
Characterisation of Norwegian Battery Electric Vehicle Owners by Level of Adoption


Abstract
:1. Introduction
Previous Literature on BEV Adoption
2. Theory of Diffusion of Innovation
3. Data and Methods
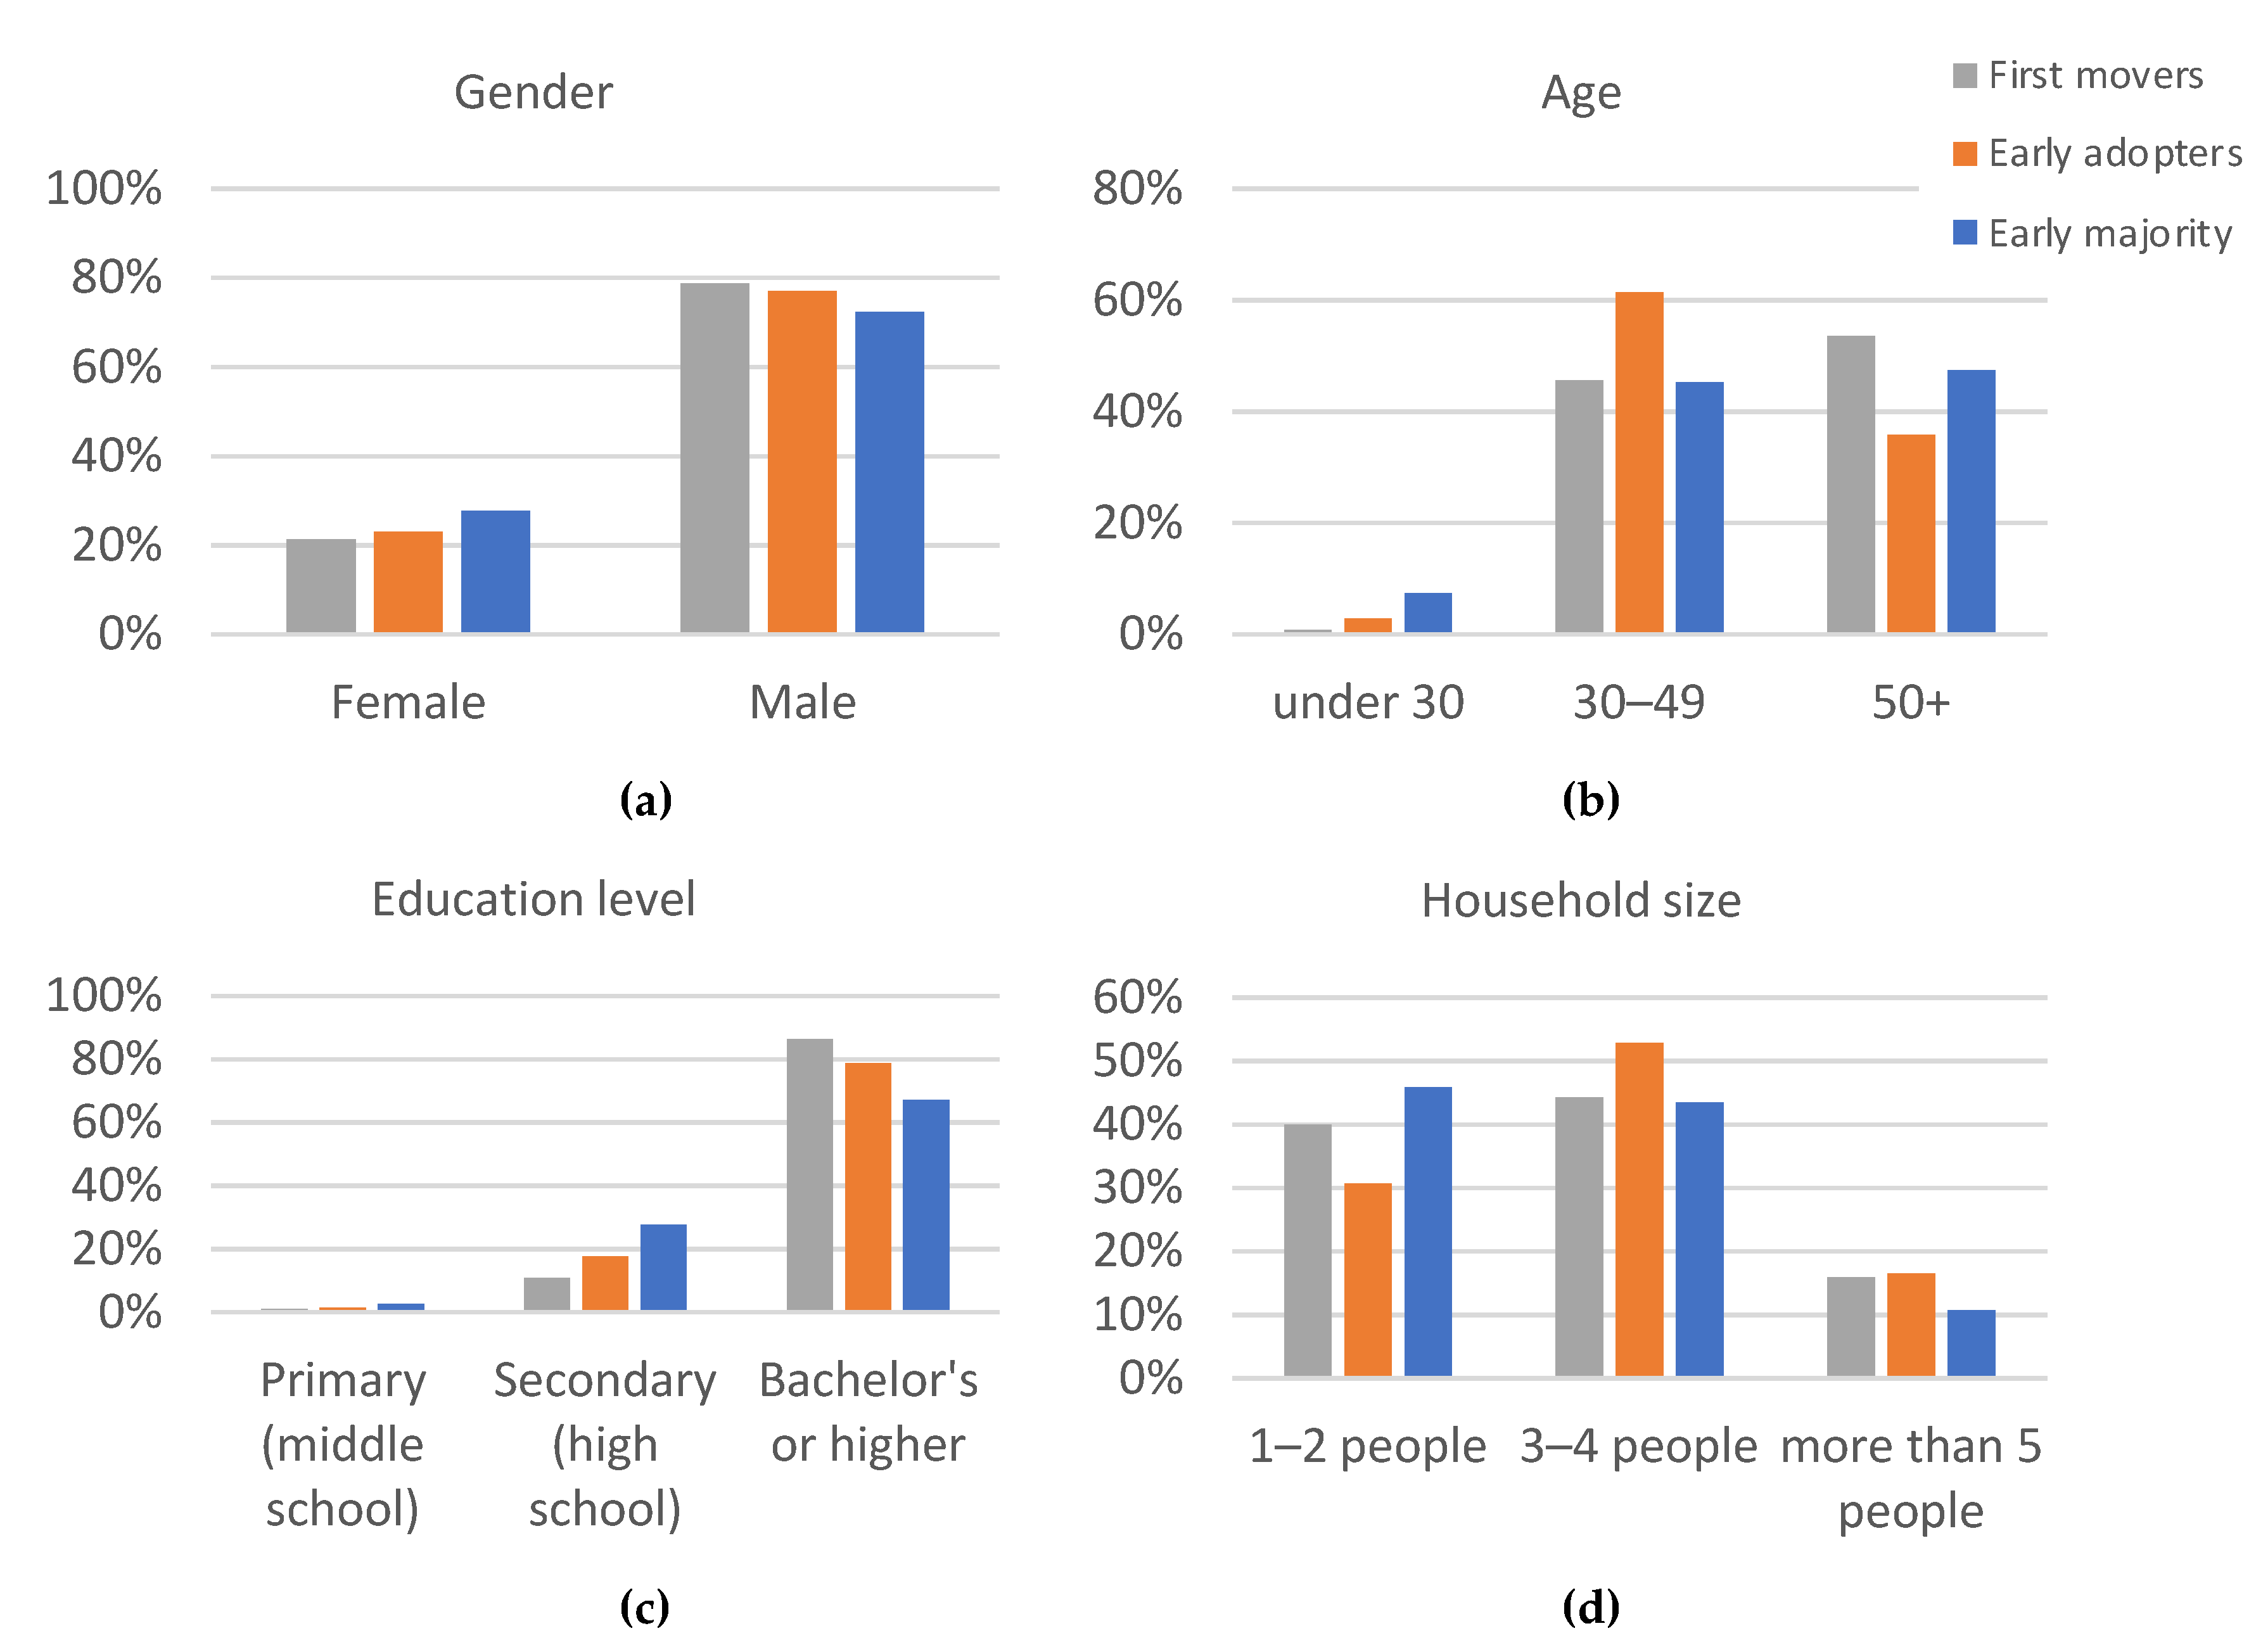
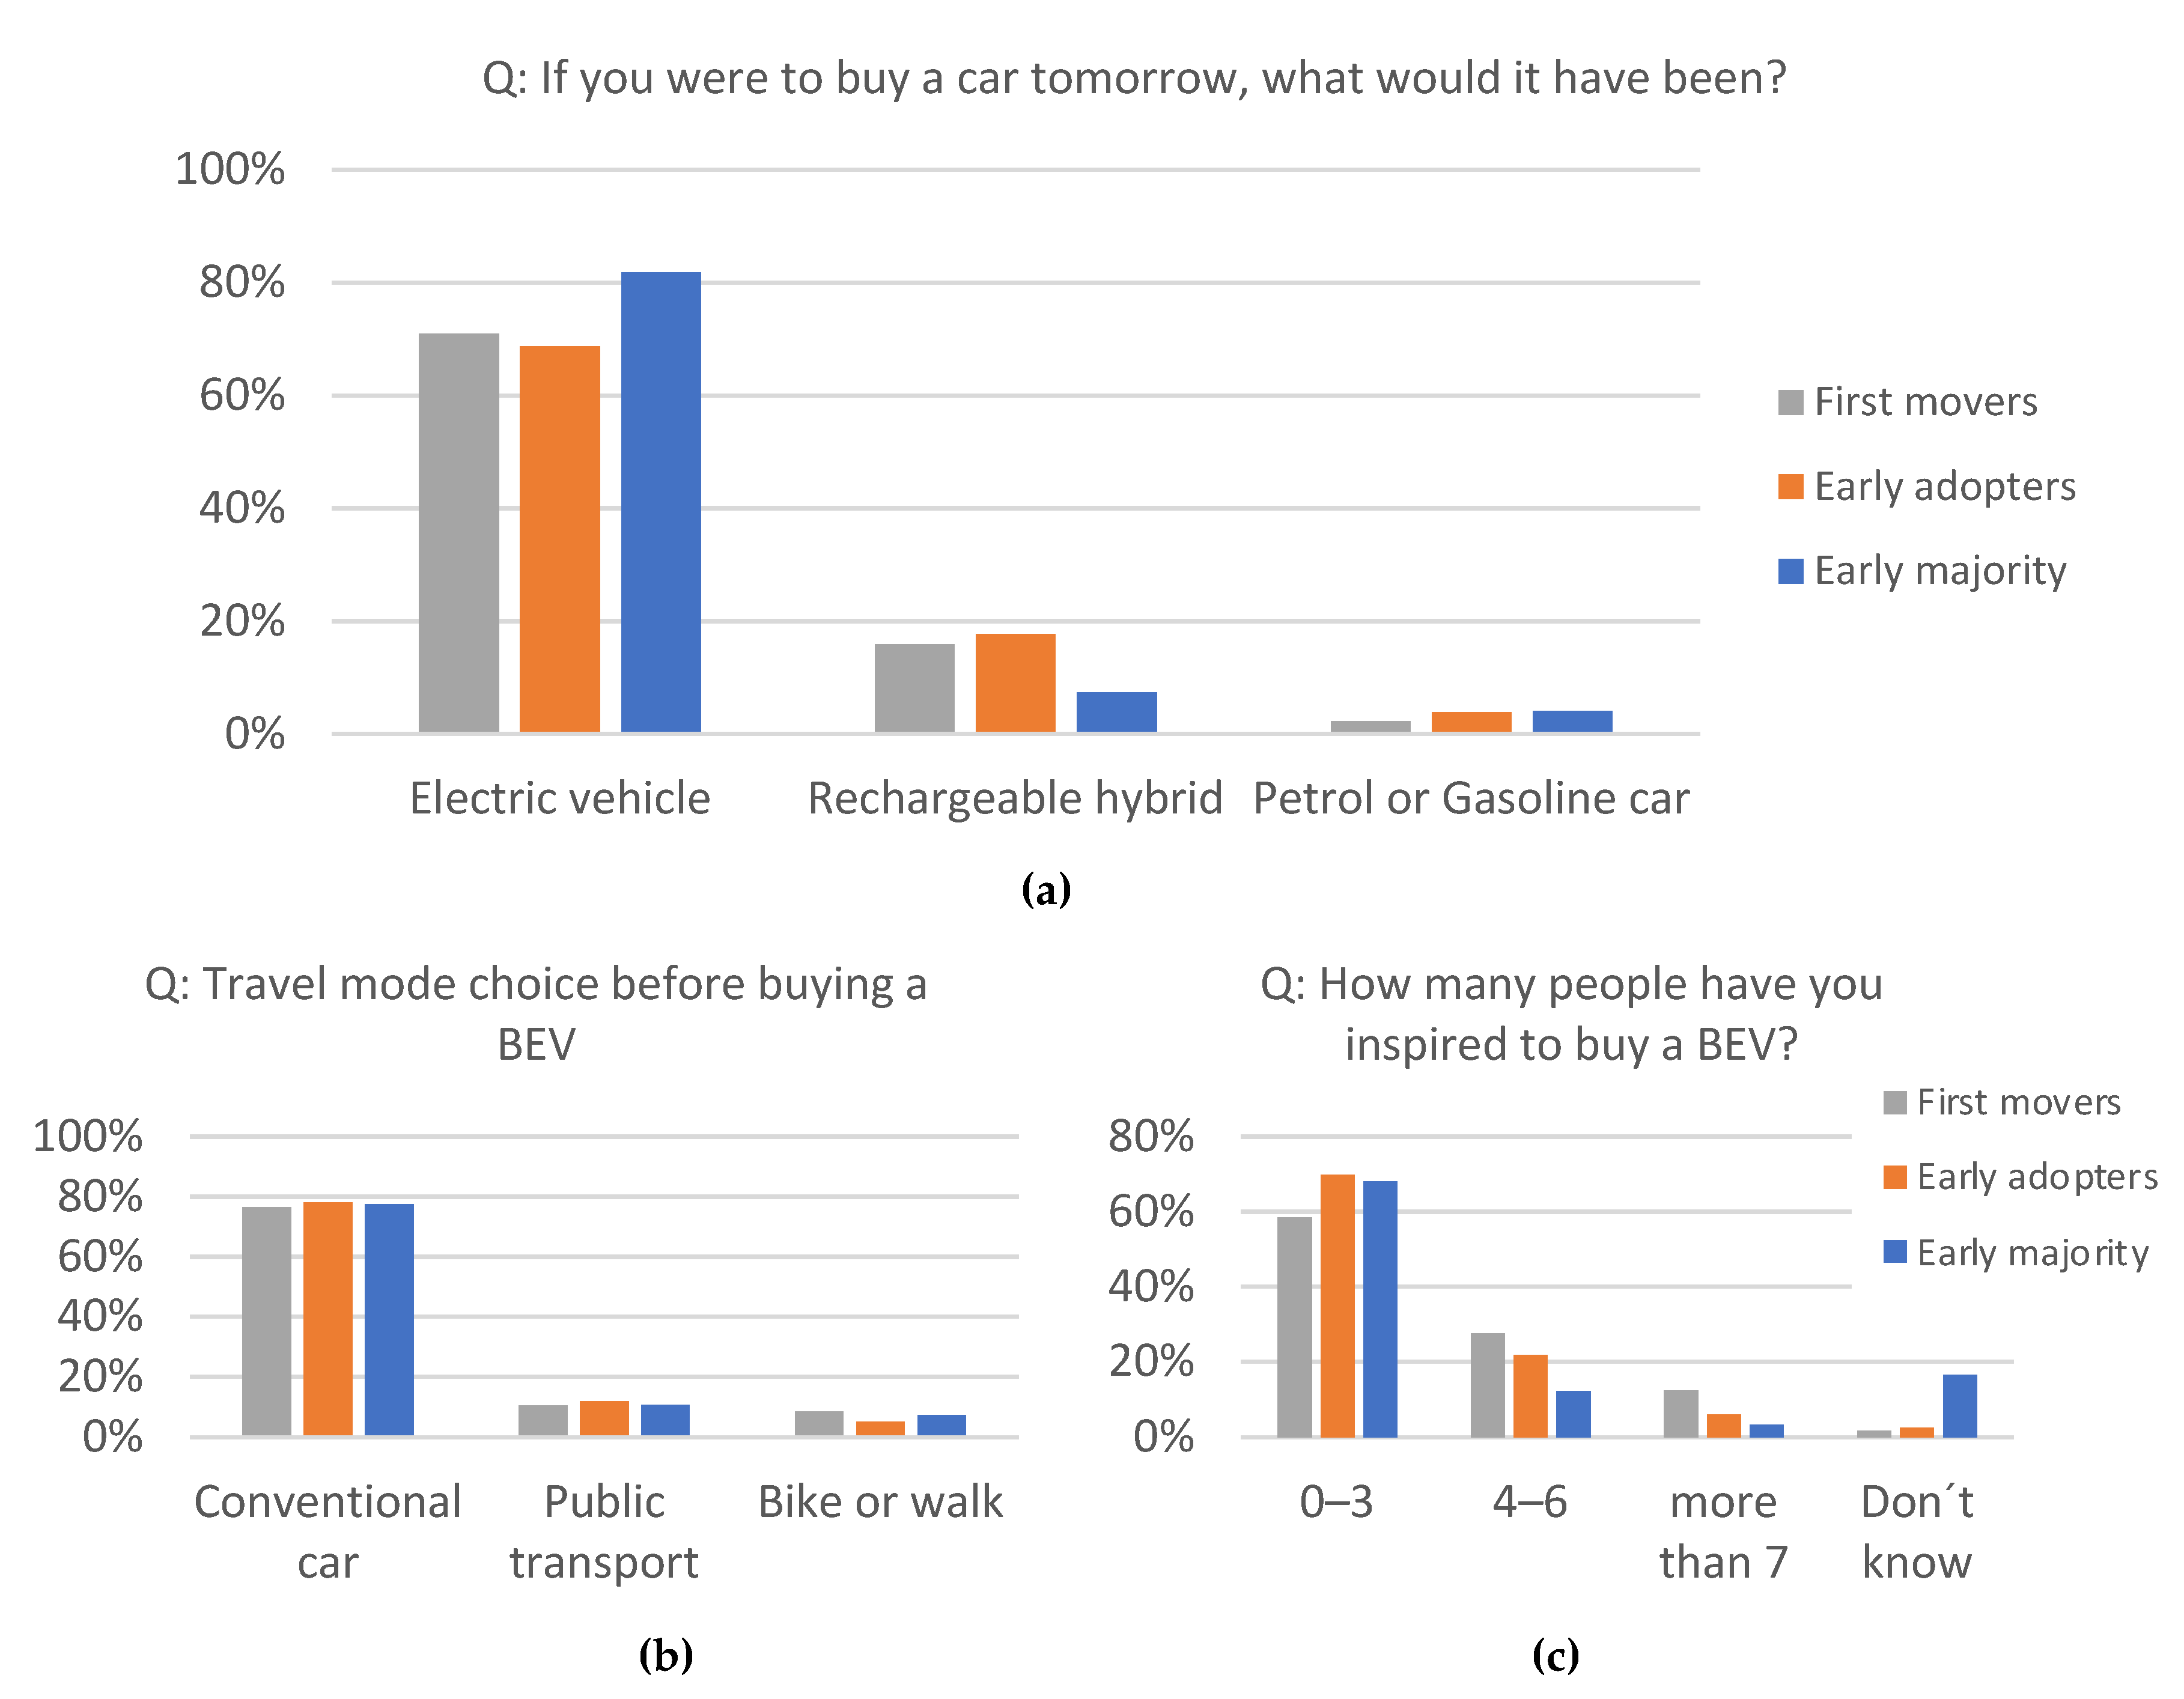
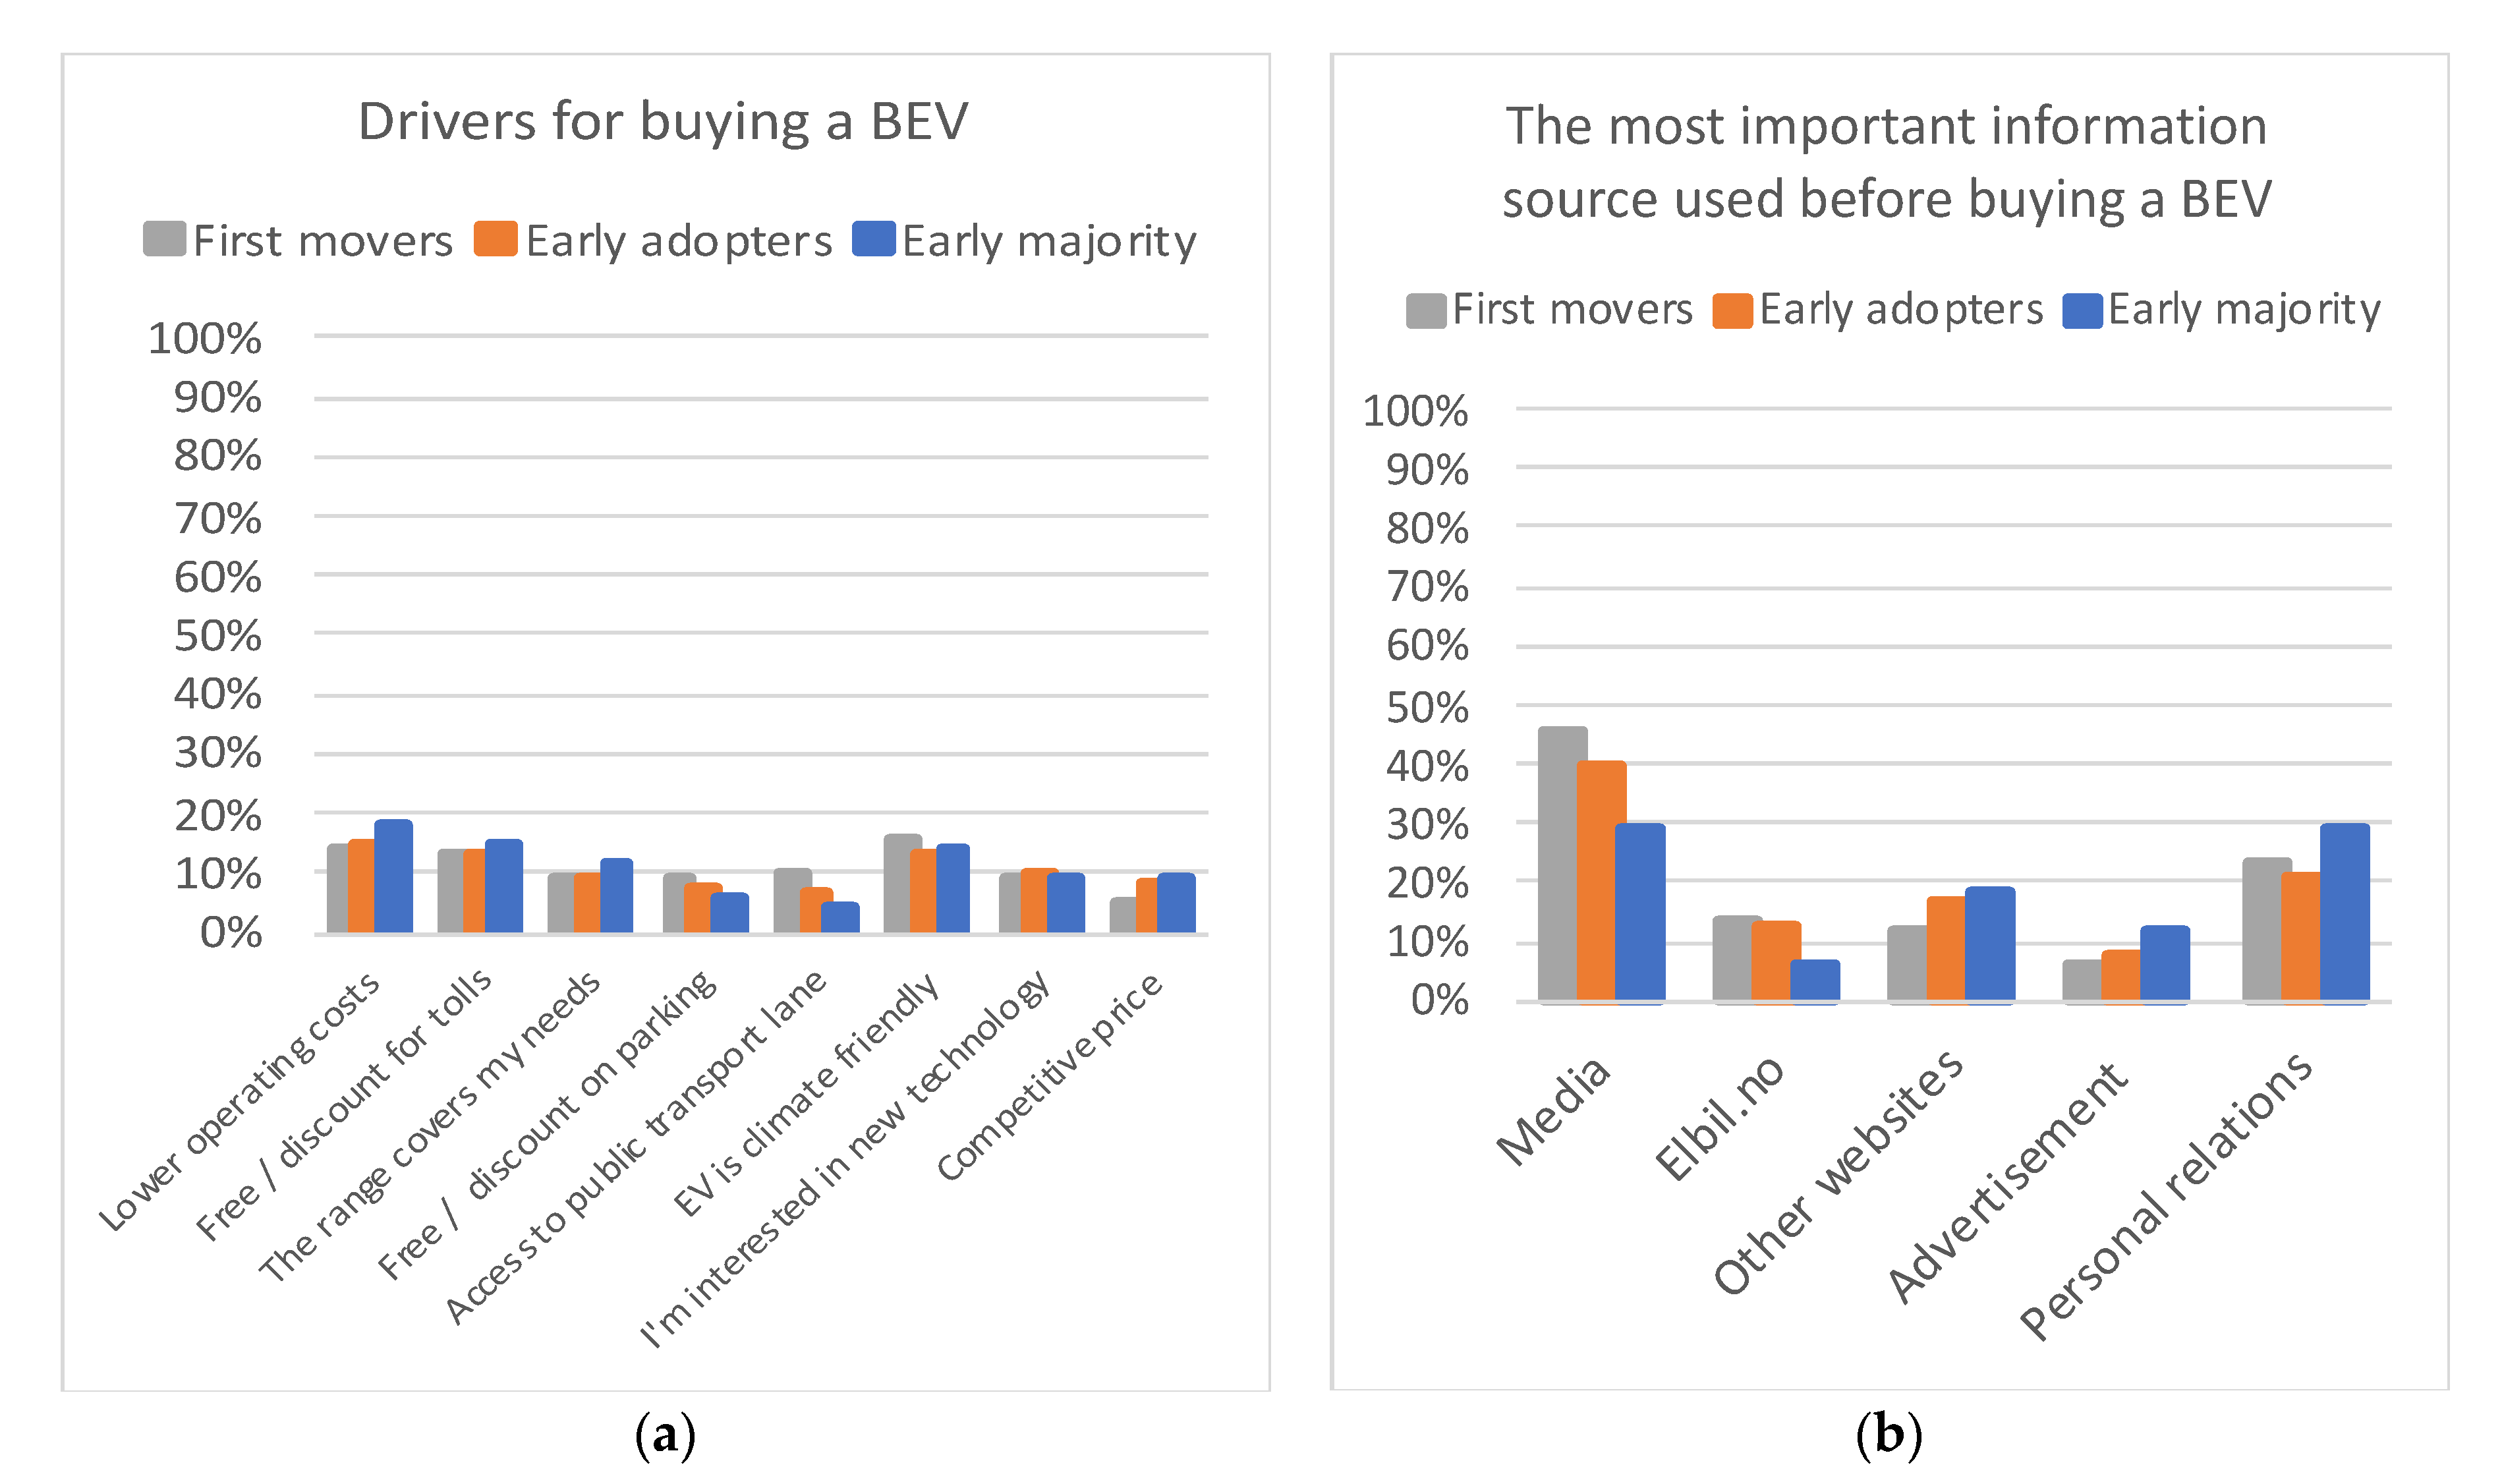
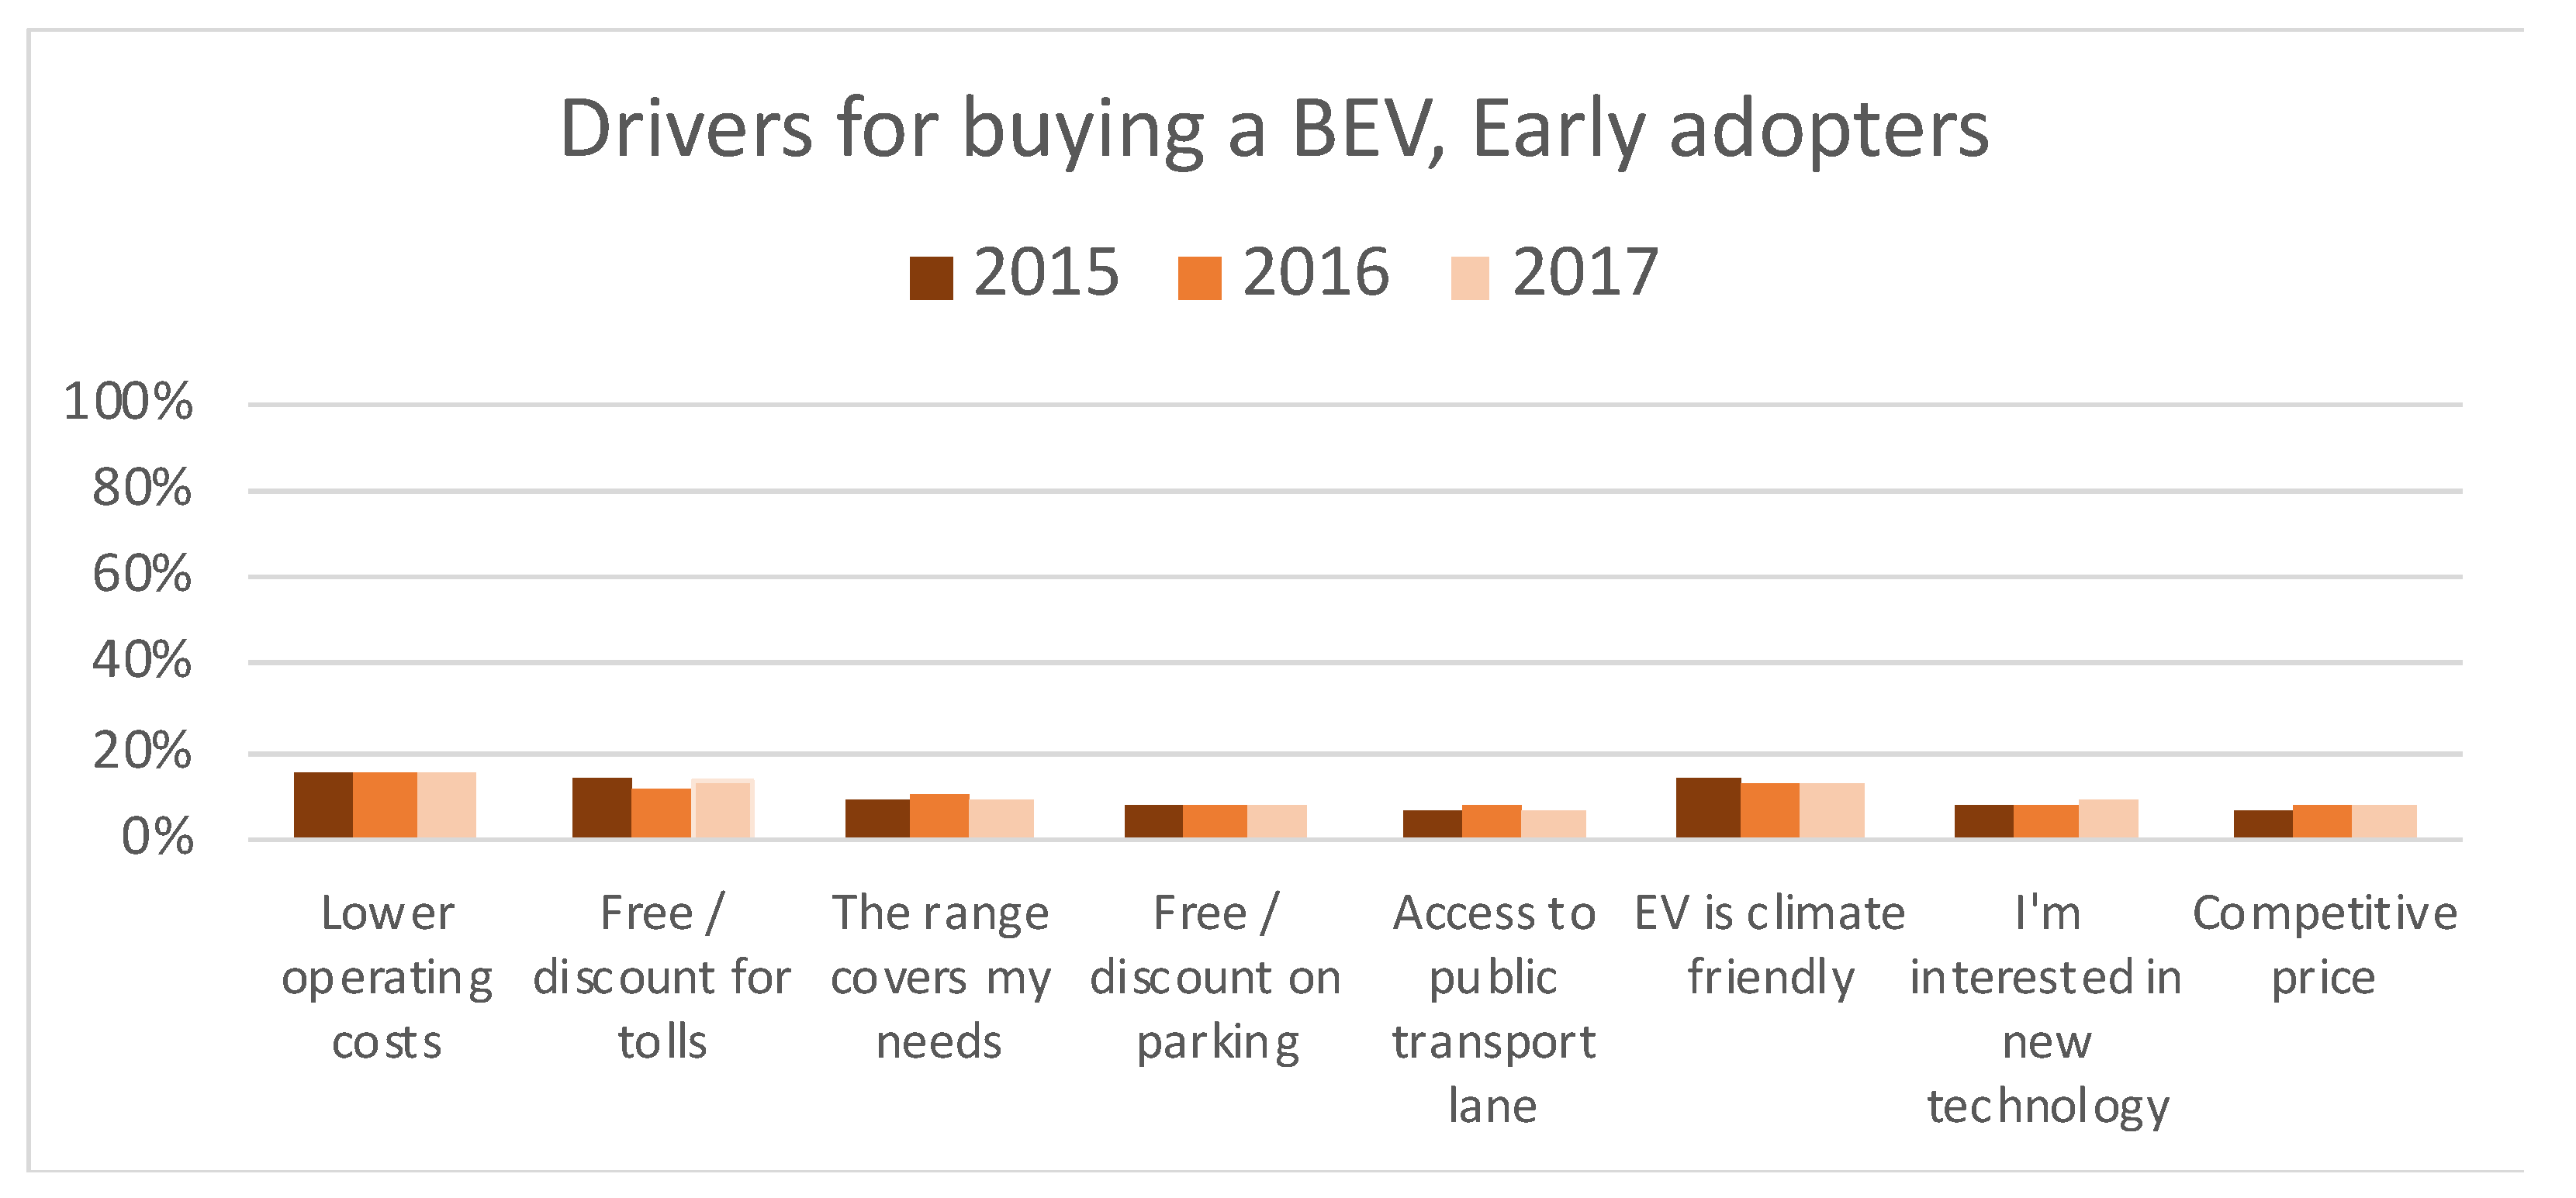
4. Results
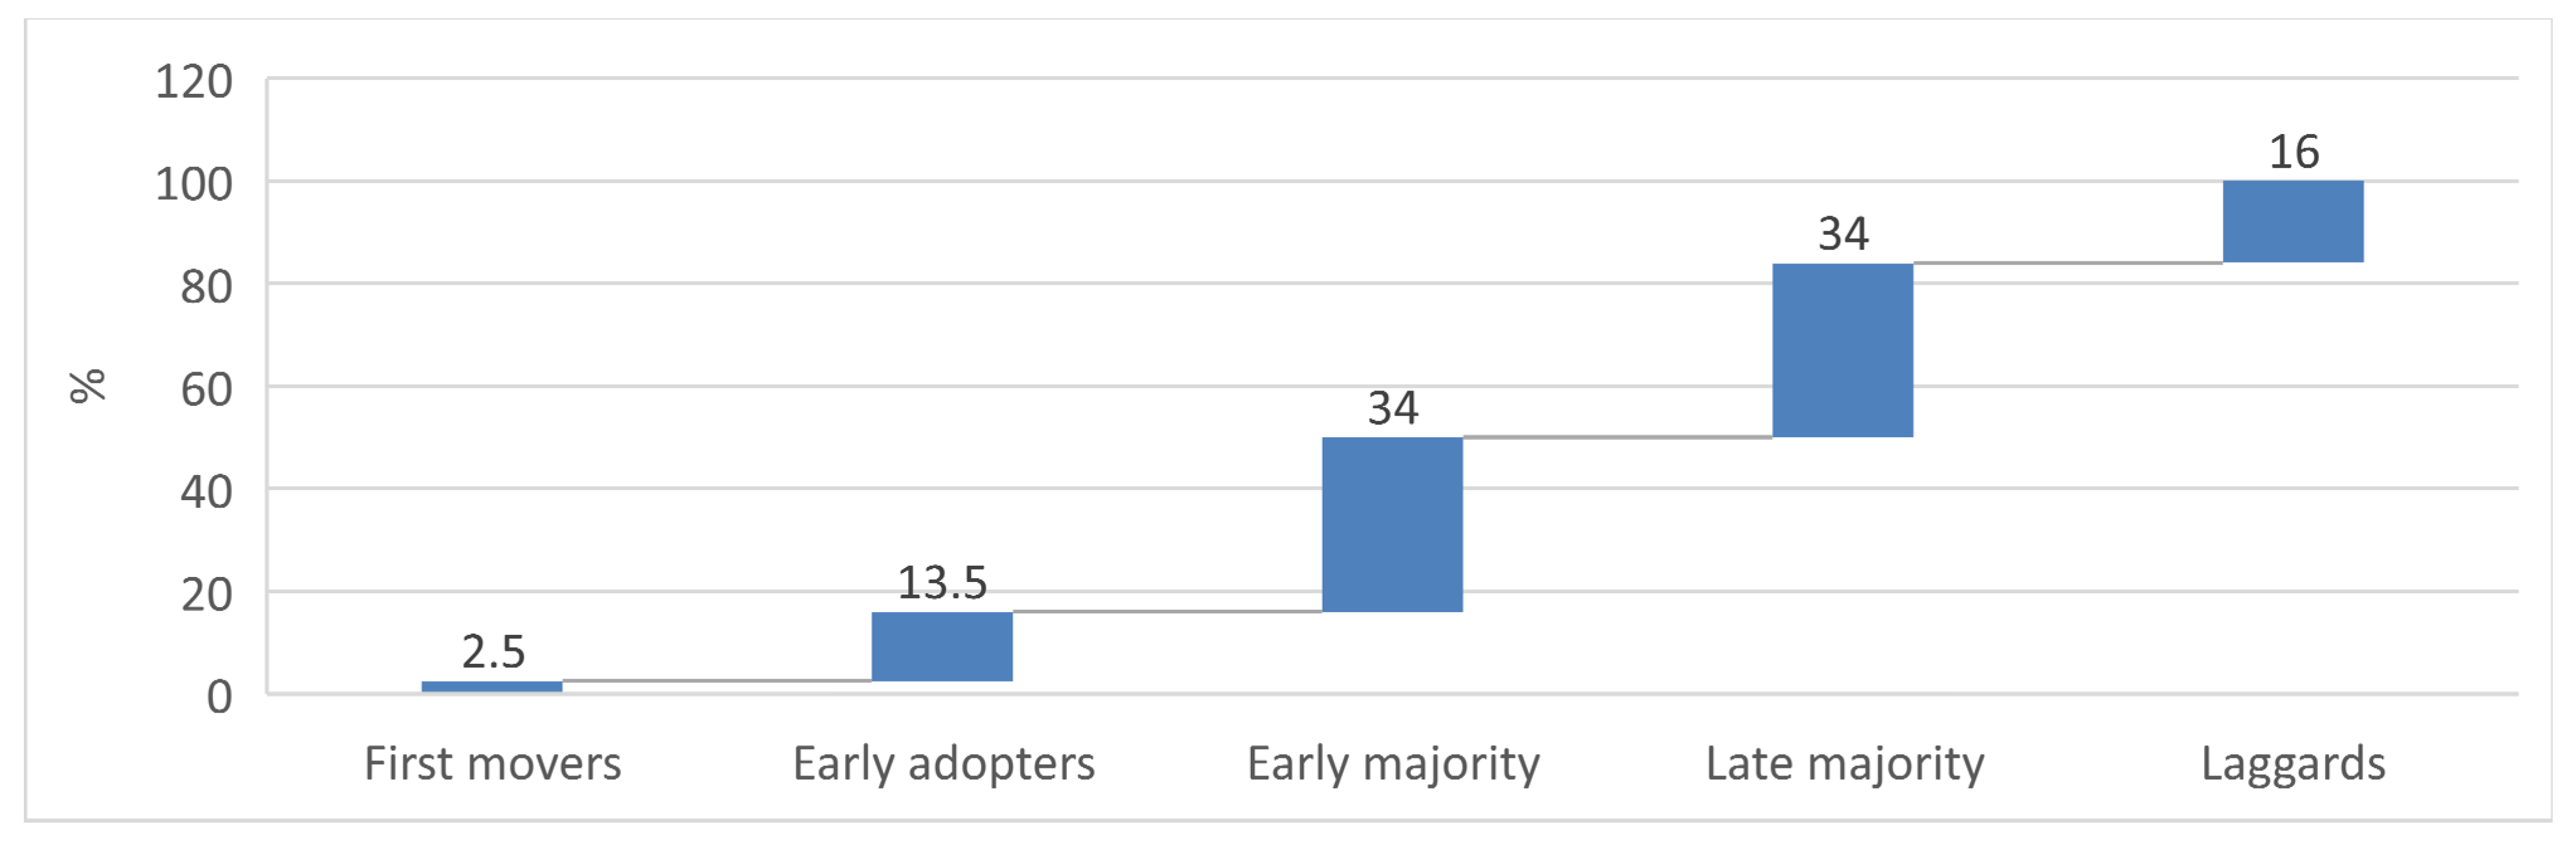
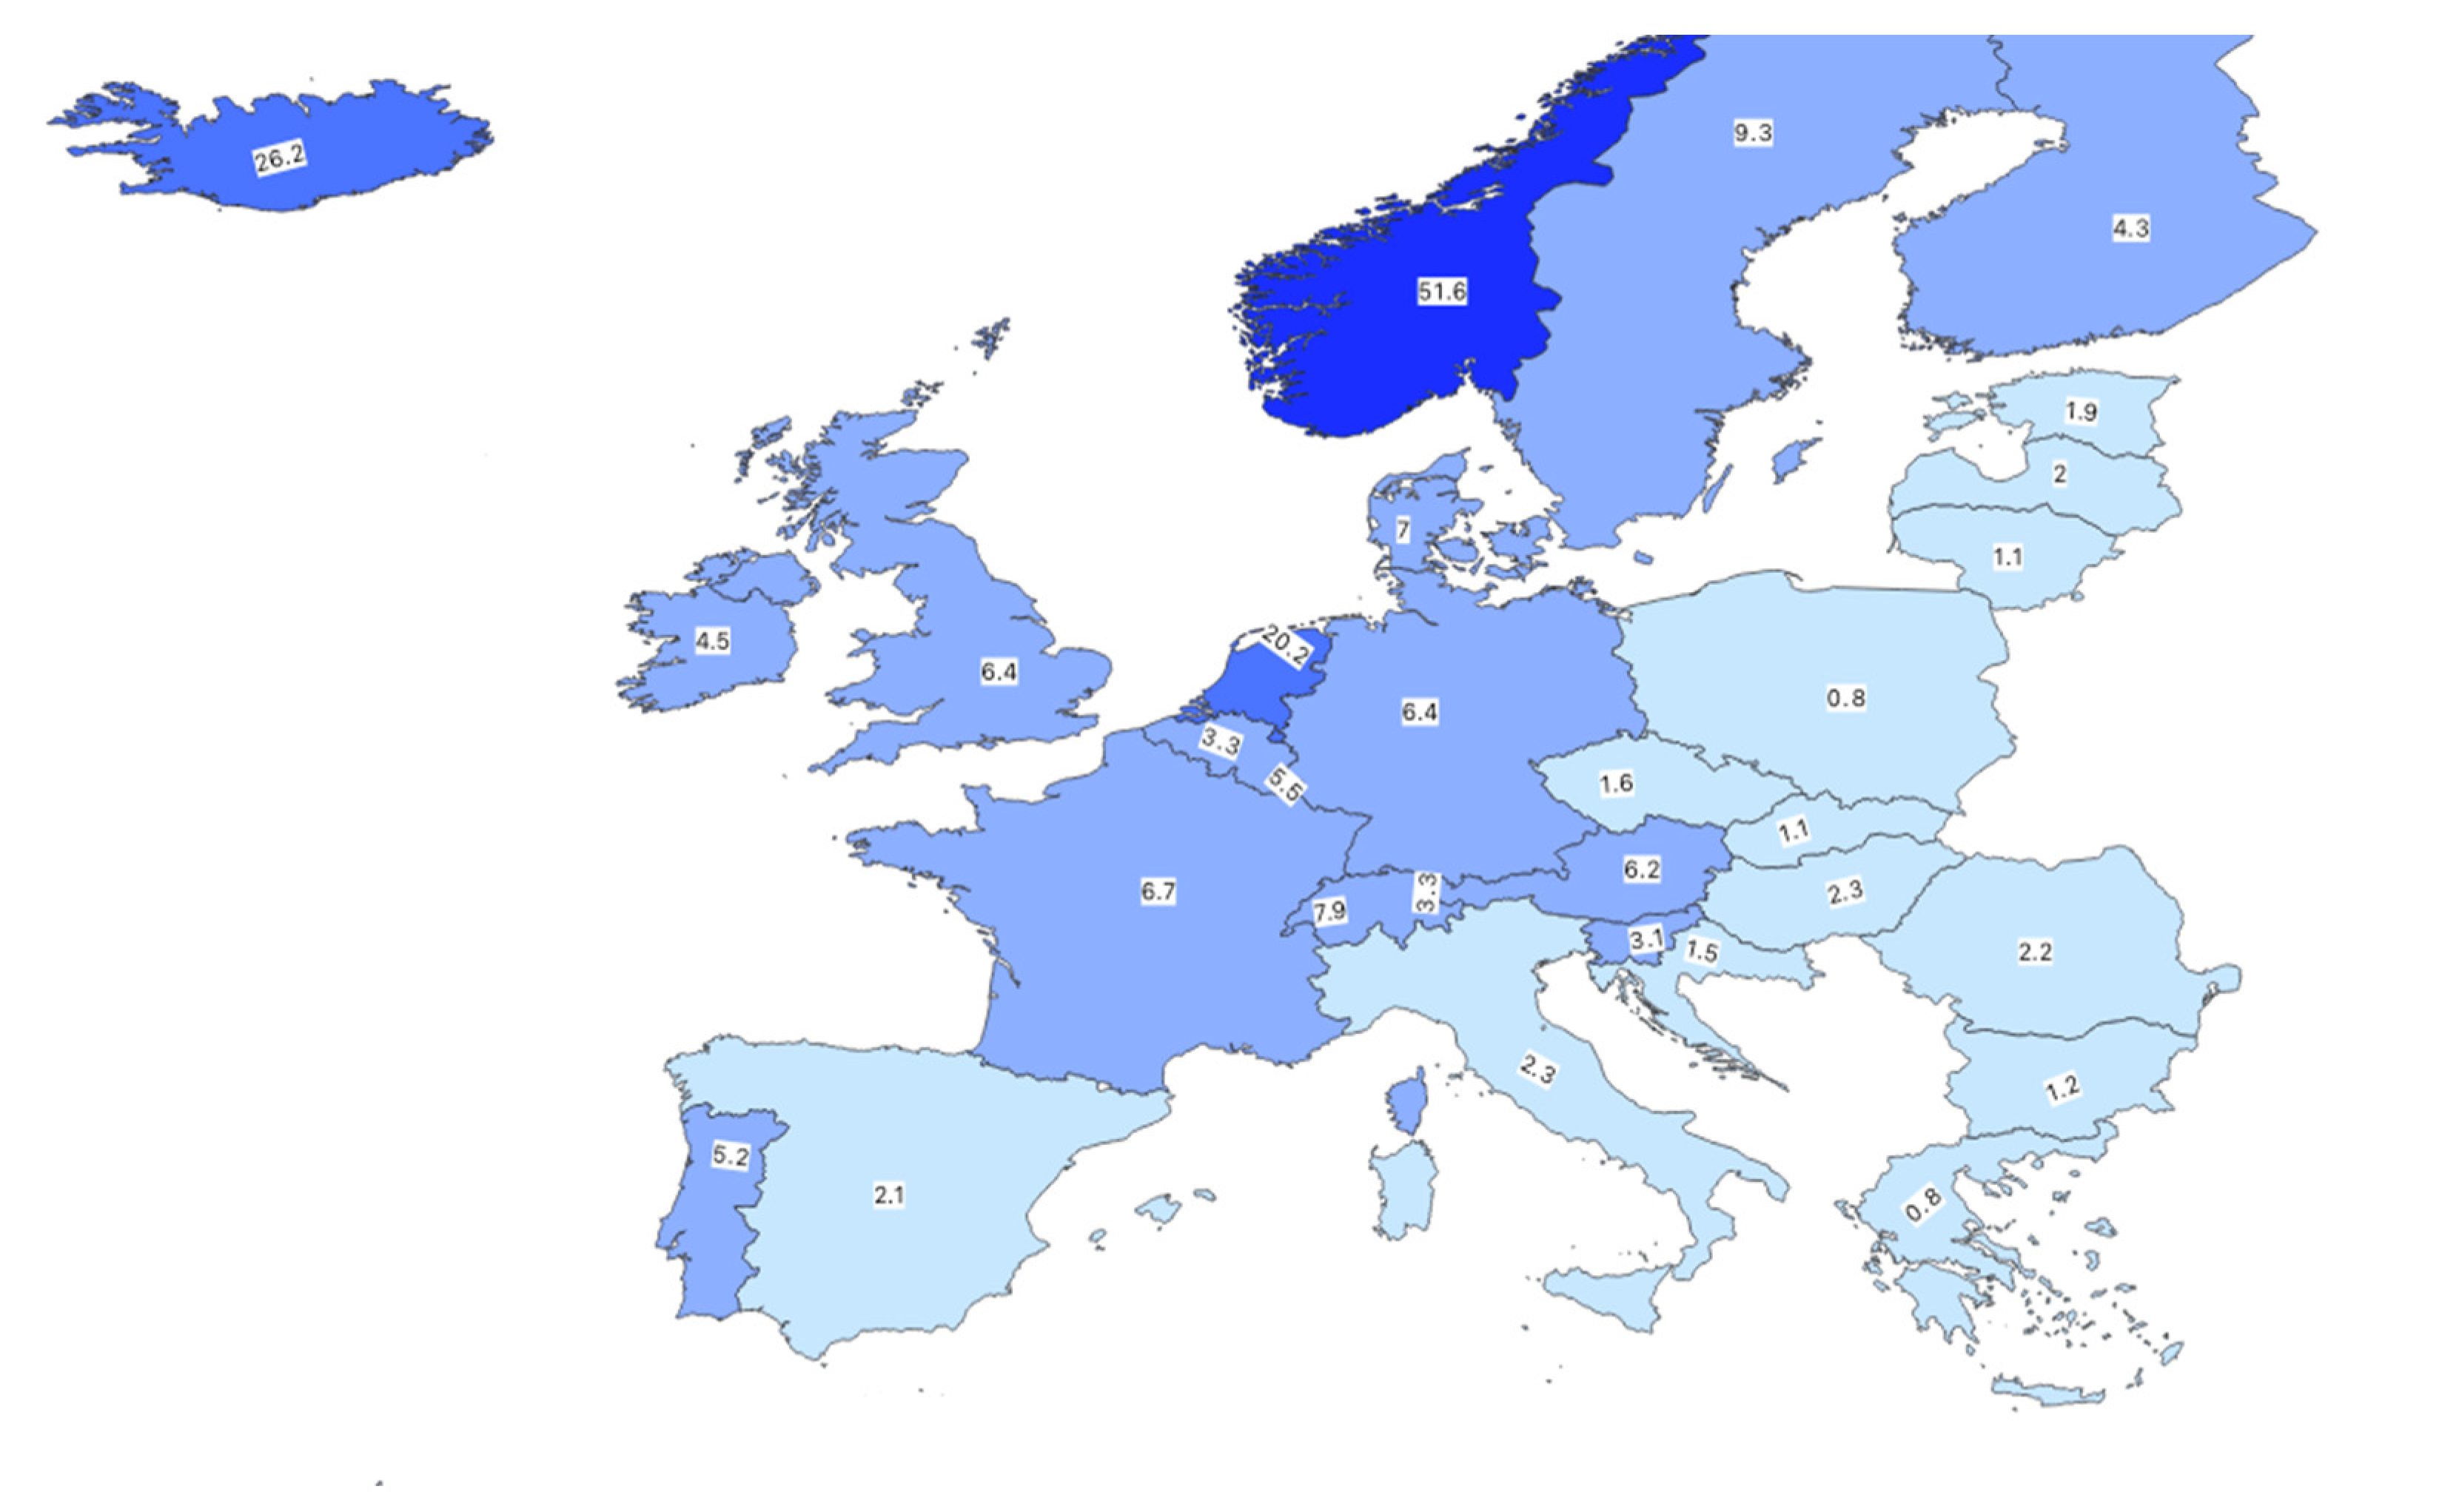
European Adoption Stages
5. Discussion
5.1. Diffusion of Innovation Theory and BEV Users in Norway
5.2. Transferability to European Countries
6. Conclusions
Author Contributions
Funding
Institutional Review Board Statement
Informed Consent Statement
Data Availability Statement
Conflicts of Interest
References
- Figenbaum, E.; Kolbenstvedt, M. Electromobility in Norway-Experiences and Opportunities with Electric Vehicles; Institute of Transport Economics (TOI): Oslo, Norway, 2013; Report 1281/2013. [Google Scholar]
- European Alternative Fuels Observatory-Vehicles and Fleet. Available online: https://alternative-fuels-observatory.ec.europa.eu/transport-mode/road/european-union-eu27/vehicles-and-fleet (accessed on 6 July 2022).
- Bjerkan, K.Y.; Nørbech, T.E.; Nordtømme, M.E. Incentives for promoting Battery Electric Vehicle (BEV) adoption in Norway. Transp. Res. D Transp. Environ. 2016, 43, 169–180. [Google Scholar] [CrossRef]
- Norwegian Climate Policy. Available online: https://www.regjeringen.no/no/dokumenter/meld-st-21-2011-2012/id679374/ (accessed on 28 April 2022).
- Fevang, E.; Figenbaum, E.; Fridstrøm, L.; Halse, A.H.; Hauge, K.E.; Johansen, B.G.; Raaum, O. Who Goes Electric? Characteristics of Electric Car Ownership in Norway 2011-2017; Institute of Transport Economics (TOI): Oslo, Norway, 2020; Report 1780/2020. [Google Scholar]
- Skjølsvold, T.M.; Ryghaug, M. Temporal echoes and cross-geography policy effects: Multiple levels of transition governance and the electric vehicle breakthrough. Environ. Innov. Soc. Transit. 2016, 35, 232–240. [Google Scholar] [CrossRef]
- Bjerkan, K.Y.; Bjørge, N.M.; Babri, S. Transforming socio-technical configurations through creative destruction: Local policy, electric vehicle diffusion, and city governance in Norway. Energy Res. Soc. Sci. 2021, 82, 102294. [Google Scholar] [CrossRef]
- Mersky, A.C.; Sprei, F.; Samaras, C.; Qian, Z.S. Effectiveness of incentives on electric vehicle adoption in Norway. Transp. Res. D Transp. Environ. 2016, 46, 56–68. [Google Scholar] [CrossRef]
- She, Z.Y.; Sun, Q.; Ma, J.J.; Xie, B.C. What are the barriers to widespread adoption of battery electric vehicles? A survey of public perception in Tianjin, China. Transp. Policy 2017, 56, 29–40. [Google Scholar] [CrossRef]
- Sovacool, B.K.; Abrahamse, W.; Zhang, L.; Ren, J. Pleasure or profit? Surveying the purchasing intentions of potential electric vehicle adopters in China. Transp. Res. A Policy Pract. 2019, 124, 69–81. [Google Scholar] [CrossRef]
- Chu, W.; Im, M.; Song, M.R.; Park, J. Psychological and behavioral factors affecting electric vehicle adoption and satisfaction: A comparative study of early adopters in China and Korea. Transp. Res. D Transp. Environ. 2019, 76, 1–18. [Google Scholar] [CrossRef]
- Helveston, J.P.; Liu, Y.; Feit, E.M.D.; Fuchs, E.; Klampfl, E.; Michalek, J.J. Will subsidies drive electric vehicle adoption? Measuring consumer preferences in the U.S. and China. Transp. Res. A Policy Pract. 2015, 73, 96–112. [Google Scholar] [CrossRef]
- Søraa, R.A.; Anfinsen, M.; Foulds, C.; Korsnes, M.; Lagesen, V.; Robison, R.; Ryghaug, M. Diversifying diversity: Inclusive engagement, intersectionality, and gender identity in a European Social Sciences and Humanities Energy research project. Energy Res. Soc. Sci. 2020, 62. [Google Scholar] [CrossRef]
- Plötz, P.; Schneider, U.; Globisch, J.; Dütschke, E. Who will buy electric vehicles? Identifying early adopters in Germany. Transp. Res. Part A Policy Pract. 2014, 67, 96–109. [Google Scholar] [CrossRef]
- Haustein, S.; Jensen, A.F. Factors of electric vehicle adoption: A comparison of conventional and electric car users based on an extended theory of planned behavior. Int. J. Sustain. Transp. 2018, 12, 484–496. [Google Scholar] [CrossRef]
- Brückmann, G.; Willibald, F.; Blanco, V. Battery Electric Vehicle adoption in regions without strong policies. Transp. Res. Part D Transp. Environ. 2021, 90, 102615. [Google Scholar] [CrossRef]
- Bas, J.; Zou, Z.; Cirillo, C. An interpretable machine learning approach to understanding the impacts of attitudinal and ridesourcing factors on electric vehicle adoption. Transp. Lett. 2021, 1–12. [Google Scholar] [CrossRef]
- Hardman, S.; Shiu, E.; Steinberger-Wilckens, R. Comparing high-end and low-end early adopters of battery electric vehicles. Transp. Res. Part A Policy Pract. 2016, 88, 40–57. [Google Scholar] [CrossRef]
- Wang, N.; Huang, Y.; Fu, Y.; Chen, L. Does lead userness matter for electric vehicle adoption? An integrated perspective of social capital and domain-specific innovativeness. J. Consum. Behav. 2022. [Google Scholar] [CrossRef]
- Rogers, E.M. Diffusion of Innovations, 5th ed.; Free Press: New York, NY, USA, 2003. [Google Scholar]


| First Movers | Early Adopters | Early Majority | Late Majority | ||||||
|---|---|---|---|---|---|---|---|---|---|
| 2011 | 2012 | 2013 | 2014 | 2015 | 2016 | 2017 | 2018 | 2019 | 2020 |
| 1.5% | 3.1% | 5.8% | 12.6% | 17.1% | 15.7% | 20.8% | 31.2% | 42.3% | 54.3% |
| Group | Definition of Each Group from the Dataset | No. of Observations |
|---|---|---|
| Early majority | Dataset 2020: Those who has owned BEV for 1–4 years. Dataset 2019: Those who has owned BEV for 0–4 year Dataset 2018: Those who has owned BEV for 0–3 year Dataset 2017: Those who has owned BEV for 0–2 year | 6784 7997 6766 7183 |
| Early adopters | Dataset 2018: Those who has owned BEV for 4–5 years Dataset 2017: Those who has owned BEV for 3–5 years Dataset 2016: Those who has owned BEV for 2–4 years Dataset 2015: Those who has owned BEV for 1–3 years | 718 1547 914 3107 |
| First movers | Dataset 2016: Those who has owned BEV for more than 5 years Dataset 2015: Those who has owned BEV for more than 4 years | 139 423 |
Publisher’s Note: MDPI stays neutral with regard to jurisdictional claims in published maps and institutional affiliations. |
© 2022 by the authors. Licensee MDPI, Basel, Switzerland. This article is an open access article distributed under the terms and conditions of the Creative Commons Attribution (CC BY) license (https://creativecommons.org/licenses/by/4.0/).
Share and Cite
Bjørge, N.M.; Hjelkrem, O.A.; Babri, S. Characterisation of Norwegian Battery Electric Vehicle Owners by Level of Adoption. World Electr. Veh. J. 2022, 13, 150. https://doi.org/10.3390/wevj13080150
Bjørge NM, Hjelkrem OA, Babri S. Characterisation of Norwegian Battery Electric Vehicle Owners by Level of Adoption. World Electric Vehicle Journal. 2022; 13(8):150. https://doi.org/10.3390/wevj13080150
Chicago/Turabian StyleBjørge, Nina Møllerstuen, Odd André Hjelkrem, and Sahar Babri. 2022. "Characterisation of Norwegian Battery Electric Vehicle Owners by Level of Adoption" World Electric Vehicle Journal 13, no. 8: 150. https://doi.org/10.3390/wevj13080150
APA StyleBjørge, N. M., Hjelkrem, O. A., & Babri, S. (2022). Characterisation of Norwegian Battery Electric Vehicle Owners by Level of Adoption. World Electric Vehicle Journal, 13(8), 150. https://doi.org/10.3390/wevj13080150