Abstract
In this study, a framework regarding park and ride facilities is presented and demonstrated to evaluate different approaches of charging concepts. The innovation in this study is that the framework can be used to evaluate arbitrary conductive charging concepts on a detailed level and on the basis of real usage data. Thus, the results can be broken down to the level of individual charging events and charging points. Among other factors, the study considers the expected growth in electric vehicles, the construction and operating costs for the investigated charging infrastructure, and the impact of heterogeneous electric vehicle fleets with different vehicle-specific charging powers. Since both technological and economic perspectives are considered in the framework, the study is relevant for all decision makers involved in the development and operation of charging infrastructure. The results in the investigated case of park and ride facilities show a high potential for cost-efficient low-power charging concepts. Thus, significantly higher energy volumes could be transmitted and better economic results could be achieved by the investigated low-power approaches. Especially for heterogeneous electric vehicle fleets, the number of available charging points appears to be more important than the charging power of the individual charging points in this case.
1. Introduction
According to the sustainable development goals of the United Nations, transport is an important component for the sustainable development of cities and communities. In this context, the electrification of vehicles represents a decisive chance to help decarbonize transport [1]. To improve the acceptance of plug-in electric vehicles (PEVs), it is necessary to build and expand the charging infrastructure (CI) in a demand-driven and user-oriented fashion. The analysis of charging events (CEs) to date allows for the actual usage behavior of CI to be determined and taken into account in the planning and operation of charging stations (CSs). In this study, a framework is presented and applied to the example of park and ride (P & R) facilities to realistically evaluate different CI types based on Charge Detail Records (CDRs) in terms of economics and technology. The results can be used by charge point operators (CPOs) to give concrete recommendations for the selection and scaling of specific CI types as well as in the design of operations and pricing models. CDRs are the data required for the billing of CEs. Important information here includes the connection time and the amount of energy transferred. This study is based on CDRs collected at more than 600 public CSs in the City of Munich in the period from 2020 to 2021. The data were provided by the largest provider of public CSs in the Munich urban area, Stadtwerke München. P & R facilities are typically located at subway or commuter rail stations and are designed to enable commuters and other users to transfer from cars to public transport services. The facilities thus enable commuters to cover part of their commuting distance by public transport.
The analysis and evaluation of CI has already been the subject of previous studies. In the following section, the current state of research and the research gap are described. Table 1 provides an overview of the most relevant studies in the analysis and evaluation of real-world charging data. In addition to the authors, the table contains the period of time in which the incorporated data set was collected and the number of CEs included. In the following columns, the publication is classified according to four subject areas. Studies in the Usage subject area deal with the usage behavior of the CI, for example, by evaluating the occupation time of the charging points (CPs) and the amount of energy transferred. The Comparison subject area indicates whether this evaluation was carried out for individual CS types or separately for AC and DC CSs. The Roll-Out subject area evaluates different roll-out strategies for scaling or adding CI depending on the ramp up of electric vehicles. The final subject area, Economics, indicates whether an economic evaluation of the CI has been carried out in addition to technological evaluations. As shown in the table, studies may contain elements from more than one subject area.

Table 1.
Overview Related Literature.
One of the first studies based on real usage data of public CEs from 2012 to 2013 is presented by van den Hoed et al. [2]. The high-quality data set of CDRs includes, among other things, the identification of individual customers in addition to the connection time and the amount of energy transferred. Over time, an extensive database of public CEs was built up as part of the research project “Intelligent data-driven optimization of charging infrastructure” (IDO-Laad) and published as part of several studies [3,12,13]. The evaluations focused primarily on the usage behavior of public CI; for example, with regard to the occupation behavior of the CPs and the temporal proportion of charging time and idle connection time. The share of charging time, and thus, the time in which the public CI is actually in use is found to be less than 20%. The share of charging and idle connection time is also an important criterion for evaluating the different types of CI in the study at hand. Considering the impact on the power grid, there is also great potential for shifting charging power over time to relieve the load on the local power grid. Thus, the power demand from AC CEs can especially be shifted by several hours [4,14,15,16,17]. The results indicate that for AC CSs there is a high potential to charge with lower power levels. In the study at hand, corresponding approaches are evaluated economically and technologically with so-called low-power chargers. If the usage behavior is considered separately for AC and DC CI, it becomes apparent that the usage behavior is different both in terms of connection times as well as in the amount of energy transferred. For example, CEs at AC CSs are usually associated with parking events, which means that connection times are usually longer than required for the actual charging process. For DC CEs, the focus is on the actual charging process itself. After the charging process is completed, the DC CP is released and becomes available for the next PEV [5,6]. Therefore, for the study at hand, a separate occupation logic for AC and DC CI is considered, which takes into account the respective user characteristics of AC and DC charging.
One challenge in the evaluation of CDRs is the accessibility of data. Since corresponding data are not always freely accessible, the usage behavior of public CI has been examined in some studies based on data from publicly available websites [6,7,10]. Compared to earlier studies, the incorporated data sets contain only basic information about the temporal occupancy of public CI and no detailed information for the CEs, such as the amounts of energy charged. Consequently, only the occupation behavior of CPs can be analyzed and evaluated on this basis. Therefore, a comprehensive evaluation of the CSs themselves, which includes not only the occupation behavior, but also the energy quantities transmitted, can not be evaluated. Within the scope of this study, a probability distribution was developed for the determination of energy demand, which is based on an extensive data set of public CEs from the years 2020 and 2021. The developed probability distribution makes it possible to determine demanded energy quantities as a function of connection time, and thus, to comprehensively evaluate CI. The developed probability distributions of the present study are made freely available to reproduce the presented methodology and to enable further investigation of CI without access to exclusive CDR.
In addition to describing usage behavior, CDRs were used to formulate roll-out strategies of CI for policy makers. Recommendations for action are structured in [8] using a decision tree. Accordingly, the recommendations for action are based primarily on the share of charging time or idle connection time. However, no recommendation is made for specific CS types or power types. In [9], roll-out strategies for three different approaches of public CI are considered. Here, the roll-out of single Level 2 AC CSs with up to 22 kW power, Level 2 AC CSs as charging hubs, and DC fast chargers with 50, 175, or 350 kW of charging power are compared using an agent-based model over an evaluation period of 10 years. Since probability distributions were partially used as input parameters and the results therefore show a certain variance per simulation run, the average of four simulation runs was used as the result in each case. The focus of the evaluations was on the extent to which the individual roll-out strategies can influence the switch to electric vehicles. In particular, the success rate of finding an available CP as well as the inconvenience of finding a CP are taken into account. In [9], it was assumed that PEV drivers are aware of the locations of CSs, but there is no information about the occupation status. In [18], the influence of information and reservation options on the necessary search traffic for finding free public CSs was additionally investigated. Due to the objective of evaluating roll-out strategies for political decision makers, the simulation of the agents in [8,9] was carried out rather on a macroscopic level. Thus, the individual CS types were not linked to specific costs, and no detailed evaluations of the usage behavior were performed, such as the transferable energy quantities or the occupation behavior of the single CS types. In the vehicle-side simulation, it was assumed that plug-in hybrid electric vehicles (PHEVs) cannot use DC CSs. However, further vehicle-side limitations of the PEV, for example, through power limitations that are either vehicle-specific or based on the state-of-charge (SOC), were not taken into account.
In [11], a large data set of about 9 million CDRs is evaluated based on the usage behavior and profitability of public CI in Germany. Among other things, the evaluation shows that only a fraction of CEs utilize the available power of the CP. Thus, the average power retrieved is only 30 to 60% of the nominal charging power of the CP. The evaluation, thus, highlights the extent to which vehicle-side limitations of the charging power occurred. In addition, an assessment was made on the economic viability of public CSs. For this purpose, six segments for public CSs were formed according to the charging power available, and the charging locations were divided into five different location types. The results of the estimation show that, in urban areas, mainly low power AC approaches and high power DC approaches can be operated economically. Based on this, a more detailed economic evaluation of the CI is carried out in the study at hand by simulating individual CEs.
Considering the current state of the art, here, a methodology to evaluate the application of charging concepts (CCs) towards different spatial cases is presented, allowing for an assessment of the usability and profitability of the given CCs in terms of the expected ramp up of PEVs, demand for CI, build-up costs for the infrastructure, and temporal development of utilization of CI. By applying the proposed methodology to the P & R case in Munich, Germany, specific CI ramp-up strategies can be derived for this case, giving the operator the necessary information to optimize their infrastructure in terms of PEV readiness. The approach allows for comprehensive recommendations of the concrete design and scaling of different types of CS, and thus, covers all the topics mentioned in Table 1. For this purpose, different types of AC and DC CI with different allocations of charging power to each CP are investigated. The study considers technological and economic perspectives and is therefore relevant for all decision-makers involved in the development and operation of CI. The advantage of the presented methodology is that concrete CCs can be simulated and evaluated on a very detailed level based on real usage data. In previous studies and methodologies, the CI was usually modeled and evaluated on a macroscopic level. Specific distinguishing features such as the number of CPs, the charging power per CP, the available grid connection power, and the investment and operating costs for different CCs were not or could not be taken into account. By simulating all relevant payment and energy flows, the proposed methodology generates concrete recommendations for action for the technologically and economically sensible selection of CCs for different cases.
2. Materials and Methods
For a realistic determination of the demand behavior, probability distributions were derived to define the occupation behavior as well as the energy demand of the PEVs. The basis for this is an extensive data set of roughly 780,000 CEs at public AC and DC CSs in the Munich metropolitan area as well as the data from more than 900,000 recorded parking sessions in P & R facilities. An agent-based model (ABM) was developed in Python for simulation and evaluation, which allows for a definition of individual CSs and an evaluation of different aspects of the usage behavior. A period of 10 years was chosen as the assessment period for CSs. In addition to evaluating the expected usage behavior, this study also includes a detailed economic and technological comparison of different CSs. By arbitrarily scaling the CSs, it is also possible to determine a roll-out strategy for the CSs. To this end, the definition of the CS is based on a set of economic and technological parameters, such as the investment and operating costs, the number of CPs per CS, the grid connection power, and the nominal power per CP. To show the range of possible evaluation approaches, two AC and DC CSs, each in different power classes, were parameterized and evaluated. Since the simulation is carried out at the level of individual vehicles and CPs, the evaluations of the payment and energy flows can be broken down to the level of individual CEs if desired. To realistically simulate CEs in this context, power limitations are considered at the level of individual PEVs, CPs, and CSs, as well as at the level of the power connection of the P & R facility to the local power grid.
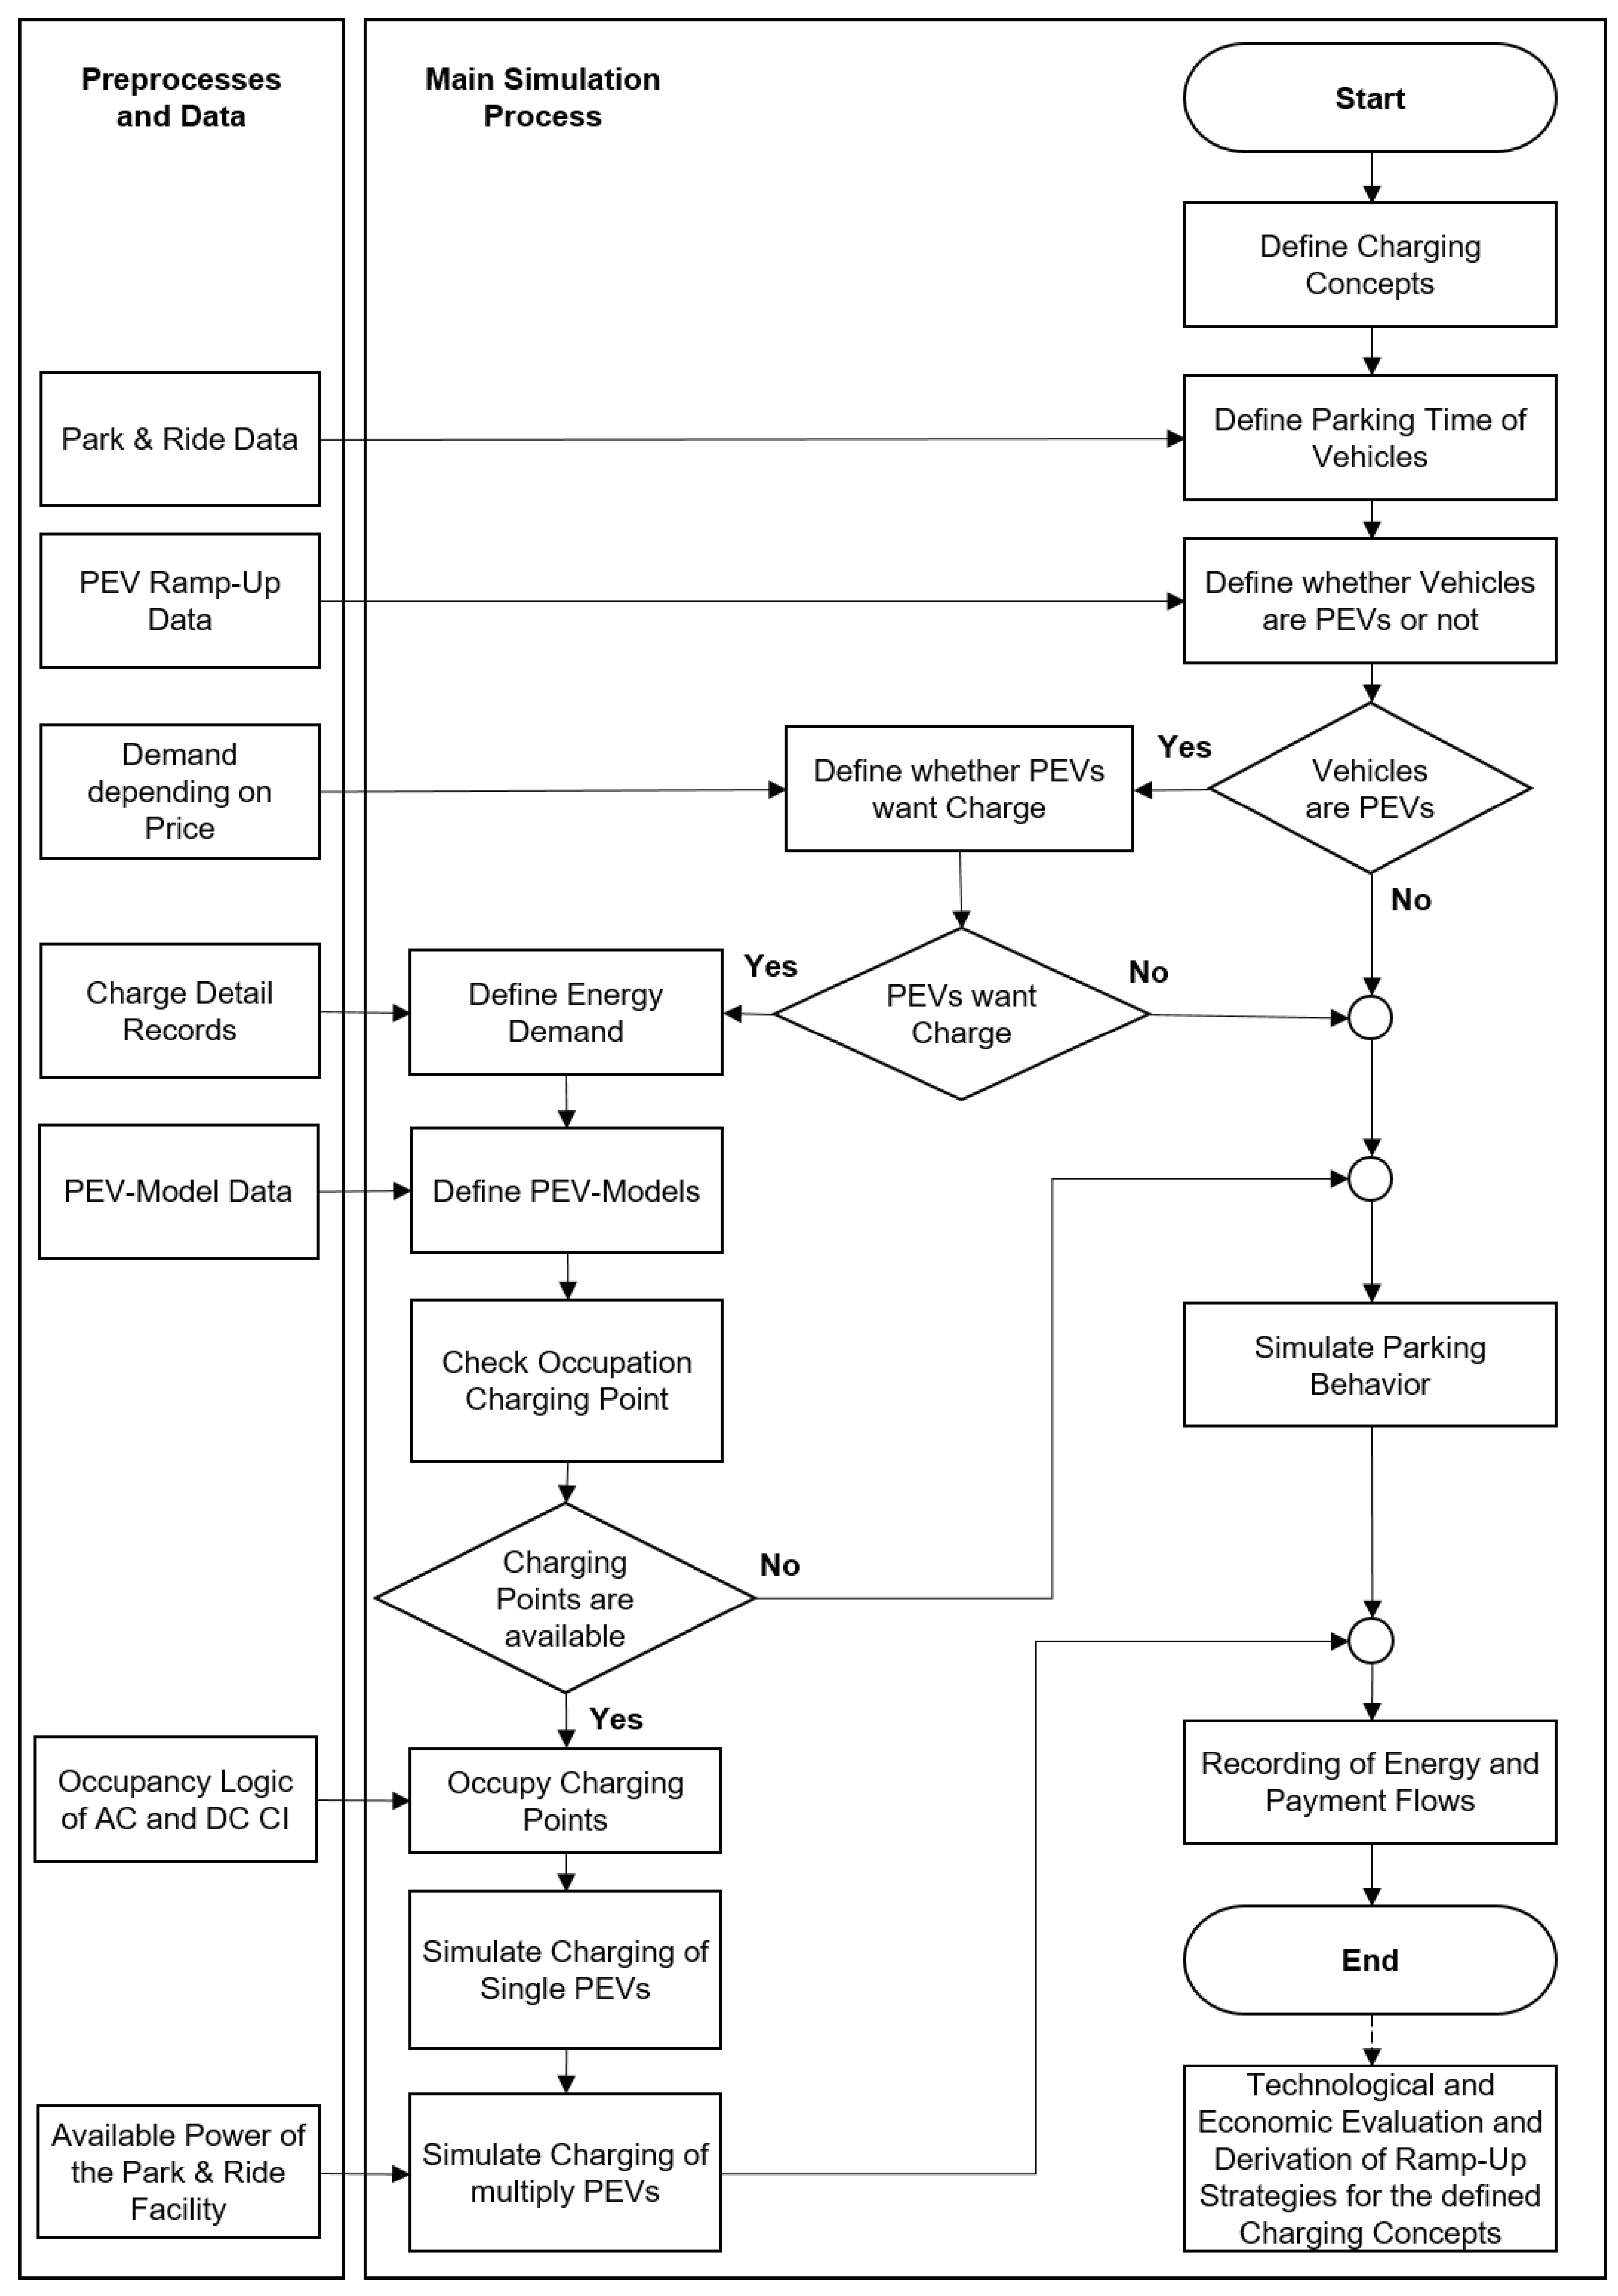
Figure 1 shows the flowchart of the developed ABM. In the flowchart, a distinction is made between pre-processing (left side) and the main simulation process (right side). During pre-processing, central input parameters for the simulation model are defined, calculated, and transferred to the main process at specific points. In the main process, parking, occupancy, and charging behavior are simulated at the level of individual vehicles and PEVs. In the following section, the processes depicted in Figure 1 are described in more detail.
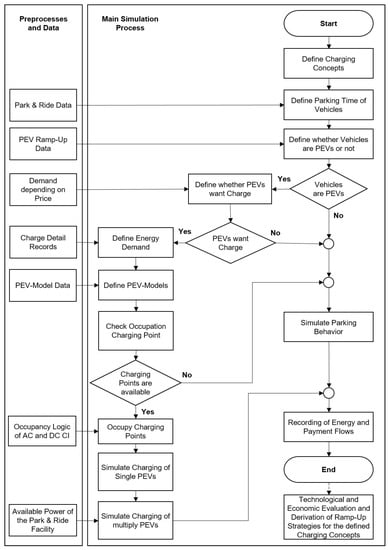
Figure 1.
Flowchart of Agent-Based Model for the Evaluation of Charging Concepts using the Example of Park and Ride Facilities, further details explained in Section 2.
2.1. Charging Concepts
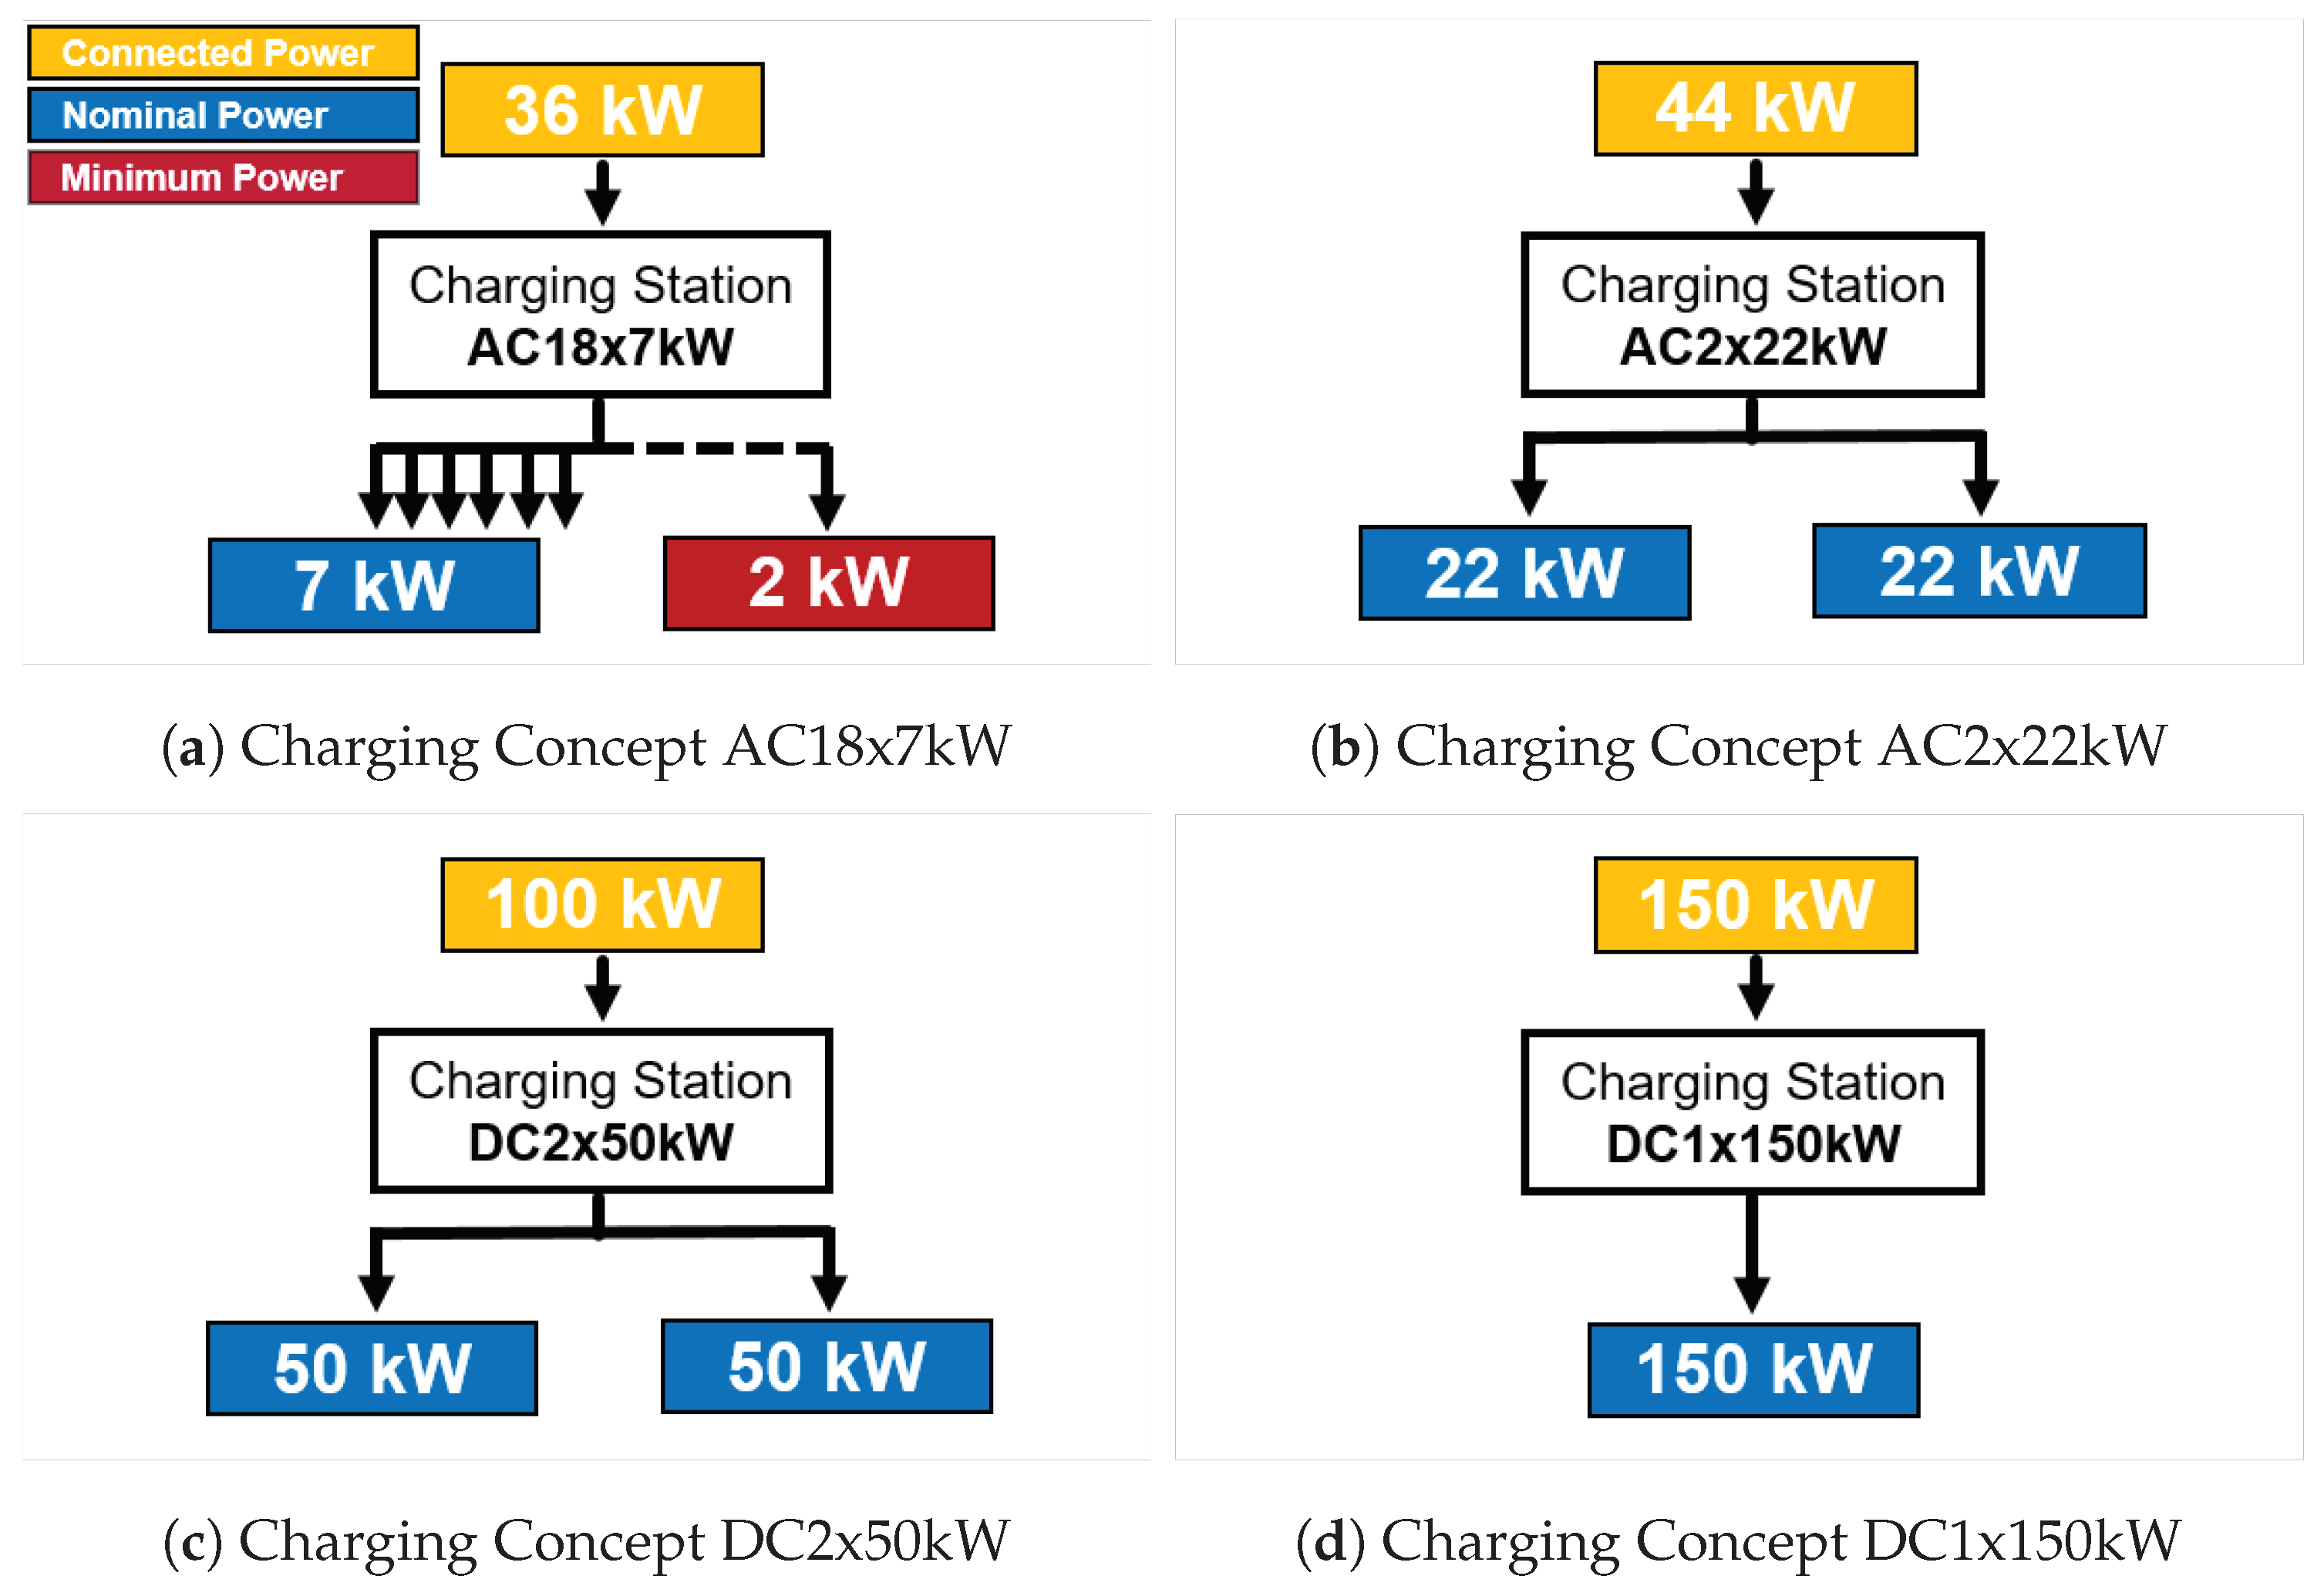
In an attempt to minimize the confusion given by the amount of abbreviations, charging concepts and charging stations are utilized interchangeably, since the applied concepts are reflected by the specific charging stations, and vice versa. In the first step of the flowchart in Figure 1, the simulated CSs and their underlying CCs are defined. The definition of the concepts is based on economic and technological parameters. Figure 2 shows the structure of the simulated CSs. Within the scope of the study, two AC and DC concepts, namely AC18x7kW, AC2x22kW, DC2x50kW and DC1x150kW, are evaluated. All concepts are implemented in real-world CSs that are already in use in public charging locations. The notation of the different concepts is composed of the charging technology, the number of CPs per station, and the nominal power per CP. Therefore, AC18x7kW represents an AC CS where the connected power is distributed to a large number (18) of CPs. The charging power is evenly distributed among the available number of CPs. The nominal charging power per CP is 7 kW. Due to the rather low nominal charging power, this kind of CS is also referred to as a low-power charger. The basic idea of low-power chargers is to offer CI at comparatively low costs. To this end, the available power is reduced to a minimum and distributed over a high number of CPs. Low power chargers are mostly used in cases where a long connection time is to be expected, such as overnight charging. AC2x22kW is also an AC CS, but here, the connected power of 44 kW is divided between two CPs, each with 22 kW of power. In addition to the AC CSs, two DC CSs are assessed with the configurations DC2x50kW and DC1x150kW. DC2x50kW is a so-called fast charger with two CPs each and a power of 50 kW. DC1x150kW is a so-called high power charger (HPC) with a comparatively high nominal power of 150 kW. With AC2x22kW and DC2x50kW, the most common public AC and DC CSs in Munich are evaluated. In addition to these established CSs, AC18x7kW and DC1x150kW, two types of chargers with a lower and higher charging power, are evaluated. The range of CSs evaluated thus includes all relevant power classes of conductive CSs.

Figure 2.
Considered Charging Concepts.
Table 2 and Table 3 contain the technological and economic parameters of the CSs used in the study. The parameters were taken from the studies [19,20,21,22] and were fixed for the simulation after consultation with the respective manufacturers. In the developed ABM, the CSs are described by the conductive Charging Technology, the Connected Power of the CS, and the Number of CPs. Additionally, the number of CPs can be scaled for AC18x7kW in the range of 18 to 36 CPs, and the CI can thus be expanded more easily as demand increases. Since these are single-phase CPs, the CPs are usually expanded in scaling steps of three CPs to ensure an even utilization of the phases. After consultation with the manufacturer of AC18x7kW, the Connected Power of the CS was dimensioned with 2 kW per CP, respectively, with 36 kW for 18 CPs. As a result, if all CPs are fully populated with charging PEVs, each CP can be supplied with a minimal power of 2 kW. The scalability of AC18x7 is symbolized by dotted lines in Figure 2a. In addition to the nominal charging power of 7 kW, the minimum charging power of 2 kW is also specified in this Figure. The 2 kW corresponds to the minimum necessary charging power for AC charging of 6 amperes per phase in order to bring PEVs into the charging state, and thus, to prevent an unwanted interruption of the CE [23]. By scaling the CP at AC18x7kW, the Connected Power must therefore also be extended, for example, for 36 CPs to 72 kW. The Connected Power of all other CSs is defined in such a way that all CPs can be supplied simultaneously with the nominal charging power Nom. Power and, thus, no reduction in power occurs when all CPs are fully populated with charging PEVs.
Table 2.
Technical Parameters of the Investigated Charging Concepts.
Table 3.
Economic Parameters of the Investigated Charging Concepts.
The economic parameters distinguish between the one-time capital expenditures (CAPEX) per CS and the ongoing annual operational expenditures (OPEX) per CP. The CAPEX include the costs for the actual CS, the installation, and the connection of the CS to the local power grid. The OPEX include the costs for the backend connection and the costs for maintenance and update of the individual CPs. In the case of the scalable approach AC18x7kW, the costs for the expansion of the CS are also listed. In addition to the costs, the table lists the profit margin from energy sales. The profit margin is the difference between the net sales price and the cost price of energy, including taxes, levies, and grid fees. For the AC CSs, a profit margin of 0.10 EUR/kWh is assumed based on consultation with the regional CS operator Stadtwerke München and the City of Munich. This value also coincides with the profit margin in [22], which was determined based on that of the day-ahead market from 2019. Considering the profit margin of 0.10 EUR/kWh for AC charging, a profit margin of 0.30 EUR/kWh was assumed for DC charging. This is based on current energy prices at public AC and DC CSs in Munich of approximately 0.50 EUR/kWh and 0.70 EUR/kWh, respectively, [24]. Both values are consistent with the expected profit margin for AC and DC CE in [11]. In addition to the sale of energy, the DC CSs can generate revenue in the form of a blocking fee. This fee accrues after the first minute if the CP continues to be occupied by a battery electric vehicle (BEV) after the charging process has been completed, and the CP is, therefore, not accessible to other vehicles. This misallocation of the CI resource is thus monetarily sanctioned and functions as an additional source of revenue. The blocking fee was only considered for DC CI, as these are not used due to the lower charging power and longer connection times of AC CI. The application of the blocking fee is thereby significantly related to the occupation logic of the CSs. This is explained in Section 2.6.
2.2. Parking Behavior
In the next step of the flowchart in Figure 1, the parking behavior of the vehicles and, thus, the potential occupation behavior of the PEVs is determined. For this purpose, a probability function was applied that defines whether and how many vehicles enter the specific P & R facility at a certain time. Here, both the time of day and the day of the week are taken into account. Data from seven P & R facilities in and around the city of Munich serve as the data basis for the probability distribution. The data were provided by P + R Park and Ride GmbH München and originate from the years 2020 and 2021. The company operates more than 14,000 parking spaces at 38 P & R facilities in and around the city of Munich. Depending on the location, these can be open-air parking facilities with free access or parking facilities with gated access. The data of the present study are taken from P & R facilities with gated access. The ticketing system of the facilities recorded when a vehicle entered the facility and when it left the facility. Therefore, it can be derived how long each vehicle was parked in the facility. More detailed information on the vehicle owner or the vehicles such as the residence of the vehicle owners or whether the vehicle entering the facility was a PEV is not available.
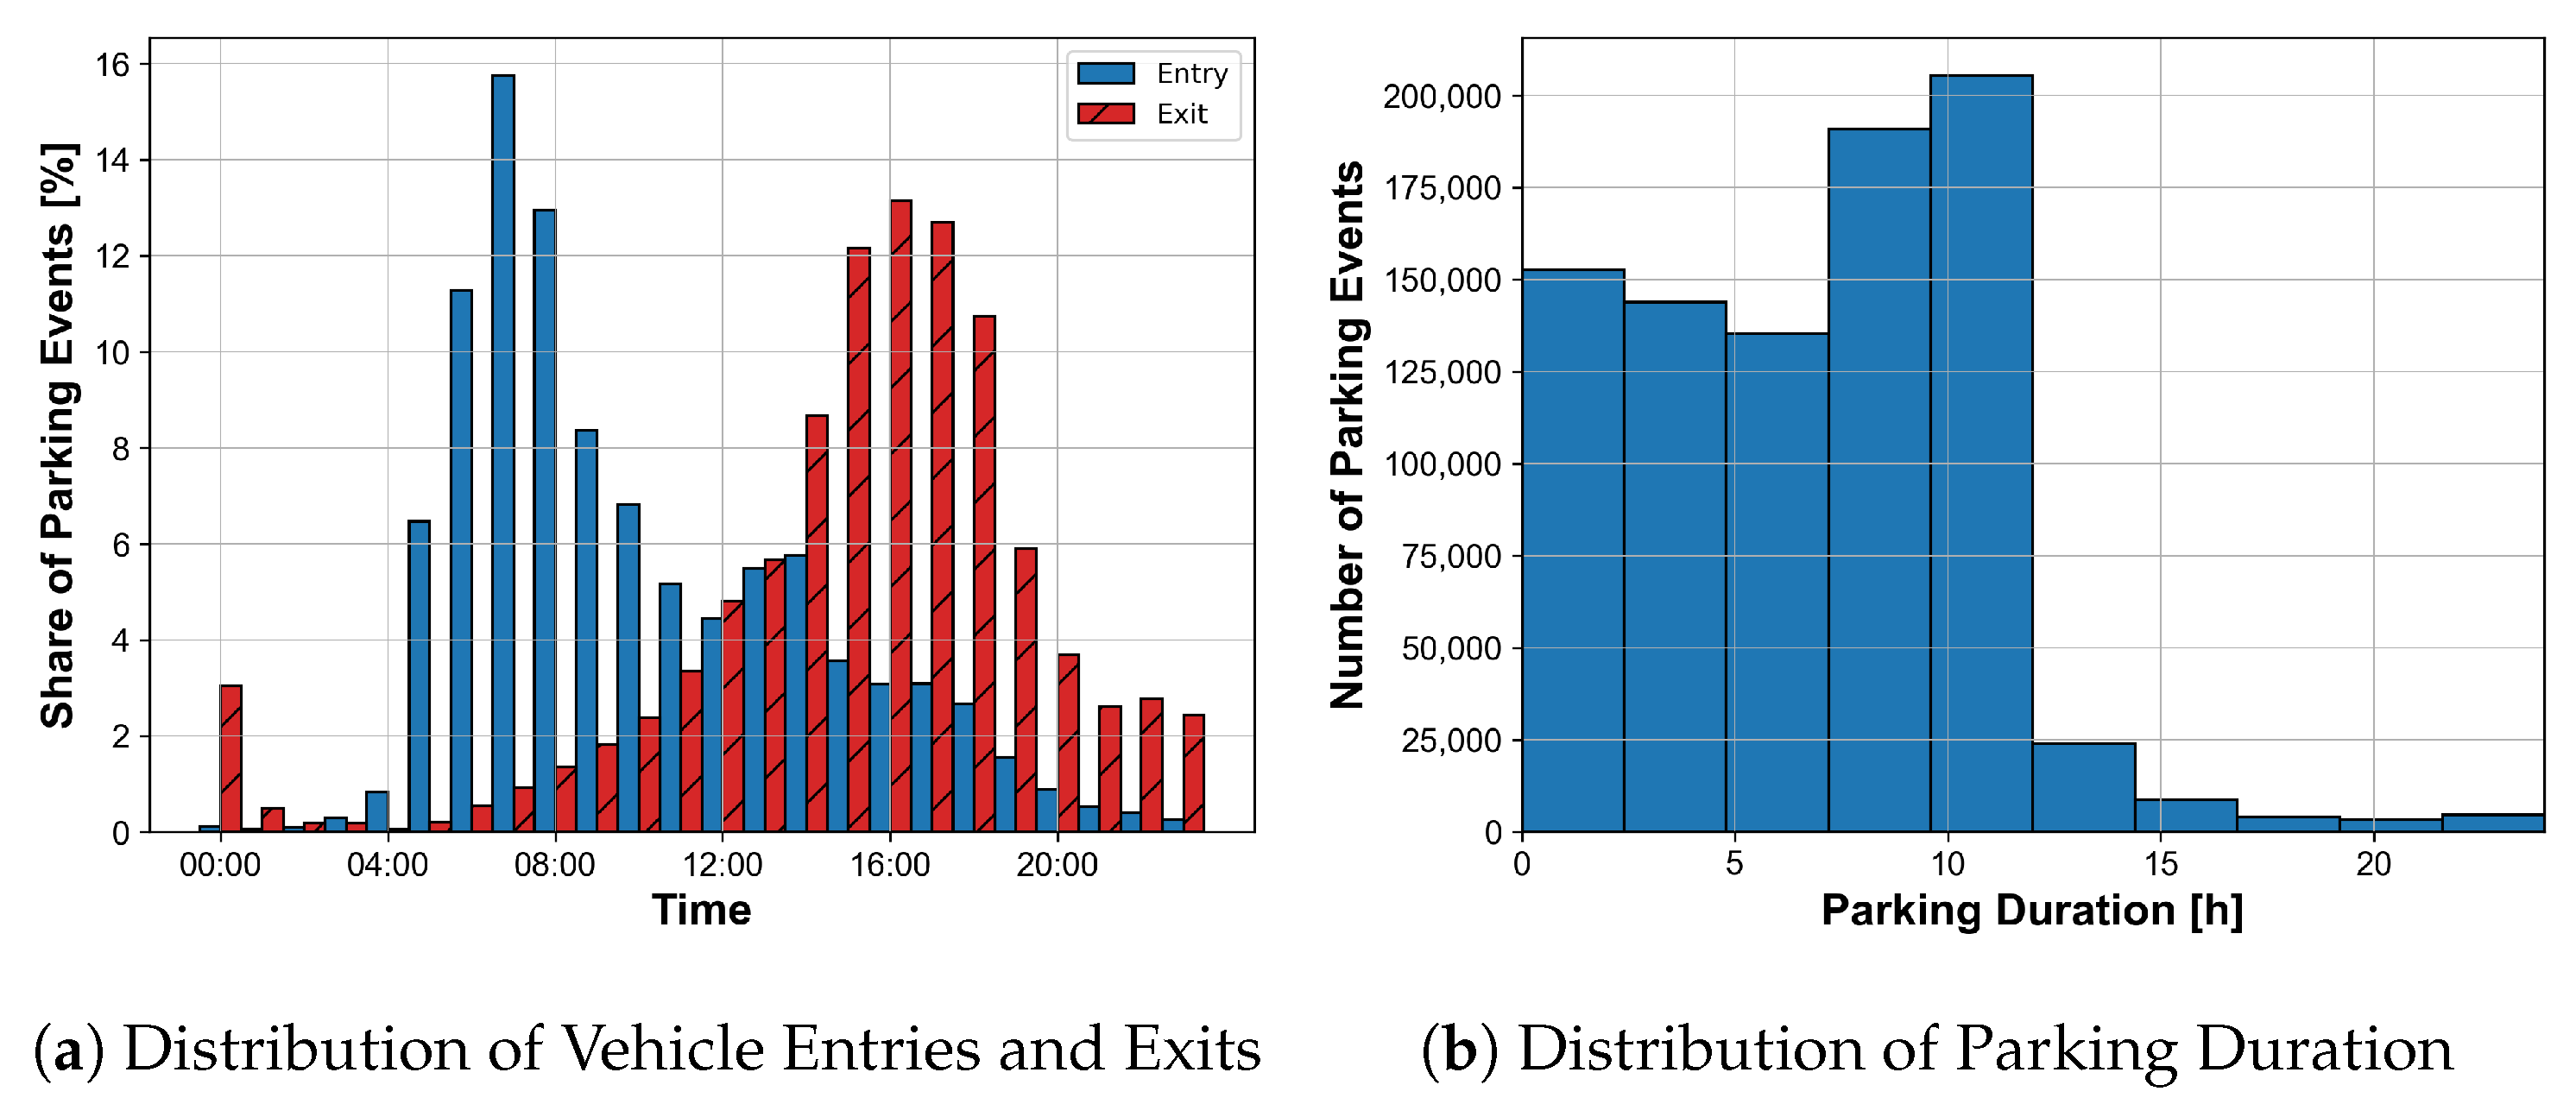
Figure 3 shows the distribution of vehicle entry and exit times and parking durations across all facilities. The distribution includes over 900,000 parking events. The analysis shows that the majority of the entries and exits occur in the morning hours around 8 a.m. and in the late afternoon hours around 4 p.m. Thus, the parking patterns reflect the peak commuting hours. The average parking duration is 6.8 h (median: 7.2 h). Facility-specific characteristics can be identified in the facility-specific distributions. However, in order to limit the variability of the results, the data of all facilities were used in this study and an ideal-typical P & R facility with 300 parking spaces and 90,000 parking events per year was simulated. The data from all facilities were used as the basis for the simulation.

Figure 3.
Parking Behavior of Vehicles.
2.3. PEV Scenario
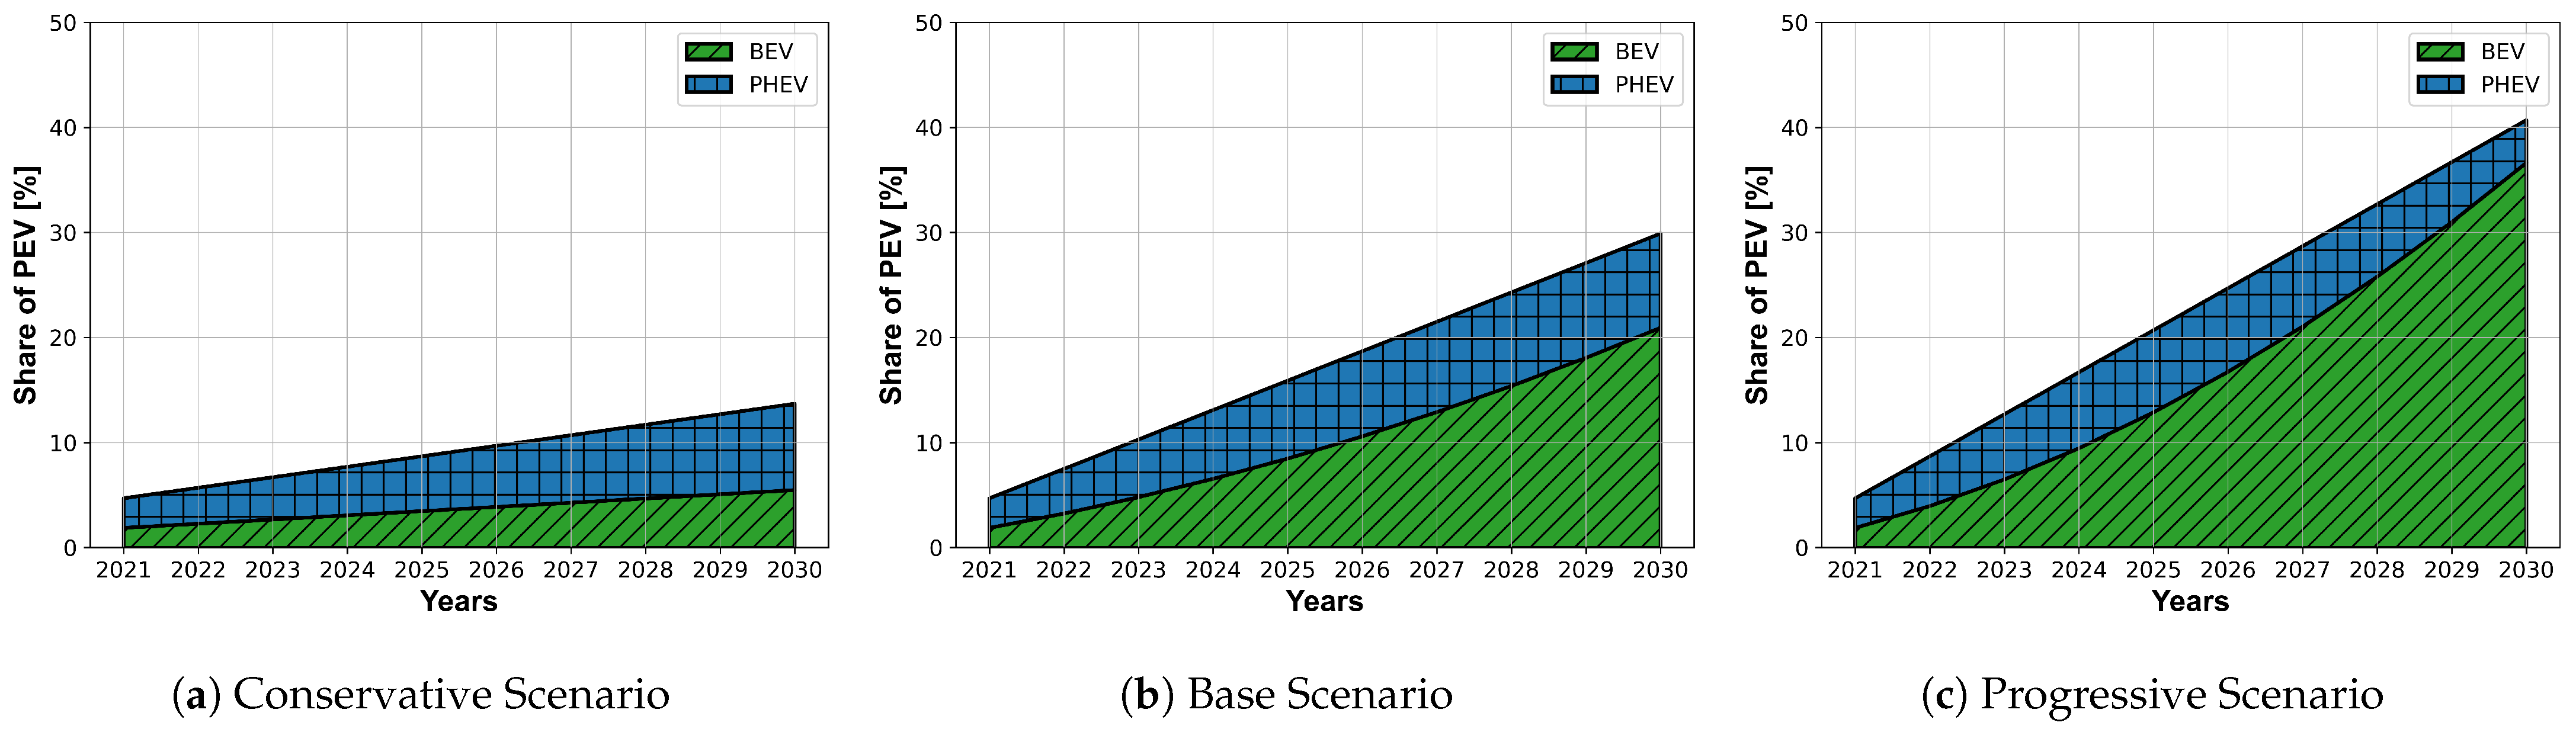
The next step with regard to the flowchart in Figure 1 is to determine whether the incoming vehicle is a PEV or not. The assignment is again made by a probability distribution. The distribution is based on three different scenarios for the growth of PEVs in the study area. Figure 4 shows the scenarios used. Here, a base scenario was supplemented with one conservative and one progressive market ramp-up scenario. The parameters of the base scenario were set in consultation with the City of Munich. Accordingly, the city expects an additive annual 2.8% increase in PEVs. In the assessment period of 10 years, this results in a share of approximately 30% at the end of the year 2030.

Figure 4.
Scenarios for the Ramp Up of Plug-in Electric Vehicles in the Study Area.
A distinction is made between the composition of the PEV stock in BEVs and PHEVs in addition to the annual stock growth. At the beginning, the number of PEVs is composed of 40% BEV and 60% PHEV, which is the current level in the study area. By 2030, the share of BEVs is assumed to increase to 70%, while the share of PHEVs is assumed to decrease to 30% due to regulatory measures such as the reduction in subsidies for PHEVs. Based on the baseline scenario, a lower annual growth rate of 1% was applied in the conservative scenario. The share of BEVs and PHEVs remains constant. In the progressive scenario, a higher annual growth rate of 4.0% was assumed. The share of BEVs and PHEVs also shifts more strongly towards BEVs in the progressive scenario with a share of 90% in 2030. The share of BEVs and PHEVs is decisive for the evaluation of the CSs, since PHEVs have a comparatively low charging power and battery capacities while generating correspondingly lower energy demand at the CPs or occupy the CPs longer for CEs with the same energy demand. In addition, PHEVs do not have the option of DC charging and the demand for DC CSs, thus, results exclusively from BEVs. How these aspects are considered in detail in the assessment is explained in Section 2.5.
2.4. Demands
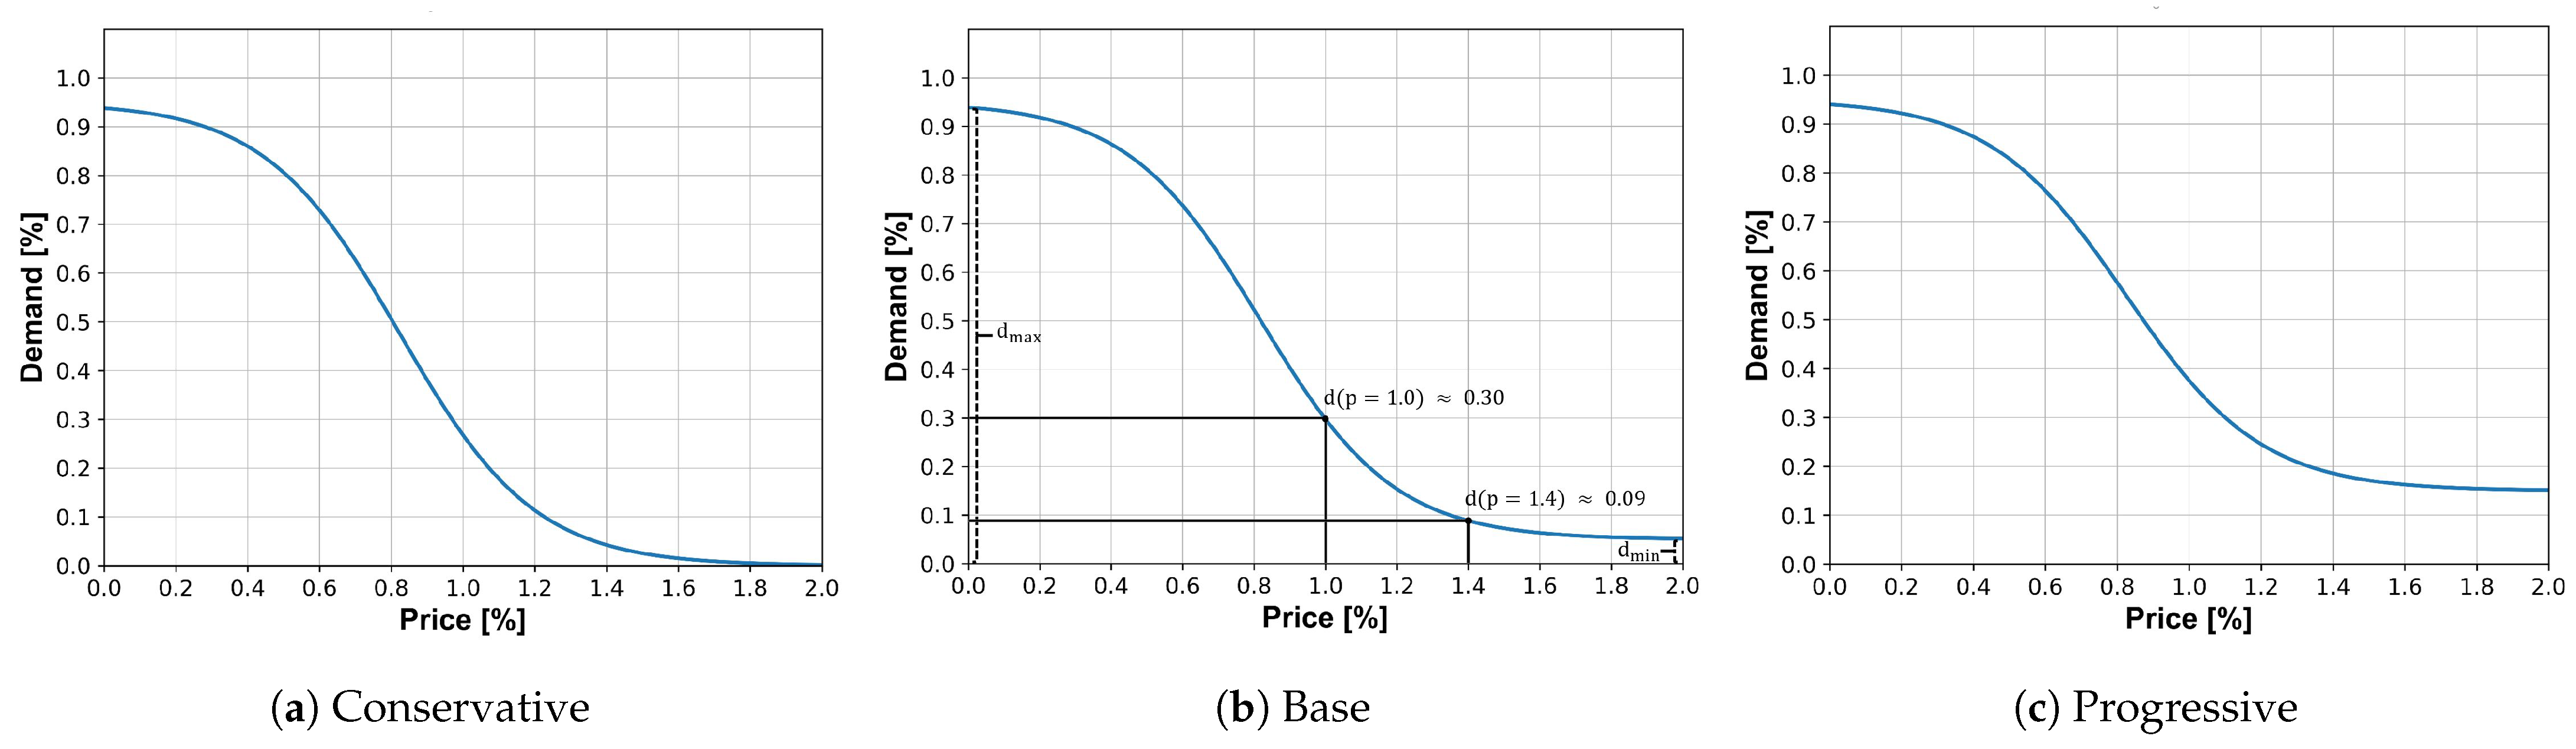
In the previous steps, the frequency at which the CPs in the P & R facility are visited by vehicles has been defined. If these are PEVs, the next step of the flowchart in Figure 1 is to determine whether the corresponding PEV wants to charge. For this purpose, a demand function is applied, which determines the demand depending on the selected energy price. The demand is given by Equation (1), according to [25] (p. 321 ff.). The equation denotes a logit demand function, where p represents the energy price and d the resulting demand, both in percentages. Here, an energy price of 100% represents the energy price at public AC CSs. According to the functional relationship shown in Figure 5, the demand reacts to price changes. The parameter b influences the price sensitivity of the demand function. The larger the factor chosen, the more strongly potential customers react to price changes. In this study, b was assumed as 5.315 for all scenarios. In the function, and were used to determine a minimum and a maximum possible demand. Depending on the considered scenario, in addition to the share of PEV in the system, the parameter is varied according to Table 4. follows the logic that regardless of the chosen energy price, a certain share of demand will take place independent of the price. At the same time, limits the maximum possible demand. In all scenarios, the maximum possible demand is assumed to be 95% of all PEVs entering the facility. With Equation (2), it is ensured that the defined maximum demand is not exceeded. The demand function for the baseline scenario results in a demand d of about 30% at an energy price p of 100%, which means that 30% of the incoming PEVs want to occupy the defined AC CS. This corresponds roughly to the expected share of use of public CI [26]. In addition, the study at hand defines a relative energy price of about 140% for DC charging, corresponding to the energy price of 0.70 EUR/kWh for DC CSs. This results in a demand of about 9% for DC CSs and 30% for AC CSs in the base scenario. In this study, the simulated PEVs thus prefer charging at AC CSs due to cost concerns. At the same time, according to the economic parameters in Table 3, the profit margin is significantly higher for DC charging at 0.30 EUR/kWh than for AC charging at 0.10 EUR/kWh. In the discussion in Section 4, the impact of the demand function is taken up again. For this purpose, the results of AC and DC CI with the same demand are compared in a separate evaluation.
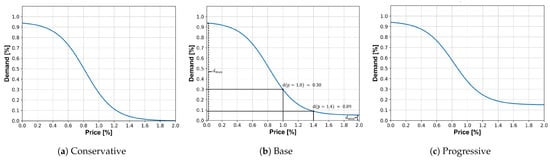
Figure 5.
Demand Functions for the Different Scenarios.
Table 4.
Scenario Data for the Demand Function.
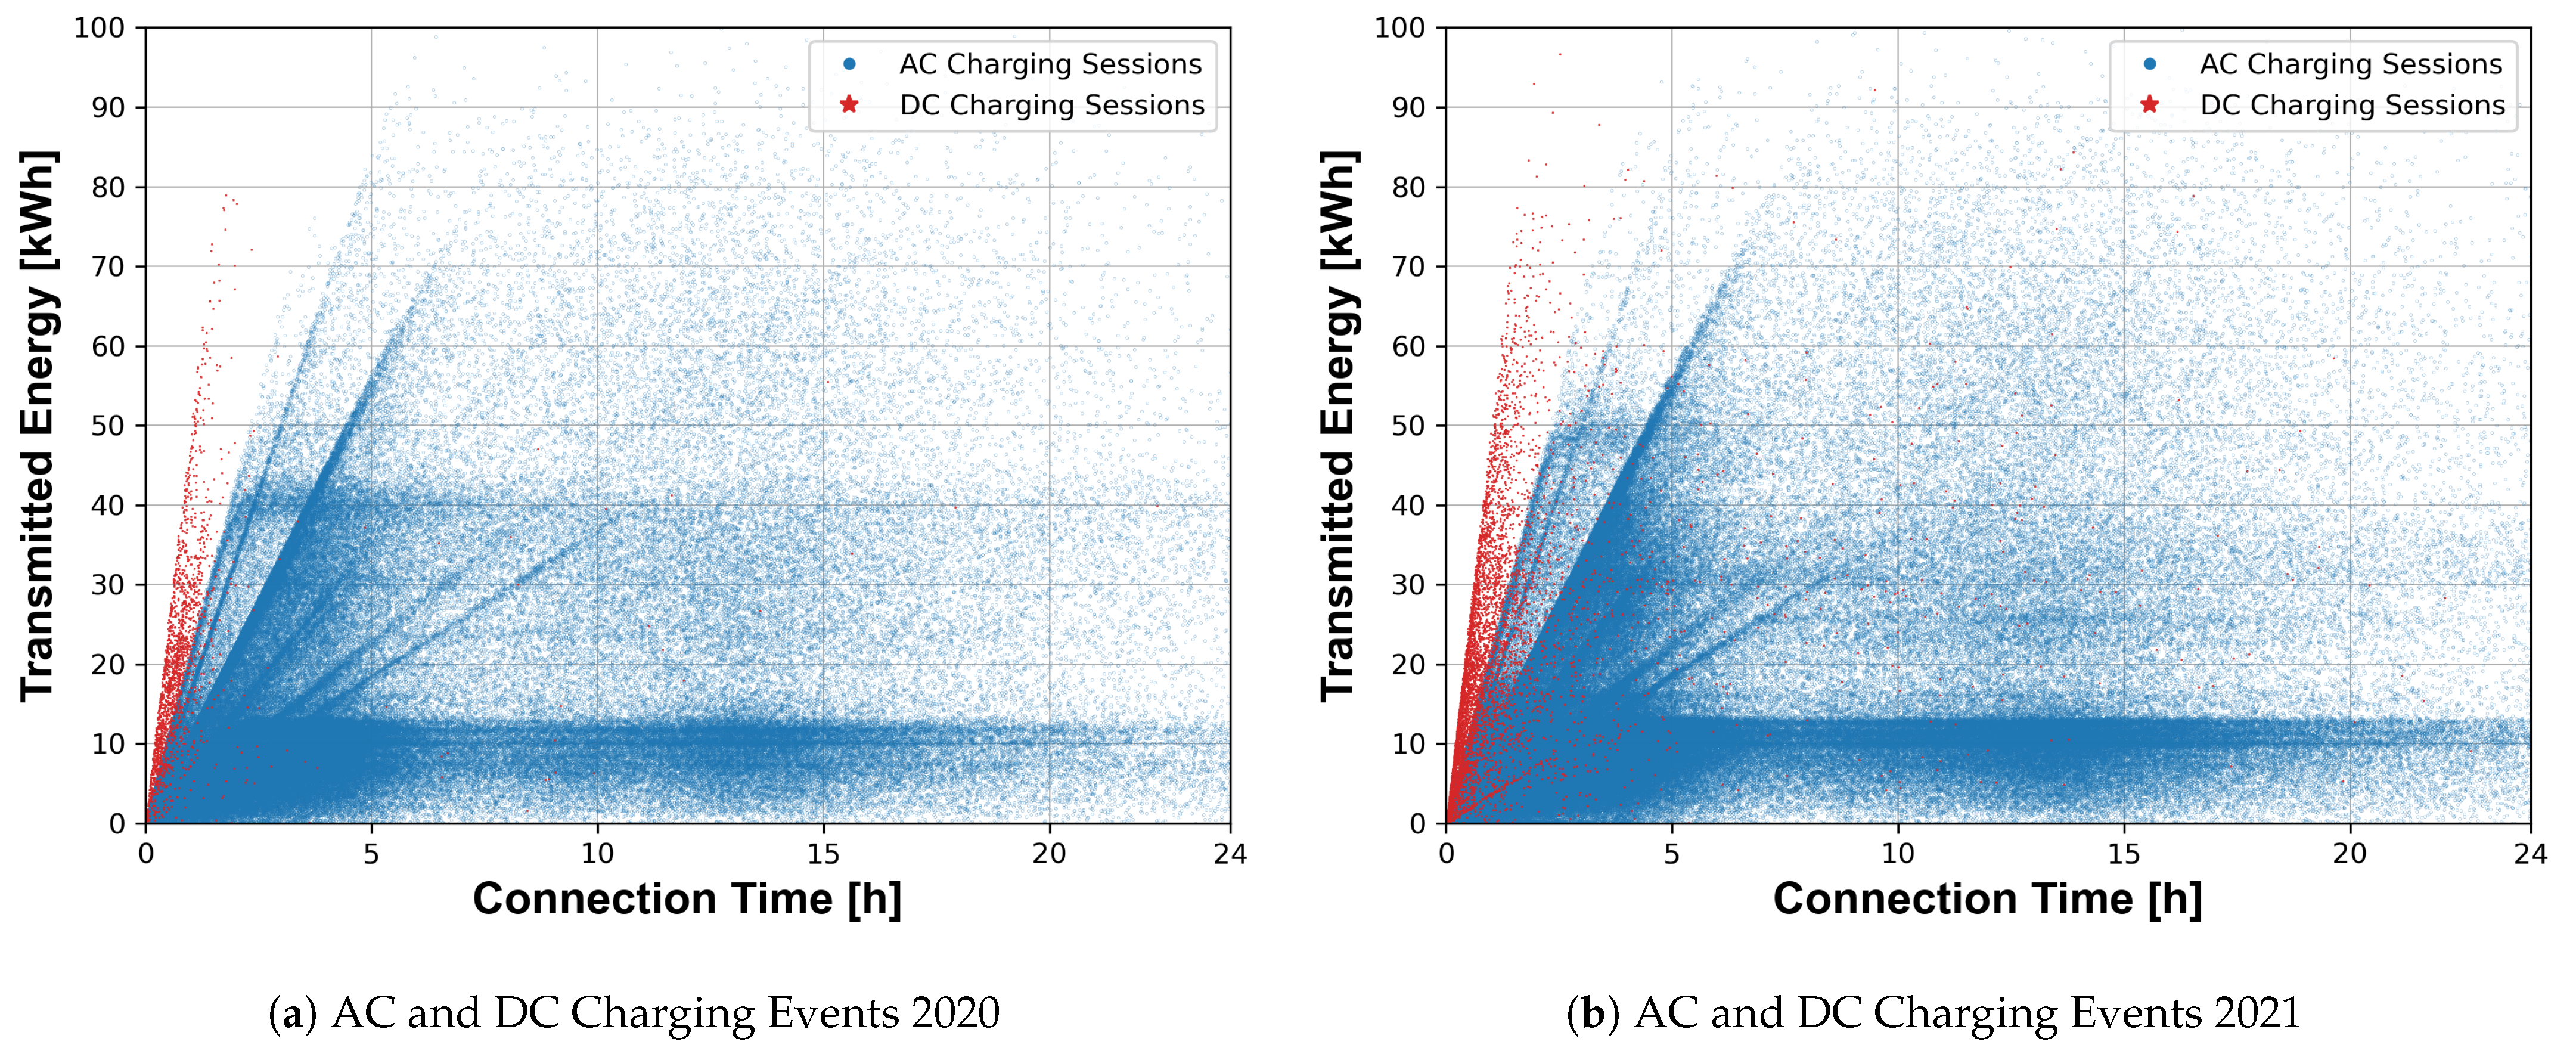
The demand function indicates the probability that a PEV wants to occupy a CP. If it is determined by a weighted random decision that a PEV wants to charge, the next step is to calculate the energy demand based on the available CDRs. The CDRs are from public CSs from the Munich metropolitan area, comprising 590 AC and 50 DC CSs. The AC CSs primarily have two CPs with a nominal power of 22 kW, and the DC CS have two CPs with a power of 50 kW. Table 5 and Table 6 contain relevant key performance indicators (KPI) separately for AC and DC charging. The data set contains mostly AC CEs. In addition to the quantitative share, the usage behavior of AC and DC CI differs. CEs at AC CSs tend to have a higher connection time compared to CEs at DC CSs, while the DC events typically transfer more energy. A more detailed evaluation of CDRs from 2020 can be found in [5,6]. Figure 6 shows the available AC and DC CEs as a scatter plot. The CEs plotted represent the data basis for defining the energy demand according to the next process step of the flowchart in Figure 1. Each point representing a CE consists of the connection duration and the amount of energy transferred. The plot illustrates a typical usage pattern of public CSs for the years 2020 and 2021. As explained in more detail in [5] (Figure 4), the diagrams also show linear areas which result from the accumulation of CEs with vehicle-specific charging powers.
Table 5.
KPIs of AC Charging Events from the Real-World Data Set.
Table 6.
KPIs of DC Charging Events from the Real-World Data Set.
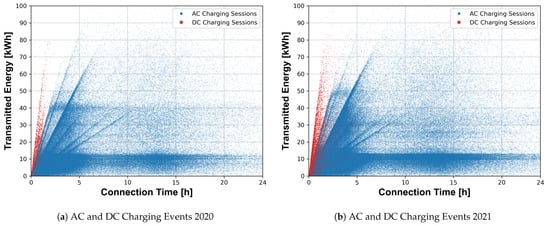
Figure 6.
Connection Time and Transmitted Energy for AC and DC Charging Events from CDRs.
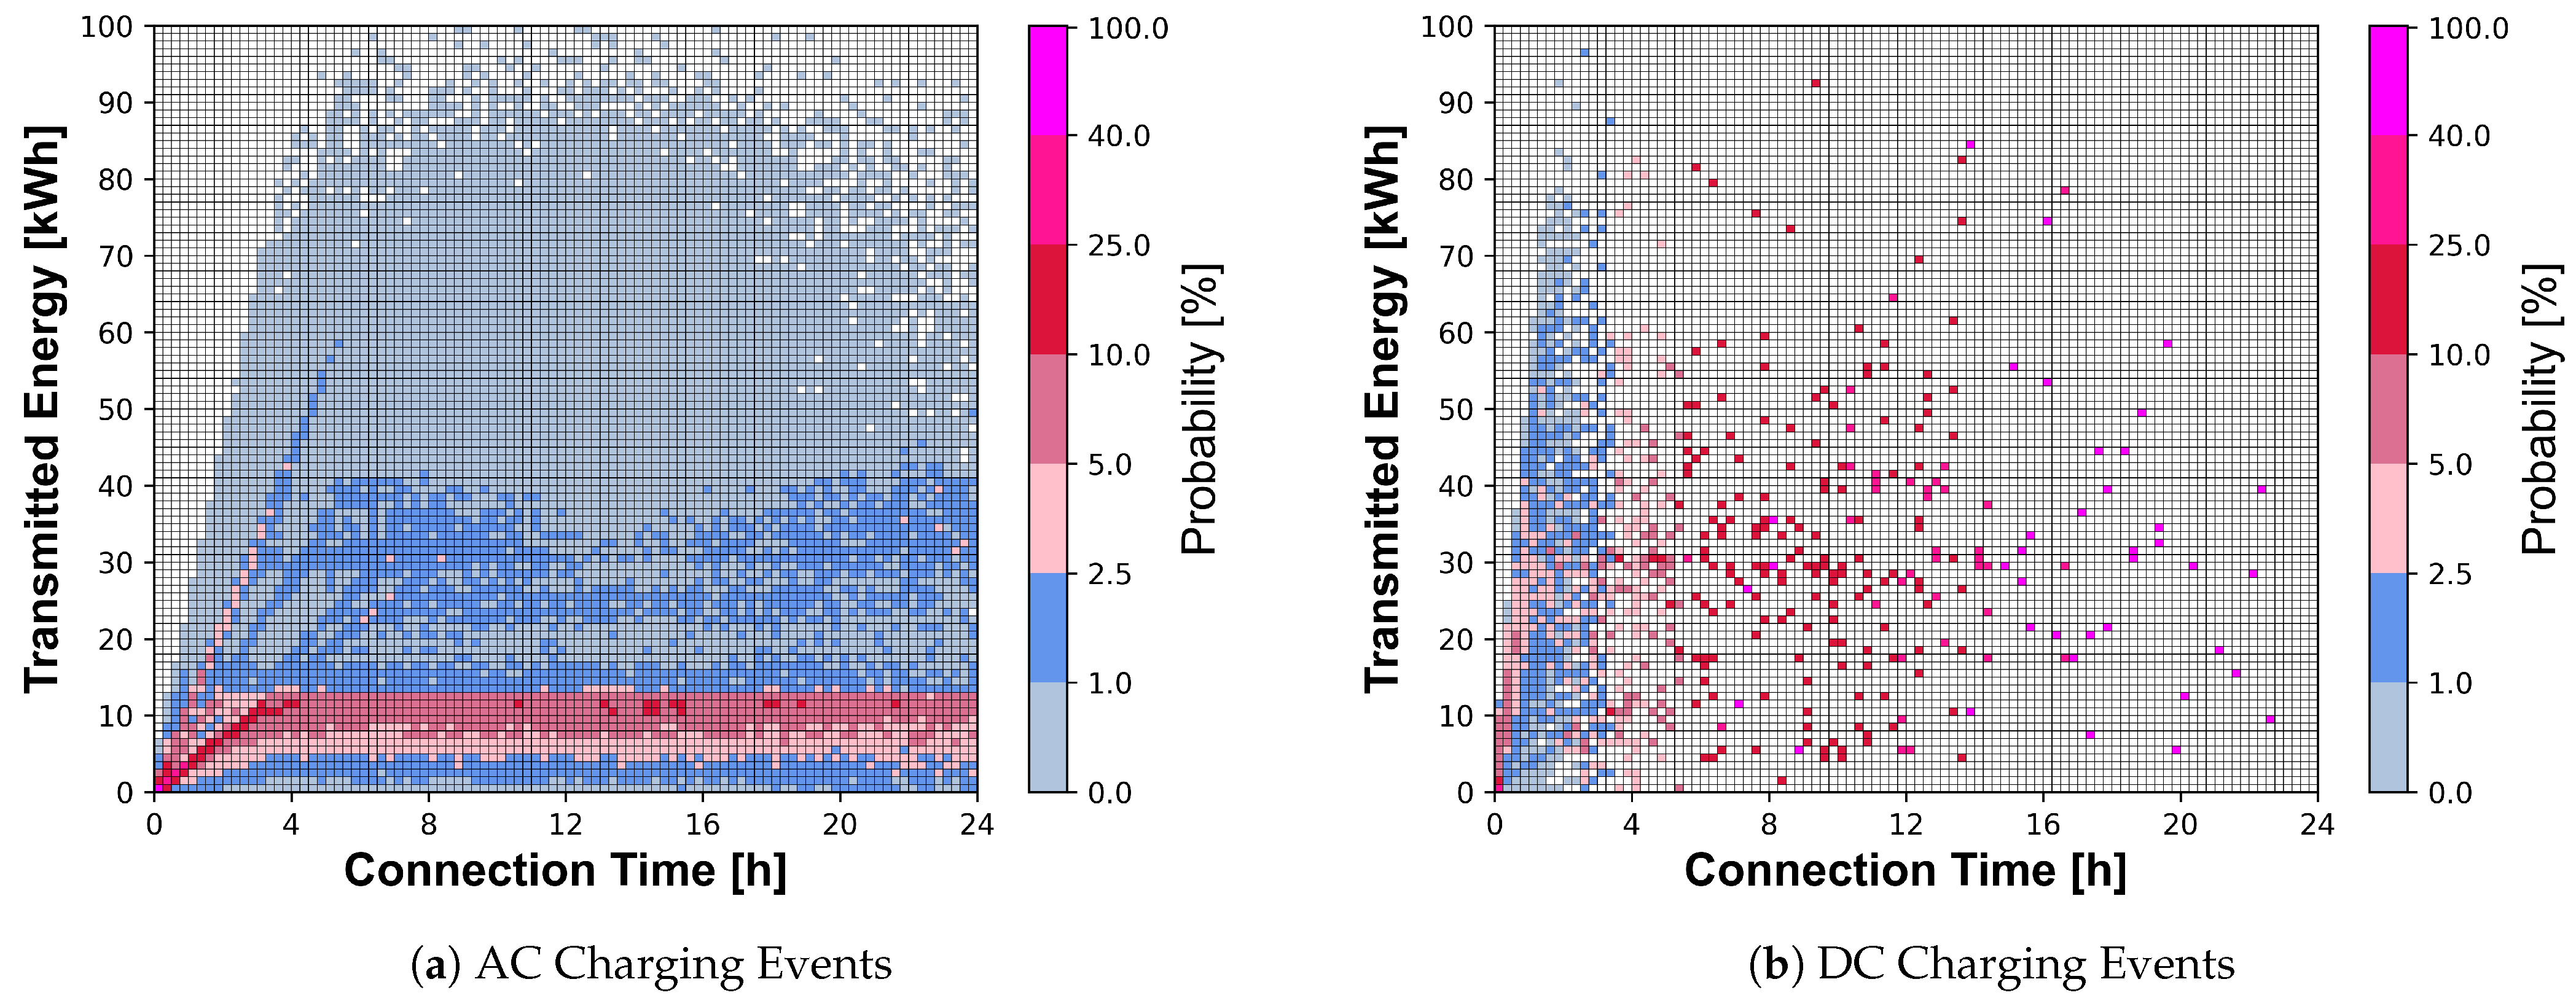
The clustering of the plotted points already shows an implicit probability distribution. Areas with a high number of points represent a high probability that a certain amount of energy was demanded for a given connection duration. To illustrate the distribution that has been used to determine the energy demand, the CDRs have been transferred to the probability matrix in Figure 7 separately for the AC and DC CEs. The connection duration is plotted on the x-axis in 15 min increments and the amount of energy transferred is plotted on the y-axis in 1 kWh increments. Thus, for a considered connection duration of 24 h or an energy amount of 100 kWh, there are 960 cells in the area. The color of each cell indicates the probability of how often the CE occurred with the corresponding connection duration and energy quantity. White-colored cells indicate that the combination of connection time and amount of energy transferred did not occur in any CE. The probability is given by the color of the cell, increasing from blue to red. For a better understanding, interpretation examples of the probability matrix are given below. With a connection time of 0 to 15 min, the probability that 0 to 1 kWh of energy has been transmitted is very high for both the AC and DC distributions. The first cell at the bottom left is, therefore, colored pink in both diagrams. In contrast, the probability of transferring between 99 and 100 kWh of energy in these 15 min is 0 in both cases, since this is technically impossible due to the available power of the CPs used. It should be noted that the nominal charging power of the AC CPs used here is 22 kW and for the DC CPs, 50 kW. In each case, this corresponds to the first linear range from the left for the AC and DC CEs. The formation of the additional linear ranges results from a reduced vehicle-specific charging power that occurred primarily for AC CEs. Figure 7a shows a wide spread of connection time for AC CEs over 24 h. In contrast, the DC CEs in Figure 7b show a concentration in short connection times. The developed probability distribution allows for a realistic determination of the energy demand realistically based on real world CEs. The available connection time used here is the parking time of the PEVs, which is derived from the entry and exit data of the P & R facilities. Here, a different logic is used for AC and DC CEs both for the occupation logic and for the determination of the energy demand. For AC CEs, the energy demand is determined based on the available connection time. For DC CEs, the challenge is that for longer connection times, as those that occurred in P and R facilities according to Figure 3b, there are sometimes no suitable data available from the CDRs. For this reason, in the absence of matching data for DC CEs, all connection times shorter than the considered connection time are considered. In this way, the energy demand can be quantified for both AC and DC CSs. The applied occupation logic is explained in Section 2.6.
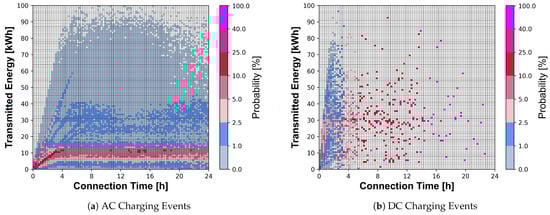
Figure 7.
Conditional Probability Distribution of Transmitted Energy Given the Connection Time.
2.5. Define PEV-Models
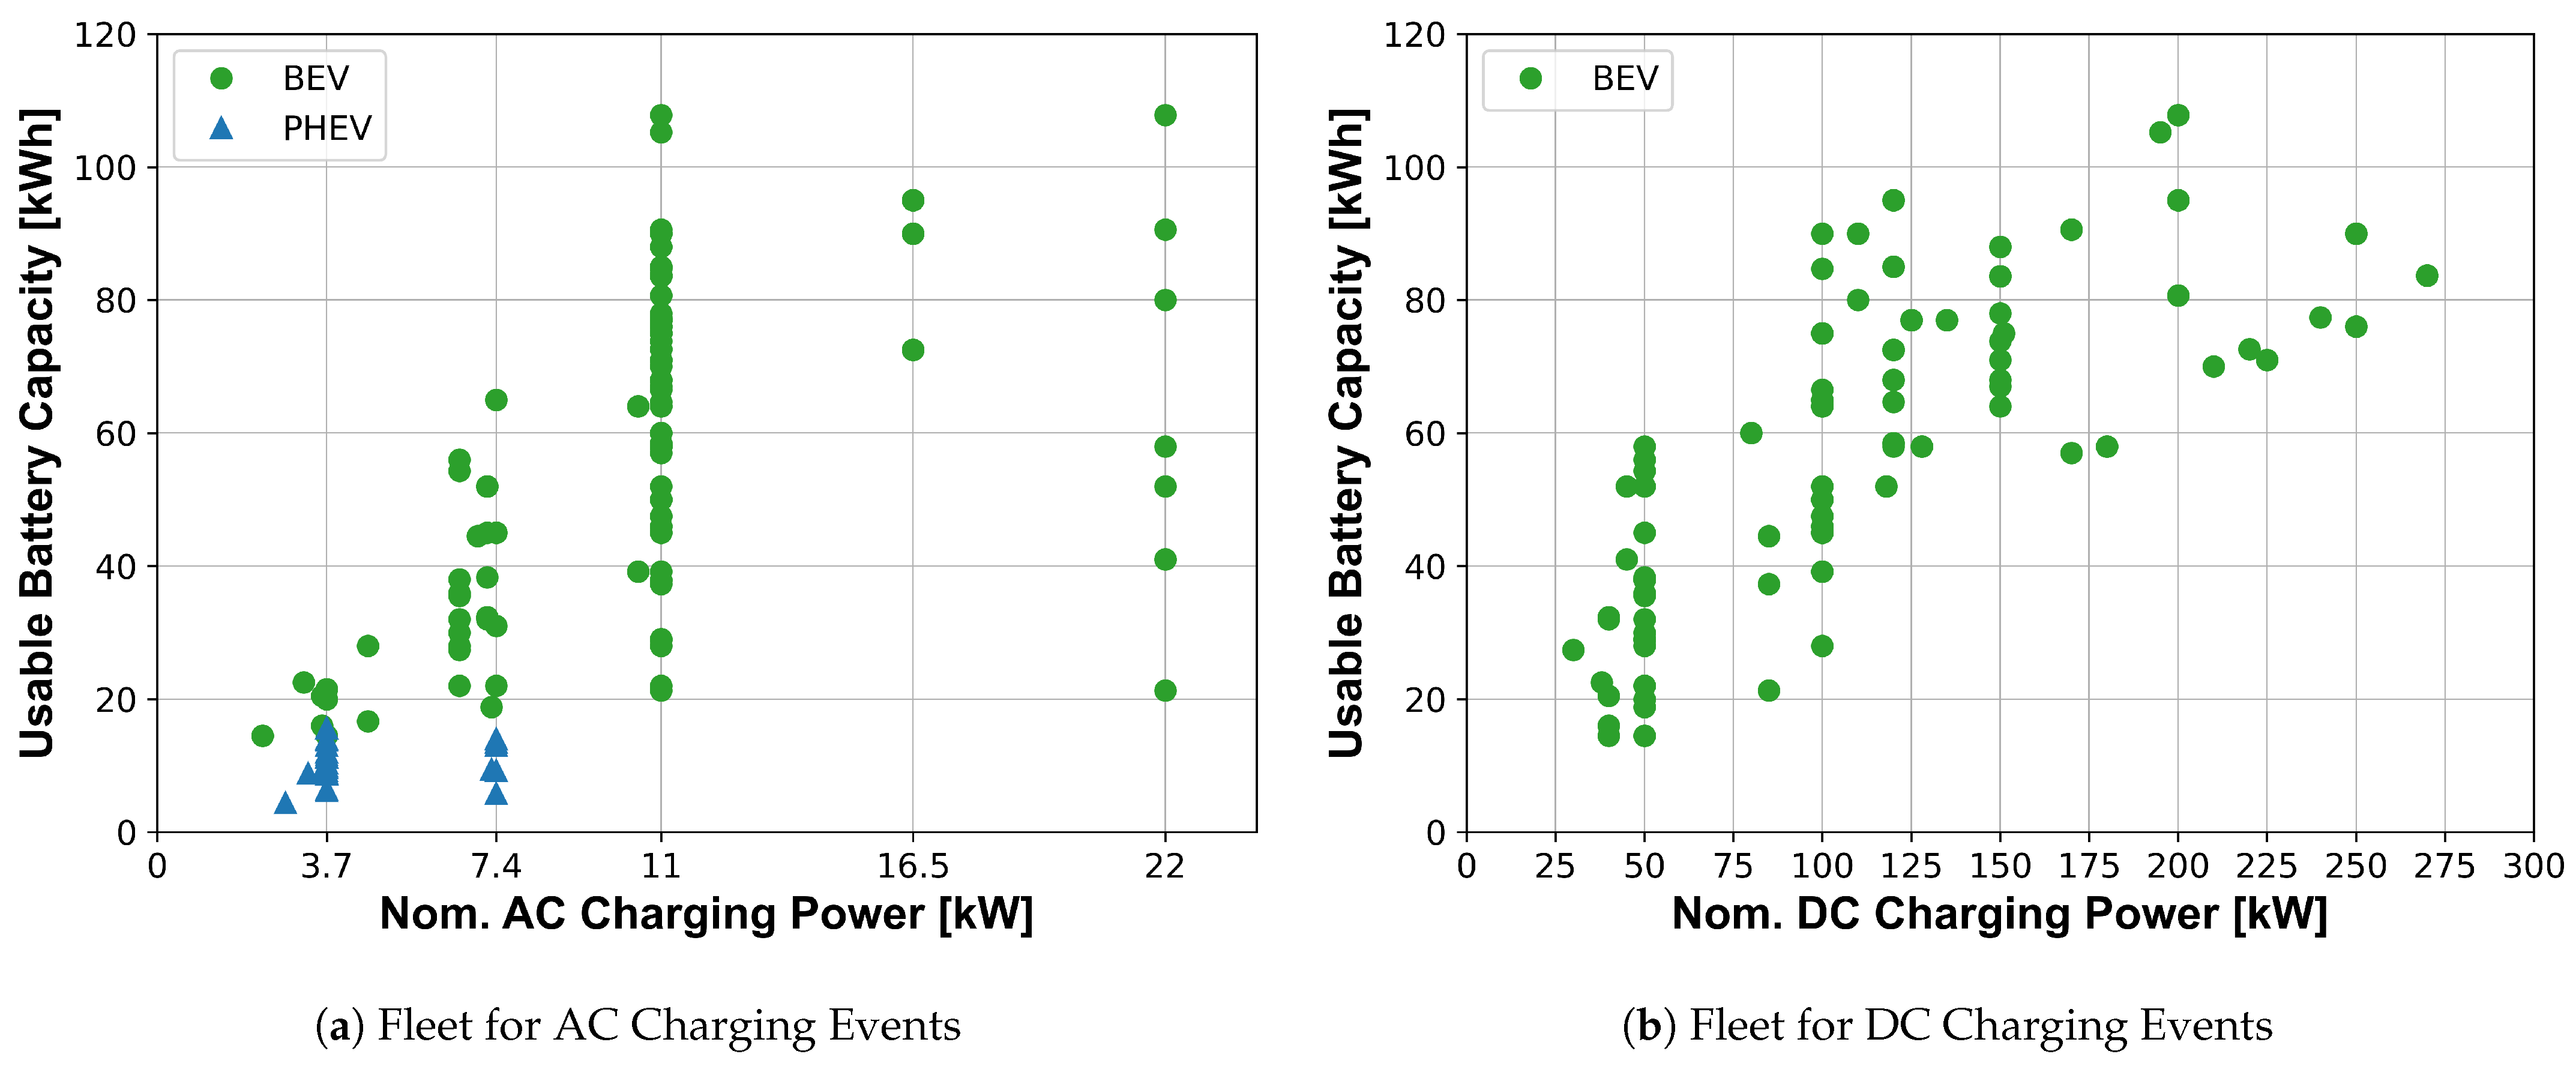
To simulate the CEs, vehicle-specific parameters such as the usable battery capacity and the nominal power of the PEV are required in addition to the available connection time and the amount of energy demanded. For this purpose, an internal database of available PEV models was created. The database includes over 200 PEV models. Figure 8a shows the relevant vehicle parameters for simulating AC CEs. Here, the nominal AC charging power has four power classes based on the supported number of phases and amperage of the on-board charger in the vehicle. It should be noted that with AC CI, both BEVs and PHEVs can access the CPs, and DC CI can only be used by BEVs. Due to the tendency of a lower usable battery capacity, PHEVS have a nominal power of 3 to 7 kW. Both nominal charging power and usable battery capacity are significantly higher for BEVs. As explained in the PEV scenario step, a different development of registered BEVs and PHEVs is considered depending on the scenario. To account for the share of BEVs and PHEVs in the demand response, a weighting of the defined energy demand is applied. Since the CDRs used do not contain any information about the vehicle or the customer, it cannot be determined whether a CE was made by a BEV or a PHEV. For this reason, an estimate was made based on the amount of energy transferred and the average power. Based on the vehicle data from Figure 8a, the value limits for energy demand were defined as 10 kWh, and as 3 kW for AC charging power. AC CEs that have a higher energy demand or higher charging power were marked as CEs by BEV and weighted according to the selected scenario. Figure 8b shows the vehicle-specific parameters for DC CEs. Since only BEVs are relevant for this, the possible number of vehicles that can charge at the DC CPs is determined by the share of BEVs of the respective scenario according to Figure 4.

Figure 8.
Usable Battery Capacity and Charging Power of the Simulated PEV Fleet.
To determine the PEV model, both the amount of energy demanded and the available connection time are taken into account. To assign possible PEV models to the defined CE, the first step is to check for which vehicle models the CE is possible based on the usable battery capacity and the nomina power. Thus, PEVs are dropped from the assignment process if the amount of energy demanded exceeds the usable battery capacity, or if the required charging power exceeds the nominal power of the PEV. This ensures that there are no vehicle-side limitations to meeting the energy demand. This is relevant if the energy demanded is compared with the energy actually transferred for the simulated CI in the result evaluation. Deviations thus result exclusively from CI-side limitations and not from the selected PEV model. If several PEV models are considered in this selection process, a random selection from the possible vehicle models takes place in the next step. For this purpose, an additional weighting is performed according to individual vehicle segments. Table 7 shows the vehicle segments considered. The weighting of the segments was carried out in accordance with the Federal Motor Transport Authority’s number of registered passenger cars [22].
Table 7.
PEV Segments.
2.6. Occupation of Charging Points
Once the specific PEV model has been determined, the CPs are occupied. Here, a separate occupation logic is applied for AC and DC CSs, since previous studies have shown that the usage behavior at the respective CS types differs, as explained in Section 1. For example, CEs at AC CSs are usually associated with extended parking periods. The connection time at AC CPs is usually longer than necessary for the actual CEs. Hence, there is a high proportion of idle connection time. In contrast, DC CEs focus on the actual charging process. The connection times are usually no longer than necessary and the proportion of idle connection time is therefore significantly lower compared to AC CEs. To take this usage behavior into account, the occupancy of the AC CPs by PEVs is conducted during the entire parking period. At AC charging, the CP is occupied for the entire parking time in the P & R facility. For the DC CI, however, occupancy of the CPs during the entire parking period is only accepted if this does not exceed a defined proportion of idle connection time. The acceptable share of idle connection time results from the determined distribution of idle connection time in [5]. Thus, idle connection time occurs in only 3.4% of DC CEs. To compensate for the blocking of CPs, a blocking fee of 0.50 EUR/min is charged at DC CPs according to Table 3. If the occupation of the DC CPs is not allowed for the entire parking time due to the idle time limitation, the CPs are occupied after the parking process. For this purpose, a queuing model is applied in which the BEVs that want to charge at a DC CP accept a maximum waiting time of 30 min if the CP is not available immediately after the parking process is completed. The occupation of the CPs after completion of the actual parking process is only taken into account for DC CI.
2.7. Charging Behavior
In the final step of the flowchart in Figure 1, the CEs are performed at the level of individual PEVs. The CEs are simulated using the so-called IU charging method as described in [5,27]. Utilizing this method allows for the characteristic charging behavior of PEVs with decreasing charging power at high SOC of the vehicle battery to be taken into account. The IU charging method distinguishes two phases in the CEs. In the I-phase, the lithium-ion cells are charged with a constant current, while in the U-Phase, the cells are charged with a constant voltage. In addition, in the simulation of CEs, the charging power is limited at three levels. First, at the vehicle level, the power is limited by the nominal power of the specific PEV model or by the power limitation of the IU charging process depending on the current SOC of the vehicle battery. Second, at the CS level, the power is limited by the available grid connection power and the power demand of the individual CPs. This limitation is relevant for CS of type AC18x7kW, since the grid connection power in this case is undersized with 36 kW and not all CPs can be supplied simultaneously with the nominal charging power of 7 kW. The third limitation originates from the available connected power of the entire P & R facility to the local power grid. After consultation with P + R Park and Ride GmbH München, the simulated facility was considered with a connected power of 198 kW to the local power grid. In addition, the time-dependent power demand for different P & R facilities was provided and considered in the study. Thus, the power consumption of the facilities is about 20 kW on average, resulting in about 180 kW available for the CI in the facility. If the power demand by the CI exceeds the available connection power, a reduction in the charging power takes place according to the logic of a dynamic load management in order to prevent the overload of the connection point at the local distribution grid. This power adjustment is especially relevant when a larger number of CSs is simulated.
3. Results
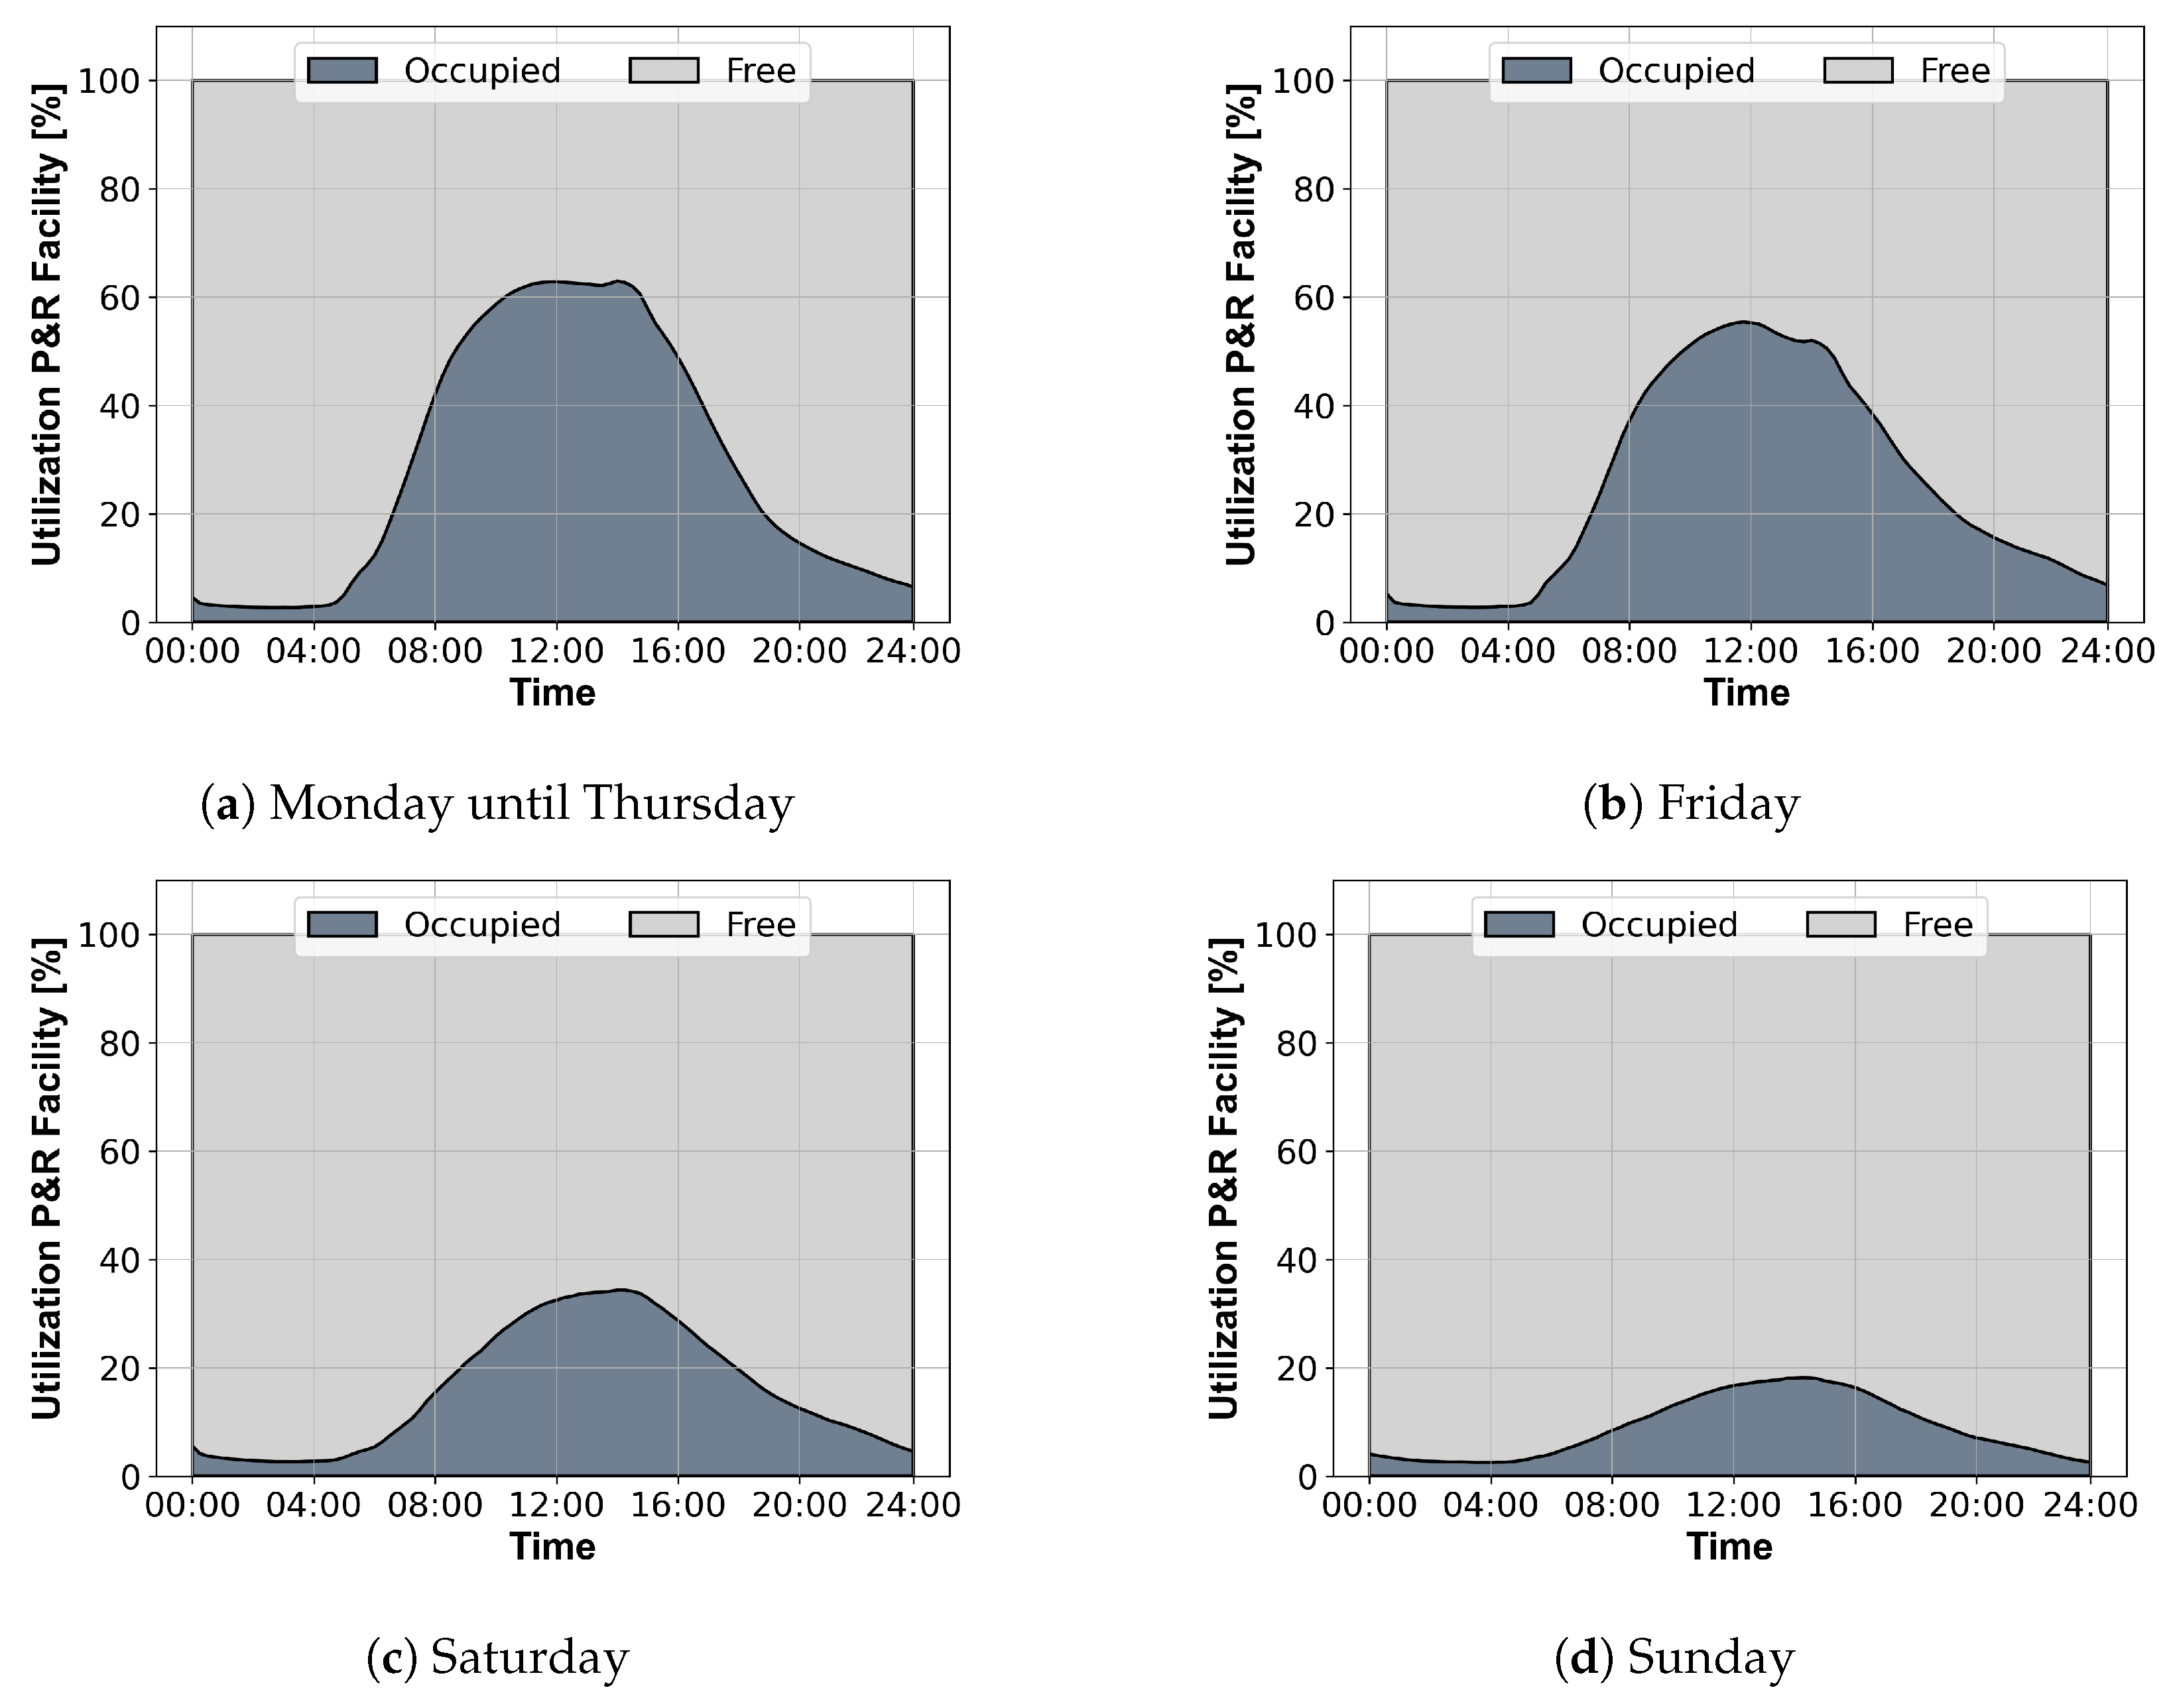
In this section, the results of the study are presented. Since probability distributions are used in the methodology to define usage and demand behavior at CSs, the results exhibit a certain amount of variance. The following results represent the average value from ten simulation runs for each CS type and scenario. In the first step, the general utilization of the simulated P & R facility is presented. Figure 9 shows the utilization of the facility for different days of the week. The diagrams show that the occupancy of the facility with vehicles is strongly dependent on the respective weekday and the time of day. The occupancy starts increasing in the morning hours and decreases until the night time.
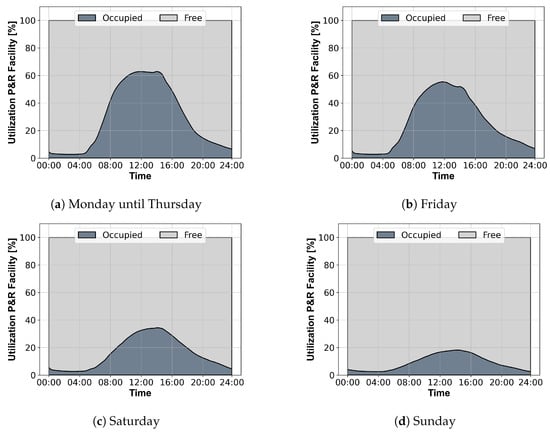
Figure 9.
Utilization of the Park and Ride facility on different types of days.
3.1. Charger Occupation
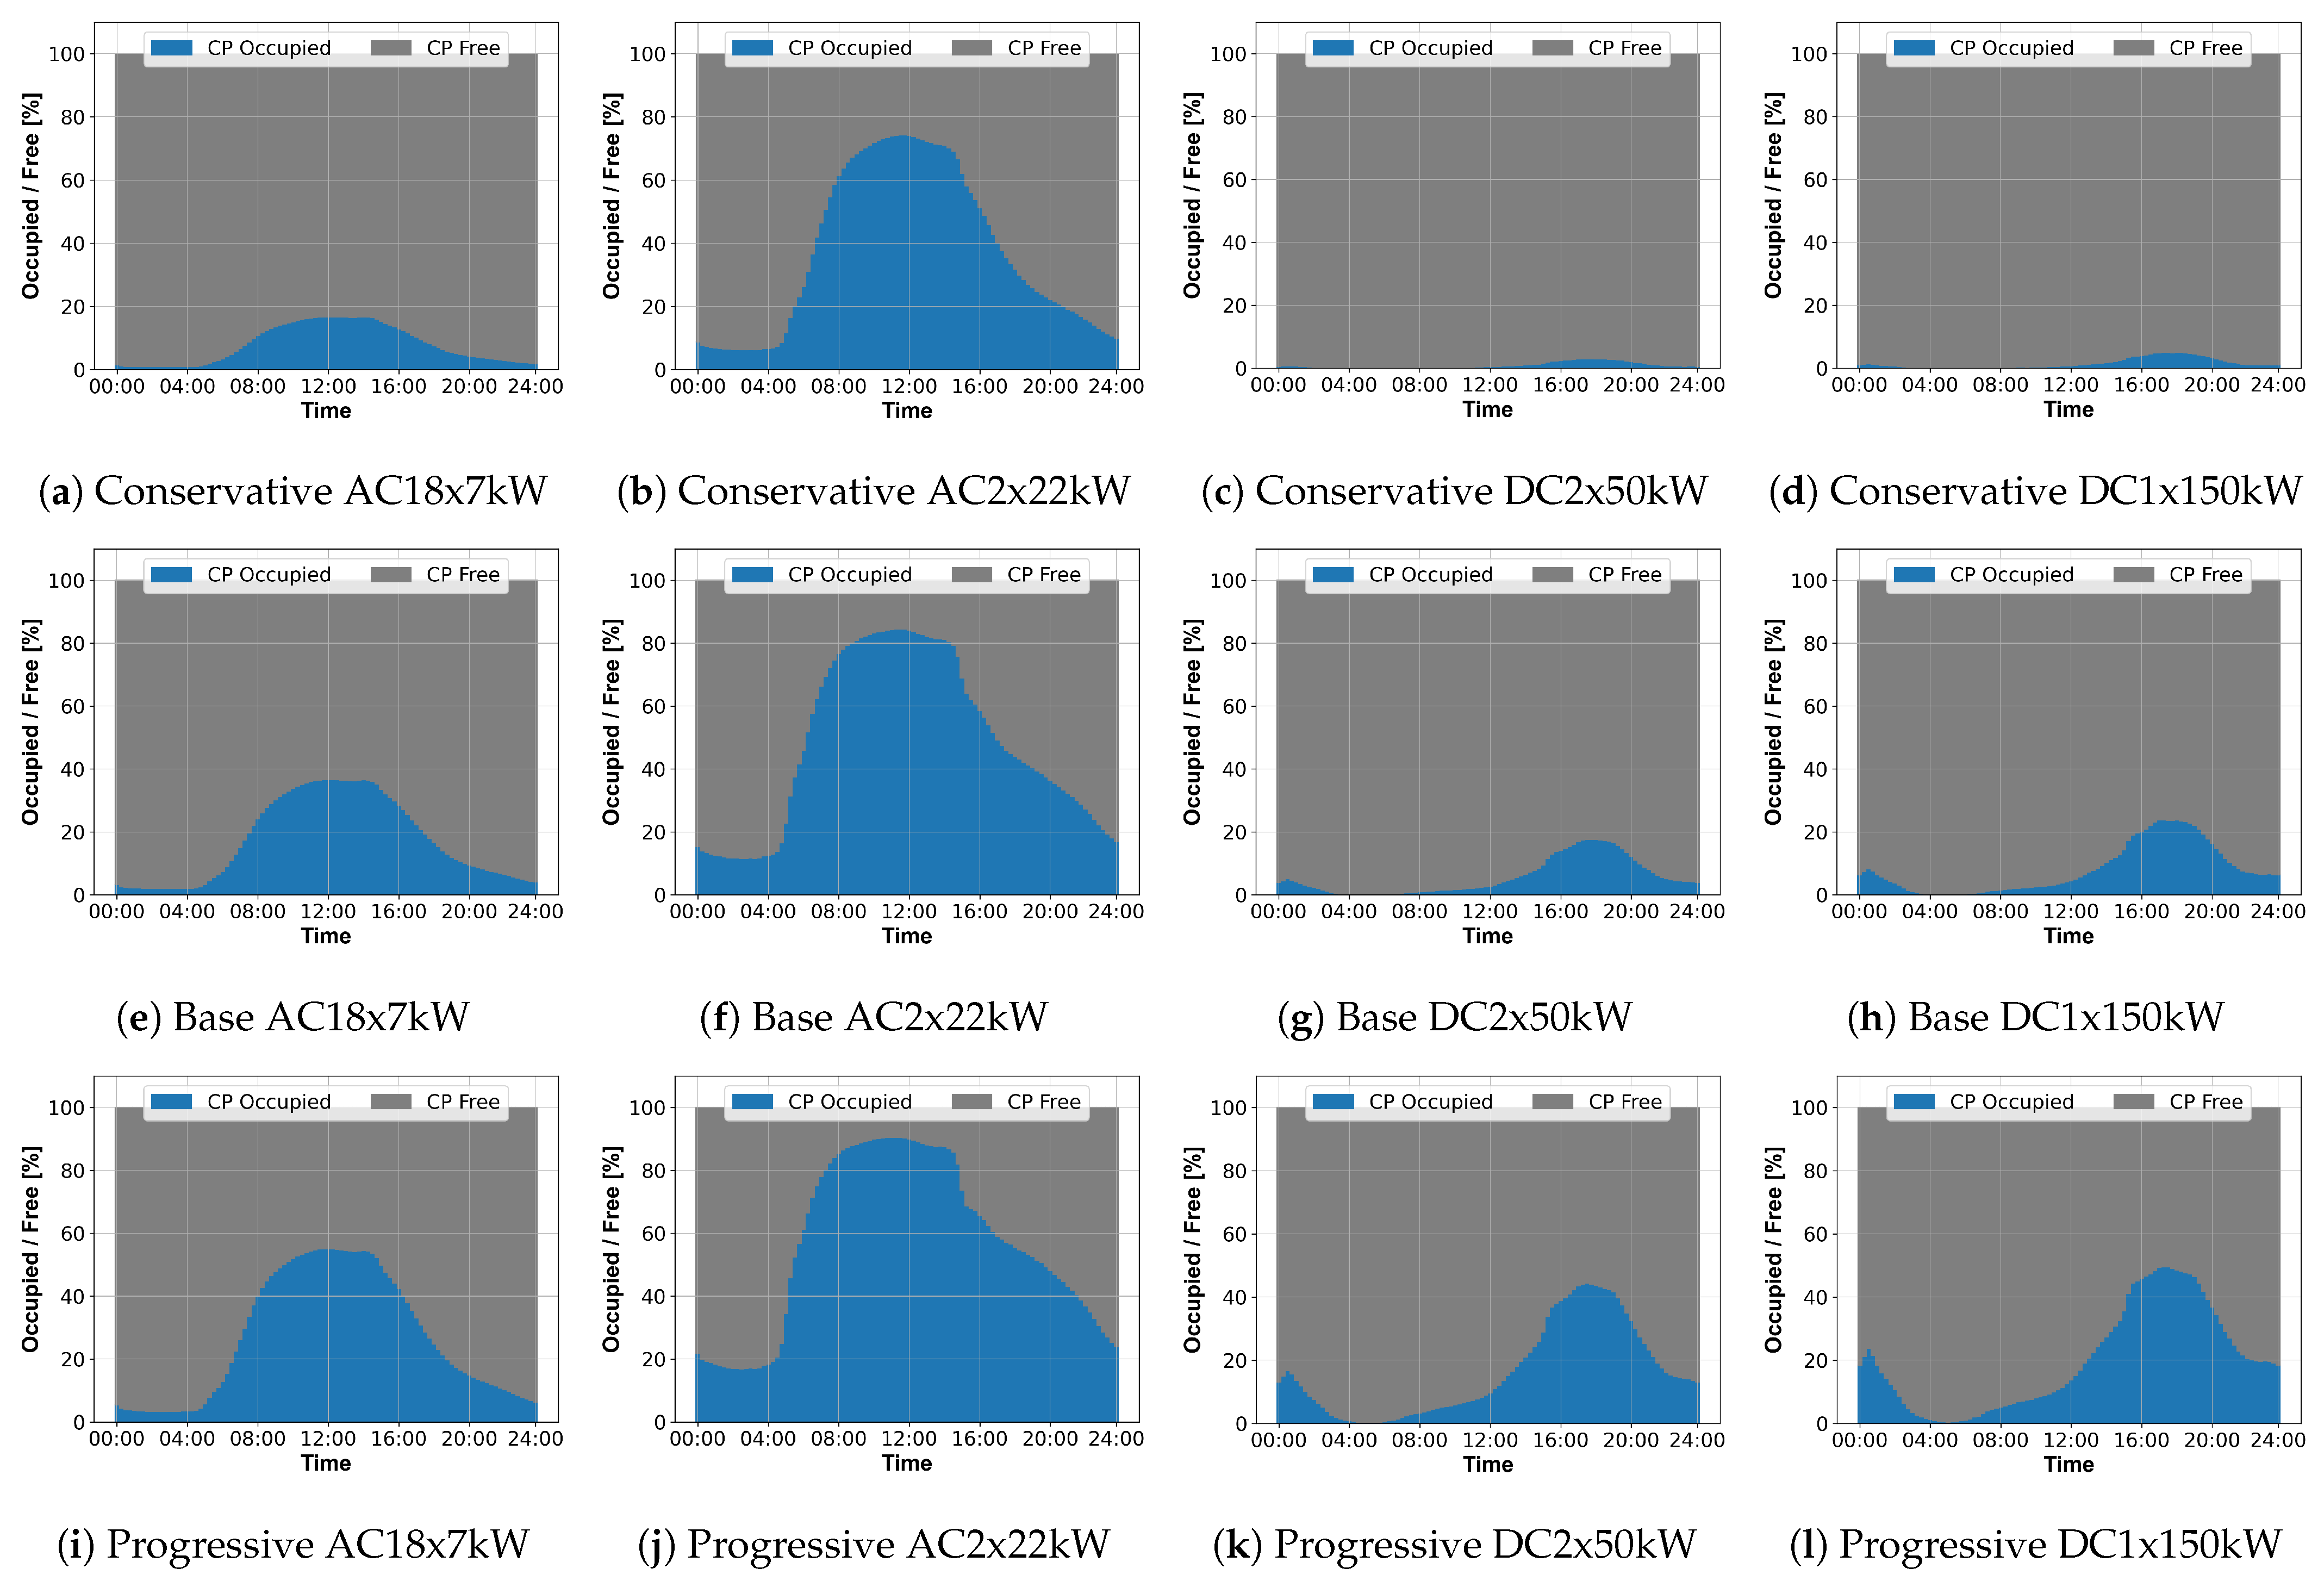
The occupation rate for CPs of the different CCs for the utilized scenarios are depicted in Figure 10. According to the occupation logic, the simulated AC and DC CI have contrasting occupation patterns. AC CSs were mostly occupied during the day. In this case, the average peak time occupancy was 74%, 85%, and 91% for AC2x22kW in each scenario. For AC18x7kW, peak utilization was significantly lower at 17%, 37%, and 55%, respectively, which can be attributed to the higher number of CPs. It is interesting to note here that AC2x22kW already has high-time utilization in the conservative scenario, and the increase from the base scenario to the progressive scenario is relatively small. This suggests that the AC2x22kW approach already tends to produce a high temporal utilization at low penetration rates, due to long occupancy times by PEVs. According to the occupancy logic for DC CEs defined in Section 2.6, the DC CSs were mostly occupied after the actual parking process was completed. The peak time utilization was much lower compared to the AC CI with 3%, 18%, and 44% for DC2x50kW and 5%, 24%, and 50% for DC1x150kW, respectively.
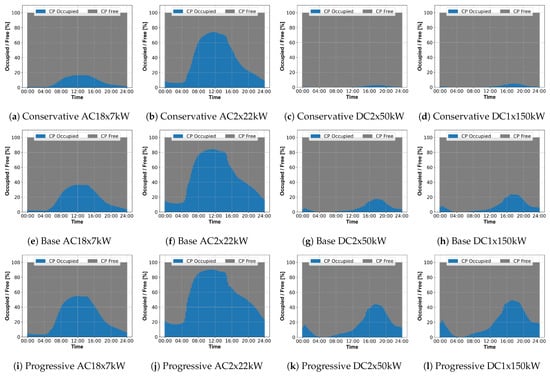
Figure 10.
Occupation of the charging points of different charging concepts for the defined scenarios.
3.2. Charging Behavior
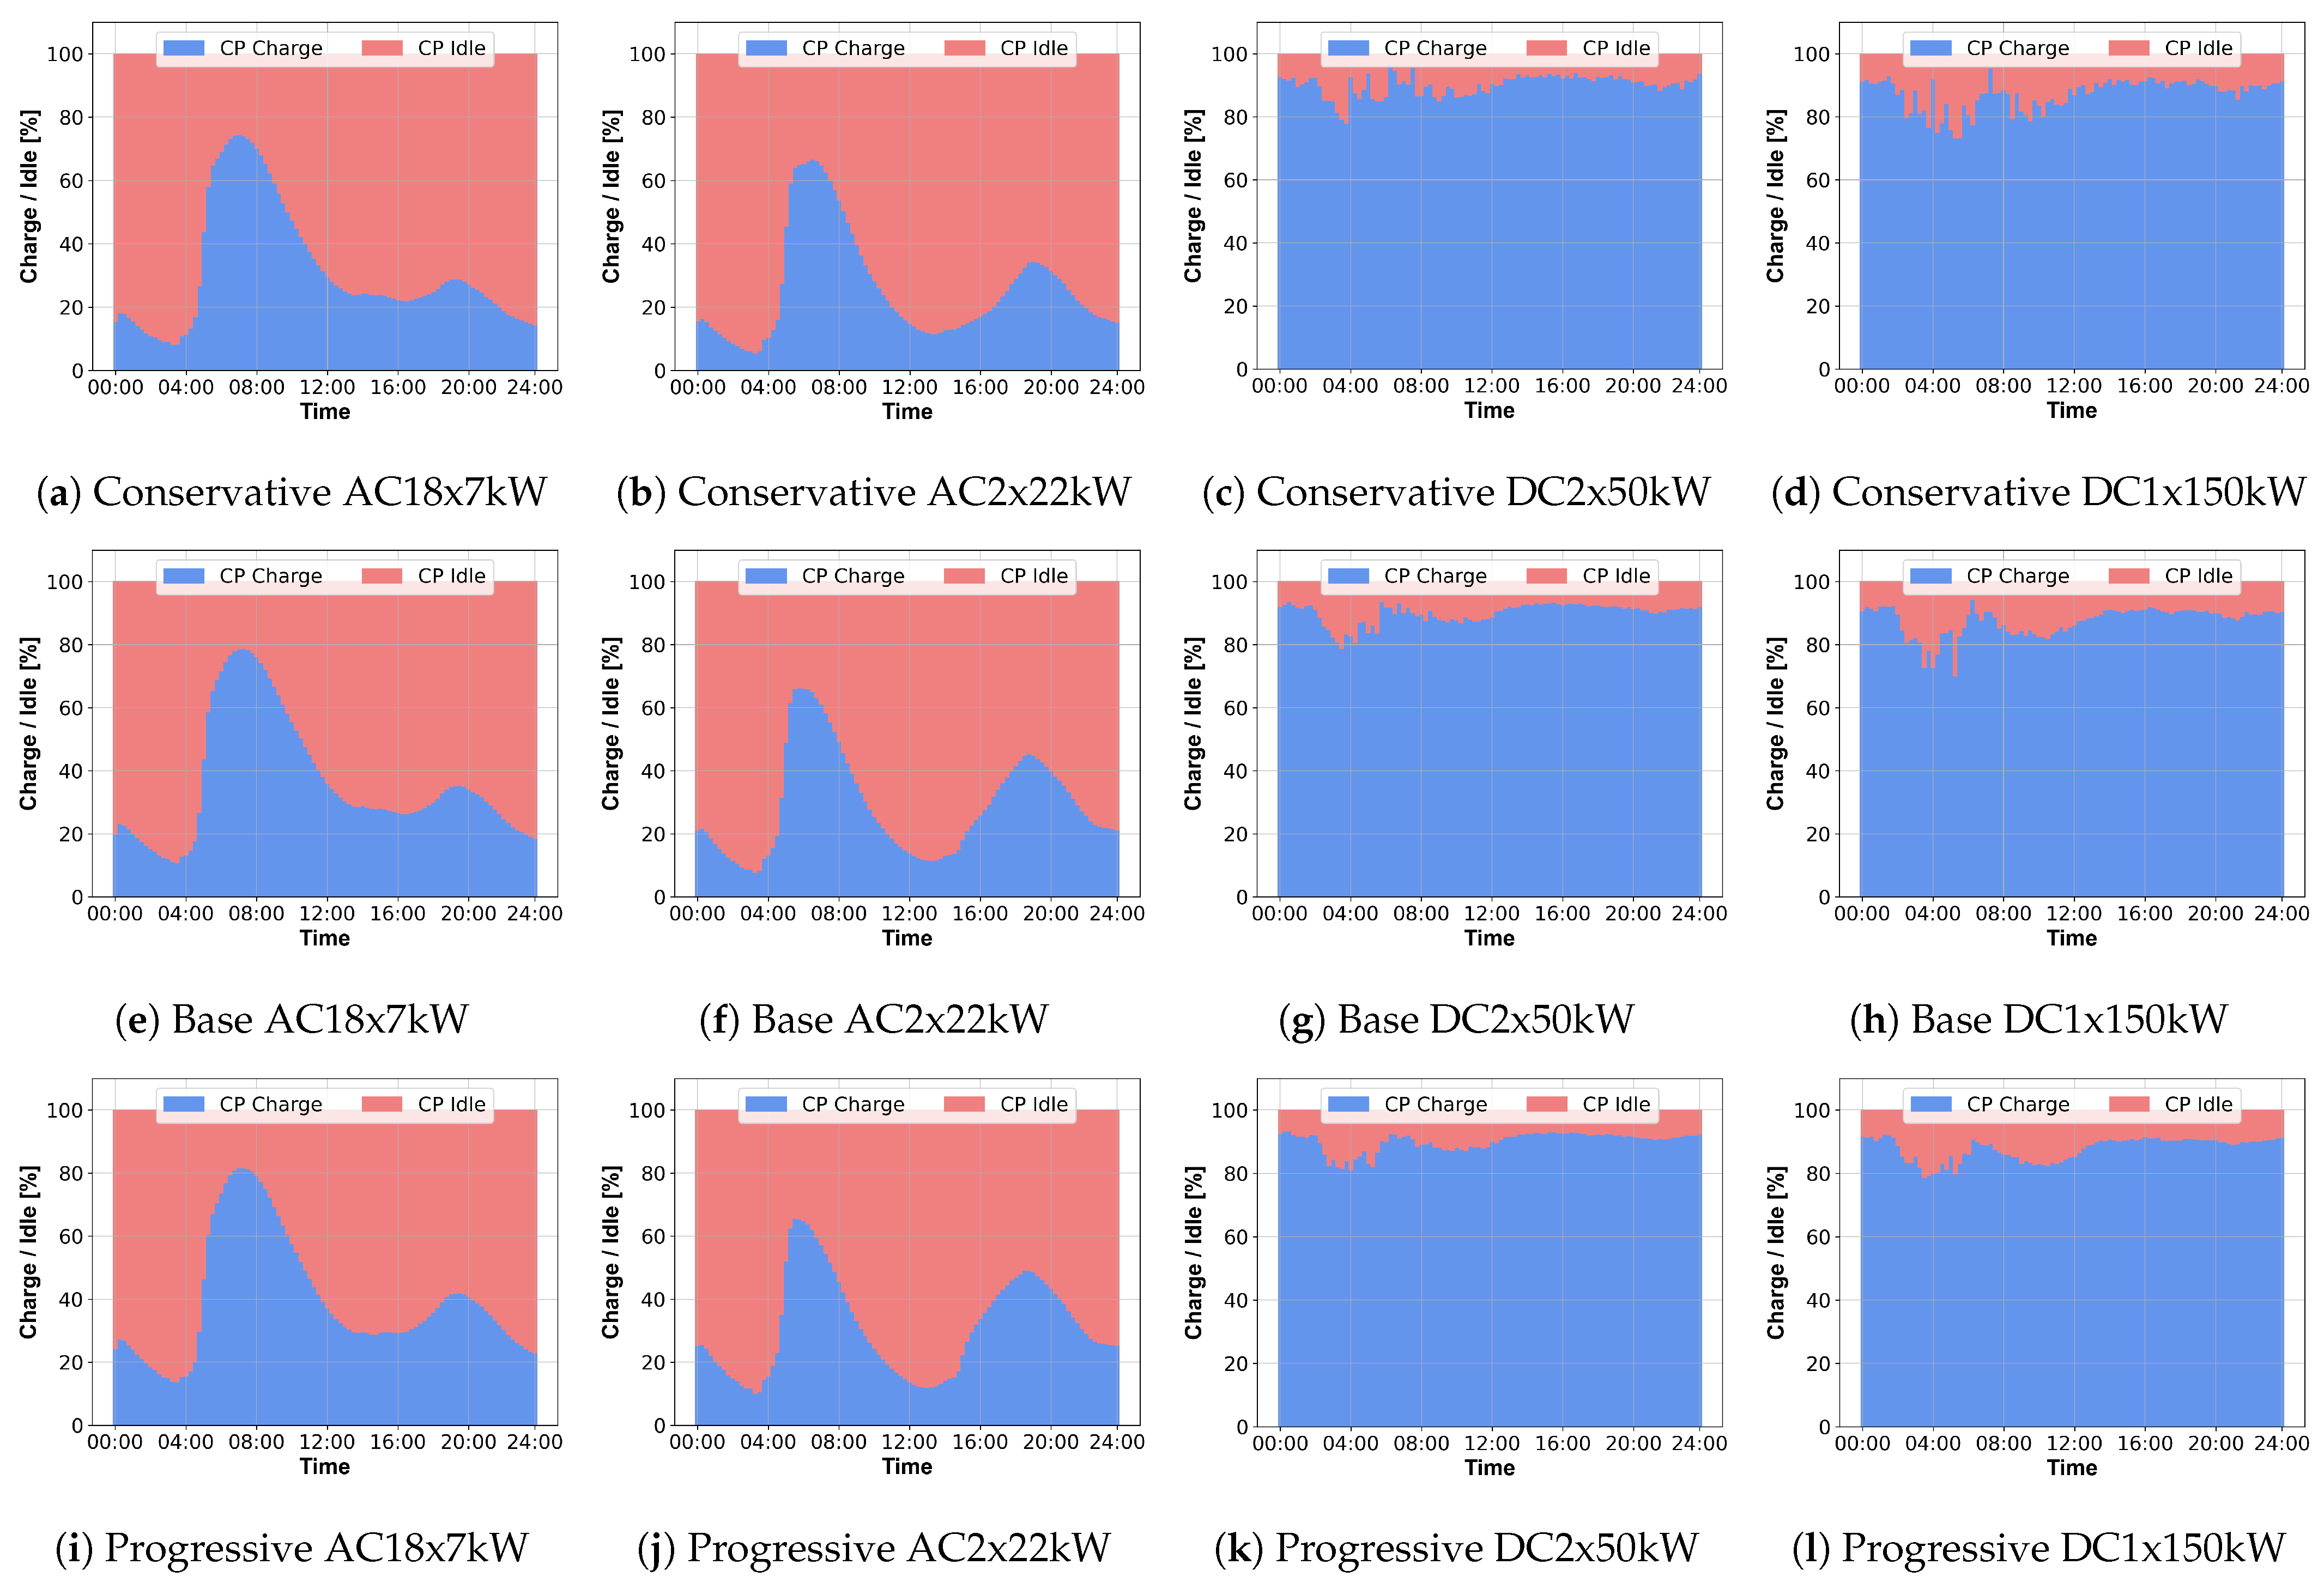
The developed methodology also makes it possible to look at the temporal utilization in more detail. For this purpose, the temporal shares of connection time are considered separately. Figure 11 shows the time distribution of charging time and idle connection time. As with the temporal utilization, the results are presented row by row for the individual scenarios. The AC CI shows a high proportion of idle connection time in all scenarios and all CS types investigated. Here, two peaks in charging time during the day, in the morning around 7 a.m. and in the evening around 7 p.m., are noticeable. This results from the occupancy behavior of the AC CPs during the entire parking period, with a CE starting in the morning and another CE starting in the afternoon or evening. Accordingly, the share of idle connection time increases during midday until the vehicles leave the CPs, and thus, become accessible to other PEVs. From this second occupation follows the second peak of charging time in the afternoon and evening. The share of charging time is about 30 to 70% in the case of AC2x22kW and about 40 to 60% in the case of AC18x7kW in all scenarios. The relatively constant distribution in the case of AC18x7kW suggests that there is no massive power-related bottlenecks at the CS level despite the smaller size of the connecting line with 36 kW for 18 CPs. This is also shown in the later evaluation, where the energy requested by the PEVs is compared with the actual amount of energy transmitted. According to the occupation logic, the DC CI under investigation shows a significantly lower share of idle connection time. The share of charging time is about 90% for both DC2x50kW and DC1x150, where the share of idle connection time is compensated with the considered blocking fee of 0.50 EUR/min and serves as an additional source of revenue for the CPOs.
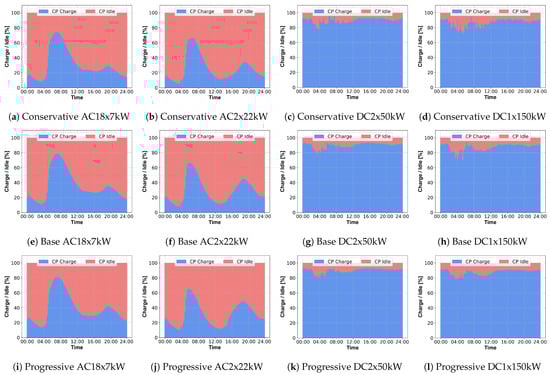
Figure 11.
Charging and idle time of the charging concepts for the defined scenarios.
3.3. Energy Transmission
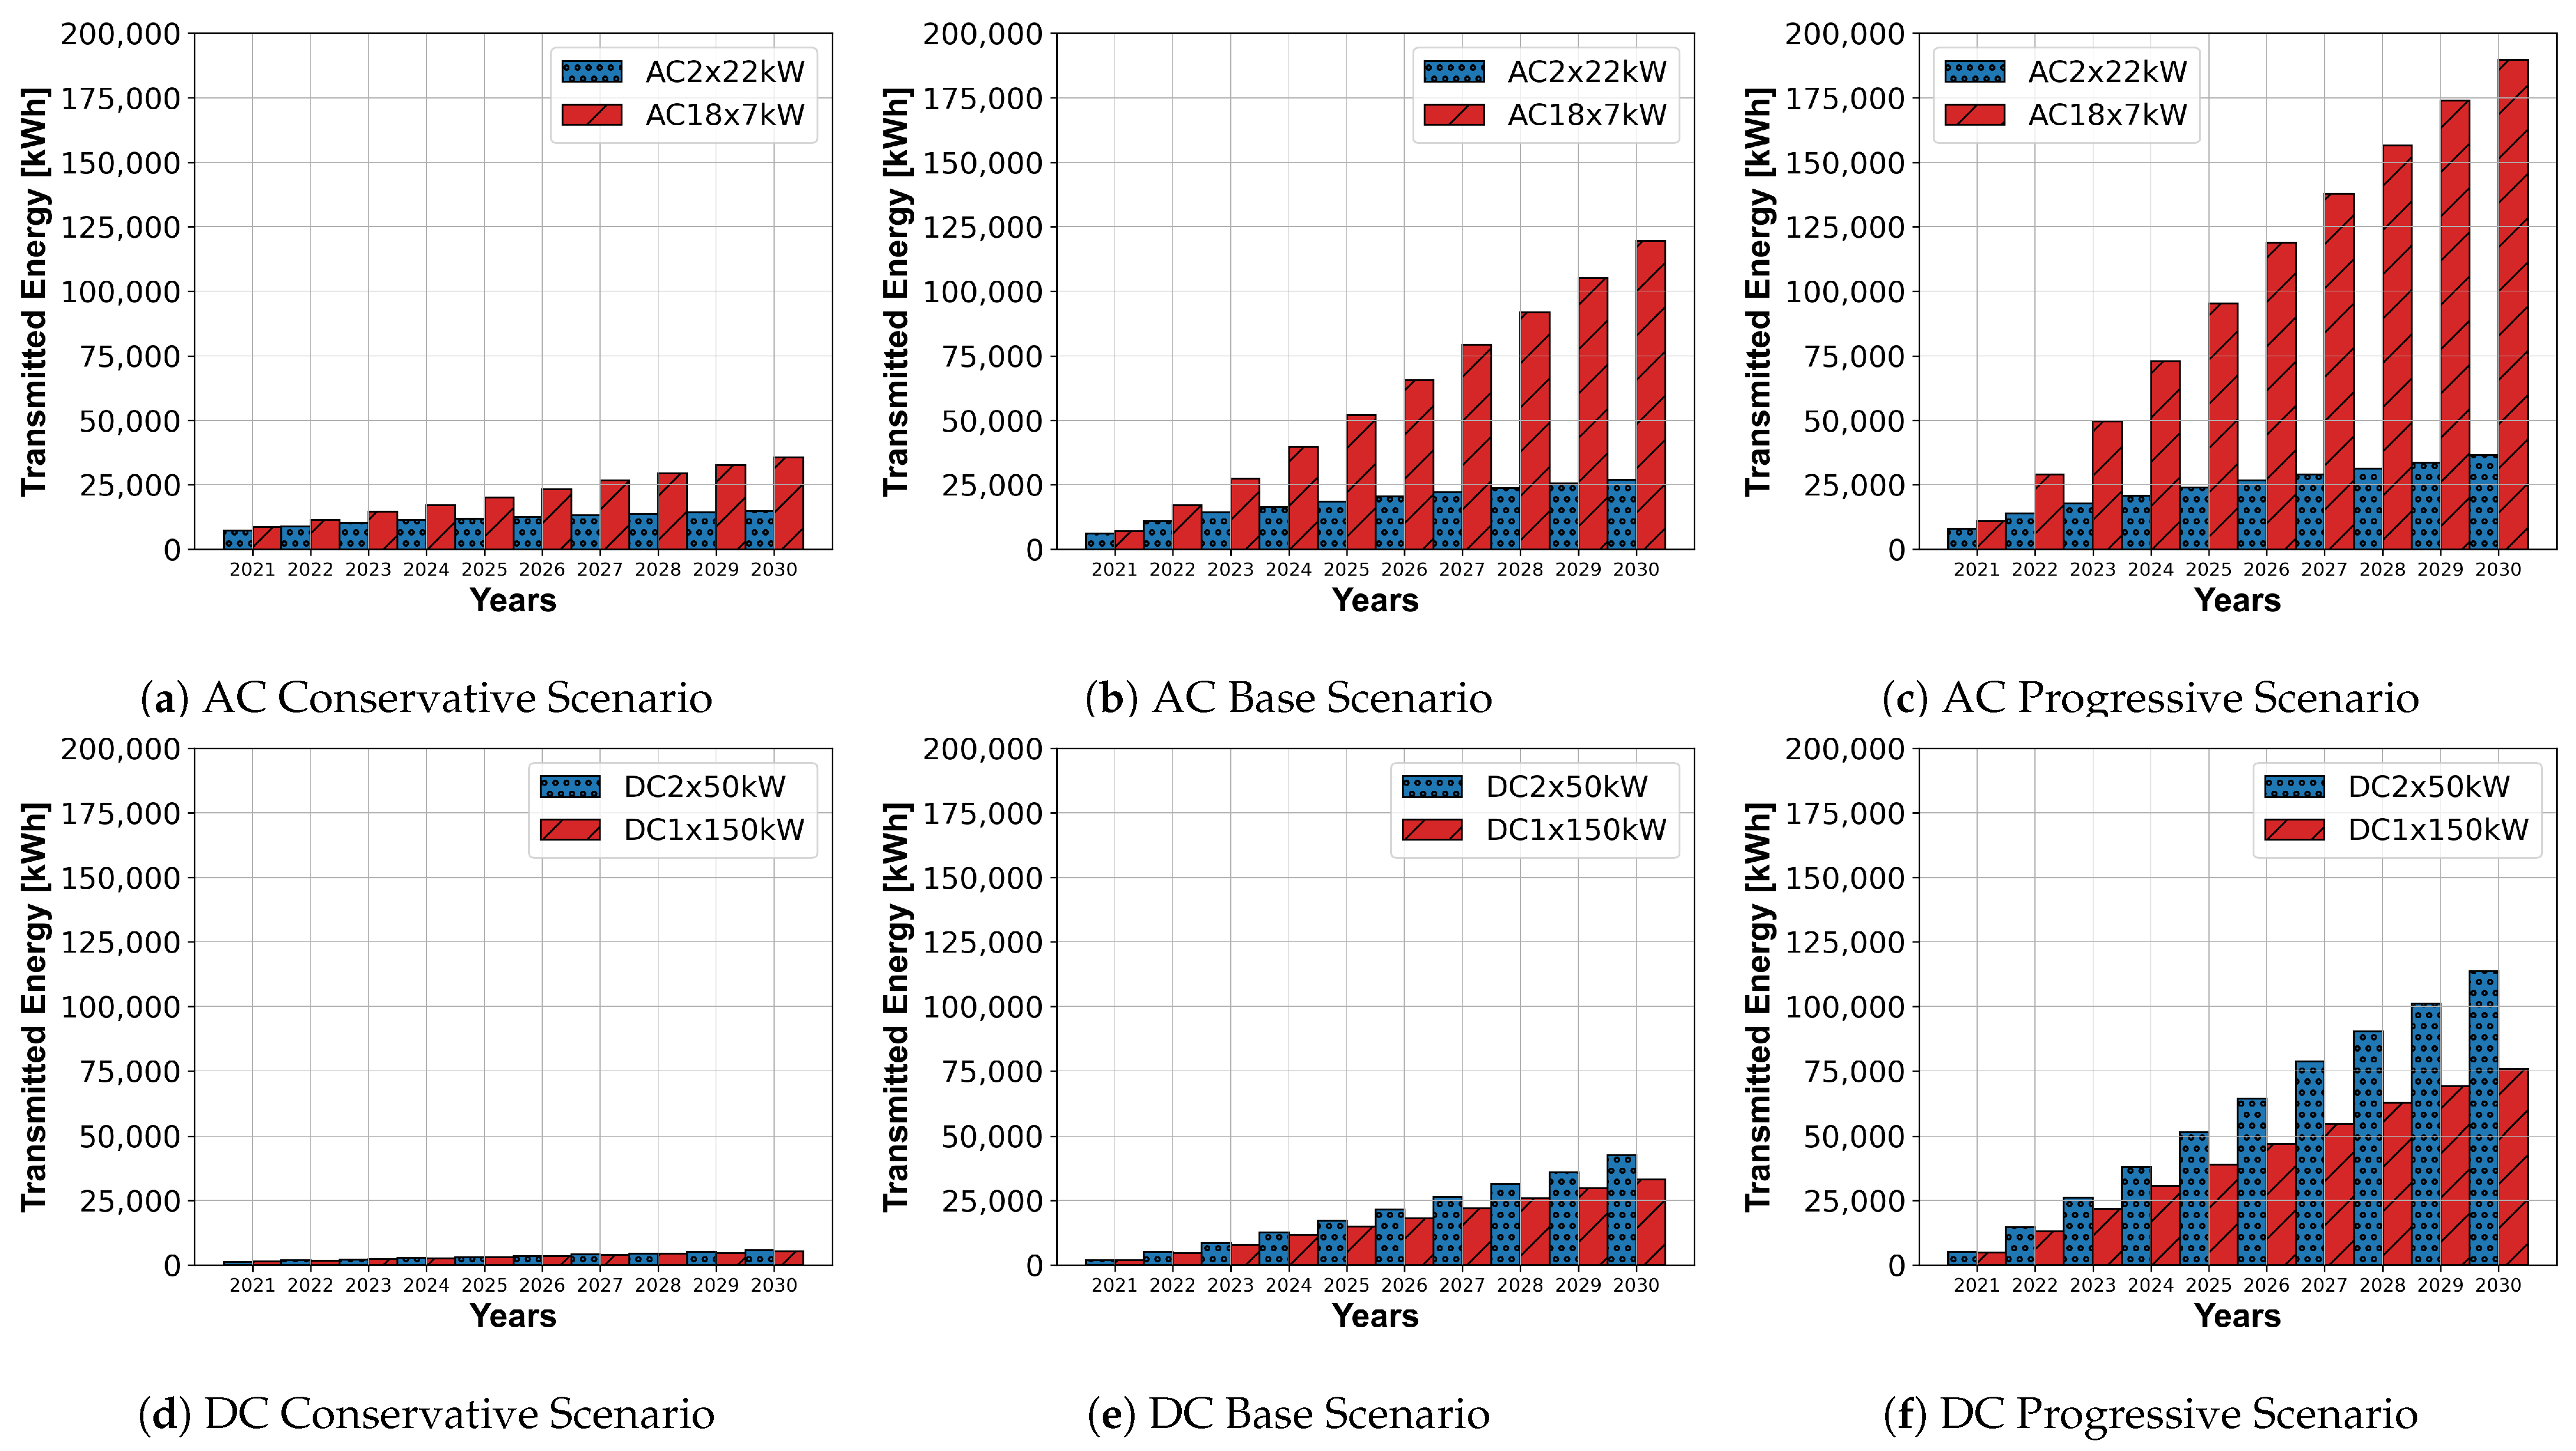
Figure 12 shows the amount of energy transferred for the CS types studied. For AC2x22kW, the results in Figure 12a–c show the maximum amount of energy that can be transferred is in the range of 15,000 to 36,000 kWh depending on the scenario considered. The low growth rate in the progressive scenario for AC2x22kW compared to the baseline is due to the high time utilization of this CS type. Thus, AC2x22kW is already 85% time-utilized in the baseline scenario and the value can only be marginally increased to 91% in the progressive scenario. Despite having a a lower connected power of 36 kW, AC18x7kW can transfer more energy by a factor of 2 to 5, with 35,000 to 190,000 kWh. In comparison, the growth rates for AC18x7kW are much higher. Here, too, a correlation between the temporal utilization and the transferable energy quantities is discernible, whereby the temporal utilization in the case of AC18x7kW is at a lower level of approximately 55% in the progressive scenario and, therefore, a potential for higher penetration rates of PEV can be assumed. In the case of the DC CSs considered, the maximum transmitted energy quantities lie in the range between 5000 and 110,000 kWh for DC2x50kW and between 5000 and 75,000 kWh for DC1x150kW, depending on the scenario considered. Compared to the evaluated AC CSs, the DC CSs thus have much lower energy quantities, especially in the conservative scenario, with a maximum of about 5000 kWh. This is due to the low growth rates of PEV in the conservative scenario on the one hand, and the low share of BEV of 40% according to the defined PEV scenario in Section 2.3 on the other. It is interesting to note that DC1x150kW cannot transmit more energy than DC2x50kW in any scenario.
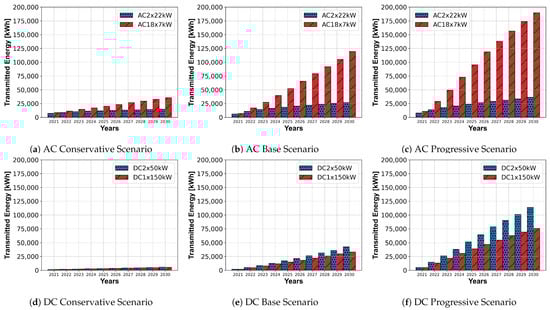
Figure 12.
Transmitted energy for the investigated charging concepts.
The comparison of the transferable energy quantities shows the high influence of the available number of CPs. Thus, AC18x7kW or DC2x50kW can transmit significantly higher amounts of energy in all scenarios. However, focusing solely on the amount of energy transferred is insufficient in this case, since the extent to which the desired energy demand on the vehicle side can be met with the lower charging power must also be taken into account. Otherwise, the amount of energy which can be transferred could be increased almost arbitrarily by increasing the number of CPs, and the CS types could thus be optimized from the CPO’s point of view. For this purpose, the Charging Completion Rate (CCR) was defined as an additional KPI in Equation (3), which takes into account the customer-side view.
In the CCR, the originally demanded energy quantity , which has been determined from the CDR according to the conditional probability distributions shown in Figure 7, is put into relation with the actually transferred energy quantity . According to the defined methodology for determining energy demand and PEV models in Section 2.5, the deviation between and can result exclusively from power limitations of the considered CI. This is only the case for AC18x7kW, as the other CSs have a charging power greater than or equal to the data based on CDRs. It is noteworthy here that despite the undersized connected power of the CS as well as the significantly lower power of 7 kW, the CCR for AC18x7kW is approximately 95% across all scenarios. This means that despite the significantly lower power of 7 kW per CP, about 95% of the demanded energy can be met. This result is consistent with the results from Figure 11, which shows that despite the high penetration rate of PEV in the progressive scenario, the maximum share of charging time is only about 80% for AC18x7kW. Too low charging power would lead to the share of charging power tending towards 100%. Figure A1 shows the CCR for all scenarios for the AC CSs evaluated. A plot of the CCR for the DC CSs evaluated has been omitted since DC2x50kW and DC1x150kW are two approaches that have been evaluated where the charging power of the CPs is greater than or equal to the CDR used. The CCR for these approaches is, thus, always 100%.
3.4. Economic Results
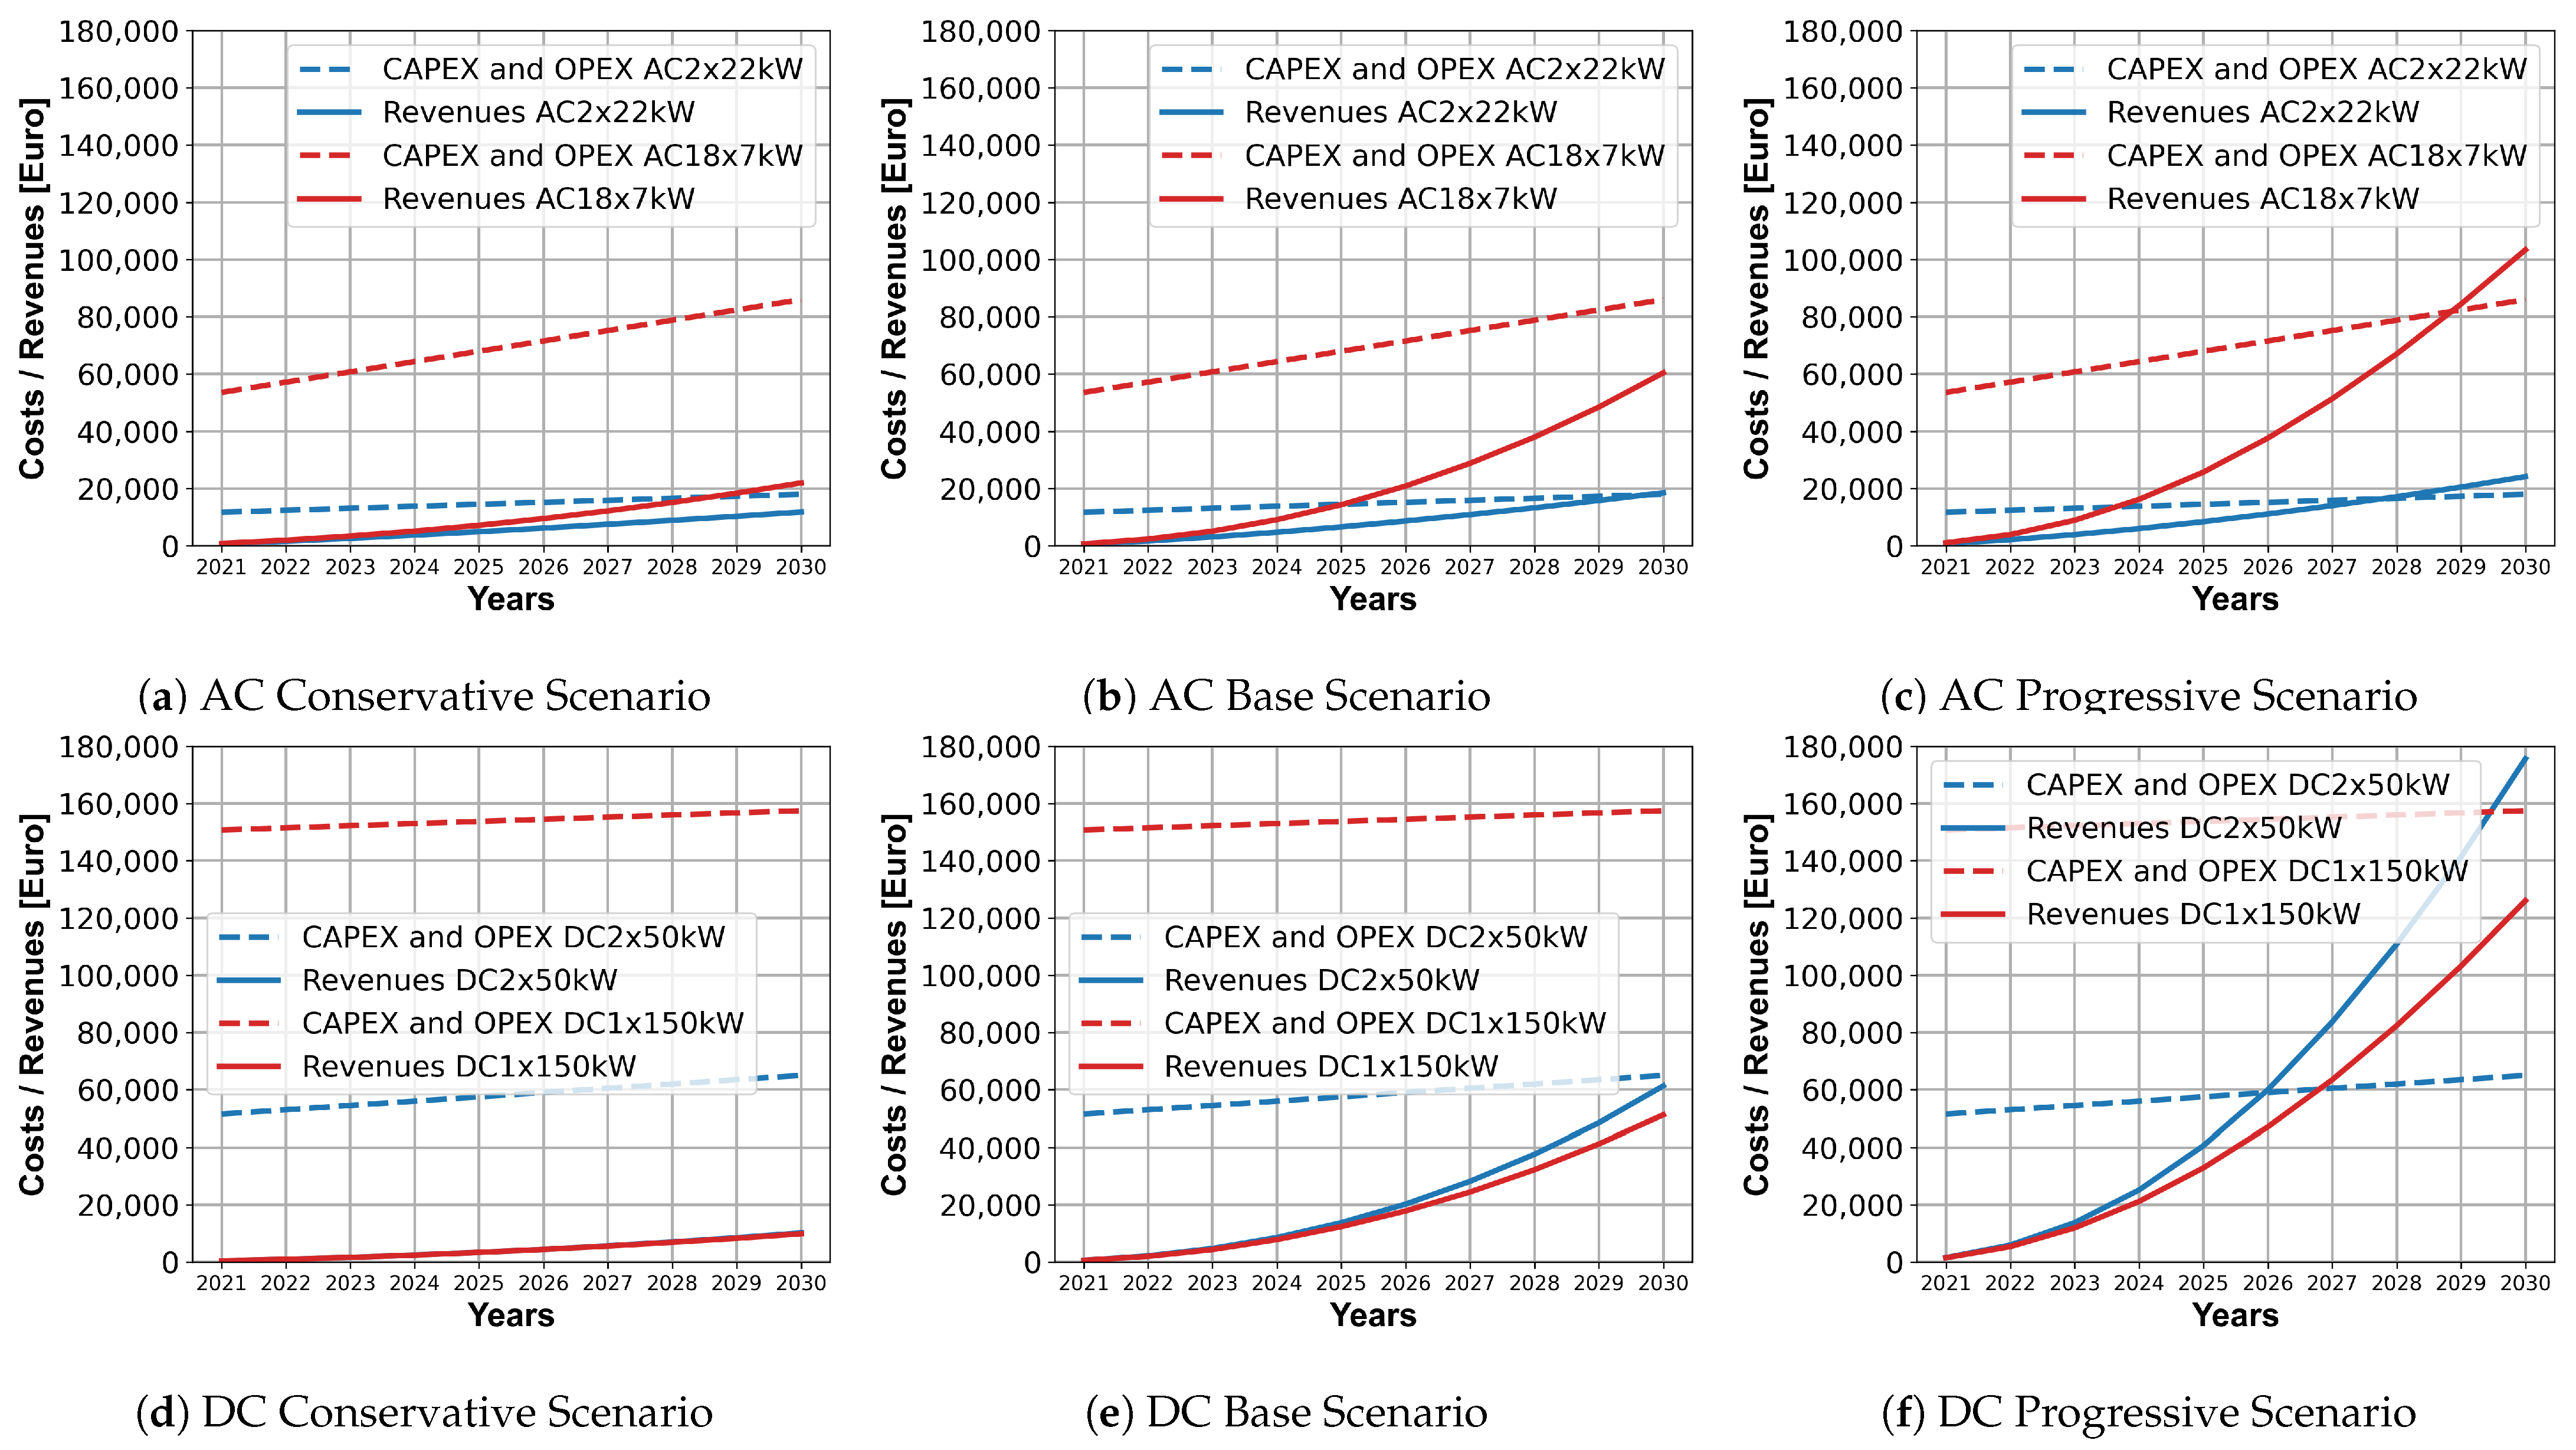
The presented methodology enables the recording of all energy and payment flows. In addition to the technological results listed, economic evaluations can, thus, also be carried out. In Figure 13, the one-time CAPEX and ongoing OPEX are compared with the revenues of the CSs. The intersection of the cost and revenue functions indicates the break-even point of the respective CSs.
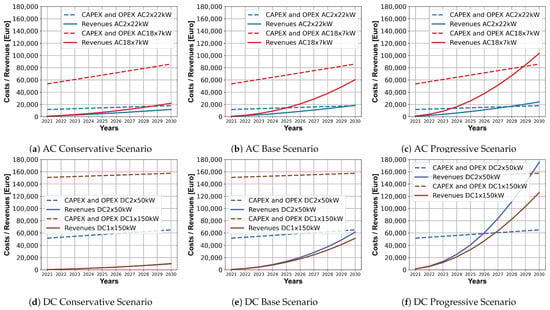
Figure 13.
Economic result for the investigated charging concepts.
The results show that during the evaluation period of 10 years, no economical operation was possible for the AC and DC CSs investigated in the conservative scenario. In contrast, AC2x22kW and DC2x50kW could be operated economically in the defined basic scenario and all CSs except DC1x150kW could be operated economically in the progressive scenario. For CS AC2x22kW, the results from the time utilization and the transferable energy quantities are also reflected in the economic results. Revenues can only be improved slightly for the progressive scenario compared to the baseline scenario. The results from CS AC2x22kW show that even with moderate PEV penetration, the CS is already at capacity and cannot benefit from increasing growth rates. In the progressive scenario, both AC2x22kW and AC18x7kW show a positive economic result, but with about 17,000 EUR, the AC18x7kW generates 180% more profit compared to the profit of about 6000 EUR of AC2x22kW. This inevitably raises the question of how AC2x22kW compares to AC18x7kW when both approaches are evaluated with the same number of CPs in the progressive scenario. For this purpose, the economic result of nine AC2x22kW CSs was compared with the result of one AC18x7kW CS. The CAPEX and OPEX were scaled according to the economic parameters in Table 3 for AC2x22kW. The evaluation shows that for the same number of CSs, AC18x7kW has a 130% better economic result than AC2x22kW. The reason for this is mainly the cost advantage per CP for AC18x7kW, which is about 50% compared to AC2x22kW. In the DC CS comparison, DC1x150kW was not able to justify the higher CAPEX associated with building the high-power approach through higher revenues. In all scenarios, the economic result for DC2x50kW was better than that for DC1x150kW by a percentage range of 60% to 450%. Looking at the number of CEs in Figure A2, it is clear that DC1x150kW, with an average of 1,430 CEs in the progressive scenario, was able to realize 30% fewer CEs than DC2x50kW with 1,970 CEs. DC1x150kW could not supply more BEVs with energy compared to DC2x50kW, and consequently, could not recoup the higher CAPEX faster through revenue. As an additional evaluation, the number of CEs and the average amount of energy transferred per CE are shown in Figure A2 and Figure A3 for each CC.
The payment flows can also be used to derive a build-up strategy for the respective CSs. For this purpose, the number of simulated CSs is scaled and the individual CSs are successively occupied with PEVs. The resulting revenue can be used to derive the timing for the construction or expansion of the CI. For this purpose, a CS is always added if the annual OPEX of the additional station can be covered by the revenues. In contrast to the evaluations in Figure 13, the CAPEX are, thus, not taken into account. Thus, a build-up strategy is assumed in which the CPOs put up a new CS at a location as soon as the operating costs can be covered, e.g., to strengthen the market position at a certain location or to make access more difficult for competitors. In the case of CS AC18x7kW, it is also possible to scale the CS in the range of 18 to 36 CPs in the scaling steps of 3 CPs. Therefore, based on Table 3, CAPEX and OPEX were considered as economic parameters. Figure 14 shows the results for the individual CSs and scenarios.
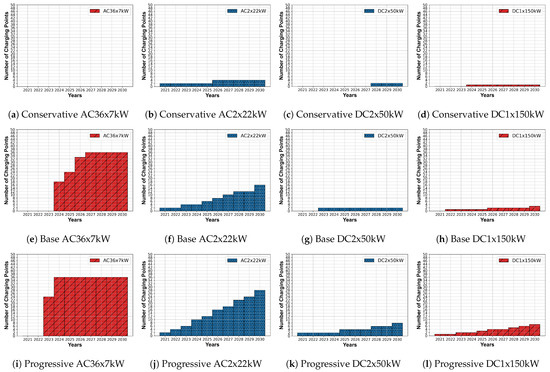
Figure 14.
Ramp up of the charging concepts for the defined scenarios.
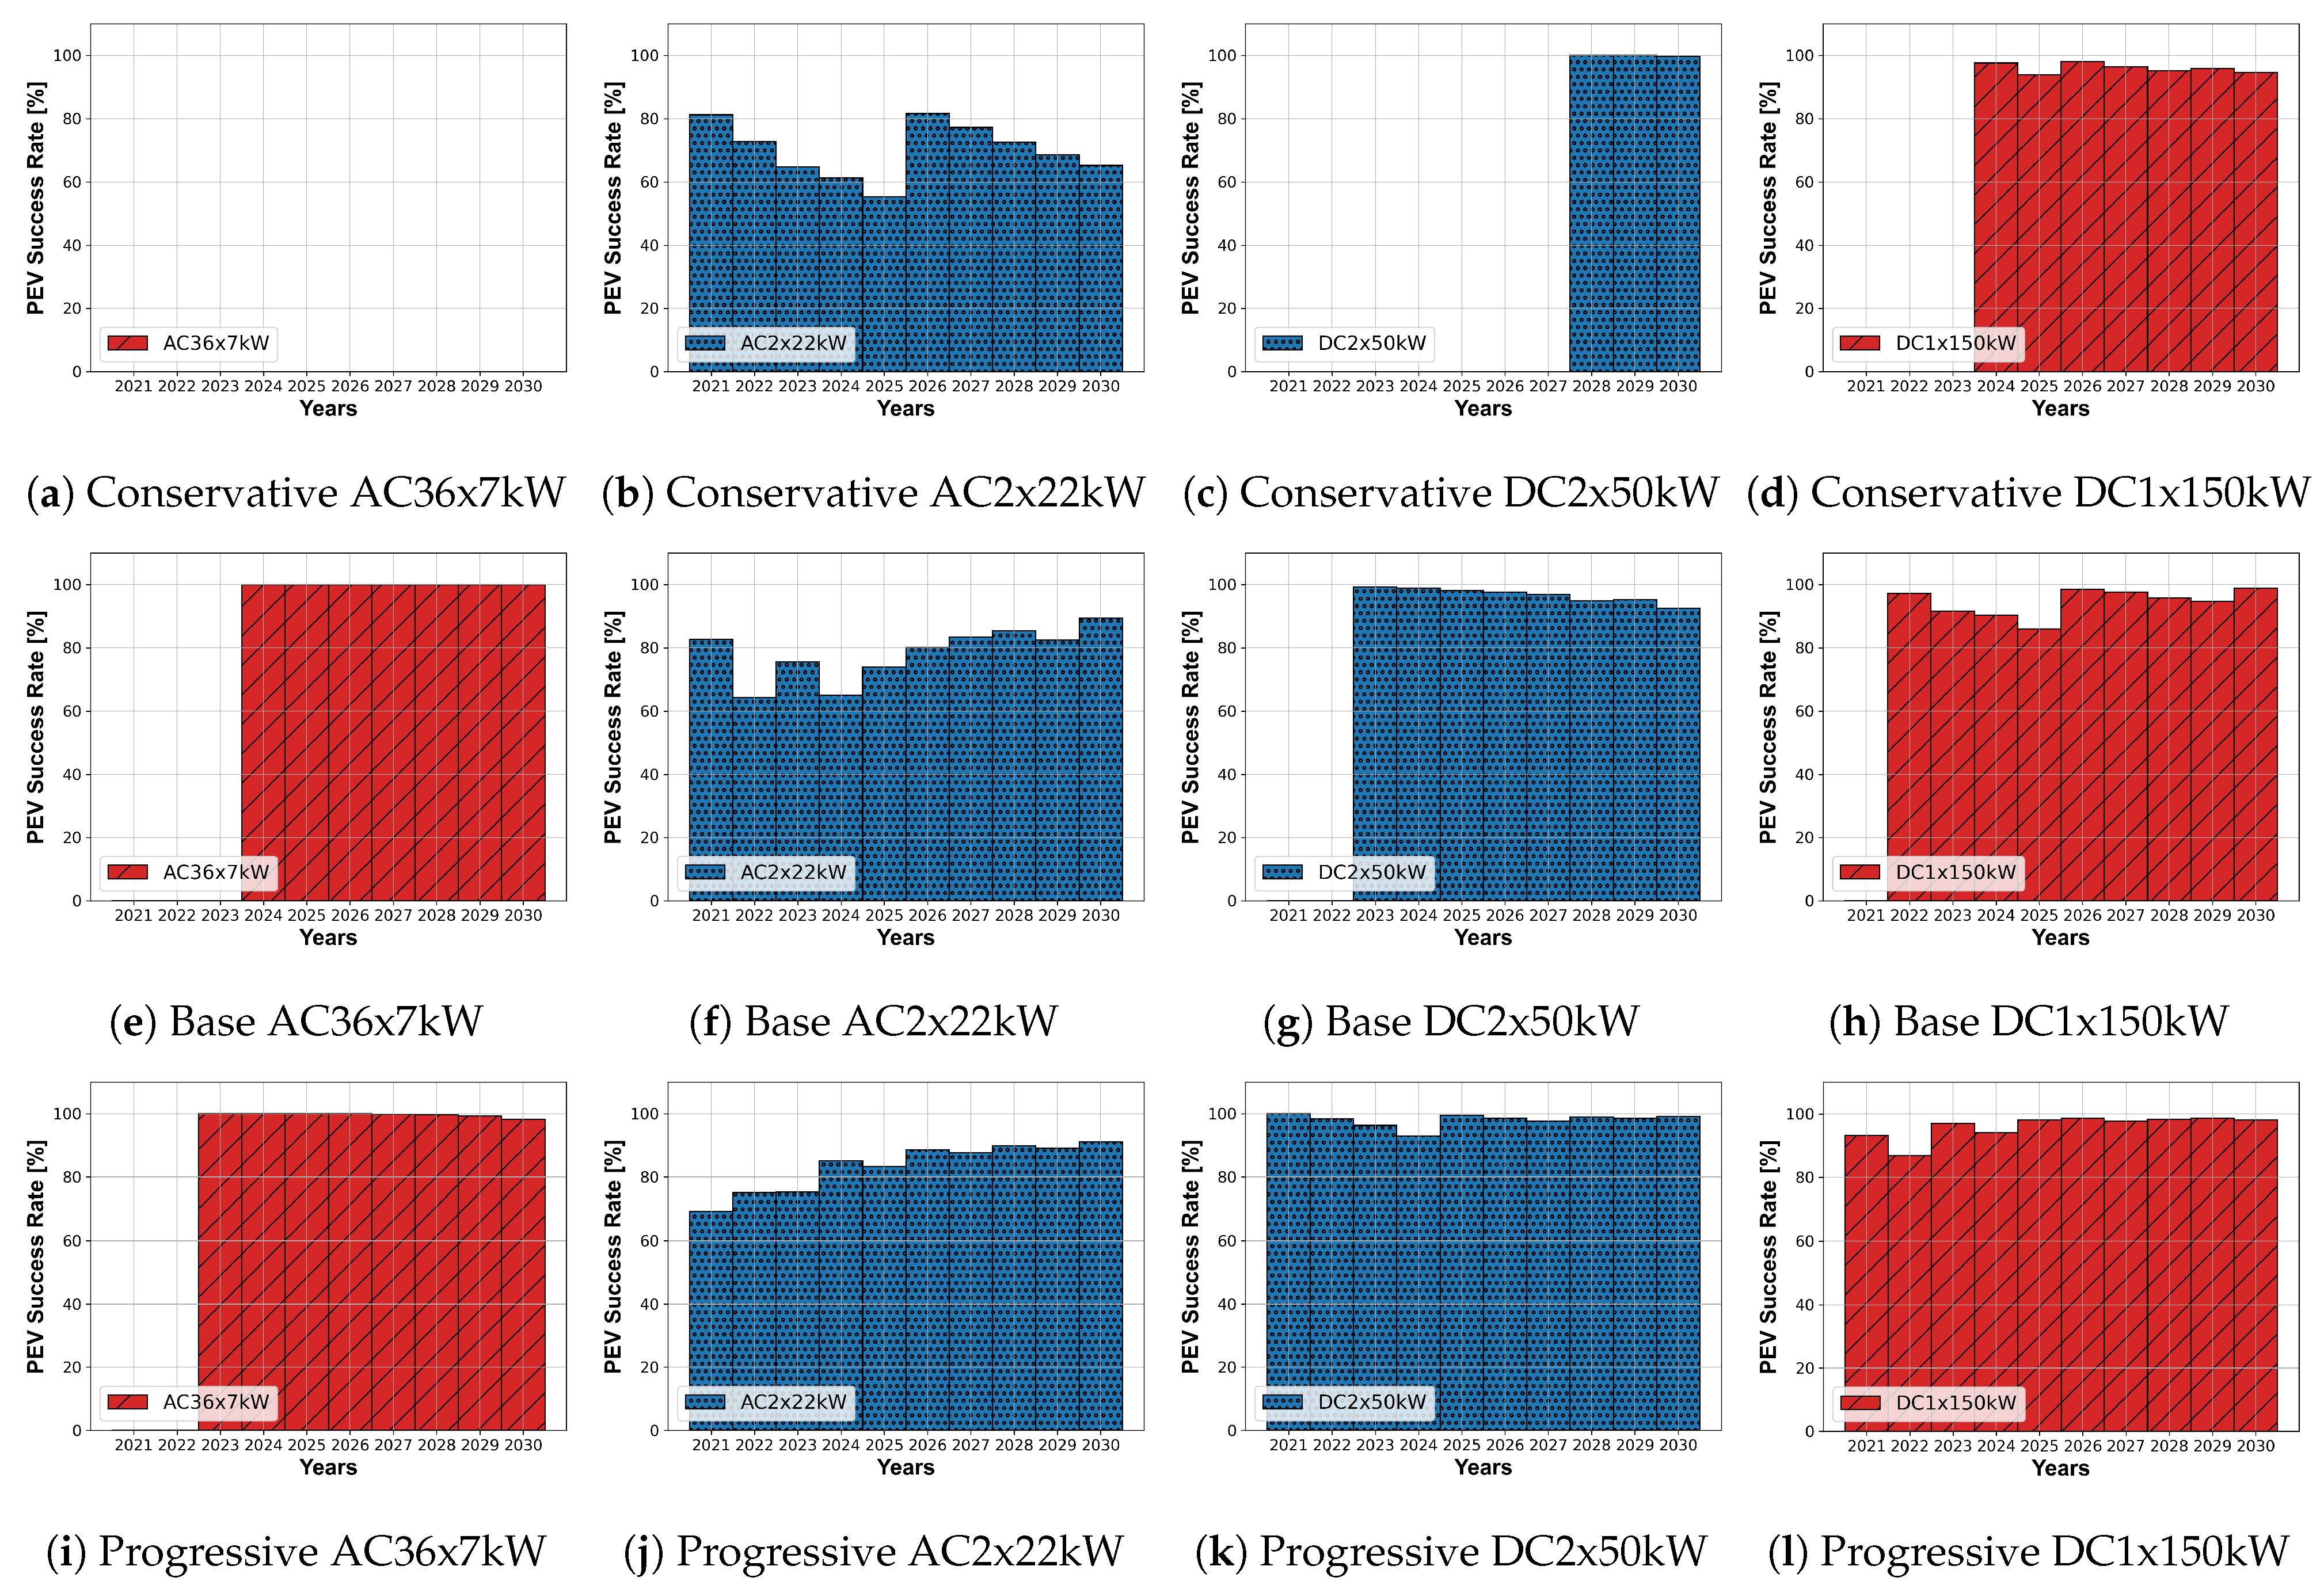
To enable a better comparability between the individual CSs, the scaling is given in the number of CPs. Due to the logic used, the results show a gradual increase in the number of CPs. The scaling of AC2x22kW is in the range of 2 to 28 CPs. For AC18x7kW, the special characteristic is represented by the fact that the scaling in the range between 18 and 36 CPs takes place in three steps according to Table 2. Since the maximum expansion stage with 36 CPs was simulated here, the term AC36x7kW is used in the diagrams. Since the CS has 18 CPs as the smallest expansion stage, the initial setup only takes place when OPEX of all CPs can be covered. It is worth mentioning that there is no OPEX recovery until 2024 in the baseline scenario and 2023 in the progressive scenario. Since OPEX cannot be covered in the entire conservative scenario, the model does not recommend any build-up here. For AC2x22kW, the OPEX can already be covered in the first year in all scenarios. According to the economic results, the construction and addition of the investigated DC CS is delayed compared to the investigated AC CS. DC2x50kW is scaled in the range of 2 to 8 CPs and DC1x150kW in the range of 1 to 7 CPs. In addition, it was determined what proportion of PEVs wanting to charge were actually able to occupy a free CP. Here, the number of CSs and CPs was defined according to the defined ramp-up strategy. Figure A4 shows the ratio as PEV success rate. The values fluctuate over the course of the year and are on average 100% for AC36x7kW, 80% for AC2x22kW, 97% for DC2x50kW, and 95% for DC1x150kW.
4. Discussion
The methodology presented is intended to improve the decision-making basis for the concrete selection and design of CCs in practical cases. For this purpose, the data listed in Section 2 are required. A comprehensive data set of approximately 780,000 public CEs from the metropolitan area of Munich in 2020 and 2021 served as the central data base for this study. The CEs were conducted at AC CSs with a power of 22 kW and DC CSs with a nominal power of 50 kW, which correspond to the AC2x22kW and DC2x50kW CSs evaluated in the study. If the charging power on the infrastructure side of the underlying CI is considered in relation to the possible power on the vehicle side according to Figure 8, it becomes clear that, in the case of the AC data set, the power on the CI side of 22 kW represents the maximum range of the possible AC charging power on the vehicle side. In the case of the DC data set, the charging power on the infrastructure side of 50 kW is in the lower range. In the case of AC charging, it allows the evaluation of CSs with a lower charging power and, thus, more cost-effective approaches such as AC18x7kW. In comparison, the DC CE data set has certain limitations in defining the usage behavior of DC high-power charging. This is one explanation for the fact that CS DC1x150kW performed comparatively poorly in the results. The comparison of the two sets of AC and DC CDR shows that a data set based on CSs with a broad power spectrum should be used when transferring the presented methodology.
Methodologically, an agent-based model was developed that allows different kinds of CSs to be evaluated technologically and economically. For this purpose, all CP occupations and CEs are simulated at the level of individual vehicles. The demand behavior of the PEVs is defined by probability distributions. The examined scenarios made it possible to narrow down probable result ranges and clarify the sensitivity of the parameters used. For example, the progressive scenario shows the high influence of BEV share in the PEV stock. The development of energy demand per CE according to Figure 6 and the defined KPIs for AC and DC CEs according to Table 5 and Table 6 need to be further investigated in the future to reflect changes in demand behavior, e.g., due to a growing share of BEVs or due to technological advancements of PEVs. For example, it remains to be seen how the interaction of increasing DC charging power and the trend toward increasing battery capacities, and thus, increasing ranges on the vehicle side will affect the demand behavior of the CI [28]. Thus, increasing ranges could lead to DC CI only being used in exceptional cases, as the range is sufficient to cover regular driving distances. Users can also postpone energy demands during longer parking periods at low-cost AC CSs. This would lead to an overall increase in demand for AC CI and increased energy demand per AC CE. At the same time, rising energy prices in the area of DC CI are conceivable in order to ensure the refinancing of the infrastructure despite a reduced demand. The demand function used here effectively considers energy prices as a demand decision criterion. Other influencing factors, such as the SOC status of the PEV under consideration or the amount of energy required for the next trip, are therefore, not directly considered. Rather, the framework aims to determine the energy demand from a pool of real CEs. This pool indirectly includes the demand behavior in the whole complexity of human decision-making. Demand functions that, for example, take into account the SOC level of PEVs and assume that PEVs with a low SOC have a higher probability of charging would inevitably lead to CEs with high energy levels being weighted more heavily and, thus, applied more frequently in the evaluation. Consequently, the empirical data basis of CDRs would be distorted as a result. Furthermore, the study assumed a higher demand for AC CI due to the lower energy price. With the same demand for AC and DC CI, the DC CSs were able to increase the maximum transmitted energy in the progressive scenario by about 40% each, with about 160,000 kWh for DC2x50kW and 100,000 kWh for DC1x150kW. It is interesting to note that AC18x7kW still has the highest energy sales of all investigated CCs, at about 190,000 kWh in this case. The exact quantification of the potential demand for CSs depending on the charging technology is a topic that will be taken up in future studies. From the authors’ point of view, additional investigations, e.g., in the context of real experiments, are needed to quantify the potential demand that can be generated by AC low power and DC high power CI in urban areas.
In the study, the occupation logic was used to consider different usage characteristics for AC and DC CI. The occupation logic was derived based on findings from previous studies. According to this, AC CEs are mostly associated with parking events. As a result, the share of idle connection time is significantly larger compared to DC CEs, where the focus is on the actual charging process itself, and thus, the charging time accounts for a large part of the connection time. The evaluation of the time utilization of the CI shows a potential for mixed concepts of AC and DC CI. Therefore, the temporal utilization of AC CI, which is mainly occupied during the day, complements the temporal utilization of DC CI, which is mainly occupied in the evening. Thus, by selectively combining AC and DC CI, different usage patterns could be combined, which in sum, can create synergies for a charging location. The investigation and evaluation of such mixed charging approaches represent a field for future research. In the case of AC CEs, an enormous potential for optimization is shown in the time utilization of AC CPs. A key finding of the study at hand is that even at a comparatively low charging power of 7 kW, the share of idle connection time is still remarkable with 40–60%. By means of automated parking and CEs, for example, by automated vehicle fleets and inductive charging systems in park and charge lanes, the time and energy utilization could be optimized, an approach discussed in [29] for car-sharing fleets. This would allow established conductive charging systems to be compared with inductive approaches and the technological and economic results to be evaluated.
In this study, a framework is presented to evaluate different CCs economically and technologically. The PEVs charge as soon as they are connected to the CP. The considered charging strategy thus corresponds to the logic of an uncontrolled power demand and thus to the current standard approach for public CI. Since the framework can be used to simulate individual power and energy flows, it is possible to evaluate deviating charging strategies such as strategies to reduce local power peaks or demand-driven charging strategies to increase the share of renewable energy [30]. Figure 11 shows, for example, the potential for shifting the charging time, or the time period in which system services could be provided by PEVs in the otherwise idle connection time with CPs. Previous studies based on vehicle data have already shown that PEVs can provide system services on a considerable scale. For example, by continuously cycling the vehicle battery, a fleet of 40 PEVs could already provide 650 MWh of system services per year during the otherwise idle connection times at apartment buildings, and thus, during CEs in the private area, without influencing the mobility offer of the vehicle fleet [31]. Overall, there is, thus, an opportunity in future studies to investigate and evaluate approaches for integrating vehicle batteries as controllable energy storage devices into the power grid on a broader data basis and for different cases.
5. Conclusions
In this study, a methodology was presented to evaluate different types of CSs based on real usage data. The application area was a semi-public space with P & R facilities. The case here is to enable commuters in particular to switch from passenger cars to public transport and, thus, to cover part of their commuting distance by public transport. The resulting long parking times of vehicles with a mean of 6.8 h (median: 7.2 h) are a decisive factor for the evaluation of possible CSs, since the available connection times for CEs, and thus, the charging technology as well as the necessary charging power, are influenced. The evaluation of the CSs was carried out in three scenarios, whereby different assumptions for future penetration rates of PEVs as well as the demand behavior of electric vehicles were determined in each case. After all, it can be concluded that the investigated CSs AC18x7kW and DC2x50kW with a comparatively lower charging power and correspondingly lower CAPEX and OPEX have an advantage over the CSs AC2x22kW and DC1x150kW in the investigated case. This advantage is highest in both cases in the selected progressive scenario; with an increasing penetration rate of PEV, the availability of CPs takes on an increasingly important role and the higher infrastructure-side charging power of AC2x22kW or DC1x150kW is limited in many cases by vehicle-side power. With heterogeneous PEV fleets with different vehicle specific charging powers also expected in the future, this is a relevant factor influencing the use of charging systems.
Author Contributions
Conceptualization, M.F. and C.H.; methodology, M.F. and C.H.; software, M.F.; validation, M.F. and C.H.; formal analysis, M.F.; investigation, M.F.; resources, M.F. and C.H.; data curation, M.F.; writing—original draft preparation, M.F. and C.H.; writing—review and editing, M.F. and C.H.; visualization, M.F. and C.H.; supervision, K.B. and J.E.; project administration, C.H. and K.B.; funding acquisition, C.H. and K.B. All authors have read and agreed to the published version of the manuscript.
Funding
This work was supported by the German Federal Ministry for Economic Affairs and Energy (BMWi) within the funding initiative “Sofortprogramm Saubere Luft” by the project “München elektrisiert”, grant number: 01MZ18010C.
Institutional Review Board Statement
Not applicable.
Informed Consent Statement
Not applicable.
Data Availability Statement
Not applicable.
Acknowledgments
The authors would like to thank Stadtwerke München (SWM) and the P+R Park and Ride GmbH München for providing the data and the German Federal Ministry for Economic Affairs and Energy (BMWi) for funding the research project “München elektrisiert”, within the presented investigation was developed. The authors further like to thank Florian Dandl of the Technical University of Munich, for his valuable input to improve this work.
Conflicts of Interest
The authors declare no conflict of interest.
Appendix A
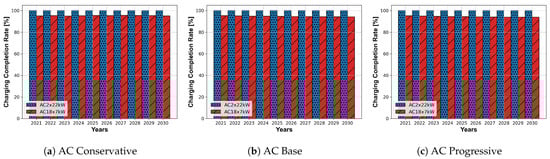
Figure A1.
Charge Completion Rate AC-Charging Concepts.
Figure A1.
Charge Completion Rate AC-Charging Concepts.
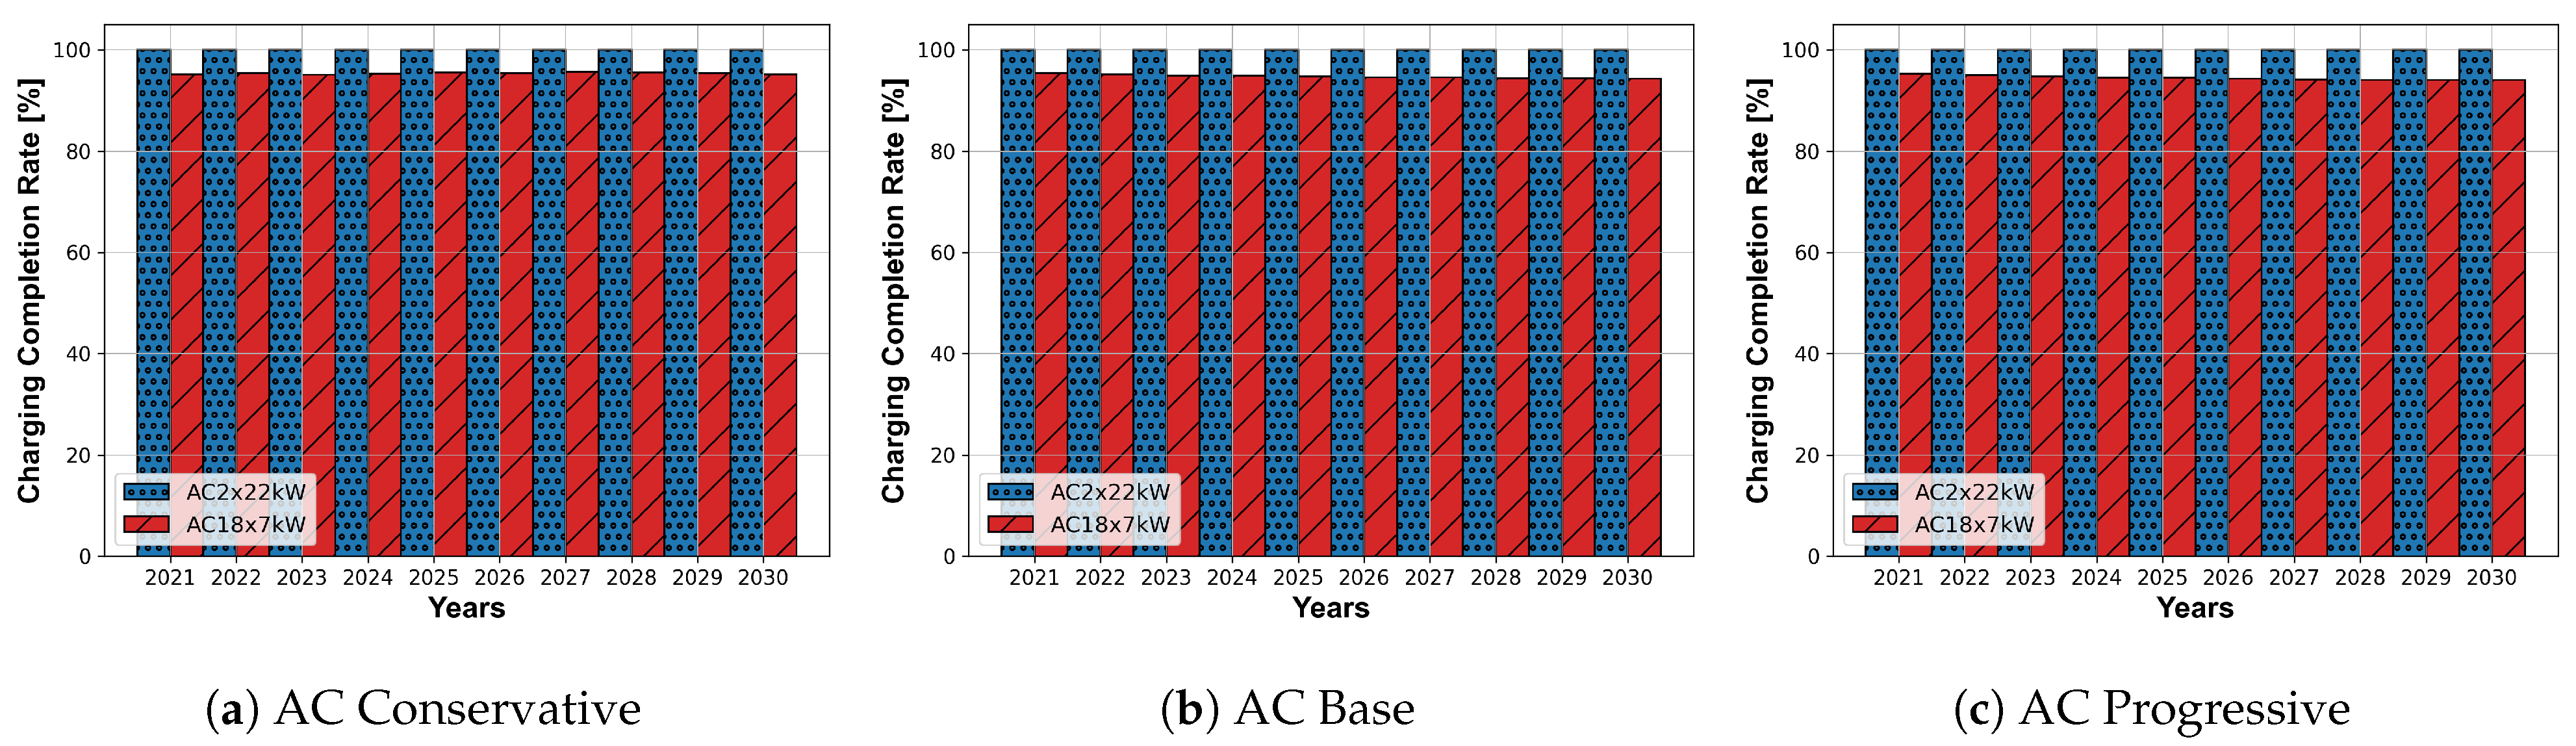

Figure A2.
Number of Charging Events per Charging Station.
Figure A2.
Number of Charging Events per Charging Station.
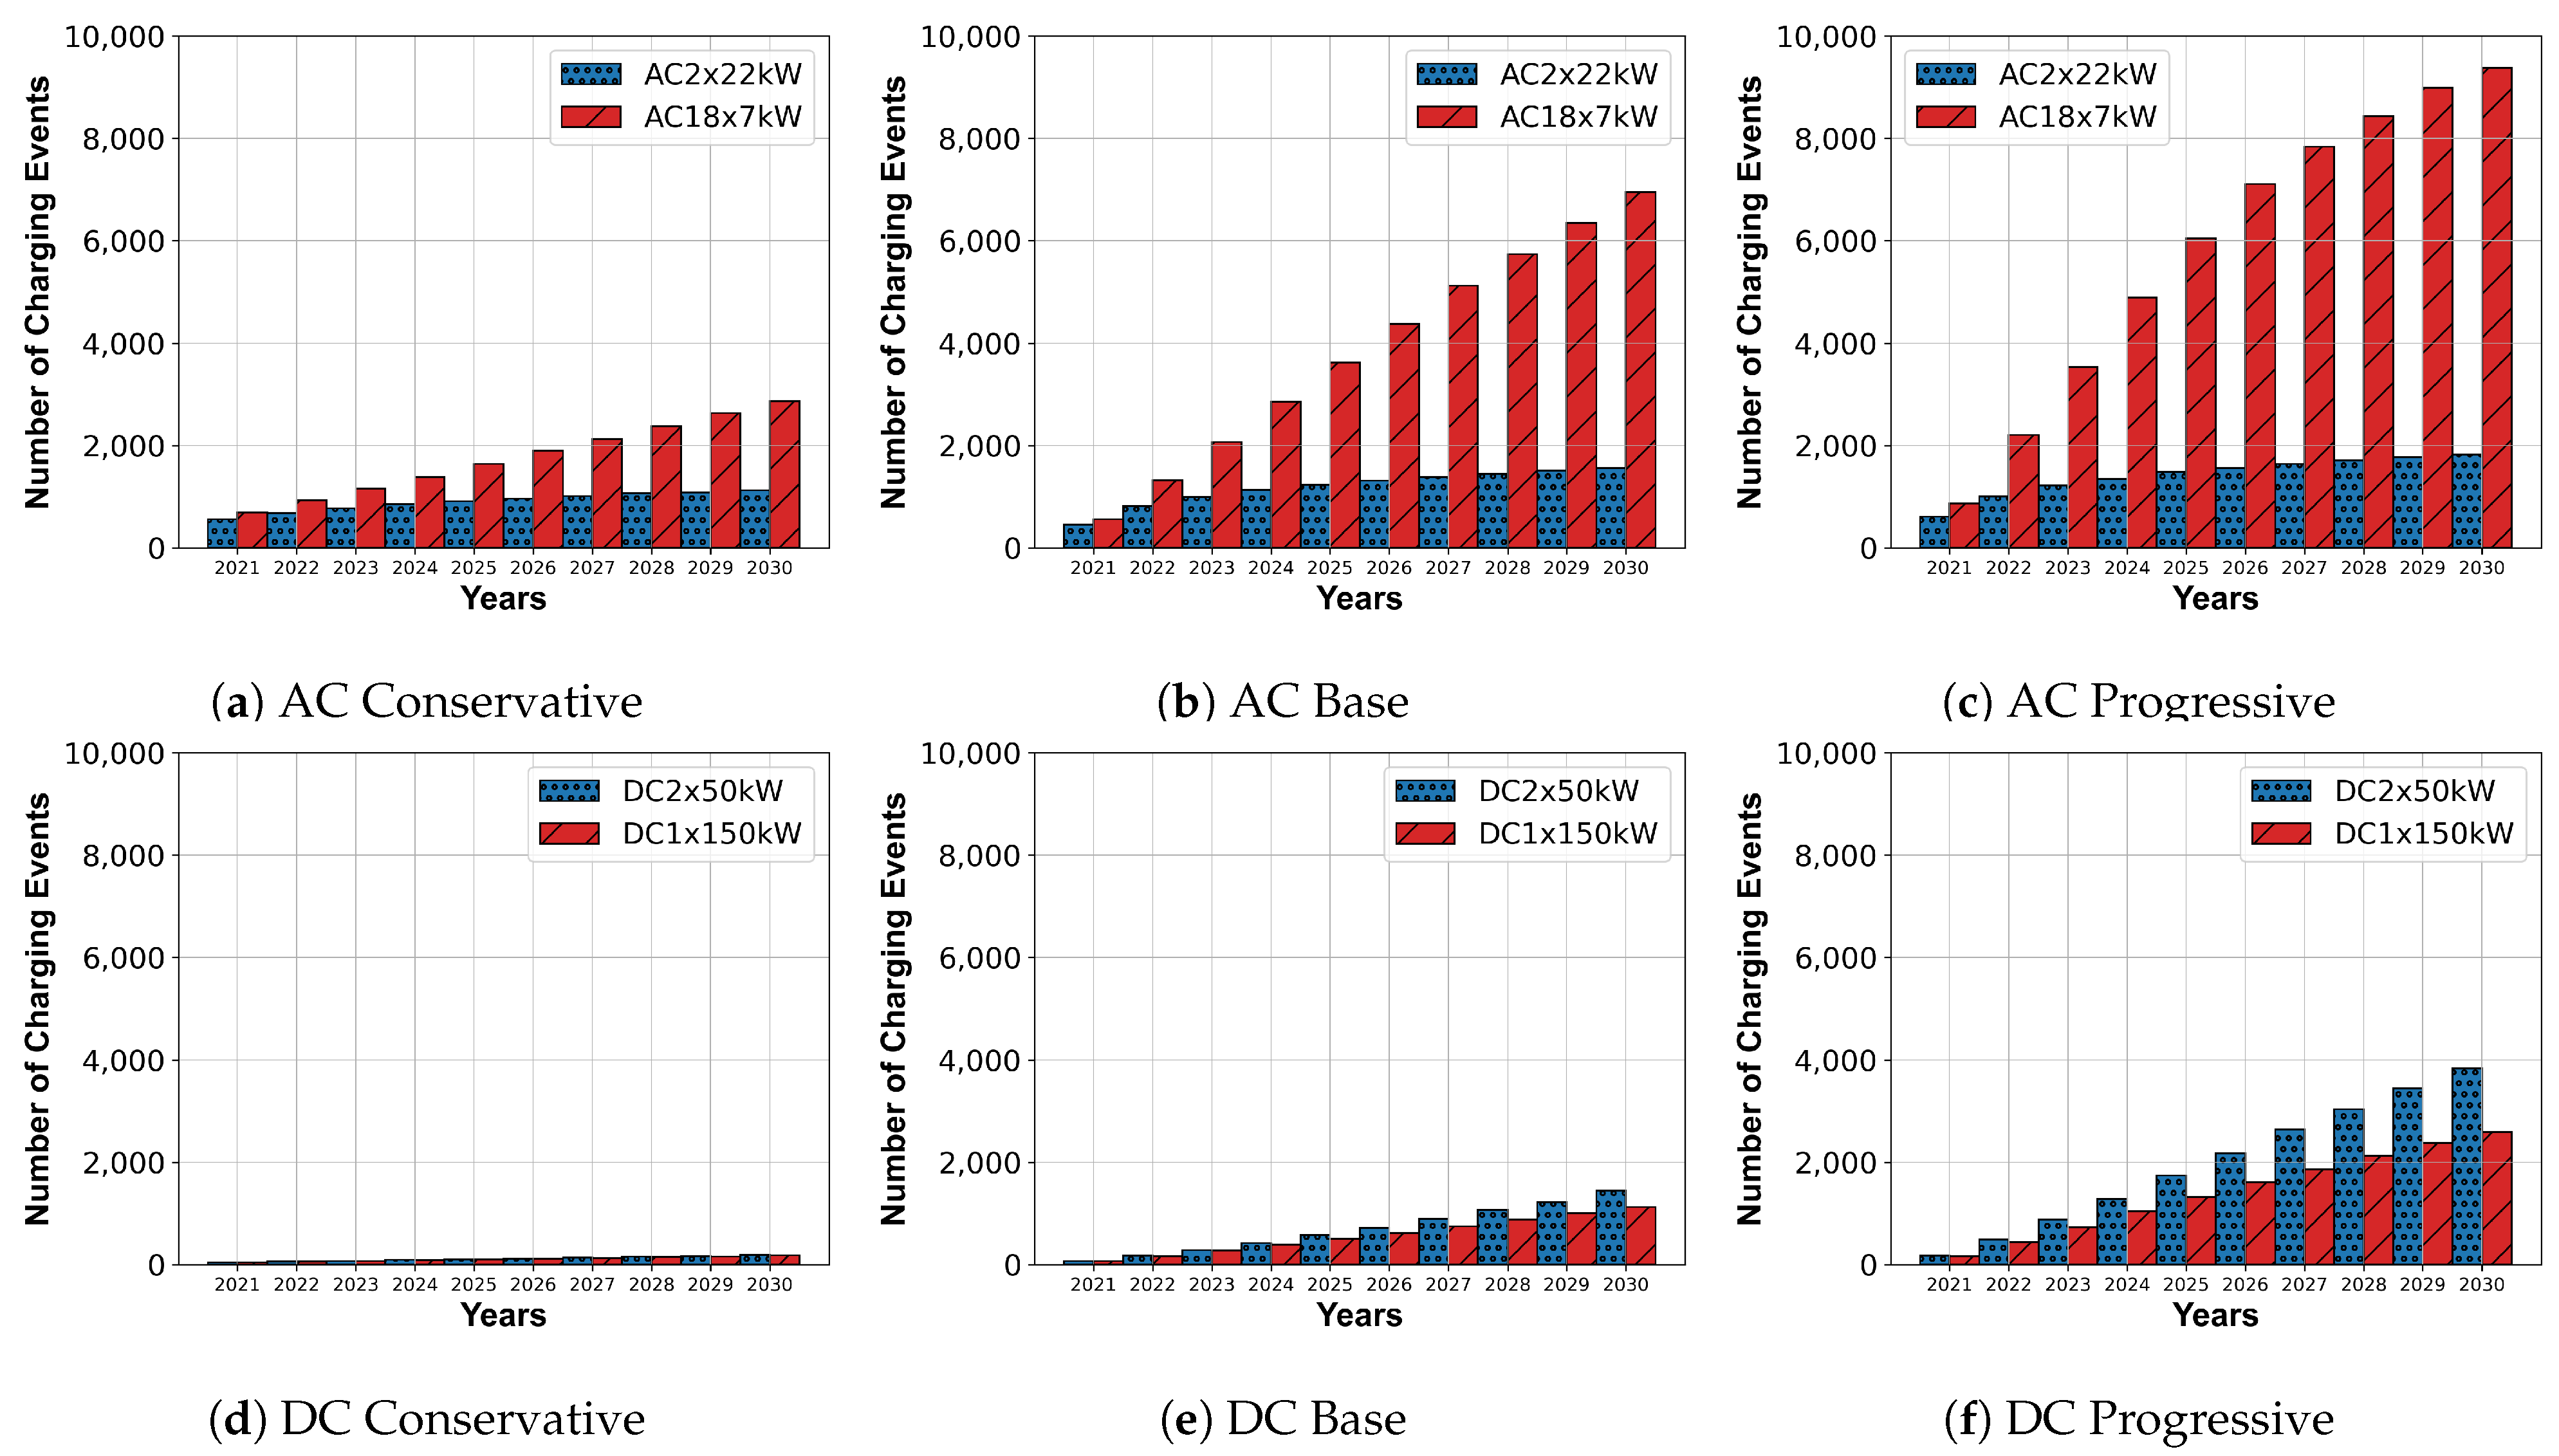
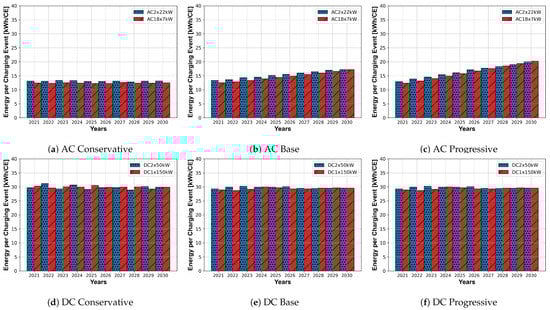
Figure A3.
Average Transmitted Energy per Charging Event.
Figure A3.
Average Transmitted Energy per Charging Event.
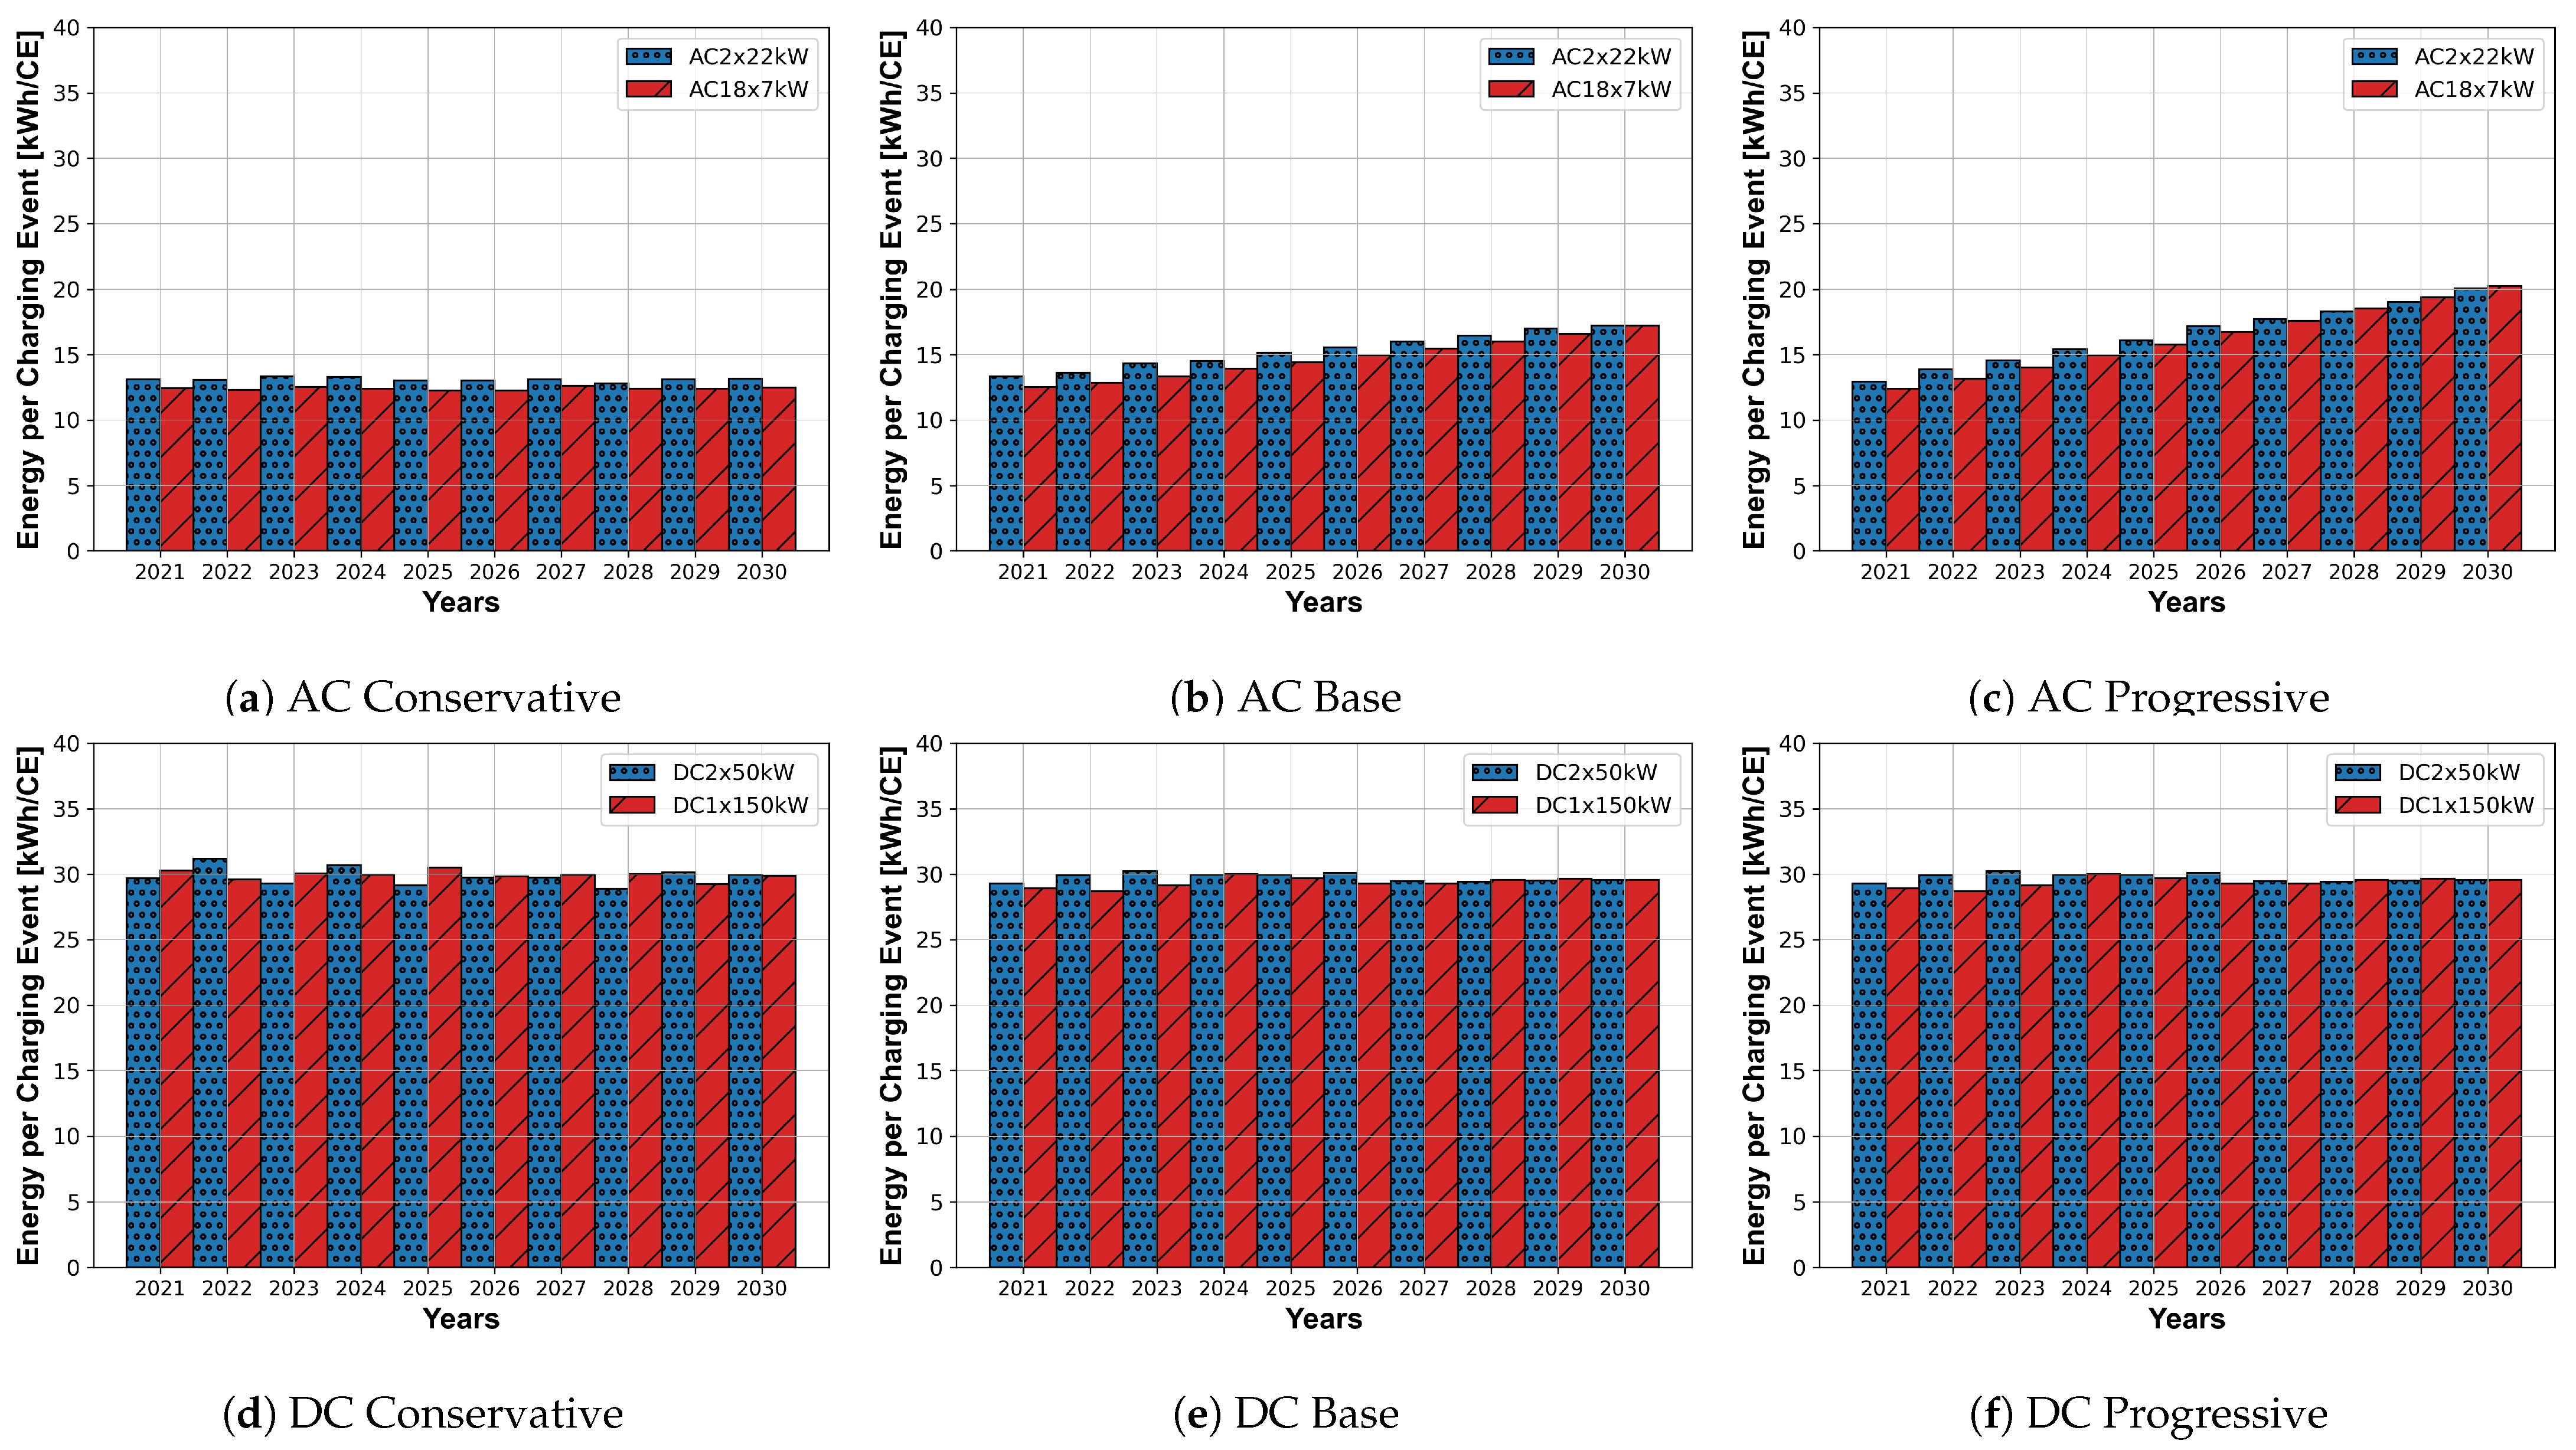

Figure A4.
Success Rate to occupy a free Charging Point of the Charging Concepts.
Figure A4.
Success Rate to occupy a free Charging Point of the Charging Concepts.
References
- Sachs, J.D.; Schmidt-Traub, G.; Mazzucato, M.; Messner, D.; Nakicenovic, N.; Rockström, J. Six Transformations to achieve the Sustainable Development Goals. Nat. Sustain. 2019, 2, 805–814. [Google Scholar] [CrossRef]
- Van den Hoed, R.; Helmus, J.R.; de Vries, R.; Bardok, D. Data analysis on the public charge infrastructure in the city of Amsterdam. In Proceedings of the 2013 World Electric Vehicle Symposium and Exhibition (EVS27), Barcelona, Spain, 17–20 November 2013; pp. 1–10. [Google Scholar] [CrossRef] [Green Version]
- Wolbertus, R.; van den Hoed, R.; Maase, S. Benchmarking Charging Infrastructure Utilization. World Electr. Veh. J. 2016, 8, 754–771. [Google Scholar] [CrossRef] [Green Version]
- Almaghrebi, A.; Shom, S.; Al Juheshi, F.; James, K.; Alahmad, M. Analysis of User Charging Behavior at Public Charging Stations. In Proceedings of the 2019 IEEE Transportation Electrification Conference and Expo (ITEC), Detroit, MI, USA, 19–21 June 2019; pp. 1–6. [Google Scholar] [CrossRef]
- Fischer, M.; Hardt, C.; Michalk, W.; Bogenberger, K. Charging or Idling: Method for quantifying the Charging and the Idle Time of public Charging Stations. In Proceedings of the TRB 101st Annual Meeting Compendium of Papers, Washington, DC, USA, 9–13 January 2022; Transportation Research Board: Washington, DC, USA, 2022. [Google Scholar]
- Friese, P.A.; Michalk, W.; Fischer, M.; Hardt, C.; Bogenberger, K. Charging Point Usage in Germany—Automated Retrieval, Analysis, and Usage Types Explained. Sustainability 2021, 13, 13046. [Google Scholar] [CrossRef]
- Hecht, C.; Das, S.; Bussar, C.; Sauer, D.U. Representative, empirical, real-world charging station usage characteristics and data in Germany. eTransportation 2020, 6, 100079. [Google Scholar] [CrossRef]
- Van der Kam, M.; van Sark, W.; Alkemade, F. Multiple roads ahead: How charging behavior can guide charging infrastructure roll-out policy. Transp. Res. Part D Transp. Environ. 2020, 85, 102452. [Google Scholar] [CrossRef]
- Wolbertus, R.; Van den Hoed, R.; Kroesen, M.; Chorus, C. Charging infrastructure roll-out strategies for large scale introduction of electric vehicles in urban areas: An agent-based simulation study. Transp. Res. Part A Policy Pract. 2021, 148, 262–285. [Google Scholar] [CrossRef]
- Mortimer, B.J.; Hecht, C.; Goldbeck, R.; Sauer, D.U.; de Doncker, R.W. Electric Vehicle Public Charging Infrastructure Planning Using Real-World Charging Data. World Electr. Veh. J. 2022, 13, 94. [Google Scholar] [CrossRef]
- Hecht, C.; Figgener, J.; Sauer, D.U. Analysis of Electric Vehicle Charging Station Usage and Profitability in Germany based on Empirical Data. arXiv 2022, arXiv:2206.09582. [Google Scholar] [CrossRef]
- Wolbertus, R.; van den Hoed, R. Charging station hogging: A data-driven analysis. In Proceedings of the Electric Vehicle Symposium EVS30, Stuttgart, Germany, 9–11 October 2017. [Google Scholar]
- Wolbertus, R.; Kroesen, M.; van den Hoed, R.; Chorus, C. Fully charged: An empirical study into the factors that influence connection times at EV-charging stations. Energy Policy 2018, 123, 1–7. [Google Scholar] [CrossRef] [Green Version]
- Gerritsma, M.K.; AlSkaif, T.A.; Fidder, H.A.; van Sark, W.G. Flexibility of Electric Vehicle Demand: Analysis of Measured Charging Data and Simulation for the Future. World Electr. Veh. J. 2019, 10, 14. [Google Scholar] [CrossRef] [Green Version]
- Almaghrebi, A.; Juheshi, F.A.; Nekl, J.; James, K.; Alahmad, M. Analysis of Energy Consumption at Public Charging Stations, a Nebraska Case Study. In Proceedings of the 2020 IEEE Transportation Electrification Conference & Expo (ITEC), Chicago, IL, USA, 23–26 June 2020; pp. 1–6. [Google Scholar] [CrossRef]
- Almaghrebi, A.; Aljuheshi, F.; Rafaie, M.; James, K.; Alahmad, M. Data-Driven Charging Demand Prediction at Public Charging Stations Using Supervised Machine Learning Regression Methods. Energies 2020, 13, 4231. [Google Scholar] [CrossRef]
- Weiß, A.; Biedenbach, F.; Müller, M. Probabilistic Load Profile Model for Public Charging Infrastructure to Evaluate the Grid Load. Energies 2022, 15, 4748. [Google Scholar] [CrossRef]
- Ali Syed, A.; Fischer, M.; Cornelius, H.; Bogenberger, K. Charge Point Search Policies for EVs—Minimizing the Cruise for Juice. In Proceedings of the (Submitted and Accepted for the 25th IEEE International Conference on Intelligent Transportation Systems), IEEE ITSC, Macau, China, 8–12 October 2022. [Google Scholar]
- Nationale Plattform Elektromobilität. Ladeinfrastruktur für Elektrofahrzeuge in Deutschland: Statusbericht und Handlungsempfehlungen 2015: AG 3—Ladeinfrastruktur und Netzintegration. 2015. Available online: https://www.acatech.de/publikation/ladeinfrastruktur-fuer-elektrofahrzeuge-in-deutschland-statusbericht-und-handlungsempfehlungen/download-pdf?lang=de (accessed on 9 August 2022).
- Deloitte. E-Mobility: Ladeinfrastruktur als Geschäftsfeld; Technical Report; Deloitte GmbH Wirtschaftsprüfungsgesellschaft: Berlin, Germany, 2018. [Google Scholar]
- Auf der Maur, A.; Brüggeshemke, N.; Kutschera, M. Lade-Report: Entwicklung der öffentlich zugänglichen Ladeinfrastruktur für die Elektromobilität sowie Vergleich der Ladetarife in Deutschland. 2020. Available online: https://www.prognos.com/sites/default/files/2021-01/20200207_prognos_lade-report_2020.pdf (accessed on 9 August 2022).
- Fischer, M.; Bogenberger, K.; Elias, J.; Schram, S. Evaluation of charging concepts for high density urban areas based on real mobility and charging profiles of BEV. In Proceedings of the CIRED 2021—The 26th International Conference and Exhibition on Electricity Distribution, Online, 20–23 September 2021; Institution of Engineering and Technology: Stevenage, UK, 2021; pp. 2979–2983. [Google Scholar] [CrossRef]
- Dronia, M.; Gallet, M. Field test of charging management system for electric vehicle—State of the art charging management using ISO 61851 with EV from different OEMs. In Proceedings of the 5th Conference on Future Automotive Technology, Fürstenfeldbruck, Germany, 3–4 May 2016. [Google Scholar] [CrossRef]
- Öffentliche Ladestationen für E-Autos in München: Tarife & Angebote. Available online: https://www.swm.de/elektromobilitaet/oeffentliches-laden (accessed on 15 June 2022).
- Talluri, K.T.; van Ryzin, G.J. The Theory and Practice of Revenue Management; Springer: Boston, MA, USA, 2004. [Google Scholar]
- Masterplan Ladeinfrastruktur der Bundesregierung: Ziele und Maßnahmen für den Ladeinfrastrukturaufbau bis 2030. 2019. Available online: https://www.bmvi.de/SharedDocs/DE/Anlage/G/masterplan-ladeinfrastruktur.pdf?__blob=publicationFile (accessed on 9 August 2022).
- Schuster, A. Batterie-bzw. Wasserstoffspeicher bei Elektrischen Fahrzeugen. 2008. Available online: https://repositum.tuwien.at/bitstream/20.500.12708/12337/2/Schuster%20Andreas%20-%202008%20-%20Batterie-%20bzw%20Wasserstoffspeicher%20bei%20elektrischen...pdf (accessed on 9 August 2022).
- Wolbertus, R.; Heath, E.; Heller, R. Impact of battery developments on the future of charging infrastructure deployment. In Proceedings of the Electric Vehicle Symposium 35, Oslo, Norway, 11–15 June 2022. [Google Scholar]
- Dandl, F.; Niels, T.; Bogenberger, K. Design and Control of Park & Charge Lanes for Carsharing Services with Highly-Automated Electric Vehicles. IFAC-PapersOnLine 2020, 53, 15420–15427. [Google Scholar] [CrossRef]
- Erickson, L.; Ma, S. Solar-Powered Charging Networks for Electric Vehicles. Energies 2021, 14, 966. [Google Scholar] [CrossRef]
- Fischer, M.; Elias, J.; Bogenberger, K.; Schramm, S. Quantification of transmitted energy and power for system services by battery electric vehicles based on real mobility and charging profiles. In Proceedings of the CIRED Berlin 2020 Workshop How to Implement Flexibility in the Distribution System, Online, 22–23 September 2020. [Google Scholar] [CrossRef]

Publisher’s Note: MDPI stays neutral with regard to jurisdictional claims in published maps and institutional affiliations. |
© 2022 by the authors. Licensee MDPI, Basel, Switzerland. This article is an open access article distributed under the terms and conditions of the Creative Commons Attribution (CC BY) license (https://creativecommons.org/licenses/by/4.0/).