Abstract
An effective model of battery performance is important for battery management systems to control the state of battery and cell balancing. The second-order equivalent circuit model of a lithium-ion battery is studied in the present paper. The identification methods that include the multiple linear regression (MLR), exponential curve fitting (ECF) and Simulink design optimization tool (SDOT), were used to determine the model parameters. The aim of this paper is to compare the validity of the three proposed algorithms, which vary in complexity. The open circuit voltage was measured based on the pulse discharge test. The voltage response was collected for every 10% SOC in the interval between 0–100% SOC. The battery voltages calculated from the estimated parameters under the constant current discharge test and dynamic discharge tests for electric vehicles (ISO and WLTP) were compared to the experimental data. The mean absolute error and root mean square error were calculated to analyze the accuracy of the three proposed estimators. Overall, SDOT provides the best fit with high accuracy, but requires a heavy computation burden. The accuracy of the three methods under the constant current discharge test is high compared to other experiments, due to the nonlinear behavior at a low SOC. For the ISO and WLTP dynamic tests, the errors of MLR are close to that of SDOT, but have less computing time. Therefore, MLR is probably more suitable for EV use than SDOT.
1. Introduction
In recent years, there has been growing interest in energy storage technology due to the power application in portable devices, photovoltaic storage [1], industrial devices [2] and electric vehicles (EVs) [3,4,5]. The lithium-ion (Li-ion) batteries are the promising choice for battery storage systems because of their high energy density [6], light weight and long-life cycle [7]. The experiments and modeling on Li-ion batteries (LTO [8], NMC [9], LFP [10], and Li-S [11]) for EV applications have been reported by a number of academic researchers. To guarantee the safety and reliability operation of the battery, a high-performance battery management system (BMS) is needed to monitor and control the voltage, current, temperature, state of the battery and cell balancing [12,13]. The three key issues that were intensively studied are (i) battery performance testing, (ii) battery model and (iii) BMS technology. These three relevant factors work together: battery parameters measured from battery tests are put into the effective battery model in order to achieve a practical battery technology for battery management. It is known that the state of charge (SOC) is one of the most important parameters that can be used to evaluate charge/discharge capability or to avoid the overcharge/over discharge state occurring in the battery. However, the SOC cannot be measured directly, and many approaches, both non-model-based [14,15] and model-based, have been proposed to determine the SOC of the battery. Compared with the non-model-based approach, the model-based method is widely used for EV application. The method can be classified into three categories: the electrochemical model (EM), equivalent circuit model (ECM) and data-driven (DD) approaches. Each model has different advantages and disadvantages [16]. The DD methods can be used to estimate the SOC by measuring the input parameters (current, voltage and temperature) [17,18]. The weakness of the DD approach is that it has to deal with a large number of training set results in a high-accuracy prediction. The machine learning platform is implemented in order to create the relationship and equations from the input data. V. Chandran et al. [19] estimated the battery SOC using six-machine learning algorithms, including the artificial neural network (ANN), support vector machine (SVM), linear regression (LR), Gaussian process regression (GPR), ensemble bagging (EBa) and ensemble boosting (EBo). It was found that the ANN and GPR algorithms achieved good performance in the SOC estimation of an Li-ion battery. The EM is completely different from the DD. The EM takes into account the physical and chemical processes in the battery described by complex nonlinear partial differential equations [20,21,22]. Therefore, the model can provide information with very high accuracy, but the computing time is very long. In [23], the degradation of 18,650 cells stored at 45 °C at 50% SOC for 202 days was studied. The changes of the parameters as a function of age are in a good agreement with the expected trends.
For the ECM, it is more common and simple compared to EM. The ECM contains a series of parallel-connected resistor-capacitor (RC) circuits to represent the battery dynamics. The simplest one is the first-order RC equivalent circuit with only one RC network [11]. The problem is that it cannot describe the nonlinear characteristics in the charge and discharge process properly. The fractional order circuit model, which contains an integer-RC network with the fractional order of capacitance, was proposed in [24,25]. The results show that the model accuracy is higher than that of the integer-order RC model. The nonlinear behavior can be described more effectively. Another way to improve the model accuracy is by increasing the number of the RC network [26,27]. The second-order RC network is the most popular ECM. It is enough to efficiently simulate the nonlinear behavior and it is not too difficult to find the model parameters. Once the battery model is built, the model parameters have to be determined. The online identification is the real-time observation showing the present state of the battery through the new parameters [28]. In contrast, the offline identification obtains the model parameters by using the relationship between the SOC and the open circuit voltage (OCV) under certain conditions in the laboratory. Several identification methods were proposed, such as multiple linear regression (MLR) [29], polynomial fitting [30], Kalman filter family [31], recursive least squares (RLS) [32] and generic algorithm [33]. For online identification, the forgetting factor is introduced into the RLS algorithm, called the forgetting factor recursive least square (FFRLS) [34,35]. The forgetting factor is the weighting factor of the new data from the real-time measurement. The accuracy and convergence of the FFRLS are found to be improved compared to the RLS.
In this work, we focus on the offline identification of the second-order RC equivalent circuit model. Three algorithms of different complexities were studied: (1) multiple linear regression (MRL), which is a common statistical technique dealing with the relationship of the input parameters; (2) exponential curve fitting (ECF), which is a basic mathematical fitting method; and (3) the Simulink design optimization tool (SDOT), which is the most complicated method, compared to the previous two methods. The paper is organized as follows: the details of the experiment and test performed in this work are explained in Section 2; the ECM and the parameter identification algorithms are introduced in Section 3; and Section 4 shows the battery voltages under the pulse discharge test, constant current (CC) discharge test, ISO120405-2:2012 (ISO) and Worldwide Harmonized Light Vehicles Test Procedure (WLTP) dynamic tests. The comparison between the measured and predicted voltages is also included in this section to validate the model accuracy. The conclusion is given in Section 5.
2. Experiment
The equipment used in the battery test consists of a DP811 programmable DC power supply, DL3021 Programmable DC Electronic Load, and LG18650MH1 Li-ion battery, as shown in Figure 1. The specification parameters of LG18650MH1 battery are listed in Table 1. The battery ambient temperature was set to 23–25 °C. The constant current–constant voltage (CC–CV) was carried out for the battery charging procedure, for which the nominal voltage was 3.67 V and nominal current was 1.55 A (0.5C). Before the discharge test starts, it is important to measure the actual capacity of the fully charged battery. The capacity test was performed with a constant current of 3.1 A (1C) (specified data supplied by the manufacturer) and cut-off voltage of 2.5 V. The results are shown in Table 2. The average battery capacity of 2951 mAh obtained from the capacity test was then used for the following discharge tests.
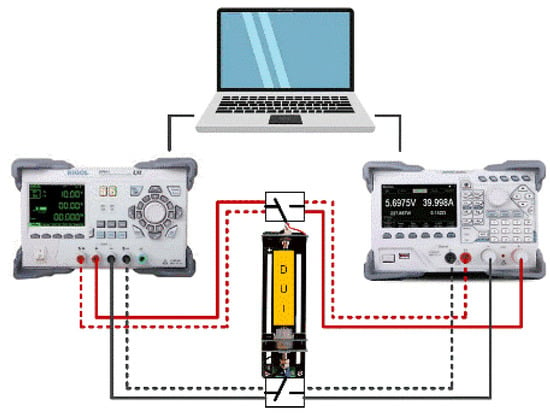
Figure 1.
The schematic of the battery test bench.

Table 1.
Specifications of the LG18650MH1 Li-ion battery cell.
Table 2.
Capacity test.
Four discharge test procedures were performed in this work, including a pulse discharge test, CC discharge test, ISO and WLTP profiles. The battery was charged with the CC–CV technique after each discharge test was completed, and rested for at least for 30 min before starting the next step in the test.
3. Battery Model and Parameter Identification
The second-order resistor-capacitor RC model was used as the ECM of the battery. The schematic diagram of the model is shown in Figure 2, consisting of the OCV (Voc), internal resistance (Rs) and two RC loop circuits. The OCV is considered as the voltage source, the internal resistance represents the ohmic resistance, and the polarization resistance (R1, R2) and polarization capacitance (C1, C2) in the RC circuits describe the dynamic characteristic of the Li-ion battery. The voltages Vs, V1, V2 are the voltages across Rs, C1, C2, respectively.
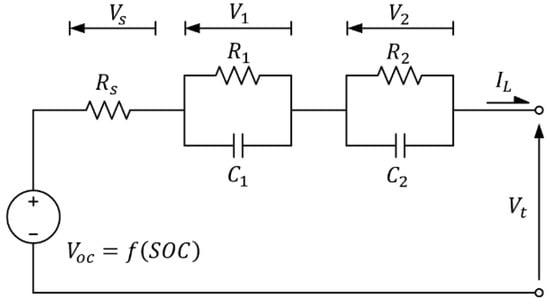
Figure 2.
The schematic diagram of the second-order ECM.
According to Kirchhoff’s voltage law (KVL), the terminal voltage of the battery () is expressed by
where IL is the load current with a negative value for charging and positive value for discharge.
The aim of this work was to identify the model parameters (Rs, R1, R2, C1, C2) for the second-order RC equivalent circuit using MLR, ECF, SDOT estimators. Different parameter estimators have different strengths, varying in complexity and accuracy. Therefore, we chose these three methods because each of them has a different strength: (i) MLR is the statistical method, which is widely used to find the variable relationship; (ii) ECF has a simple algorithm compared to the others; and (iii) SDOT offers high accuracy, but requires a heavy computation burden. The details for each estimator are explained in the following subsection.
3.1. Multiple Linear Regression (MLR)
The multiple linear regression is a statistical technique used to estimate the linear relationship between two or more independent variables (xi) and one dependent variable (y). The equation for multiple linear regression with n observations has the following form:
where is the parameter and is an error. Based on the model, the terminal voltage of the battery is written as
The open-circuit voltage, Voc, was estimated from the voltage before each discharge cycle and the internal resistance, Rs, was calculated (see Figure 3)
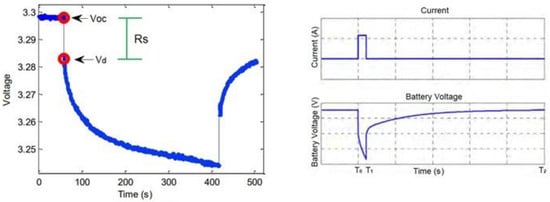
Figure 3.
Measured voltage and current from the pulse discharge test.
The regression is represented by
The Y, A, U functions are calculated from the measurement, while V10, V20 are the unknown parameters related to the model parameters R1, R2, C1, C2 by
where and . Once we obtain the values of V10, V20 from the MLR method, the model parameters can be determined.
3.2. Exponential Curve Fitting (ECF)
According to the KVL, the battery terminal voltage can be written in the exponential form as
With a = Voc − RsIL, b = ILR1, c = R1C1, d = ILR2 and e = R2C2. Similar to the MLR method, the open-circuit voltage, Voc, and the internal resistance, Rs, can be defined from the voltage response of the pulse test. The coefficients a, b, c, d and e were calculated by using the curve fitting tool in Matlab.
3.3. Simulink Design Optimization Tool (SDOT)
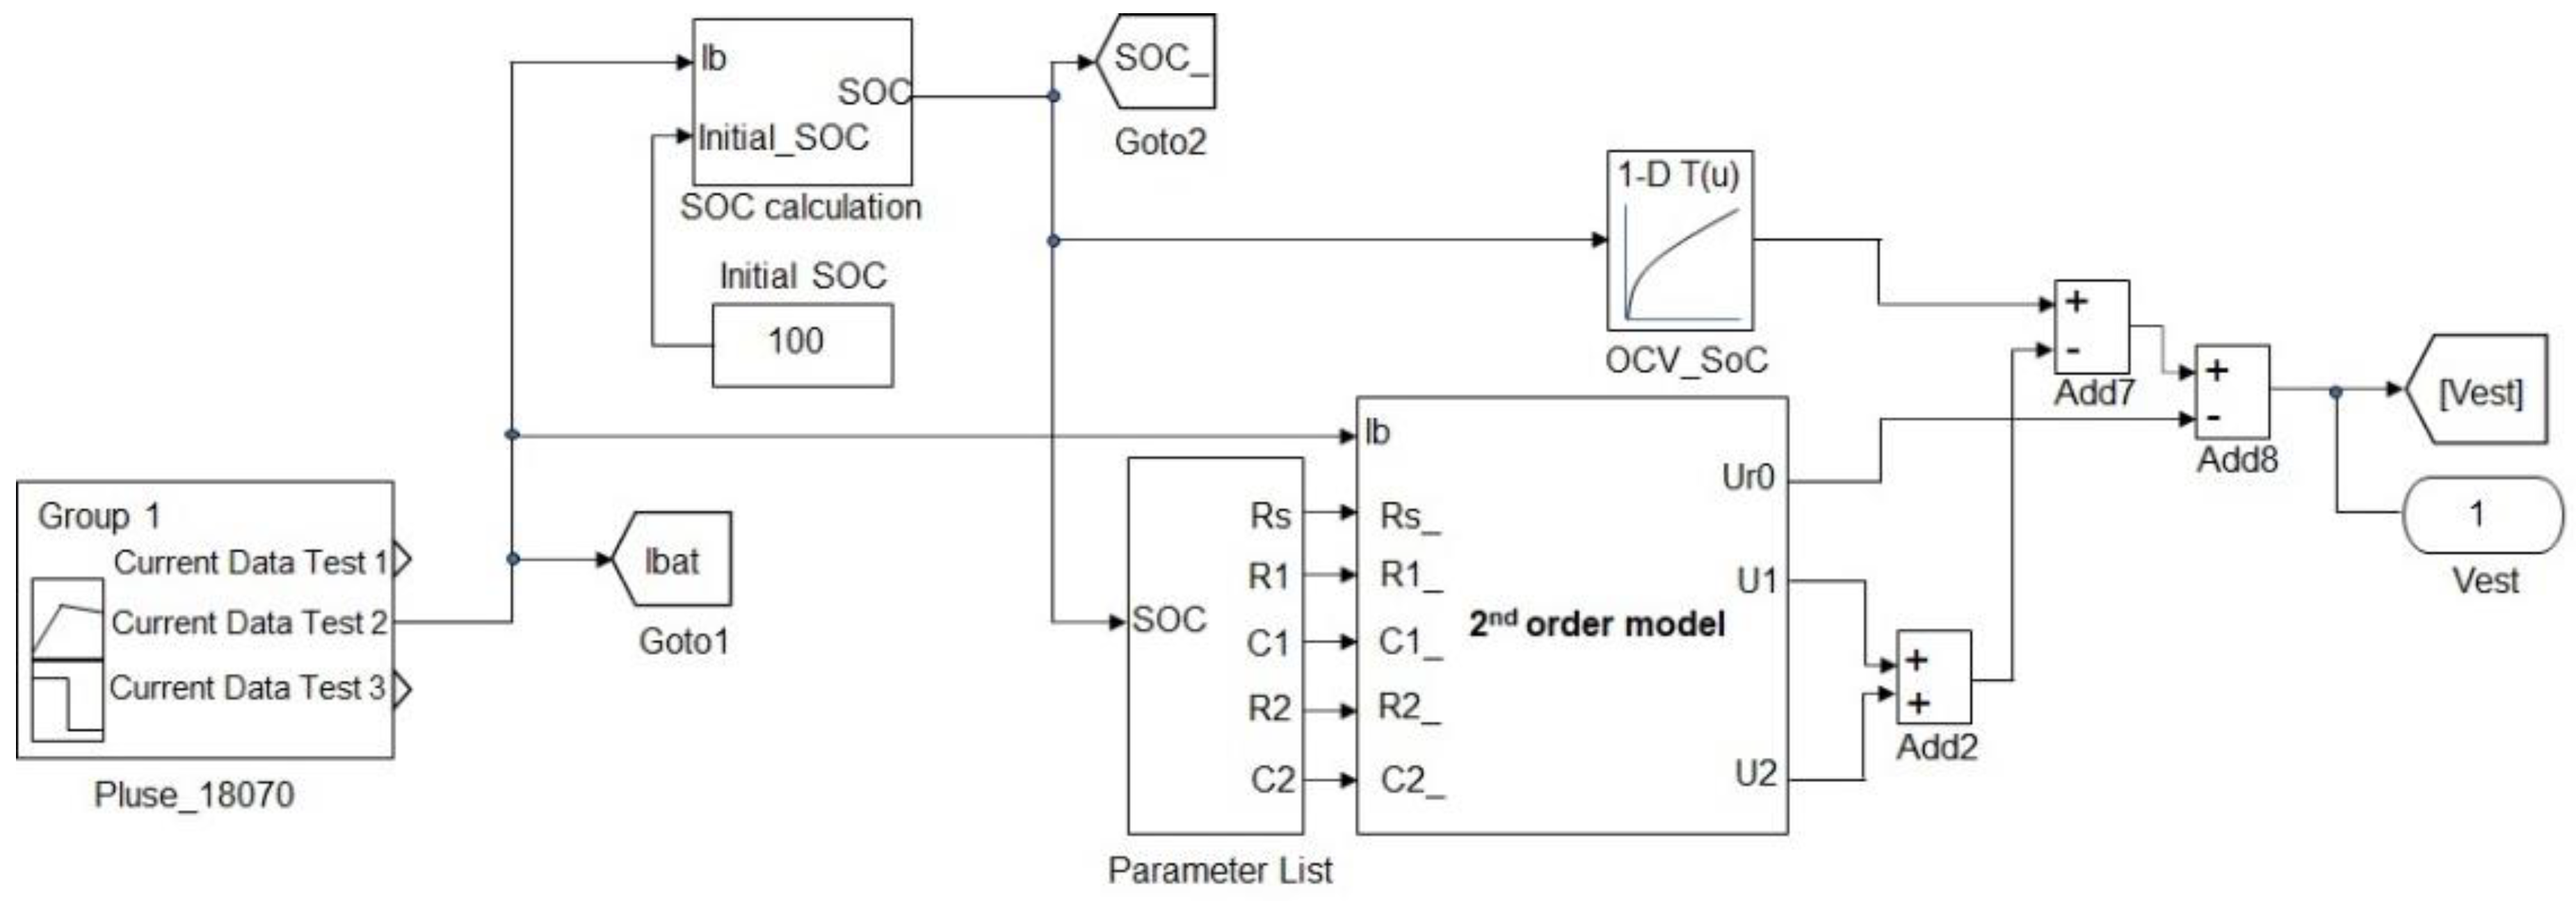
Simulink Design Optimization is a tool that provides functions, interactive tools and blocks for fitting the model to the test data. The model parameters can be tuned to meet the requirements. In this work, the second-order RC equivalent circuit was built by a Simulink block (Figure 4 and Figure 5). The model parameters (Rs, R1, R2, C1, C2) were tuned until the estimated voltage was in good agreement with the measured voltage. The optimization method used here was the nonlinear least square function presented as the following equation:
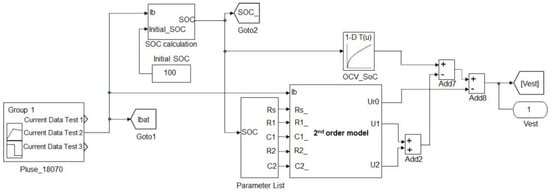
Figure 4.
Simulink diagram for the second-order RC ECM.

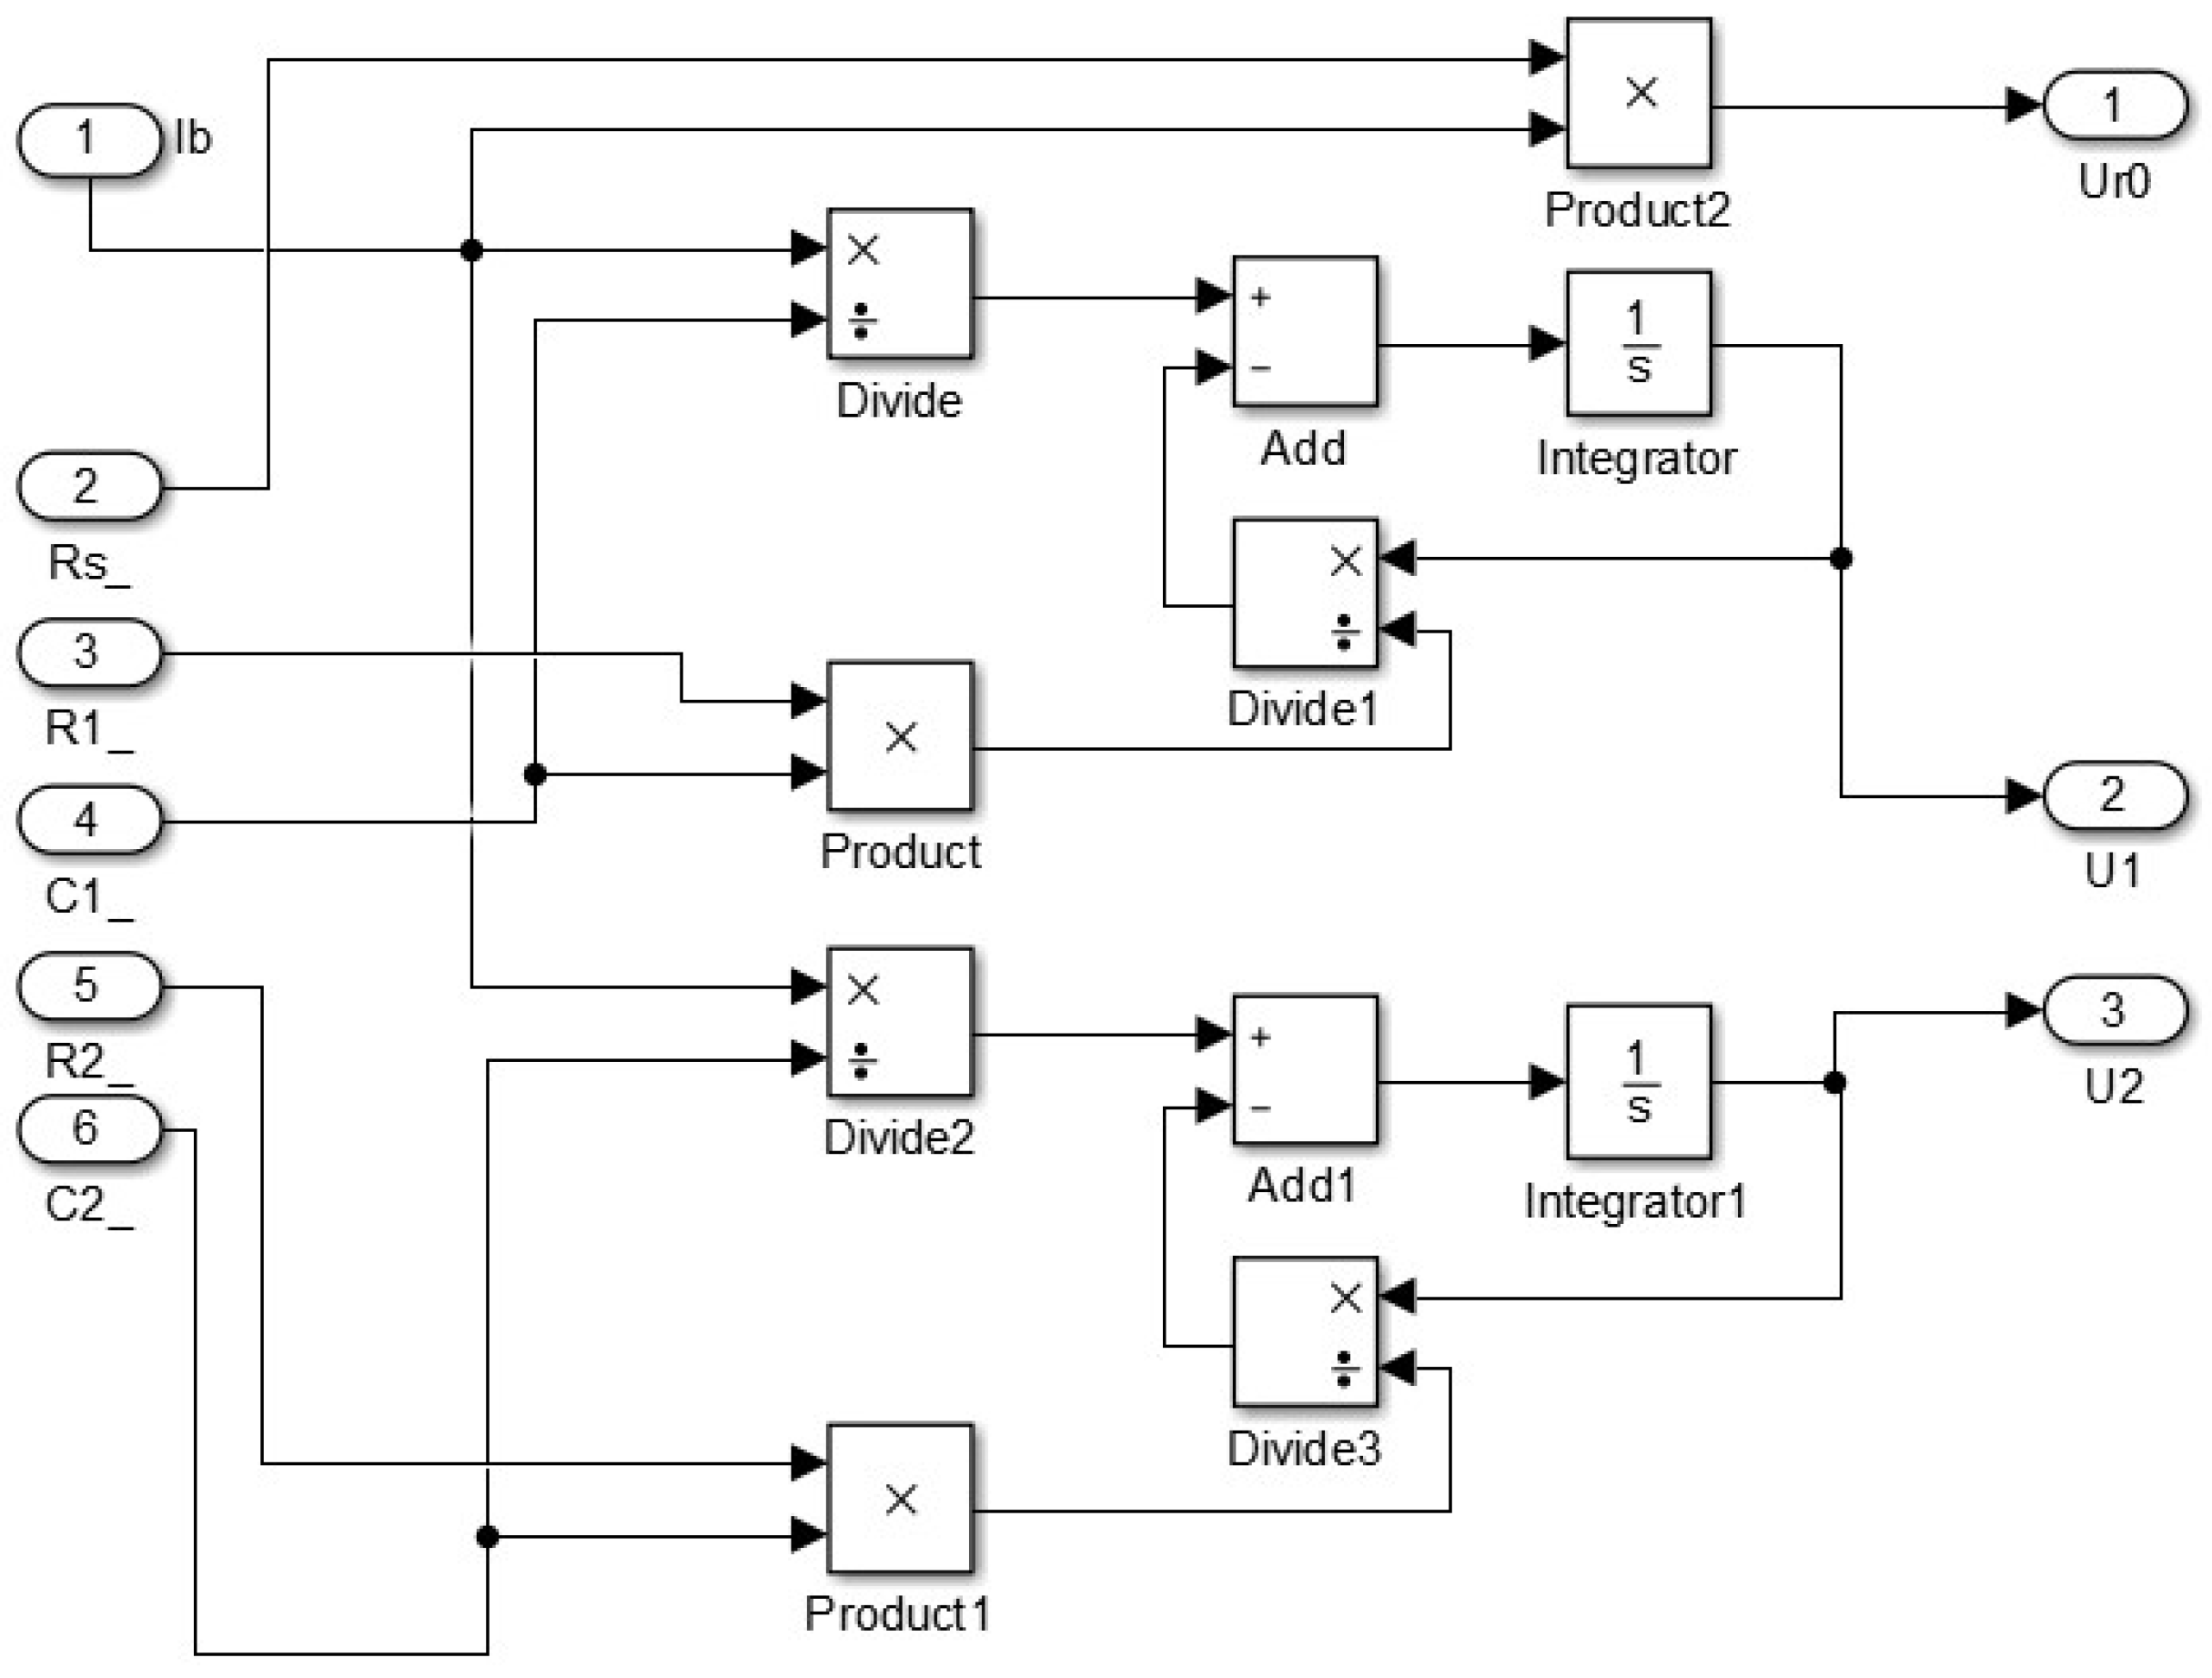
Figure 5.
Simulink diagram for the second-order RC branch.
4. Results and Discussion
4.1. Pulse Discharge Test
4.1.1. Pulse Discharge Test
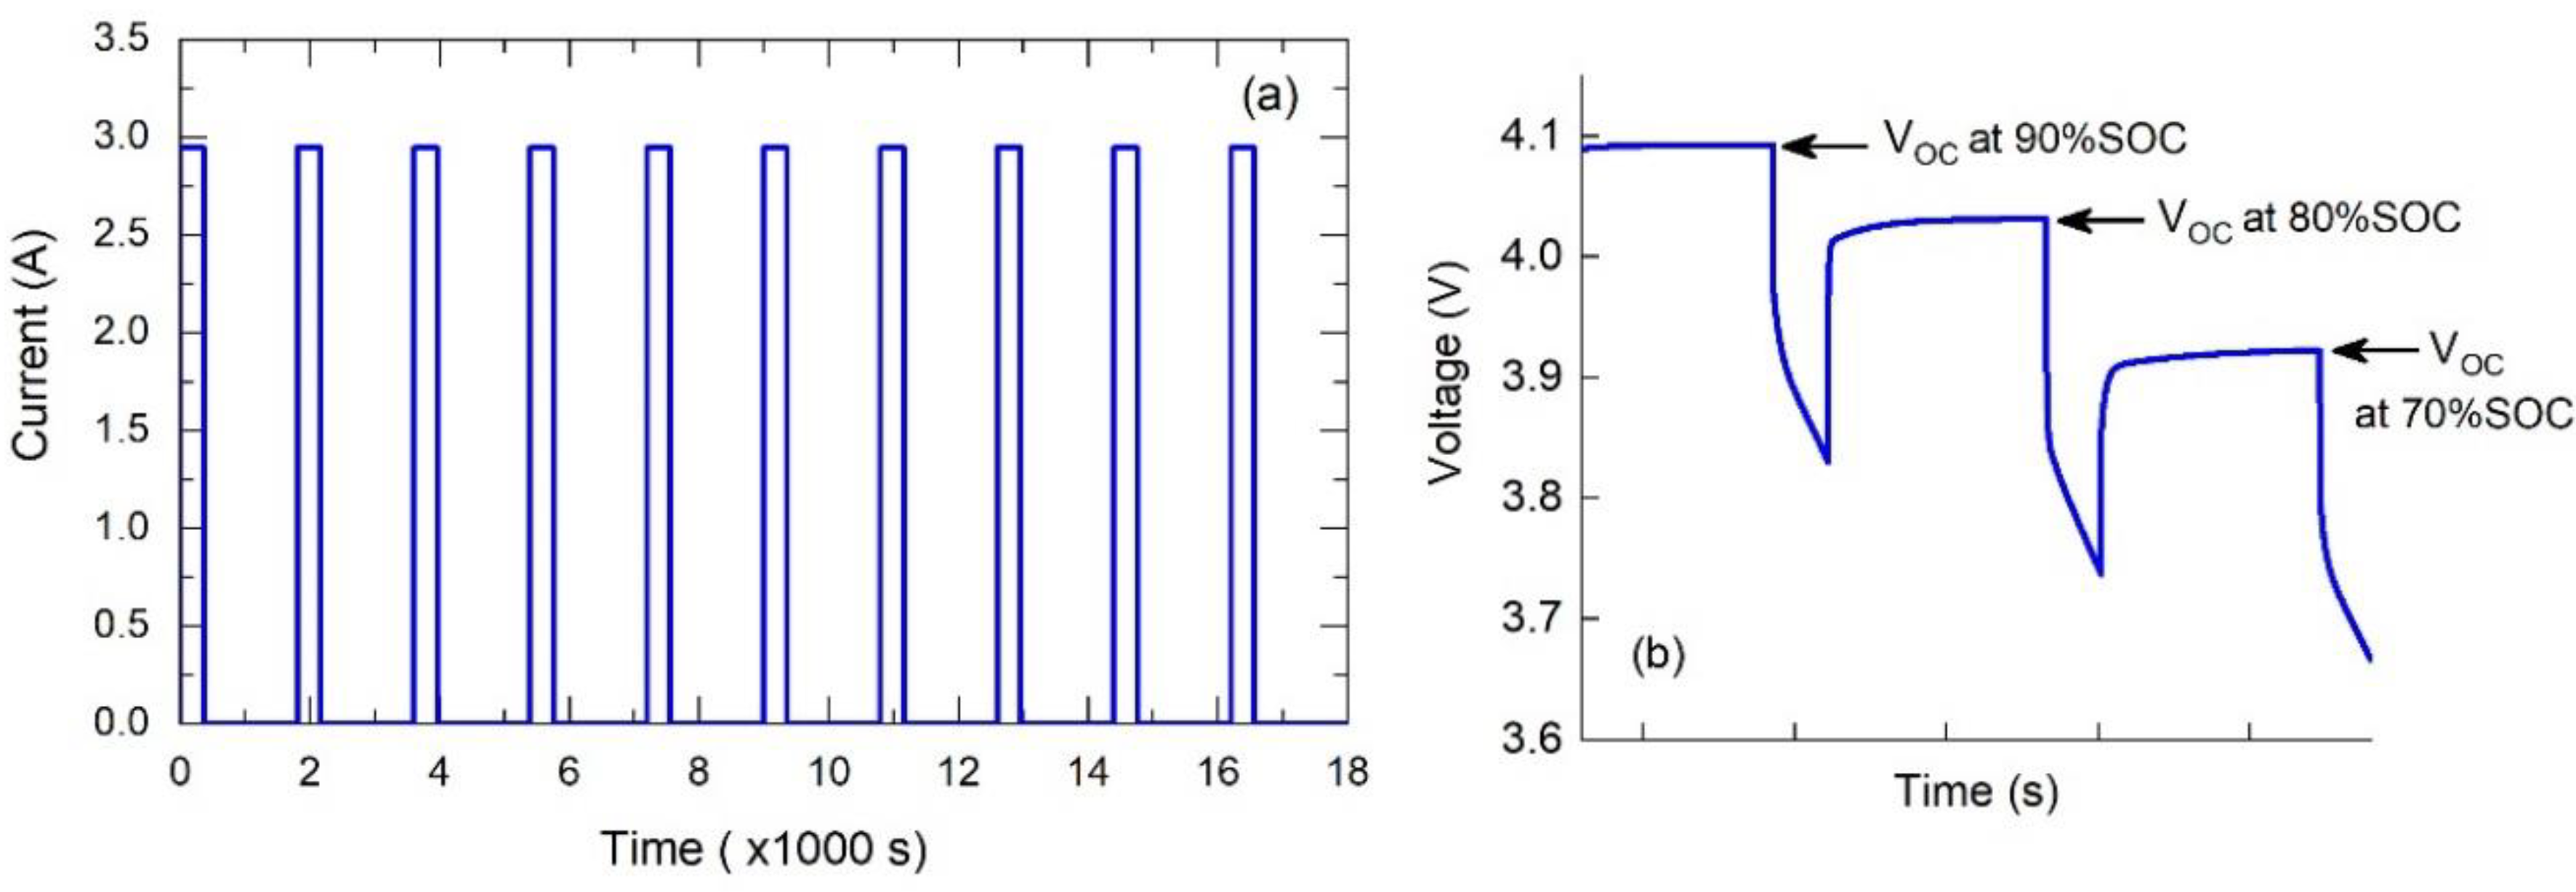
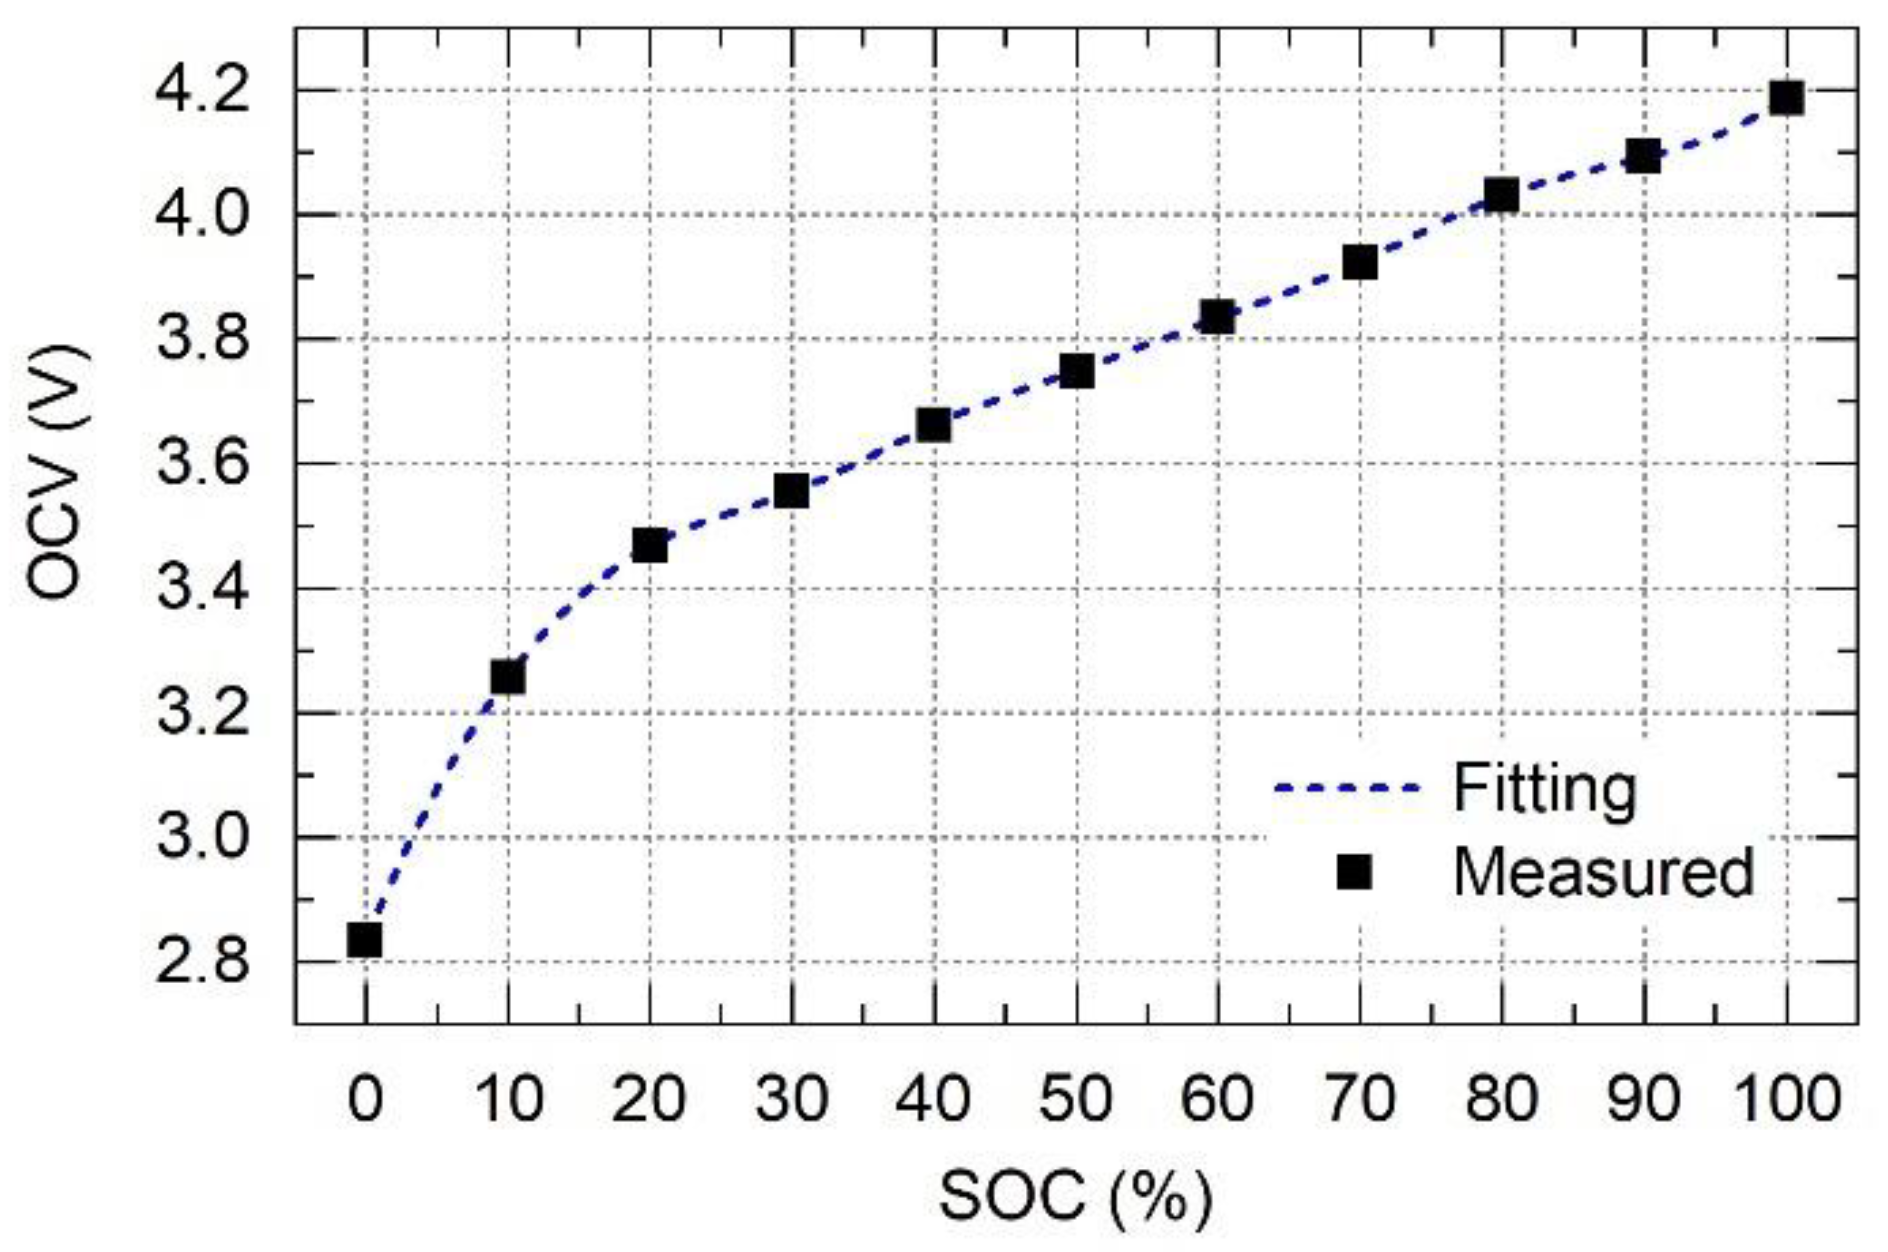
The pulsed discharging test was performed to measure the OCV of the battery. To collected data every 10% SOC starting from 100% SOC to 0% SOC, the constant current of 2951 mA (1C) and the discharge pulse time of 360 s separated by 1440 s of rest was applied to the battery (Figure 6a). The OCV is determined by the voltage at the end of the rest process, as shown in Figure 6b. We carried out three pulse tests and collected the OCV every 10% SOC of each experiment. The average OCV as a function of SOC is illustrated in Figure 7. The nonlinearly characteristic was clearly observed between 0–30% SOC.
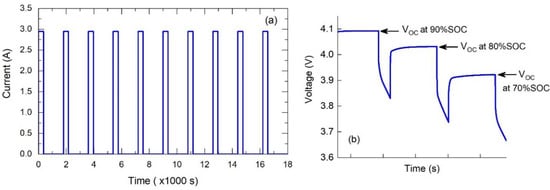
Figure 6.
(a) Battery pulse discharge test profile; (b) open-circuit voltage for each SOC.
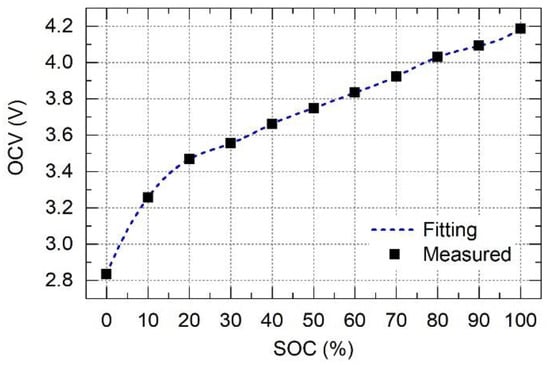
Figure 7.
Estimated open circuit voltage.
4.1.2. Constant Current Discharge Test
This test is used to simulate the case of constant usage, which may suitable for the electronic device applications. The continuous discharge load with a constant current of 3 A was used in the test. The battery was fully charged to 4.2 V and discharged at 2.5 V (cut-off voltage).
4.1.3. Dynamic Discharge Tests for EVs
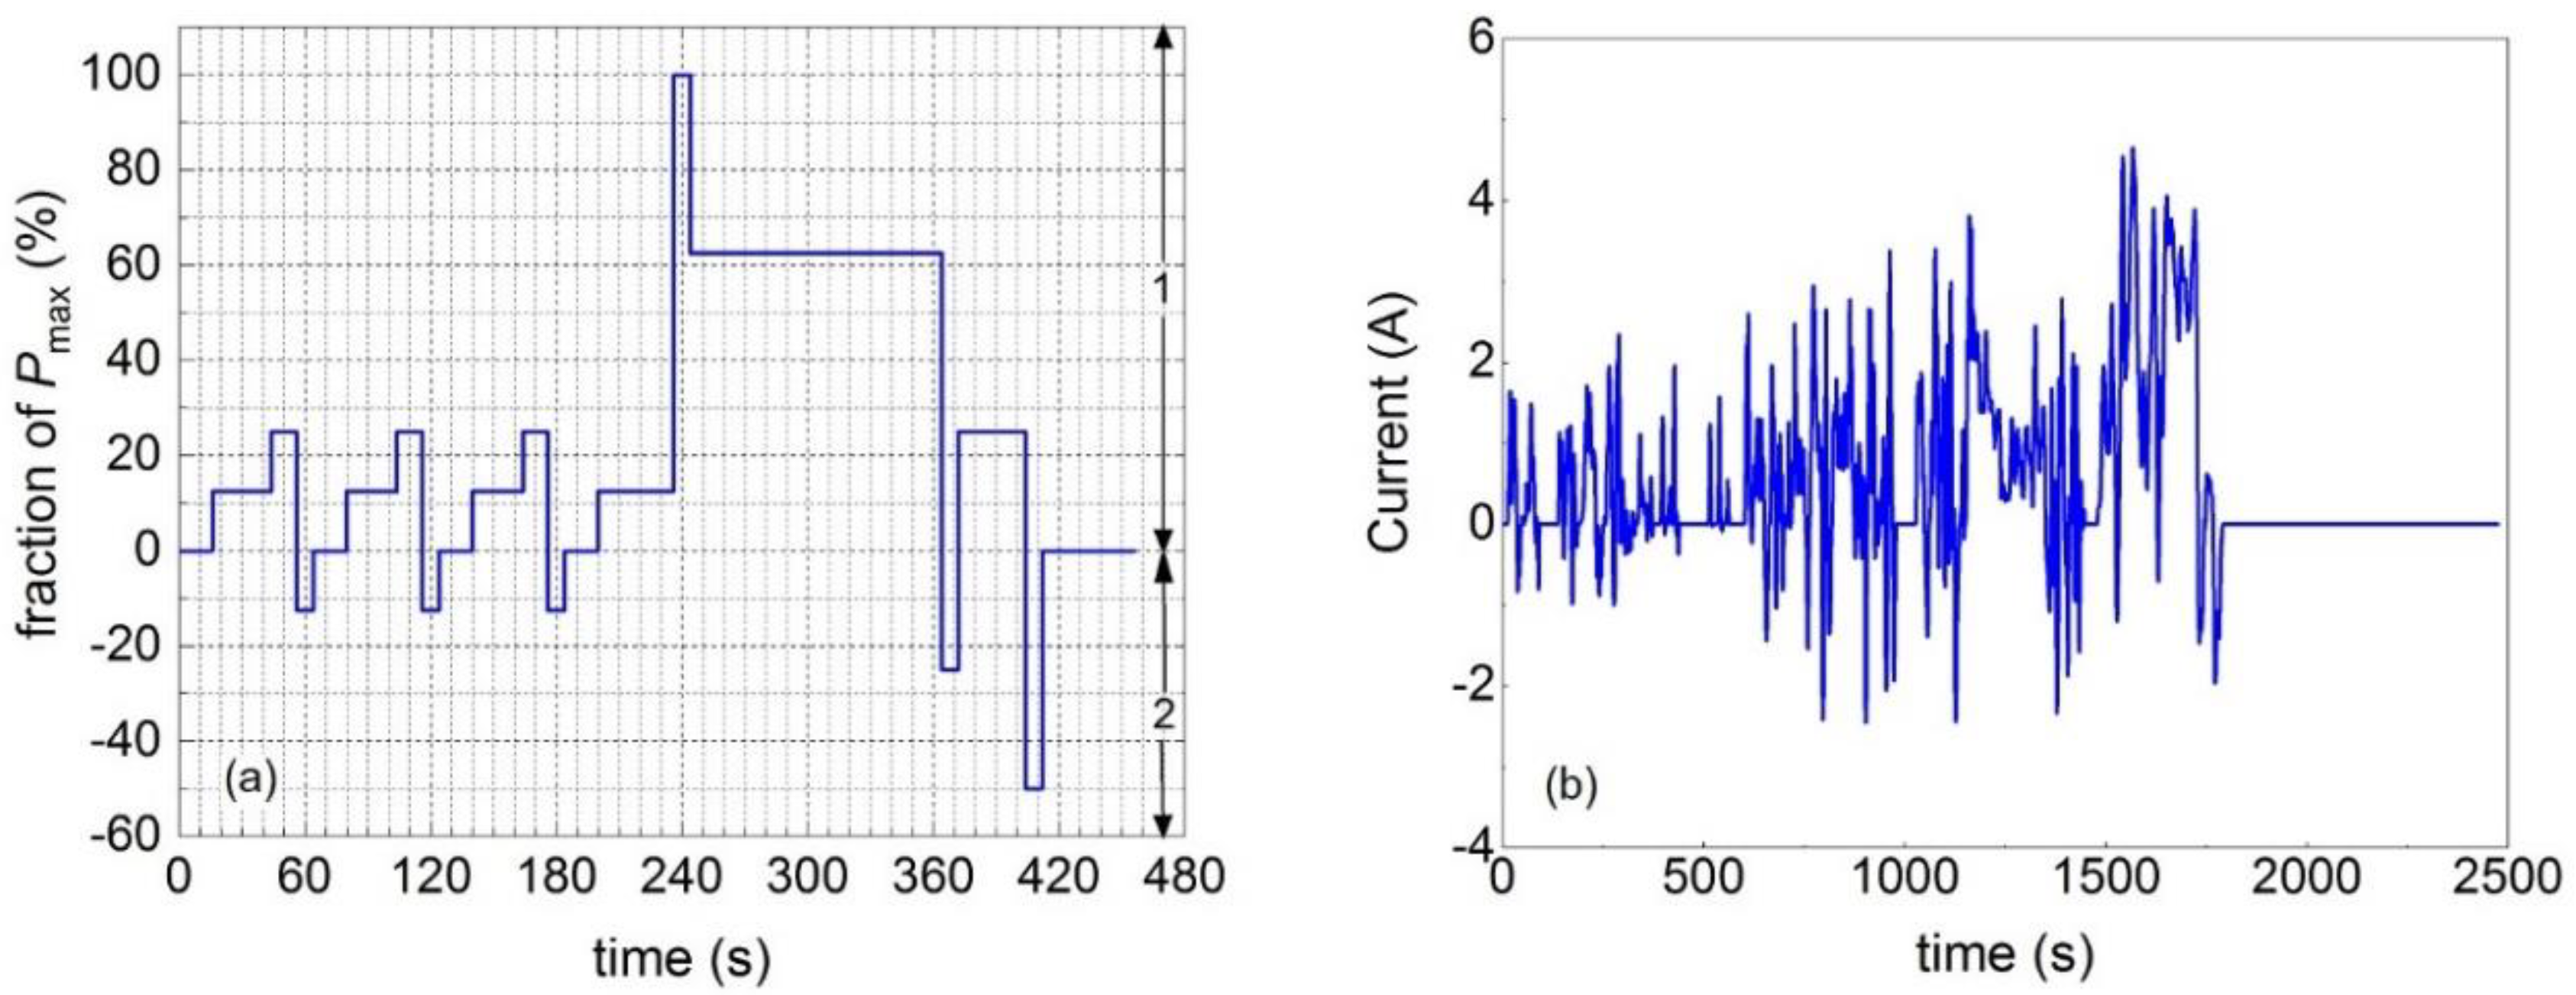
The ISO and WLTP (class 3) profiles (Figure 8) were taken into account in this work. The tests are the global standard tests used to determine the performance of Li-ion battery packs and the systems used in the electrically propelled road vehicles. The process starts with the ISO test, followed by WLTP test. Since the tests consist of charging and discharging procedures, ISO was initiated at 80% SOC in order to prevent the over-voltage condition. The ISO profile is demonstrated in Figure 8a. Once the ISO dynamic test is completed, the battery rests for at least 30 min before proceeding with the WLTP procedure (Figure 8b).

Figure 8.
Dynamic test profiles for (a) ISO12405-2:2012 (profile B) [36] and (b) WLTP (class 3) [37]. The numbers 1 and 2 on the right-hand side in (a) represent the discharge and charge processes, respectively.
4.2. Identify the Model Parameters
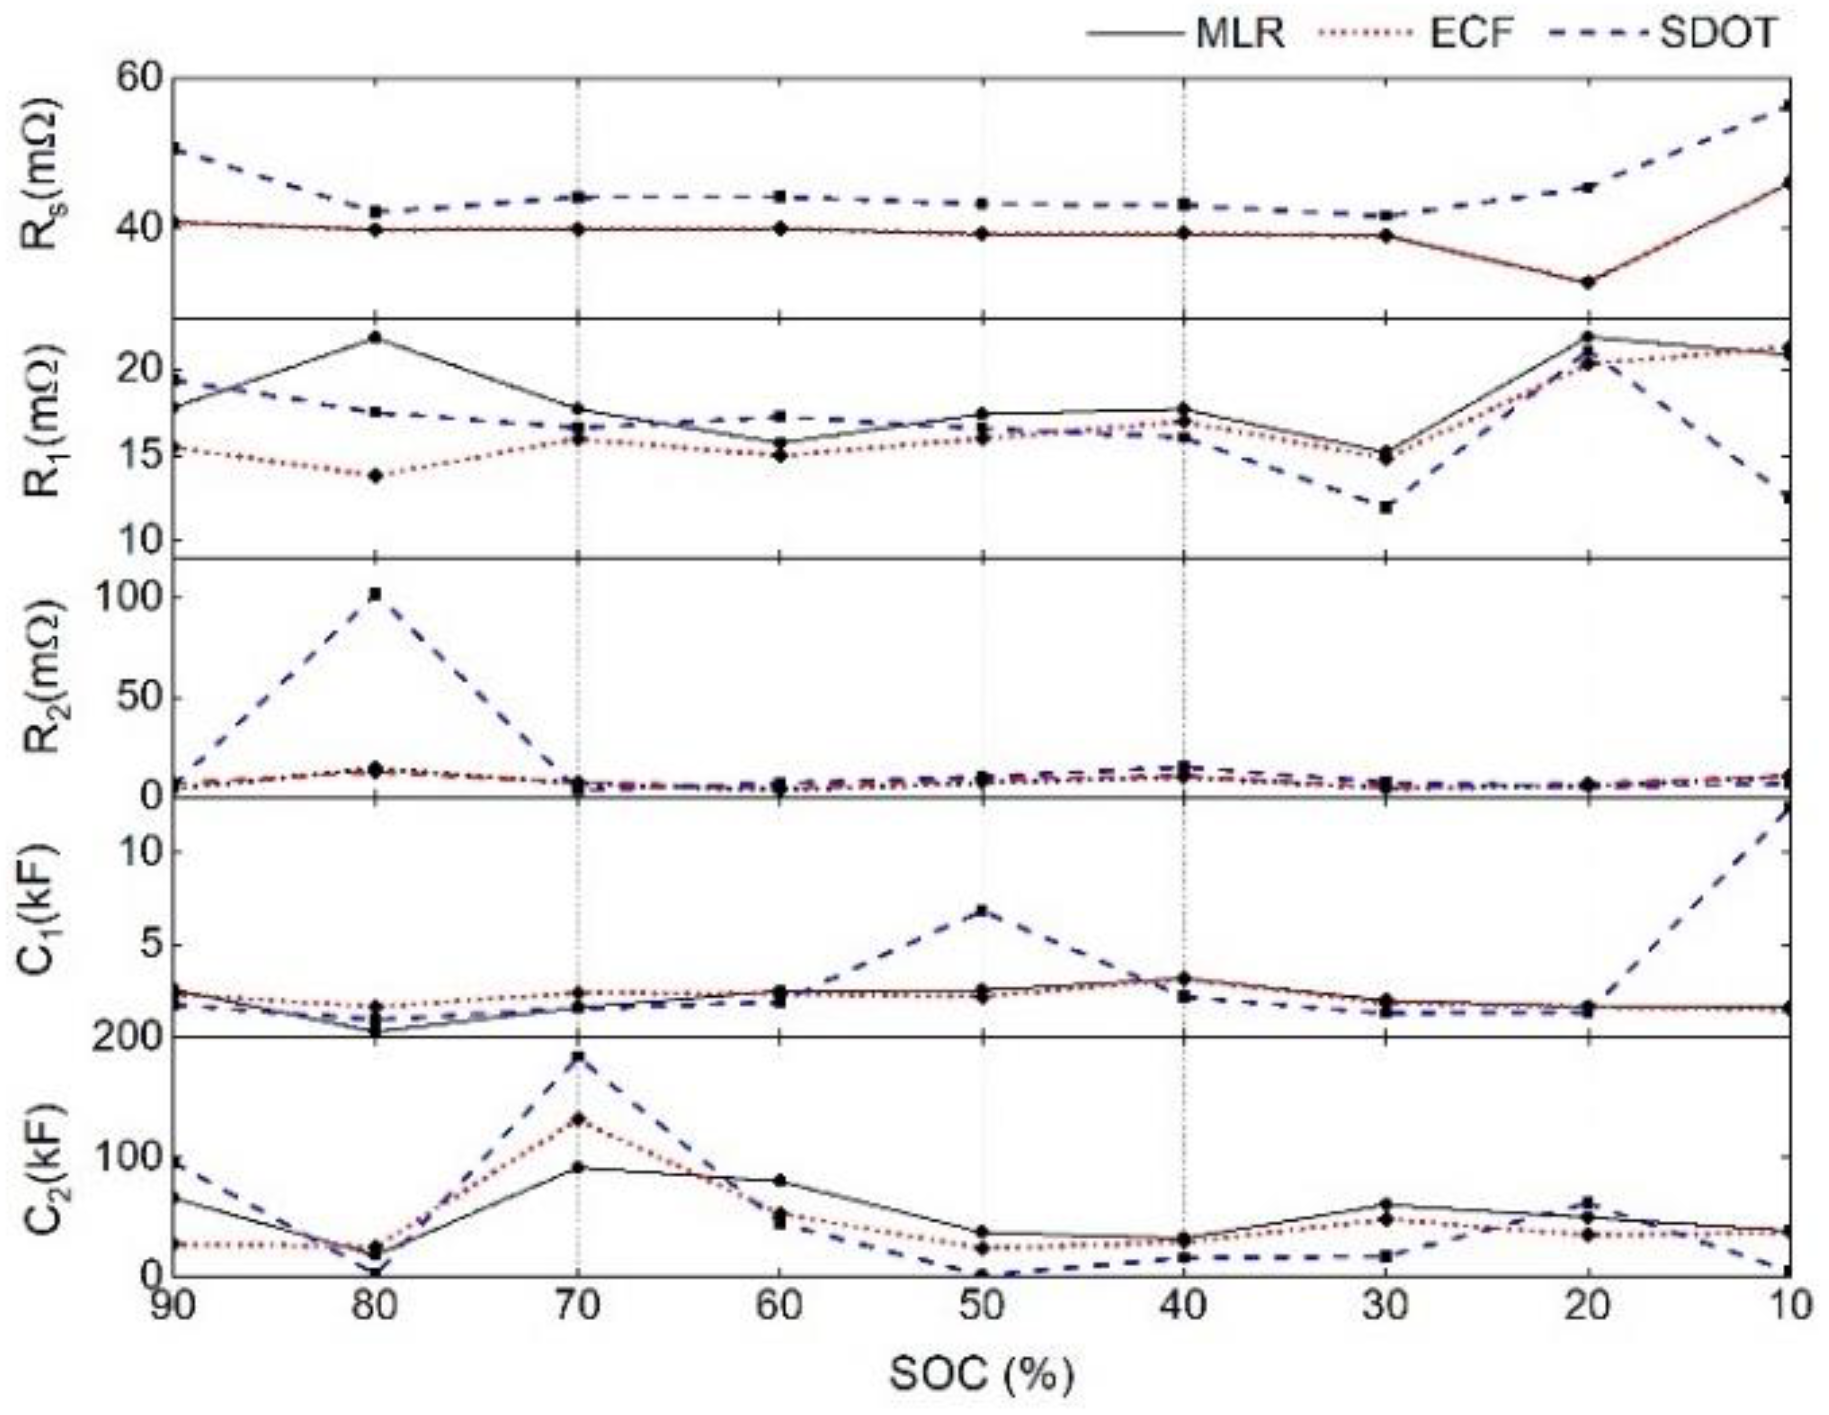
To determine the (Rs, R1, R2, C1, C2) parameters for ECM, the OCV for each SOC is calculated based on the pulse test experiment. The estimated model parameters obtained from MLR, ECF and SDOT are shown in Figure 9. The internal resistance, Rs, parameter of MLR and ECF are exactly the same, because both are calculated using the voltage response from the pulse test data, but SDOT has a different scheme. This is the reason why the estimated parameters from SDOT are different. The resistance, Rs and R1, tends to increase at low SOC (0–30%). For the polarization parameters, the large increase in the polarization resistance (Ri) observed in SDOT can be compensated by the decrease in the polarization capacitance (Ci) and vice versa. For example, the large value of R2 at 80% SOC or the significant decrease in at 10% SOC are compensated by a small value of C2 or a large capacitance, C1, respectively. One interesting point is that all the parameters are nearly constant in between 30–60% SOC, but a dramatic change is observed at 0–30% SOC and 70–100% SOC when the nonlinearity behavior is dominated in the OCV–SOC relationship. The estimated terminal voltage of the battery for the pulse test and its relative error are demonstrated in Figure 10. The relative error is a difference between the simulation and experiment. It is found that the predictions fit very well with the experimental data, especially in the case of SDOT. The relative error is almost zero; a large error is observed only at a low SOC (less than 10% SOC).
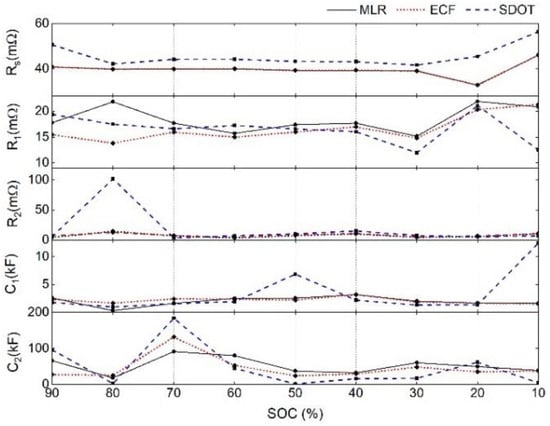
Figure 9.
The estimated parameters of the second-order RC ECM for MLR (solid), ECF (dashed) and SDOT (dotted). The symbols represent the experimental data and the lines are the linear interpolation of the experimental data.
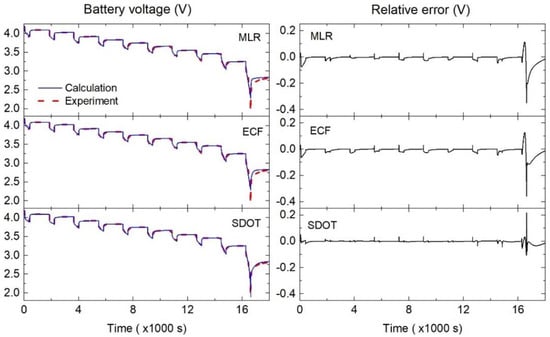
Figure 10.
The battery terminal voltage of the pulse discharge test and the relative error for three estimations.
4.3. Simulated Terminal Voltage for the Dynamic Discharge Tests
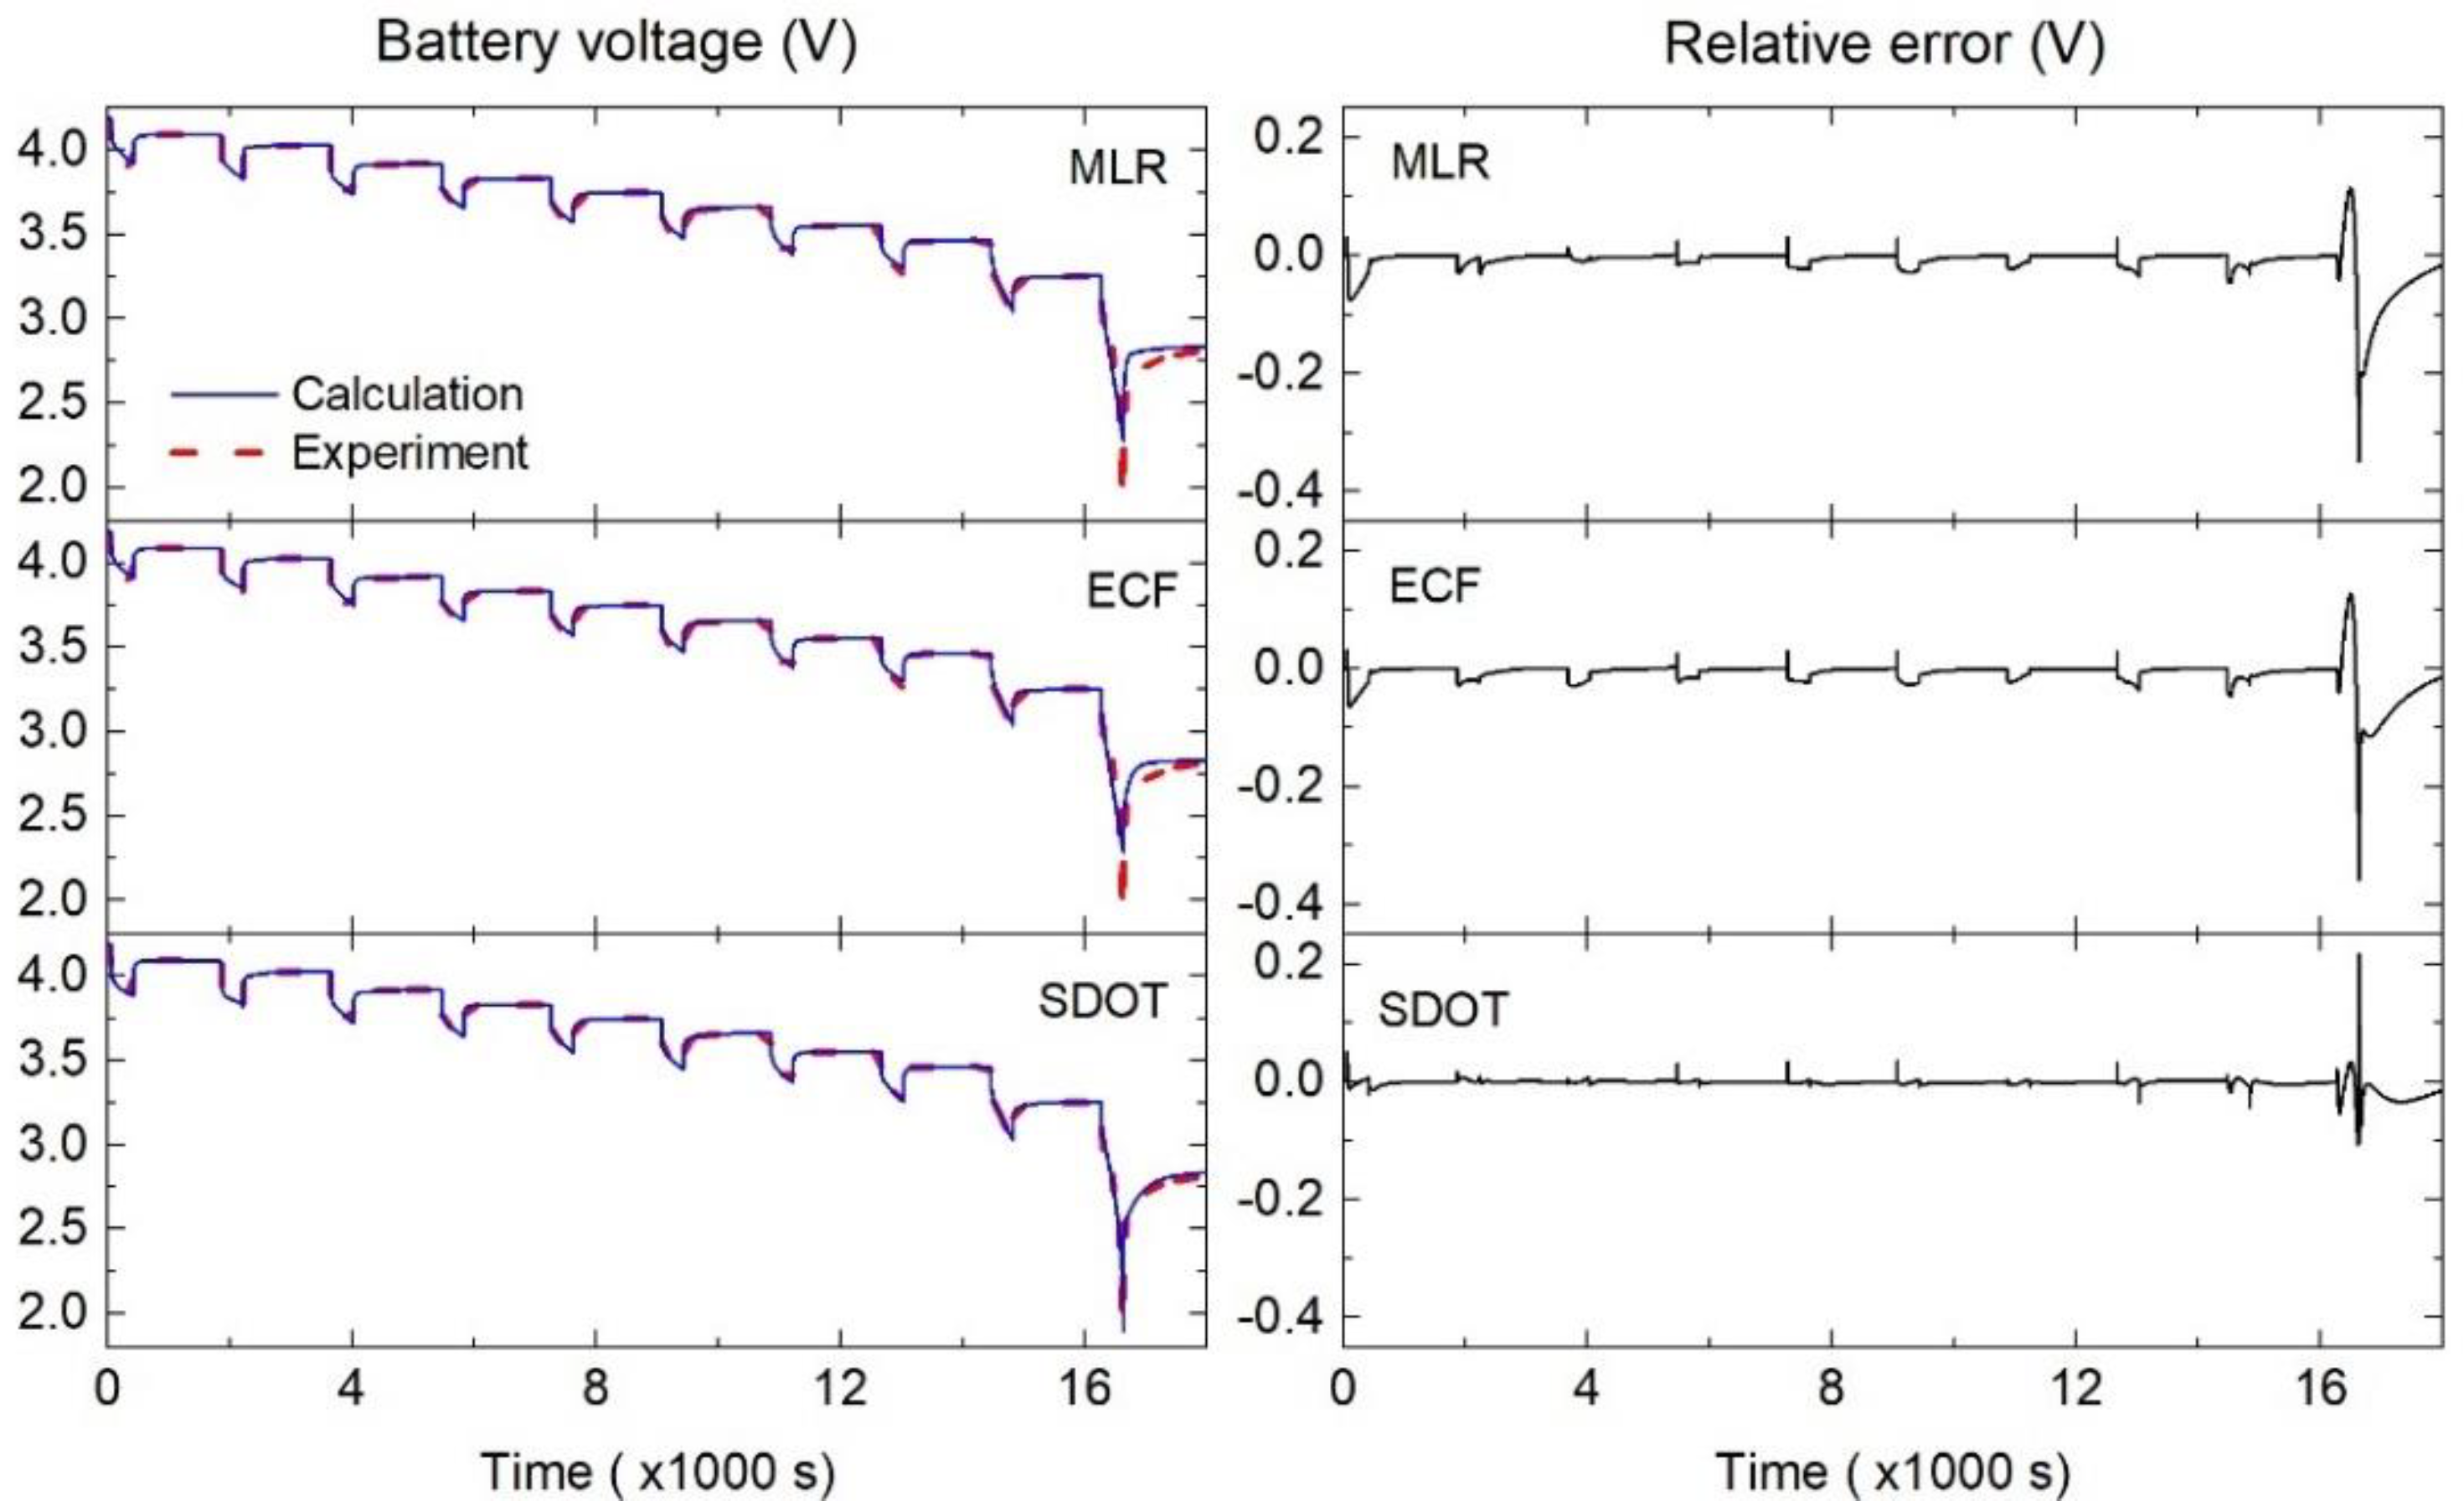
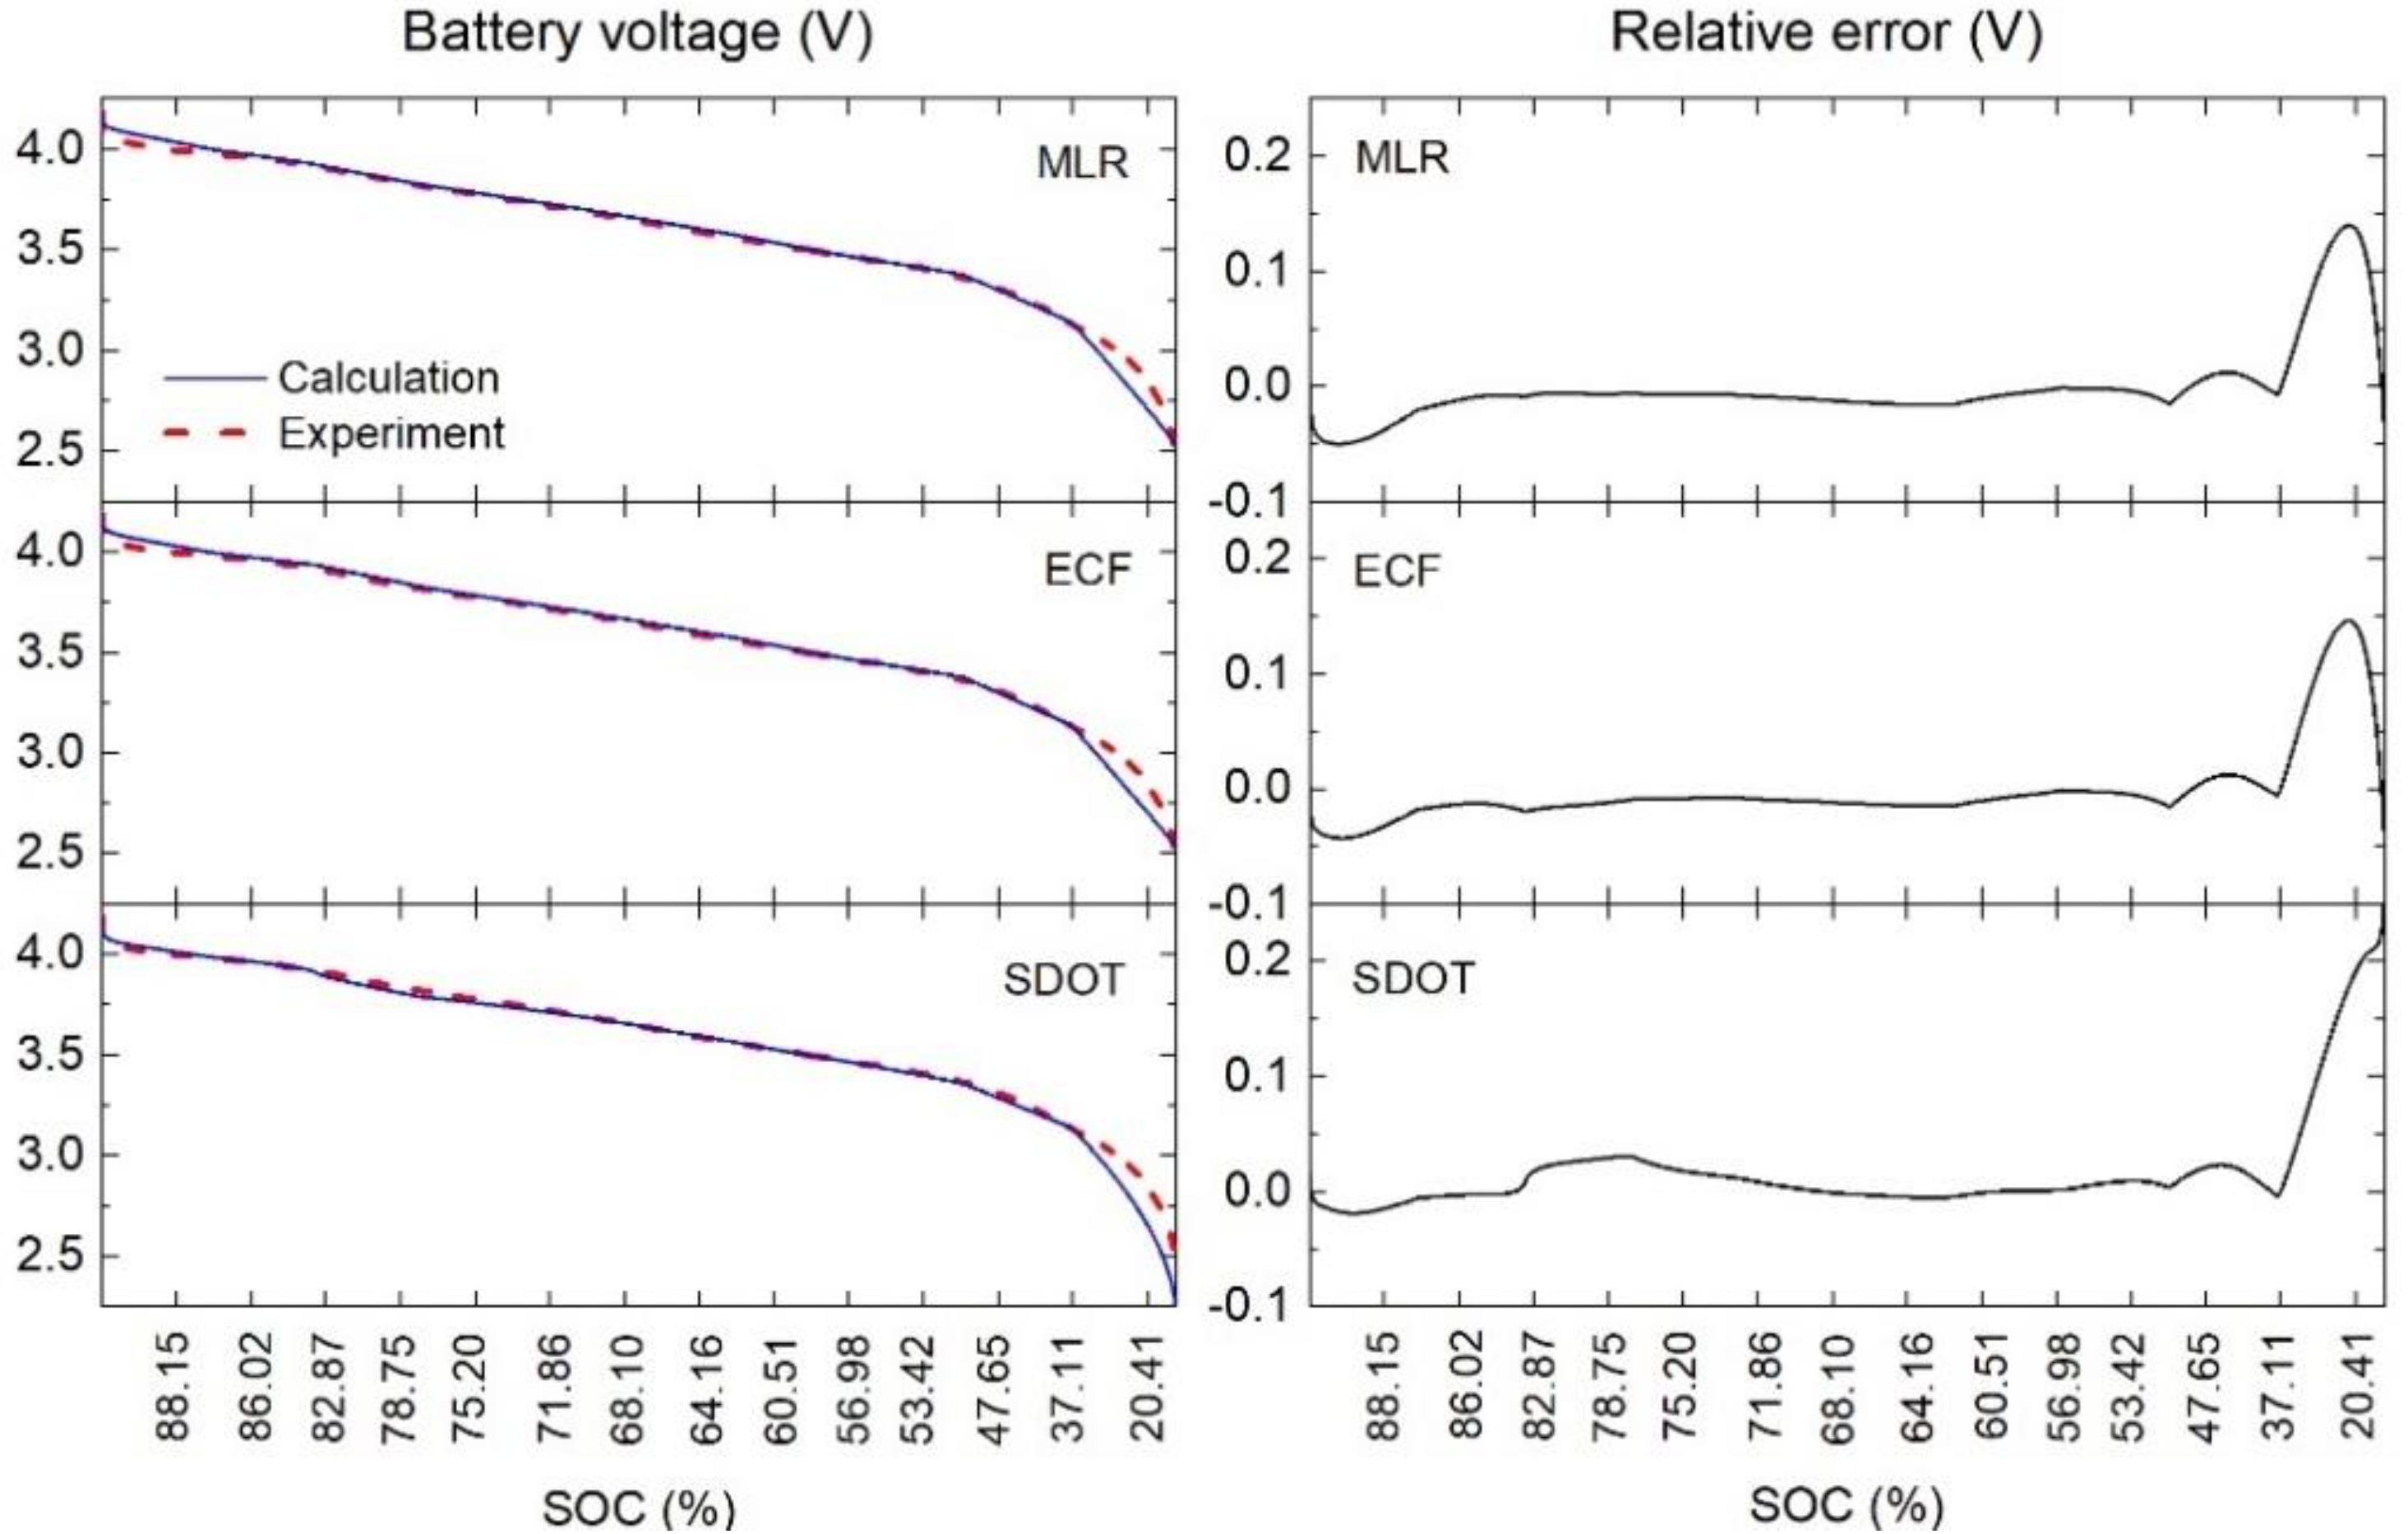
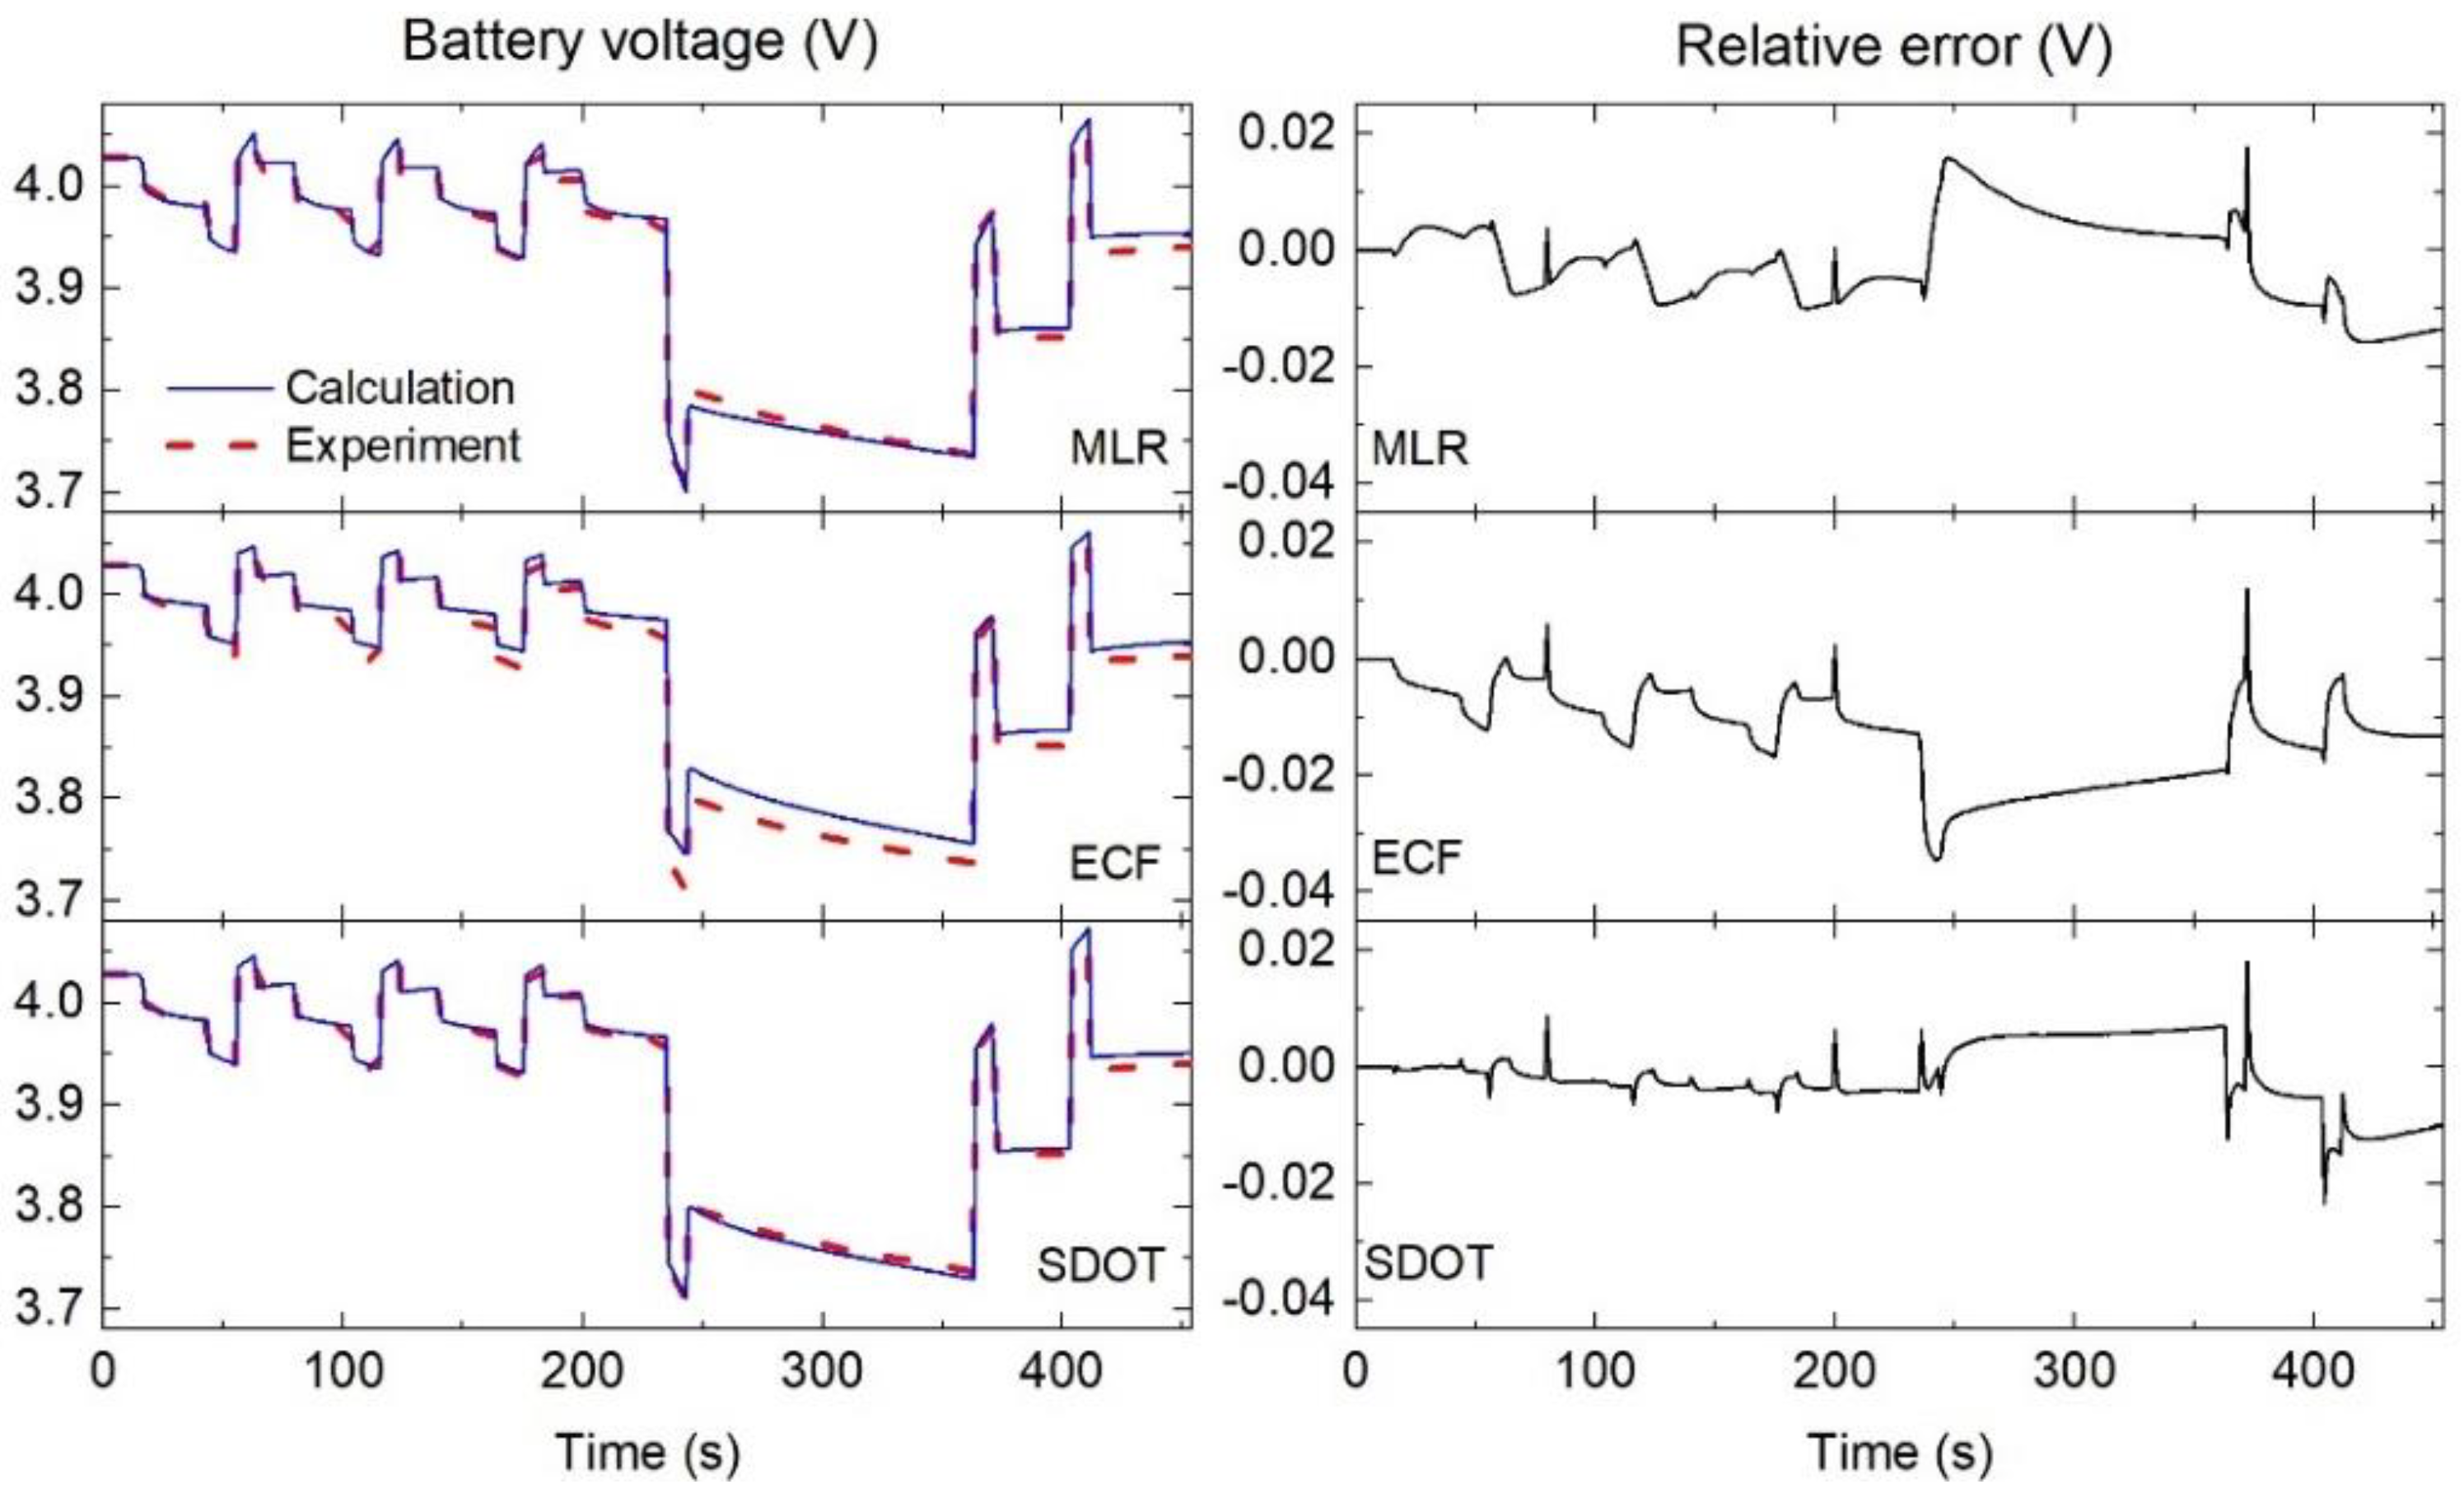
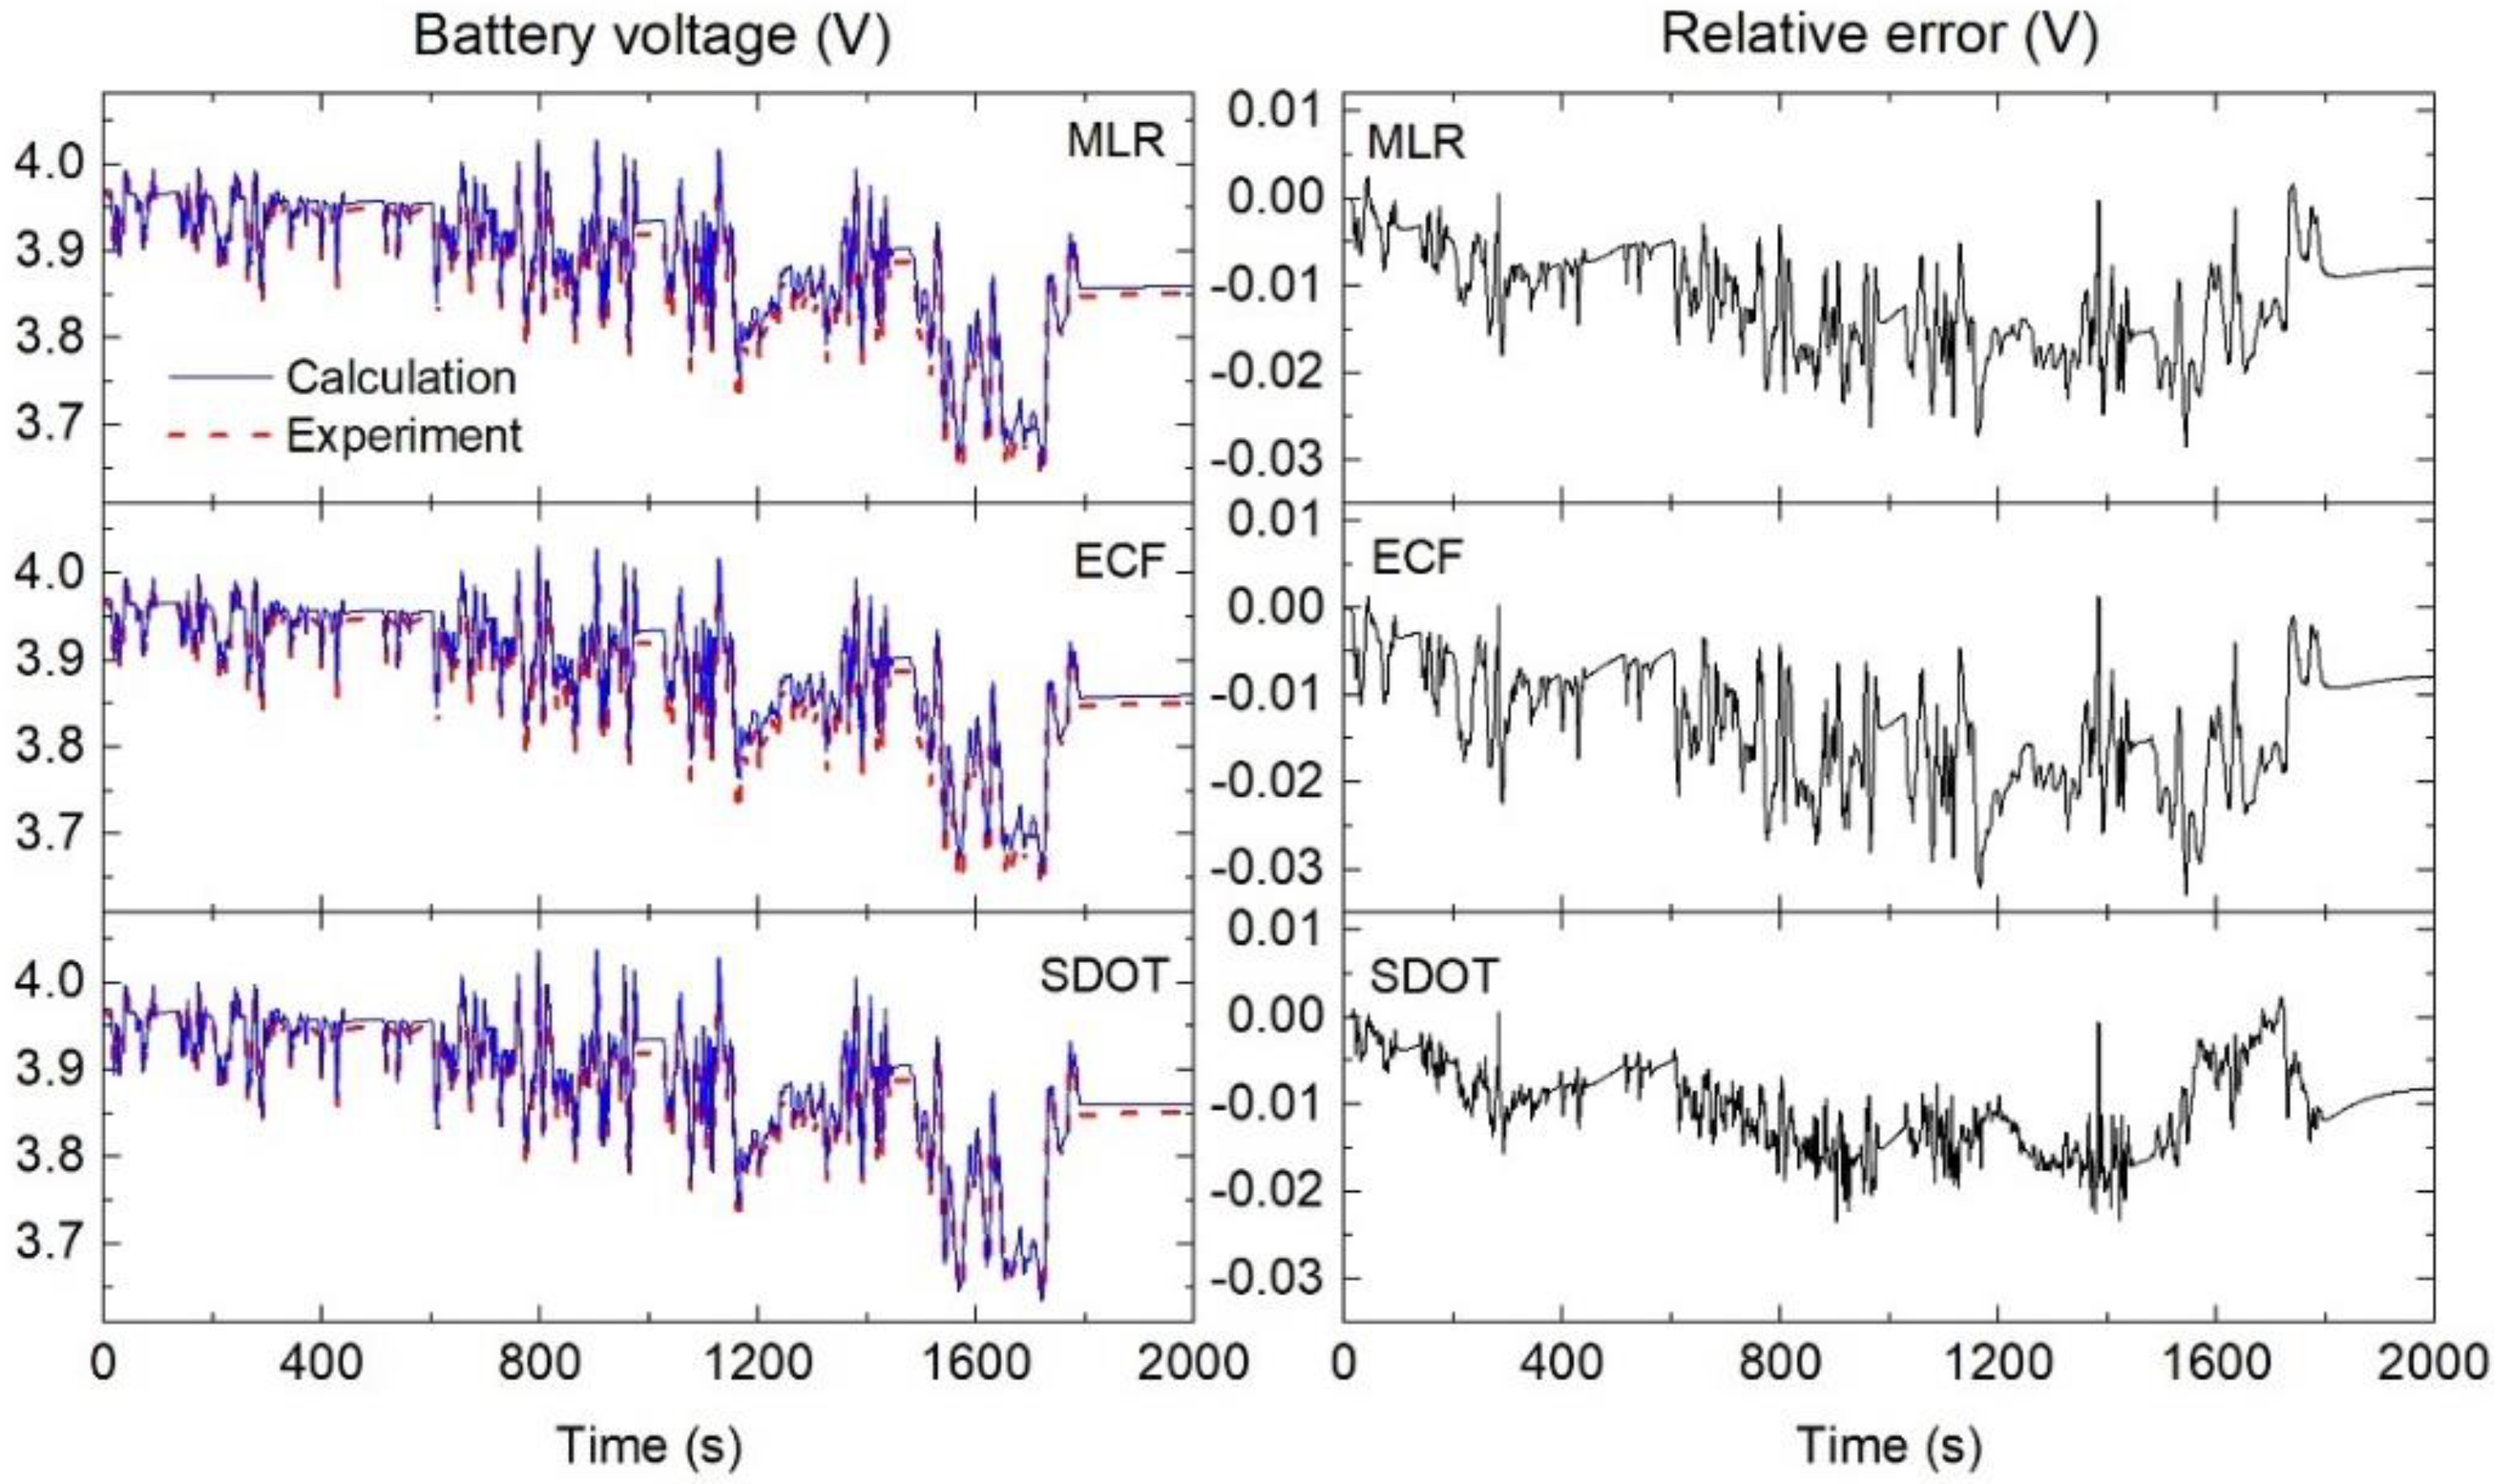
According to the three different sets of the model parameters estimated from three different methods (MLR, ECF and SDOT), the battery terminal voltage of the three dynamic discharge tests was calculated and compared to the measured data, as shown in Figure 11, Figure 12 and Figure 13. For the CC test, the calculated voltage of the battery fits very well with the experimental response, except at a very low SOC due to the nonlinear performance. In fact, this low SOC range is normally not used in EVs. However, in order to improve the model, the nonlinear part can be considered separately from the linear part by introducing the higher-order RC or fractional-order RC. The relative error at a low SOC dramatically increases to about 0.15 V for MLR and ECF, and 0.20 for SDOT. For the specific test of EVs, the estimated battery voltage of SDOT is in good agreement with the experiment and presents a smaller relative error compared to the other methods. A large difference between the ECF prediction and measurement is observed, evidently in between 250 s and 350 s, corresponding to a long period of a constant discharge process (Figure 8a). Similar to ISO, SDOT is the best fit in the case of WLTP.
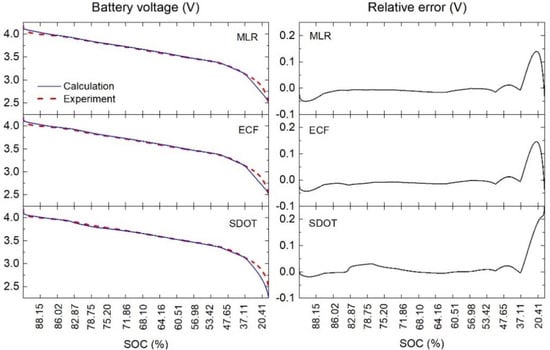
Figure 11.
The battery terminal voltage of the CC discharge test and the relative error for the three estimations.
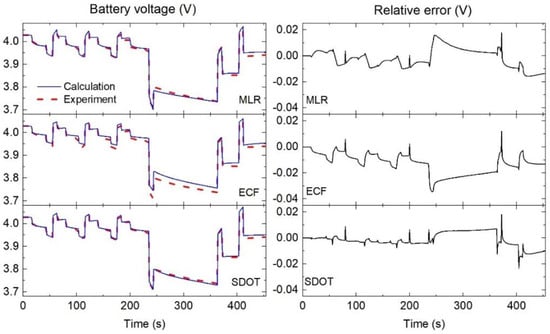
Figure 12.
The battery terminal voltage of the ISO dynamic test and the relative error for the three estimations.
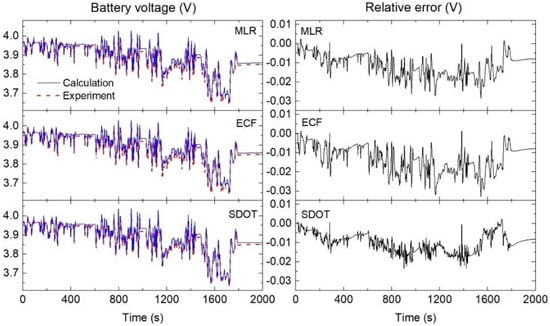
Figure 13.
The battery terminal voltage of the WLTP dynamic test and the relative error for the three estimations.
To validate the proposed models, the mean absolute error (MAE) and the root mean square error (RMSE) are calculated by the following equations:
where N is the sampling number, Vi is the measured voltage and is the estimated voltage.
Figure 14 shows the MAE and RMSE of the measured voltage under the four discharge tests calculated by three different models. The results can be summarized as follows:
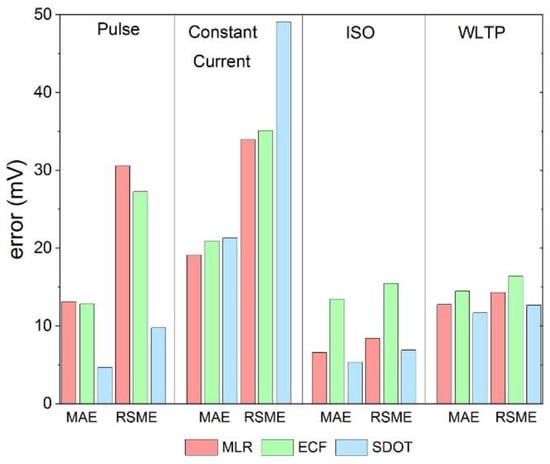
Figure 14.
The mean absolute error (MAE) and root mean square error (RMSE) obtained from the three parameter estimators.
- For the pulse test, the MAE (RMSE) of the predicted voltage is 12.8 (31.5), 12.2 (27.9) and 4.2 (10.1) mV for MLR, ECF and SDOT, respectively. The errors of SDOT are around three times less than the other two methods, but it took a longer time to calculate.
- For the CC test, the MAEs of the three methods are comparable (19.1 mV(MLR) 20.2 mV(ECF) 21.9 mV(SDOT)), but the RMSE value of SDOT is obviously higher than the others (34.2 mV(MLR) 35.3 mV(ECF) 47.8 mV(SDOT)). This excess RMSE of SDOT is caused by a large error between the calculated and measured voltages at a low SOC when the nonlinearity is dominated (see Figure 10).
- The results under the dynamic ISO and WLTP discharge tests have a similar tendency. The SDOT is the best method providing the smallest error, followed by the MLR and ECF estimations, respectively. As can be seen in the figure, MLR and SDOT produce a comparable error, for example, the MAE for ISO is 6.1 mV (4.5 mV) and WLTP is 11.4 mV (10.2 mV) for MLR (SDOT).
From all the results shown above, it can be seen that the characteristics of the discharge or use of the battery affect the choice of parameter identification and type of equivalent circuit model. The linearity of the battery performance, SOC of the battery, and computing time should be considered in order to obtain a suitable model for the applications.
5. Conclusions
This paper presents the parameter identification of the second-order RC ECM using three different methods, including MLR, ECF and SDOT algorithms. These three proposed methods vary in complexity and mathematical background. MLR is statistically based, ECF is mathematically fitting, and SDOT is an optimization technique. The accuracy of the models was compared by calculating the errors (MAE and RSME) between the measured and estimated terminal voltages. The LG18650MH1 Li-ion battery was performed with four dynamic experiments. The pulse test was operated in order to establish the OCV–SOC relationship. The voltage response was collected for every 10% SOC and used to find the model parameters (Rs, R1, R2, C1, C2). SDOT provides the best fit in the battery voltage of the pulse test. Using the estimated parameters, the CC discharge test, ISO and WLTP profiles were simulated and compared to the experimental response. For the CC discharge test, the simulation fits very well with the experiment, except at a low SOC when the OCV–SOC relationship exhibits the nonlinear characteristic. Additionally, it is found that the MAE of three estimators under the CC discharge test is comparable. This means that under the constant current usage, such as electronic device application, the identification is not the important key. The MLR and ECF are less complicated than SDOT, but can provide the same accuracy as SDOT. The situation is different in EV discharge tests (ISO and WLTP), in which the SDOT offers the best fit with a small margin of error compared to MLR and ECF. The MAE and RSME of ECF are twice as high as SDOT, in the case of the ISO procedure. However, the higher the accuracy, the heavier the computation burden. Calculations using SDOT took a long time, so it is probably not suitable for EV application. In contrast, MLR calculation is faster and is not complicated. Although the accuracy of MLR is lower than that of SDOT, it can be improved by increasing the rest time between pulses or reducing the SOC step, as these two parameters can affect the OCV approximation.
Author Contributions
Conceptualization, T.P.; methodology, T.P.; formal analysis, K.S. and P.P.; investigation, T.P., K.S. and P.P.; writing—original draft preparation, K.S.; writing—review and editing, T.P. and P.P. All authors have read and agreed to the published version of the manuscript.
Funding
K.S. thanks the Fundamental Fund 2565 (Ubon Ratchathani University) for the financial support.
Institutional Review Board Statement
Not applicable.
Informed Consent Statement
Not applicable.
Data Availability Statement
Not applicable.
Acknowledgments
The authors thank Sirapop Japa, Sutad Paroebram, Affan Waesu and Aekarat Bootsiri for their technical support.
Conflicts of Interest
The authors declare no conflict of interest.
References
- Böttiger, M.; Paulitschke, M.; Bocklisch, T. Systematic Experimental Pulse Test Investigation for Parameter Identification of an Equivalent Based Lithium-Ion Battery Model. Energy Procedia 2017, 135, 337–346. [Google Scholar] [CrossRef]
- Masoudinejad, M. Open-Loop Dynamic Modeling of Low-Budget Batteries with Low-Power Loads. Batteries 2020, 6, 50. [Google Scholar] [CrossRef]
- Yong, J.Y.; Ramachandaramurthy, V.K.; Tan, K.M.; Mithulananthan, N. A Review on the State-of-the-Art Technologies of Electric Vehicle, Its Impacts and Prospects. Renew. Sustain. Energy Rev. 2015, 49, 365–385. [Google Scholar] [CrossRef]
- Cuma, M.U.; Koroglu, T. A Comprehensive Review on Estimation Strategies Used in Hybrid and Battery Electric Vehicles. Renew. Sustain. Energy Rev. 2015, 42, 517–531. [Google Scholar] [CrossRef]
- Mayer, B.; Schier, M.; Friedrich, H.E. Stand-Alone Battery Thermal Management for Fast Charging of Electric Two Wheelers—Integrated Busbar Cooling. World Electr. Veh. J. 2019, 10, 37. [Google Scholar] [CrossRef] [Green Version]
- Wei, P.; Fan, M.Q.; Chen, H.C.; Yang, X.R.; Wu, H.M.; Chen, J.; Li, T.; Zeng, L.W.; Li, C.M.; Ju, Q.J.; et al. Enhanced Cycle Performance of Hollow Polyaniline Sphere/Sulfur Composite in Comparison with Pure Sulfur for Lithium–Sulfur Batteries. Renew. Energy 2016, 86, 148–153. [Google Scholar] [CrossRef]
- Ruiz, V.; Pfrang, A.; Kriston, A.; Omar, N.; Van den Bossche, P.; Boon-Brett, L. A Review of International Abuse Testing Standards and Regulations for Lithium Ion Batteries in Electric and Hybrid Electric Vehicles. Renew. Sustain. Energy Rev. 2018, 81, 1427–1452. [Google Scholar] [CrossRef]
- Madani, S.; Schaltz, E.; Knudsen Kær, S. An Electrical Equivalent Circuit Model of a Lithium Titanate Oxide Battery. Batteries 2019, 5, 31. [Google Scholar] [CrossRef] [Green Version]
- Baczyńska, A.; Niewiadomski, W.; Gonçalves, A.; Almeida, P.; Luís, R. Li-NMC Batteries Model Evaluation with Experimental Data for Electric Vehicle Application. Batteries 2018, 4, 11. [Google Scholar] [CrossRef] [Green Version]
- Meng, J.; Stroe, D.-I.; Ricco, M.; Luo, G.; Teodorescu, R. A Simplified Model-Based State-of-Charge Estimation Approach for Lithium-Ion Battery with Dynamic Linear Model. IEEE Trans. Ind. Electron. 2019, 66, 7717–7727. [Google Scholar] [CrossRef] [Green Version]
- Jiang, J.; Liang, Y.; Ju, Q.; Zhang, L.; Zhang, W.; Zhang, C. An Equivalent Circuit Model for Lithium-Sulfur Batteries. Energy Procedia 2017, 105, 3533–3538. [Google Scholar] [CrossRef]
- Lu, L.; Han, X.; Li, J.; Hua, J.; Ouyang, M. A Review on the Key Issues for Lithium-Ion Battery Management in Electric Vehicles. J. Power Sources 2013, 226, 272–288. [Google Scholar] [CrossRef]
- Technologies in Battery Management System—A Review. Available online: http://www.ijstr.org/final-print/feb2020/Technologies-In-Battery-Management-System-a-Review.pdf (accessed on 6 February 2022).
- Li, X.; Li, J.; Xu, L.; Ouyang, M.; Han, X.; Lu, L.; Lin, C. Online Management of Lithium-Ion Battery Based on Time-Triggered Controller Area Network for Fuel-Cell Hybrid Vehicle Applications. J. Power Sources 2010, 195, 3338–3343. [Google Scholar] [CrossRef]
- Yang, N.; Zhang, X.; Li, G. State of Charge Estimation for Pulse Discharge of a LiFePO4 Battery by a Revised Ah Counting. Electrochim. Acta 2015, 151, 63–71. [Google Scholar] [CrossRef]
- How, D.N.T.; Hannan, M.A.; Hossain Lipu, M.S.; Ker, P.J. State of Charge Estimation for Lithium-Ion Batteries Using Model-Based and Data-Driven Methods: A Review. IEEE Access 2019, 7, 136116. [Google Scholar] [CrossRef]
- Yang, F.; Li, W.; Li, C.; Miao, Q. State-of-Charge Estimation of Lithium-Ion Batteries Based on Gated Recurrent Neural Network. Energy 2019, 175, 66–75. [Google Scholar] [CrossRef]
- Chen, L.; Wang, Z.; Lu, Z.; Li, J.; Ji, B.; Wei, H.; Pan, H. A Novel State-of-Charge Estimation Method of Lithium-Ion Batteries Combining the Grey Model and Genetic Algorithms. IEEE Trans. Power Electron. 2018, 33, 8797–8807. [Google Scholar] [CrossRef] [Green Version]
- Chandran, V.; Patil, C.K.; Karthick, A.; Ganeshaperumal, D.; Rahim, R.; Ghosh, A. State of Charge Estimation of Lithium-Ion Battery for Electric Vehicles Using Machine Learning Algorithms. World Electr. Veh. J. 2021, 12, 38. [Google Scholar] [CrossRef]
- Klein, R.; Chaturvedi, N.A.; Christensen, J.; Ahmed, J.; Findeisen, R.; Kojic, A. Electrochemical Model Based Observer Design for a Lithium-Ion Battery. IEEE Trans. Control Syst. Technol. 2013, 21, 289–301. [Google Scholar] [CrossRef]
- Zhang, X.; Lu, J.; Yuan, S.; Yang, J.; Zhou, X. A Novel Method for Identification of Lithium-Ion Battery Equivalent Circuit Model Parameters Considering Electrochemical Properties. J. Power Sources 2017, 345, 21–29. [Google Scholar] [CrossRef]
- Zhou, Y.; Huang, M. On-Board Capacity Estimation of Lithium-Ion Batteries Based on Charge Phase. J. Electr. Eng. Technol. 2018, 13, 733–741. [Google Scholar]
- Uddin, K.; Perera, S.; Widanage, W.; Marco, J. Characterising Li-Ion Battery Degradation through the Identification of Perturbations in Electrochemical Battery Models. World Electr. Veh. J. 2015, 7, 76–84. [Google Scholar] [CrossRef] [Green Version]
- Wang, J.; Zhang, L.; Xu, D.; Zhang, P.; Zhang, G. A Simplified Fractional Order Equivalent Circuit Model and Adaptive Online Parameter Identification Method for Lithium-Ion Batteries. Math. Probl. Eng. 2019, 2019, 6019236. [Google Scholar] [CrossRef]
- Zhang, Q.; Shang, Y.; Li, Y.; Cui, N.; Duan, B.; Zhang, C. A Novel Fractional Variable-Order Equivalent Circuit Model and Parameter Identification of Electric Vehicle Li-Ion Batteries. ISA Trans. 2020, 97, 448–457. [Google Scholar] [CrossRef]
- He, H.; Xiong, R.; Guo, H.; Li, S. Comparison Study on the Battery Models Used for the Energy Management of Batteries in Electric Vehicles. Energy Convers. Manag. 2012, 64, 113–121. [Google Scholar] [CrossRef]
- Zhang, J.; Wang, P.; Liu, Y.; Cheng, Z. Variable-Order Equivalent Circuit Modeling and State of Charge Estimation of Lithium-Ion Battery Based on Electrochemical Impedance Spectroscopy. Energies 2021, 14, 769. [Google Scholar] [CrossRef]
- De Sutter, L.; Nikolian, A.; Timmermans, J.-M.; Omar, N.; Van Mierlo, J. Online Multi Chemistry SoC Estimation Technique Using Data Driven Battery Model Parameter Estimation. World Electr. Veh. J. 2018, 9, 16. [Google Scholar] [CrossRef] [Green Version]
- Vilsen, S.B.; Stroe, D.-I. Battery State-of-Health Modelling by Multiple Linear Regression. J. Clean. Prod. 2021, 290, 125700. [Google Scholar] [CrossRef]
- Zhang, R.; Xia, B.; Li, B.; Cao, L.; Lai, Y.; Zheng, W.; Wang, H.; Wang, W.; Wang, M. A Study on the Open Circuit Voltage and State of Charge Characterization of High Capacity Lithium-Ion Battery under Different Temperature. Energies 2018, 11, 2408. [Google Scholar] [CrossRef] [Green Version]
- Tudoroiu, R.-E.; Zaheeruddin, M.; Tudoroiu, N.; Radu, S.-M. SOC Estimation of a Rechargeable Li-Ion Battery Used in Fuel Cell Hybrid Electric Vehicles—Comparative Study of Accuracy and Robustness Performance Based on Statistical Criteria. Part II: SOC Estimators. Batteries 2020, 6, 41. [Google Scholar] [CrossRef]
- Wen, F.; Duan, B.; Zhang, C.; Zhu, R.; Shang, Y.; Zhang, J. High-Accuracy Parameter Identification Method for Equivalent-Circuit Models of Lithium-Ion Batteries Based on the Stochastic Theory Response Reconstruction. Electronics 2019, 8, 834. [Google Scholar] [CrossRef] [Green Version]
- Chen, Z.; Mi, C.C.; Fu, Y.; Xu, J.; Gong, X. Online Battery State of Health Estimation Based on Genetic Algorithm for Electric and Hybrid Vehicle Applications. J. Power Sources 2013, 240, 184–192. [Google Scholar] [CrossRef]
- Xia, B.; Lao, Z.; Zhang, R.; Tian, Y.; Chen, G.; Sun, Z.; Wang, W.; Sun, W.; Lai, Y.; Wang, M.; et al. Online Parameter Identification and State of Charge Estimation of Lithium-Ion Batteries Based on Forgetting Factor Recursive Least Squares and Nonlinear Kalman Filter. Energies 2017, 11, 3. [Google Scholar] [CrossRef] [Green Version]
- Sun, X.; Ji, J.; Ren, B.; Xie, C.; Yan, D. Adaptive Forgetting Factor Recursive Least Square Algorithm for Online Identification of Equivalent Circuit Model Parameters of a Lithium-Ion Battery. Energies 2019, 12, 2242. [Google Scholar] [CrossRef] [Green Version]
- BSI Standard Publication. Electrically Propelled Road Vehicles—Test Specification for Lithium-Ion Traction Battery Packs and Systems—Part 2: High-Energy Applications; BSI Standards Limited 2012: London, UK, 2012. [Google Scholar]
- United Nations. Addendum 15: Global Technical Regulation No. 15—Worldwide Harmonized Light Vehicles Test Procedure; UNECE: Geneva, Switzerland, 2014. [Google Scholar]


Publisher’s Note: MDPI stays neutral with regard to jurisdictional claims in published maps and institutional affiliations. |
© 2022 by the authors. Licensee MDPI, Basel, Switzerland. This article is an open access article distributed under the terms and conditions of the Creative Commons Attribution (CC BY) license (https://creativecommons.org/licenses/by/4.0/).