Abstract
The primary objective of a hybrid electric vehicle (HEV) is to optimize the energy consumption of the automotive powertrain. This optimization has to be applied while respecting the operating conditions of the battery. Otherwise, there is a risk of compromising the battery life and thermal runaway that may result from excessive power transfer across the battery. Such considerations are critical if factoring in the low battery capacity and the passive battery cooling technology that is commonly associated with HEVs. The literature has proposed many solutions to HEV energy optimization. However, only a few of the solutions have addressed this optimization in the presence of thermal constraints. In this paper, a strategy for energy optimization in the presence of thermal constraints is developed for P2 HEVs based on battery sizing and the application of model predictive control (MPC) strategy. To analyse this approach, an electro-thermal battery pack model is integrated with an off-axis P2 HEV powertrain. The battery pack is properly sized to prevent thermal runaway while improving the energy consumption. The power splitting, thermal enhancement and energy optimization of the complex and nonlinear system are handled in this work with an adaptive MPC operated within a moving finite prediction horizon. The simulation results of the HEV SUV demonstrate that, by applying thermal constraints, energy consumption for a 0.9 kWh battery capacity can be reduced by 11.3% relative to the conventional vehicle. This corresponds to about a 1.5% energy increase when there is no thermal constraint. However, by increasing the battery capacity to 1.5 kWh (14s10p), it is possible to reduce the energy consumption by 15.7%. Additional benefits associated with the predictive capability of MPC are reported in terms of energy minimization and thermal improvement.
1. Introduction
Energy management optimization is a key focus of research in the automotive industry as the need to enhance fuel economy and minimise environmental pollution grows. Hybrid electric vehicles (HEVs) continuously grow in popularity due to their contributions in enhancing fuel economy and reducing environmental pollution through the optimum use of dual power sources and regenerative braking [1,2,3,4]. The HEV combines power sources from the electric machine and the internal combustion engine (ICE). To optimise and control energy consumption, the HEVs splits the power request of the powertrain between the ICE and the electric machine (EM).
This often increases the use of the electric machine at low vehicle speeds while the ICE is utilized when needed at high speeds where the fuel efficiency is optimum [3,4]. The sophisticated powertrain of the HEVs however complicates the design of the energy control strategy known as the energy management strategy (EMS) [5].
The hybrid electric vehicle (HEV) powertrain can exist in series, parallel or combined (series-parallel) configuration typologies [6,7,8]. Due to a double-clutch system, the parallel HEV topology creates the possibility to operate in pure ICE mode, when only the ICE is used; in pure electric mode, when only the EM is used; or in power-assisted mode, when the ICE and EM are used together. Among the HEV powertrain configurations is the parallel P2 model that is adapted in this work, and the scheme is shown in Figure 1. P2 configuration can be On-axis or Off-axis depending on the position of the EM.
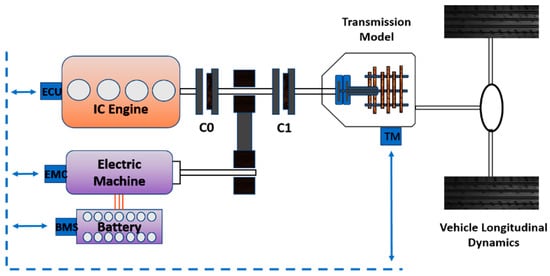
Figure 1.
P2 Off-axis Configuration HEV powertrain integrated with an energy management system (EMS).
In the Off-axis P2 HEVs as in the figure, the ICE shaft can be linked to the EM shaft through the axis gear, chain or belt. A generic case with a P2 off-axis configuration was considered as it involves additional variables, such as the transmission ratio and efficiency of belt drive. However, it can be converted to an on-axis configuration by setting the aforementioned parameters to unity. When C0 is open, the vehicle runs on pure electric mode with an efficient regeneration of the braking energy. The presence of a clutch C1 creates the possibility to use the EM as a starter to crank the ICE and for gear shifting.
For energy optimization and control based on a backward model, the powertrain torque request at the transmission model (TM) is satisfied with the combination of torques provided by the ICE and EM. The battery pack serves as an energy reservoir to store and release energy to the EM. The EMS interfaces with the ICE, the EM and the battery pack through the engine control unit (ECU), the electric machine control (EMC) and the battery management system (BMS), respectively.
A positive torque request is required to accelerate the vehicle. On the other hand, a negative torque regenerated from the vehicle kinetic energy during deceleration or downhill is deployed for battery charging [7]. It is possible to drive the EM with the torque from ICE during traction. Some authors propose a load shifting mode as a strategy to operate on the high-efficiency zone of the ICE. However, previous analysis according to [9] has not shown a clear benefit of such an approach especially from the point of view of energy consumption minimization. Hence, the load shifting mode has been avoided in this analysis.
Lithium-ion cells are becoming popular electricity storage or power equipment due to their high specific energy, high specific power, lightweight, high voltage output, low self-discharge rate, low maintenance cost, long service life as well as low mass–volume production cost [10,11]. A battery pack is a collection of lithium-ion cells connected in series and parallel.
Such connections create the flexibility of scaling a lithium-ion cell based on the energy capacity and power requirements. For the HEVs, the battery capacity is often in the range of 0.5 to 2 kWh [12]. Lithium-ion batteries are usually faced with the risk of thermal runaway, and this has to be avoided by reducing excessive heat generated both inside the cell and at the interconnecting terminals.
To minimize this risk and to enhance the battery life, many battery thermal management strategies (BTMS) that are based on active cooling have been developed. The common active cooling BTMSs include liquid cooling, air cooling and the use of refrigerant. Passive cooling, on the other hand, includes phase change material (PCM) and heat pipe techniques. Cooling strategies are reviewed and compared in [13,14]. The complexity and cost of these cooling systems are, however, not justified for 48 V HEV applications as in the current work. A simple passive cooling that dissipates heat from the battery surface by natural convection is assumed.
The lithium-ion battery of the HEV is often exposed to a high peak current. Considering the low capacity of the lithium-ion battery in such an application, there is a high tendency for a rise in the temperature of the battery. The consequence is increased ageing and thermal runaway. The effect of battery temperature on fuel economy and battery ageing is discussed in [15,16,17,18].
To enhance fuel economy, proper battery sizing has to be analysed to determine the minimum battery capacity to prevent thermal runaway. An electro-thermal model of a battery pack is relevant for acquiring information about the electrical and thermal states of the battery. Such information can be useful for studying the influence of temperature on the fuel economy of HEV.
EMS plays a critical role in the fuel efficiency improvement of HEVs and has been widely investigated by industry and academia. Various EMS strategies have been explored by researchers and they are generally grouped into rule-based and optimization strategies [3,4,8,19]. Rule-based strategies decide the operation modes and energy distribution scheme of power sources according to the characteristics of each source component [20]. Rule-based controls can be designed based on deterministic strategies [21] or according to fuzzy logic that requires expert knowledge [22]. Such controls algorithms can ensure stability, robustness and computational efficiency with low memory consumption. However, the complex powertrain structure of the HEVs and inadequate knowledge of the driving information leads to sub-optimum results.
Optimization-based strategies can minimize emission or energy consumption within a defined time horizon while respecting the system constraints. A local time horizon optimisation determines the optimum energy distribution for minimizing fuel consumption instantaneously or within a short time horizon [23]. Energy consumption minimization strategy (ECMS) [24] is one of the approaches for local energy optimisation. At each time step, ECMS evaluates the instantaneous cost function as a sum of the fuel consumption and the equivalent fuel cost of electric energy [25,26].
Notwithstanding the benefits of ECMS, the results are not globally optimum [27]. By defining an equivalent fuel cost for the battery energy, the ECMS strategy is developed to be solved at each instant rather than over the driving range [15,17,28]. Tuning the ECMS can be a complex task since the weighting parameters are determined heuristically. The ECMS strategy can be applied online as a closed-loop controller. However, the decisions are non-predictive, and the plant model dynamics are not fully exploited.
When the entire driving conditions represented by a drive cycle are known a priori, the energy management can be treated as an optimal control problem and solved by global optimization strategies. Some strategies for global optimisation adopted in the literature include dynamic programming (DP) [19,29], Pontryagin’s minimum principle (PMP) [30] and quadratic programming [31]. These approaches are sufficient for theoretical analysis and serve as a benchmark. However, it lacks practicability since the results are dependent on the knowledge of the entire drive cycle.
The results of the DP are a global optimum, but the procedure is computationally expensive and non-causal. On the other hand, the ECMS procedure is causal and results in a fast computation but optimum only at a given time instance and, hence, suboptimum in a global context. As a compromise that extracts the best features from these two approaches, the model predictive control (MPC) performs optimization over a moving finite horizon [32,33,34]. The MPC strategy may not be as fast as ECMS or as optimum as DP, but it is causal, fast enough and optimum over a practical range of a prediction horizon.
MPCs are currently gaining ground in online automotive applications. Linear MPCs are efficient for controlling linear or mildly nonlinear models. An iterative implicit MPC strategy adopted in [35,36] performs convex approximations to optimize energy consumption. The MPC applies quadratic programming techniques to a linear or linearized model for solutions to online optimization problems. Explicit MPC offers a less computational expensive approach. Explicit MPC based on multi-parametric programming, where the optimal control action is obtained from a lookup table is analysed for energy management in [37].
However, the off-line construction of the feedback law scales badly with the increasing dimensionality of the problem [38]. As nonlinearity grows as in the HEVs, the controlling capability of linear MPC shrinks. Nonlinear MPCs are efficient in handling nonlinear prediction problems. In [39,40], nonlinear MPC is adopted for power splitting and energy optimisation of HEVs. However, nonlinear MPCs are computationally expensive and have limited online applications especially in the case of HEVs.
An adaptive MPC is a viable option for solutions to nonlinear problems [41,42]. The work reported here takes advantage of the low computational cost of the adaptive MPC to minimize emissions and fuel consumption while respecting the system constraints. An adaptive MPC strategy applied in iterative tasks is reported in [42]. Such a strategy is an improvement on the linear MPC with the advantage that the internal prediction model parameters can be modified at every time step. The benefits of future prediction as a means of improving fuel economy in the presence of thermal constraints is still an open topic for research.
The present paper aims to investigate the influence of the battery pack capacity on the thermal behaviour and the fuel consumption of the HEV using an adaptive MPC strategy with a practically implementable prediction horizon. Hence, the minimum battery capacity, which allows its operation without thermal implications is defined. The information from the prediction horizon helps to minimize overdesign by reducing the minimum battery capacity that prevents thermal runaway. Moreover, there is an overall improvement in the fuel consumption and battery thermal behaviour.
The paper is organised as follows: Section 2 describes the backward powertrain model of HEV, including the vehicle longitudinal dynamic model, vehicle transmission model, the internal combustion engine, the battery and electro-thermal model and the energy management strategy with adaptive MPC. Section 3 discusses the results of the adaptive MPC. Section 4 summarises and concludes the work.
2. Methodology
2.1. The Hybrid Electric Vehicle (HEV)
Energy consumption optimisation through power splitting is the major goal of HEVs. The strategy for this optimisation is developed considering the necessary constraints to stay consistent with the physical limitations coming from the vehicle systems. This paper focuses on the P2 HEV powertrain that is shown in Figure 1. The vehicle is modelled using a backward approach that computes the torque and wheel speed to follow the given drive cycle. The wheel torque and speed are then propagated to the sources through the powertrain [43].
The power request that corresponds to a given drive condition is acquired for a given gear combination from the transmission control. Applying MPC strategy, the torque values of EM, and ICE, are decided for the optimum energy consumption, considering the operating constraints of the ICE and the EM. The constituents of the backward model are addressed in the following sections, and the parameters of the vehicle model are defined in Table 1.

Table 1.
The vehicle specifications for Mazda CX9 2016 [44].
The detailed description of the backward model and its experimental validation for the case with conventional powertrain (Mazda CX9 2016) is illustrated in [17]. Furthermore, the experimental validation of the battery electro-thermal model described here is also illustrated in [17]. However, here the models of the main subsystems are presented for the sake of completeness. Both the model and the control strategy are designed and simulated in MATLAB and Simulink platform with a sampling time, of 0.5 s. Figure 2 shows the backward model simulation scheme that is discussed in detail in the subsequent sections.
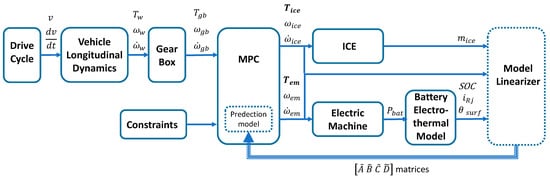
Figure 2.
The backward model simulation scheme for HEV.
2.2. Vehicle Longitudinal Dynamic Model
The power request on the axle is computed considering the drag losses on the axle bearings and the contribution of the wheels’ inertia according to Equation (1). The required longitudinal traction force is transmitted to the wheels to overcome the aerodynamic resistance, the rolling resistance and the vehicle inertia as expressed in Equation (2). As homologation cycles are performed on a flat road and simulations in the paper are performed based on these homologation cycles, the resistive force due to road inclination is neglected in the work.
where is the vehicle mass; and are the longitudinal speed and acceleration; is the coefficient of rolling resistance; is the aerodynamic drag coefficient; is the air density; is the vehicle reference area; is the wheel rolling radius; is the torque request on the axle; and is the angular speed of the wheel shaft.
2.3. Vehicle Transmission Model (Gearbox)
The transmission model converts and to the corresponding gearbox torque and gearbox angular speed based on the selected gear ratio and the final gear ratio . is computed according to Equation (3). A speed based gearshift strategy of the 6-speed gearbox is implemented in the model accounting for the constraint of ICE maximum speed. The gearshift strategy used in this work is defined by analysing the gearshift experimental data from Argonne National Laboratory (ANL) [44,45].
where the efficiencies of the final gear and the gearbox are considered as .
The is computed accordingly from Equation (4).
2.4. The Internal Combustion Engine
Conventional vehicles rely solely on the ICE as the traction source. It is a common practice to model the fuel consumption of the ICE with static maps. The fuel consumption map for Mazda CX9 2016 ICE is used for analysis in this work [45]. The map is shown in Figure 3 where the fuel consumption rate is defined as a two (2) dimensional function of engine torque and speed . The maximum operating torque of the ICE is limited by the engine wide open throttle (WOT) characteristics. The steady-state map was obtained without loads of alternator and water pump. The oil pump load was included in the experimental tests [45].
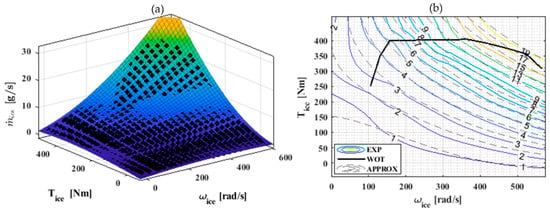
Figure 3.
(a) Fuel consumption map of Mazda CX9 2016 ICE as a function of and . The dots are the estimated values. (b) The maximum operating torque as a function of and the fuel consumption rate contour lines.
The analytical model of the fuel consumption rate was derived using polynomial curve fitting as described in Equation (5). The regression coefficients of the polynomial function were estimated with a fit goodness indicator R-square = 0.91. Figure 3b visualizes the goodness of fit of the two fuel consumption rates: experimentally obtained (solid lines–EXP) and approximated from Equation (5) (dashed lines–APPROX).
2.5. Electric Machine (EM)
The presence of the EM provides an alternative or supporting power source for the powertrain of the HEV. The electric machine can either act as an electric motor or as a generator. When there is the need to accelerate the vehicle, the EM acts as an electric motor, drawing energy from the battery to lower or eliminate the ICE fuel consumption. If the vehicle is to be decelerated, the EM acts as a brake, and the generated energy is stored in the battery. Equation (6) computes the power requested from the battery in charge and discharge modes. Similar to the ICE, the maximum operating torque of the EM is limited by its maximum torque characteristics as shown with the efficiency map in Figure 4.
and are the respective generator and motor efficiencies.
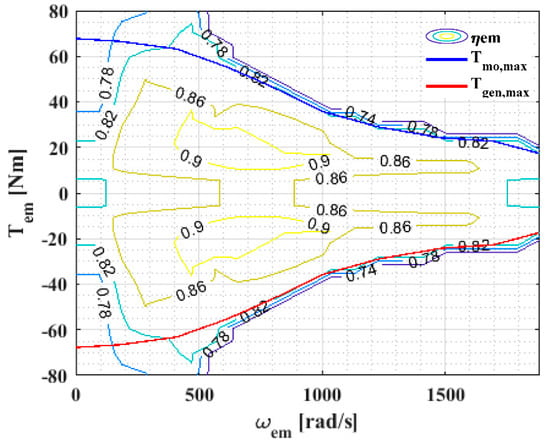
Figure 4.
Efficiency map of the electric machine in both motor and generator operating modes. The maximum motor torque and maximum generator torque as functions of .
2.6. Battery and Electro-Thermal Model
The battery pack serves as the energy reservoir for the storage of electrical energy. Two battery packs of 0.9 and 1.5 kWh capacities are designed using 14s6p and 14s10p configurations, respectively. These capacities correspond to the range of commercially available HEV batteries [12]. The configuration indicates the series and parallel combination of cells. 14s6p means 14 modules of six parallel cells connected in series. The battery packs are built from Sanyo NCR 18650 GA lithium-ion cells that have a capacity of 3.2 Ah and a nominal voltage of 3.6 V [46]. The difference in the capacities of these two batteries is useful to analyse the influence of battery sizing on thermal behaviour and fuel consumption. Refer to Table 1 for the cell specification.
2.6.1. Cell Electric Model
The electro-thermal model of the lithium cell was developed and validated experimentally at an ambient environmental temperature in [17]. The equivalent circuit of the electric model according to [47] is shown in Figure 5. The circuit consists of a single parallel resistor-capacitor (RC) branch connected in series with a resistor and a Warburg impedance. Given a current input (derived from the battery power request ) to the cell model, the diffusion–resistor current passes through the parallel resistor. The single parallel RC branch with and models the relatively high-frequency diffusion loss due to mass transfer and the activation loss due to charge transfer. models the ohmic internal resistance of the cell. The low-frequency Warburg impedance models the hysteresis losses [48].
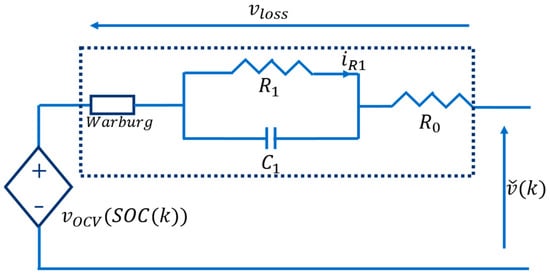
Figure 5.
Equivalent circuit that describes the dynamic model designed for terminal voltage and voltage loss prediction.
The model provides information about the cell state of the charge (SOC) and the temperature at every time step . The battery state of charge SOC is expressed by coulomb counting in Equation (7) for a given discrete time step .
where is current input to the model–positive at discharge; is the sampling time of the model; [Ah] is the total releasable capacity when the cell is fully charged; and is the cell coulombic efficiency in the charge phase [49,50].
Other states of the cell electric model include the diffusion-resistor current and the hysteresis voltage . expressed in Equation (8) and in Equation (9) [47].
where is the time constant of the RC circuit determined by subspace system identification using current and measured voltage and input and output, respectively.
The non-dimensional parameter determines how quickly the hysteresis state changes with the SOC. is a sign function, i.e., 1 for positive current input, −1 for negative input and zero otherwise.
The predicted cell terminal voltage results from the summation of the open-circuit voltage and the voltage loss contributions (Equation (10)).
The is a function of SOC. The is the cell terminal voltage predicted from the electric model. The models the voltage losses that result from the contributions of the cell internal resistance, diffusion resistance and hysteresis.
The contributions are expressed in Equation (11).
is the maximum absolute analog hysteresis voltage at ambient temperature; is the instantaneous hysteresis voltage; is the hysteresis voltage; and is the parallel branch resistance. The parameters of the model and appear linearly according to Equation (12) and are computed by least squares approximation. The parameters of the cell were determined without considering cell ageing.
where is the number of data points of the experimental dataset. Refer to Table 2 for the electro-thermal model parameters.
Table 2.
List of the electrical and thermal model parameters with the estimated values.
2.6.2. Cell Thermal Model
When the is computed, the thermal component of the electro-thermal model can be computed using the lumped parameter approach. The dynamic thermal model is designed considering only the heat transfer by convection while neglecting the conductive component. The heat source, of the thermal model is derived from and discrete-time temperature of the cell surface is expressed in Equation (13) [51]. We assumed that the cell is cooled by natural convection without an active cooling system.
where ; is the cell specific heat capacity; is the cell mass; is the ambient temperature; and is the thermal resistance by convection. The thermal model parameters are highlighted in Table 2.
2.7. Energy Management System (EMS) Strategy with Adaptive MPC
The primary goal of energy management in HEVs is to minimise energy consumption without violating the operating limitations of the vehicle system. Using an MPC, this goal is defined as the objective or cost function that is minimized across a defined prediction horizon while respecting the defined constraints. A prediction horizon is applied in the final design. This corresponds to a prediction distance of 80–90 m at an average driving speed of 31.5 km/h for the UDDS cycle considering a sampling time of 0.5 s. The MPC is equipped with a linearized internal plant model for making predictions across the defined horizon.
2.7.1. Design of an MPC Internal Prediction Model
The MPC internal prediction model and the constraints are derived as the linear approximation of the backward model described in Section 2.1, Section 2.2, Section 2.3, Section 2.4, Section 2.5 and Section 2.6. The model has three (3) inputs, four (4) states and three (3) outputs as highlighted in Table 3. The inputs include the torque of EM, torque of ICE and speed of ICE. The torque of EM and torque of ICE are the manipulated variables while the speed of ICE is assumed to be a measured disturbance to the model. The speed of the EM is derived by scaling the speed of the ICE with the off-axis gear ratio of 2.7. The states include: the SOC, diffusion-resistor current , battery surface temperature and fuel consumed , which is an integration of . The outputs of the model are the SOC, and .
Table 3.
Inputs, states, eigenvalues and output variables of the linearized nominal internal plant model.
For prediction model design, is computed neglecting the hysteresis components and the model is evaluated at a single operating point. This simplifies the model without significant deviation from the true model. Furthermore, the presence of feedback in the control strategy compensates for such deviation.
From Table 3, the presence of zero eigenvalues resulting from the presence of the integrators in SOC and contributes to the marginal stability of the nominal plant model. The small magnitude of the non-zero eigenvalues is an indication of the slow dynamics of the model.
2.7.2. Design of Standard MPC
The adaptive MPC is built on the standard MPC [52,53]. In general form, the MPC optimisation problem is formulated in discrete time as an argument that minimizes the cost function subject to the states of the model and the constraints as in Equation (14). is a contribution of the cost due to output reference error () minimization, ; the cost due to input variation minimization, ; and the cost due to constraint violation () minimization ; implies a hard constraint. The constraint is softened with an increase in non-negative .
subject to
and the constraints
where ; ; and , , and are the penalising weights on the respective costs. Increasing the weight increases the importance of the corresponding component whose cost is desired to be minimised. is set to 0.0001 for all the outputs since our goal is not to track the reference. is set to 0.01 for all the inputs to give some importance to minimizing the input variation. is set to 100,000 to minimize violation of constraints. is the torque request computed from the transmission control. The subscripts and indicate the minimum and maximum values of the variables. Table 4 lists the minimum and maximum limits of the input and output constraints.
Table 4.
The minimum and maximum limits of the input and output constraints.
The MPC problem is solved for the prediction horizon to compute the control sequence such that Equation (15) holds. The first element of the optimum control sequence is applied, and the control procedure is repeated.
The mechanical brake is applied to augment the in the charge phase when cannot provide the required torque. It is desired to minimize as much as possible to use the maximum power of the electric machine.
2.7.3. Adaptive MPC
Adaptive MPC provides an intuitive approach for handling nonlinear control problems with linear controllers. A linearizer is developed to linearize the plant model at every time step. Since the HEV model is highly nonlinear both on the states and on the constraints, the standard MPC is suitable for controlling the model only at a single operating point. The nonlinearity of the plant model come from , as well as the . Furthermore, and the introduce nonlinear constraint functions. These constraints are shown in Figure 4 and Figure 3b, respectively. They are in polynomial form in Equations (16) and (17) as suitable for applying in an MPC.
The Adaptive MPC controls the nonlinear HEV model with a standard linear MPC whose prediction model is updated at every time step . To update the linear MPC, the HEV model is linearized at every time step and the linear parameters are used to update the parameters of the MPC prediction model. The linearized model is obtained by computing the Jacobian matrix at each time step. The stability and disturbance rejection properties for this approach are addressed in the literature in [54,55]. The linearized model is computed according to Equation (18).
where , , ; are the current values of the states, the manipulated inputs and the disturbances of the system, respectively.
For the HEV fuel consumption minimisation problem, at each time step, assuming that the velocity of the vehicle is known for a defined prediction horizon, the states of the model can be predicted within this horizon, and the MPC problem is solved to compute the control sequence. The prediction information helps the return optimum results within the prediction horizon. The energy consumption is minimized, and the thermal behaviour is enhanced as reported in Section 3. The presence of prediction information helps to avoid overdesign by reducing the minimum battery capacity that is needed to avoid thermal runaway. This can be verified by comparing the adaptive MPC results with that of ECMS [17].
3. Results and Discussion
The HEV model performance is first analysed under an optimized On/Off condition (without MPC) to define a reference for comparing the optimized results when a temperature limit is imposed. The adaptive MPC is set to a minimum prediction horizon of and with a 0.9 kWh battery of configuration 14s6p and analysed without temperature limitation. This computes the energy consumption and emission assuming no temperature constraints imposed on the battery. To understand the influence of the prediction horizon, the MPC is set to , and the model performance is analysed without temperature limitations.
Furthermore, a thermal constraint is imposed, and the influence of temperature on energy consumption is evaluated. Finally, battery sizing is demonstrated as a means to efficiently enhance the thermal behaviour of the battery pack while improving the energy savings. The battery capacity is gradually increased to determine the minimum battery capacity suitable to avoid thermal runaway. A minimum capacity of 1.5 kWh with the configuration 14s10p is determined for the performance analysis. The results of the analyses are summarized in Table 5.
Table 5.
Result summary for different prediction horizons, battery pack configurations and operating conditions.
3.1. Fuel Consumption Computation Based on On/Off Model
The first attempt in imposing battery temperature limitations in fuel consumption optimization is to define a reference based on an optimized model upon which the optimized results can be compared. The HEV model is run in this mode without the MPC. To obtain the temperature limitation in the On/Off mode, the electric machine is allowed to work only when the battery surface temperature is less than the maximum operating temperature of the battery. When the battery temperature approaches the maximum, the system runs on pure ICE mode.
In other words, the electric-assist mode is activated only when the battery temperature is below the maximum operating temperature. Considering the temperature operating range of the battery, a maximum battery surface temperature of 55 °C is defined in this work. This is considered the worst-case fuel consumption scenario when the EM is utilized with no optimization. The analysis is carried out considering the 14s6p battery configuration and an ambient temperature of 20 °C. The main results are shown in Figure 6.
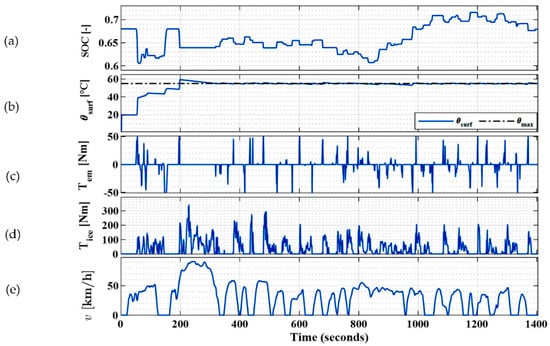
Figure 6.
On/off model evaluated with 14s6p battery configuration; (a) the state of charge; (b) the battery surface temperature; (c) the EM torque; (d) the ICE torque; and (e) the velocity of the UDDS drive cycle.
The acceleration phase of the drive cycle velocity profile in Figure 6e corresponds to a positive torque request, while the deceleration corresponds to a negative torque request. Although the maximum battery temperature is defined as 55 °C, there is a slight overshoot at 200 s. The reason for this overshoot is that, in one simulation step, the temperature raised fast and the action to turn off the use of electric traction was performed with a delay at the next simulation step.
This can be avoided by using smaller simulation step size. However, this does not impact the results of the analysis significantly. To realize a charge sustaining mode, the SOC starts and ends at approximately equal values. In this on/off mode, the computed fuel consumption is equal to 672 g corresponding to emission values of 175.7 g/km [56] as reported in Table 5. The emission value is computed according to the EU technical guidlines (Regulation (EU) No 510/2011).
3.2. Adaptive MPC Strategy Results
3.2.1. No Thermal Limitation Constraint
The MPC is analysed here applying no limits on the battery surface temperature to optimize fuel consumption and the corresponding emission for the 14s6p battery pack configuration. The results of this analysis will be used as a benchmark to evaluate the model performance when constraints are imposed to limit the thermal behaviour. The adaptive MPC in this section is set to .
This is a good approximation of an ECMS implementation where the computation is instantaneous or non-predictive. Under this condition, the computation considers the plant dynamics (especially the electro-thermal model) within a very limited horizon. This results in a low adaptation of the controller. The minimum prediction horizon that is applied is due to the structural limitation of MPC. This is because the input constraint operates in the range of . The results are shown in Figure 7.
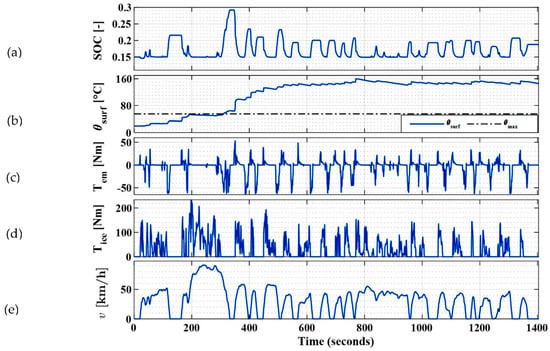
Figure 7.
MPC evaluated at with using 14s6p battery configuration, no thermal limitations; (a) is the state of charge; (b) is the battery surface temperature; (c) is the EM torque; (d) is the ICE torque; and (e) is the velocity of the UDDS drive cycle.
With no constraint applied to limit the temperature of the battery, the fuel consumed is 618.5 g while the emissions are 161.8 g/km. This corresponds to an energy saving of 11.6% relative to the conventional vehicle and 8% relative to the On/off model. However, it can be seen from Figure 7b that the surface temperature of the battery can reach as high as 160 °C. This is way beyond the maximum operating temperature of the battery shown with a dotted line.
3.2.2. Increased Prediction Horizon with No Thermal Limitation Constraint
Increasing the prediction horizon of the adaptive MPC enhances its thermal handling capability. In this case, MPC considers the plant dynamics (especially the electro-thermal model) across an increased prediction horizon. By increasing the prediction horizon, MPC can predict a possible disturbance in advance and act accordingly to minimize the effect. Thermal shock can also be minimized in the process. The analysis is repeated as in Section 3.2.1 but with the prediction horizon set to . Figure 8 shows the results of the analysis.
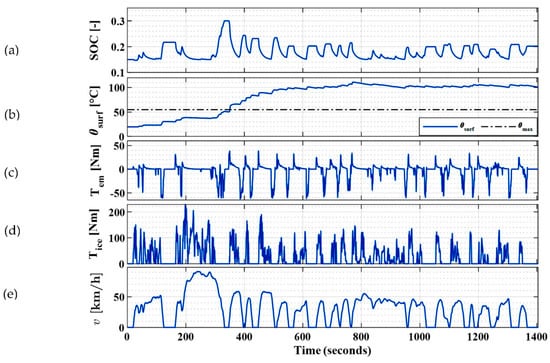
Figure 8.
MPC evaluated with using 14s6p battery configuration, no thermal limitations; (a) is the state of charge; (b) is the battery surface temperature; (c) is the EM torque; (d) is the ICE torque; and (e) is the velocity of the UDDS drive cycle.
By increasing the prediction horizon from 2 to 20, the battery surface temperature is reduced from 160 to 111 °C and thermal shock is minimized as shown in Figure 8b. In this case, 610 g of fuel is consumed. This corresponds to 159.5 g/km emission, hence, an improvement relative to a low prediction horizon of 2. This corresponds to an energy saving of 12.8% relative to the conventional vehicle and 9.2% relative to the On/Off mode.
3.2.3. Introducing Thermal Limitation Constraint
The adaptive MPC is desired to maintain the temperature of the battery below the maximum temperature of 55 °C while minimizing the energy consumption. It is possible to achieve this temperature limit using the 0.9 kWh (14s6p) battery with a reduced maximum EM torque output, however. The classical approach for temperature limitation with MPC is to impose a boundary constraint on the maximum temperatures. However, due to the high nonlinearity that is associated with the temperature variable, the boundary constraint is violated occasionally in this case. An alternative approach is to impose a constraint on the range variation of the battery SOC. This limits the magnitude of energy that can be delivered by the battery.
The is satisfied with the increase in the use of the in the vehicle deceleration mode. In acceleration mode, however, there is an increase in the use of the and consequently, an increased fuel consumption. Figure 9 shows the results of this analysis for .
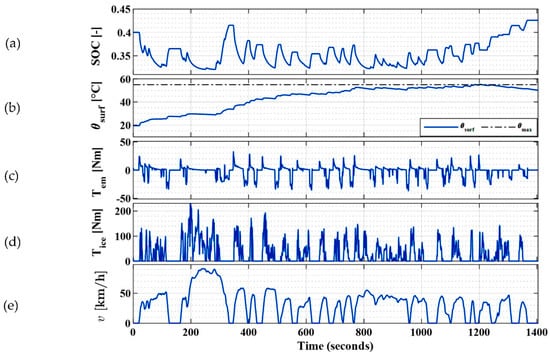
Figure 9.
MPC evaluated with using 14s6p battery configuration, applied thermal limitation; (a) is the state of charge; (b) is the battery surface temperature; (c) is the EM torque; (d) is the ICE torque; (e) is the velocity of the UDDS drive cycle.
The thermal limitation is achieved by limiting the SOC of the battery to vary in the range of 0.3 to 4.5. The fuel consumed in the process is 621.5 g and the emissions are 162.6 g/km. This corresponds to about 11.3% energy saving when compared to the conventional vehicle and about 7.6% when compared to the On/Off model. The results in Figure 9 show that the adaptive MPC can maintain the battery surface temperature below the defined maximum limit of 55 °C. However, this is possible with a compromise on the limit of the operating EM torque output and on the fuel consumption. Figure 10 compares the torques in this case with the cases when there are no thermal limitations in the operating point efficiency map of EM and ICE.
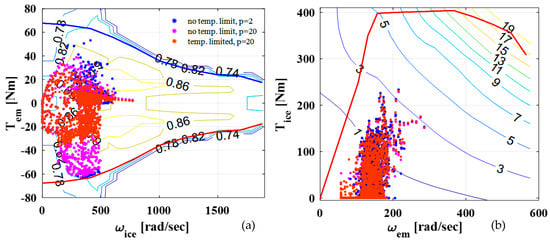
Figure 10.
Operating torque comparison between the case with thermal limitation and without thermal limitations in the efficiency map. (a) The electric machine torque comparison; and (b) the ICE torque comparison.
It is can be seen from Figure 10b that the operating torque of the electric machine is reduced in the case of a thermal limitation compared to the cases when there are no thermal limitations.
3.2.4. Battery Thermal Enhancement with Battery Sizing
From Section 3.2.3, it is possible to maintain the temperature of the battery below 55 °C but at a cost of increased fuel consumption resulting from the underutilization of the EM power. Increasing the contribution of the EM while operating within the maximum temperature limit of the battery is only possible by increasing the battery capacity. Increasing the number of cells in parallel increases the battery capacity.
This also corresponds to reducing the maximum current that passes through each of the parallel cells by an approximate product factor of , where is the number of cells in parallel. Increasing the capacity of the battery permits softening the constraint imposed on the variation of SOC and the battery can deliver more energy. Maintaining the prediction horizon of 20, the experiment is repeated varying in the fuel consumption optimization process. Without overdesigning, a suitable battery pack configuration of 14s10p (1.5 kWh) was chosen to satisfy the desired requirements. Figure 11 shows the results.
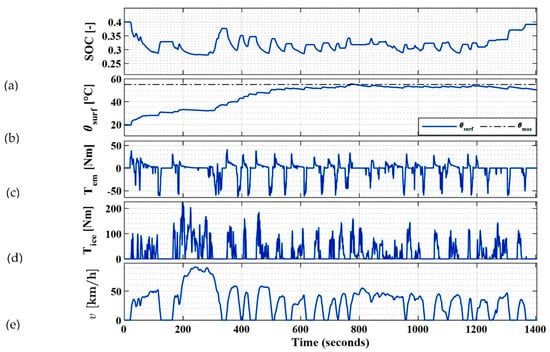
Figure 11.
MPC evaluated with using 14s10p battery configuration, (a) is the state of charge; (b) is the battery surface temperature; (c) is the EM torque; (d) is the ICE torque; and (e) is the velocity of the UDDS drive cycle.
By increasing the battery capacity from 0.9 to 1.5 kWh, the fuel consumed computed is 590.4 g while the emissions are equal to 154.4 g/km. This corresponds to the energy saving of 15.7% relative to the conventional vehicle and 12.1% relative to the On/Off model. The battery operating temperature is maintained as desired with a maximum value of 55 °C while satisfying the torque request across the drive cycle.
The results of all the cases analysed here are summarised in Table 5.
The percentage fuel savings computed in Table 5 is with respect to the conventional vehicle. The results shown in this paper addressed the influence of MPC prediction capability and battery capacity on the thermal behaviour and fuel consumption of P2 HEV. By comparing the results of Section 3.2.1 and Section 3.2.2, there is clear evidence that the future prediction capability of the MPC helps to improve the battery thermal behaviour.
The battery temperature reduced from 160 to 111 °C when the prediction horizon was changed from 2 to 20. Section 3.2.3 demonstrates that the desired battery temperature range cannot be achieved using a 0.9 kWh battery while reducing fuel consumption. An optimum battery size with a capacity of 1.5 kWh was, therefore, chosen in Section 3.2.4 to achieve the desired temperature with an overall reduction in fuel consumption.
As a limitation of this model, the electro-thermal model used in this analysis was validated without considering battery ageing.
4. Summary and Conclusions
This work demonstrated the application of adaptive MPC for energy optimisation of P2 HEV considering battery pack thermal limitations. Two battery pack configurations, 14s6p and 14s10p with 0.9 and 1.5 kWh capacities, respectively, were considered. The developed electro-thermal model of the cell was used for predicting the electrical and thermal states of the battery pack.
The adaptive MPC strategy offer solutions to the nonlinear HEV energy management problem. The proposed solution is obtained respecting the system constraints over a defined prediction horizon of 20. This prediction horizon corresponds to about 80–90 m of prediction distance at an average driving speed of 31.5 km/h for UDDS cycle. This prediction horizon can be realized by means of modern on-board ADAS systems.
The system was analysed with and without the thermal limitations of the battery pack using two different pack configurations and two prediction horizons (2 and 20). Based on this analysis, the reduction of emission and fuel consumption was obtained by increasing the battery capacity and the prediction capability of the MPC model. High battery temperature and thermal shock were also minimized in the process. Minimum emissions and fuel consumption were obtained using the prediction horizon of 20 and with the 14s10p battery configuration pack. The battery surface temperature was approximately 55 °C with the relatively lowest maximum temperature and with the least thermal shock.
It can be seen from the analysis that the prediction capability of the MPC can help to improve the thermal behaviour of the battery pack. However, to fully exploit the benefits of the MPC in minimizing fuel consumption, the increase of the battery pack to 1.5 kWh is required. This minimum battery capacity is comparably smaller than that of non-predictive ECMS where the minimum capacity is 1.9 kWh [17].
In the paper, the realistic prediction horizon realizable with on-board vehicle systems was considered. However, it would be interesting to see the potential of fuel consumption and thermal control improvement using MPC with an optimal prediction horizon to obtain comparable results with dynamic programming-based optimization. The results shown in this paper were obtained without considering the influence of battery ageing. Therefore, such analysis could be of interest for future research.
Author Contributions
Conceptualization, E.E., S.R. and A.T.; Data curation, E.E., G.Y.; Formal analysis, E.E., S.R., L.M.C. and A.T.; Investigation, E.E., G.Y., S.R., L.M.C. and A.T.; Methodology, E.E., S.R. and L.M.C.; Project administration, A.T.; Resources, A.T.; Software, E.E. and S.R.; Supervision, S.R. and A.T.; Validation, E.E. and G.Y.; Visualization, E.E., G.Y., L.M.C. and A.T.; Writing—original draft, E.E.; Writing—review and editing, G.Y., S.R., L.M.C. and A.T. All authors have read and agreed to the published version of the manuscript.
Funding
This research received no external funding and the APC was funded by Doctoral Funds of Politecnico di Torino.
Data Availability Statement
Not applicable.
Acknowledgments
We thank the LIM—Mechatronics Lab for providing the battery testing equipment.
Conflicts of Interest
The authors declare no conflict of interest.
References
- Chung, I.; Kang, H.; Park, J.; Lee, J. Fuel Economy Improvement Analysis of Hybrid Electric Vehicle. Int. J. Automot. Technol. 2019, 20, 531–537. [Google Scholar] [CrossRef]
- de Almeida, S.C.A.; Kruczan, R. Effects of Drivetrain Hybridization on Fuel Economy, Performance and Costs of a Fuel Cell Hybrid Electric Vehicle. Int. J. Hydrog. Energy 2021, 46, 39404–39414. [Google Scholar] [CrossRef]
- Ehsani, M.; Gao, Y.; Emadi, A. (Eds.) Modern Electric, Hybrid Electric, and Fuel Cell Vehicles: Fundamentals, Theory, and Design, 2nd ed.; CRC Press: Boca Raton, FL, USA, 2017; ISBN 9781315219400. [Google Scholar]
- Emadi, A. (Ed.) Advanced Electric Drive Vehicles; CRC Press: Boca Raton, FL, USA, 2014; ISBN 9781315215570. [Google Scholar]
- Zhuang, W.; Li (Eben), S.; Zhang, X.; Kum, D.; Song, Z.; Yin, G.; Ju, F. A Survey of Powertrain Configuration Studies on Hybrid Electric Vehicles. Appl. Energy 2020, 262, 114553. [Google Scholar] [CrossRef]
- Tran, D.-D.; Vafaeipour, M.; El Baghdadi, M.; Barrero, R.; Van Mierlo, J.; Hegazy, O. Thorough State-of-the-Art Analysis of Electric and Hybrid Vehicle Powertrains: Topologies and Integrated Energy Management Strategies. Renew. Sustain. Energy Rev. 2020, 119, 109596. [Google Scholar] [CrossRef]
- García, A.; Monsalve-Serrano, J.; Martínez-Boggio, S.; Wittek, K. Potential of Hybrid Powertrains in a Variable Compression Ratio Downsized Turbocharged VVA Spark Ignition Engine. Energy 2020, 195, 117039. [Google Scholar] [CrossRef]
- Sieg, C.; Küçükay, F. Benchmarking of Dedicated Hybrid Transmissions. Vehicles 2020, 2, 100–125. [Google Scholar] [CrossRef] [Green Version]
- Castellazzi, L.; Ruzimov, S.; Bonfitto, A.; Tonoli, A.; Amati, N. A Method for Battery Sizing in Parallel P4 Mild Hybrid Electric Vehicles. SAE Int. J. Electrified Veh. 2021, 11, 14-11-01-0008. [Google Scholar] [CrossRef]
- Whittingham, M.S. Materials Challenges Facing Electrical Energy Storage. MRS Bull. 2008, 33, 411–419. [Google Scholar] [CrossRef] [Green Version]
- Nitta, N.; Wu, F.; Lee, J.T.; Yushin, G. Li-Ion Battery Materials: Present and Future. Mater. Today 2015, 18, 252–264. [Google Scholar] [CrossRef]
- Sanjarbek, R.; Mavlonov, J.; Mukhitdinov, A. Analysis of the Powertrain Component Size of Electrified Vehicles Commercially Available on the Market. Commun. Sci. Lett. Univ. Zilina 2022, 24, B74–B86. [Google Scholar] [CrossRef]
- Wang, Q.; Jiang, B.; Li, B.; Yan, Y. A Critical Review of Thermal Management Models and Solutions of Lithium-Ion Batteries for the Development of Pure Electric Vehicles. Renew. Sustain. Energy Rev. 2016, 64, 106–128. [Google Scholar] [CrossRef]
- An, Z.; Jia, L.; Ding, Y.; Dang, C.; Li, X. A Review on Lithium-Ion Power Battery Thermal Management Technologies and Thermal Safety. J. Therm. Sci. 2017, 26, 391–412. [Google Scholar] [CrossRef]
- Zhou, B.; Rezaei, A.; Burl, J. Effect of Battery Temperature on Fuel Economy and Battery Aging When Using the Equivalent Consumption Minimization Strategy for Hybrid Electric Vehicles; SAE Technical Paper. No. 2020-01-1188; SAE International: Warrendale, PA, USA, 2020. [Google Scholar] [CrossRef]
- Du, R.; Hu, X.; Xie, S.; Hu, L.; Zhang, Z.; Lin, X. Battery Aging- and Temperature-Aware Predictive Energy Management for Hybrid Electric Vehicles. J. Power Sources 2020, 473, 228568. [Google Scholar] [CrossRef]
- Yakhshilikova, G.; Ezemobi, E.; Ruzimov, S.; Tonoli, A. Battery Sizing for Mild P2 HEVs Considering the Battery Pack Thermal Limitations. Appl. Sci. 2022, 12, 226. [Google Scholar] [CrossRef]
- Conte, F.V. Battery and Battery Management for Hybrid Electric Vehicles: A Review. Elektrotech. Inftech. 2006, 123, 424–431. [Google Scholar] [CrossRef]
- Sundström, O.; Guzzella, L.; Soltic, P. Optimal Hybridization in Two Parallel Hybrid Electric Vehicles Using Dynamic Programming. IFAC Proc. Vol. 2008, 41, 4642–4647. [Google Scholar] [CrossRef] [Green Version]
- Neffati, A.; Caux, S.; Fadel, M. Fuzzy switching of fuzzy rules for energy management in HEV. IFAC Proc. Vol. 2012, 45, 663–668. [Google Scholar] [CrossRef]
- Tie, S.F.; Tan, C.W. A Review of Energy Sources and Energy Management System in Electric Vehicles. Renew. Sustain. Energy Rev. 2013, 20, 82–102. [Google Scholar] [CrossRef]
- Ahmadi, S.; Hosseinpour, A.; Bathaee, S.M. Improving Fuel Economy and Performance of a Fuel-Cell Hybrid Electric Vehicle (Fuel-Cell, Battery, and Ultra-Capacitor) Using Optimized Energy Management Strategy. Energy Convers. Manag. 2018, 160, 74–84. [Google Scholar] [CrossRef]
- Geng, B.; Mills, J.K.; Sun, D. Energy Management Control of Microturbine-Powered Plug-In Hybrid Electric Vehicles Using the Telemetry Equivalent Consumption Minimization Strategy. IEEE Trans. Veh. Technol. 2011, 60, 4238–4248. [Google Scholar] [CrossRef]
- Rezaei, A.; Burl, J.B.; Zhou, B. Estimation of the ECMS Equivalent Factor Bounds for Hybrid Electric Vehicles. IEEE Trans. Control. Syst. Technol. 2018, 26, 2198–2205. [Google Scholar] [CrossRef]
- Sciarretta, A.; Back, M.; Guzzella, L. Optimal Control of Parallel Hybrid Electric Vehicles. IEEE Trans. Control. Syst. Technol. 2004, 12, 352–363. [Google Scholar] [CrossRef]
- Musardo, C.; Rizzoni, G.; Guezennec, Y.; Staccia, B. A-ECMS: An Adaptive Algorithm for Hybrid Electric Vehicle Energy Management. Eur. J. Control. 2005, 11, 509–524. [Google Scholar] [CrossRef]
- Rahmeh, H.; Bonfitto, A.; Ruzimov, S. Fuzzy Logic vs Equivalent Consumption Minimization Strategy for Energy Management in P2 Hybrid Electric Vehicles. In Proceedings of the ASME 2020 International Design Engineering Technical Conferences and Computers and Information in Engineering Conference, Virtual, Online, 17–19 August 2020. [Google Scholar]
- Paganelli, G.; Delprat, S.; Guerra, T.M.; Rimaux, J.; Santin, J.J. Equivalent Consumption Minimization Strategy for Parallel Hybrid Powertrains. In Proceedings of the Vehicular Technology Conference IEEE 55th Vehicular Technology Conference. VTC Spring 2002 (Cat. No.02CH37367), Birmingham, AL, USA, 6–9 May 2002; Volume 4, pp. 2076–2081. [Google Scholar]
- Xie, S.; Sun, F.; He, H.; Peng, J. Plug-In Hybrid Electric Bus Energy Management Based on Dynamic Programming. Energy Procedia 2016, 104, 378–383. [Google Scholar] [CrossRef]
- Tribioli, L.; Cozzolino, R.; Chiappini, D.; Iora, P. Energy Management of a Plug-in Fuel Cell/Battery Hybrid Vehicle with on-Board Fuel Processing. Appl. Energy 2016, 184, 140–154. [Google Scholar] [CrossRef]
- Chen, Z.; Mi, C.C.; Xiong, R.; Xu, J.; You, C. Energy Management of a Power-Split Plug-in Hybrid Electric Vehicle Based on Genetic Algorithm and Quadratic Programming. J. Power Sources 2014, 248, 416–426. [Google Scholar] [CrossRef]
- He, H.; Zhang, J.; Li, G. Model Predictive Control for Energy Management of a Plug-in Hybrid Electric Bus. Energy Procedia 2016, 88, 901–907. [Google Scholar] [CrossRef] [Green Version]
- Borhan, H.; Vahidi, A.; Phillips, A.M.; Kuang, M.L.; Kolmanovsky, I.V.; Di Cairano, S. MPC-Based Energy Management of a Power-Split Hybrid Electric Vehicle. IEEE Trans. Control. Syst. Technol. 2012, 20, 593–603. [Google Scholar] [CrossRef]
- He, H.; Wang, Y.; Han, R.; Han, M.; Bai, Y.; Liu, Q. An Improved MPC-Based Energy Management Strategy for Hybrid Vehicles Using V2V and V2I Communications. Energy 2021, 225, 120273. [Google Scholar] [CrossRef]
- Nüesch, T.; Elbert, P.; Flankl, M.; Onder, C.; Guzzella, L. Convex Optimization for the Energy Management of Hybrid Electric Vehicles Considering Engine Start and Gearshift Costs. Energies 2014, 7, 834–856. [Google Scholar] [CrossRef] [Green Version]
- Cairano, S.D.; Bernardini, D.; Bemporad, A.; Kolmanovsky, I. Stochastic MPC With Learning for Driver-Predictive Vehicle Control and Its Application to HEV Energy Management. IEEE Trans. Control. Syst. Technol. 2014, 22, 1018–1031. [Google Scholar] [CrossRef]
- Vadamalu, R.S.; Beidl, C. Explicit MPC PHEV Energy Management Using Markov Chain Based Predictor: Development and Validation at Engine-In-The-Loop Testbed. In Proceedings of the 2016 European Control Conference (ECC), Aalborg, Denmark, 29 June–1 July 2016; pp. 453–458. [Google Scholar] [CrossRef]
- Kvasnica, M. Implicit vs Explicit MPC—Similarities, Differences, and a Path Owards a Unified Method. In Proceedings of the 2016 European Control Conference (ECC), Aalborg, Denmark, 29 June–1 July 2016; p. 603. [Google Scholar]
- Borhan, H.A.; Zhang, C.; Vahidi, A.; Phillips, A.M.; Kuang, M.L.; Di Cairano, S. Nonlinear Model Predictive Control for Power-Split Hybrid Electric Vehicles. In Proceedings of the 49th IEEE Conference on Decision and Control (CDC), Atlanta, GA, USA, 15–17 December 2010; pp. 4890–4895. [Google Scholar]
- Non-Linear Model Predictive Control of a Power-Split Hybrid Electric Vehicle Influence of Conclusion of Powertrain Dynamics. Available online: https://www.esteco.com/modefrontier/non-linear-model-predictive-control-power-split-hybrid-electric-vehicle-influence-concl (accessed on 25 November 2021).
- Dhar, A.; Bhasin, S. Adaptive MPC for Uncertain Discrete-Time LTI MIMO Systems with Incremental Input Constraints. IFAC-PapersOnLine 2018, 51, 329–334. [Google Scholar] [CrossRef]
- Bujarbaruah, M.; Zhang, X.; Rosolia, U.; Borrelli, F. Adaptive MPC for Iterative Tasks. In Proceedings of the 2018 IEEE Conference on Decision and Control (CDC), Miami, FL, USA, 17–19 December 2018; pp. 6322–6327. [Google Scholar]
- Wipke, K.B.; Cuddy, M.R.; Burch, S.D. ADVISOR 2.1: A User-Friendly Advanced Powertrain Simulation Using a Combined Backward/Forward Approach. IEEE Trans. Veh. Technol. 1999, 48, 1751–1761. [Google Scholar] [CrossRef]
- Energy Systems D3 2016 Mazda CX9 | Argonne National Laboratory. Available online: https://www.anl.gov/es/energy-systems-d3-2016-mazda-cx9 (accessed on 5 January 2022).
- US EPA. Combining Data into Complete Engine ALPHA Maps. Available online: https://www.epa.gov/vehicle-and-fuel-emissions-testing/combining-data-complete-engine-alpha-maps (accessed on 5 January 2022).
- Specifications for NCR 18650 GA Sanyo Lithium-Ion Battery. Available online: https://www.hurt.com.pl/prods/bat/_li_ion/ncr18650ga.pdf (accessed on 5 January 2022).
- Battery Management Systems, Volume 2: Equivalent-Circuit Methods. Available online: http://mocha-java.uccs.edu/BMS2/ (accessed on 8 January 2022).
- Variable-Order Equivalent Circuit Modeling and State of Charge Estimation of Lithium-Ion Battery Based on Electrochemical Impedance Spectroscopy. Available online: https://www.researchgate.net/publication/348950509_Variable-Order_Equivalent_Circuit_Modeling_and_State_of_Charge_Estimation_of_Lithium-Ion_Battery_Based_on_Electrochemical_Impedance_Spectroscopy (accessed on 16 November 2021).
- Dahbi, M.; Komaba, S. Chapter 16—Fluorine Chemistry for Negative Electrode in Sodium and Lithium Ion Batteries. In Advanced Fluoride-Based Materials for Energy Conversion; Nakajima, T., Groult, H., Eds.; Elsevier: Amsterdam, The Netherlands, 2015; pp. 387–414. ISBN 9780128006795. [Google Scholar]
- Wang, W.; Wei, X.; Choi, D.; Lu, X.; Yang, G.; Sun, C. Chapter 1—Electrochemical Cells for Medium- and Large-Scale Energy Storage: Fundamentals. In Advances in Batteries for Medium and Large-Scale Energy Storage; Woodhead Publishing Series in Energy; Menictas, C., Skyllas-Kazacos, M., Lim, T.M., Eds.; Woodhead Publishing: Thorston, UK, 2015; pp. 3–28. ISBN 978-1-78242-013-2. [Google Scholar]
- Cui, X.; Zeng, J.; Zhang, H.; Yang, J.; Qiao, J.; Li, J.; Li, W. Optimization of the Lumped Parameter Thermal Model for Hard-Cased Li-Ion Batteries. J. Energy Storage 2020, 32, 101758. [Google Scholar] [CrossRef]
- Moradi, M.H. Predictive Control with Constraints, J.M. Maciejowski; Pearson Education Limited, Prentice Hall, London, 2002, Pp. IX+331, Price £35.99, ISBN 0-201-39823-0. Int. J. Adapt. Control. Signal Process. 2003, 17, 261–262. [Google Scholar] [CrossRef]
- Camacho, E.F. Constrained Control and Estimation: An Optimization Approach, G. C. Goodwin, M. M. Seron and J. A. de Dona, Springer, Berlin. No. of Pages: 411. ISBN: 1852335483. Int. J. Robust Nonlinear Control. 2007, 17, 347–348. [Google Scholar] [CrossRef]
- Falcone, P.; Borrelli, F.; Tseng, H.E.; Asgari, J.; Hrovat, D. Linear Time-Varying Model Predictive Control and Its Application to Active Steering Systems: Stability Analysis and Experimental Validation. Int. J. Robust Nonlinear Control. 2008, 18, 862–875. [Google Scholar] [CrossRef]
- Wan, Z.; Kothare, M.V. Efficient Scheduled Stabilizing Output Feedback Model Predictive Control for Constrained Nonlinear Systems. IEEE Trans. Autom. Control. 2004, 49, 1172–1177. [Google Scholar] [CrossRef]
- Technical Guidelines for the Preparation of Applications for the Approval of Innovative Technologies Pursuant to Regulation (EC) No 443/2009 of The European Parliament and of the Council. European Commission: Brussels, Belgium, February 2013. Available online: https://circabc.europa.eu/sd/a/a19b42c8-8e87-4b24-a78b-9b70760f82a9/July%202018%20Technical%20Guidelines.pdf (accessed on 5 January 2022).
Publisher’s Note: MDPI stays neutral with regard to jurisdictional claims in published maps and institutional affiliations. |
© 2022 by the authors. Licensee MDPI, Basel, Switzerland. This article is an open access article distributed under the terms and conditions of the Creative Commons Attribution (CC BY) license (https://creativecommons.org/licenses/by/4.0/).