1. Introduction
One of Indonesia’s most widely used forms of transportation is the motorcycle, and the number of motorcycles in Indonesia reached 120 million units in 2018 (Central Statistics Agency, 2019). Innovations in electric vehicle and battery technology can provide transportation solutions that are environmentally friendly, energy-efficient, and have lower operating and maintenance costs [
1]. Thus far, these innovations have sparked growth in the production of electric vehicles, improvements in the construction and operating costs for the corresponding charging infrastructure, and the profound impact of heterogeneous electric vehicle fleets with different vehicle-specific charging powers [
2]. The Indonesian Government plans to shift from fossil fuel vehicles to electric vehicles through Presidential Regulation no. 55 of 2019 concerning the Acceleration of the Battery Electric Vehicle Program for Road Transportation. Public agencies and stakeholders need objective, equitable, and systematic processes for identifying candidate sites for situating charging stations [
3]. The system will become even more complex and less user-friendly as more actors join unless factors such as consolidation, regulation, or independent network orchestrators reduce this complexity [
4]. Developments in the analysis of the electric vehicle market with renewable energy economics and the infrastructural impact of electric vehicles have been studied with respect to their effects in reducing pollution [
5].
The city of Surakarta is a medium-sized city in Central Java, Indonesia. It is one of the centers of Javanese culture that has sustained aspects from its language, dance, and music to other traditional Javanese arts with a Surakarta style. Apart from standing as an independent city, Surakarta is also supported by agglomeration areas that help popularize this city. Surakarta City is one of the urban areas currently experiencing rapid development in trade, industry, services, settlement, education, and transportation sectors, as indicated by the level of traffic density. The city’s development triggers a high rate of population growth and the conversion of undeveloped land into built-up areas such as settlements, offices, hotels, malls, schools, and others. This increasing population density increases the number of transportation activities. Thus, carbon emissions also increase when such vehicles use fossil fuels.
Several studies have discussed the electrification of motorcycles. Transforming conventional motorcycles into electric motorcycles is very effective because it can directly reduce fossil fuels and directly impact carbon reduction [
6]. The associated study explains that the purchase price, model, vehicle performance, and infrastructure readiness are the most significant barriers to adopting electric vehicles. Therefore, a government-provided infrastructure development plan is needed to serve the community’s need for electric motorcycle-charging stations [
7]. This is very important to the development of a business plan for electric motorcycles that can be implemented to realize the government’s plan to reduce carbon emissions. Planning for the allocation of charging stations must consider the distance of consumers to the charging stations to be built [
8].
The innovation of electric vehicle technology is essential in order to provide solutions for transportation facilities that are environmentally friendly, energy-efficient, and have lower operating and maintenance costs [
1]. The authors of [
9] identified the market share of convertible electric motorcycles in Surakarta City. They concluded that the people of Surakarta City responded positively to the development of convertible electric motorcycles. From this research, it can be explained that the opportunity for developing electric motorcycles is quite significant. Electric vehicle innovation also encourages the entrance of new entities into the supply chain, including technopreneurs and start-ups from developers, suppliers, manufacturers, and distributors of electric vehicle products/services and their derivatives in the market [
10]. Therefore, a government-provided infrastructure development plan is required to serve the community’s need for electric motorcycle-charging stations. In determining the opening of a facility, one of the factors that must be considered is economies of scale [
11]. An efficient distribution–allocation–location system will minimize transportation costs [
12]. Developments regarding electric vehicles and various configurations regarding aspects of charging stations’ design are categorized based on optimizing the power used and optimal strategies for the future [
13].
Developing a location and allocation model is essential. Accordingly, feasibility studies on investment in factory establishments must be analyzed. Investment feasibility studies need to be carried out to provide an overview for stakeholders who will later be involved in procuring an operating a given charging station. Through the feasibility study, the stakeholders will be able to determine strategic decisions that related parties will use. After the stakeholders make decisions and plans, the procurement of charging station infrastructure will be more accessible and have more support for its construction. These plans are intended to be implemented in the next few years. Thus, the stakeholders involved can be optimistic about owning a charging station because they have a general picture of the profit earned, the business plan to be undertaken, and the rate of return on capital to build the charging station. In this case, the aspects that need to be considered include the power demand from consumers, the selection of charging stations that must be built to meet this power demand, the degree of investment required, and the operational costs incurred. This study is related to research by several Indonesian Ministries regarding emission-based vehicle tax regulations, feasibility tests for electric vehicles, and rates for electric vehicle charging stations. With this research, the commercialization of electric motorcycles as a substitute for conventional motorcycles in Indonesia can be realized faster.
One of the critical factors in the diffusion of electric vehicle technology is the availability of the infrastructure to meet the needs of electric vehicles. Therefore, planning to construct a charging station is essential to help accelerate the commercialization of electric motorcycle technology. This research has many benefits for stakeholders and other researchers in terms of resolving the confusion with respect to deciding the right location concerning the Maximal Covering Location Problem, the reason the location is chosen, and providing an overview of the costs and benefits of the charging station construction project that will be carried out. The limitation of this research lies in its coverage of the condition of demand, in which only references are used as an illustration of the system in Surakarta. This is because there is little demand for electric motorcycles in circulation. With these limitations, this research is expected to provide an overview of conditions for future infrastructure development.
This paper is structured as follows:
Section 2 provides a literature review on the study of the development of electric motorcycle charging stations. In addition, the literature review contains optimization methods and cost analyses used in previous studies.
Section 3 describes the methodology and stages of our research. The results of the optimization and calculation of the B/C ratio are presented in
Section 4.
Section 5 describes the results obtained in
Section 4, and this section also describes the benefits of the construction of a charging station. Finally,
Section 5 discusses the main findings and conclusions of this paper.
2. Literature Review
Various countries have made many plans to develop charging stations to meet the needs of electric vehicles. Technological developments in transportation have significantly impacted the environment and people’s daily lives. The authors of [
14] conducted a study to determine the optimal locations and the types of charging stations installed using Mixed-Integer Non-Linear Programming (MINLP) optimization. The aspects considered in planning regarding the location of EV charging stations stem from the problem of locating public facilities [
15]. The central planner allocates the supply or services to meet demand based on nodes in a spatial network, for example, the location of electric taxi-recharging stations [
16] and electric charging (EV) stations [
17,
18]. Optimal location modeling is also carried out using a stochastic optimization method by considering the cost and reliability of the charging station [
19]. Concerning plans to build charging stations or services for electric motorcycles, it is necessary to study the feasibility of investment and the techno-economics that support the program. In addition, site selection also supports decisions in determining development costs and the services provided to customers. This study explains that the use of electric road systems can significantly reduce peak BEV charging by distributing charging intervals throughout the day. We also found a considerable difference between the maximum possible and minimum charge required on electric road systems [
20]. A corresponding mathematical model was developed, which incorporates a site survey, EV density, an electricity demand analysis, load modeling, a cost analysis, EV battery charging time, and power quality [
21].
Several studies use scalogram analysis to determine service centers in an urban area [
22]. In the cited authors’ research, a linear programming method is used to design the optimal location selection model for the construction of charging stations. Scalogram analysis and the centrality index are also used to determine service points that are easily accessible by the community. The scalogram method is an analytical technique used to identify the distribution of functions of social and economic service facilities as well as the hierarchy of development centers and development infrastructure. In addition, this study also uses a techno-economic analysis model for government investment in developing public services in the form of supporting infrastructure for the development of electric motorcycles. Charging strategies may be more relevant for fleets than personally owned EVs [
23].
The location of charging stations for electric motorcycles has been researched using many methods. An activity-based approach was developed for planning charging station infrastructure and the impact of this charging station on the mileage of an electric vehicle by evaluating the feasibility of the electric vehicle’s battery [
24]. In this particular case, the location of the charging station is accounted for by using demographic and decision rules [
25]. Pervasive mobility data become one of the decisions in optimizing the location of charging stations through a discrete optimization problem-solving technique that minimizes the distance needed to charge an electric motorcycle [
26]. A strategy for determining the location of charging stations in urban areas that uses an agent-based simulation has been developed [
27].
There are several studies on the economic benefits of charging infrastructure. One study analyzes cost reduction and minimizing the impact on local grids (energy storage and charging systems) from a technical and economic point of view [
28]. However, this research mainly focused on evaluating the economic benefits of energy storage charging stations, and the authors’ models do not involve social and environmental benefits. Another study developed a rule-based energy management (REMS) scheme to study the benefits of grid-connected electric vehicle photovoltaic charging stations [
29]. Although this study considers the benefits of photovoltaic charging stations in reducing the network load, the main concern remains the maximum benefits of a charging station. Based on the life cycle theory, [
30] proposed a model to analyze the economic and environmental benefits of using photovoltaic panels to charge EVs in a Dutch workplace and evaluate the impact of network-connected tariffs on photovoltaic income. The feasibility and profitability of a grid-connected photovoltaic power plant was analyzed via sensitivity analysis, which showed that photovoltaic power generation is economically feasible [
31]. At the same time, they analyzed and quantified the reduction in pollutant emissions from photovoltaic charging stations. The results show that photovoltaic power plants have high potential for reducing pollutant emissions. In another study, the economic and environmental benefits of PV charging stations were analyzed from the perspective of electrical facilities using the energy balance analysis method [
30]. The model analyzed the impact of parking fees, PV installation costs, incentives, motorcycle prices, and more factors, which provide a reference for studies of the benefits of PV charging facilities. Renewable energy is used as a preferential method to charge electric motorcycles and store the renewable energy in battery packs when there is no charging load in a station. Their work discusses the economics of photovoltaic energy system charging stations based on energy management strategies [
32].
One study used net present value (NPV) to evaluate the costs and benefits of photovoltaic charging stations with second-use battery energy storage [
33]. They concluded that using a battery-based energy storage system in a photovoltaic charging station will increase the annual profit limit. However, the above research only involves economics and the benefits of the charging station itself and does not consider social and environmental benefits. Several studies described in
Table 1 have discussed the cost–benefit relationship of the existence of electric vehicle technology. Many of them accommodate technical, economic, and environmental aspects. Many researchers still need to adapt the social aspect and provide an overview of the types of levies used in their research. Our research accommodates the social aspect because the selection of the location’s selection is based on community activities. In addition, this study considers the power supply and types of charging used in the community.
3. Methodology
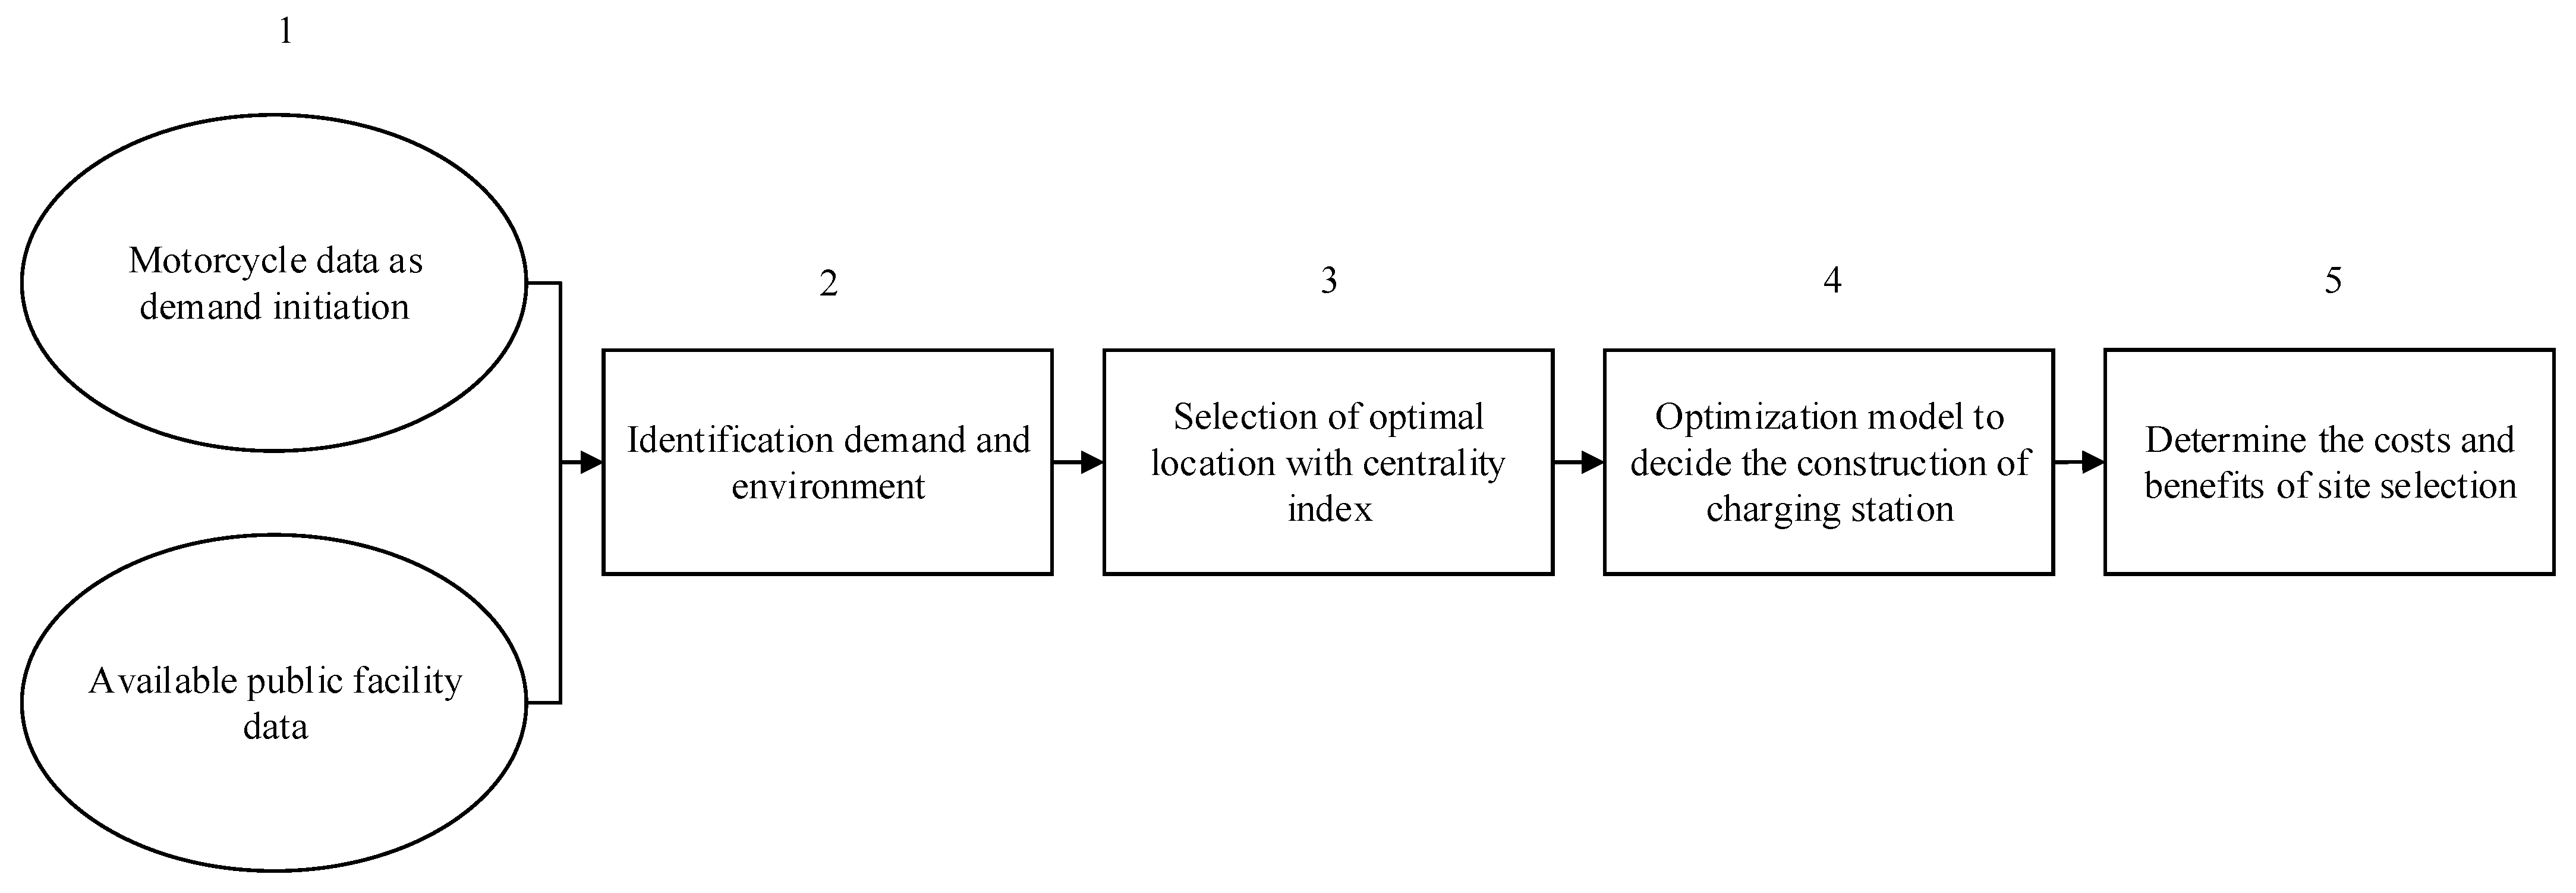
This section describes our approach for determining appropriate points for constructing charging stations. The material discussed at this stage concerns the locations generated from the calculation of the centrality index. The point of the charging station is determined to reach more customers. We created an optimization model to help ensure that the charging station can be situated with the minimum total service cost. The service cost is calculated based on the driving distance between the location of a customer and a charging station point. The corresponding research flow is visualized in
Figure 1.
Step 1: Collecting motorcycle data as an initiation of demand and available public facilities data is the first step of the research. Motorcycle user data were obtained from the calculation of 5% of the population of motorcycle users.
Step 2: Identification of demand and environment is a collection of requests from the data in step 1 regarding the completion of an optimization model with optimal coverage. This step will identify the demand and coverage of the location that will be used as the research location, and this step also identifies the variables used in modeling.
Step 3: This step focuses on selecting the optimal solution that generates a list of suitable points for the charging station. The point selection is based on population activities so that the social aspect is examined from the community side. The point selection process uses a centrality index and a scalogram.
Step 4: Step 4 will explain the optimization model that decided the construction of a charging station at the selected location in step 3. This step validates the selection of a charging station’s construction point based on cost.
Step 5: The costs and benefits of building a charging station at a given point are identified. We analyze the cost–benefit relationship of procuring a charging station to serve the community’s needs. Besides NPV analysis, there is another method with which to evaluate and compare the economic performance of one or more investments, namely, the benefit–cost ratio (B/C) [
34,
35]
3.1. Operational Data and Public Facility Data
In this study, the charging infrastructure is optimized for electric motorcycles. Therefore, we use motorcycle user data as the initial demand to estimate the number of charging stations and possible charging locations (Step 1). In addition, this study uses data on existing facilities to determine locations with dense user activity. With these data, it can be illustrated that the charging points are crowded with electric vehicle users. Social and economic factors will influence the location of the charging station’s construction in this study.
The locational data that will be selected comprise several public facilities with many community activities. These locations encompass the following:
Education clusters consisting of elementary schools, junior high schools, and university campuses;
Health clusters with pharmacies, clinics, health centers, and various types of hospitals;
Office clusters made up of small and large offices;
An entertainment cluster involving a playground and a shopping center;
Clusters of public places such as football fields, city parks, and cemeteries.
In addition, places of worship of various religions are also considered in choosing the locations for constructing charging stations.
3.2. Identification of Charging Demand and Environment
The estimation of charging demand is based on two questions: (i) How many charging station points can cover the demand? (ii) Where is the most frequent vehicle location at the appropriate time for charging? Charging during customer trips should be avoided. This study uses scenarios focused on crowded places for customer activities and aims to allow electric motorcycle users to charge their vehicles while carrying out daily activities. Customer activities can be generated from facilities included in the model’s consideration so that it is easier for users to determine the charging location from the destination. Therefore, it will be easier for the customer to have a charging station in the vicinity of the activity they perform. Furthermore, it would be better to have a charging station near the location of the corresponding user activity after the vehicle has been charged. In this context, we consider the start and end locations of a user trip as suitable points for charging from the user’s perspective. Consequently, the travel time between the locations where the electric motorcycle must be charged and the charging station will be minimized. Our research does not incorporate any information about energy consumption during travel. Therefore, more electric motorcycles will look for charging stations in areas with many starting/ending locations, i.e., densely populated locations with many community activities. Hence, higher charging demand is expected (Step 2).
One study provided the design and prototype of a buck–boost converter for dual-mode lithium-ion battery charging (buck and boost mode) and the implementation of the Multi-Step Constant Current Method (MSCC) algorithm with an optimal charging pattern (OPT) to perform fast charging under voltage, current limit, and temperature monitoring [
36]. In this study, we focus on Surakarta City, and the data show the population density in Surakarta in 2020 as and is illustrated in
Figure 2 [
8]. It indicates that population activities are very spread out and varied. When choosing the point for the procurement of charging stations, it will be chosen with respect to maximizing the ease with which it can be accessed from locations where people are most active. Finally, locations around the city center offer above-average possibilities for recreational activities and attract more people who live further afield. We can also observe several “hot spots” far from the city center [
8]. These are primarily districts with public facilities such as hospitals or train stations. In areas with a higher number of starting and ending locations, the probability of many vehicles—especially motorcycles—starting or ending the journey is higher. As electric vehicles appear more frequently in these locations, the demand for refills will also increase. As a result, we selected the frequency of start and end locations as indicators of fill requests.
We use non-swap battery-charging stations as the study objects. The charging technology is applied faster to accelerate the commercialization of electric vehicles.
Table 2 describes the four types of charging stations that the Indonesian Government has set. Level 3 was chosen to be the charging station that can adequately serve the needs of the communities because of its sufficient capacity and low investment costs. Levels 1 and 2 are used for personal use; thus, they do not require a large amount of power from the residence of the electric motorcycle owner. Charging level 4 has the largest capacity. However, currently, Indonesia does not yet have much demand. Therefore, our research does not consider charging level 4. Charging level 4 might be developed if the market in the research location is already high. Demand and cost data used in this study are based on annual calculations.
3.3. Selection of Optimal Location with Centrality Index
This research aims to determine charging station locations using centrality indices and scalability. The locations will show the density of community activity. Therefore, the locations in this research were analyzed from the available public facilities. With the number of customers and public facilities available, the locations have a fairly dense activity level. This study also considers the average speed of electric vehicles. Over a large area, the likelihood of finding a suitable point for a charging station is higher. Therefore, we develop a model that facilitates the discovery of the best charging station locations with optimum costs.
3.4. Optimization Model to Decide the Construction of the Charging Station
This optimization model aims to decide whether a filling station should be built at a point in the village with a higher hierarchical level (see
Table 3). This study’s mathematical model formulation follows the steps described previously (see
Figure 1). The development of the linear programming model is illustrated in the workflow diagram shown in
Figure 1. The figure represents the steps for developing an optimization model to minimize the costs of building the charging stations and service costs while meeting all charging needs. We use the LINGO programming language to formulate and solve the optimization model. The following elaborates on the optimization model, containing objective functions, decision variables, and problem constraints.
which is subject to:
where
Decision variables:
- ○
—The decision variable. If a charging station should be built at the point 𝑗, = 1; if not, = 0.
- ○
—The decision variable. If the charging station in point j fulfills the demand for power in location (village) i, = 1; if not, = 0.
Parameters:
𝑛—Number of locations (villages) to be served by the charging station;
𝑚—Number of locations (villages) where a charging station can be built;
L—Power levels to be accommodated {1, 2, 3, and 4} (see
Table 3);
—Charging station’s power capacity level l (kW);
—Cost of building a charging station with the capacity level l per kW (IDR);
—Transportation costs for charging station services (IDR);
—Total number of EVs that have charging requirements in the location (village) 𝑖;
𝑑𝑖𝑗—Distance between the center point of the location (villages) i and the charging station at point 𝑗 (Km);
—Average driving speed of EV in the city (Km/h);
—Population of the location (villages) 𝑖;
—Power plug in the charging space (kW)
—Electric motorcycle power (kW)
—Percentage of the population owning electric motorcycles in all locations (villages);
—Percentage of owners who regularly use the electric motorcycles.
Table 3.
Centrality index location.
Table 3.
Centrality index location.
| No | Districts | Village | Centrality Index | Hierarchy |
|---|
| 1 | Jebres | Mojosongo | 2138.61 | I |
| 2 | Jebres | Jebres | 1674.21 | II |
| 3 | Banjarsari | Kadipiro | 1193.27 | IV |
| 4 | Pasar Kliwon | Semanggi | 1064.30 | IV |
| 5 | Serengan | Danukusuman | 914.22 | V |
| 6 | Serengan | Kemlayan | 892.84 | V |
| 7 | Laweyan | Pajang | 813.42 | V |
| 8 | Jebres | Pucangsawit | 805.35 | V |
| 9 | Banjarsari | Gilingan | 766.77 | V |
| 10 | Jebres | Jagalan | 745.07 | V |
| 11 | Serengan | Serengan | 668.14 | V |
| 12 | Serengan | Tipes | 636.99 | V |
| 13 | Banjarsari | Sumber | 578.54 | VI |
| 14 | Banjarsari | Banyuanyar | 570.75 | VI |
| 15 | Serengan | Joyotakan | 560.96 | VI |
| 16 | Banjarsari | Manahan | 546.58 | VI |
| 17 | Serengan | Jayengan | 537.91 | VI |
| 18 | Banjarsari | Mangkubumen | 531.52 | VI |
| 19 | Jebres | Sudiroprajan | 492.31 | VI |
| 20 | Banjarsari | Nusukan | 482.79 | VI |
| 21 | Laweyan | Panularan | 461.80 | VI |
| 22 | Pasar Kliwon | Kauman | 458.38 | VI |
| 23 | Laweyan | Purwosari | 454.99 | VI |
| 24 | Laweyan | Sondakan | 450.86 | VI |
| 25 | Pasar Kliwon | Gajahan | 445.06 | VI |
| 26 | Serengan | Kratonan | 422.97 | VI |
| 27 | Banjarsari | Timuran | 382.48 | VI |
| 28 | Laweyan | Kerten | 345.61 | VI |
| 29 | Banjarsari | Keprabon | 343.67 | VI |
| 30 | Jebres | Purwodiningratan | 337.15 | VI |
| 31 | Jebres | Gandekan | 328.70 | VII |
| 32 | Banjarsari | Setabelan | 325.30 | VII |
| 33 | Pasar Kliwon | Joyosuran | 325.08 | VII |
| 34 | Banjarsari | Kestelan | 322.72 | VII |
| 35 | Banjarsari | Punggawan | 292.18 | VII |
| 36 | Pasar Kliwon | Kedung Lumbu | 284.18 | VII |
| 37 | Pasar Kliwon | Kampung Baru | 273.20 | VII |
| 38 | Pasar Kliwon | Sangkrah | 257.44 | VII |
| 39 | Pasar Kliwon | Pasar Kliwon | 250.27 | VII |
| 40 | Laweyan | Karangasem | 249.66 | VII |
| 41 | Laweyan | Penumping | 215.28 | VII |
| 42 | Jebres | Sewu | 204.39 | VII |
| 43 | Laweyan | Sriwedari | 201.83 | VII |
| 44 | Pasar Kliwon | Baluwarti | 199.13 | VII |
| 45 | Laweyan | Jajar | 180.58 | VII |
| 46 | Banjarsari | Ketelan | 173.45 | VII |
| 47 | Jebres | Tegalharjo | 156.47 | VII |
| 48 | Jebres | Kepatihan Kulon | 127.73 | VII |
| 49 | Laweyan | Bumi | 127.65 | VII |
| 50 | Jebres | Kepatihan Wetan | 100.46 | VII |
| 51 | Laweyan | Laweyan | 34.99 | VII |
The first Equation (1) states the objective function that minimizes charging station infrastructure development costs and transportation costs incurred by charging station users for charging electric motorcycles. Equation (2) shows the decision variable for building a charging station at a certain level, and Equation (3) shows the decision variable for deciding whether the charging station facility will meet the electric vehicle’s charging services demand. Equation (4) shows that location (villages) i will not be served if a charging station is not built. Equation (5) shows the constraint wherein the service provided by the charging station has a limit that cannot exceed the needs of the community. In addition, Equation (6) shows that the demand for charging station power is obtained from a large percentage of electric vehicle users in the population. This model will prove that charging station services can satisfy all existing demands by optimizing the costs incurred to build charging stations and service costs.
3.5. Determining the Costs and Benefits of Site Selection
The final step (Step 5) is to provide an overview of the costs that will be incurred for the construction of the charging station and the benefits obtained at the selected point based on stakeholder decisions regarding local planning and installation of charging infrastructure. The primary considerations are based on the following:
Local prospects and possibilities;
Economics and partnerships;
Consumer acceptance and appearance;
Expandability.
The selected site points represent basic concepts in a grid size suitable for stakeholder consultation. Experts can analyze real estate possibilities, actual power grids, transportation extensions, and connections to decide on local prospects and possibilities. From an economic point of view, partnerships for the installation and operation of charging infrastructure are very important for users of electric motorcycles and other vehicles as representatives of a portion of the stakeholders. Surakarta City Government supports design, display, and marketing. To avoid competition between users of the same charging outlet, the number of charging points continuously increases, with the decision to expand based on charging station occupancy.
4. Results
This section presents the results of the optimization model. Our initial analysis concludes that charging level 3 is the most feasible type for the City of Surakarta. The charging request is estimated based on motorcycle data from 2020, containing information on around 27,000 vehicles with 1–3 charging times a week. Based on the charging demand, we identified areas to place the charging stations. Next, we compared different scenarios with a varying number of charging stations and investigated their impacts on road network coverage, benefits, and costs.
4.1. Demand Satisfactory
Our study results indicate that five points were chosen to be the locations for constructing the charging stations. The selected points have high activity density. The selected points are villages that can cover the district area. These points have a reasonably optimal cost for serving the demand for the electric motorcycles in the vicinity.
4.2. Binary Allocation
Each district’s charging station point can be obtained using binary allocation from the optimization model. The results are shown in
Table 2, which shows the location of the charging station in each district throughout the village. The charging station point is the location where a charging station will be built, which can later serve requests from surrounding locations (CS Serviced).
4.3. Sensitivity Analysis
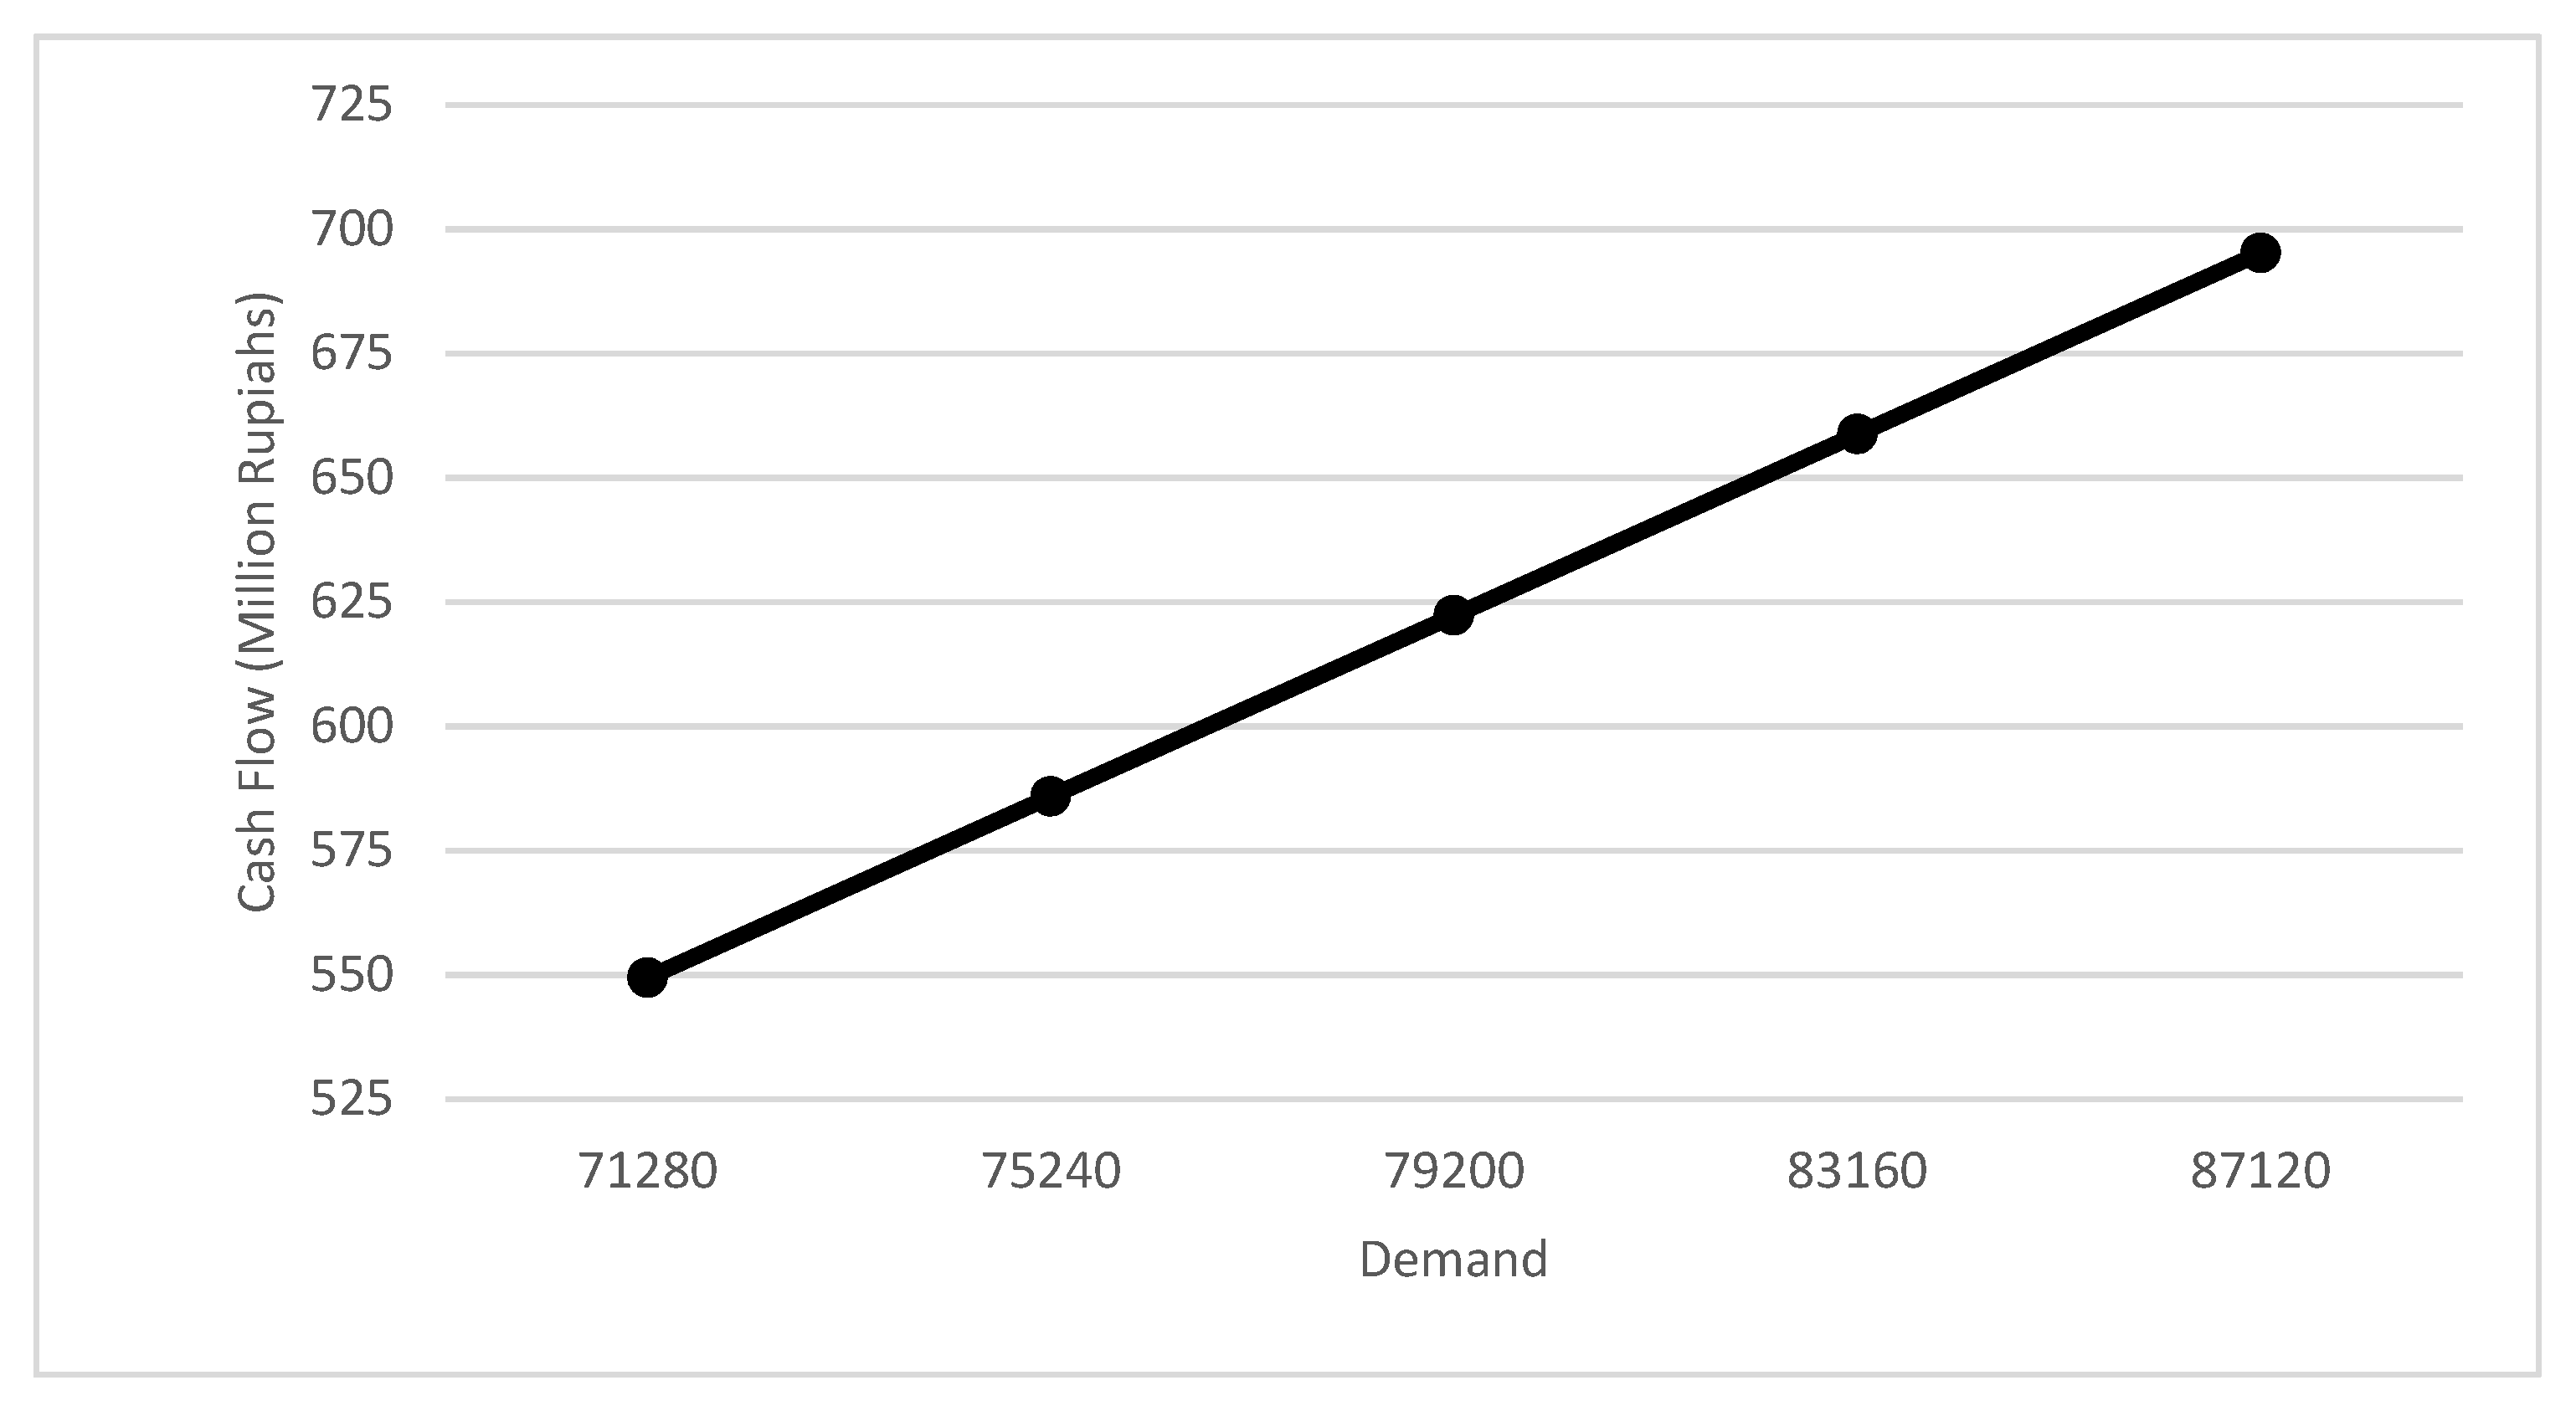
We performed sensitivity analysis through two sets of scenarios by altering the demand and the cost per kWh. In the first set of scenarios, we increased the demand for 79,200 vehicles by 5% and 10% and then decreased it by 5% and 10%. This resulted in 83,160, 87,120, 75,240, and 71,280 cars. The result of this analysis is shown in
Figure 3.
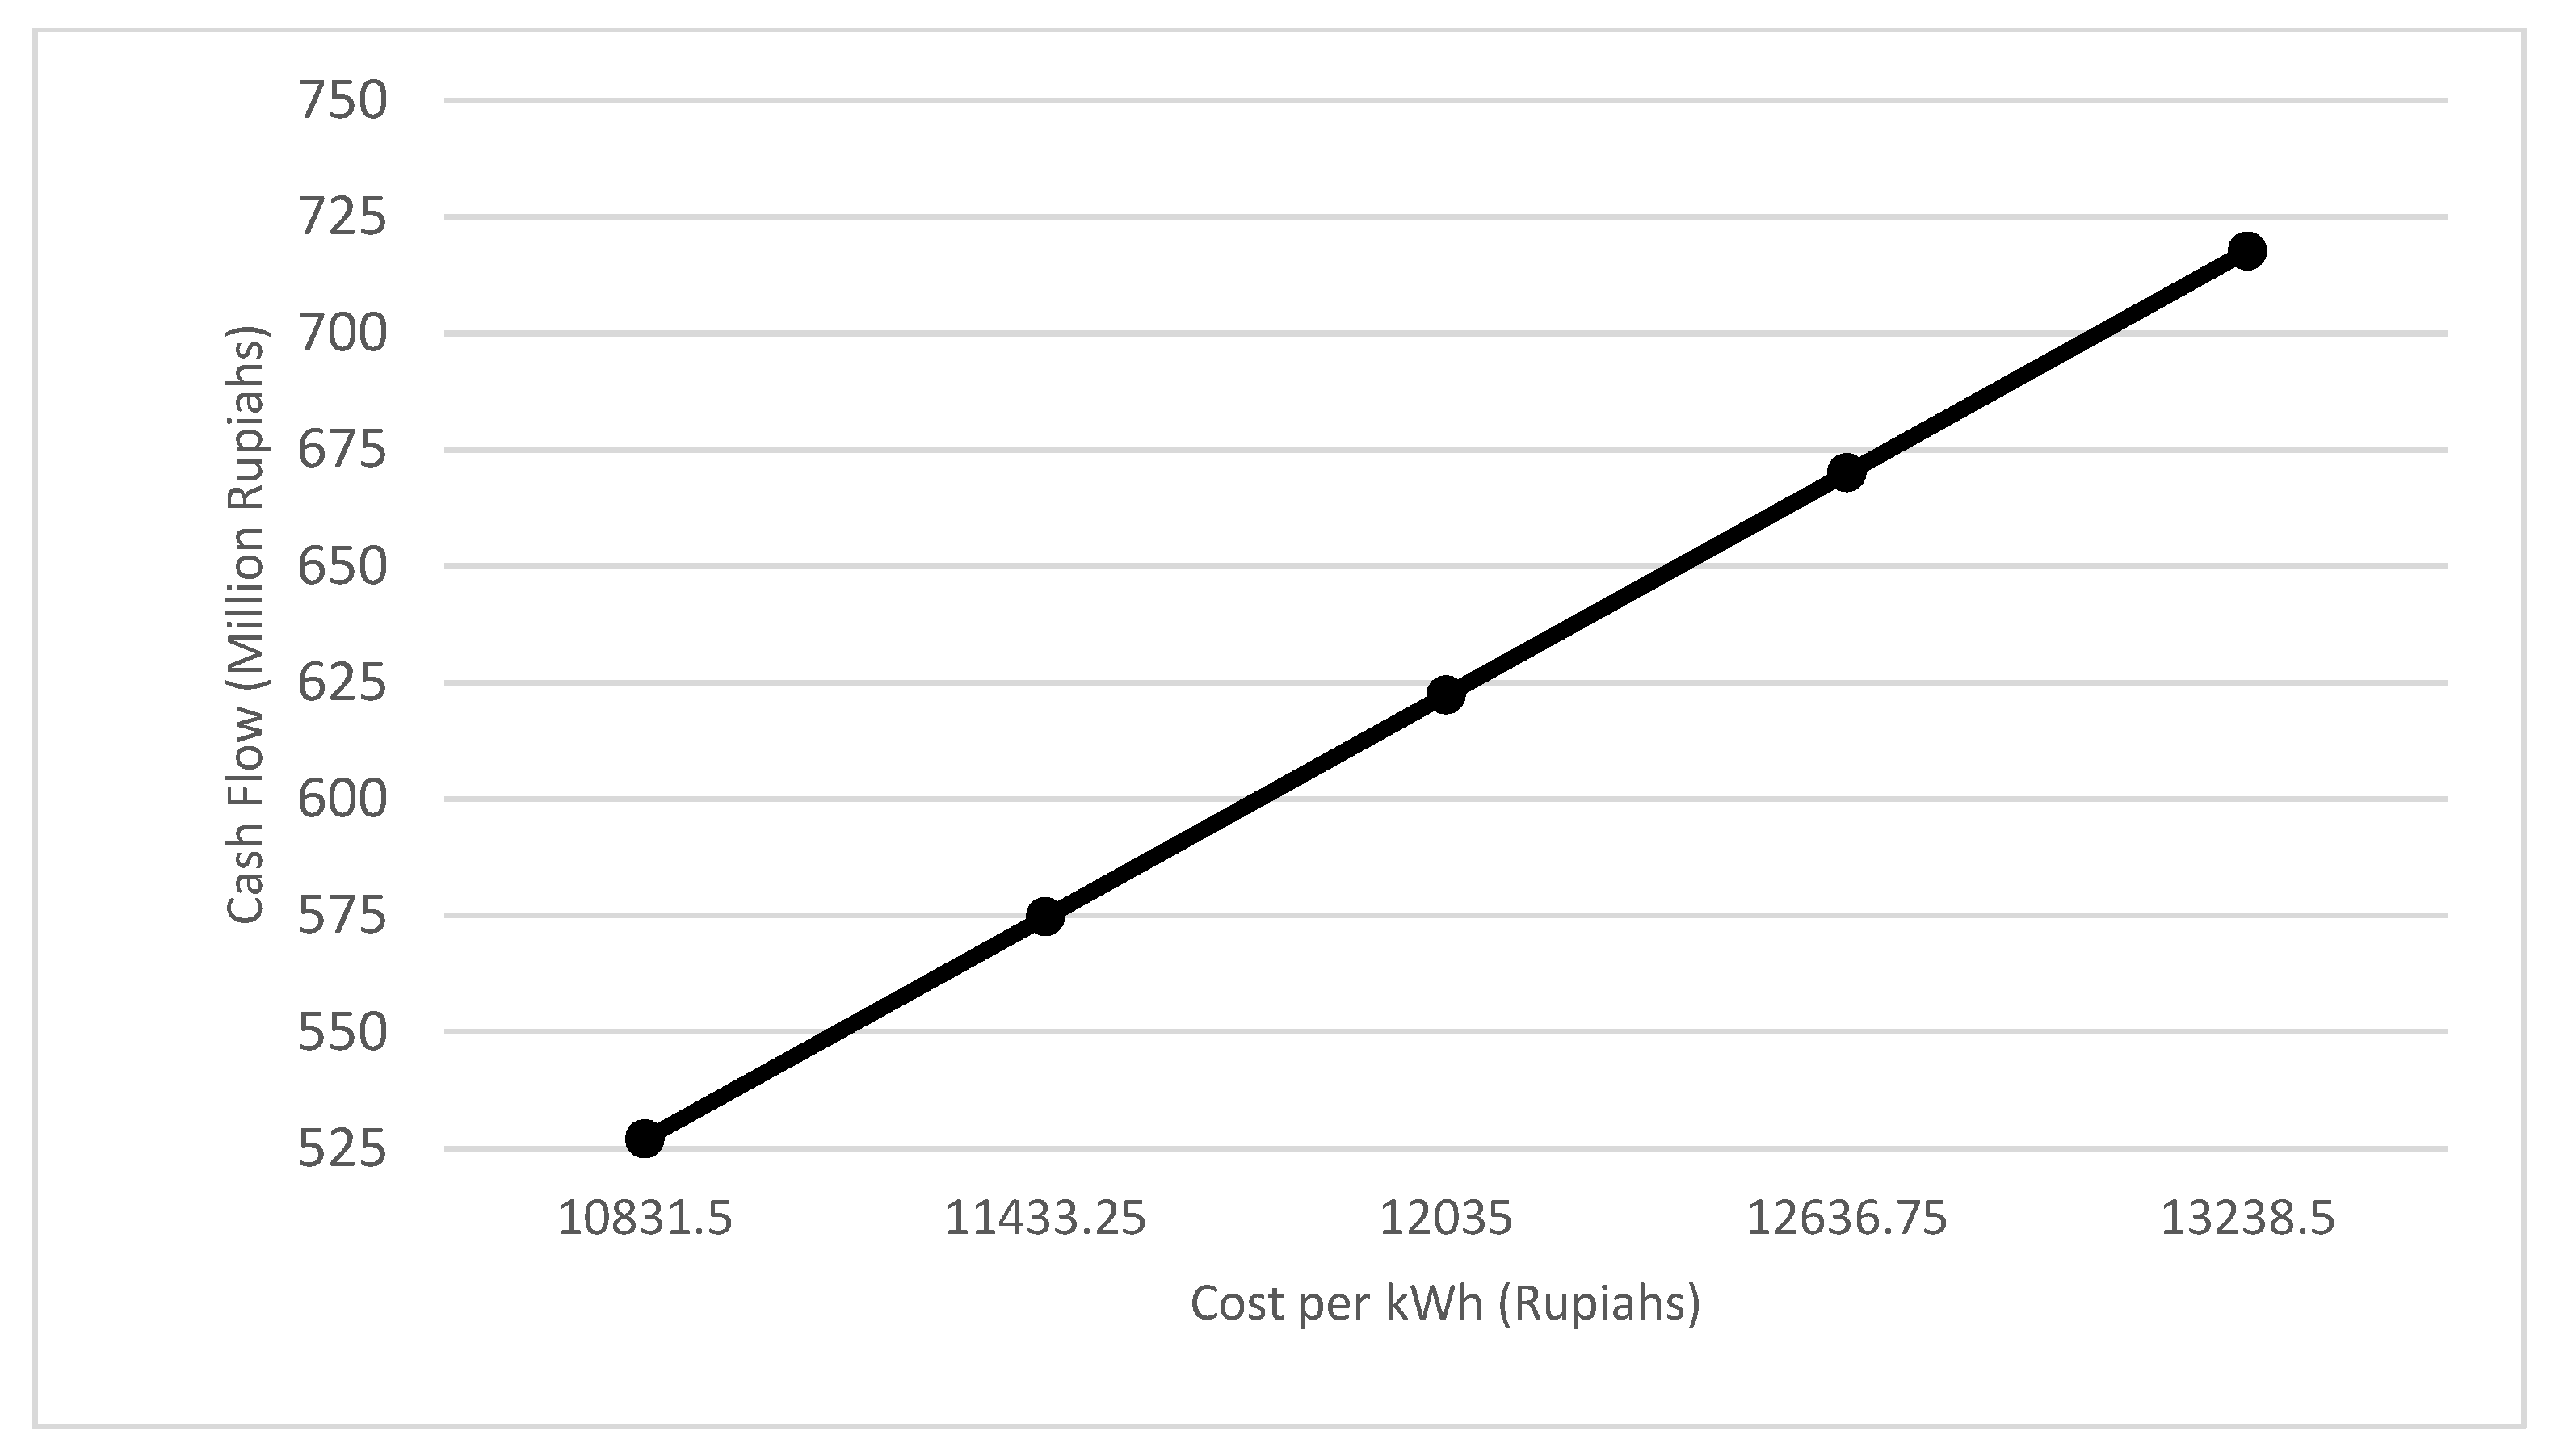
In the second set of scenarios, we altered the price per kWh. The initial cost per kWh is IDR 12,035.00. We changed the cost by +5%, +10%, −5%, and −10%, or IDR 12,636.75, IDR 13,238.50, IDR 11,433.25, and IDR 10,831.5, respectively.
Figure 4 shows the result of the sensitivity analysis performed on the second set.
The sensitivity analysis results in this study provide evidence that our model is sensitive to changes in several parameters. We use the demand and power price as modifiable variables. Demand is one of the variables that will continue to change within technological development and commercialization. The power price for electric charging will also change if there is a new policy or increasing demand. This shows that the model is valid.
4.4. Economic, Social, and Environmental Benefits
In this part of the research, we consider charging station construction’s economic, social, and environmental aspects. We compile aggregated benefits for each element based on prior research. Economic factors consist of fuel-saving and economic development. Social aspects include national security and health impacts, whereas environmental elements are related to CO
2 emissions reduction [
37].
Table 4 shows the benefits of the charging station according to [
37].
Based on
Table 4, we calculated the value of each participant’s prospects of receiving benefits based on the demand in Surakarta City. We calculated the benefits for each mile, and the results became the basis for calculating the benefits in our research. The results are shown in
Table 5.
A benefit–cost ratio (BCR) has been calculated using the converted costs from [
37]. Benefits include economic, environmental, and social impacts.
Cost (IDR/year) = IDR 324,336,000.00 [
8].
With a BCR value above 1, procuring a charging station to serve the power demand from the community is considered feasible. This value indicates that the business’s development is beneficial.
5. Discussion
The model developed in this study is structured so as to provide an overview and optimal solution for accelerating the commercialization of electric motorcycle technology in Surakarta. This study has calculated the feasibility of investing in planning the construction of a charging station. In addition, the developed model accounts for minimizing investment and service costs at charging stations and considers the demand for coverage. The selection of the charging station’s construction site uses the centrality index as the optimal locational parameter to choose from. Service allocation uses a model to optimize the demand for electric motorcycle services. This model validates several charging stations that can serve requests from motorcycle users in Surakarta City, selected via their centrality index value. The optimization model also determines the allocation of charging station services for servicing electric motorcycles. It is very important for stakeholders to help them carry out construction planning.
Sensitivity analysis was carried out using two sets of scenarios: changes in the number of requests and electricity prices. The sensitivity analysis shows that the profit earned still changes according to the conditions of demand and the price of existing electric power. Thus, the compiled model has been validated. In addition, the benefits and costs obtained in this study have been considered and included in government policies and adapted to the conditions of existing installations in Indonesia. The policies include subsidies in development, determining the selling price of electricity to the public, and other sources of cost calculations. These investment feasibility analysis results are used to determine the business investment that will be planned later. The investment feasibility analysis in this study provides a new general picture for investors and the government in terms of determining strategic and tactical plans for the construction of charging stations.
This study has limitations, notably, it has not produced a simultaneous model. The investment feasibility analysis model is calculated separately from the charging station allocation model. In addition, it needs support from the simulation results to determine the optimal service time, operational time, and the increase in demand per unit time to provide better customer satisfaction. This would also make the model closer to the actual conditions of adopting electric motorcycles. Furthermore, this study considers only one type of motorcycle and assumes that all-electric motorcycles have exact specifications and power demand. The type of charging station developed has also been considered to meet the needs of electric motorcycles, which will be developed later.
The analysis results using the benefit–cost ratio method show that the filling stations selected at each location are feasible to build. This is indicated because the BCR value is >1. The benefit–cost ratio analysis was calculated based on the benefits obtained from social, economic, and environmental aspects. This research shows many positive impacts if the charging station can serve the demand for electric vehicles. This impact is influential on life in general and for society in particular. This impact will be described in more detail according to the aspects affected by the decision to build a charging station. By using the centrality index to determine the location of filling stations, it is easier for people to find charging services in their vicinity. From the results described in
Table 6, it can be seen that the selected location (CS Point) can serve several areas (CS Serviced) optimally because all demands are served. This research does not have a direct impact on reducing CO
2 emissions. However, this research illustrates that community activities are an essential factor in determining the location of a charging station’s construction. This study’s social, economic, and environmental benefits are described below.
This study developed a model for determining the location of a charging station for the general public’s electric motorcycle power demand. With this research, the commercialization of motorcycle technology can be realized more quickly. This is because the city government, stakeholders providing electric motorcycles, charging station service providers, and electric motorcycle users do not need to determine the optimal charging stations through trial and error. The discussions and experiments carried out can be minimized. With the acceleration of this technology’s commercialization, it will be faster for vehicle users to convert their conventional vehicles into electric vehicles. On the other hand, a well-distributed charging station can positively impact the customer because it is more efficient and easily accessible, and more customers can use this infrastructure. Moreover, this infrastructure supports environmentally friendly electric vehicles, thereby minimizing greenhouse gas emissions and bringing significant environmental benefits.
Charging stations are equipped with specific capacities and specifications so that a well-distributed charging station can satisfy the demands of electric motorcycle users. From an indirect social perspective, the charging station business can reduce the purchase of fossil fuels for use in conventional vehicles. Another social benefit is that the optimization model has been tested with respect to determining the point of the charging station’s construction. There is no need for a detailed study of the development of electric motorcycle technology. It is easier for people to replace conventional vehicles with electric vehicles because one of the essential factors (infrastructure) in this commercialization has been fulfilled.
6. Conclusions
This study presents a method for finding the optimal location to place a predetermined number of charging stations. The goal is to meet the maximum power needs of electric motorcycles. The selected point is further analyzed regarding cost optimization so that the number of requests based on the number of user activities in the area is considered in the model. This model for validating charging station construction points has been developed to support active communities in minimizing the distance from an activity’s location to the location of the charging station. Demand in a region can be met by one charging station at the exact location and partially by a nearby charging station. In addition, optimization issues allow for the integration of existing charging stations, enabling the iterative development of the charging infrastructure. Finally, the simple structure of the optimization problem allows for a precise solution. The result is one location that is representative of the sub-district. Decision makers should determine the exact location of the charging station based on environmental constraints. This study’s results support decision making regarding the introduction of electric motorcycles in Surakarta City, Indonesia.
By utilizing the results of this study, the distribution of charging stations in Surakarta will be in line with the pattern of its residents’ activities. This will be further investigated in a planned follow-up project where charging stations and electric vehicles will be operational. With different behavioral variables of electric vehicle users, this can be solved by a dynamic system simulation model. However, this is a topic for future research activities, which will optimize the expansion of different charging stations with additional charging points.
Author Contributions
Conceptualization, W.S. and H.W.; methodology, W.S.; software, S.I.; validation, W.S., M.H. and H.W.; formal analysis, W.S.; investigation, S.I.; resources, M.H.; data curation, M.H.; writing—original draft preparation, S.I.; writing—review and editing, W.S.; visualization, S.I.; supervision, H.W.; project administration, M.H.; funding acquisition, W.S. All authors have read and agreed to the published version of the manuscript.
Funding
This research was funded by the Institution of Research and Community Services, Universitas Sebelas Maret, through the program “Penelitian Unggulan Terapan (PUT-UNS)”, grant number 254/UN27.22/PT.01.03/2022, 15 March 2022.
Data Availability Statement
Not applicable.
Acknowledgments
We thank the Institution of Research and Community Services, Universitas Sebelas Maret.
Conflicts of Interest
The authors declare no conflict of interest.
References
- Sutopo, W.; Astuti, R.W.; Purwanto, A.; Nizam, M. Commercialization model of new technology lithium ion battery: A case study for smart electrical vehicle. In Proceedings of the 2013 Joint International Conference on Rural Information & Communication Technology and Electric-Vehicle Technology (rICT & ICeV-T), Bandung, Indonesia, 26–28 November 2013. [Google Scholar]
- Fischer, M.; Hardt, C.; Elias, J.; Bogenberger, K. Simulation-Based Evaluation of Charging Infrastructure Concepts: The Park and Ride Case. World Electr. Veh. J. 2022, 13, 151. [Google Scholar] [CrossRef]
- Desai, J.; Mathew, J.K.; Li, H.; Bullock, D.M. Leveraging Connected Vehicle Data to Assess Interstate Exit Utilization and Identify Charging Infrastructure Investment Allocation Opportunities. World Electr. Veh. J. 2022, 13, 167. [Google Scholar] [CrossRef]
- Figenbaum, E.; Wangsness, P.B.; Amundsen, A.H.; Milch, V. Empirical Analysis of the User Needs and the Business Models in the Norwegian Charging Infrastructure Ecosystem. World Electr. Veh. J. 2022, 13, 185. [Google Scholar] [CrossRef]
- Mopidevi, S.; Narasipuram, R.P.; Aemalla, S.R.; Rajan, H. E-mobility: Impacts and analysis of future transportation electrification market in economic, renewable energy and infrastructure perspective. Int. J. Powertrains 2022, 11, 264. [Google Scholar] [CrossRef]
- Habibie, A.; Sutopo, W. A Literature Review: Commercialization Study of Electric Motorcycle Conversion in Indonesia. IOP Conf. Ser. Mater. Sci. Eng. 2020, 943, 012048. [Google Scholar] [CrossRef]
- Utami, M.W.D.; Yuniaristanto, Y.; Sutopo, W. Adoption Intention Model of Electric Vehicle in Indonesia. J. Optimasi Sist. Ind. 2020, 19, 70–81. [Google Scholar] [CrossRef]
- Istiqomah, S.; Sutopo, W. Optimization of Network Design for Charging Station Placement: A Case Study. In Proceedings of the 5th NA International Conference on Industrial Engineering and Operations Management, Detroit, MI, USA, 10–14 August 2020. [Google Scholar]
- Jodinesa, M.N.A.; Sutopo, W.; Zakaria, R. Markov Chain Analysis to Indentify the Market Share Prediction of New Technology: A Case Study of Electric Conversion Motorcycle in Surakarta, Indonesia. AIP Conf. Proc. 2020, 2217, 030062. [Google Scholar]
- Yuniaristanto; Wicaksana, D.E.; Sutopo, W.; Nizam, M. Proposed business process technology commercialization: A case study of electric car technology incubation. In Proceedings of the 2014 International Conference on Electrical Engineering and Computer Science, Kuta, Bali, Indonesia, 24–25 November 2014; pp. 254–259. [Google Scholar]
- Watson, M.; Lewis, S.; Cacioppi, P.; Jayaraman, J. Supply Chain Network Design Applying Optimization and Analytics to the Global Supply Chain; Pearson Prentice Hall: Upper Saddle River, NJ, USA, 2013. [Google Scholar]
- Pujawan, N. Mahendrawathi. Supply Chain Manag. 2017. [Google Scholar]
- Narasipuram, R.P.; Mopidevi, S. A technological overview & design considerations for developing electric vehicle charging stations. J. Energy Storage 2021, 43, 103225. [Google Scholar] [CrossRef]
- Sadeghi-Barzani, P.; Rajabi-Ghahnavieh, A.; Kazemi-Karegar, H. Optimal fast charging station placing and sizing. Appl. Energy 2014, 125, 289–299. [Google Scholar] [CrossRef]
- Daskin, M.S. Network and Discrete Location; John Wiley & Sons, Inc.: Hoboken, NJ, USA, 1995. [Google Scholar]
- Jung, J.; Chow, J.Y.J.; Jayakrishnan, R.; Park, J.Y. Stochastic dynamic itinerary interception refueling location problem with queue delay for electric taxi charging stations. Transp. Res. Part C Emerg. Technol. 2014, 40, 123–142. [Google Scholar] [CrossRef]
- Ip, A.; Fong, S.; Liu, E. Optimization for allocating BEV recharging stations in urban areas by using hierarchical clustering. In Proceedings of the 6th International Conference on Advanced Information Management and Service, IMS2010, with ICMIA2010-2nd International Conference on Data Mining and Intelligent Information Technology Applications, Seoul, Republic of Korea, 30 November–2 December 2010; pp. 460–465. [Google Scholar]
- Momtazpour, M.; Butler, P.; Ramakrishnan, N.; Hossain, M.S.; Bozchalui, M.C.; Sharma, R. Charging and Storage Infrastructure Design for Electric Vehicles. ACM Trans. Intell. Syst. Technol. 2014, 5, 1–27. [Google Scholar] [CrossRef]
- Davidov, S.; Pantoš, M. Planning of electric vehicle infrastructure based on charging reliability and quality of service. Energy 2017, 118, 1156–1167. [Google Scholar] [CrossRef]
- Shoman, W.; Karlsson, S.; Yeh, S. Benefits of an Electric Road System for Battery Electric Vehicles. World Electr. Veh. J. 2022, 13, 197. [Google Scholar] [CrossRef]
- Verma, R.; Sharma, S.K.; Singh, P.; Bhutto, J.K.; Alharbi, A.R.A. Analysis and Sizing of Charging Stations in Kota City. Sustainability 2022, 14, 11759. [Google Scholar] [CrossRef]
- Jacob, J.; Hasan, N. Determining The Centers of Economic Growth and Regional Development using Scalogram Analysis (An Empirical Study in West Halmahera Regency). Int. J. Innov. Sci. Res. 2016, 26, 75–82. [Google Scholar] [CrossRef]
- Leijon, J.; Boström, C. Charging Electric Vehicles Today and in the Future. World Electr. Veh. J. 2022, 13, 139. [Google Scholar] [CrossRef]
- Dong, J.; Liu, C.; Lin, Z. Charging infrastructure planning for promoting battery electric vehicles: An activity-based approach using multiday travel data. Transp. Res. Part C Emerg. Technol. 2014, 38, 44–55. [Google Scholar] [CrossRef]
- Baresch, M.; Moser, S. Allocation of e-car charging: Assessing the utilization of charging infrastructures by location. Transp. Res. Part A Policy Pract. 2019, 124, 388–395. [Google Scholar] [CrossRef]
- Vazifeh, M.M.; Zhang, H.; Santi, P.; Ratti, C. Optimizing the deployment of electric vehicle charging stations using pervasive mobility data. Transp. Res. Part A Policy Pract. 2019, 121, 75–91. [Google Scholar] [CrossRef]
- Wolbertus, R.; van den Hoed, R.; Kroesen, M.; Chorus, C. Charging infrastructure roll-out strategies for large scale introduction of electric vehicles in urban areas: An agent-based simulation study. Transp. Res. Part A Policy Pract. 2021, 148, 262–285. [Google Scholar] [CrossRef]
- McPhail, D. Evaluation of ground energy storage assisted electric vehicle DC fast charger for demand charge reduction and providing demand response. Renew. Energy 2014, 67, 103–108. [Google Scholar] [CrossRef]
- Bhatti, A.R.; Salam, Z. A rule-based energy management scheme for uninterrupted electric vehicles charging at constant price using photovoltaic-grid system. Renew. Energy 2018, 125, 384–400. [Google Scholar] [CrossRef]
- Mouli, G.R.C.; Bauer, P.; Zeman, M. System design for a solar powered electric vehicle charging station for workplaces. Appl. Energy 2016, 168, 434–443. [Google Scholar] [CrossRef]
- Tulpule, P.J.; Marano, V.; Yurkovich, S.; Rizzoni, G. Economic and environmental impacts of a PV powered workplace parking garage charging station. Appl. Energy 2013, 108, 323–332. [Google Scholar] [CrossRef]
- Bokopane, L.; Kusakana, K.; Vermaak, H. POET Structured energy management and efficiency improvement of a grid-integrated electric vehicle energy Charging Stations. J. Phys. Conf. Ser. 2020, 1577, 012052. [Google Scholar] [CrossRef]
- Han, X.; Liang, Y.; Ai, Y.; Li, J. Economic evaluation of a PV combined energy storage charging station based on cost estimation of second-use batteries. Energy 2018, 165, 326–339. [Google Scholar] [CrossRef]
- Gjelaj, M.; Traholt, C.; Hashemi, S.; Andersen, P.B. Cost-benefit analysis of a novel DC fast-charging station with a local battery storage for EVs. In Proceedings of the 2017 52nd International Universities Power Engineering Conference (UPEC), Heraklion, Greece, 28–31 August 2017; pp. 1–6. [Google Scholar] [CrossRef]
- Yang, M.; Zhang, L.; Zhao, Z.; Wang, L. Comprehensive benefits analysis of electric vehicle charging station integrated photovoltaic and energy storage. J. Clean. Prod. 2021, 302, 126967. [Google Scholar] [CrossRef]
- Nizam, M.; Maghfiroh, H.; Irfani, B.; Inayati, I.; Ma’arif, A. Designing and Prototyping of Lithium-Ion Charging System Using Multi-Step Constant Current Method. World Electr. Veh. J. 2022, 13, 178. [Google Scholar] [CrossRef]
- Malmgren, I. Quantifying the societal benefits of electric vehicles. World Electr. Veh. J. 2016, 8, 996–1007. [Google Scholar] [CrossRef]
| Publisher’s Note: MDPI stays neutral with regard to jurisdictional claims in published maps and institutional affiliations. |
© 2022 by the authors. Licensee MDPI, Basel, Switzerland. This article is an open access article distributed under the terms and conditions of the Creative Commons Attribution (CC BY) license (https://creativecommons.org/licenses/by/4.0/).


