1. Introduction
Climate change has brought a significant concern over the past few decades due to its impact on communities worldwide, which increases day in, day out. The trams, metro, and trains are already electrified in most cities in Europe and worldwide. Efforts are now focused on the electrification of diesel buses. As well as emitting no CO
2, Electric Buses (EBs) make much less noise and have less operational cost than the diesel-powered ones. Public transportation means could play a vital role in minimizing CO
2 emissions as they have average operating hours of around 16–20 h per day, compared with private cars, which have around 1–2 h per day [
1,
2].
1.1. Literature Review
Nowadays, the vast majority of Heavy-Duty (HD) vehicles in operation within Europe are propelled by Internal Combustion Engine (ICE), which typically runs on diesel, as this is the most affordable and convenient energy carrier. So far, only a negligible number of low- and zero-emission trucks are in operation. The European truck manufacturers were set a target to reach carbon neutrality in road freight transport by 2050 at the latest [
3,
4]. In China [
5], Shenzhen city moved to 100% EB integration, with chargers with a power level of 750 kW and EB mileage of about 250 km.
The chargers must supply the EBs with enough energy to reach their destinations. Therefore, it is essential to identify the charger’s power and EB mileage, which is based mainly on EB consumption. The EB consumption depends on several factors, such as load, weather (heating system on/off), traffic, city terrain, etc. For an 18 m EB, the average energy consumption for 10 months of operation is around 1.63 kWh/km, and for a 12 m EB, it is around 1.15 kWh/km. In temperatures of 15–19 °C, the 18 m EB consumes, on average, 1.35 kWh/km, whereas the 12 m EB consumes 0.99 kWh/km [
6]. An 18.75 m Trolley bus demo, Ikarus-Škoda Tr187.2, was launched in Budapest, Hungary, with a battery capacity of 80 kWh. The trolley bus ran on a route called 77 A, where the round trip was 13.2 km, and the needed distance of the battery mode was 9.2 km. In battery mode, taking into consideration severe terrain properties and weather conditions, with the air-conditioning or heating was switched on, it was found that when the vehicle had no passenger load, it could run for around 20 km. When the vehicle had full passenger load, it could run for about 7 km. Furthermore, the vehicle is considered to use only 33 kWh out of 81 kWh to ensure long battery life [
2]. In [
7], an energy management system was developed to optimize the auxiliary consumption of the EB fleet; the system is able to be monitored, accessed, and controlled online.
The diesel buses are more financially affordable than the electric ones, which makes the work and support of the various stakeholders’ indispensable in reaching the goal of worldwide usage of EBs. It was found that more EBs than diesel buses are needed, which increases the fleet size and cost. In [
8], a study was carried out to size the charging systems compared to the battery sizes on the vehicles and to work out the number of EBs required on the route line to investigate the feasibility of replacing the diesel ones. The Use Cases (UCs) are Mercedes-Benz eCitaro EBs, which are normally produced with lithium-ion battery capacities of 150, 200, or 250 kWh. These buses are equipped with CSS2 with the potential ability to adopt the pantograph system, which is sold as a piece of special equipment. The test route line (7.9 km) is between Porto Vado and Via Alessandria (Sovana, Italy), with a total estimated energy consumption of 40.6 kWh for the round trip. It was found that two EBs with a battery capacity of 250 or 200 kWh can cover the operation of one diesel bus with three chargers in the depot with a power capability of 43 kWh. With less battery capacity, 150 kWh, three EBs are needed to cover the operation of one diesel bus. However, all the buses need to stop at Porto Vado station for some minutes, this time could be used to charge the EBs with opportunity charging. It was found that with an opportunity charging of at least 300 kW, one EB is needed for each diesel bus. The findings are summarized in
Table 1.
1.2. Research Gap
It is worth mentioning that in interoperability tests carried out between Electric Vehicle Supply Equipment (EVSE) brands and HD-EV brands, it is quite common to experience some interoperability issues. Those issues typically originate from different interpretations of the standards, from which the most issues by far arise due to different interpretations of communication protocols.
In [
9], a study carried out aims to support the application and promotion of the EB through reducing the fleet size, empty driving mileage, and charging facility. A total cost of 544 EB trips with tasks was declined by 19.6%. Although, the average empty driving mileage rise by roughly 20%, the number of EBs and the number of charging points declined by 19.7% and 33.3%, respectively. The cost of raising the empty driving mileage was brought down by reducing the number of EBs and charging facilities. The long operating time of EBs requires a large storage system (about 300 kWh) to drive without any charging stops all day. The huge battery weight increases the vehicle’s Total Cost of Ownership (TCO) and the operational costs due to an increase in the consumption because of the huge battery weight. Here, the opportunity charging solutions can solve these issues and fast-charge the EBs when they are equipped with low battery capacity. In order to decrease (or maintain) the number of EBs in operation on the route line and maintain the EBs’ operation effectively, the targeted SoC must be achieved within around 5–10 min. In the Graz demo, six EBs are operating on a route simultaneously. Therefore, at the ‘end-stop’, an EB arrives every 10 min and (depending on traffic) a few minutes are left before it has to leave again. This time (0–5 min) could be used as a ‘charging-window’. At the 10 min end stop, assuming a 2 min charging window (depending on traffic, the actual duration of the end stop may vary; hence, a 2 min minimum is assumed for charging), a 540 kW of average power is needed to transfer 18 kWh of energy [
10]. Such a power level has not yet been achieved by the opportunity charging technologies in most of the previous work, a max power of 300 kW was achieved in [
8], as mentioned in
Table 1. Furthermore, the absence of interoperability among various venders of EBs and chargers burden the bus operators with more TCO and operational costs, which has not been investigated by the previous works.
It was found that the power consumption of the auxiliary equipment, including the electric heating, has a great impact on the consumption of EVs. The optimal consumption of a 12 m EB is 0.8 kWh/km at 20 °C (without heating) with not much traffic. While the same EB operating in the winter at −10 °C can reach a consumption of 2.3–2.5 kWh/km with the electric heating turned on [
6,
7]. A few works have investigated the impact of the electric heating on the total vehicle consumption and optimization of the EVs’ mileage using the Range Extender (REx). It was proven that using a Heating and Ventilation Air Conditioning (HVAC) system instead of an electrical system could optimise the energy consumption of the vehicles.
1.3. Contribution
Securing interoperability between the EVs’ charging infrastructure is one of the success factors that will impact the widespread use of electric vehicles in general and EBs in particular and will require special cooperation between the EBs’ and chargers’ manufacturers. Several projects worldwide examine various solutions for the charging opportunities, e.g., conductive and inductive power transfer (IPT) [
2]. In this work, EBs and fast-chargers from various venders were developed, the interoperability between the EBs and fast-chargers were tested.
The objective of the charging solution test is to ensure the acceptability of the solutions developed within the ASSURED project, primarily the interoperability of the charging solutions and smart energy management for fleet upscale, based on the performed adaptations and modifications of the vehicles. To do so, vehicles, energy management solutions, charging interoperability tests, charging protocol improvements, charging strategies, and operational tools were developed and tested in real operation in a selection of demo cities.
Adopting the opportunity charging solution along the line routes could minimize the number of required EBs and onboard battery capacity. Therefore, the operational and capital costs are decreased. With high charging power capability, the EBs could be operated without impact on their schedules and the EB fleet size could be minimized. In this work, the opportunity charging technologies with a power capability of 300–600 kW along the EBs’ line route were developed. This aims to make EBs more affordable to help the public bus operators to adopt the EBs instead of the diesel buses. These opportunity charging solutions could optimize the EBs’ operation in the following ways:
In this work, the developed EBs and E-truck are equipped with regenerative systems to optimize their operation and support their mileage. Such regenerative braking systems could recover a 65% of the maximum amount of recoverable energy [
8]. Furthermore, the optimization of the E-truck consumption was implemented by replacing the electrical heating system with a HVAC system and by using the Compressed Natural Gas (CNG) Range Extender (REx) in the E-truck UC, which addresses aspects like energy efficiency, noise emissions, and pollution emissions.
This paper is organized as follows,
Section 2 presents the demos in Barcelona, Osnabrück, and Munich. The characterizations and specifications of the EBs, chargers, and route lines were presented in detail. Furthermore,
Section 2 deals with the collected measurements from the demo vehicles and the adopted methods of analyzing them.
Section 3 includes the results and discussion of the collected measurements from demo vehicles and compares them with the measurements obtained by pieces of literature.
Section 4 presents the conclusion of the whole work.
2. Materials and Methods
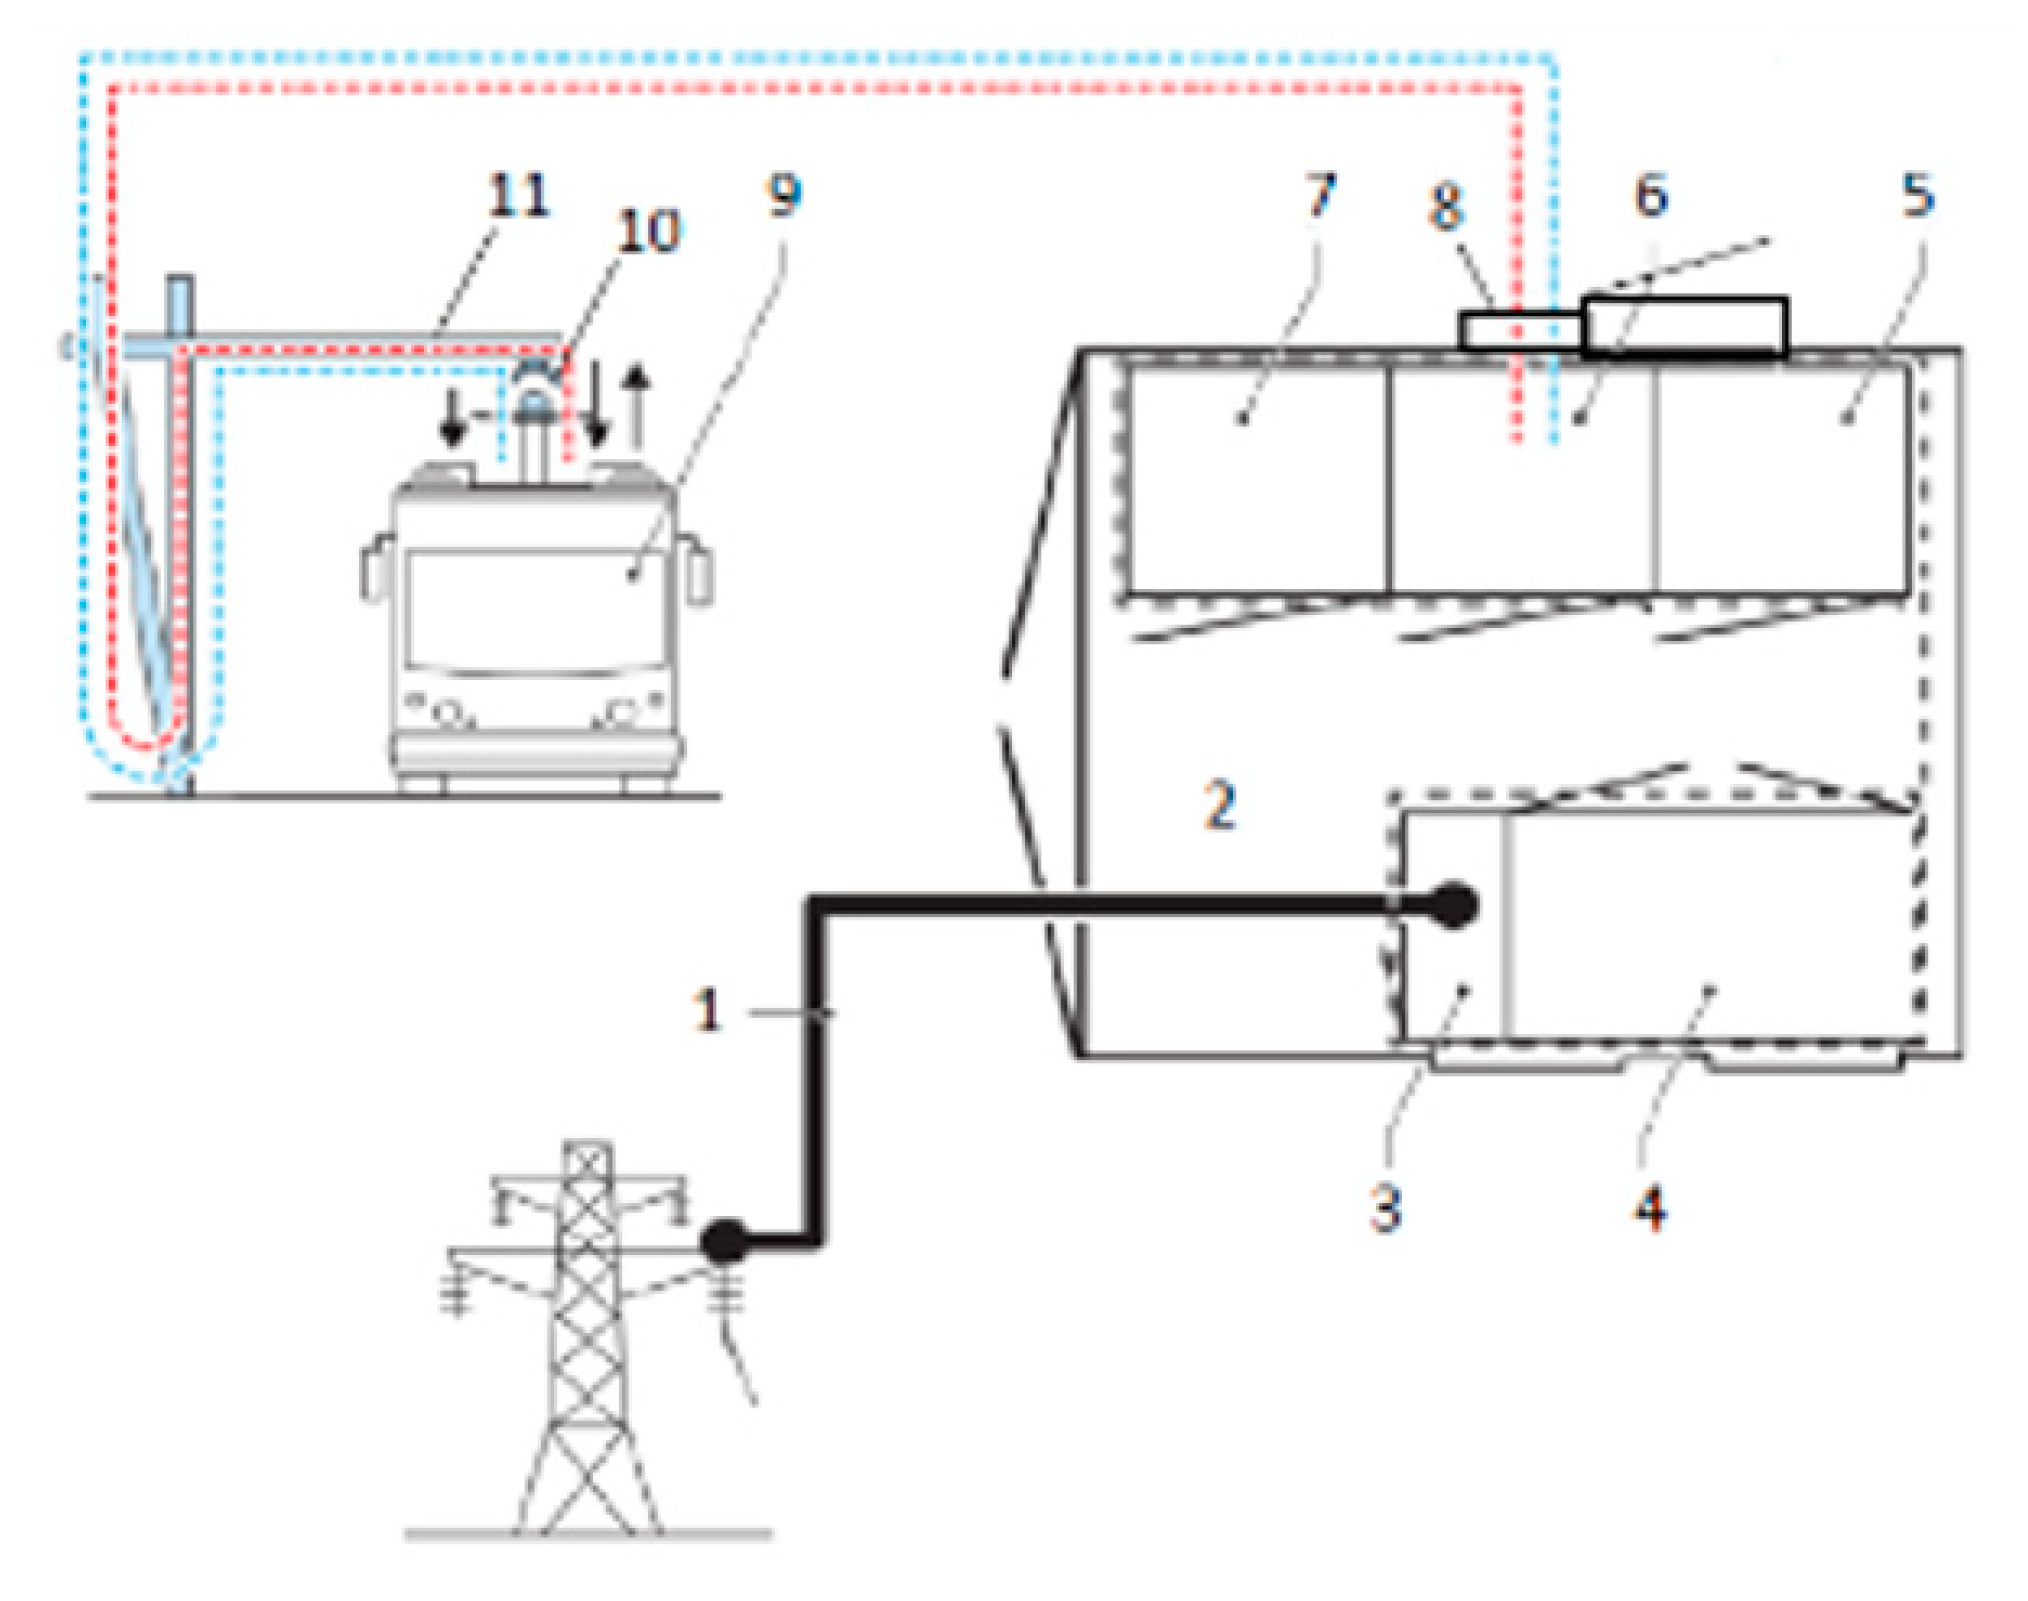
Two pantograph superfast-charging technologies based on an Automated Connection Device (ACD) were tested in this work, i.e., Type A and Type B. In Type A, the ACD is mounted within the charging station, typically on a pylon or within a building infrastructure. When a vehicle reaches the charging position, the pantograph connects to the vehicle. The setup requires wireless communication between the vehicle and the charger, as the pantograph down request needs to be transmitted from the vehicle to the charger before there is contact available between the systems.
In a roof-mounted ACD system, a pantograph is placed on top of the bus. This simplifies the charging stations, as the connector on the infrastructure side is static. Since the ACD is mounted on the vehicle, the cost of a charging station is lower, but the pantograph will add some weight, height, complexity, and cost to the vehicle.
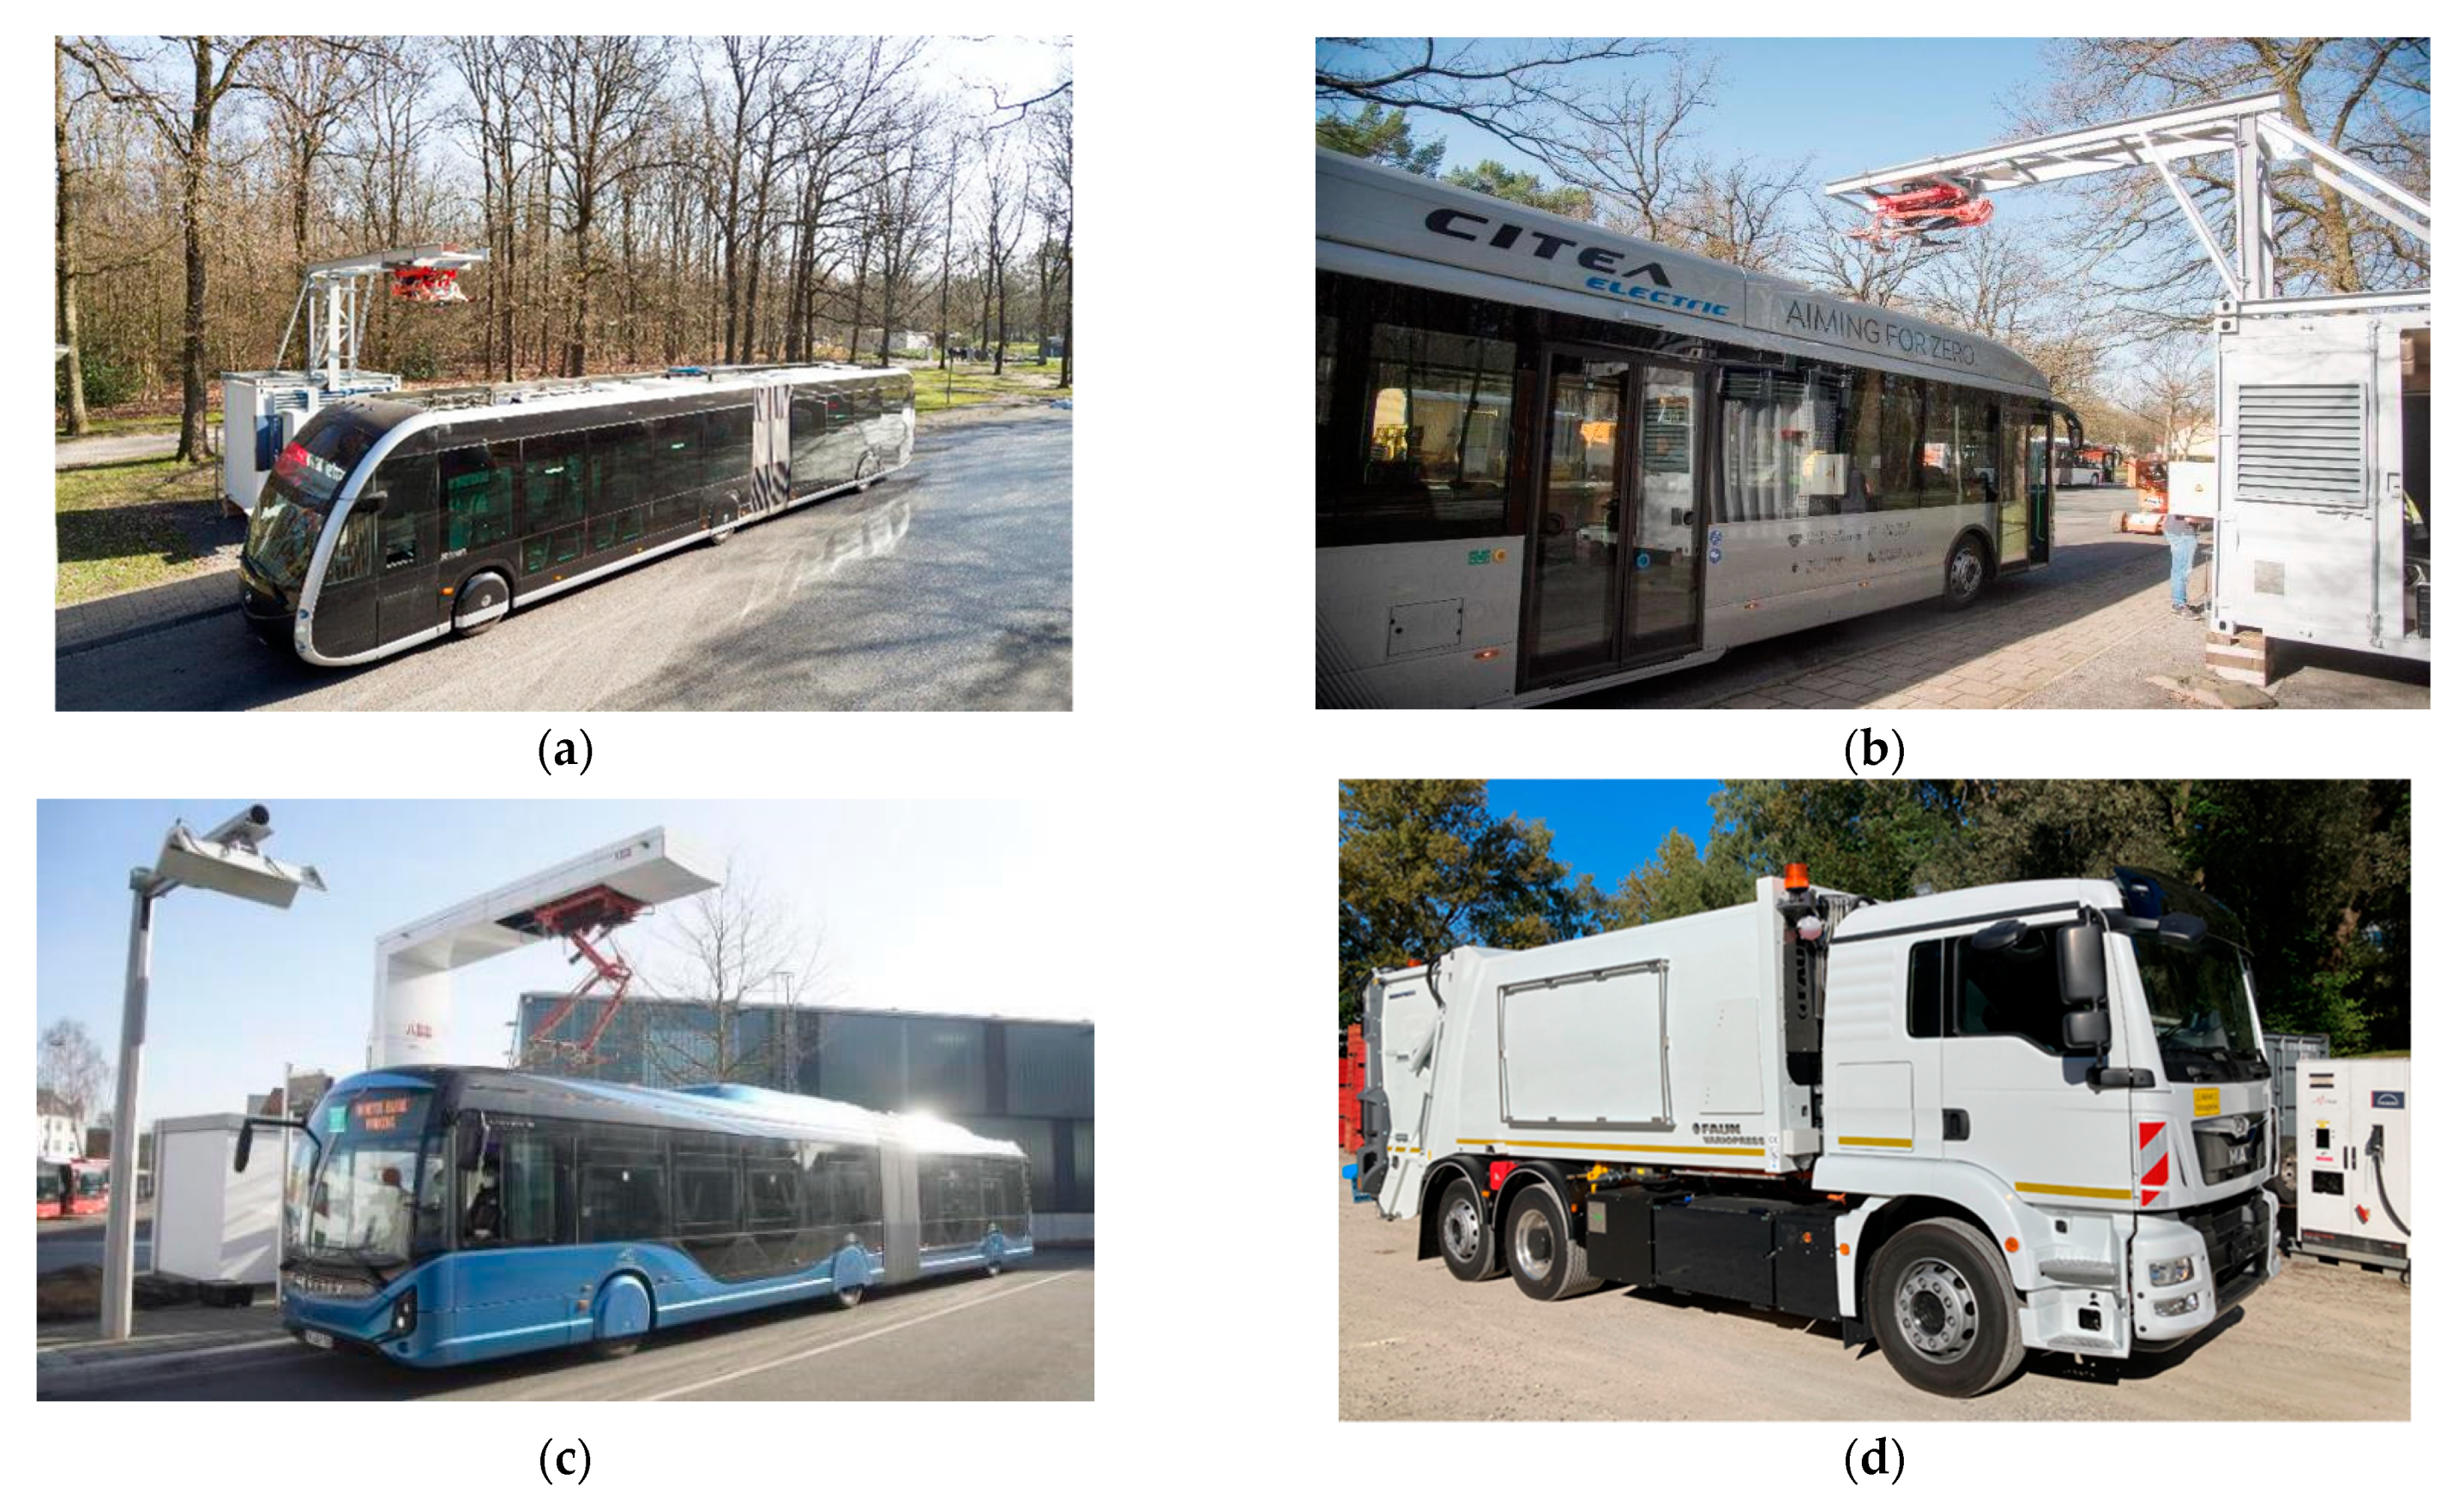
The demonstrations of several HD-EVs (buses and trucks) were carried out, including their connections to the next generation of charging infrastructure in the selected city demonstrations (Barcelona, Osnabruck, Gothenburg, Eindhoven, and Jaworzno). In this work, three demos are presented, two for EBs, and one for an E-truck. The two EB demos took place in BARCELONA and OSNABRÜCK with EBs (Type A & Type B) from four brands, i.e., Irizar, VDL, Heuliez, and Volvo, see
Table 2.
Based on the operational specifications, requirements, and city need, as defined in ASSURED and the charge solutions, the UCs are implemented and operated in the project. An overview of the demos UCs is presented in this section.
2.1. Chargers
The Electric Vehicle Supply Equipment (EVSE) is an essential part of the charging infrastructure, which could optimize the whole EB fleet operation and TCO of the entire system. There are two types of charger infrastructures, i.e., CSS2 in depot (40–150 kW) and opportunity charging on route lines, bus stops, or at terminals. The opportunity charging systems usually have various rated power levels: 150 kW, 300 kW, 450 kW up to 600 kW with the main feature being that charging can take place during the service along the EB route line [
11].
As mentioned earlier, the HD-EVs have an average operation of around 16–20 h per day, which means the parking time of the HD-EVs is too short. Accordingly, fast-charging solutions are needed to meet the HD-EVs’ demands without impacting their operation. In this work, as well the 10 chargers already installed on the three demo routes in Barcelona, there are three additional Type B chargers (roof-mounted pantograph) involved in the demonstration which are supplied by the ASSURED partners’ ABB, Heliox (Hex), and Jema,
Table 2.
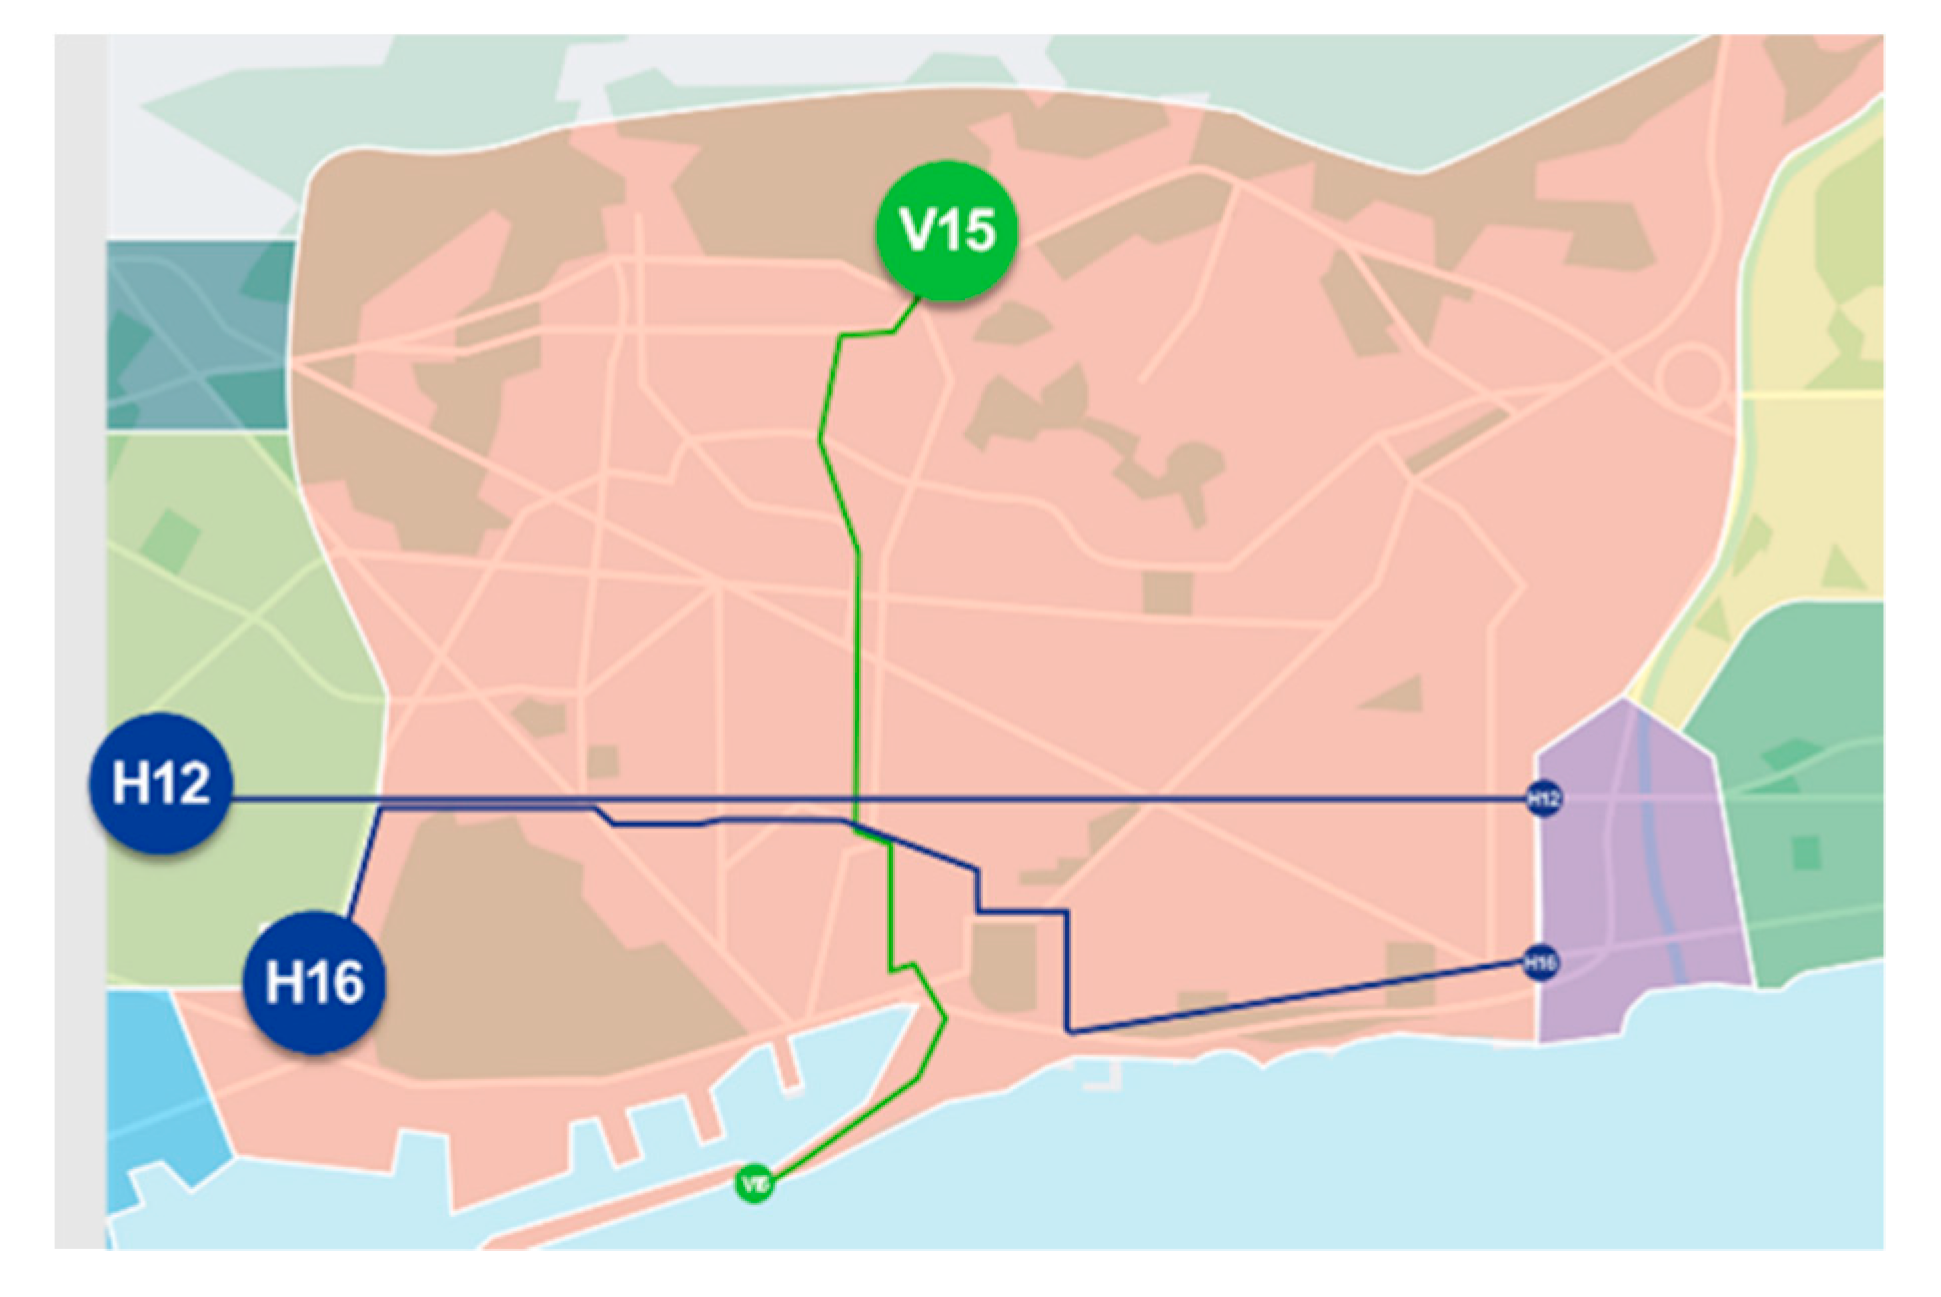
The ABB and the Heliox chargers were installed in the triangle depot. The maximum power of both chargers was limited to 150 kW due to the limitations of the infrastructure at the depot. The Jema charger is in the terminal stop Carrer del Cisel, on the H16 Line. In [
12], it was proven that the installation of the fast-charging solutions at the terminal, where buses are parked for a relatively long time, or on-street bus stops that are shared by many bus lines, results in an effective reduction of the size and total cost of the bus system’s on-board batteries.
The ABB mobile HVC-PU (Type B) charger 300 & 450 kW is a functional demo charger, especially designed for local events and tests.
The Heliox charger provided a mobile 300 kW charger with a contact hood (ACD Type B). The container has an ultra-fast battery charger system for EVs, and it is used as a charging unit for opportunity (on route) charging at stops along the route, see
Figure 1.
The Jema ECI600 outdoor charger tested in Barcelona is designed to provide 600 kW of uninterrupted output if required. Due to the high power required at the opportunity charging stations, the chargers are usually installed directly at medium voltage (MV) along with all the necessary safety and protection elements required by the particular regulations of each country. However, in the Barcelona demos, the MV to LV installation had been carried out and more chargers were connected to the same LV network; an LV/LV transformer had to be added to provide galvanic isolation to the Jema charger. Power requirements for the charger are 630 kVA; Electric grounding; IT power; Auxiliary TNS. The power can be supplied from the installation itself or, as in this case, using the LV/LV transformer.
During installation, for the correct airflow necessary for the operation of the charger and the possible maintenance of the equipment, it is necessary that a distance of 800 mm is left free around the equipment.
In Barcelona, on bus service Line H16, there are two chargers located at each end of the line (terminals): Plaça Europa and Barcelona Port. Next to this in the Barcelona/TMB depot, there are 22 chargers located. The characteristics of those chargers are found in
Table 3. Jema has completed the construction and commissioning of the last depot charging stations and designed the load control algorithm to minimize the use of network power during the peak load.
In Osnabrück, on the route Line 15, there are two Type A opportunity chargers installed, one ABB Mobile HVC-PD 450 EB charger (450 kW) on the depot and one Heliox opportunity charger (300 kW) on the terminal station, Dodesheide Waldfriedhof. The characteristics of those chargers are found in
Table 3.
2.2. Objectives
Some data were collected from the chargers to investigate the following:
Charger efficiency.
Interoperability between chargers and EBs.
Time for opportunity charging.
Time needed for charging (compared with conventional): calculate the average waiting time of the EBs on the stations (e.g., from the velocity over the time) with and without charging. This time can possibly be used as opportunity charging time.
2.3. EBs
This section describes the EBs’ UCs used in the Barcelona and Osnabrück demos. This demo is led by TMB, which is the largest public transport operator in Catalonia (Spain). The objective of the Barcelona demo is to demonstrate the interoperability of the bus chargers with Type B technology (roof-mounted pantograph). In the Barcelona demo, the full interoperability between EBs and chargers from various manufactures in real operating conditions was also demonstrated.
The demo in Osnabrück (Germany) aims to demonstrate the interoperability of EBs against ACD Type A technology (charger-mounted pantograph). Therefore, the full interoperability between EBs and chargers from various manufactures in real operating conditions is demonstrated. This demo is led by “Stadtwerke Osnabrück” SWO. The SWO is the local provider of public transport in Osnabrück. The following EBs are presented:
2.3.1. Irizar ie Tram (18 m)
In the ASSURED project, an Irizar baseline electrical bus was converted to support an ACD Type B (roof-mounted technology) pantograph system to be used for superfast-charging (500 kW) and depot overnight charging (balancing mode). The replacement high(er)-power (C-rate) battery supports a maximum charging power of 500 kW but has less battery capacity than its predecessor (150 kWh instead of 340 kWh). Furthermore, the power consumption of the auxiliary equipment was optimized to include the HVAC and battery thermal management system (BTMS) in order to minimize the operation cost including the number of the frequency vehicles in the line route. Two Irizars’ EBs were demonstrated, one in Barcelona with the Type B charging solution, and the other in Osnabrück with the Type A charging solution. The EBs are shown in
Figure 2 and the vehicle specifications are found in [
13].
2.3.2. VDL Citea Buses
The baseline VDL vehicle is a full electric city bus, the VDL Citea SLE(A) Electric, specifically developed for superfast-charging based on charging concepts Type A and Type B. The main objective for VDL was to upgrade the existing fast-charge technology and to demonstrate this technology on two VDL Bus & Coach Citea electric buses, of which one is equipped with a Type A superfast ACD and the other is equipped with a Type B superfast ACD pantograph system. For this purpose, both VDL EBs were fitted with the latest charging strategies and with protocol implementations in accordance with the latest available standards.
Two different EBs from the VDL brand were tested in two different demo cities. The buses have similar technical specifications but one has an ACD Type B charging solution and the other has a Type A charging solution, see
Figure 2b and the specification in [
14]. The drivelines and battery packs of both buses are the same, only the dimensions and the interiors differ between the two vehicles. These buses are VDL Citea, one tested in Barcelona, i.e., VDL Citea SLF-120 Electric 12 m, and the other one in Osnabrück i.e., VDL Citea SLE-129 Electric 12 m.
2.3.3. Heuliez GX437 (18 m)
The baseline Heuliez vehicle is an 18 m articulated urban electric Bus (Heuliez Bus GX437E), see
Figure 2c and vehicle specifications in [
15]. For urban transportation operations, mainly with articulated EBs, overnight charge requires unacceptable ESS sizing (a huge amount of kWh batteries are required to be embedded). The baseline bus was equipped with a high-power optimized battery with acceptable energy capacity and sizing and an ACD pantograph Type A system with a power of up to 450 kW acceptance power capability.
Starting from the vehicle baseline, the HB GX437E 18 m bus was adapted to achieve the following performance objectives:
A BEV 18 m articulated urban electric bus with superfast-charging capability with ACD Type A technology developed for urban transportation (model GX437E with opportunity superfast-charging capability).
20 h EB, range 300 km with superfast charge >400 kW at bus terminal or last stop.
Up to 30 km electric range from 100% SoC.
ACD Type A technology with a max power greater than 400 kW.
CCS Combo 2 (mode 4) for depot charging.
Only ZEV operation.
Charging time <5 min (for 12 km superfast charging).
TCO similar to diesel bus by considering environmental cost, according to green public procurement directive, exemptions, and institutional support.
Minimized impact on the power grid.
Standardized superfast-charging to guarantee interoperability.
Demonstration in real operation.
2.3.4. Line Operations
The Barcelona demo embraces three routes for demonstrating the interoperability within the ASSURED project. The routes are shown in
Figure 3.
In this work, the data from the EBs were analyzed in the working route over Line H16. Therefore, only the characteristics of this line route are listed in
Table 4.
In the Osnabrück demo, during the demo period, four EBs from various brands were operated on Line 15, which starts at the SWO depot in Osnabrück and goes from the main train station to station Dodesheide Waldfriedhof. The characteristics of Line 15 are listed in
Table 4.
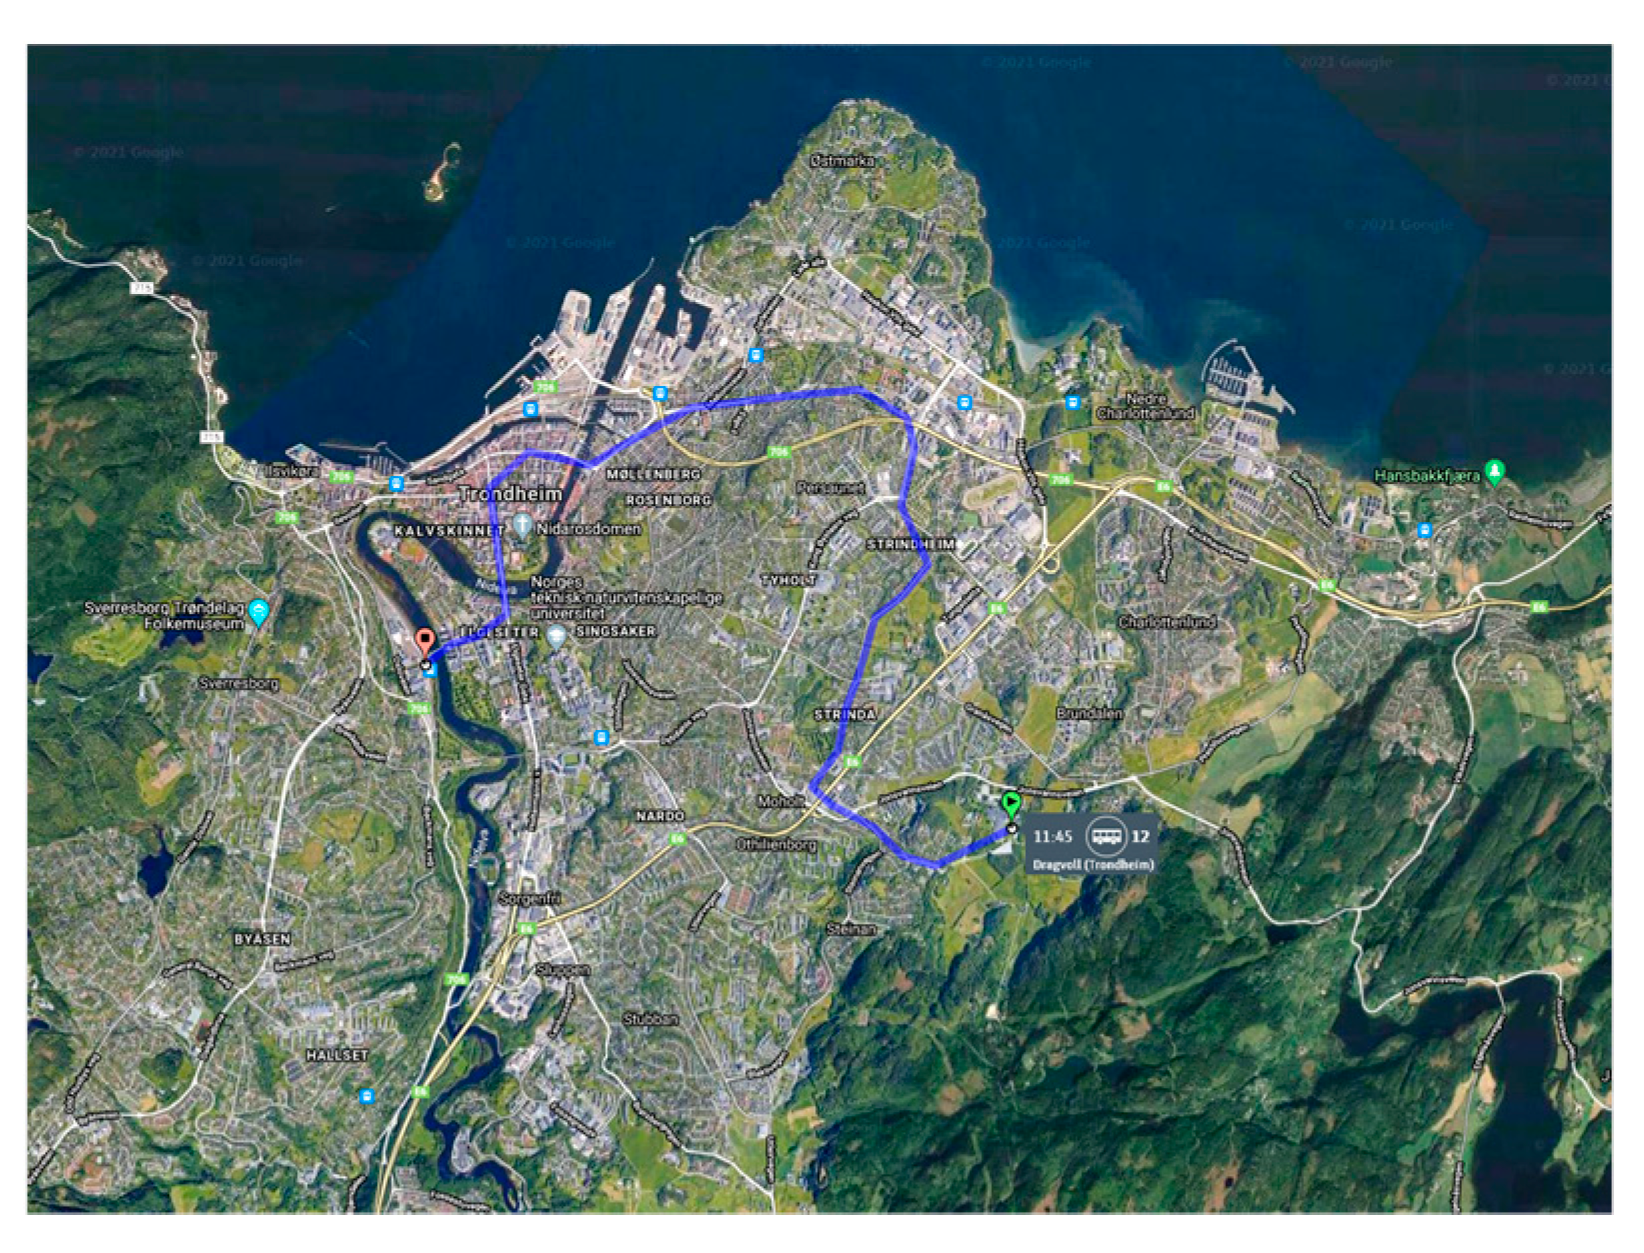
During the demo period in Osnabrück, there was an issue with the CAN connection of the built-in data logger of the Heuliez EB; therefore, no data from the bus were obtained. As a replacement, Heuliez provides data from the city of Trondheim in Norway, see
Figure 4, with the same vehicle configuration as the demo bus in Osnabrück. The total mileage of the vehicle is 115.850 km.
Several parameters were recorded with different intervals of event trigger during the measurement including Vehicle mileage; GPS Longitude and Latitude (°); Door status; SoC; Total charging time; and Vehicle energy consumption.
2.3.5. Objectives
Most of the EBs and some of the chargers are equipped with a CAN-bus logger to collect the operational data from the EBs demos i.e., Irizar, VDL, and Heliox. The collected data were used to measure and improve the energy consumption of the battery thermal management system (BTMS). Similarly, the use of energy for auxiliary loads has been measured and optimized. The following analyses were implemented:
The determination of the above KPIs gives important additional information from the real-world application to address some research questions from the stakeholders. In [
16], a test method was developed to select a bus in such a way to lower the operational cost and TCO and provide a better service. The included KPIs are power consumption, charging duration, driving distance, and failure duration. In this work, the following KPIs were adopted to study the EBs behavior.
2.4. E-Truck Demo (Munich, Germany)
2.4.1. Baseline Truck
The baseline vehicle is a MAN, Battery Electric Vehicle (BEV) Truck, BEV-Truck (TGM 6x2/4), with a drivetrain configuration suitable for distribution purposes. A photo of the vehicle is shown in
Figure 2d, and
Table 5 lists the specifications of the E-truck. Several improvements in the truck configuration have to be done to make it fit for refuse collection application, for example, using HVAC instead of electrical heater, installing the packages of the batteries in the truck body, integrating the Range Extender (REx) module and tank system on the truck frame as well as setting up the smart energy management.
2.4.2. E-Truck
The main objective of this demo in Munich (Germany) is to demonstrate an E-truck for refuse collection operations with a drivetrain and its auxiliary units optimized with regard to energy consumption. Pursuing this goal, one REx module running on CNG was developed, integrated, and demonstrated in a dedicated timespan during this UC. The module is able to fast charge during transport operation mainly outside of downtown areas and has the potential for installation and use in commercial BEV-Trucks. The aim is to reduce the TCO and achieve a higher payload, which leads to a maximized competitiveness against conventional low emission trucks. The E-truck is equipped with a CCS2 connector with 150 kW of power. The objective of this demo is summarised as follows:
Realization Battery Electric Vehicle (BEV-Truck) ((medium-duty) TGM 6x2/4) with highly efficient drivetrain developed for refuse collection purposes.
Zero emissions during refuse collection operation in inner-city areas (BEV-Mode).
Low emissions during transport of garbage to recycling ground in suburban areas (REx-Mode aiming at Euro VI with a conformity factor of 1.2 (availability of EURO IV engines in suitable power range provided)).
Fully integrated and optimized energy and recuperation management.
Pure electrical driving range of at least 50 km.
Low noise during operation (<72 dB).
Energy-efficient auxiliary units for maximized driving range (e.g., HVAC).
TRL 6-7 achieved after successful demonstration of the truck in operational environments.
One further task is to deal with the optimization of the auxiliary units’ energy efficiency. The components in focus are the cooling system, cabin heater, and air conditioning, the aim is to minimize the energy consumption and maximize the driving range according to the requirements of electrical drivetrains. The efficiency of the cabin heating and the driving range will be simultaneously increased by using new HVAC technologies like heat pumps that use R744 (carbon dioxide) as refrigeration fluid. An optimized HMI interface will contribute to anticipatory driving leading to the reduced energy consumption of the E-Truck.
The E-truck is equipped with a data logger which records all relevant CAN-communication and uploads the needed signals to cloud storage via LTE once a day. With this, actual data from the vehicle can be accessed every day.
The recorded signals, such as voltages, currents, temperatures, and operating modes of all-electric components (batteries, axle, charging interface, auxiliary units, compressor, heater, etc.), driving information from the base vehicle and an additional GPS receiver and control signals of the three rapid prototyping ECUs (e.g., Micro-auto-box) are responsible for controlling the vehicle and the optimized energy management. The cooling and refrigerant circuits are equipped with several temperature, pressure, and flowrate-sensors which are connected via A-/D-converters to the data logger.
To evaluate the outcome of this demo, some measurements data were considered. These data are used to evaluate the following outcomes of this demo:
Combustion engine on/off: The use of the range extender has to be logged in order to give information about the frequency and place of its use.
GPS gives information of the mileage, velocity, high profile, and the location where the range extender is running during operation and is, therefore, valuable.
Energy consumption is important for the operation and operational costs.
CO2 and pollutant emission of the range extender unit and of a diesel baseline for comparison must be measured.
Mileage is also an important asset to refer to aspects like emissions and energy consumption.
3. Results and Discussion
This section presents the data analyses for the EBs and E-Truck for the evaluation of the operational performance and how it was impacted according to the adopted optimization techniques.
3.1. EB Demos
The EB demos were held in Barcelona and Osnabrück. The EBs were selected from four various brands, i.e., Irizar, VDL, Heuliez, and Volvo. The Volvo EB is not presented in this work as the objective of the test is beyond the scope of this study for this EB. In this work, fast-charging solutions based on pantograph Type A & Type B were tested in the bus operator depot and on the line route. The pantograph charging solutions were selected from three various brands, i.e., Jema, ABB, and Hex, to test the interoperability between the EBs and the chargers.
3.2. Irizar EB
Measurements were collected from Irizar buses while driving in Barcelona on route Line H16. In the Osnabrück demo, one hour and eleven minutes (01h:11min) of Irizar data were collected. These data were recorded on the 30th of April 2021 at 9:39. These data were recorded while the Irizar bus was driving on the line route 15 in Osnabrück. 3.2.1 Interoperability.
The Irizar EBs were already driving in Barcelona as part of the TMB bus fleet, therefore, no major interoperability issues were to be expected with the already installed charging infrastructure. From the already installed fast chargers in Barcelona, the charger’s data were obtained from mid-December 2020 until the beginning of February 2021, which showed that the majority of the charging sessions (94%) reached the targeted SoC of 90% without any interoperability issue. From the 6% of the sessions that did not reach the targeted SoC, it was observed that 66% originated from an uncontrolled stop. The most likely reason for this is that the bus driver initiated a stop of the charging session by lowering the pantograph before reaching the targeted end SoC. In the other cases (2% of the total), the reason remains unclear. There are, in the aforementioned timeframe, no charging sessions observed in which no energy was charged. Only 1% of the charging sessions corresponded with 2 kWh of charged energy or less. The lowest observed energy transfer was 0.7 kWh.
3.2.1. Charging Rate
The power transfer rate from the chargers to the EBs was analysed to investigate the average and maximum transfer power from the chargers and the achieved SoC and their corresponding charging time. It was observed that most of the average charging rates were realized when the measured 668 charging sessions was 353 kW. The average amount of charged energy was approximately 22 kWh, providing an average driving range of almost 14 km after charging. The maximum average charging power for a single charging session was 486 kW (3% lower than the theoretical maximum). The difference between the average power and the maximum charging power can be mostly explained by the fact that above 80% of SoC, the charging speed will be reduced by the battery management system (BMS). It has been observed that charging sessions with high power tend to be short sessions and that most charging sessions in Barcelona lasted 5 min and were charging at around 350 kW. It is expected that if the initial SoC is low, then the average charging power will increase.
3.2.2. Consumption
From the Irizar bus in Osnabrück, one hour and eleven minutes of recorded data were analysed when the EB was under test (empty without passengers). From the obtained data, the following analyses parameters were derived, see
Table 6. For these measurements, no passengers were present in the bus.
Aggregated measurements from Barcelona reveal that when the electricity consumed by the chargers covering a whole season is compared with the number of kilometres driven by the EB fleet, it results in an average energy consumption of 2.0 kWh/km in wintertime and up to 3.1 kWh/km during the summer season. This is considerably more than what was measured in Osnabrück. The delta comprises that no payload/passengers were present in Osnabrück, implying less or no air-conditioning (auxiliary) losses in Osnabrück. The aforementioned results are in line with the those reported in [
6], where in the EB that use diesel heating, the consumption is around 1.5 kWh/km. In this work, the power consumption of auxiliary pieces of equipment within the demo vehicles was optimized to include the HVAC in order to improve the performance of the vehicles. Compared with the data obtained from ViriCiti, a 12 m EB can have a mileage of 375 km with a battery capacity of 300 kWh; this mileage considerably declined to 120–130 km in winter when the EB was electrically heated, whereas with diesel heating, it could achieve 200 km of mileage range.
Most of the EBs are equipped with regenerative systems. A total of 5% of recuperated power is obtained when the drivers push the brake firmly, while a 35–40% of the recuperated power could be obtained if the drivers apply the brake more smoothly. It was found that the low temperatures (−5 °C, 0 °C) have an impact of up to 38% on the vehicle range in cases of BEB, and up to 23% for hydrogen-powered buses [
7].
It is worth mentioning that in Barcelona, the same EBs with a diesel powertrain would be using 70–75 L of diesel per 100 km of range. The much smaller seasonal effect (7% versus 76% difference) with diesel buses can be explained by:
All energy for heating and cooling needs to come from the battery, whereas:
With diesel buses, (waste) heat is readily available;
With the diesel buses in the TMB fleet, the HVAC system is already very optimized by using more energy while the EB is retarding (i.e., regenerating energy through its HVAC system) and while the diesel engine is under low loads and therefore inefficient (e.g., while idling).
These observations are very relevant when referring to the electric fleet (more specifically: the battery sizes, C-rate, chargers, and bus-line planning) and imply that for fleet operators that want to make the transition towards a (partial) zero emission fleet, it is of paramount importance to pre-investigate the vehicle’s energy consumption under (possibly several) worst case conditions and to take these into account in the vehicle specifications and the schedule (time for charging). When doing this, it is generally worth considering taking the costs and benefits from energy saving measures into account.
The obtained results and conclusions are in line with those presented in [
6], where three articulated EBs with a length of 18 m from three various brands (i.e., Bozankaya Sileo, and Solaris) were tested in three days of operation in Bonn (Germany). The measured consumption (heating off but air conditioning on) for the three EBs was between 1.65–1.84 kWh/km. According to these data, a range between 190 and 210 km can be covered by an 18 m EB with 350 kWh of battery capacity. However, the energy consumption could be different for the same EBs with the same, length, capacity, load condition, etc. This could be explained due to the traffic conditions (or terrain) from one line to another or from one city to another. In urban areas, the EB spends much time stopping and moving at low speeds, it consumes energy even when it is stopped at the traffic jam because it must supply the auxiliaries. For example, in [
8], this occurs in route Line 6, which is 7.9 km long and connects Porto Vado to “Via Alessandria” in Savona, Italy. The route lines are analyzed in two parts according to the ground characteristics. The first part of the route line (700 m) passes through the city center, starting from Via Paolo Boselli and finishing at its destination of “Via XX Settembre”. The other and longer part of the route line (1450 m) heads to the west following the seafront of Savona, which goes from the bus stop Villa Zanelli to Via Nizza (Camping) until it reaches its destination, Via Nizza 126. In the first part, the estimated consumption is about 2.47 kWh/km, while in the second part it is 2.62 kWh/km.
3.3. VDL EB
The collected VDL data are from the time period of 10 November 2020 until 30 May 2021 (for Barcelona demo) and from the time period of 18 December 2020 until 1 June 2021 (for Osnabrück demo).
3.3.1. Charger Efficiency
From the Barcelona data set, it can be observed that the maximum charging rate achieved is around 340 kW. The VDL bus was charged in Osnabrück with a maximum rate of 330 kW.
In Barcelona, the VDL data were matched against the data of the ABB charger, so that a comparison could be made between the amount of energy delivered from the grid versus the amount of input energy received by the vehicle battery.
On 16 February 2021, a 69.85 kWh transfer of energy was measured on the charger (AC side) and 68.90 kWh was measured at the vehicle side, resulting in 98.64% charger efficiency during a 32 min charging session. On 19 February 2021, a 13.37 kWh transfer of energy was measured on the charger (AC side) and 13.26 kWh was measured at the vehicle side, resulting in 99.16% charger efficiency during a 10 min charging session. The conditions were quite similar: both charging sessions reached the same maximum power of 147 kW and both sessions were in the early morning (16th: 8:37–9:09 @ 13 °C vs. 19th: 7:01–7:11 @ 10.5 °C). The difference in charger efficiency may be explained by the lower energy transfer and lower temperatures on the 19th, resulting in a lower cooling demand on the charger side. In general, it can be said that conditioning of the (power) electronics may contribute significantly (up to 10%) to the overall power consumption due to the energy use of cooling equipment (fans) and cabinet conditioning (heating and cooling to ensure that all components of the charger remain within the specified temperature range).
3.3.2. CO2 Saving
The benefits gained from the TMB fleet electrification in Barcelona are seen with an emission reduction of 1.8 t CO2, 540 kg of NOx, and 6 kg of PMx by using only EBs instead of diesel buses. Furthermore, regarding the fuel cost, there is an expected reduction of 30% by 2024 for using electricity instead of diesel, which means a reduction of 1.5 M€ per year. Overall emissions and costs are reduced, combined with higher passenger comfort and less driving noise.
3.4. Heuliez EB: Operational Parameters Analyses
In this section, the operational parameters of the Heuliez EB were analyzed. The parameters include charging C-rate, charging time, and energy consumption. Furthermore, some other statistical analyses were implemented, including daily driving distance, daily operational time, number of fast charges, number of slow charges, etc. The analyses based on obtained data are from 15 June 2021 to 22 June 2021 of Line 12, which operated between St. Olavs Hospital/Øya to Sentrum Strindheim and Dragvoll (
https://www.atb.no/trondheim-area/category2822.html, accessed on 1 Jan 2022), see
Figure 4. Line 12 includes 29 bus stops in total. The data include the total distance of the line route, i.e., 2.061 km during operation.
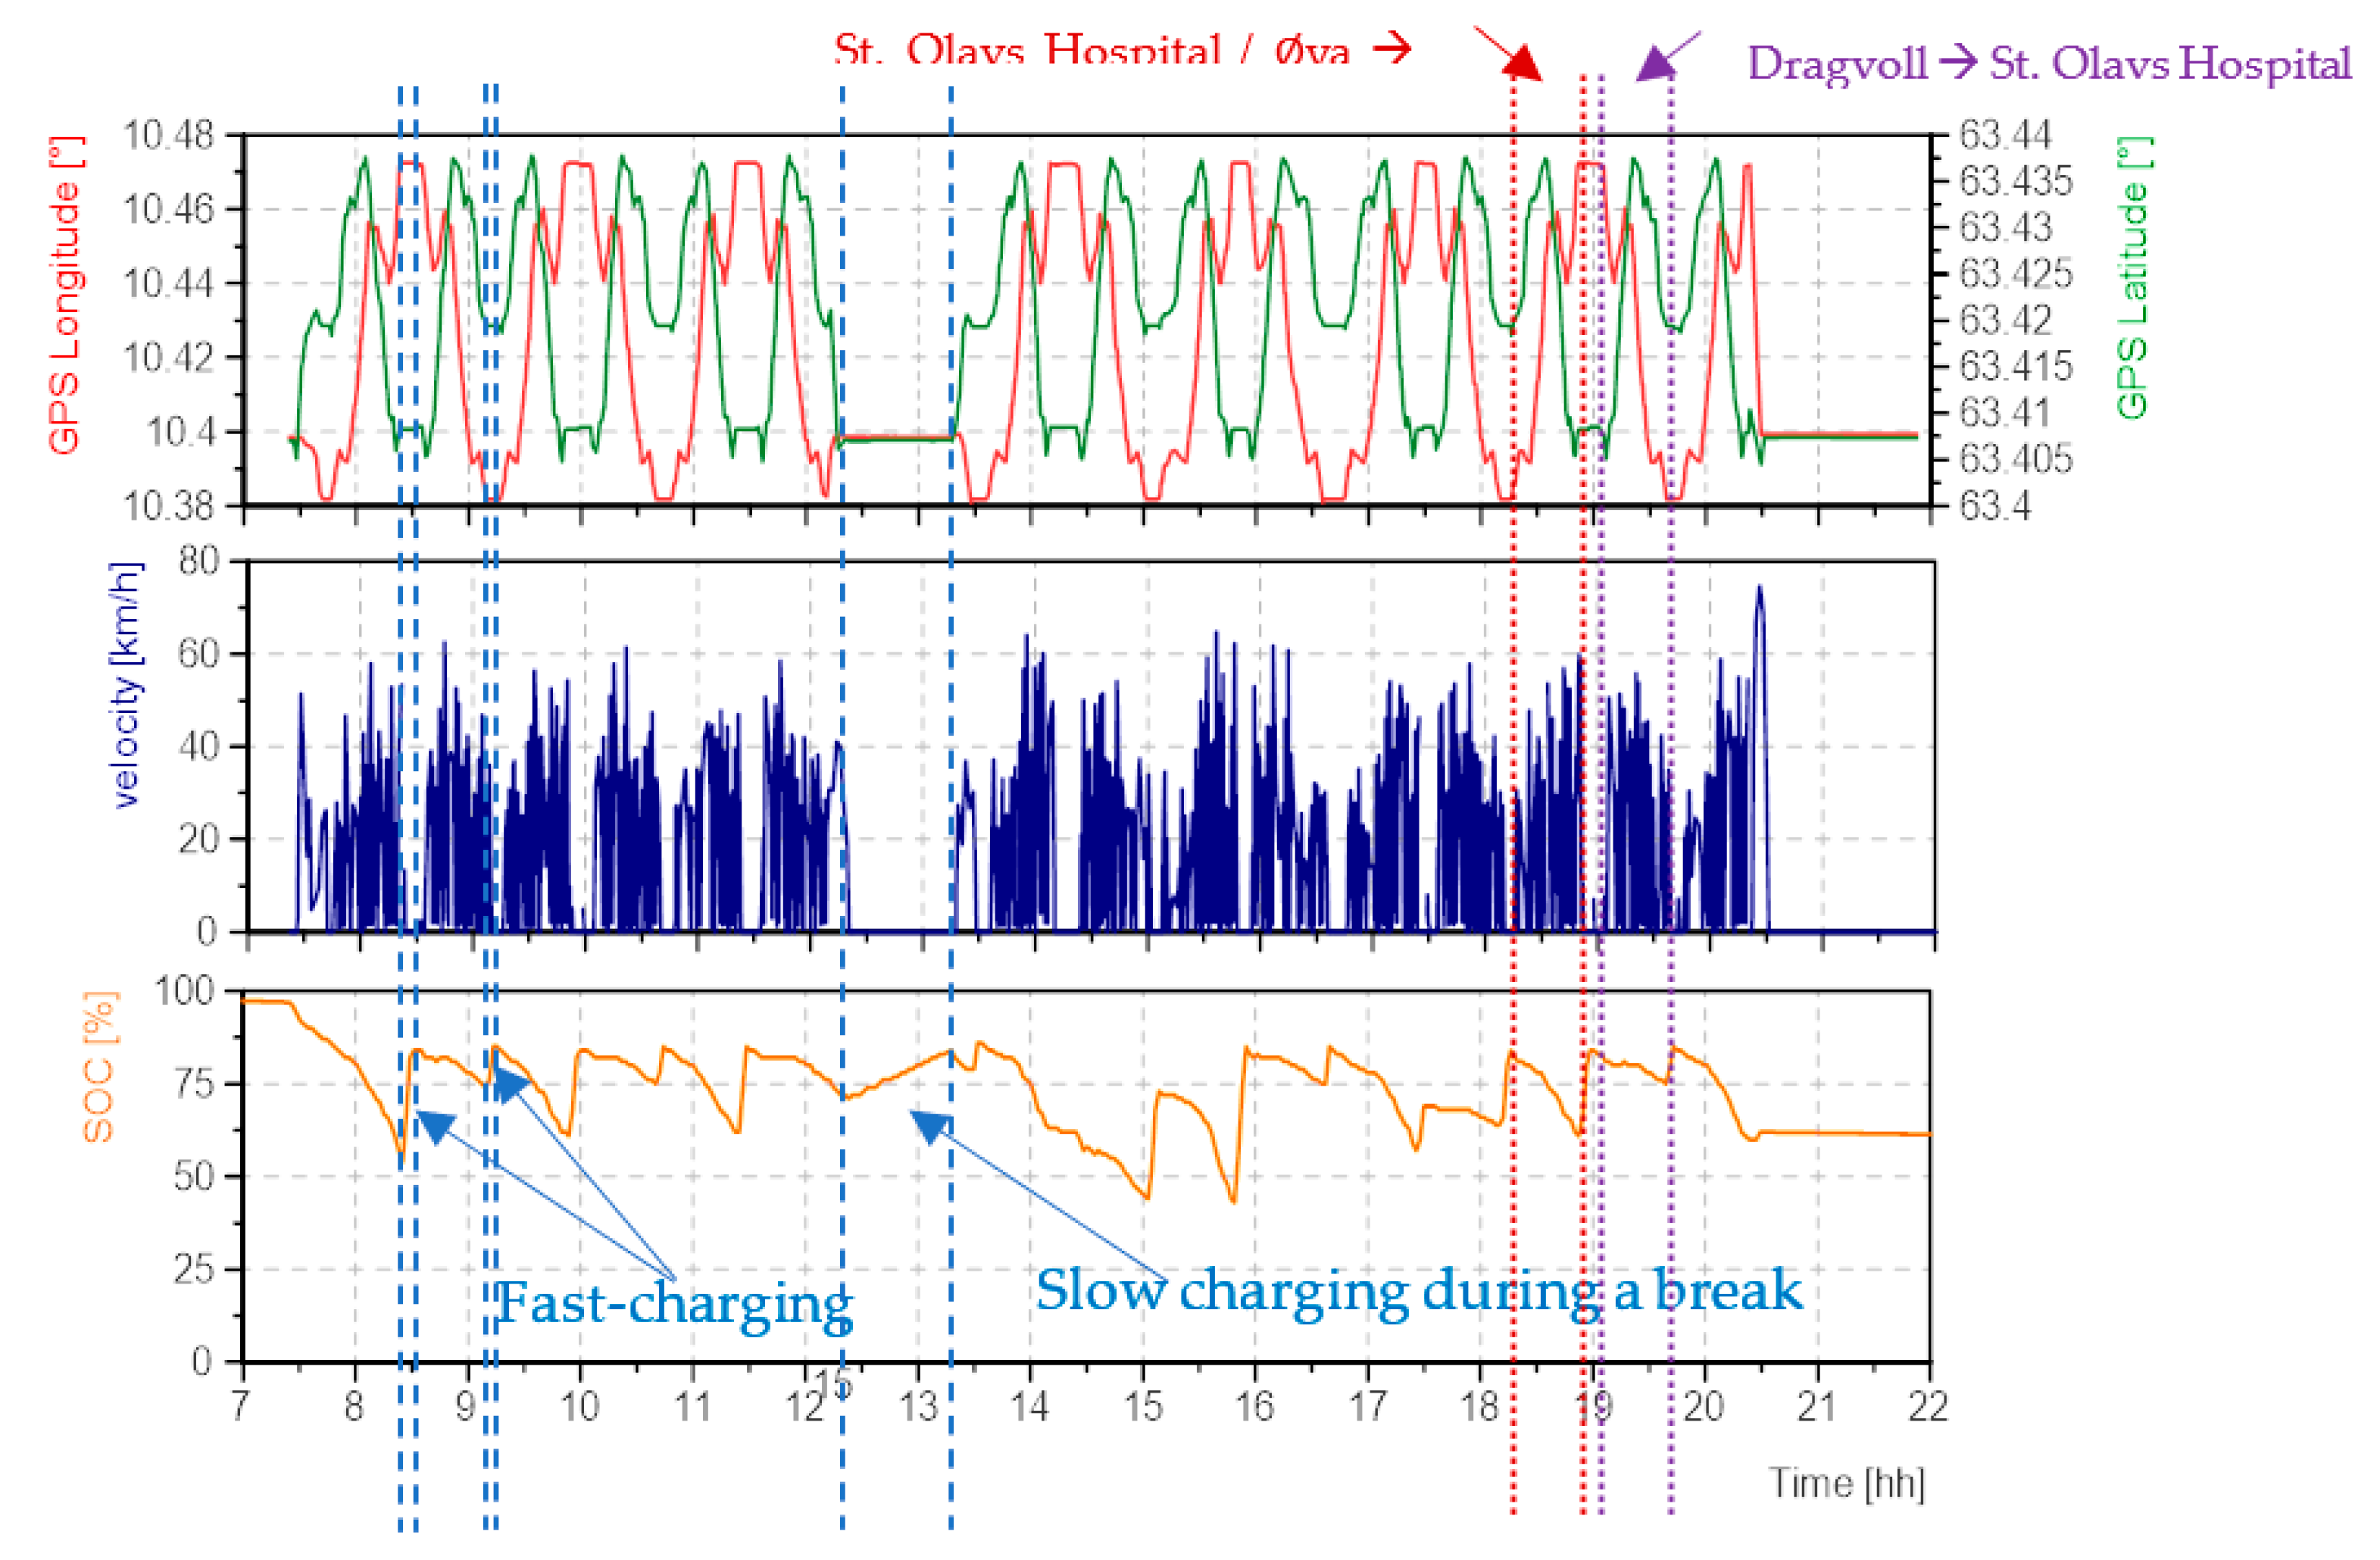
The external temperatures during the operation week vary from 6 °C to 22 °C with an average of 15 °C. Therefore, the temperatures are comparable with the autumn in Osnabrück. To get an impression of the daily routine of the bus,
Figure 5 shows the GPS and the SoC throughout the day on the 15 June. The beginning and the end of the vehicle usage were at the depot. The vehicle starts with a fully charged battery. During the day, the vehicle drove between “St. Olavs Hospital/Øya” and “Dragvoll”. At the stop at both ends, the vehicle was charged via opportunity charging for around 2–6 min. The opportunity charging time differs because charging was done in the time buffer to keep to the time schedule of the route line. The average SoC is on a high level of more than 70% so that in a case of a delay, the opportunity charging time can be shortened without the risk of low energy. At midday on 15 June, there was a break of around 1 h at the depot, where the vehicle was slowly charged.
Some of the operational parameters were analyzed statistically and presented in
Table 7, which lists the minimum, maximum, and average values of the operational EB parameters.
As can be seen from the table above, some observations regarding operational parameters could be summarized:
The C-rate of every single charge was calculated.
The average C-rate of the opportunity charging is around 20 times higher than the slow charging during nights and stops.
During operation, only around 7.2% of the operational time is used for charging (without overnight charging). This small amount of required charging time can be provided by the typically scheduled waiting times in the stops at the end of the line. These waiting times are also scheduled for diesel baseline busses as a time buffer, for a short break of the driver, and for driver changes. Thus, in this case, there is no extra time needed for EB charging.
The average energy consumption is 1.4 kWh/km. It is important to mention that this value is estimated from the output power of the battery and does not include the energy losses from the charger, the charging progress, and the battery.
Average daily operational time is 13 h and 14 min and the driving distance is 294.5 km. With opportunity charging on Line 12, the EB can operate like the baseline diesel bus.
The average charging time (fast charging) is 5 min with an average delta SoC of 19.6%. With a battery capacity of 102 kWh, the average charging amount is 20.0 kWh.
The fast chargers need 261 kW on average and a maximum of 490 kW as a power requirement (plus the energy losses from the charger, the power transfer, and battery charging).
The obtained results are comparable with some obtained in the literature. In [
16], some EBs from four brands were tested, i.e., BYD, Skywell, Yinlong, and Jiankang. The EBs include buses with a length of 8 m and 10 m. The EBs of 10 m in length showed higher power consumption than the 8 m buses. For example, per 100 km, some 10 m EBs consumed 100 kWh, 93 kWh, 106 kWh, and 102 kWh, for 8 m EBs, the consumptions were 83 kWh, 73 kWh, 94 kWh, and 80 kWh. While the charging duration was almost equal, for example, for 10 m EBs it was 28 min, 16 min, 27 min, and 23 min, and for 8 m EBs it was 29 min, 16 min, 28 min, and 20 m. The daily average driving distances of most EBs are equal and around 200 km.
In October 2019, a new record was marked by the EB from Iveco with the Iveco E-WAY 12 m (Heuliez GX 337 Elec), where on a single charge the bus covered as many as 527 km during a test day. The bus travelled with an average speed of 46 km/h for 12 h. The heating and air conditioning were turned off. This remarkable driving range couldn’t be achieved in normal traffic conditions [
6].
3.5. E-Truck
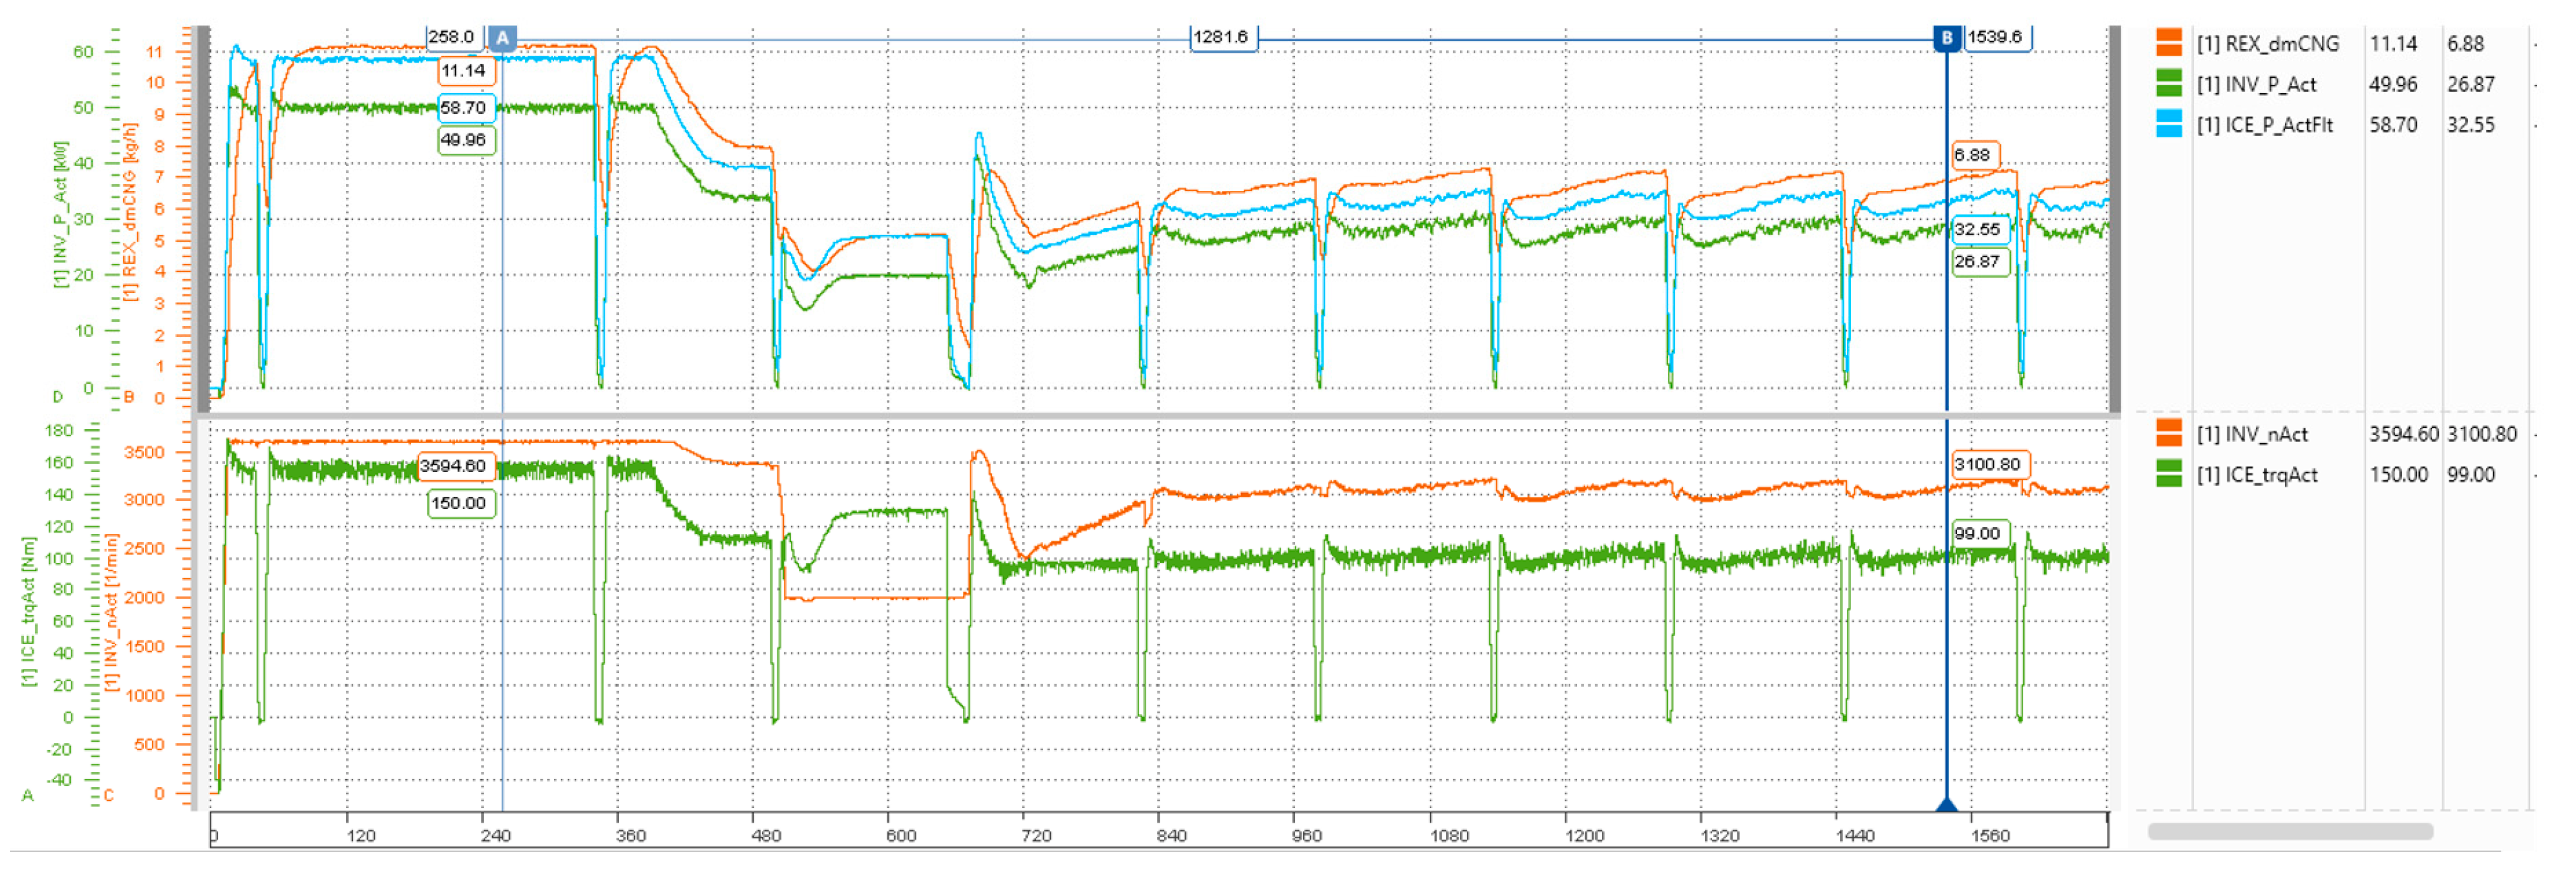
While REx was being build and put into operation in the MAN E-Truck, the tests and measurements were done. Graphs of the engine torque and speed, Compressed Natural Gas (CNG) mass flow, and produced electric power of the REx module running on a test bench are shown in
Figure 6.
3.5.1. REx Module Efficiency
The maximum power output (electric) of 50 kW, for which the REx module was designed, is the setpoint in the first 360 s (values at point A). The efficiency here is 4.5 kWh/kg CNG or 34% (based on a calorific value of 13.2 kWh/kg for CNG). The combustion of 1 kg of CNG produces 275 kg of CO2, so the efficiency related to CO2 is 1.6 kWh/kg CO2. A lower setpoint with advantages regarding acoustics and temperatures is shown with point B. Here, 27 kW of electric power was generated with 3.9 kWh/kg CNG (30%) or 1.4 kWh/kg CO2.
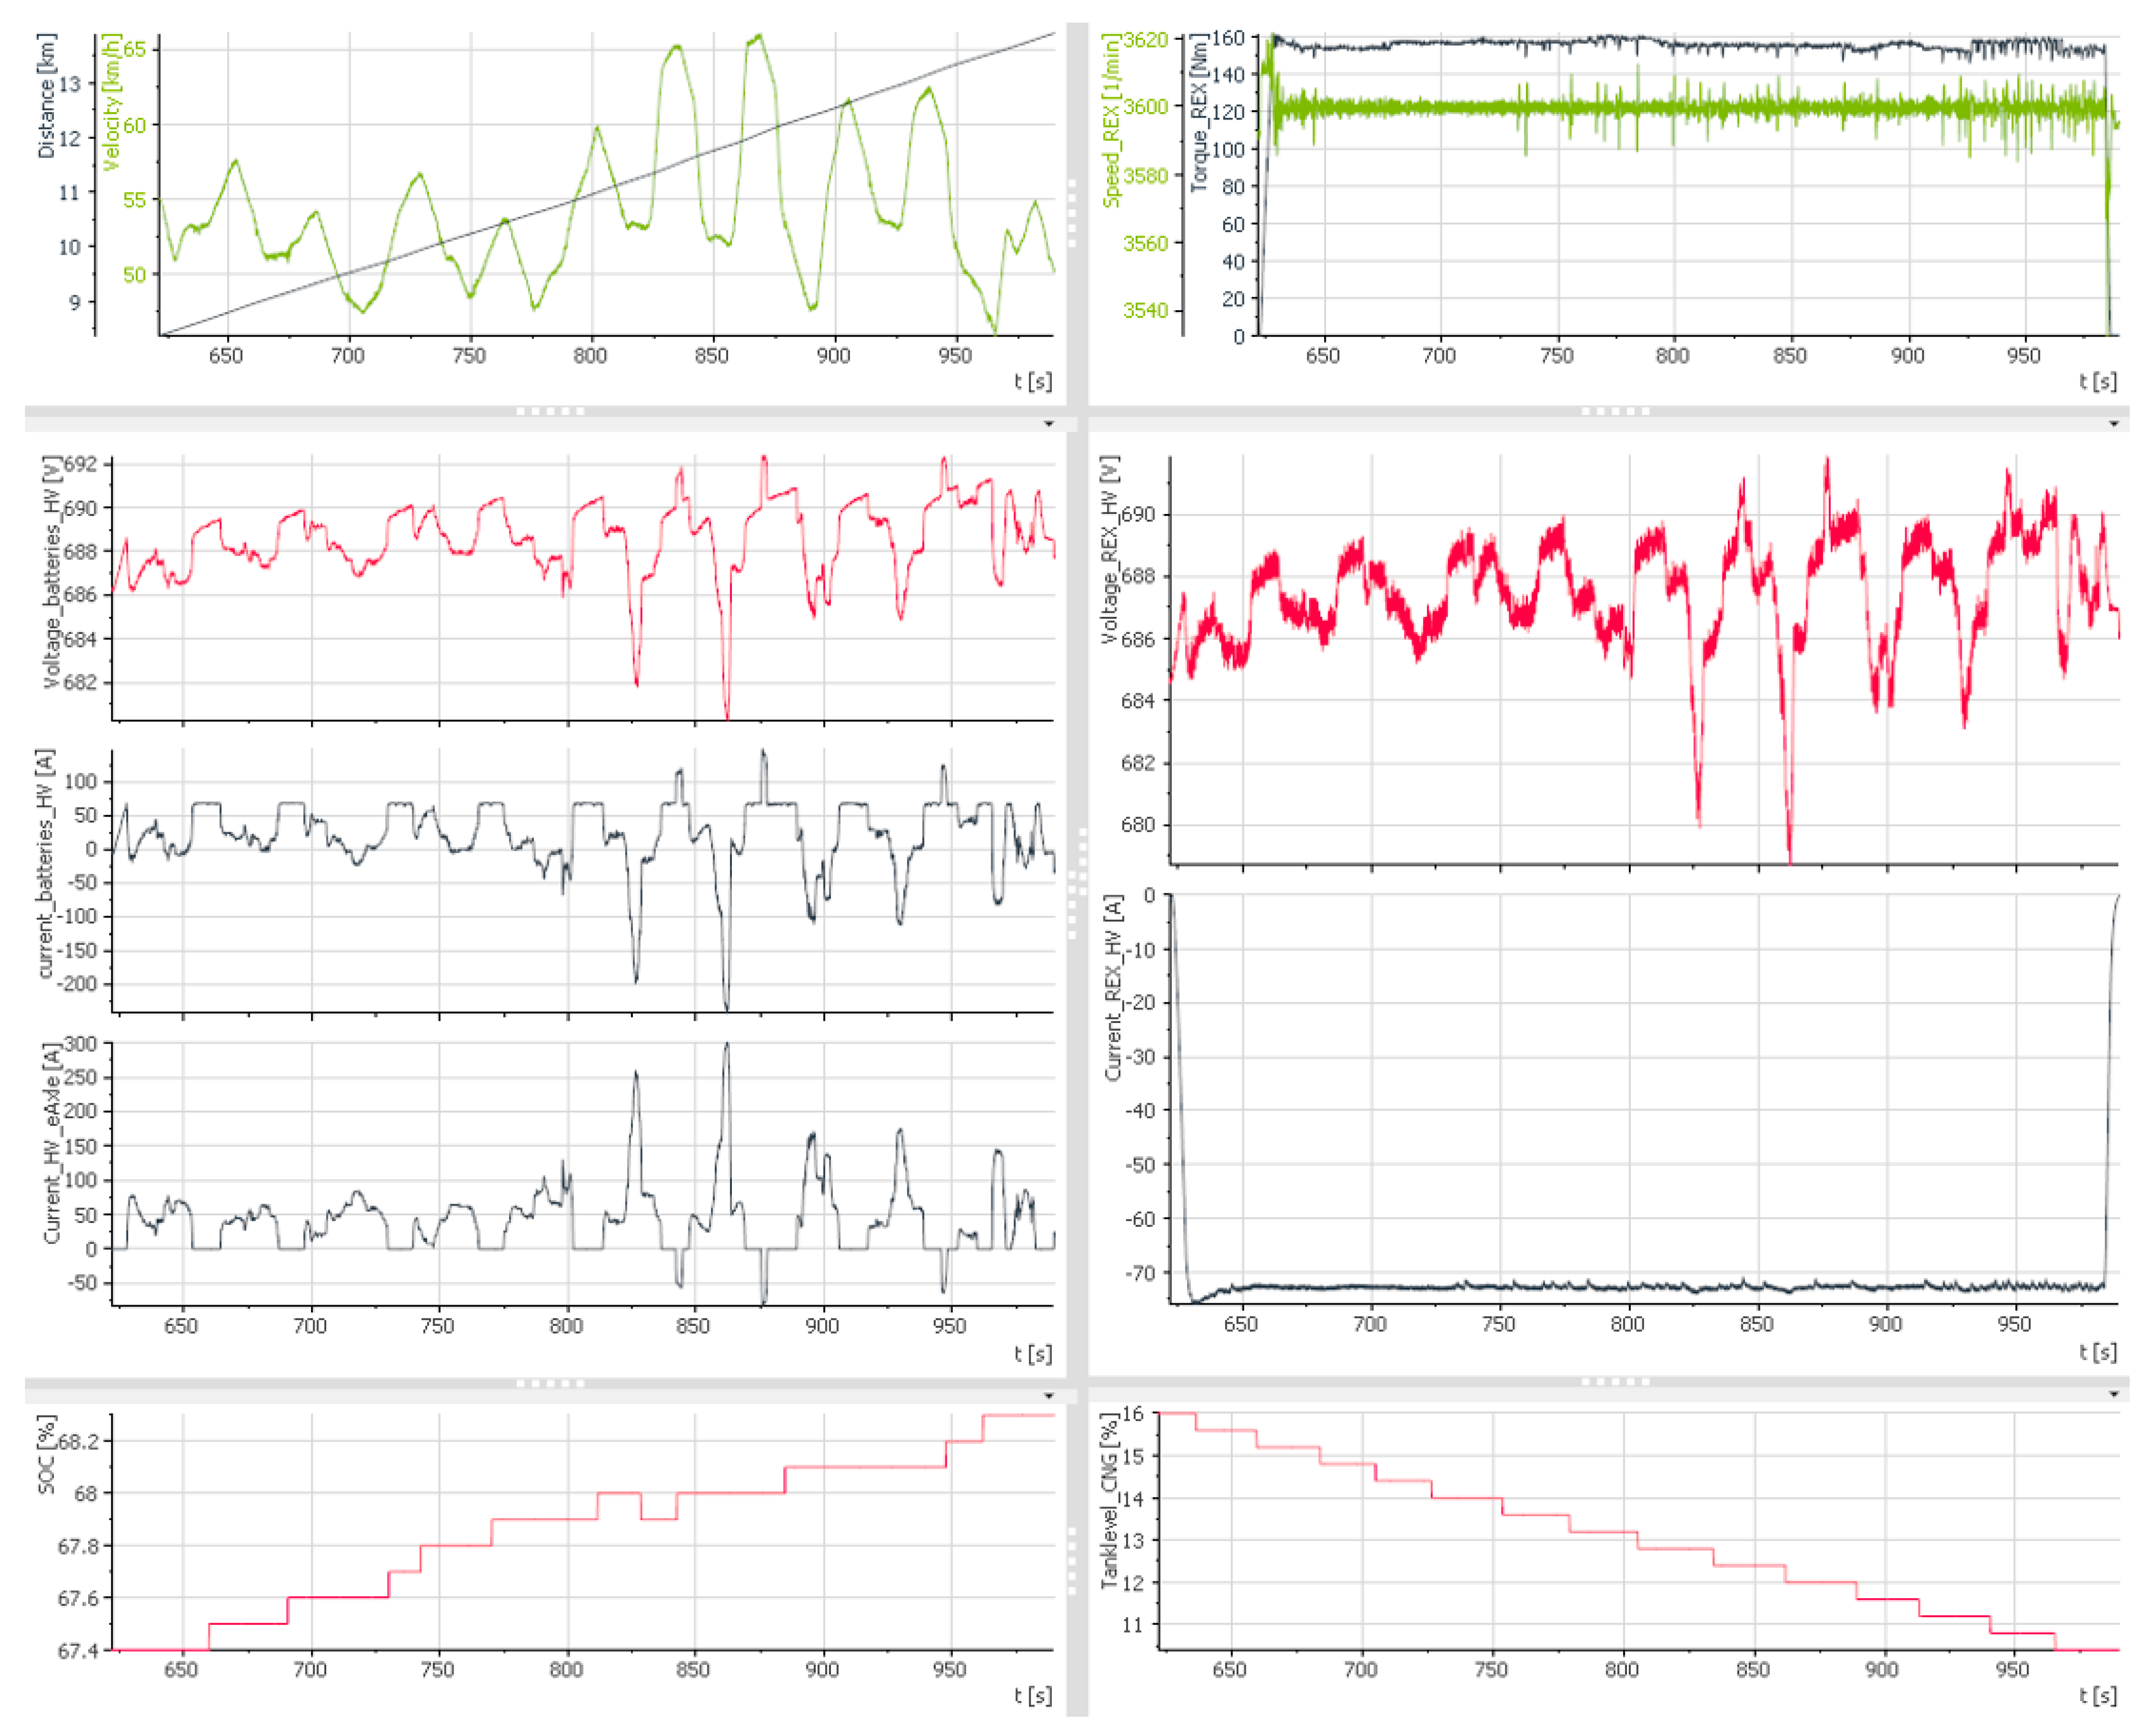
In
Figure 7, the REx module is set to be 50 kW electric output and the vehicle (empty, no waste collector) is running on the test track between 45–65 km/h. In this 6 min, the REx produces electric energy of 5 kWh with about 1.1 kg CNG, which confirms the results from the test bench.
3.5.2. Consumption
The heat pump (heating, cooling, air conditioning) could be successfully put in operation. First exemplary runs show its potential to reduce energy consumption compared to a conventional electric heater. At 5°C ambient temperature, the cabin gets heated with an electric heater or the heat pump. Air temperatures in the cabin are identical, but the energy consumption of the heat pump is about half that of the electric heater in this setpoint and under these boundary conditions.
In terms of impact of energy consumption due to heating system, the E-Truck could be compared to an EB. The obtained results are consistent with those obtained from a real test that was conducted on the 12 m EBs in winter that were aiming to investigate the impact of the heating system on the EBs’ range. The EBs were heated by an auxiliary fossil fuel heater that consumes energy of 110.5 kWh plus 20 L of fuel to 144 kWh plus 6.4 L of fuel. The EBs energy consumption with full-electric heating, “diluted” over 100 km, stands in the range of 179–235 kWh. In other words, the energy consumed by the tested EBs is in the range of 1–1.4 kWh/km with fossil-fueled heating systems, while the consumed energy is up to 2.35 kWh/km with electrical heating systems. Taking Solobus as an example, with 300 kWh of battery capacity, the range of the EB is between 214–300 km if heated using diesel and as low as 130 km if heated using electricity [
6].
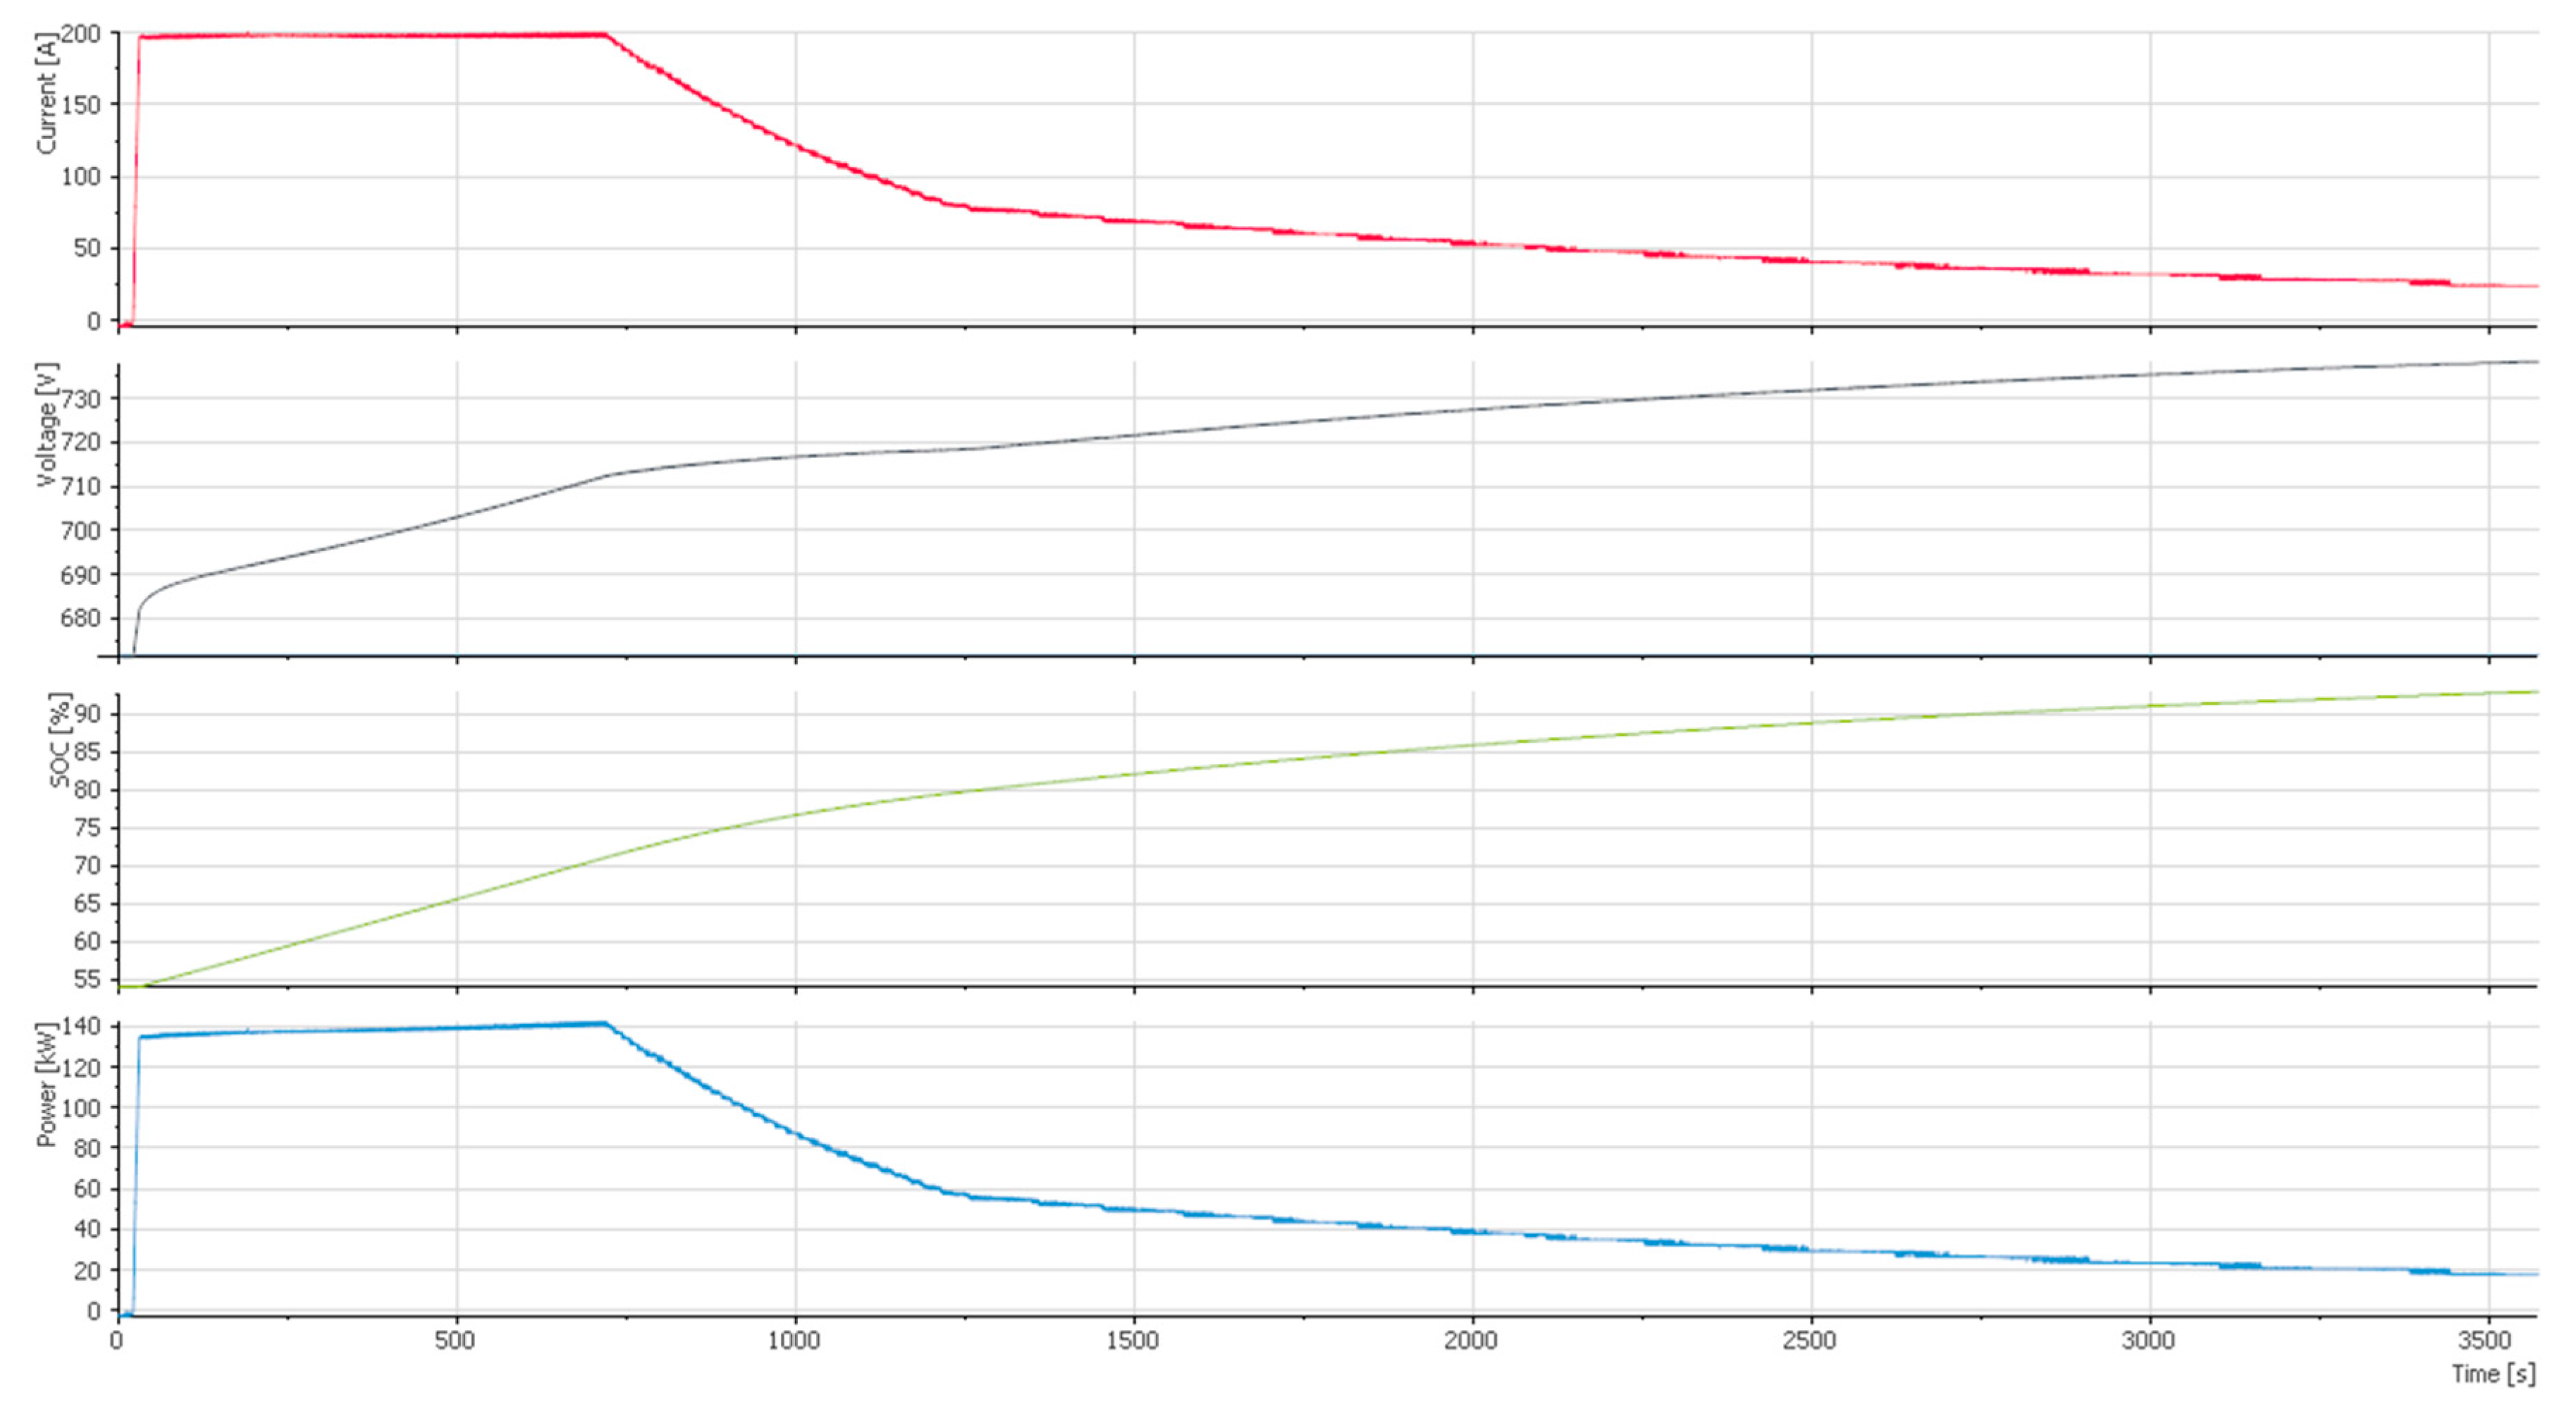
The graphs in
Figure 8 show the voltage, current, SoC of the battery system, and charging power. Due to the CCS2 charging interface, the current is limited to 200 A. With increasing battery voltage above 715 V (around 72% SoC), the charging current gets derated. At this point, the maximum charging power of about 143 kW is reached.
4. Conclusions
The interoperability between fast-charging technologies and EBs that were developed within the ASSURED project has been investigated. The tests showed that there is good compatibility between the two technologies, which, when the EBs working normally, minimizes the total system cost, minimizes the total infrastructure cost, and minimizes the number of chargers. Furthermore, the charging efficiency of the chargers reaches 99%, which makes them technically and economically valuable. The fast-charging solutions proved their ability to meet the energy need of the EBs with optimized operation, which include deploying same number of EBs as diesel ones, no impact on the vehicle schedule, and the ability to use low battery capacity onboard.
The average energy consumption of EBs operating in the considered route lines have been estimated in order to investigate the possible locations and sizes of the charging systems that will need to be installed. The weather conditions were taken into account. It was found that some of the EBs consume extra 64% of power during the wintertime due to the heating system. It was proved, during the E-Truck demos operation, to optimize the energy consumption, that the heat pump consumes around half as much energy as the electric heater. This conclusion was taken from only one setpoint under specific boundary conditions during the testing and application of a heat pump. The heat pump could be used instead of electric heaters to minimize the total energy consumption. The energy consumption could be different for the same EBs with the same length, capacity, load condition, etc. This could be explained by the difference in traffic conditions (or terrain) from one line to another or from one city to another. In urban areas, the EB spends much time stopping and moving at low speeds, it consumes energy even when it is stopped in a traffic jam because it has to supply the auxiliaries.


 ,
, 


