Abstract
This study involved a detailed analysis of an energy distribution strategy and the parameters of key components of fuel cell electric vehicles (FCEVs). In order to better utilize the advantages of multiple energy sources, the wavelet-fuzzy energy management method was used to adjust the demand power allocation among multiple energy sources, and particle swarm optimization (PSO) was used to solve highly nonlinear optimization problems under multi-dimensional and multi-condition constraints. The multi-objective optimization problem of predefined driving cycle powertrain parameters about fuel economy and system durability was studied. The parameters of the key components of the system were optimized, including the size parameters of the air com-pressor and the number of batteries and ultra-capacitors. Furthermore, the driving state under specific working conditions was analyzed, and a nonlinear model with system durability and fuel economy as the optimization objectives were established, which greatly reduced the costs, reduced the fuel consumption rate and extended the battery life. The simulation results showed that for a UDDS cycle, the FCS’s maximal net output power of 83 kW was optimal for the fuel economy and system durability of a fuel cell city bus.
1. Introduction
In order to solve the problems of energy consumption and environmental protection in the field of transportation, fuel cell (FC) technology uses renewable fuels to provide power for vehicles; therefore, it is considered to be the most potential solution, but using a fuel cell system as the only power supply cannot meet all the requirements of vehicles. The dynamic response of a hydrogen fuel cell is poor and the regenerative braking energy cannot be covered again; therefore, other auxiliary energy sources are usually required.
In FCEVs, the energy supply system is an expensive, heavy and bulky component and its comprehensive characteristics directly affect the mileage and fuel economy. It is one of the important areas to optimize when formulating a power management strategy. Adding an auxiliary energy storage system composed of batteries and ultra-capacitors makes the energy supply mode flexible, prolongs the life of the FCS, improves the recovery of braking energy and minimizes the consumption of hydrogen. The FCS is used to provide the average power required when the vehicle is running, and the auxiliary power source is used to provide the peak power to supplement the insufficient power of the FCS when the vehicle is accelerating or climbing, avoiding the shortcomings of the poor dynamic response of the FCS [1]. Ultra-capacitors have the largest power density and an FCS has the smallest power density, while an FCS has the highest energy density and ultra-capacitors have the smallest.
When the driving cycle is determined, the parameter sizing and energy management strategy will determine the fuel economy and system durability. The sizes of the battery, ultra-capacitors and fuel cells are the key factors affecting the overall efficiency of the power system, which determines the power, economy and cost of the power system, as well as the effectiveness of the energy management system. The goal of energy management is to minimize fuel consumption while maintaining the battery state of charge (SOC) and prolonging the battery life because battery life is directly related to replacement cost, which limits the advantages of electric vehicles. In order to achieve this goal, it is necessary to design the optimal energy management strategy and match the optimal parameters to balance the power supply of the FCS, battery and ultra-capacitors, and give full play to the advantages of multiple energy sources. When matching the parameters of a vehicle, the weights and volumes of energy supply components and auxiliary equipment have a greater impact on the system durability and cost of the vehicle, and various parameters are usually optimized under constrained conditions. Part of the optimization research ignores the energy management system and focuses on the sizes of the structural parameters.
Some authors tended to only focus on the energy management strategy. Hanane Hemi proposed Pontryagin’s minimum principle combined with the Markov chain approach for a fuel cell/ultra-capacitors electrical vehicle to predict the future power demand [2]. Jamila Snoussi et al. designed a triple-power-supply system of a fuel cell, lithium battery and ultra-capacitors, and proposed an energy management strategy based on adaptive filtering [3]. Through dynamic programming algorithm, P. Elbert et al. used the calculation method of fuel consumption matrix and reachable state set, taking the minimum fuel consumption as the target parameter, and carried out the optimal energy distribution [4]. Zandi et al. used a battery and ultra-capacitors to assist the fuel cell; optimized the system power output according to the fuel cell efficiency, battery SOC and ultra-capacitors characteristics; kept the battery SOC within a certain range; reduced hydrogen fuel consumption; and prolonged the components’ lives [5]. Masih et al. defined a formulation for energy storage hybridization sizing, and the dynamic programming method was used to optimize the energy management strategy, where the optimum strategy increased the lithium battery life [6]. According to the driving power demand of the vehicle, Z. Ridong extracted the driving mode from the historical speed window based on the multi-layer perceptual neural network and used the adaptive fuzzy energy management controller for power allocation [7]. Omid Madani et al. developed a separate controller for the power management for FC and ultra-capacitors, instead of a central controller mode, which distributes energy according to the frequency characteristics of each power [8]. M. K. Dayeni designed an adaptive fuzzy logic controller and a traffic condition recognition algorithm to select the working mode of the vehicle according to different traffic conditions and performed energy management and distribution [9]. Some studies focused on the recognition of driving patterns, which can be distinguished by their characteristic driving conditions. Many studies in this field involved mathematical modeling of traffic flow, such as the work of Wang and Chen [10,11]. In other studies, the obvious advantages of an auxiliary fuel cell system in recovering braking energy were analyzed [12,13,14].
Some authors aimed to optimize the powertrain parameters and EMS simultaneously. There is a connection between the energy management strategy and the structural parameter, and these two sets of parameters should be jointly matched and optimized to achieve the optimal power and economy of the vehicle. For example, for an air compressor in an air supply system, the size of the impeller radius is closely related to the efficiency, power characteristics and weight of the compressor, and the number and weight of battery packs are also closely related to parameters such as power and efficiency. Therefore, the energy management strategy and the key structural parameters should be optimized at the same time to find the optimal parameter combination. In the work of Junyi Shen, a multi-objective optimization problem was formulated to optimize the HESS weight and battery cycle life using the dividing rectangles algorithm [15]. Cai presented a sizing design methodology for the hybridization of a fuel cell with a battery or ultra-capacitors for an unmanned underwater vehicle to meet the power and energy demands, while at the same time meeting the weight and volume constraints [16]. Francisca Segura proposed a hybrid control concept joining constant and variable control techniques, which solves some problems that traditional techniques hold, and this work contributed to existing power management proposals with a new hybrid control concept [17]. Xu adopted a dual-loop optimization structure of inner and outer loops to achieve the dual optimization of the best energy parameters and structural parameters. However, this method requires high accuracy of the control strategy, and it is difficult to avoid the situation where only local minimums are obtained [18]. S. Ziyou used dynamic programming (DP) approach to optimize the configuration and energy management strategy of a hybrid energy storage system that included a battery and ultra-capacitors, and proposed a rule-based optimization strategy [19]. Alexandre Ravey studied a methodology based on two combined optimization loops: using a genetic algorithm and dynamic programming for sizing the energy sources and computing the optimal energy management strategy [20].
According to the previous analysis, the following points can be drawn:
- (1)
- The optimization of an energy management strategy is always combined with the size matching of key vehicle components. A rule-based strategy or optimal control strategy can be used for optimization, or it can be regarded as a low-level optimization problem in the cycle of vehicle parameter matching.
- (2)
- A variety of algorithms can be used, such as convex optimization and PSO, which can solve the combinatorial optimization problems of parameter matching and energy management at the same time.
In this study, a multi-objective optimization method of FCEV power system parameters was proposed based on PSO. Section 2 describes the topology of the power system, Section 3 provides the design of the wavelet-fuzzy logical energy management system, Section 4 presents the optimization of the control strategy and component parameters based on PSO and Section 5 summarizes and analyzes the optimization results.
2. System Description and Methodology
2.1. Powertrain Structure
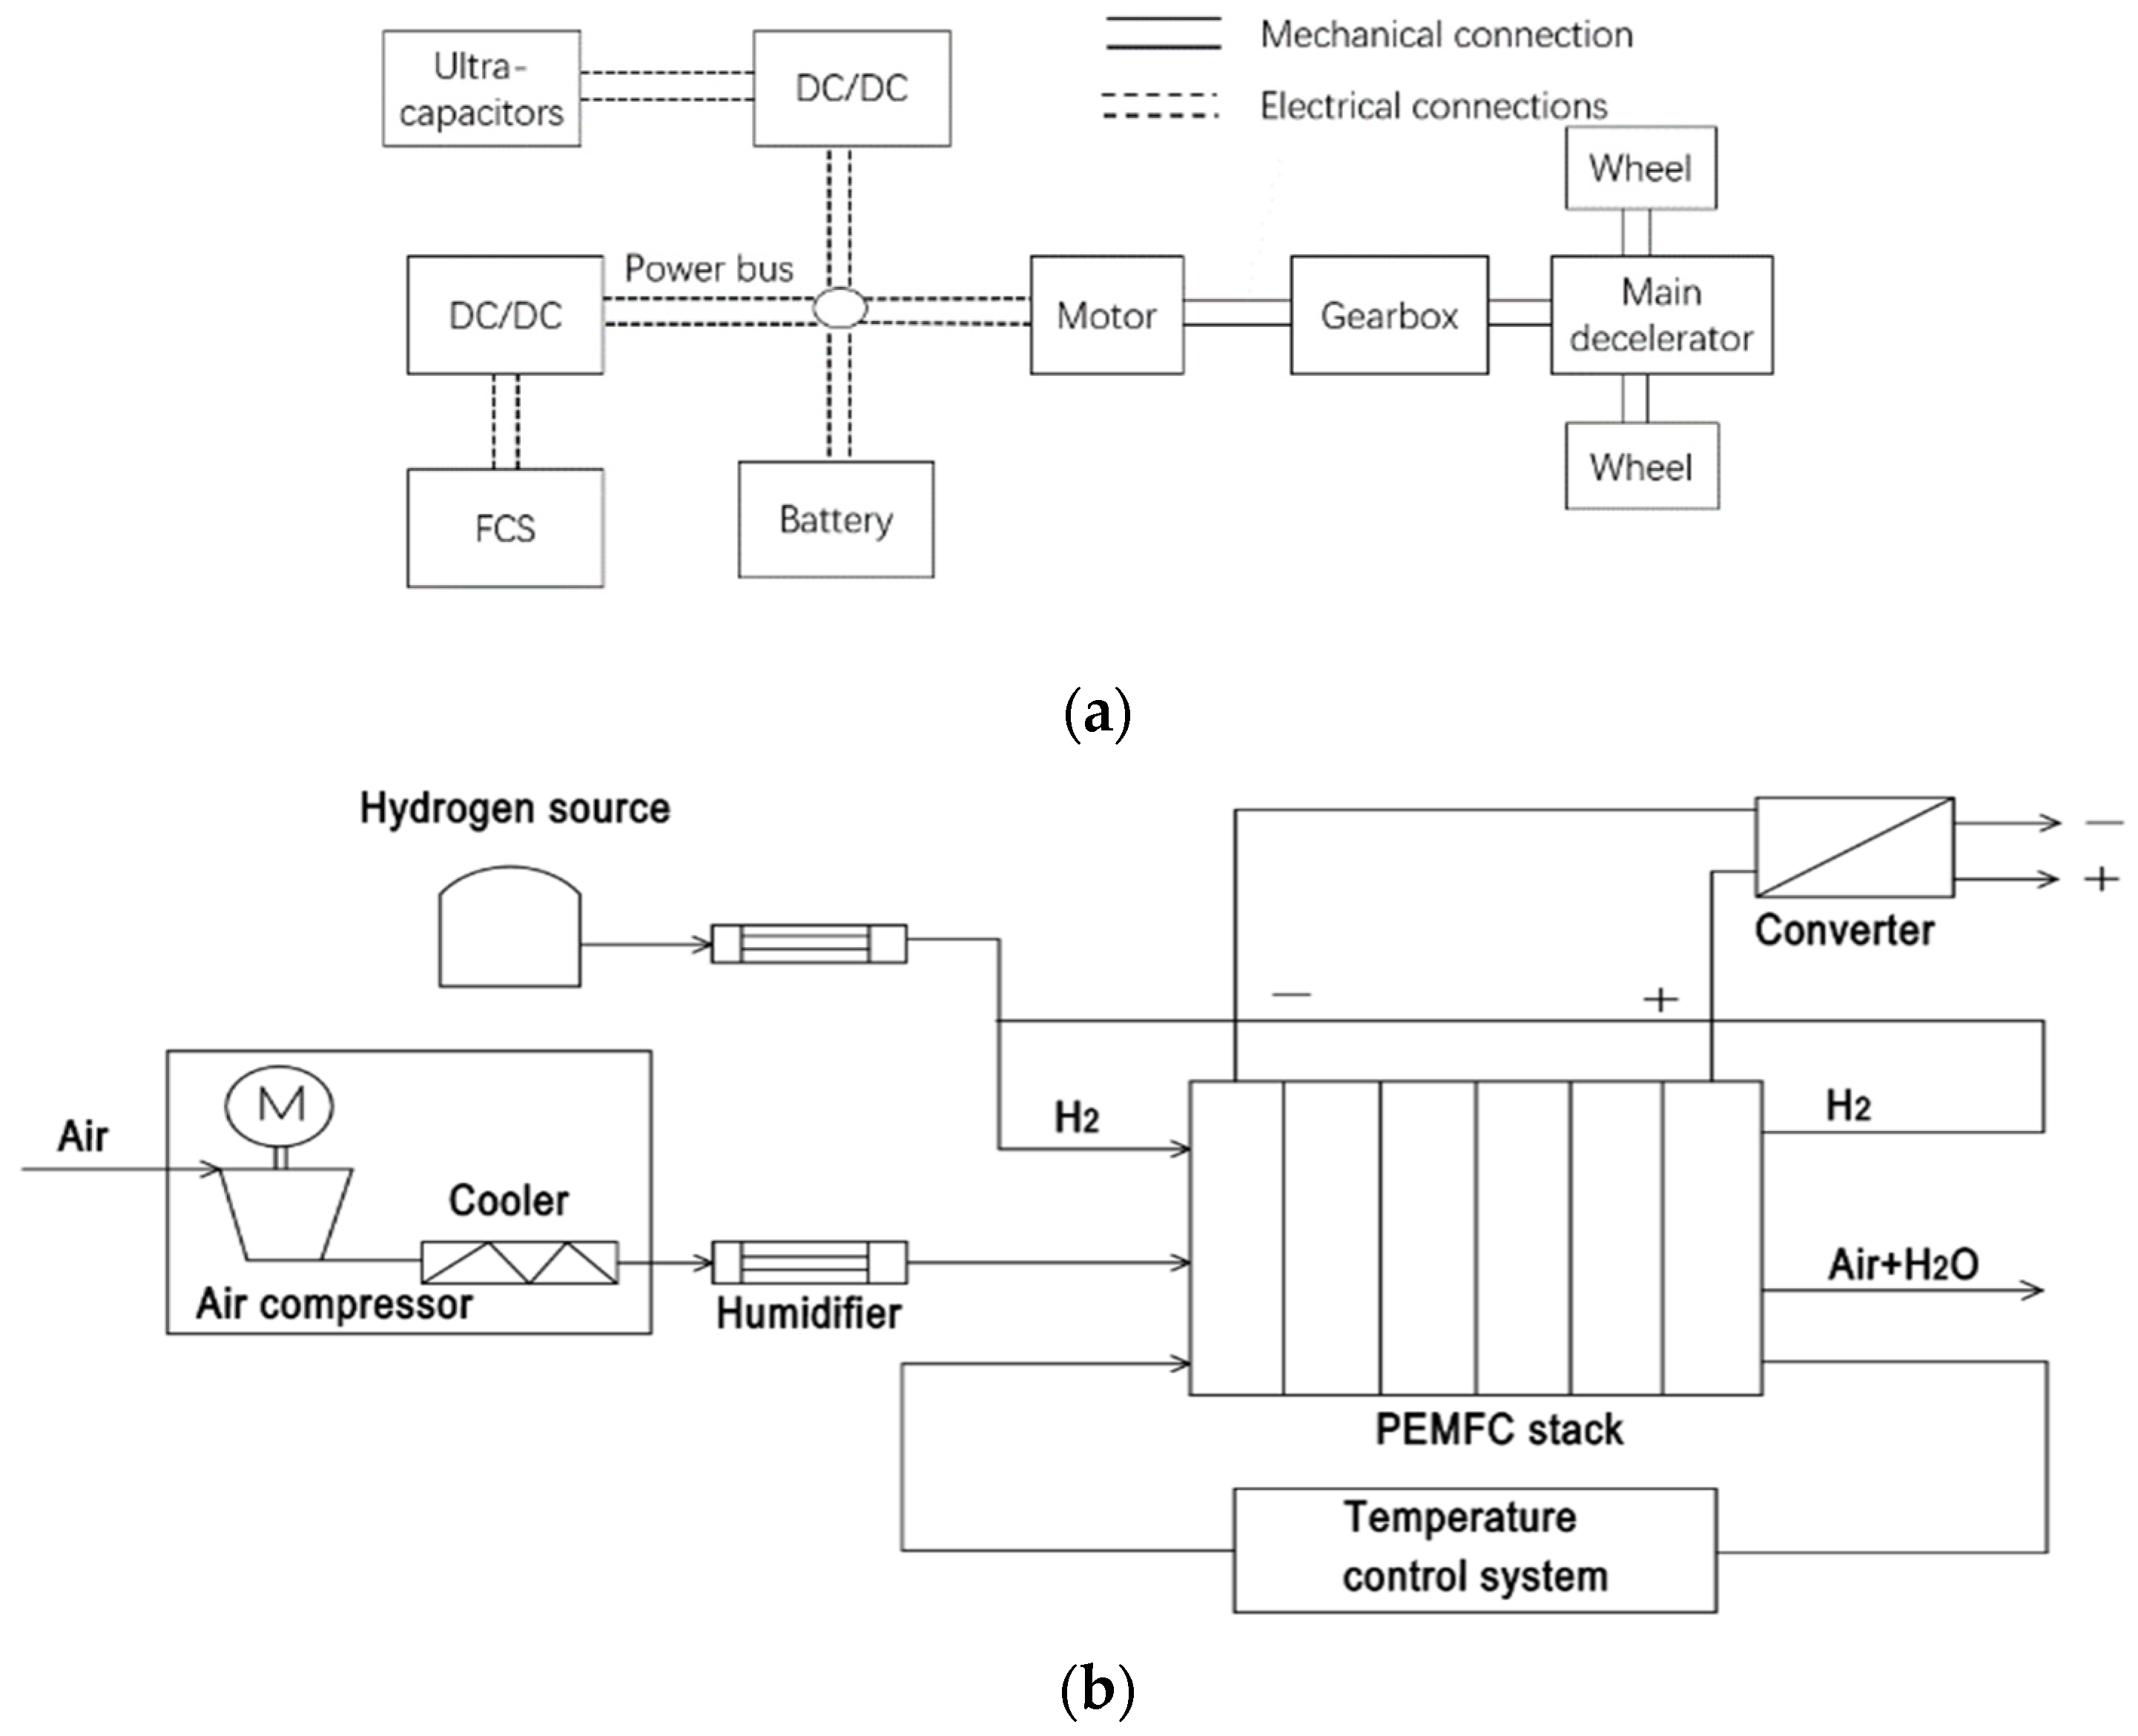
The power system of triple-energy FCEVs is shown in Figure 1a. The FCS, battery and ultra-capacitors are connected in parallel to the power bus, and the energy is transferred to the motor through the energy distribution controller to drive the vehicle. The FCS has the advantages of simple structure and higher power density, compared with the internal combustion engine of the same size, and it has relatively high electrical efficiency and can operate at low temperatures. The FCS is divided into four subsystems: fuel cell stack, gas supply subsystem, hydrogen supply subsystem and water and heat management subsystem, as shown in Figure 1b. The air supply subsystem is mainly realized through the air compressor to pressurize the ambient air to the optimal working pressure of the fuel cell stack and provide the required air mass flow according to the power demand. The air supply system has a great impact on the performance of the stack, which directly affects the efficiency and cost of the stack, and is the main contributor to the cost of the fuel cell system.
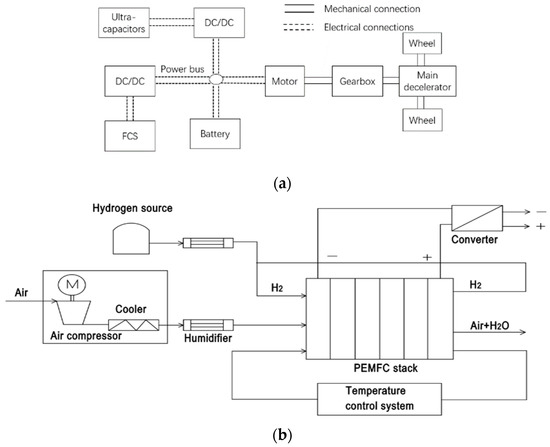
Figure 1.
Structure of power system of FCEVs and an FCS: (a) Power system structure (b) FCS structure.
2.2. Matching of Composite Power Supplies
The vehicle operating modes include a fuel cell separate driving mode (FDM), composite power supply separate driving mode (CDM), composite power supply fuel cell combined driving mode (FCDM) and braking energy recovery mode (BRM). In the FDM, the fuel cell provides the energy required by the vehicle, and the excess energy can be stored in the composite power supply. In the CDM, the fuel cell is in the shutdown state, and the energy required for vehicle driving is only provided by the composite power supply. In the FCDM, the fuel cell and composite power supply jointly provide energy for the vehicle. In the BRM, the braking energy recovered by the motor is stored in the composite power supply. BRM refers to the process of converting part of the kinetic energy into other forms and storing it for driving when the vehicle decelerates or brakes. The realization of regenerative braking involves controlling the traction motor to enter the power generation state when the vehicle is braking, driving the motor to generate power through the inertia torque generated by the wheel and storing it in the battery and supercapacitor.
In the power system, the FCS provides stable energy, and the composite power supply supplements the additional energy demand. In the composite power system, the battery can output energy continuously and stably, and the ultra-capacitors supplements the rest. In other working conditions, a composite power supply is required as an independent energy output unit to drive the vehicle and continuously output energy [21]. The FCS and the composite power supply provide energy together, which is suitable for heavy loads and large power requirements. The output power can meet the needs of motor and electrical accessories, where the power demand of the composite power supply is as follows:
- : Required power of composite power supply;
- : Efficiency of the motor control system;
- : Maximum power required by the vehicle;
- : Other power requirements;
- : Fuel cell system power;
- : DC converter efficiency.
According to the above analysis, when the SOC of the battery and supercapacitor is high, only the composite power system provides energy and the output power meets the requirements of motor and electrical accessories:
- Pcap2: Required power from the composite power supply;
- Prat: Rated power of the power source (motor).
The power output capacity of the composite power supply shall meet the following requirements:
Pcap = max (Pcap1, Pcap2) = Pcap1
2.3. PEMFC Model
A proton exchange membrane fuel cell (PEMFC) is an electrochemical device that can produce electric energy through chemical reactions. As the main energy source of vehicles, it needs to meet the requirements of most steady-state loads. A PEMFC is mainly composed of anode, electrolyte and cathode electrode. Hydrogen is evenly distributed to the anode of the fuel cell through the flow channel, and the air provided by the compressor enters through the distribution channel of the cathode.
The open-circuit voltage of the Nernst equation for a PEMFC is as follows [22]:
- : Change in molar concentration of the hydrogen;
- : Cell temperature (K);
- : Gas constant = ;
- : Partial pressure of hydrogen;
- : Partial pressure of oxygen;
- : Ratio of gas to liquid water;
- .
The combined effect of thermodynamics, kinetics, ohm resistance and mass determines the output voltage of a fuel cell as follows:
- : Open-circuit voltage;
- : Activation loss;
- : Ohmic loss;
- : Concentration loss.
The total fuel cell voltage is given as follows:
2.4. Lithium Battery Model
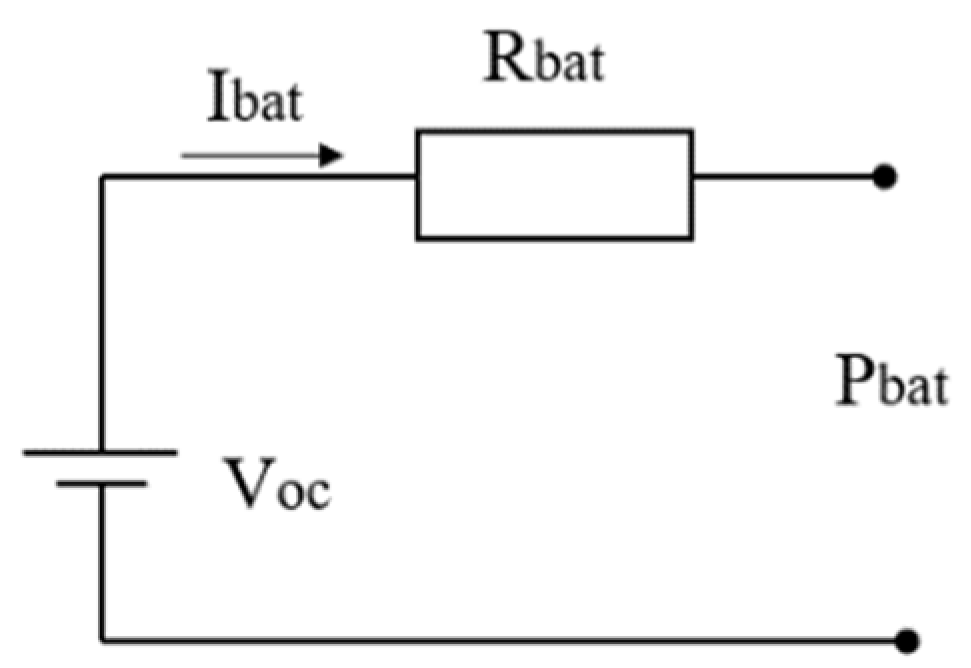
From the perspective of energy management, most batteries are modeled through an equivalent circuit, including the internal resistance model (Rint), resistance–capacitance model and Thevenin model. Although the Rint model does not describe the dynamic response of the battery well, it can truly reflect the energy consumption of the battery. The model is simple in form and has an acceptable accuracy range. The circuit principle of the internal resistance model is shown in Figure 2. In order to meet the voltage level required by the motor drive and meet the minimum capacity within the working range, a series–parallel structure is adopted to form a battery pack [23].

Figure 2.
Rint model of a lithium battery.
- : Open circuit voltage;
- : Internal current;
- : Equivalent internal resistance;
- : External output power.
The SOCbat and Vbat can be calculated as follows [24]:
- : Initial SOC;
- : Battery capacity (Ah);
- : Number of battery cells in series.
The battery efficiency in the discharge state is determined based on the open-circuit voltage shown as follows:
Under the single driving condition of the composite power supply, all the required power of the vehicle is provided by the composite power. The battery cannot provide large instantaneous power, and mainly realizes the energy storage function. Usually, the initial value of the SOC is set between 0.5–0.8 to ensure the cell terminal voltage will not change much. The specification sheet of the battery is summarized in Table 1.

Table 1.
Main specifications of the battery.
2.5. Ultra-Capacitors Model
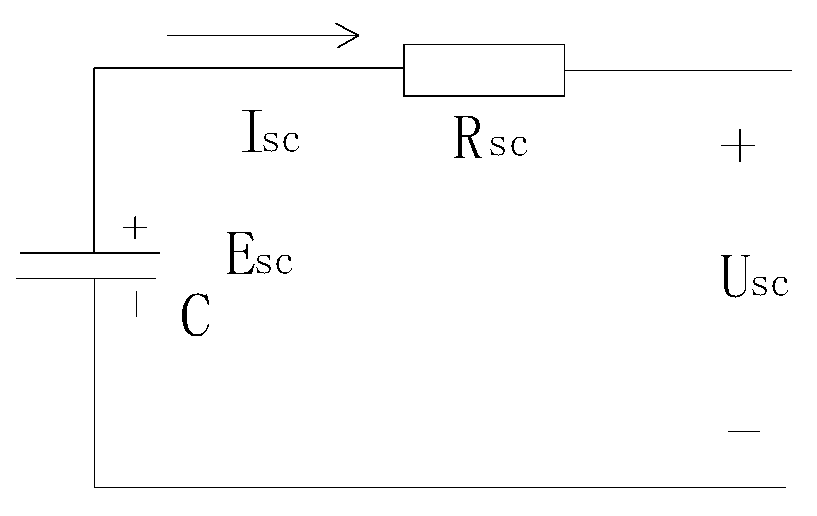
Compared with the high energy density of lithium batteries, ultra-capacitors have a high power density, low internal resistance, wide temperature operating range and excellent recyclability. Ultra-capacitors can maintain the original performance after millions of charging and discharging cycles. It plays a vital role in providing instant power, especially in terms of acceleration and regenerative braking, which can bear the peak power demand of vehicles [25]. The recovery of braking energy can alleviate the impact of high current return, protect the lithium battery and avoid shock to the components. The durability characteristics of the FCS and the charging and discharging level of ultra-capacitors should be considered when formulating control strategies. The equivalent circuit of ultra-capacitors is shown in Figure 3.
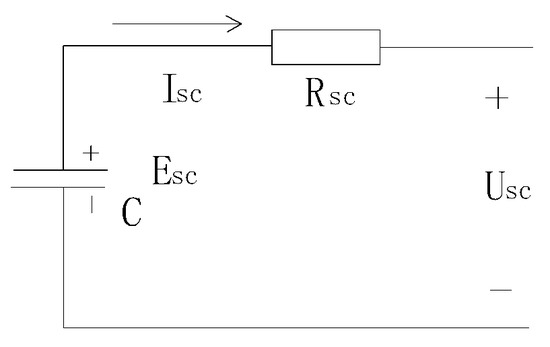
Figure 3.
Equivalent circuit of ultra-capacitors.
- : Stored energy;
- : Terminal voltage;
- : Internal current;
- : Internal resistance;
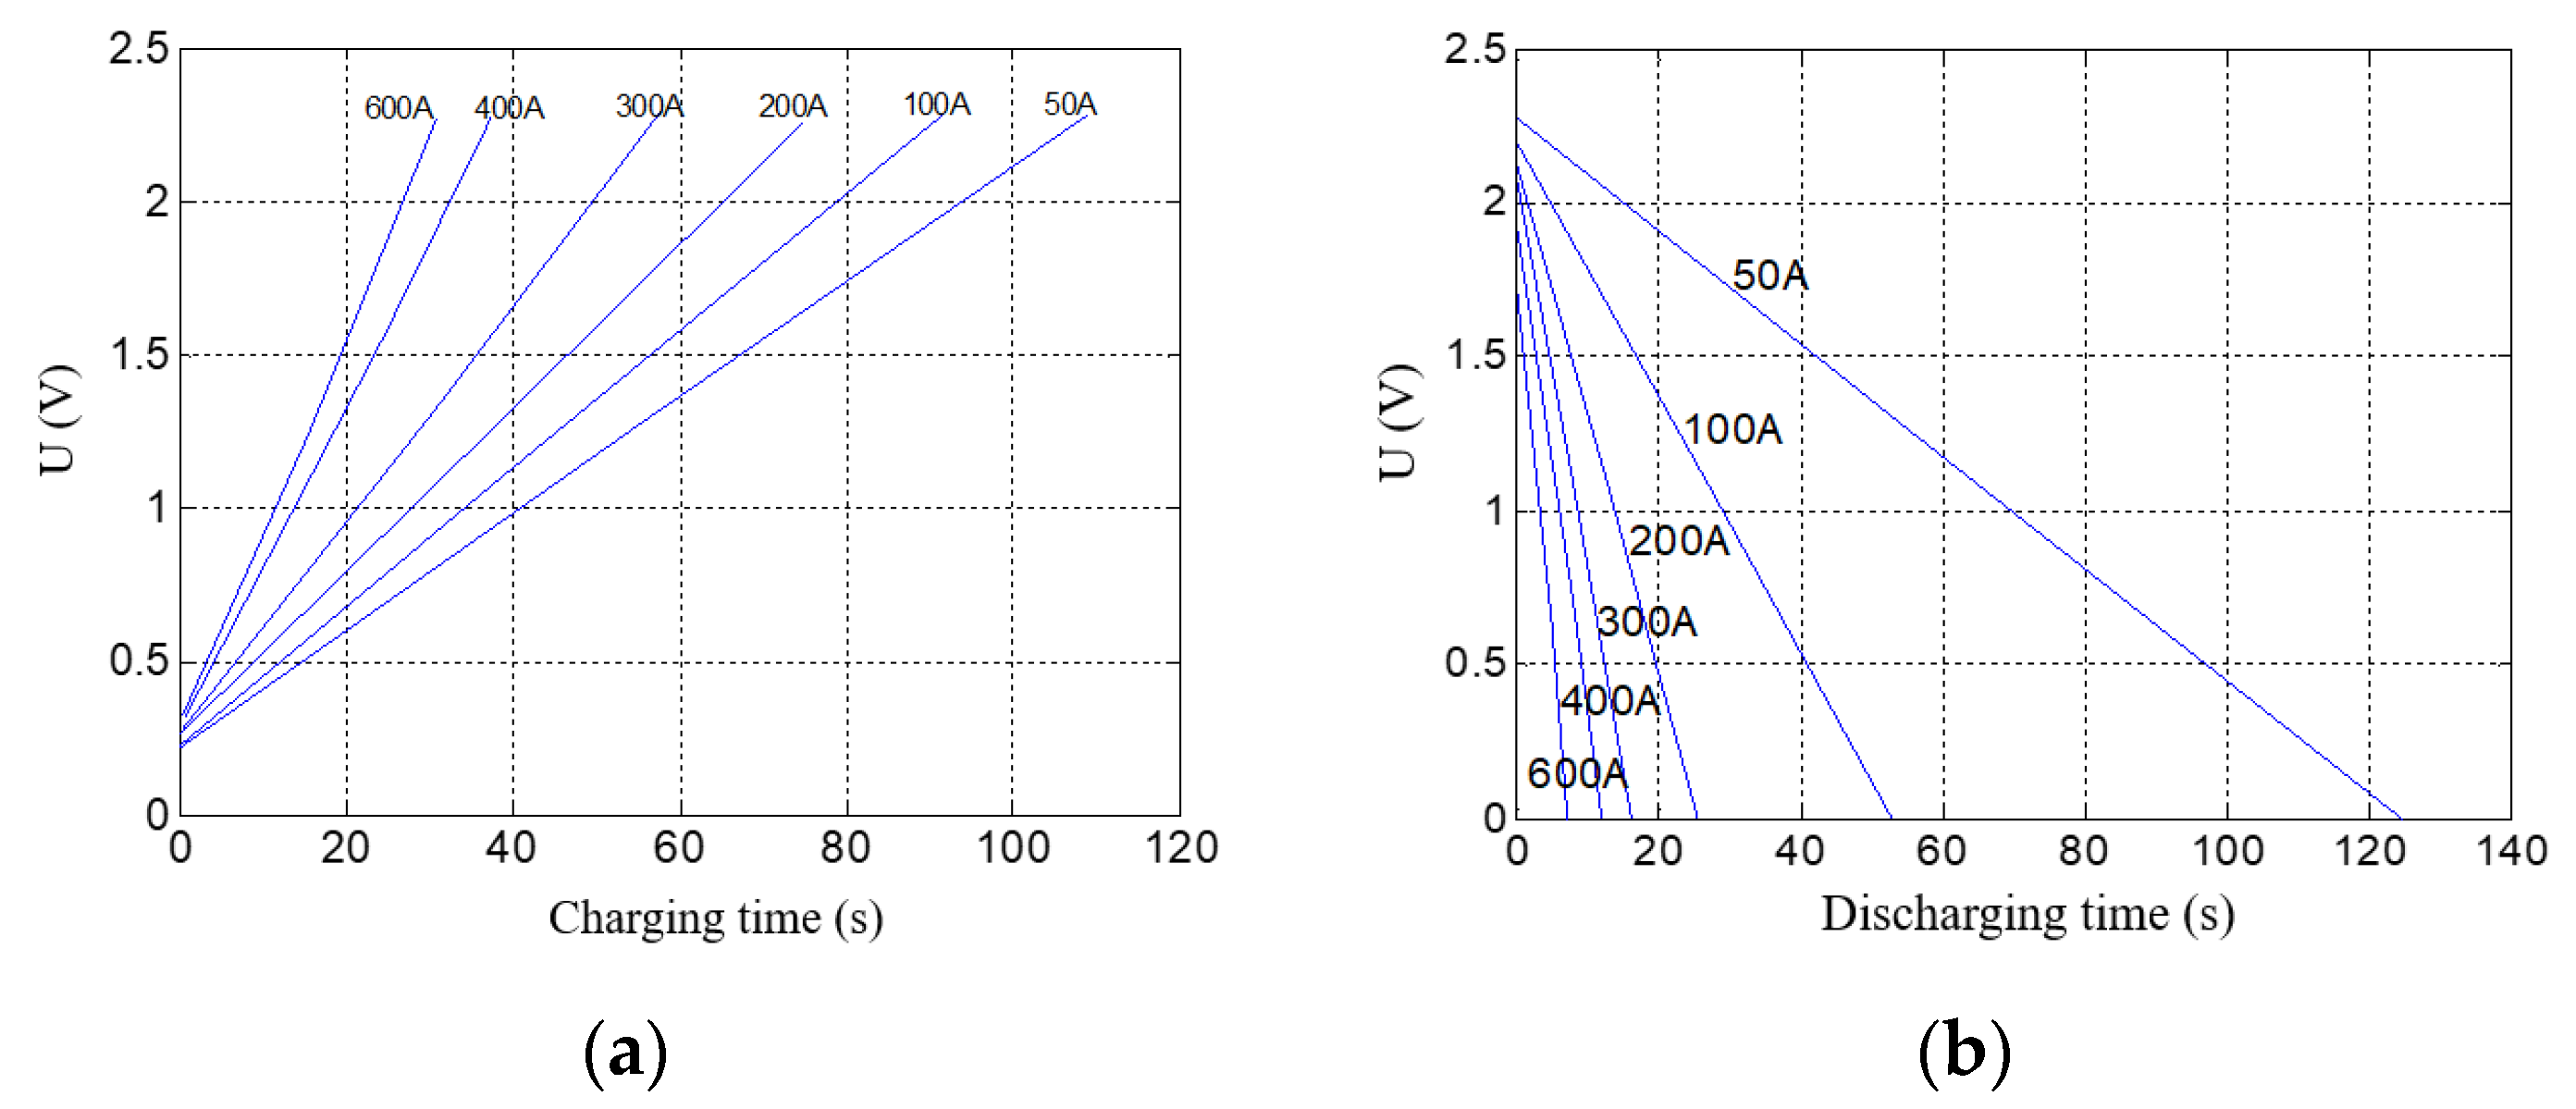
At a specific current value, the voltage value is directly proportional to the charging time; therefore, it can be judged that the efficiency of the battery is lower than that of the ultra-capacitors. As can be seen from Figure 4, with the increase in discharge current, the discharge speed decreases faster than the battery, and the discharge duration is also shortened; therefore, ultra-capacitors are more suitable as an auxiliary power supply. In the process of frequent starts, stops and accelerations of the vehicle, the ultra-capacitors are consumed rapidly, and the battery shall charge the ultra-capacitors. The specification sheet of the ultra-capacitors is summarized in Table 2.
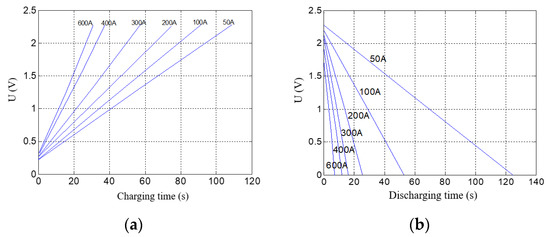
Figure 4.
Characteristic curves of ultra-capacitors (a) Charging characteristic curves (b) Discharging characteristic curves.
Table 2.
Main specifications of the ultra-capacitors.
2.6. Characteristic Analysis and Experiment of Air Compressor
In the auxiliary system, the energy consumption of the air compressor is relatively large, which can account for 30% of the total power of the FCS. The parameter that can directly reflect the efficiency of the air compressor, namely, the radius of the impeller, was selected as the optimization variable so that the compressor can meet the efficiency supply requirements while working in the high-efficiency area as much as possible. The normalized compressor flow rate can be expressed as follows [26]:
- : Mass flow;
- : Air density;
- : Diameter of the impeller;
- : Blade tip speed;
- : Rotating speed;
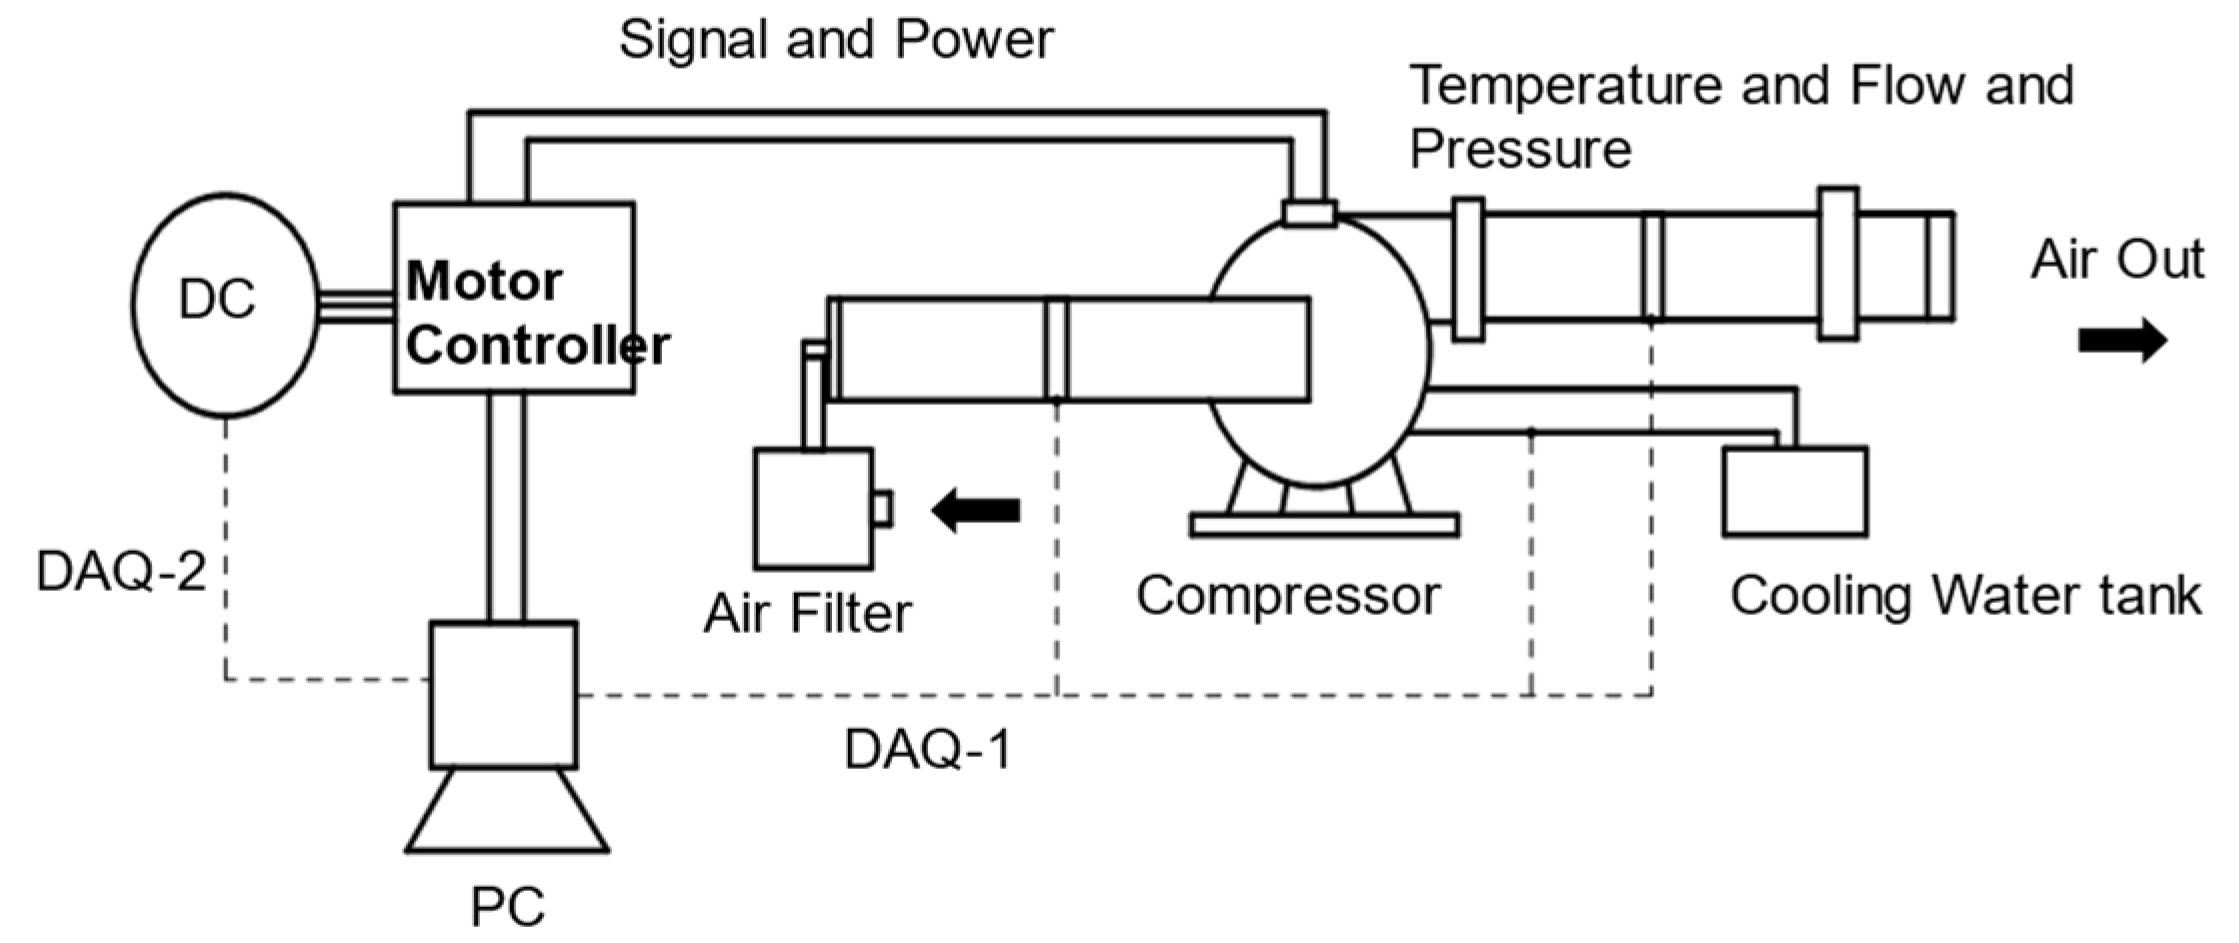
In order to comprehensively test the performance data of the air compressor and the working characteristics under different working conditions, a test bench was designed according to the characteristics and experimental requirements of the compressor, as shown in Figure 5. The test bench was equipped with a compressor, gas flow pipeline and cooling water flow pipeline. Flow sensors and other measuring instruments were installed at the inlet and outlet of each circuit to obtain the experimental parameters.
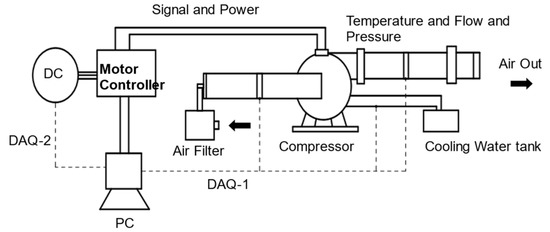
Figure 5.
Test bench for air compressor.
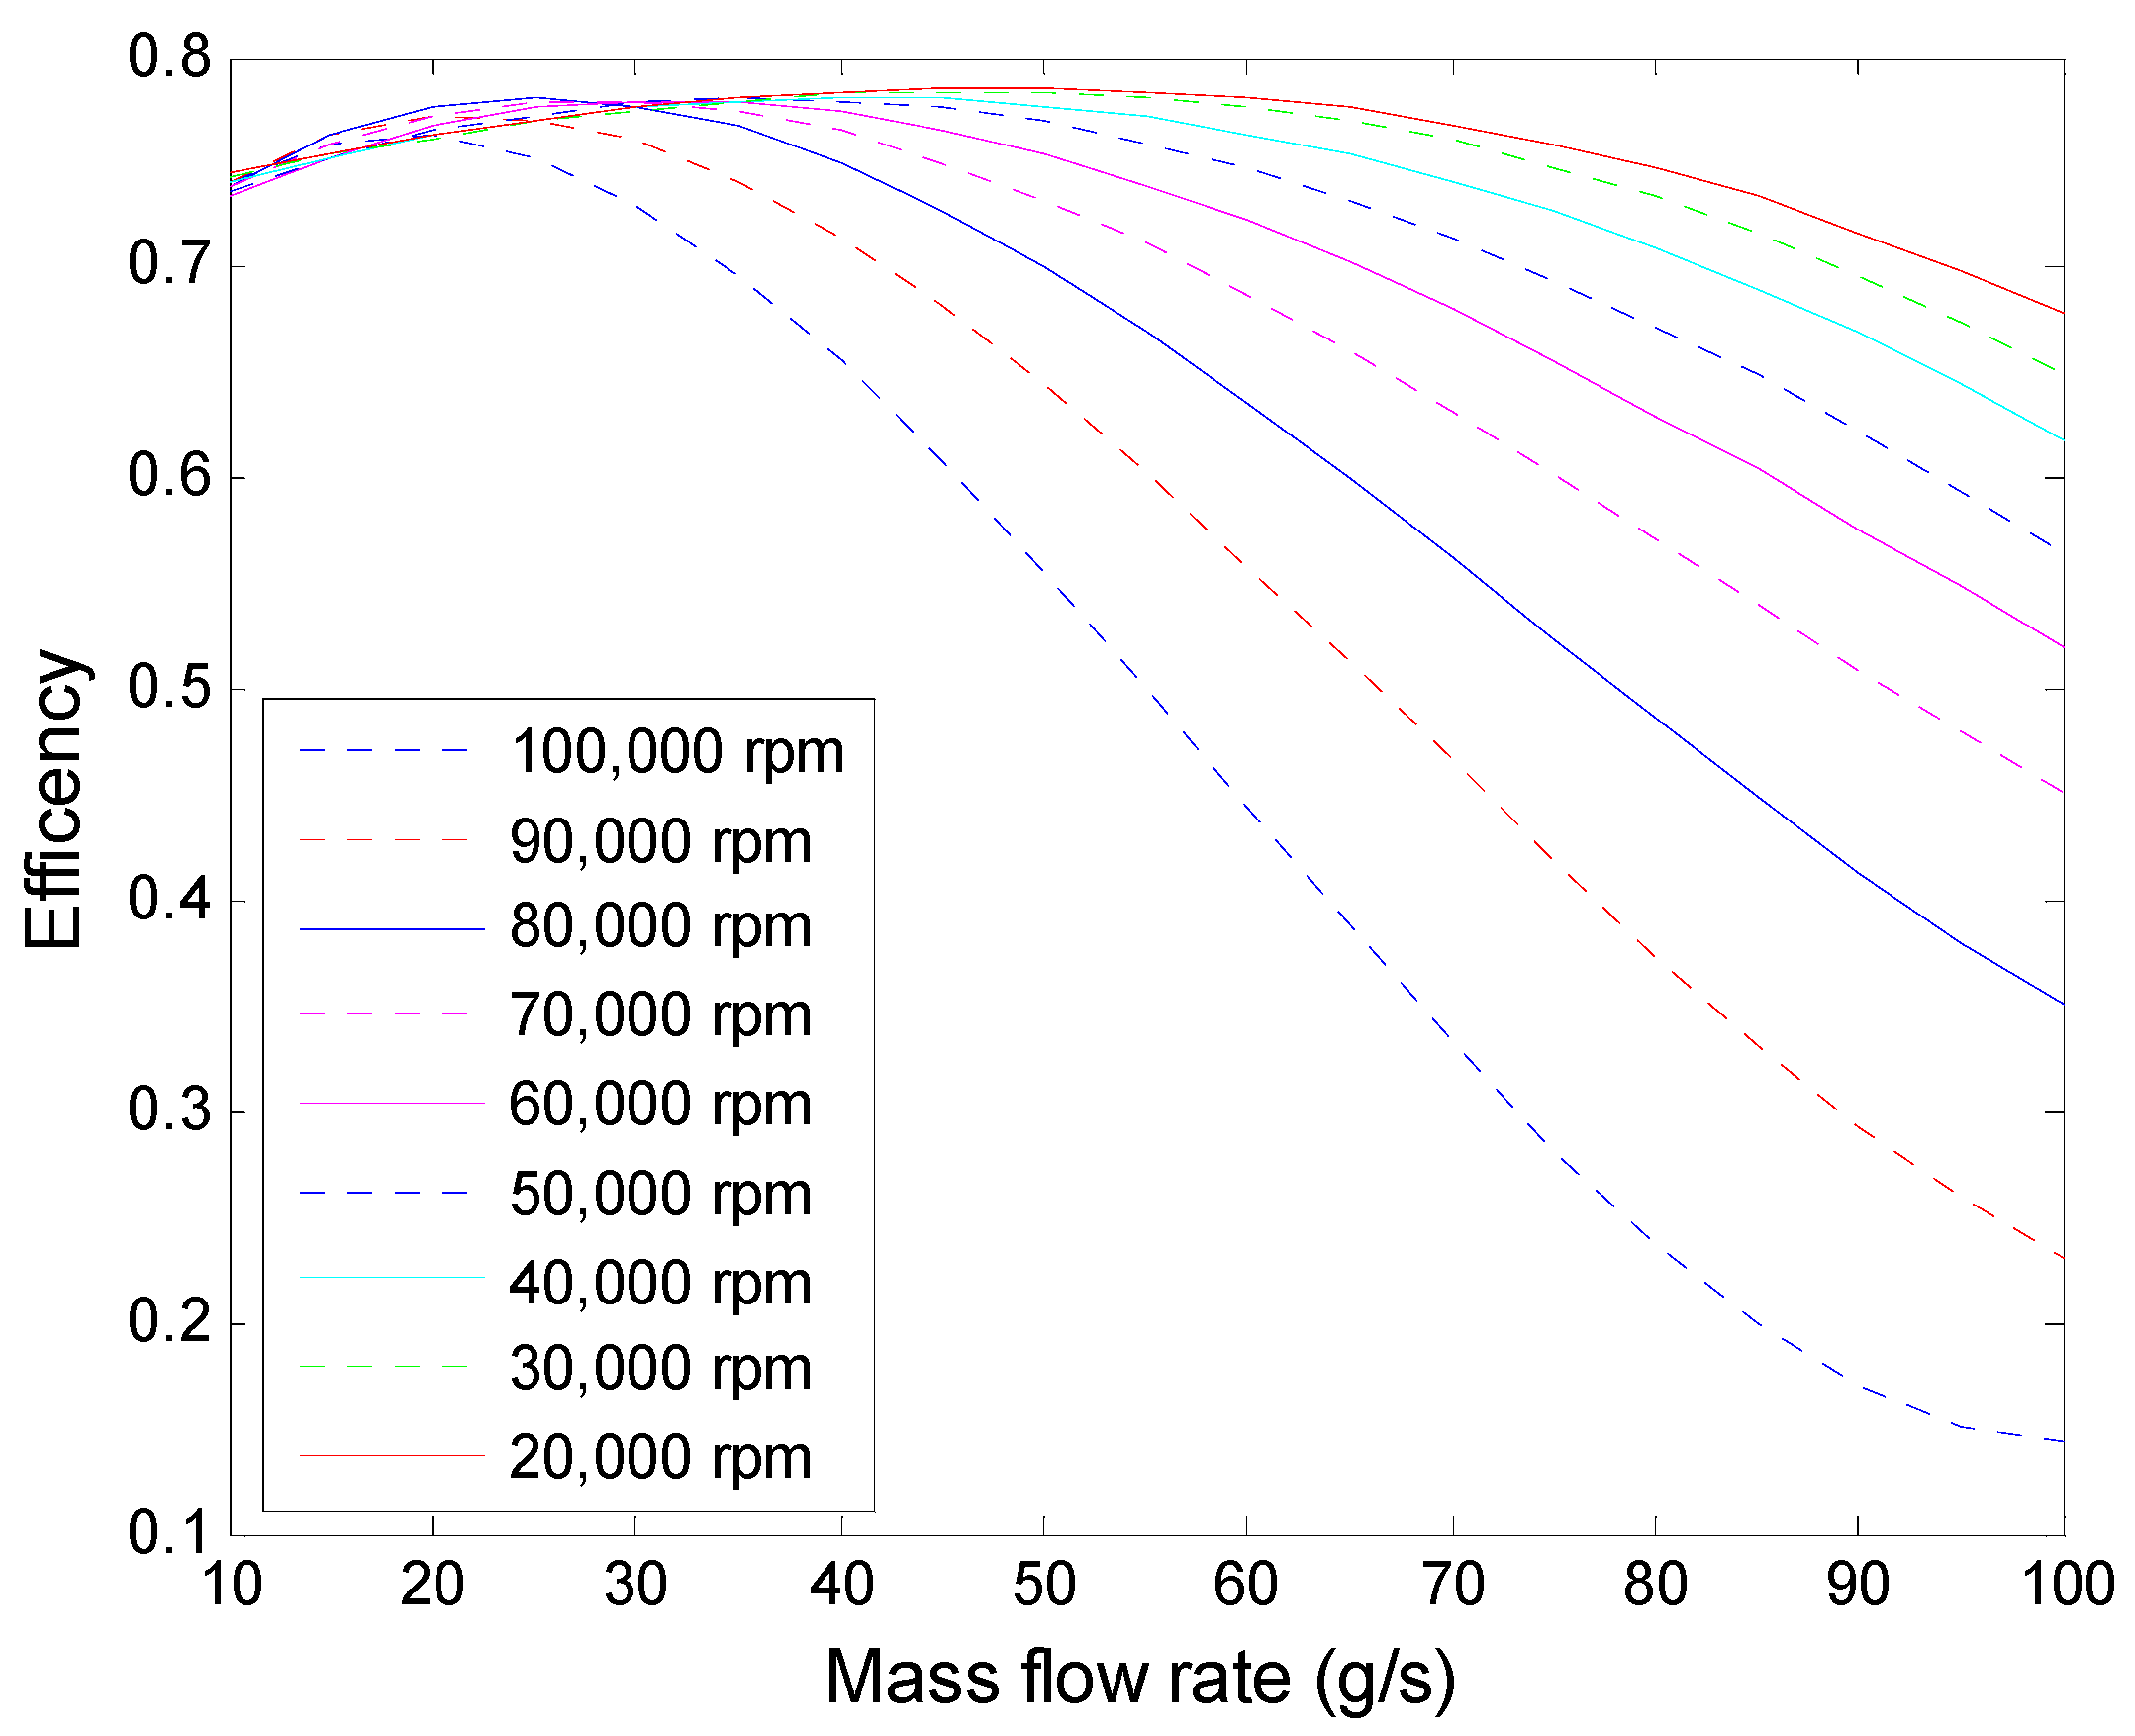
The air entering the compressor needed to be treated by muffler and filter. The pipeline in front of the inlet was equipped with a temperature sensor, pressure sensor and flowmeter. It entered the exhaust pipe after being pressurized by the compressor, and the temperature sensor, pressure sensor and flowmeter were installed at the outlet too. The changes in physical parameters before and after passing through the compressor were compared to analyze the performance of the compressor. Temperature sensors were installed at the inlet and outlet of the cooling water pipeline to monitor the cooling effect of the system. The power and speed information of the compressor could be obtained through the controller of the motor. The main body of the experimental bench had an aluminum alloy profile, which was simple, firm and reliable. Figure 6 shows the mass flow–efficiency curve of the compressor; the test speed was 20,000–100,000 r/min, the maximum efficiency at a particular speed was a nonlinear function of the mass flow and the trend in the low speed was more pronounced. Under large flow conditions, the higher the speed, the higher the efficiency.
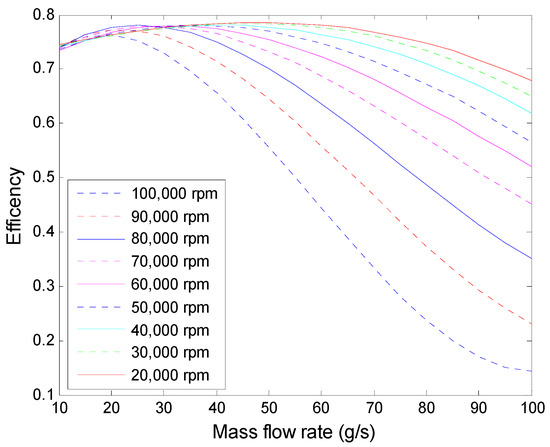
Figure 6.
Efficiency–flow curve of the air compressor.
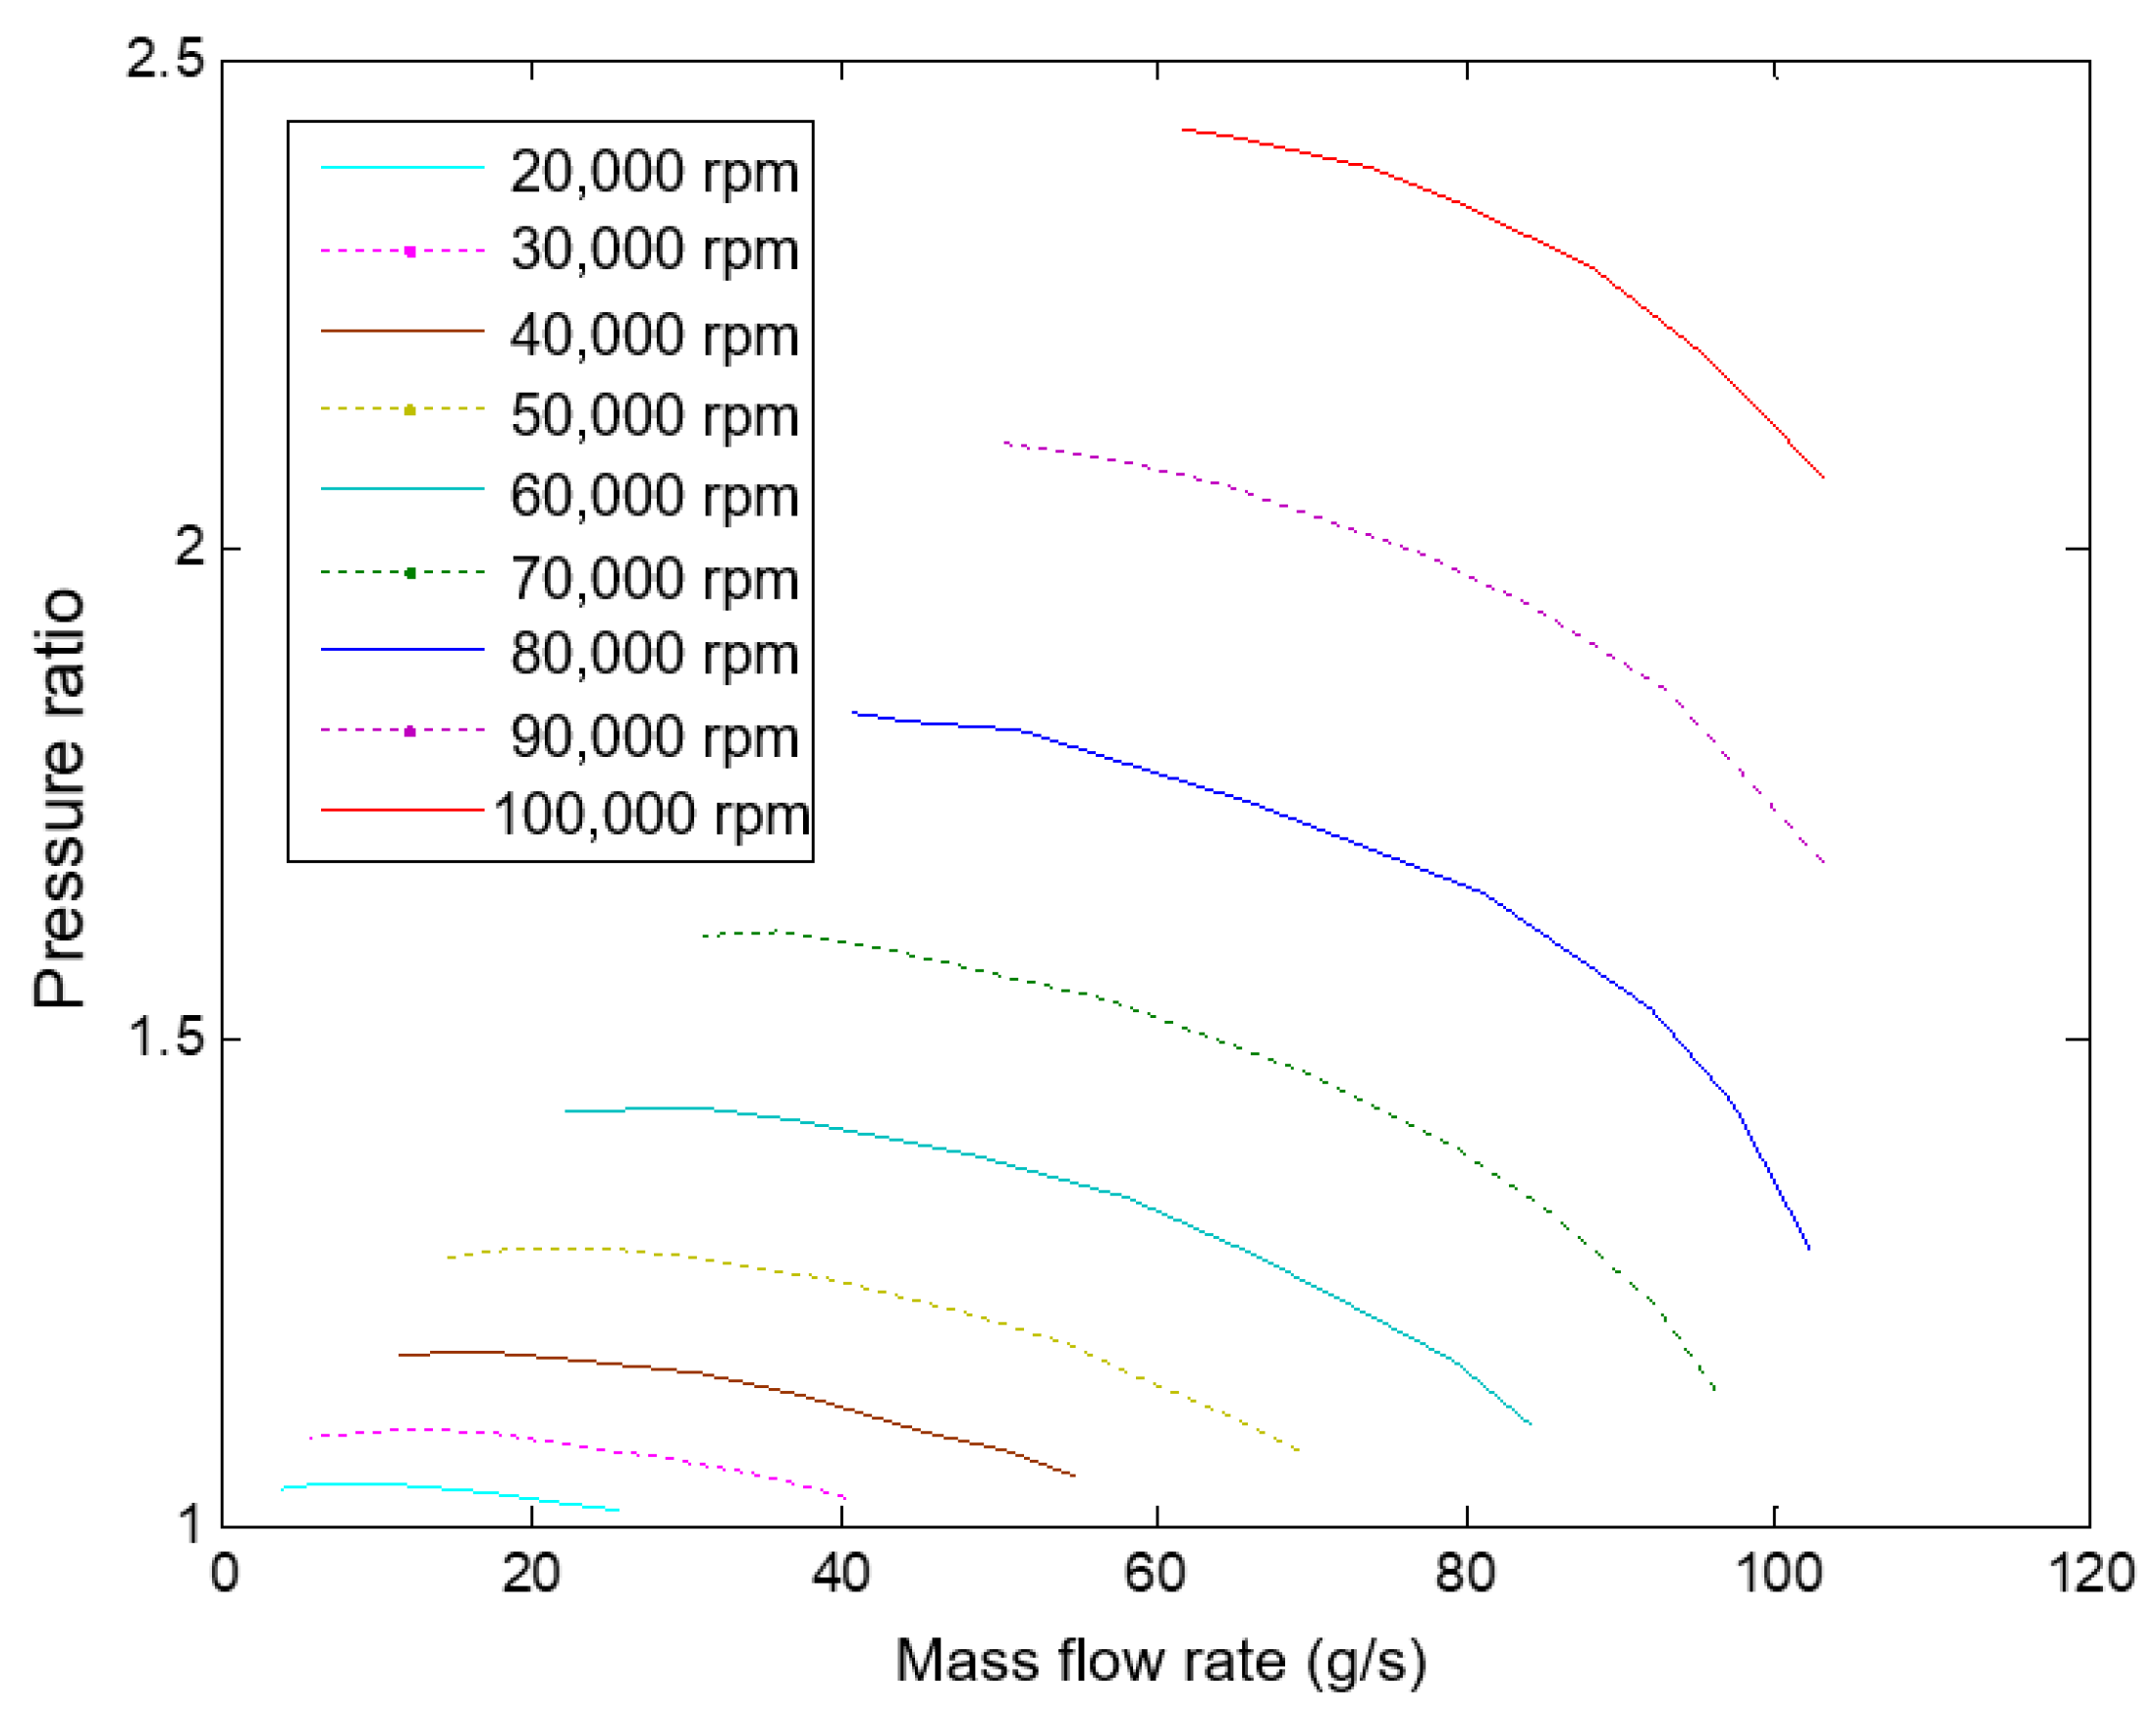
In Figure 7, it can be seen that there was a close relationship between the pressure and flow at a particular working speed, and a change in the outlet pressure could result in a large change in mass flow. The compressor could provide a larger gas mass flow, and the working speed was the main factor in determining pressure and flow. The left area of the characteristic curve is the surge area. At this boundary, the mass flow is small and the pressure ratio is too high, causing the gas to not be sucked in by the blades, which interrupts the exhaust. The operating point in this area has slight vibration and produces unreasonable noise. Running in this area for a long time will cause the compressor to accelerate and fail.
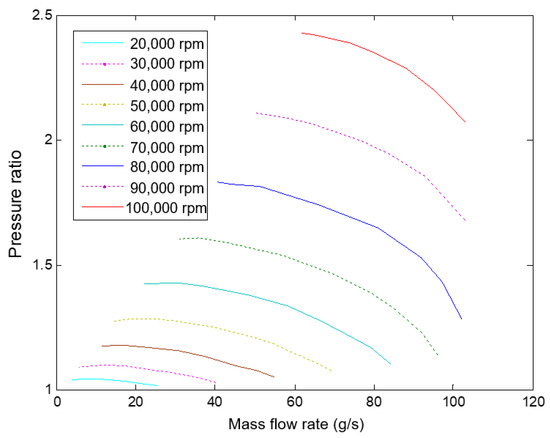
Figure 7.
Flow–pressure ratio curve of the air compressor.
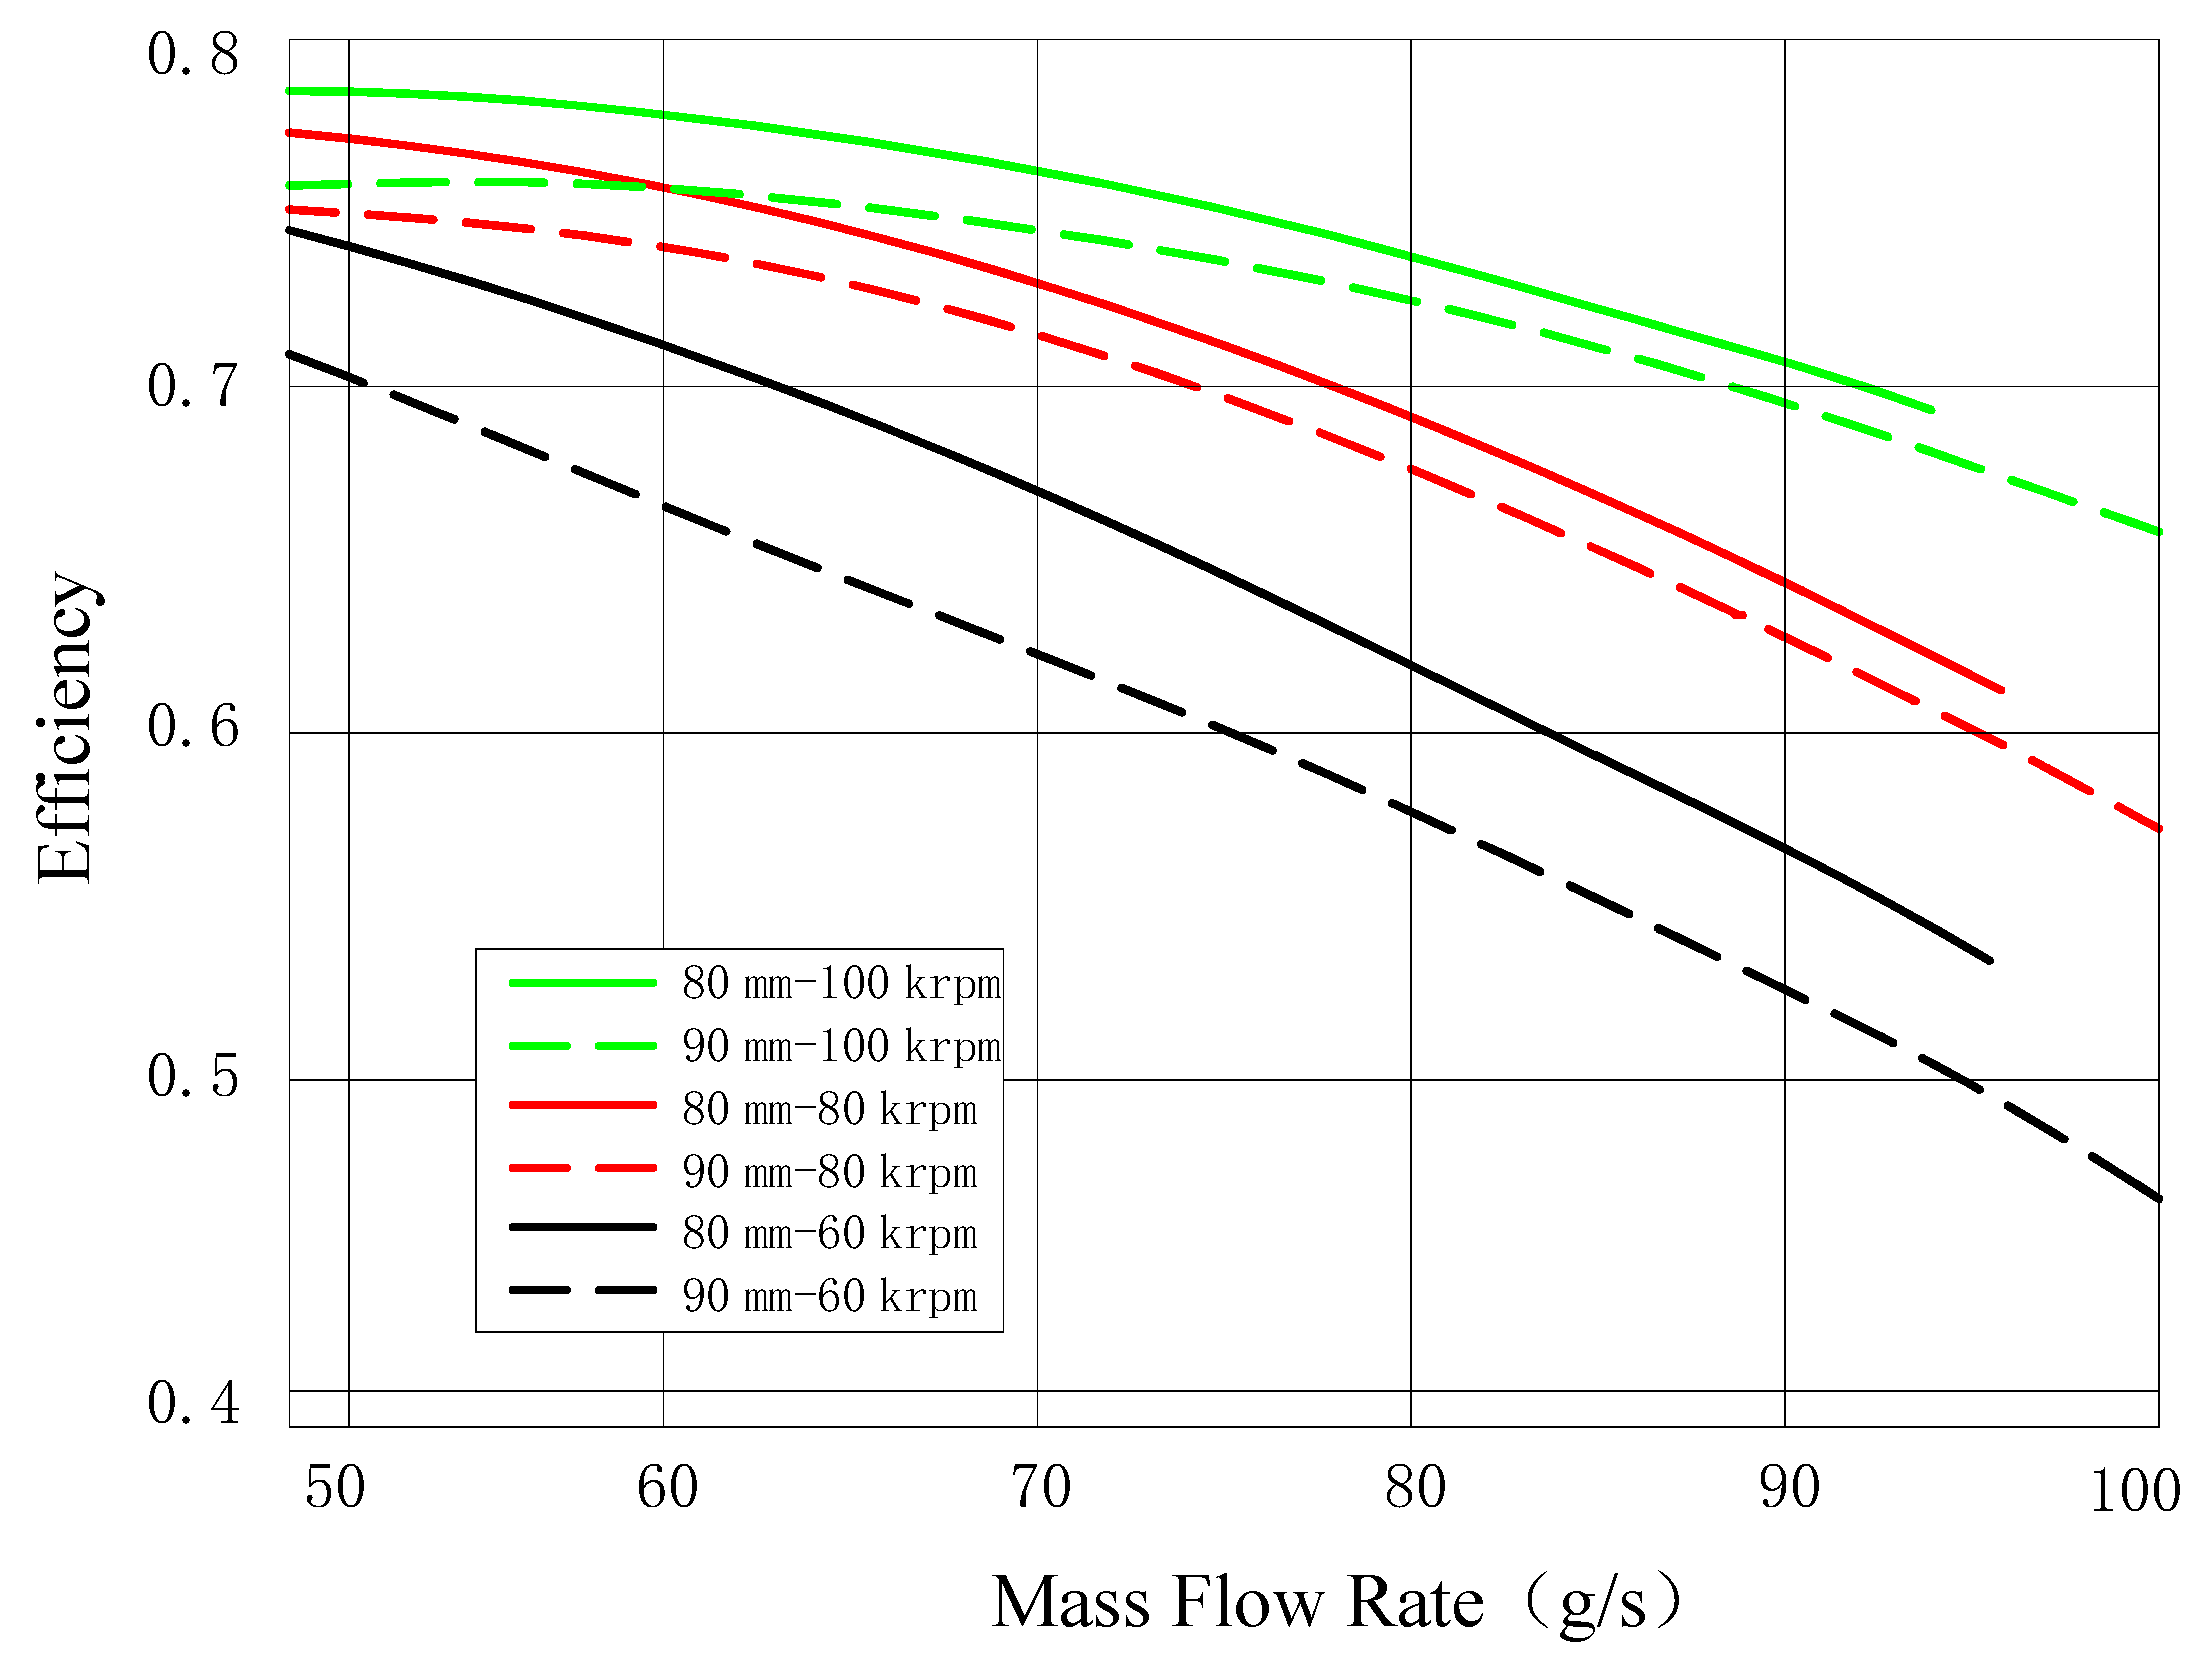
The was changed to test the relationship between the mass flow and efficiency at different speeds. It can be seen from the experimental results in Figure 8 that the mass flow range of the larger air compressor was larger than the mass flow range of the small compressor. Low speed had a larger working mass flow range than high speed. The friction loss under a high mass flow rate was low, and the efficiency was high. At the same time, the instability increased under a low mass flow rate and the efficiency was low. A smaller had a lower mass flow rate and could reach a higher peak efficiency. A larger had a greater efficiency loss in the low flow range, but has a larger flow range, thereby achieving a larger power.
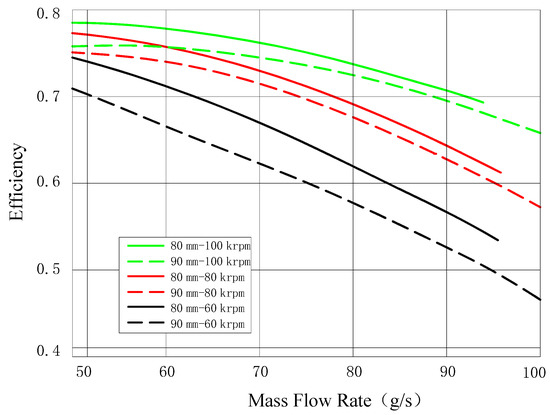
Figure 8.
Relationship between the DC and air compressor efficiency.
2.7. Drive Cycle
The urban road cycle Urban Dynameter Driving Schedule (UDDS) proposed by the U.S. Environmental Protection Agency is one of the typical driving conditions that can be used to evaluate the dynamic performance of the vehicle and the changes of other vehicle parameters. This driving condition has many starting and stopping times, which is in line with the driving conditions of the city and can make full use of the regenerative braking function of the electric vehicle to accurately reflect the changes in various parameters of the electric vehicle. Specific characteristics of the UDDS cycle are shown in Table 3.
Table 3.
Specific characteristics of the UDDS cycle.
2.8. Vehicle Performance
We evaluated the dynamic performance, fuel economy, vehicle durability and safety from the following indicators: maximum speed, acceleration time from zero acceleration to a certain speed and mileage under specific conditions.
2.8.1. Maximum Speed
The following forces must be overcome during the driving of the vehicle: rolling resistance, air resistance, gradient resistance and acceleration resistance. The dynamic equation of the vehicle can be written as follows:
- m: Weight (including energy management system components);
- f: Rolling resistance coefficient;
- u: Speed;
- : Climbing angle;
- CD: Drag coefficient;
- A: Frontal area;
- : Air density;
- : Motor inverter input power;
- : Transmission system efficiency;
- : Battery drive efficiency;
- : Accessory power;
- : FCS output power;
- : Converter efficiency;
- : Battery output power;
- : Ultra-capacitors output power;
2.8.2. Acceleration Time
The acceleration time indicates the acceleration capacity, which has a great impact on the average driving speed. It is usually expressed using the acceleration time from starting in place. It refers to the time required for the vehicle to reach a predetermined speed or distance from starting. Overtaking acceleration time refers to the time required to fully accelerate to a higher speed at a lower speed. Generally, the time required for 0–100 km/h is used to indicate the acceleration capacity.
- : Traction;
- : Maximum torque output by the energy management system;
- : Tire rolling radius;
- : Maximum torque of motor external characteristic curve;
- : Sampling interval;
- : Rotating speed;
- : Acceleration time;
- : Discrete time matrix;
- : Maximum input power of the motor inverter.
2.8.3. Mileage
The mileage of the vehicle is determined by the fuel consumption, road conditions and energy management strategies. The simulation was performed under the assumption of a flat road at 60 km/h at a constant speed. The power demand was relatively stable. At this time, the FCS and battery were the energy sources.
- : Output energy of the fuel cell system;
- : Efficiency of the DC converter;
- : Energy consumed by the accessorial components of the vehicle;
- : Hydrogen mass;
- LHV: Low heat value of hydrogen;
- : Net efficiency of the fuel cell system.
- : Driving distance.
3. Wavelet-Fuzzy Logic Energy Management System
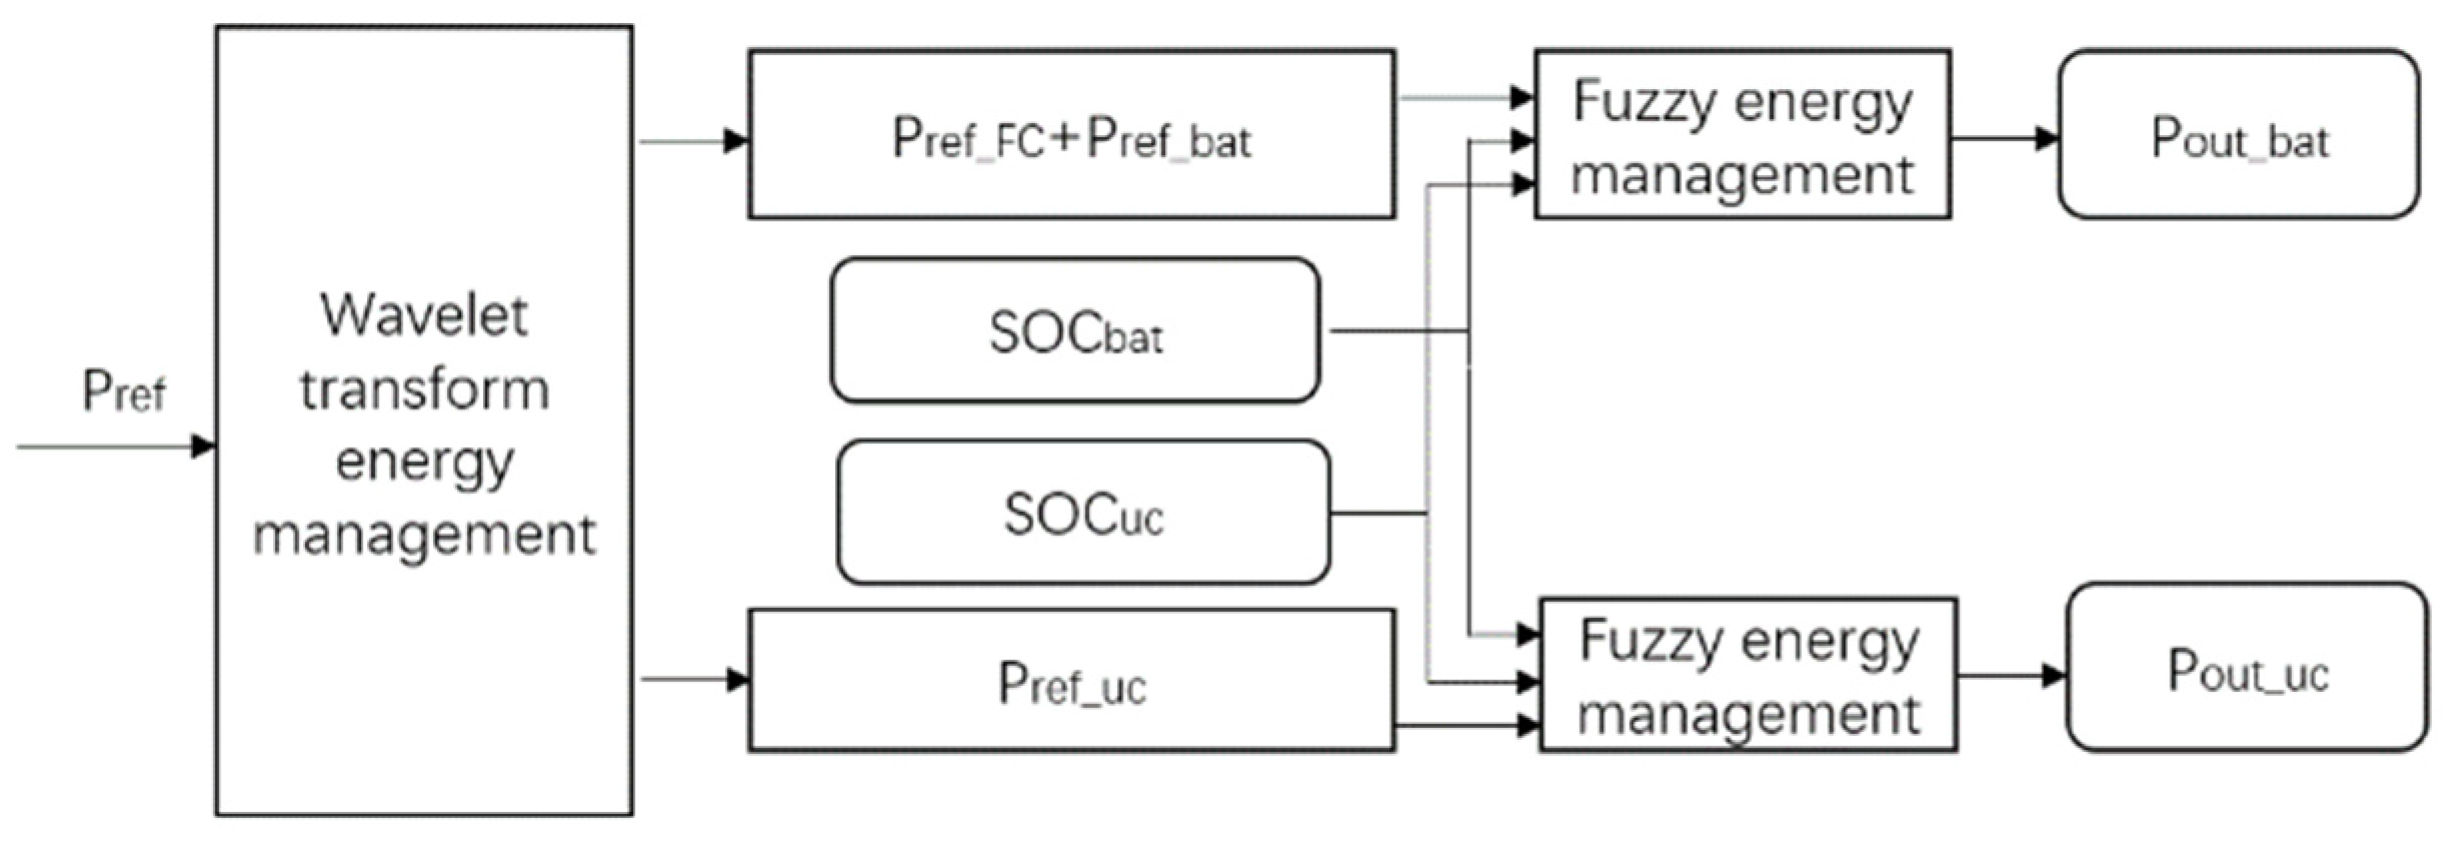
In a multi-energy source system, each energy source has its own efficiency range and charging and discharging characteristics. It is difficult for a single energy management strategy to give full play to the advantages of the multi-energy system. The most ideal solution is to design reasonable power requirements for different energy sources to improve system efficiency. The purpose of an energy management strategy is to control each energy source to make it work at a suitable working point, exploiting the strengths of each energy source. Therefore, only considering the distribution of the load cannot solve this problem [27]. The principle diagram of energy control strategy based on Wavelet-fuzzy is shown in Figure 9.
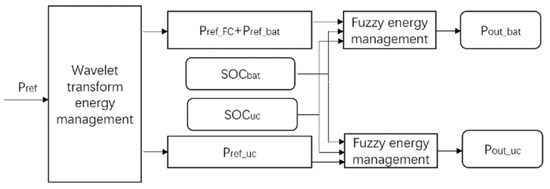
Figure 9.
Wavelet-fuzzy energy management strategy.
Wavelet transforms show excellent performance in transient analysis, where they can analyze the basic power requirements from a given transient signal. After filtering the total power demand signal, it is decomposed into high-frequency and low-frequency components. The low-frequency signal is distributed to the FCS and battery, and the high-frequency transient signal is distributed to the ultra-capacitors. However, each energy source has different dynamic characteristics and charge–discharge performances, and only the wavelet transform cantake into account various factors, especially the SOC value of lithium batteries and ultra-capacitors. The power output value of each energy source is directly related to the SOC value. When both the battery and the ultra-capacitors have sufficient power, the output power of the FCS should be reduced. Conversely, if the power of the battery and the ultra-capacitors is insufficient, the FCS should provide more power; therefore, the power should be shunted by combining the SOC value of the battery and the ultra-capacitors to improve the fuel economy of the system. Therefore, a series strategy of a wavelet transform and fuzzy control was adopted to formulate reasonable fuzzy rules to give full play to the advantages of each energy source [28,29].
3.1. Energy Split Based on a Wavelet Transform
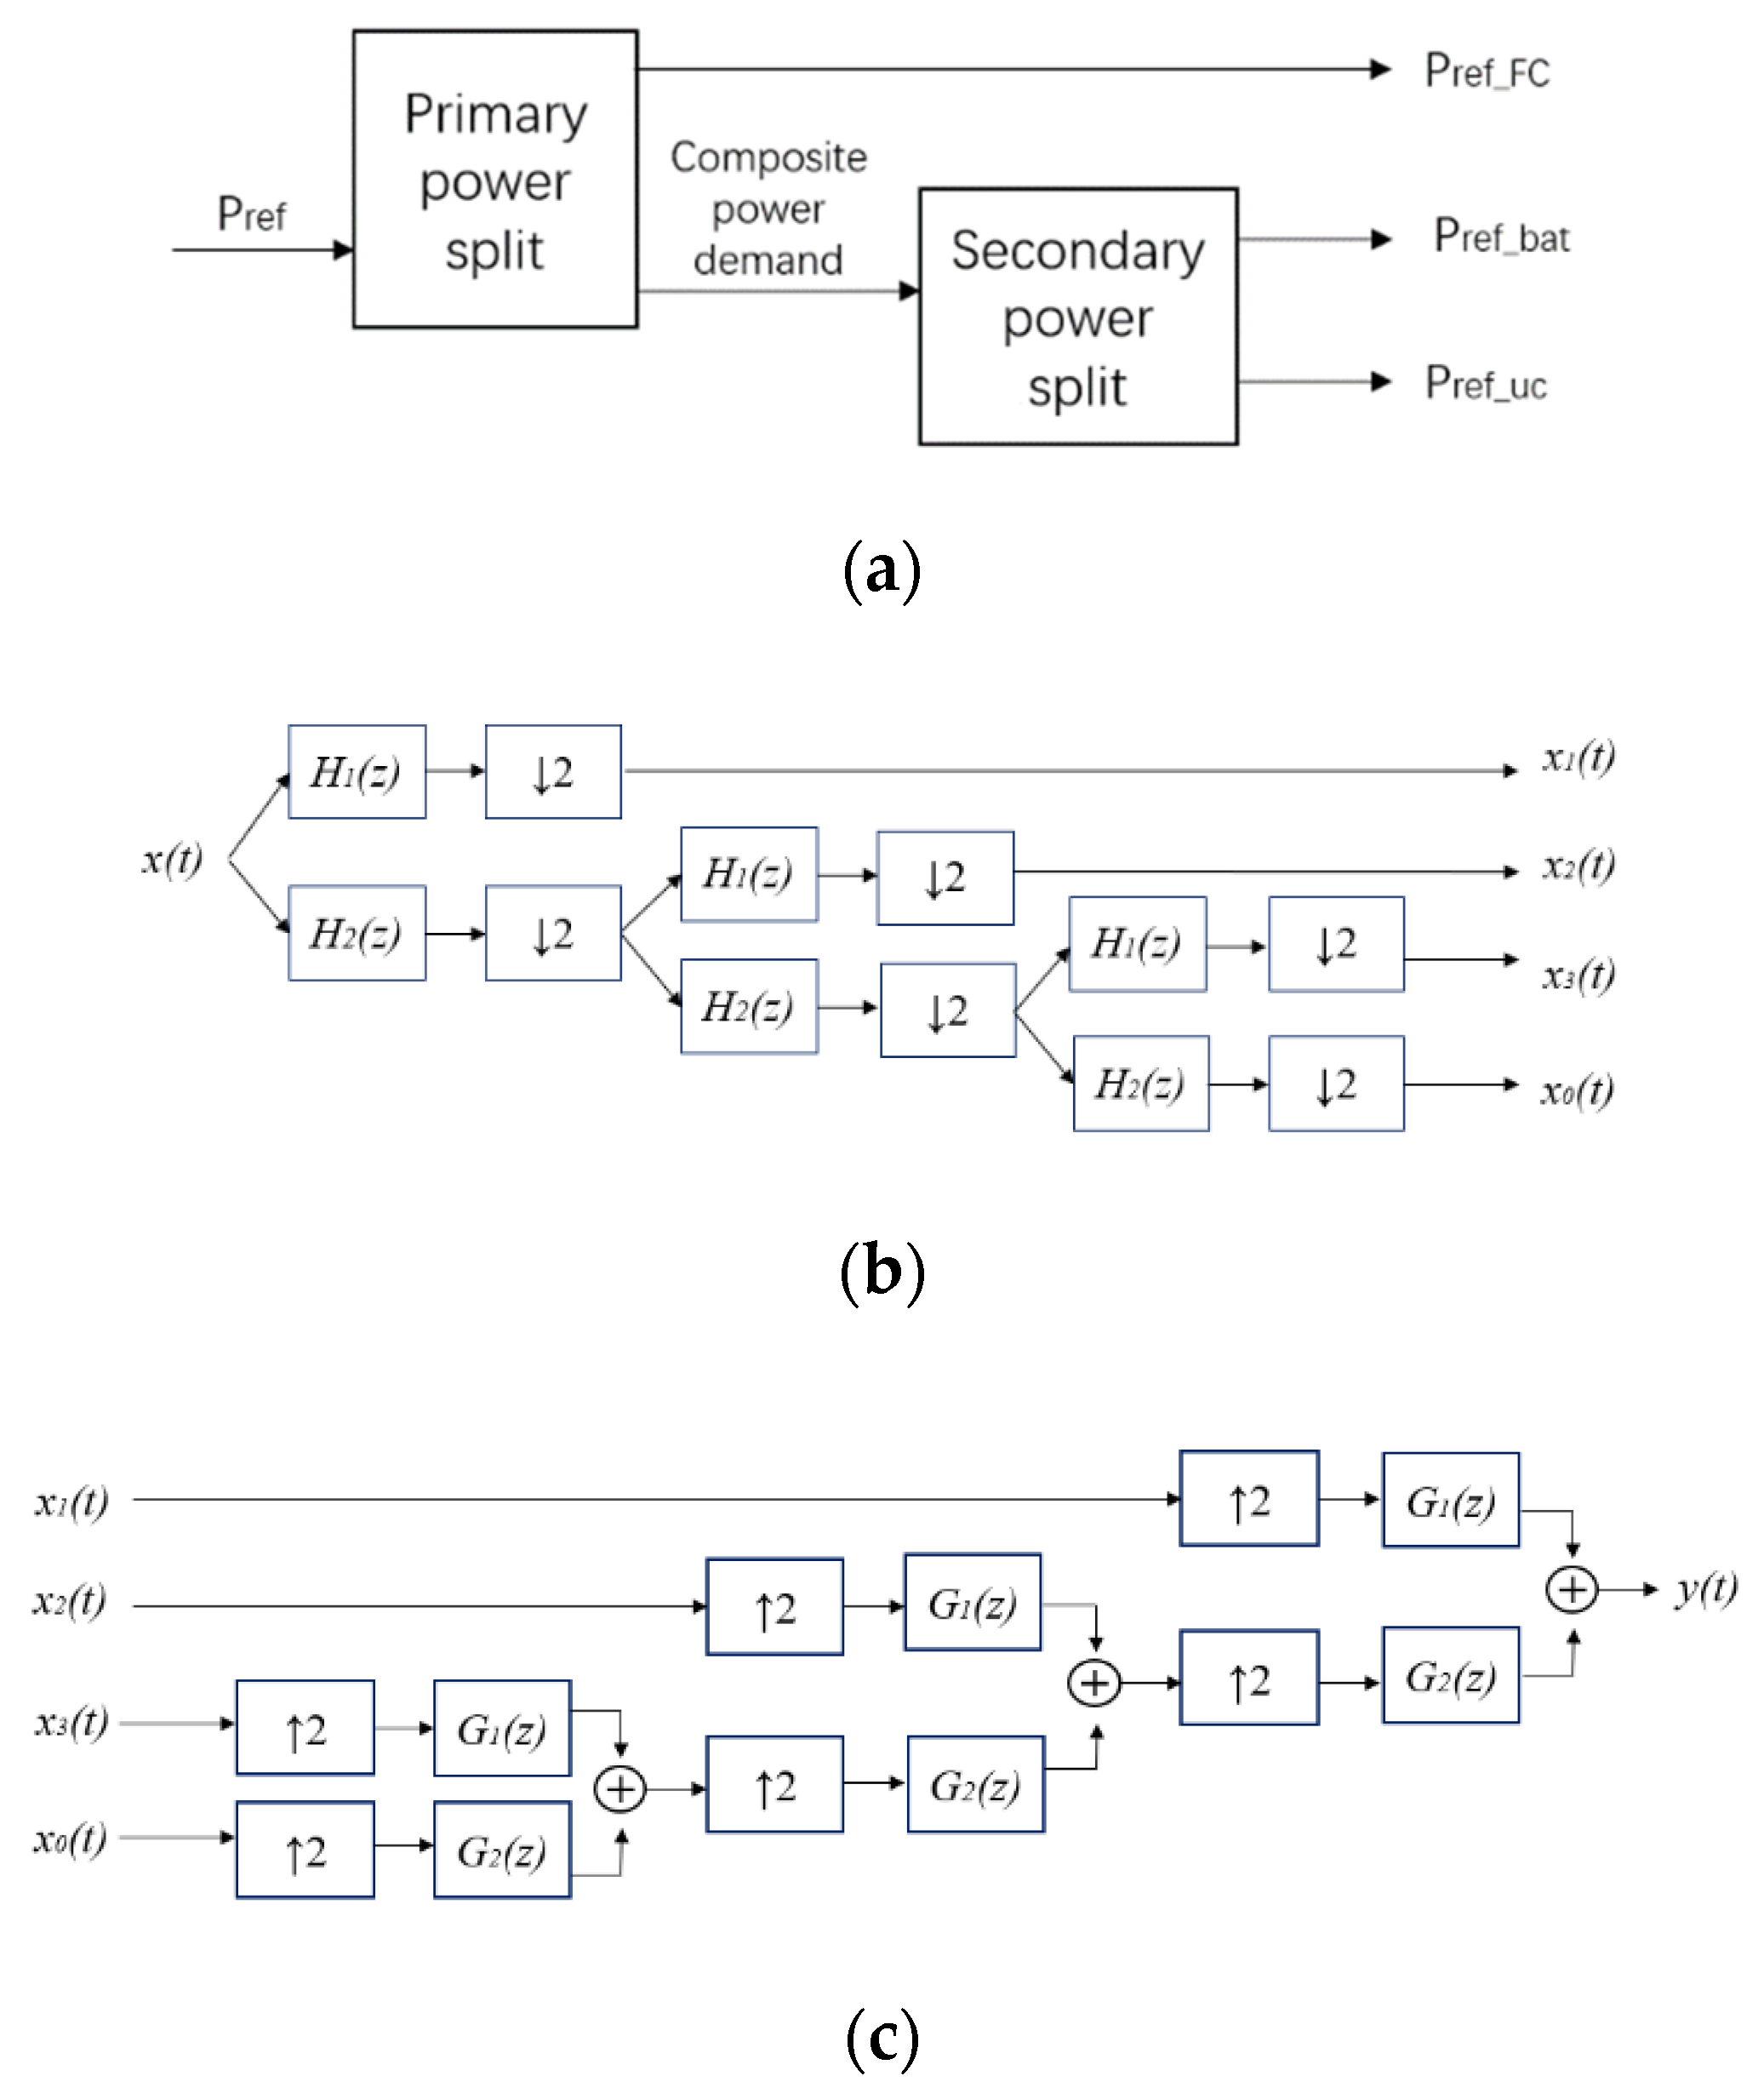
The original signal of a wavelet transform is the total required power. It is decomposed and reconstructed according to the Haar wavelet transform to obtain a high-frequency part and a low-frequency part. The low-frequency part is the reference signal and the high-frequency part is the detailed signal. In the two-level decomposition, the low-frequency signal of the previous level continues to pass the Haar wavelet transform, and finally, the low-frequency signal obtained after the two-level decomposition is subjected to the three-level Haar wavelet transform, as shown in Figure 10. H1(Z) is a high-pass filter and H2(Z) is a low-pass filter. In the decomposed signal, x0(t) is a low-frequency signal; x1(t), x2(t) and x3(t) are high-frequency signals, where the sum of the three high-frequency signals is output as the required power of the ultra-capacitors; and x0(t) is the sum of the required power of the FCS and the battery, where the two are distributed in a certain proportion. The FCS cannot recover energy, and the negative part of x0(t) is allocated to the battery for energy recovery. After the decomposition is completed, the inverse process signal reconstruction is completed through a reconstruction filter.
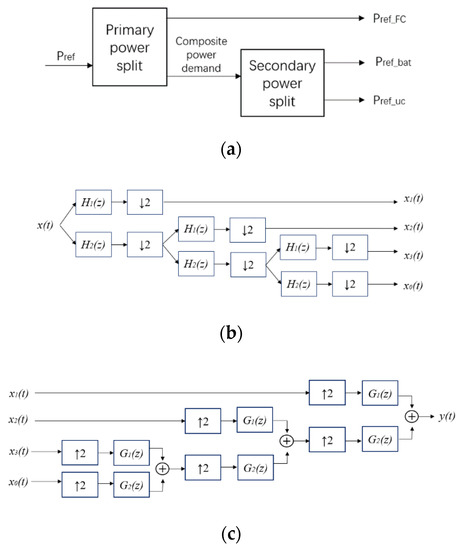
Figure 10.
Energy split of a three-level wavelet transform: (a) demand power decomposition (b) Haar wavelet decomposition (c) Haar wavelet reconstruction.
The power in the low-frequency signal was allocated to the fuel cell and the battery in set proportions, where 60% was allocated to the FCS and 40% was allocated to the battery. The specific distribution method was as follows:
According to the aforementioned power signal decomposition method, the required power of the FCS, the battery and the ultra-capacitors were obtained [30].
3.2. Fuzzy Logic Energy Management System
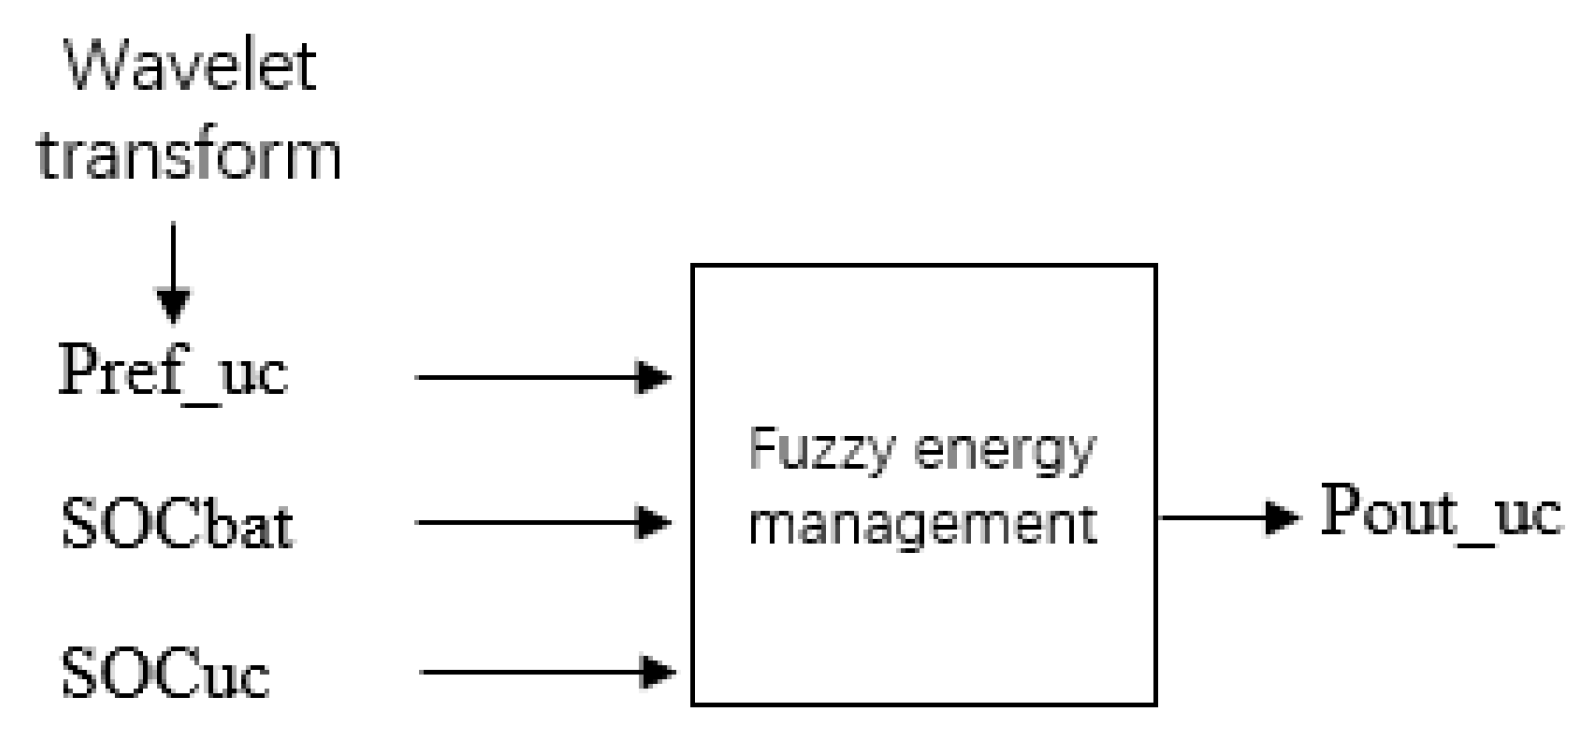
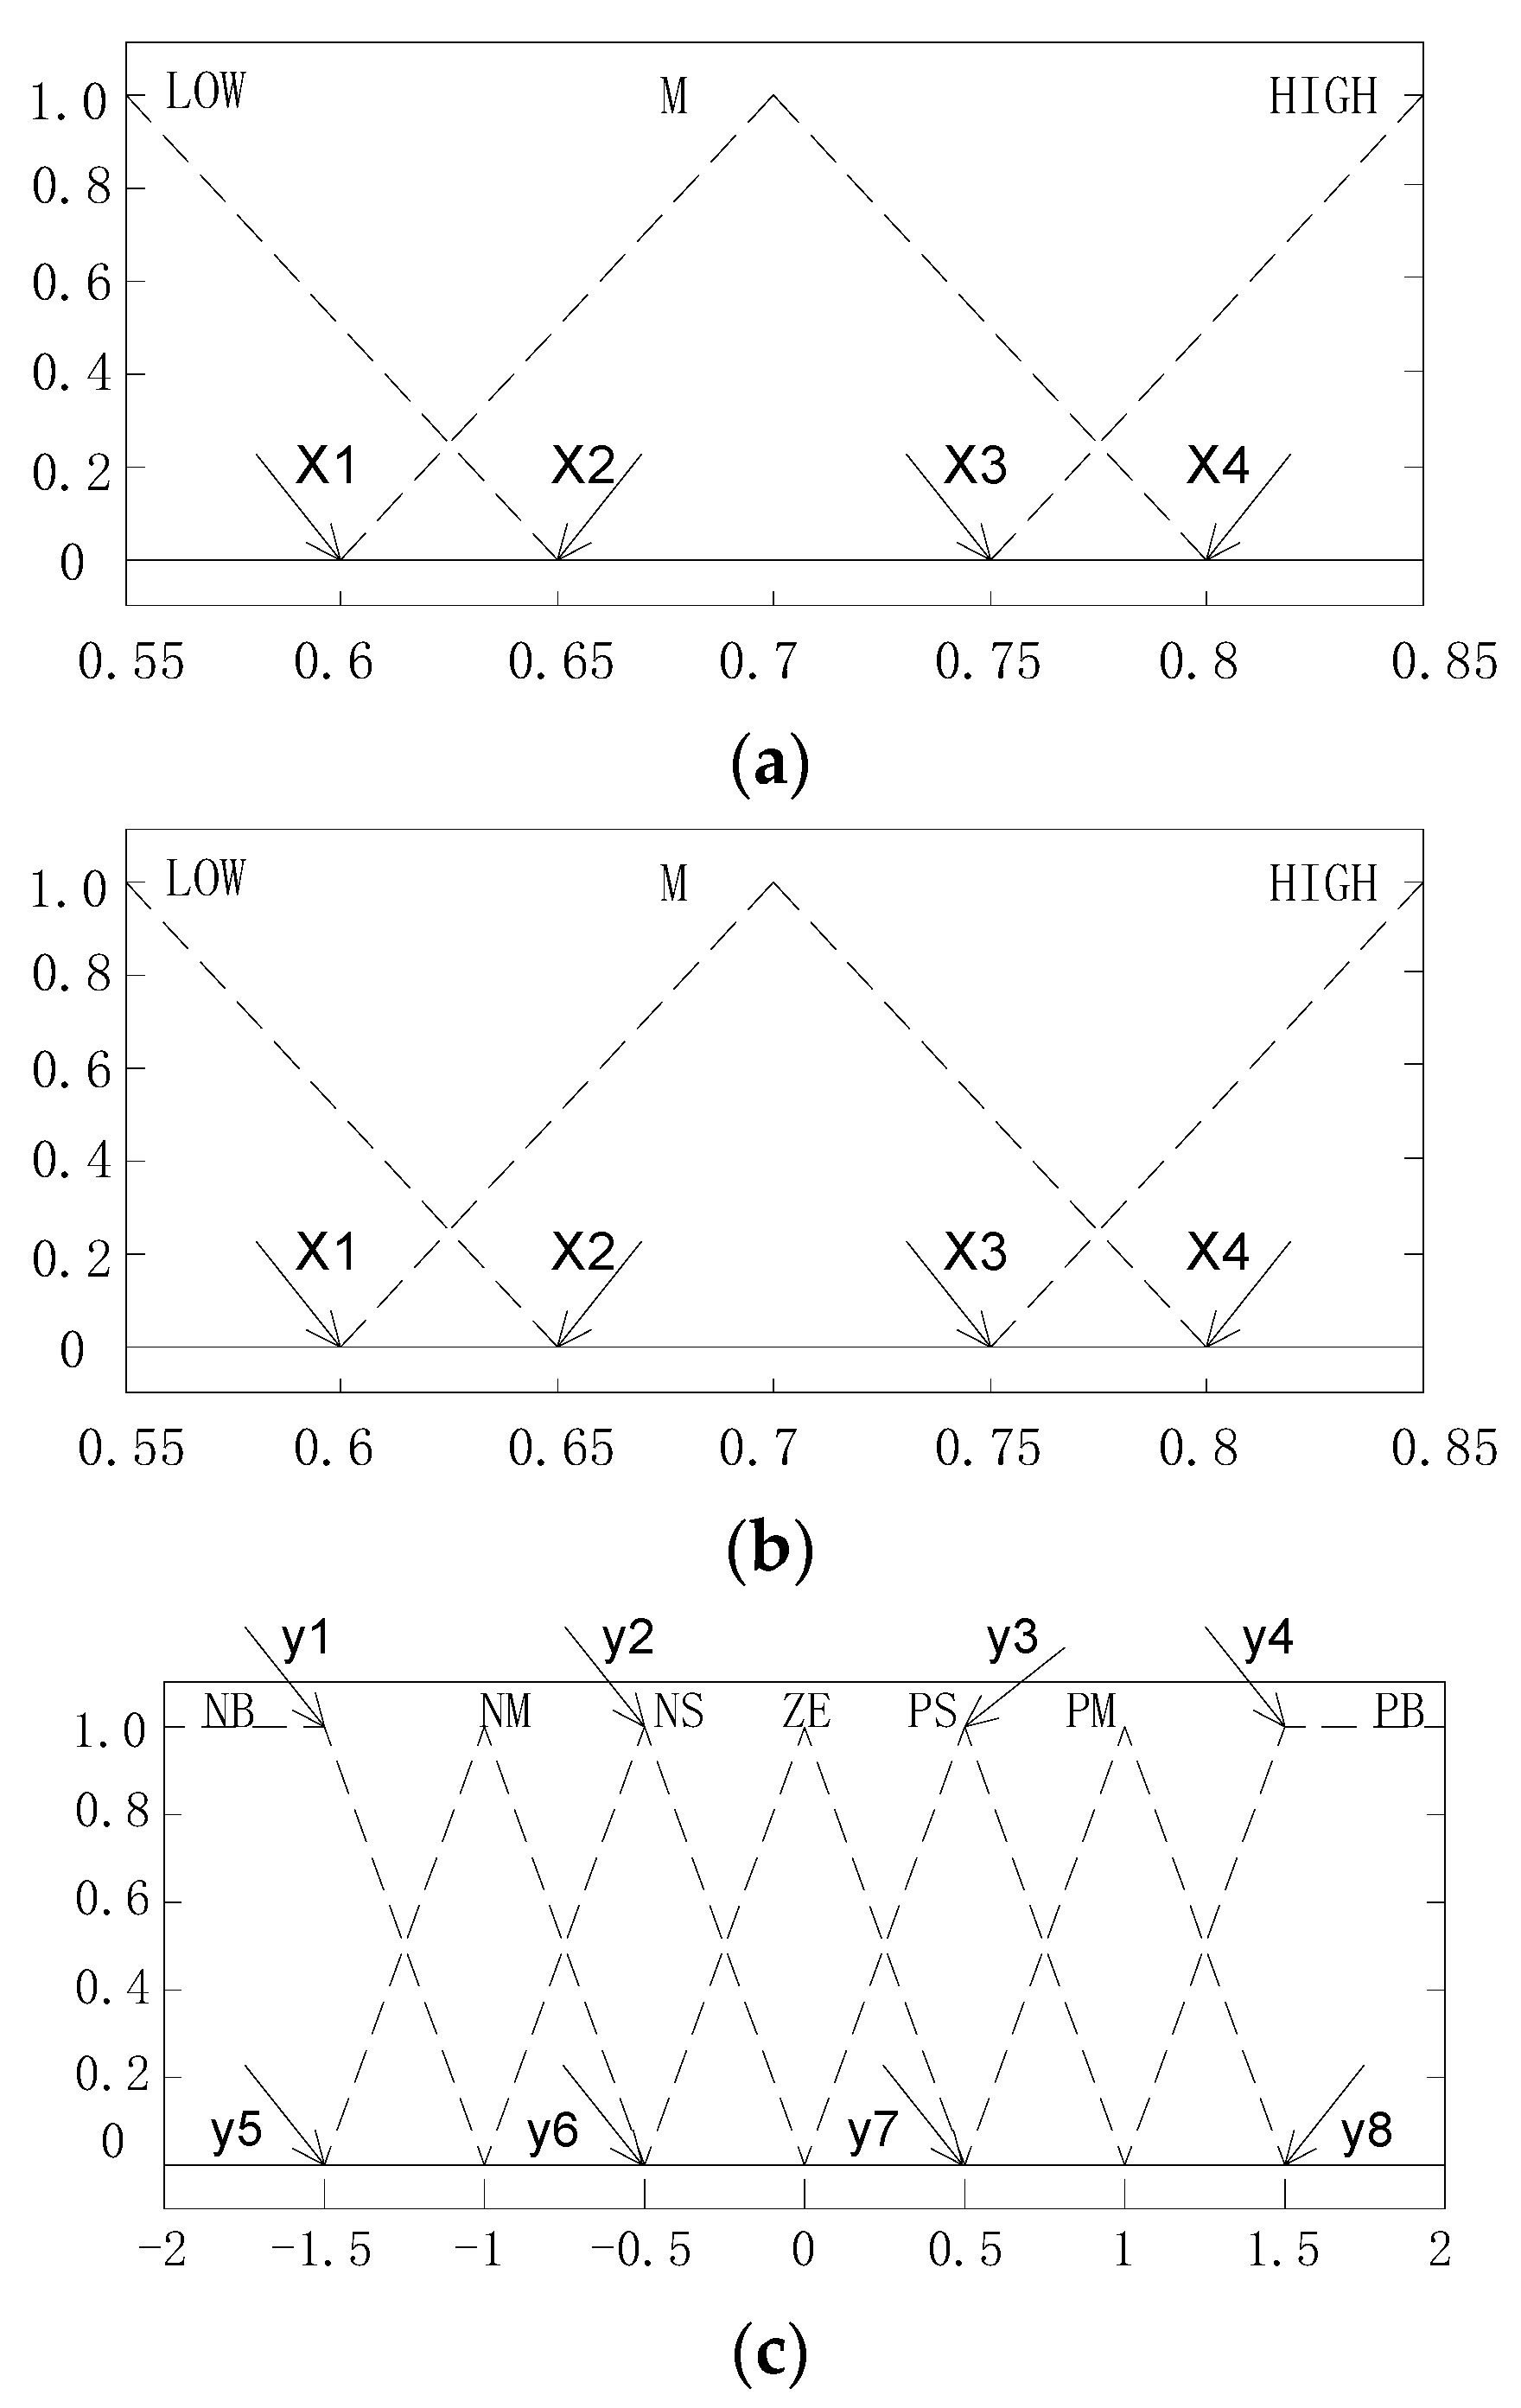
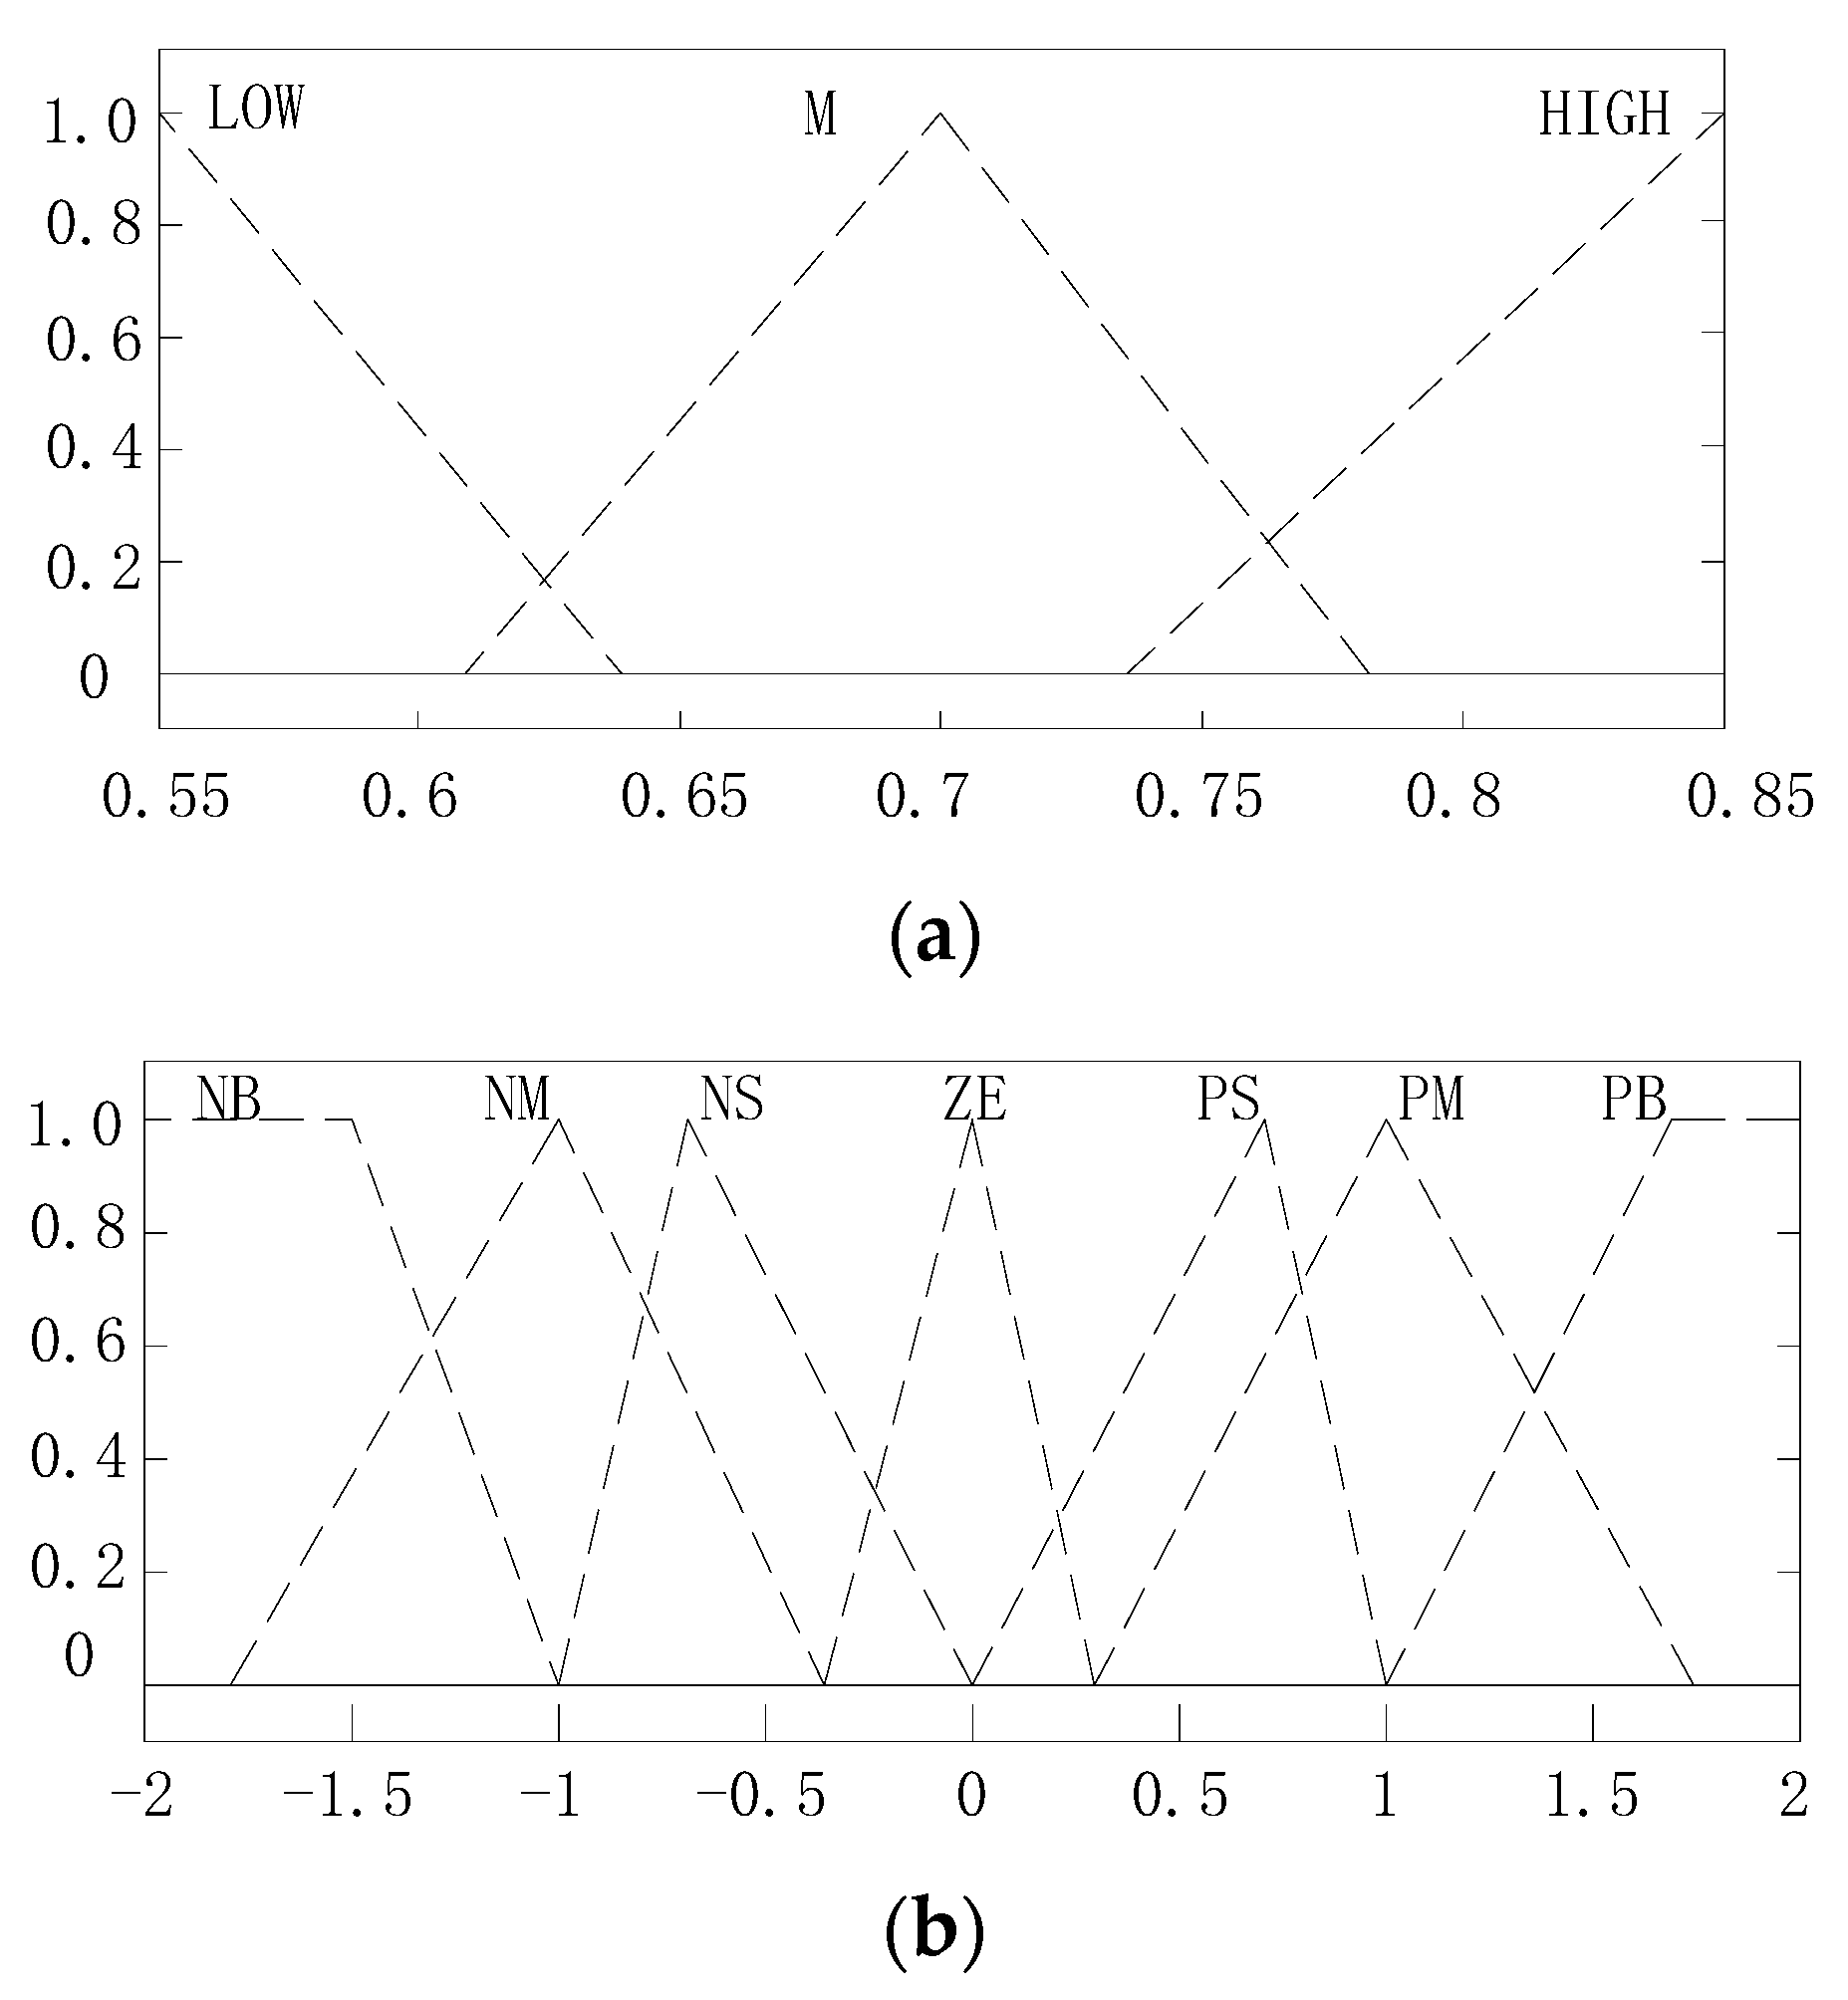
As the amount of input increases, the output result is closer to the ideal value, and at the same time, the complexity of the fuzzy rules and the amount of calculation will increase. Under the two working conditions of the driving and braking modes, the demand for each energy source is different. For this reason, the two fuzzy controllers were divided, and two control rules were respectively formulated to simplify the complexity of the system. Figure 11 and Figure 12 show the basic configuration of a dual-mode compound power fuzzy controller. The reference power of the battery after the wavelet transform was used as the input; in order to ensure a reasonable flow of energy in the system, the SOC of the battery and ultra-capacitors were used as input parameters, and the actual output power of the battery was the output parameter [31,32]. The three inputs of the controller in drive mode were the battery SOC, demand power (Pref) and ultra-capacitors SOCs. Under specific fuzzy rules, through fuzzification and defuzzification, accurate battery output power and FCS output were obtained. The control rules under the driving conditions were as follows: (1) When the Pref is small, most of the Pref is provided by the FCS, or provided by the FCS alone. The output power of the battery and the ultra-capacitors should be adjusted in conjunction with their own SOC. The power supply with the higher SOC value is the first to supply energy. (2) When the Pref is medium, the fuzzy rule should first keep the FCS in the optimal efficiency range, and at the same time, batteries and ultra-capacitors are used as auxiliary energy sources to provide part of the energy. (3) When the Pref is high, the fuzzy rule should first ensure that the vehicle energy demand is met, and the FCS, battery and ultra-capacitors work at the same time. In the braking mode, the battery and the ultra-capacitors recover the braking energy. The fuzzy rules are shown in Table 4. The larger instantaneous power is mainly recovered by the ultra-capacitors to prevent the battery from being impacted by a larger current; when the braking energy is medium or small, the energy is first recovered by the power source with a smaller SOC. The distribution of MFs is consistent over the entire discourse in the primary FLC. Thus, it is not expected to perform optimally over different parameters. In this study, the MFs of the FLC were optimized with the help of the PSO algorithm, and the construction parameters of the input MFs were regarded as design variables, as shown in Figure 13. The input MFs of SOCuc and SOCbat could be represented by four parameters (x1, x2, x3, x4), and the input MFs of PREF-bat could be represented by eight parameters (y1, y2, y3, y4, y5, y6, y7, y8).
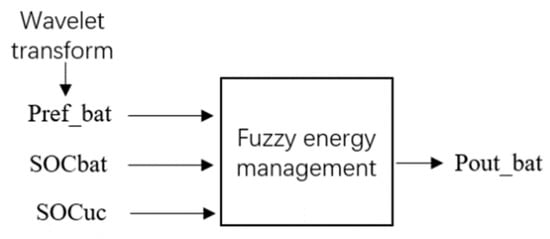
Figure 11.
Control diagram of the lithium battery output power.
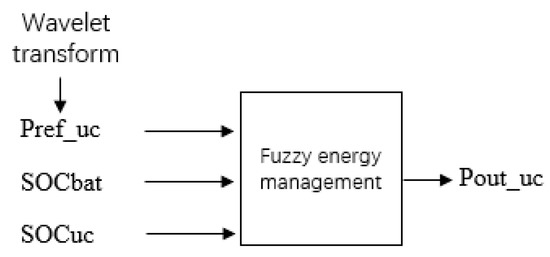
Figure 12.
Control diagram of the ultra-capacitors output power.
Table 4.
Fuzzy rules under driving conditions.
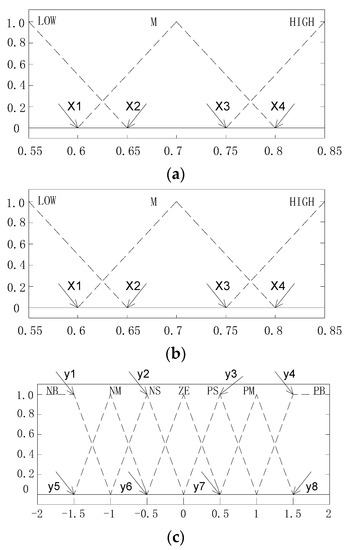
Figure 13.
Membership functions: (a) SOCuc (b) SOCbat (c) PREF-bat.
4. Parameter Optimization Based on the Particle Swarm Algorithm (PSO)
The parameter optimization problem involves finding the optimal value of the optimized variable between multiple goals, such as vehicle dynamics and fuel economy, and solving the contradictions that exist among them [33,34]. While optimizing the structural parameters, considering the impact of energy management strategies on energy consumption, the membership function in the fuzzy control rules was selected as the optimization variable. When selecting the power of the motor and the FCS, as the power increases, the system durability will increase, but at the same time, the volume and mass of the motor and FCS will increase, nor can it be guaranteed to work in a high-efficiency zone. A larger number of batteries can reduce the charge and discharge load of each battery and increase the overall weight. Compared with the battery, the specific energy and energy density of the ultra-capacitors are much smaller, and their weight should also be considered in the optimization range. Therefore, we selected the number of batteries and ultra-capacitors as optimization variables and sought the optimal solution between battery life and overall weight. There are some optimization algorithms that are used to solve multi-objective parameter optimization problems, such as Lagrange dual decomposition and the convex optimization algorithm, which also solve the trade-offs between key parameters. In this study, the particle swarm algorithm is used to optimize the key parameters with a single loop structure.
4.1. PSO
In PSO, the solution of each optimization problem is a bird in the search space, which is called a “particle”. Each particle has an initial speed and position, and a fitness value is determined by the fitness function. Each particle is given a memory function to remember the best position found; in addition, the speed of each particle determines the direction and distance of their flight so that the particle can search in the optimal solution space [35]. In each iteration of the optimization process, the particle updates its speed and position by comparing the fitness value and two extreme values: the optimal solution found by the particle itself (individual extreme value pbest) and the optimal solution found by the entire population (global extremum gbest). The iterative formula can be expressed as [36]:
- t: Number of iterations;
- : The velocity of the ith particle in t iterations;
- : Inertia weight;
- ,: Cognitive coefficients;
- ,: Uniformly distributed random numbers;
- : The historical optimal position of the individual particle i;
- : The best position in the history of the group;
- : Shrinkage factor.
The parameters and bounds of PSO algorithm are shown in Table 5.
Table 5.
PSO algorithm parameters and bounds.
4.2. Definition of Multi-Objective Parameter Optimization Problem
The performance of a fuel cell system is determined by the following three factors: power system, energy management strategy and driving cycle. In the defined UDDS cycle, the driving performance is determined by energy management strategy parameters and power system parameters. The optimization problem is determined as follows.
4.2.1. Objective Function
Minimize f(x) = fuel consumption.
The fuel economy was evaluated by hydrogen consumption in a cycle. The energy flow method was used to calculate hydrogen consumption.
- : Motor drive energy;
- : Motor efficiency;
- : Ancillary energy consumption;
- : Battery charge and discharge energy consumption;
- : Regenerative braking to recover energy;
- : Regenerative braking efficiency;
- : FCS efficiency;
- ndc: Converter efficiency.
- LHV: Low calorific value of hydrogen.
4.2.2. Restrictions
In the process of joint optimization, the dynamic performance of the vehicle shall be guaranteed. We evaluated the performance of the vehicle in terms of the maximum speed, acceleration time and mileage under certain conditions. The design parameters shall first meet the dynamic requirements, while at the same time, the total power of the three energy sources shall meet the maximum power demand. During the simulation process, an SOC correction shall be carried out to make the SOC change of the battery and supercapacitor small enough before and after the simulation:
- : Lower limits of battery SoC;
- : Upper limits of battery SoC;
- : Initial SoC value;
- : End SoC value;
- : Minimal and maximal voltages of the bus;
- : Maximal power of the DC converter;
- : Maximal speed.
4.2.3. Optimization Variables
- : The maximum power of the FCS should not be higher than the required power when the vehicle is running at the highest speed so as to avoid capacity waste when the FCS is driven alone;
- : Compressor diameter scale;
- : Number of parallel-connected battery cell stings;
- : Number of series-connected battery cells;
- : Number of parallel-connected UC cell stings;
- : Number of series-connected UC cells.
Controller parameters: membership function in the fuzzy control system.
5. Simulation and Test Result
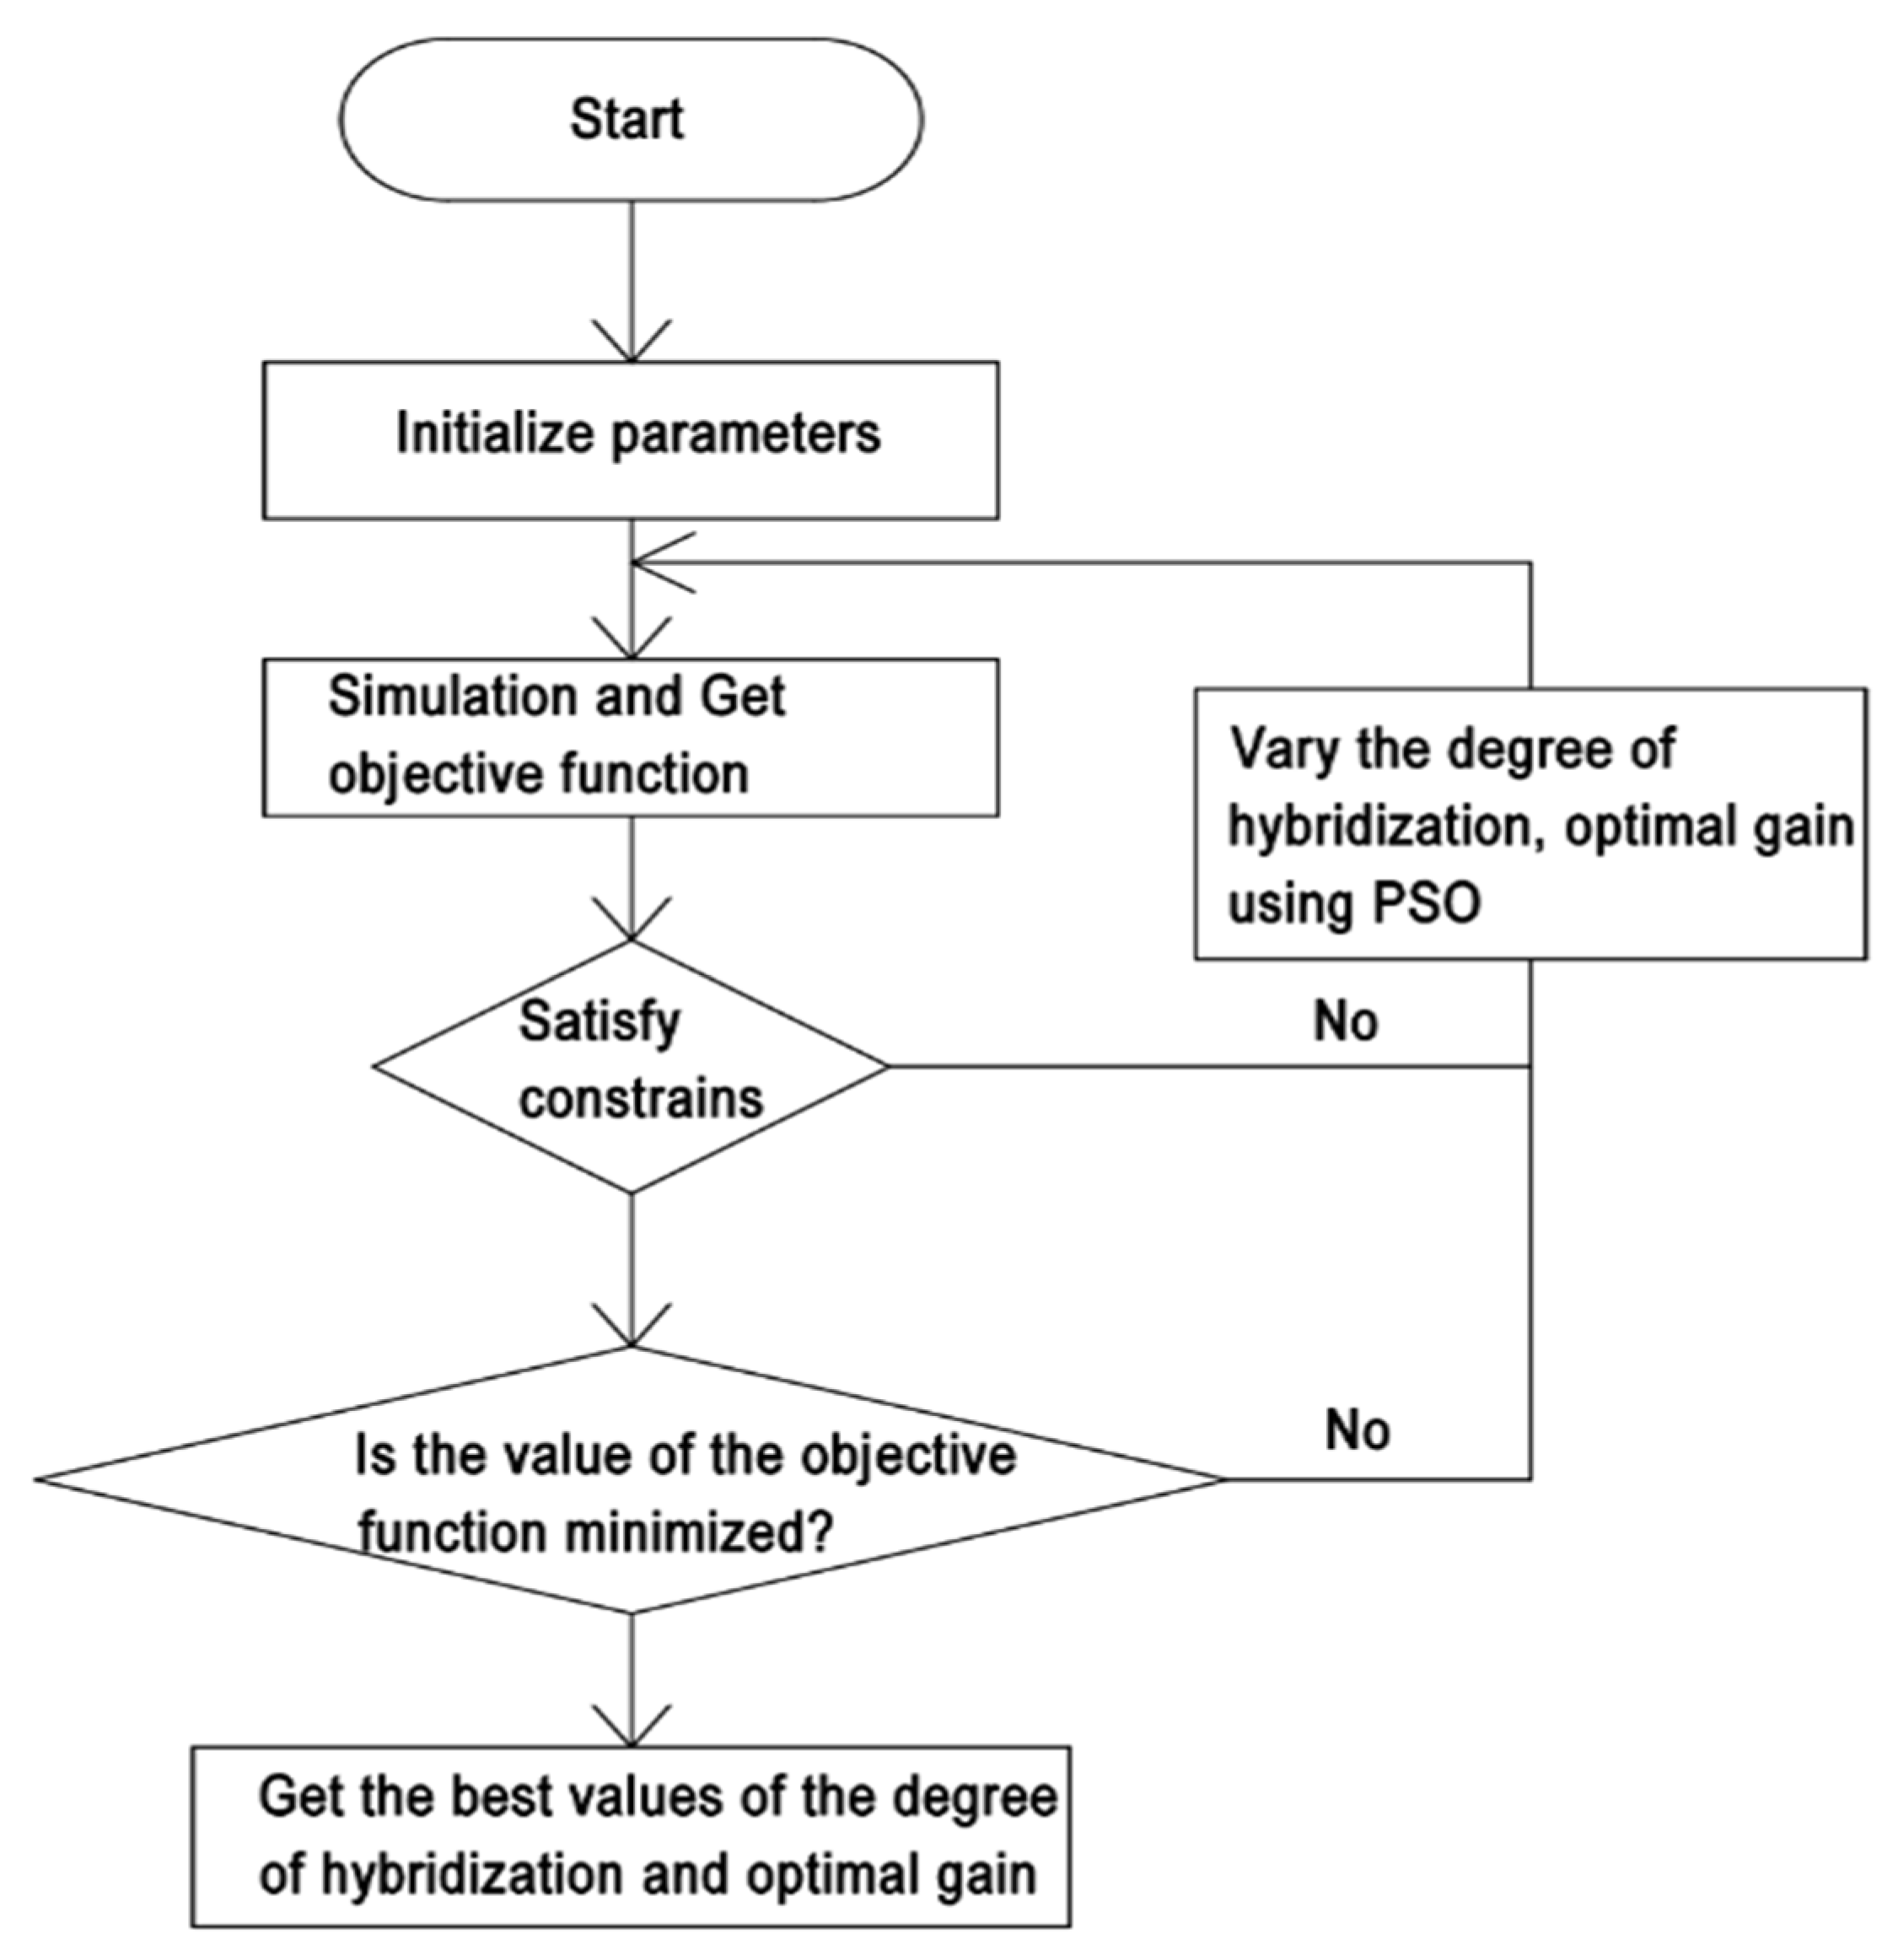
Using a MATLAB/Simulink-based software package to build the above optimization model, the purpose was to observe the system performance of the energy management system under the set cycle so as to investigate the pros and cons of the designed energy management strategy. Table 6 gives the performance parameters of the vehicle, which describes the key parameters such as the weight of the vehicle, the front area and wheel rolling radius. The optimized membership function is shown in Figure 14 and the optimized parameters are listed in Table 7. The optimization results of the membership function are shown in Figure 15.
Table 6.
Main specifications of the vehicle.

Figure 14.
Flowchart of the implemented PSO.
Table 7.
Results of the optimal design.
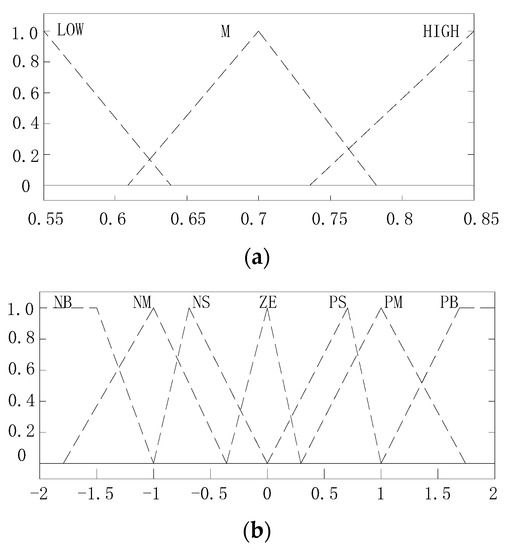
Figure 15.
Optimization results of the membership function: (a) adjusted MFs of SOCuc and SOCbat and (b) adjusted MFs of PREF-bat.
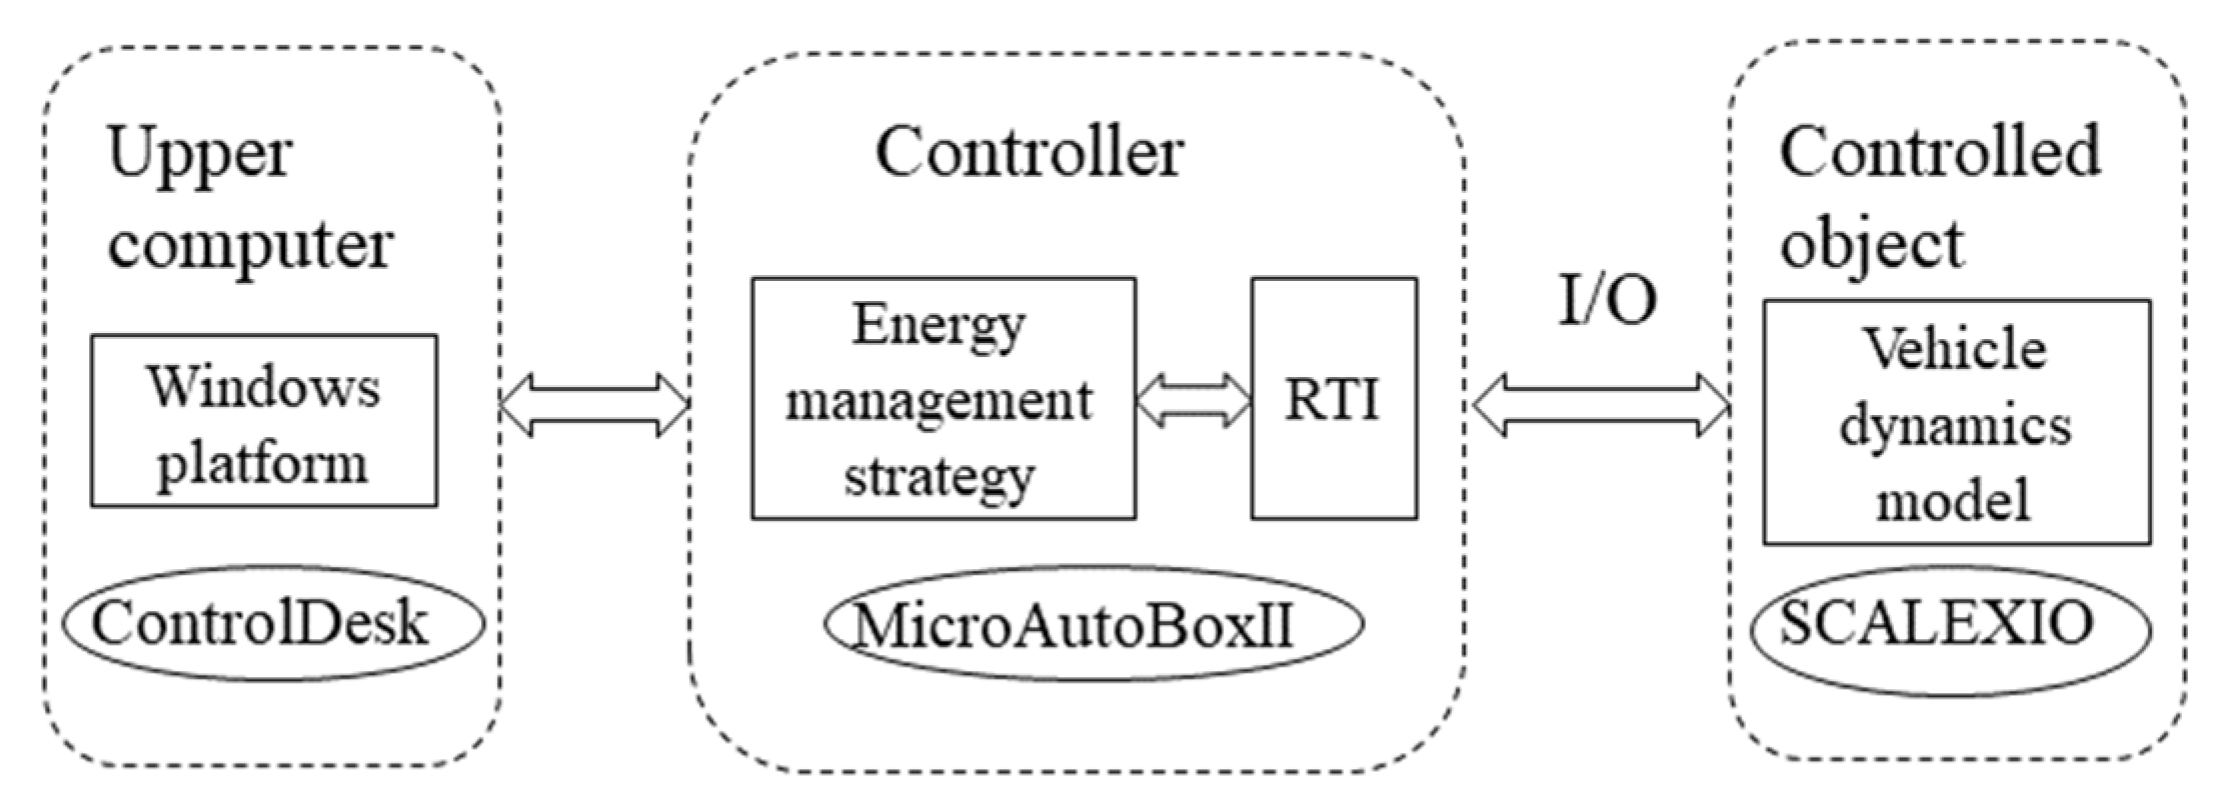
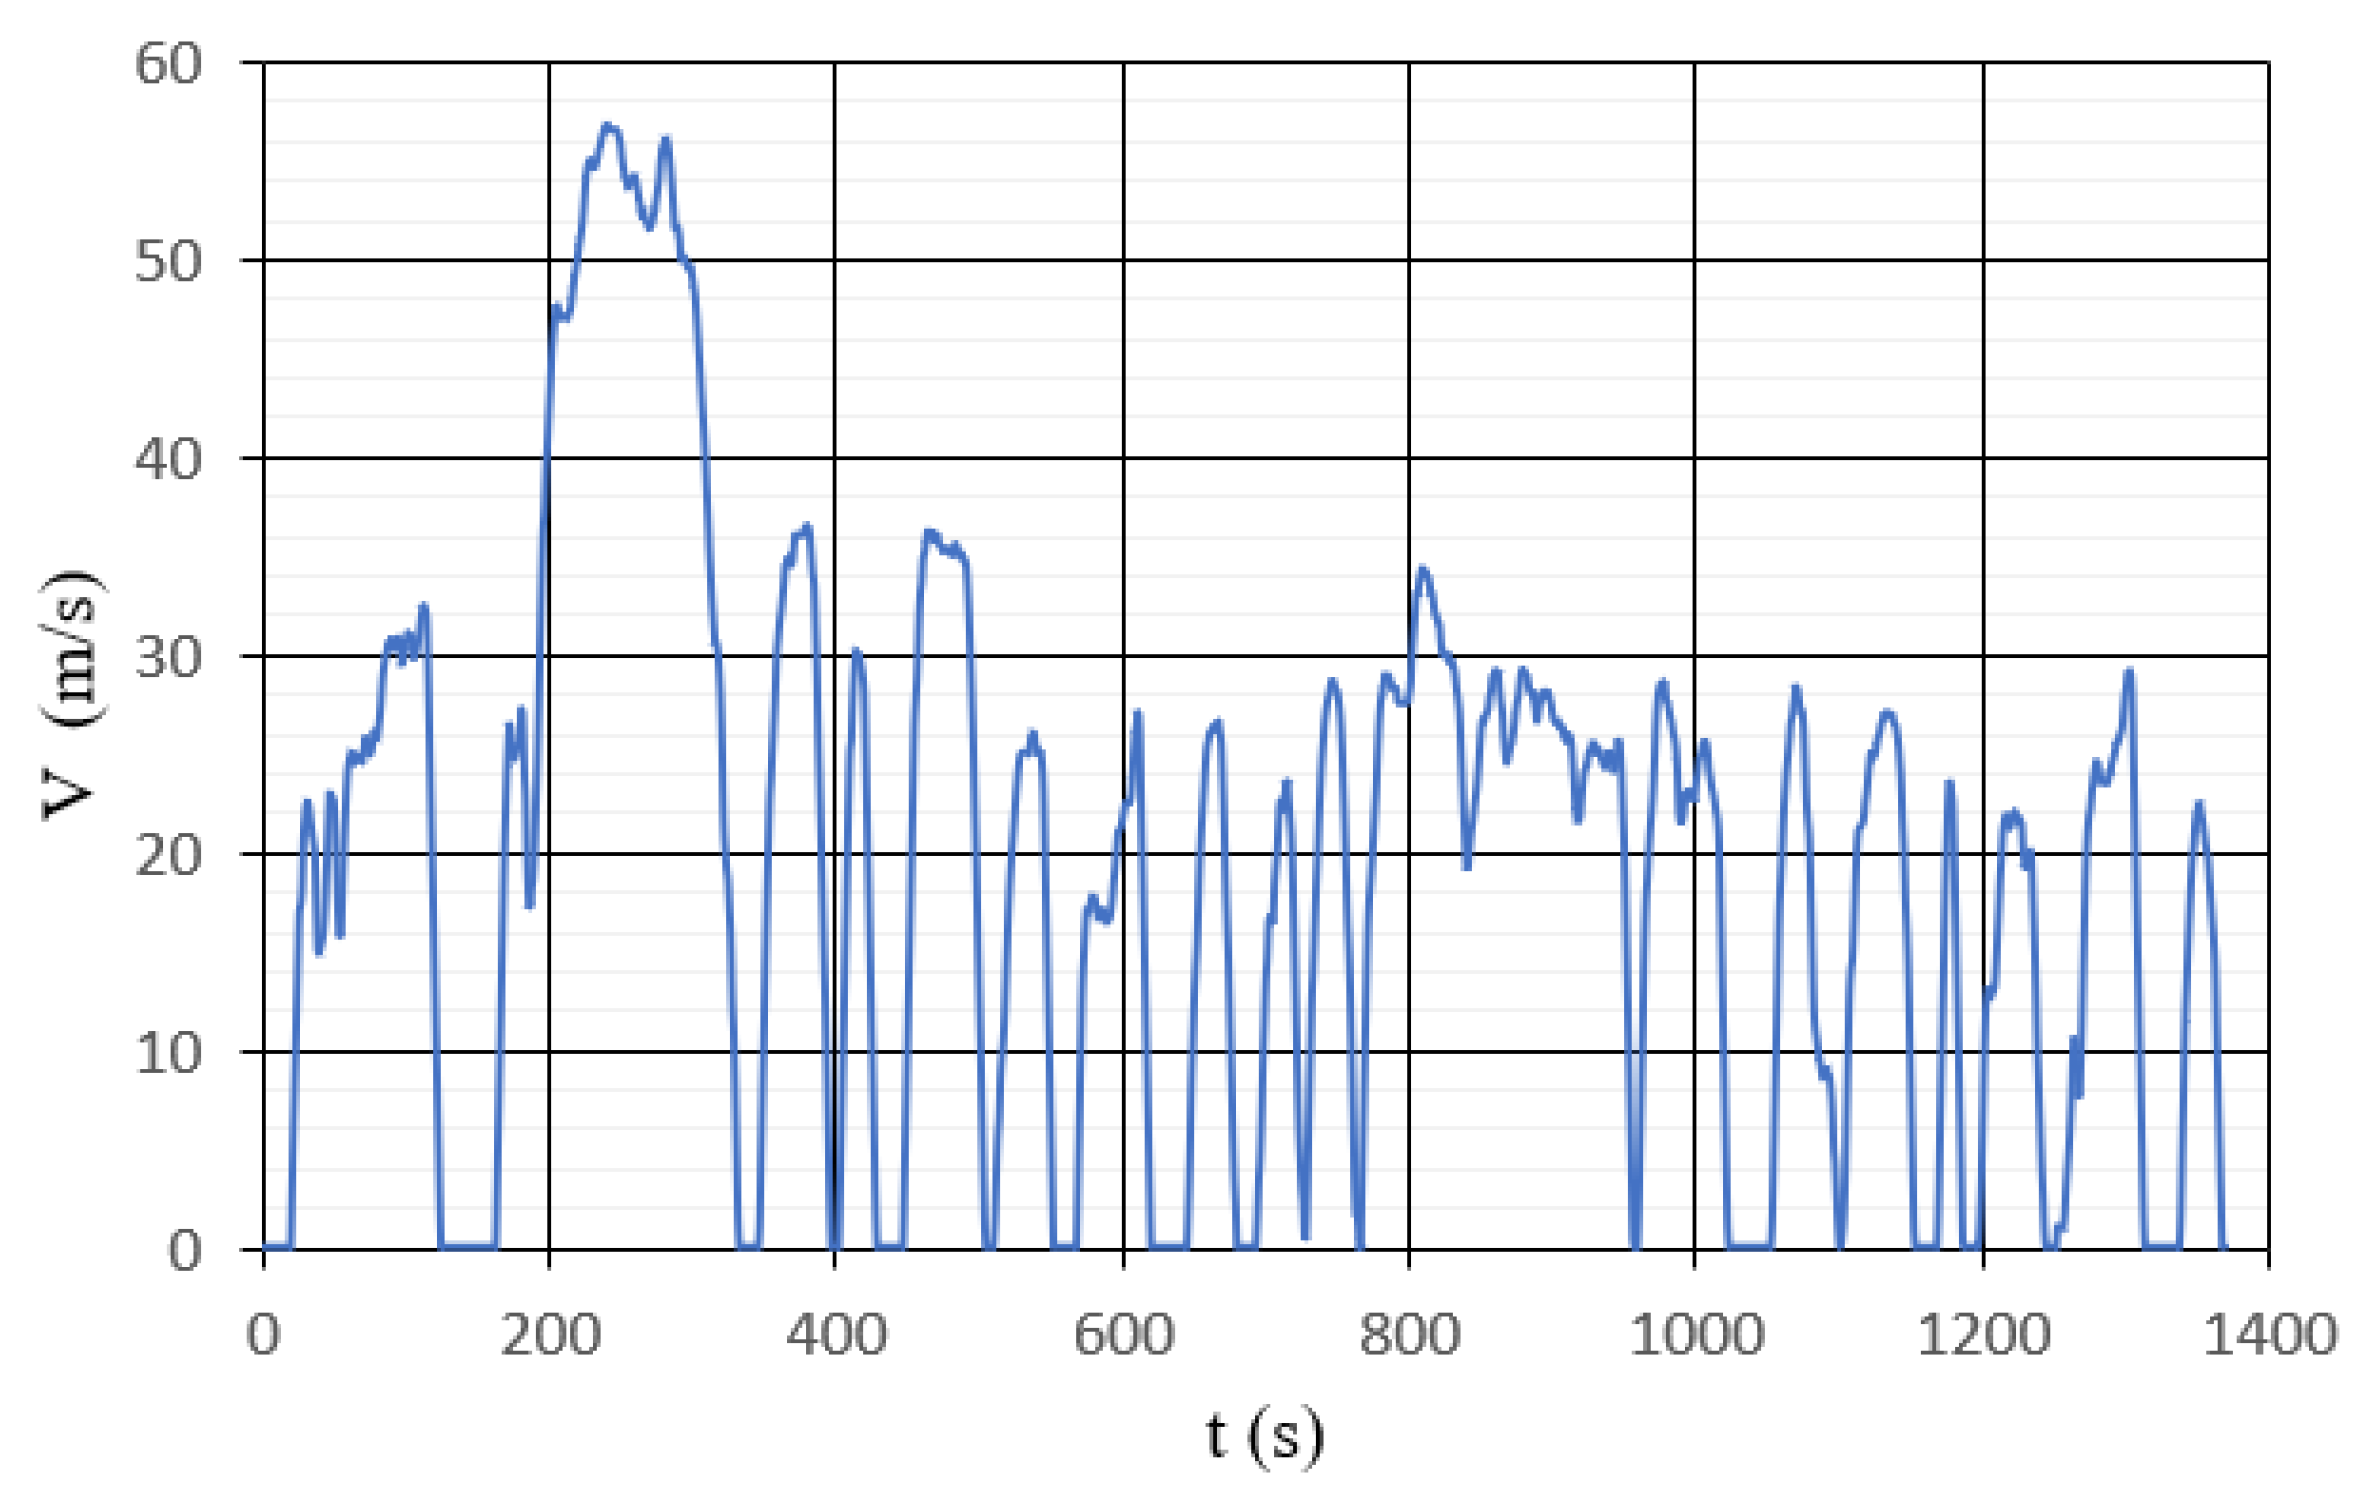
The HIL test system established in this study was based on the dSPACE SCALEXIO hardware platform. The dSPACE real-time simulation system includes software and hardware, where the software part includes RTI, ControlDesk and ConfigerationDesk, while the hardware part includes MicroAutobox and SCALEXIO. By combining with MATLAB/Simulink, the control algorithm was downloaded to MicroAutobox with automatic code generation technology, and the development, simulation and experimental verification of the control strategy could be completed [37]. The whole vehicle control system test platform is shown in Figure 16. The driving state under the UDDS condition was selected for analysis, and the speed change is shown in Figure 17.

Figure 16.
Structure diagram of the HIL test platform.

Figure 17.
Vehicle speed under the UDDS.
The whole verification process was divided into the following parts.
- (1)
- Construction of the energy management strategy
The strategy was built in Matlab/Simulink, and the external hardware interface was initialized and set in software with the help of the real-time interface (RTI) library embedded in Matlab/Simulink, which involved the interface type, communication mode, etc.
- (2)
- Calculation of the parameters related to the lithium battery and supercapacitor
Because the energy management of the composite energy storage system in this study was based on the SOC state of each energy storage unit, but the SOC could not be obtained directly, it was necessary to build relevant calculation models in the software to obtain the current SOC state.
- (3)
- Compilation and download of the energy management strategy
The original design purpose of the dSPACE system was to avoid cumbersome control strategy code. The modular strategy in Matlab/Simulink can be compiled into a language recognized by dSPACE system. The deployment of the control strategy can be completed by downloading the compiled code into dSPACE system and identifying it successfully.
- (4)
- ControlDesk design
In the upper computer software ControlDesk of the dSPACE system, various data in Matlab/Simulink can be monitored, observed and recorded in real time, and the monitoring interface and data monitoring form can be designed independently to control the experimental process.
- (5)
- Working condition simulation
After the test conditions were determined, the external demand power was calculated according to the vehicle model. The electronic load in this experiment supported the editing of specified power parameters and could simulate any working condition. The calculated demand power was introduced into the electronic load in the form of a table, and the electronic load could convert and consume electric energy with the composite energy storage system.
- (6)
- Data acquisition
After connecting the dSPACE hardware interface with external equipment or relevant sensors and setting the sampling frequency and acquisition channel, the current operation state of the whole system could be obtained.
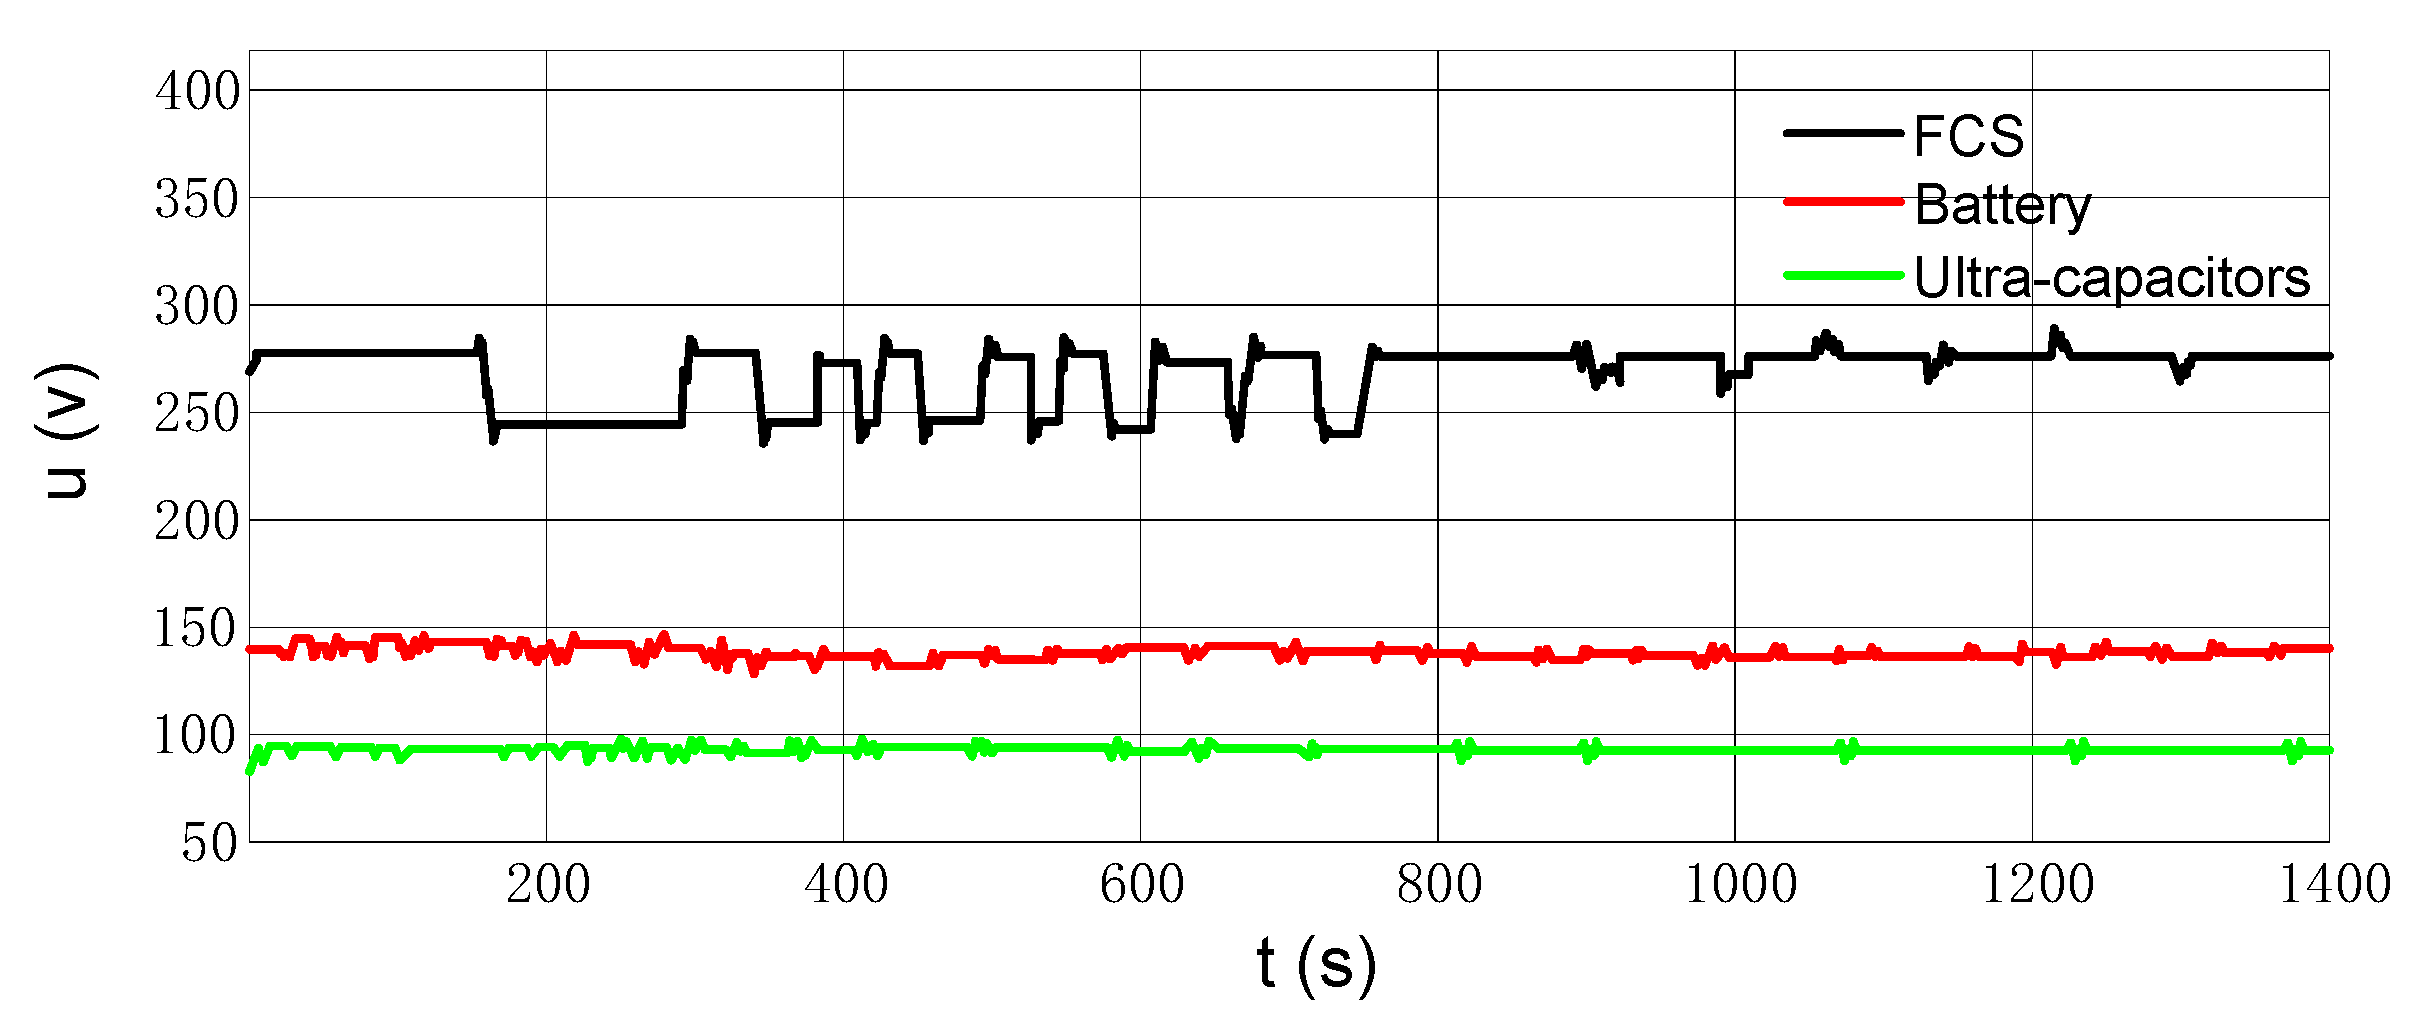
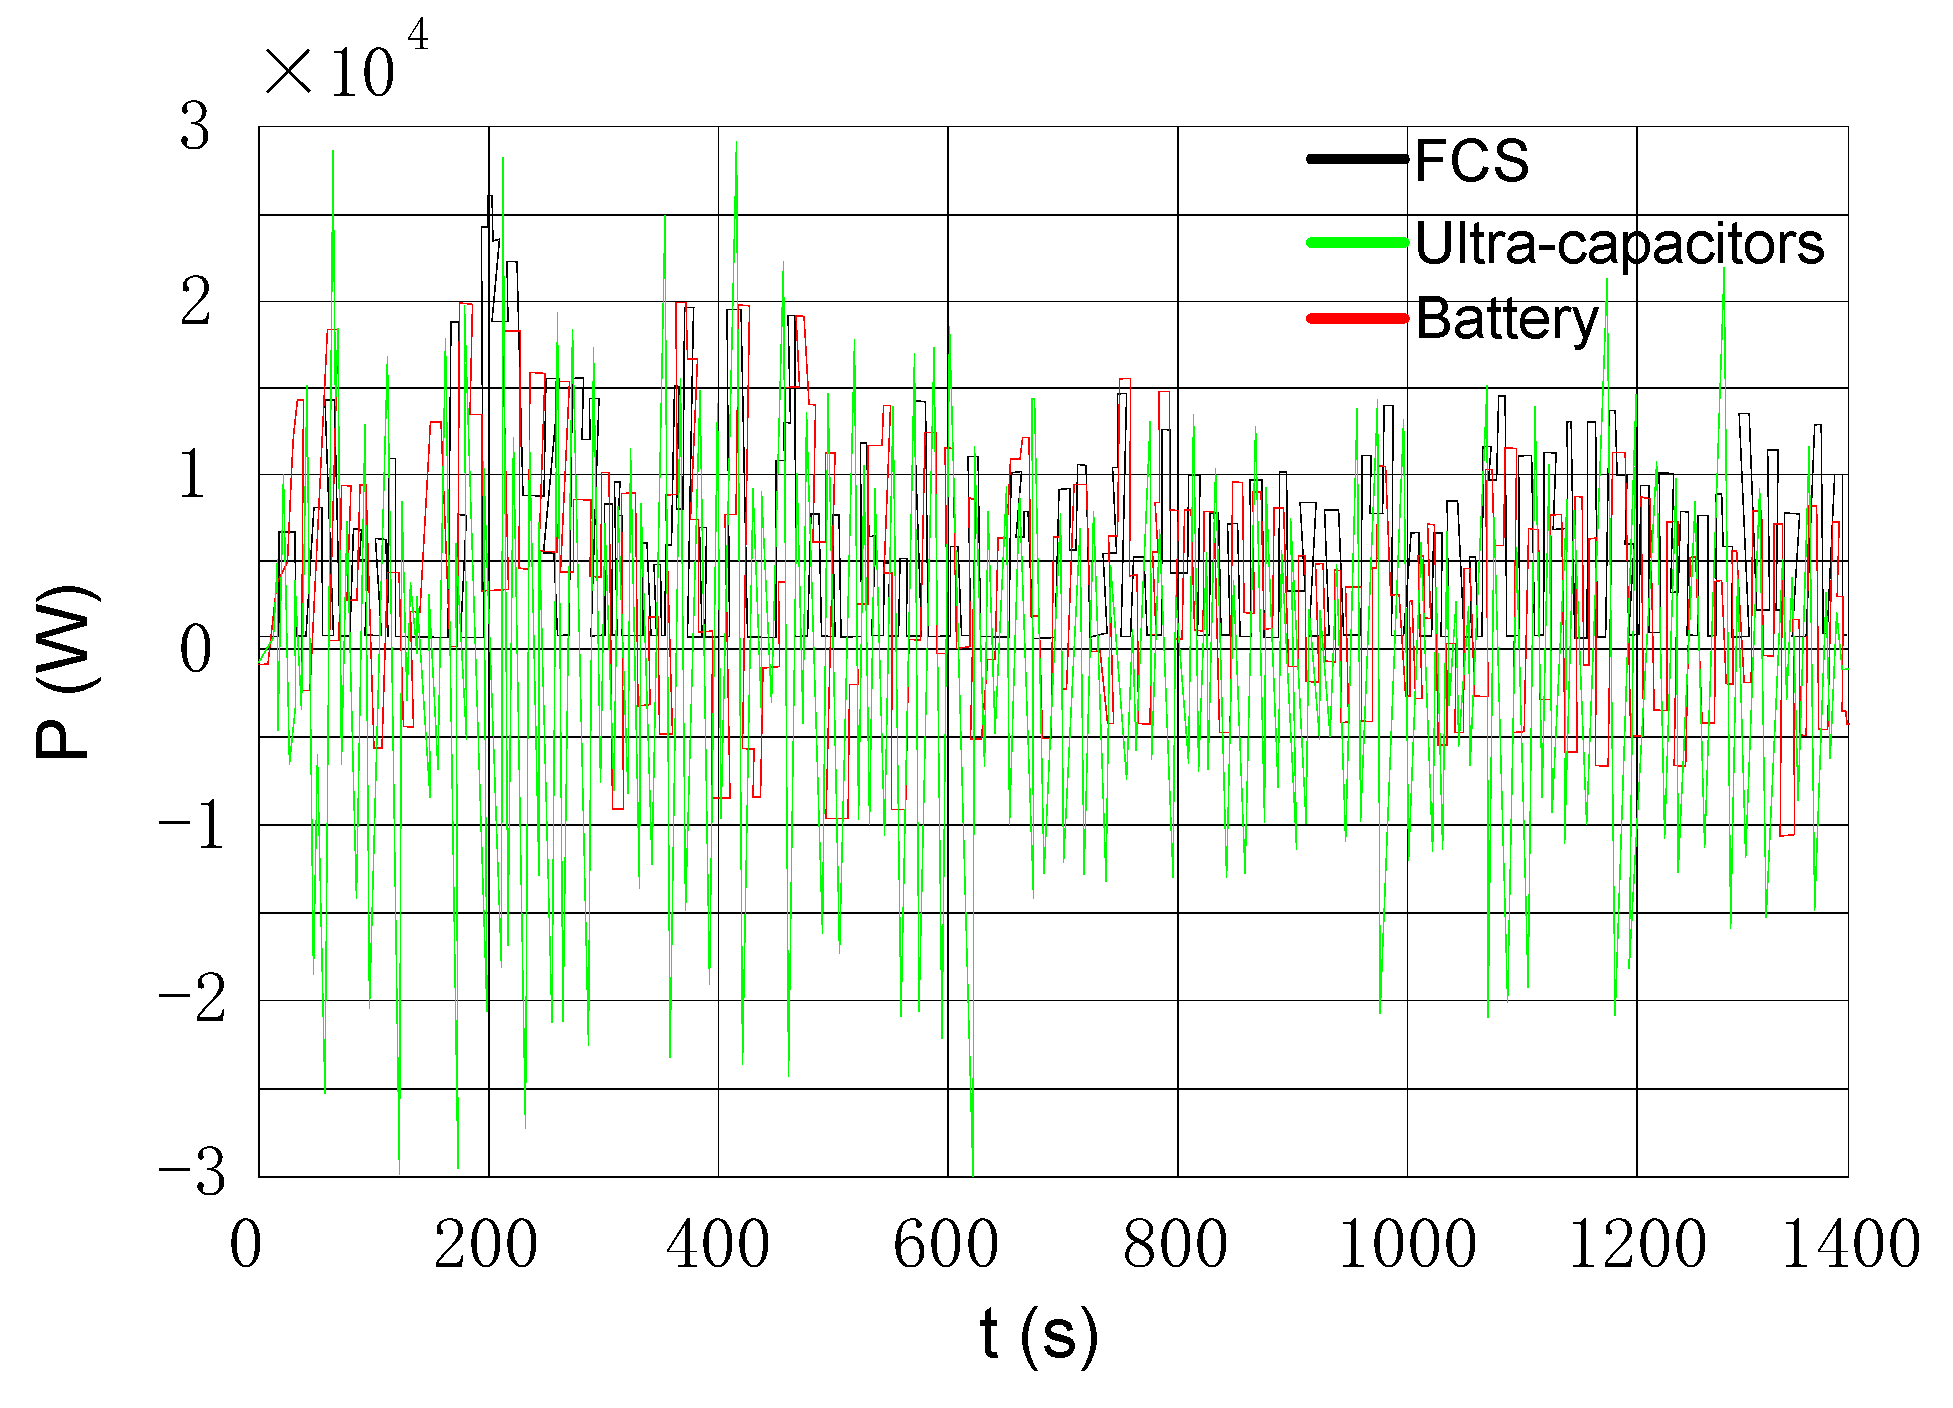
Figure 18 shows voltage of the FCS, battery cells and ultra-capacitors with the optimized parameters. The charging and discharging power of the battery pack is shown in Figure 19. The positive power represents the battery output energy and the negative power represents the recovered energy. It can be seen that the battery energy output was a steady-state signal. There were many high-frequency transient signals in the power demand signal, which were solely borne by the FCS and the battery, which will damage the battery life. Due to the function of the ultra-capacitors, the output power signal of the battery mainly changed smoothly, and the power signal of the ultra-capacitors was mainly a high-frequency transient signal, as shown in Figure 19. As shown in Figure 19, taking 190–250 s as an example, the vehicle driving state was an acceleration process, the battery was in a discharge state, the average output power is about 10 kW and the peak power is about 20 kW. Between 250–400 s, the vehicle was in a deceleration process, the battery was in an energy recovery state and the ultra-capacitors performed most of the energy recovery. The output power of the ultra-capacitors varied between positive and negative values according to the charging and discharging state, which satisfied the system’s need for responsiveness. According to the optimized parameters, the model was modified and restimulated, and the optimized simulation results were obtained. It can be seen that the system performance was improved after multi-objective joint optimization. The cost, hydrogen consumption and average battery current were improved.
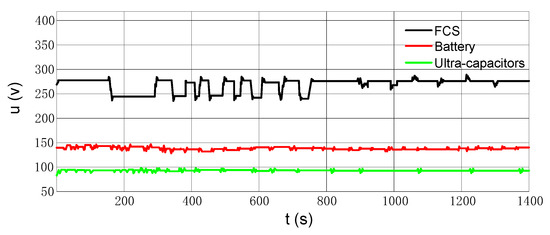
Figure 18.
Voltage variations during the UDDS drive cycle.
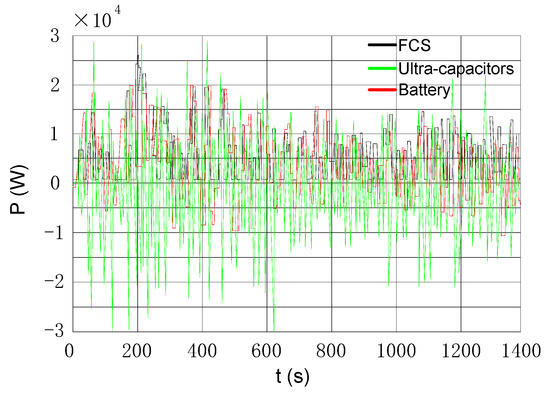
Figure 19.
Output power of the FCS, battery and ultra-capacitors.
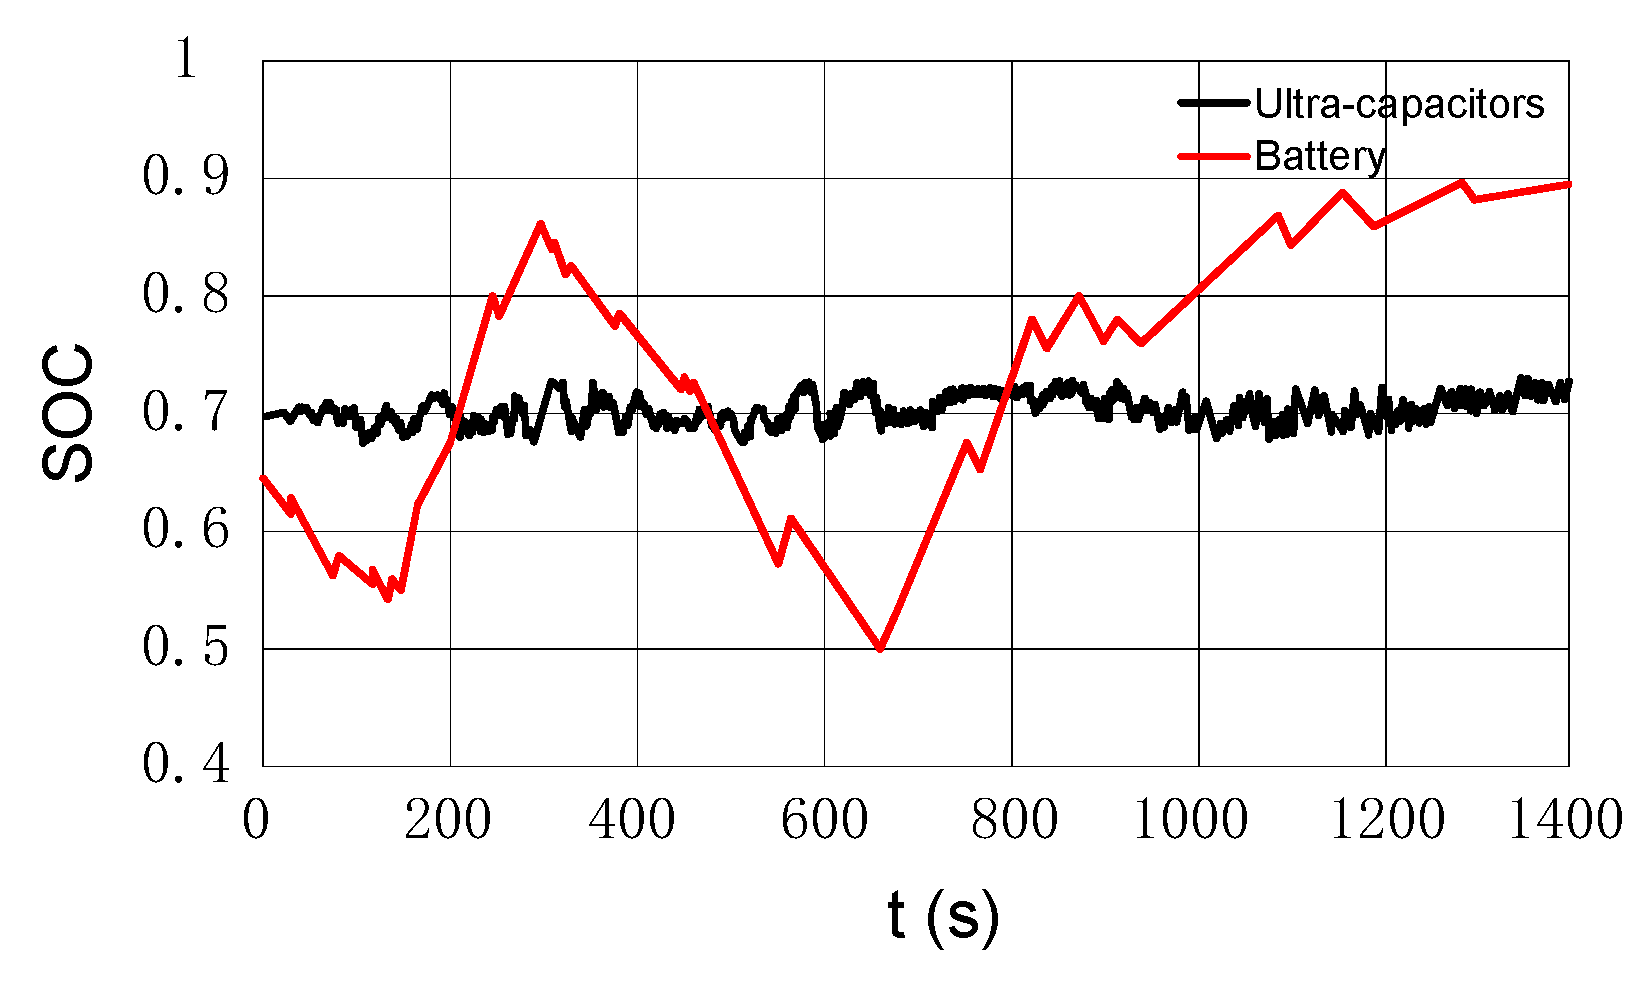
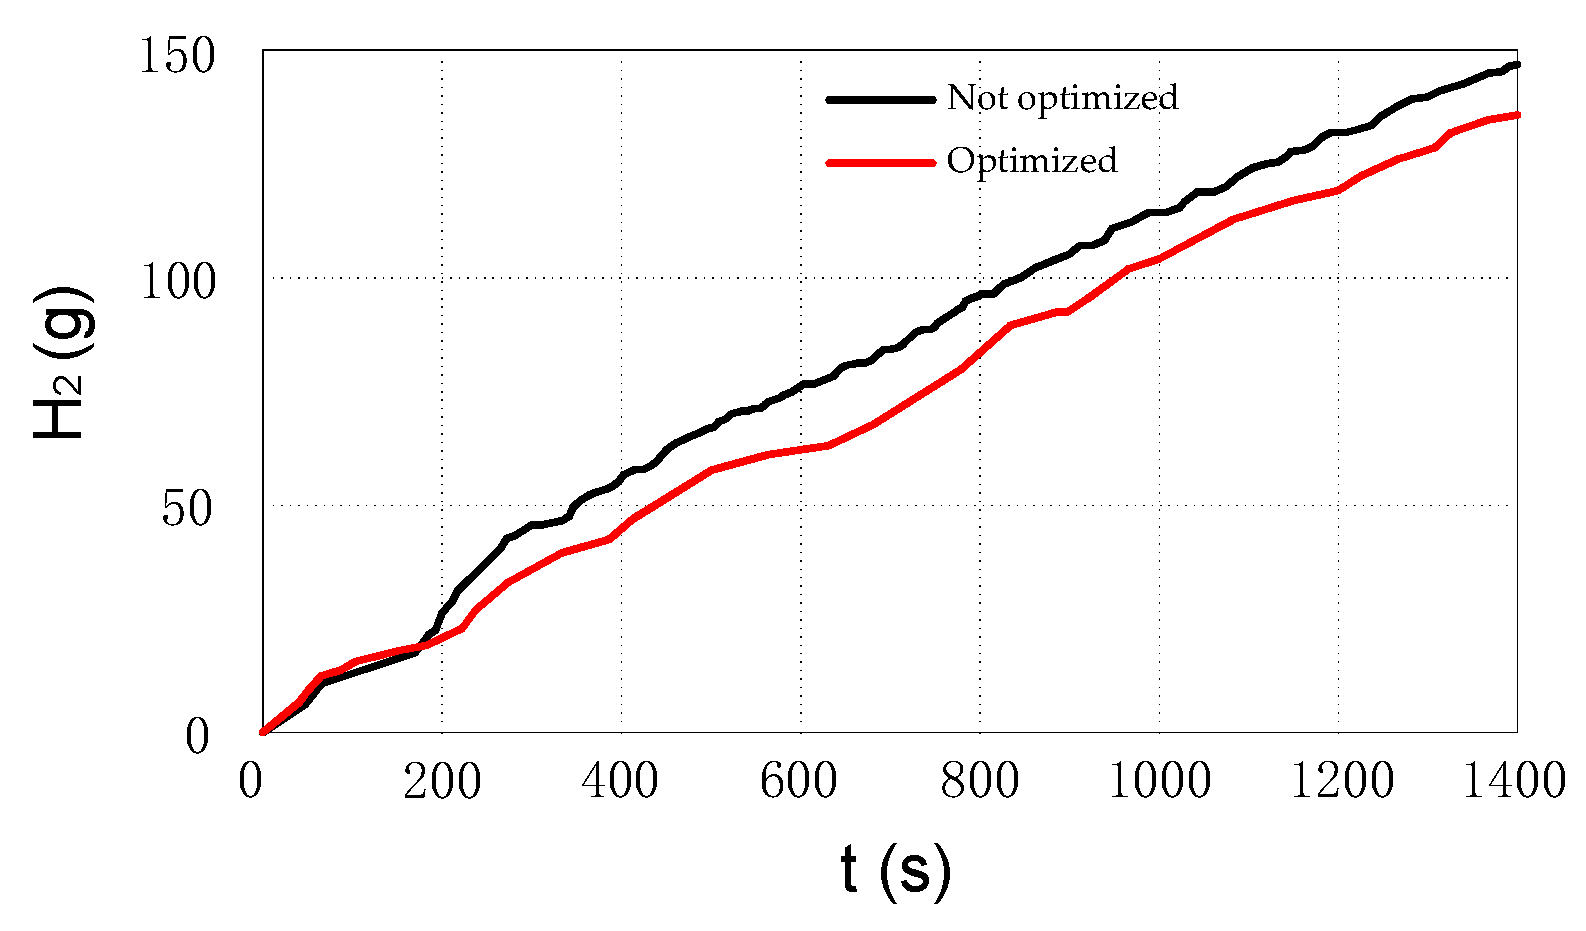
As shown in Figure 20, it can be seen from the battery and ultra-capacitors SOC that the wavelet-fuzzy control strategy could ensure that the SOC value fluctuated within a reasonable range, which benefited from the recovery of braking energy and could meet the demand for energy. During the entire working condition, the SOC value of the battery pack and the ultra-capacitors were maintained within the set range, and the SOC of the ultra-capacitors was relatively stable, which met the goal of maintaining stable power in the optimized conditions. Figure 21 illustrates the hydrogen consumption during the UDDS.
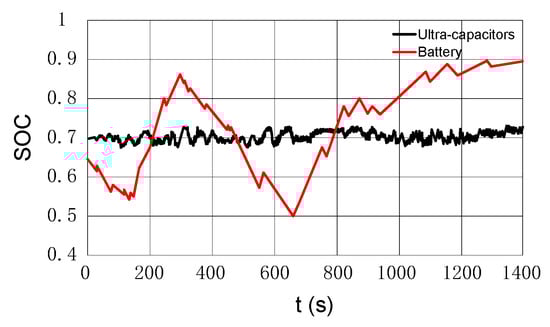
Figure 20.
SOC of the battery and ultra-capacitors.

Figure 21.
Hydrogen consumption during the UDDS drive cycle.
The simulation results before and after optimization are shown in Table 8.
Table 8.
Comparison of the simulation results before and after the optimization.
The above-mentioned changes conformed to the original design idea. The wavelet-fuzzy control strategy effectively decomposed the energy demand signal and matched the characteristics of different energy sources.
6. Conclusions
The energy sources and energy management modes in the power system were analyzed. Due to the complex nonlinearity of the system, a single model was difficult to describe. The wavelet-fuzzy energy management strategy was adopted to adjust the power of the three energy sources to achieve the total demand power. While taking into account the SOC of batteries and ultra-capacitors, the high-frequency and low-frequency distributions of signals reduced the energy loss, allowed the battery power to change smoothly and ensured that the SOC values of the batteries and ultra-capacitors changed within a reasonable range. In the whole working condition range, most of the stable load part was provided by the FCS and the battery, and the high-frequency transient part was provided by the ultra-capacitors. The PSO was used to optimize the key parameters that affected the overall size and weight of the system, and a framework mode for energy management and component parameter optimization was established, including the size parameters of the air compressor and the number of batteries and ultra-capacitors. The parameters that affected efficiency and fuel economy were optimized, including the rated power of the FCS and the membership function in the fuzzy controller, finally realizing the energy distribution and optimization. Based on dSPACE’s scalexio real-time simulation tool and the MicroAutobox rapid prototyping controller, an HIL test platform was established to test the vehicle control strategy in open-loop and closed-loop scenarios, and the good real-time and functionality of the control strategy were verified.
Regarding future research, first, the model of the nonlinear system needs to be improved, especially the life model of the battery system and SOC estimation. Second, the key mode of the fuel cell regarding composite power supply was not considered, and this strategy needs to be further improved. Finally, the optimized data should be tested on fuel cell vehicles to verify the research method through a road test.
Author Contributions
Conceptualization, W.L.; Formal analysis, S.J.; Funding acquisition, G.F.; Investigation, S.J.; Methodology, W.L. and G.F.; Project administration, G.F.; Software, W.L.; Supervision, G.F.; Writing—original draft, W.L. and S.J.; Writing—review and editing, S.J. All authors have read and agreed to the published version of the manuscript.
Funding
This research was funded by a project in Hebei Province, grant number 20312205D.
Institutional Review Board Statement
Not applicable.
Informed Consent Statement
Not applicable.
Data Availability Statement
Not applicable.
Conflicts of Interest
The authors declare that they have no known competing financial interests or personal relationships that could have appeared to influence the work reported in this paper.
Nomenclature
| BRM | Braking energy recovery mode |
| CDM | Composite power supply separate driving mode |
| DP | Dynamic programming |
| FC | Fuel cell |
| FCEVs | Fuel cell electric vehicles |
| FCS | Fuel cell system |
| FCDM | Fuel cell combined driving mode |
| FDM | Fuel cell separate driving mode |
| PEMFC | Proton exchange membrane fuel cell |
| PSO | Particle swarm optimization |
| SOC | State of charge |
| UDDS | Urban Dynameter Driving Schedule |
References
- Ostadi, A.; Kazerani, M. A comparative analysis of optimal sizing of battery-only, ultracapacitor-only, and battery–ultracapacitor hybrid energy storage systems for a city bus. IEEE Access 2015, 64, 4449–4460. [Google Scholar] [CrossRef]
- Hemi, H.; Ghouili, J.; Cheriti, A. Combination of Markov chain and optimal control solved by Pontryagin’s Minimum Principle for a fuel cell/ultra-capacitors vehicle. Energy Convers. Manag. 2015, 91, 387–393. [Google Scholar] [CrossRef]
- Snoussi, J.; Ben Elghali, S.; Benbouzid, M.; Mimouni, M.F. Auto-Adaptive Filtering-Based Energy Management Strategy for Fuel Cell Hybrid Electric Vehicles. Energies 2018, 11, 2118. [Google Scholar] [CrossRef] [Green Version]
- Elbert, P.; Widmer, M.; Gisler, H.J.; Onder, C. Stochastic dynamic programming for the energy management of a serial hybrid electric bus. Int. J. Veh. Des. 2015, 69, 88–112. [Google Scholar] [CrossRef]
- Zandi, M.; Payman, A.; Martin, J.P. Energy management of a fuel cell/ultra-capacitors/ battery power source for electric vehicular applications. IEEE Trans. Veh. Technol. 2011, 60, 433–443. [Google Scholar] [CrossRef]
- Masih-Tehrani, M.; Ha’iri-Yazdi, M.R.; Esfahanian, V.; Safaei, A. Optimum sizing and optimum energy management of a hybrid energy storage system for lithium battery life improvement. J. Power Source 2013, 244, 2–10. [Google Scholar] [CrossRef]
- Ridong, Z.; Jili, T.; Huiyu, Z. Fuzzy optimal energy management for fuel cell and ultra-capacitors systems using neural network-based driving pattern recognition. IEEE Access 2018, 27, 45–57. [Google Scholar]
- Madani, O.; Bhattacharjee, A.; Das, T. Decentralized power management in a hybrid fuel cell ultracapacitor system. IEEE Access 2016, 24, 765–778. [Google Scholar] [CrossRef]
- Dayeni, M.K.; Soleymani, M. Intelligent energy management of a fuel cell vehicle based on traffic condition recognition. Clean Technol. Environ. Policy 2016, 18, 1945–1960. [Google Scholar] [CrossRef]
- Wang, H.; Zhang, X.; Ouyang, M. Energy consumption of electric vehicles based on real-world driving patterns: A case study of Beijing. Appl. Energy 2015, 157, 710–719. [Google Scholar] [CrossRef]
- Chen, Z.; Xiong, R.; Cao, J. Particle swarm optimization-based optimal power management of plug-in hybrid electric vehicles considering uncertain driving conditions. Energy 2016, 96, 197–208. [Google Scholar] [CrossRef]
- Rezzak, D.; Boudjerda, N. Management and control strategy of a hybrid energy source fuel cell/ultra-capacitors in electric vehicles. Int. Trans. Electr. Energy Syst. 2017, 27, e2308. [Google Scholar] [CrossRef]
- Palandini, V.; Donateo, T.; Risi, A.D. Super-capacitors fuel cell hybrid electric vehicle optimization and control strategy development. Energy Convers. Manag. 2007, 48, 3001–3008. [Google Scholar] [CrossRef]
- García, P.; Torreglosa, J.P.; Fernandez, L.M. Control strategies for high-power electric vehicles powered by hydrogen fuel cell, battery and ultra-capacitors. Expert Syst. Appl. 2013, 40, 4791–4804. [Google Scholar] [CrossRef]
- Shen, J.; Dusmez, S.; Khaligh, A. Optimization of sizing and battery cycle life in battery/ultracapacitor hybrid energy storage systems for electric vehicle applications. IEEE Trans. Ind. Inform. 2014, 10, 2112–2121. [Google Scholar] [CrossRef]
- Cai, Q.; Brett, D.J.L.; Browning, D. A sizing-design methodology for hybrid fuel cell power systems and its application to an unmanned underwater vehicle. J. Power Source 2010, 195, 6559–6569. [Google Scholar] [CrossRef]
- Segura, F.; Andujar, J.M. Power management based on sliding control applied to fuel cell systems: A further step towards the hybrid control concept. Appl. Energy 2012, 99, 213–225. [Google Scholar] [CrossRef]
- Xu, L.; Mueller, C.D.; Li, J. Multi-objective component sizing based on optimal energy management strategy of fuel cell electric vehicles. Appl. Energy 2015, 157, 664–674. [Google Scholar] [CrossRef]
- Song, Z.; Hofmann, H.; Li, J. Optimization for a hybrid energy storage system in electric vehicles using dynamic programing approach. Appl. Energy 2015, 139, 151–162. [Google Scholar] [CrossRef]
- Ravey, A.; Roche, R.; Blunier, B.; Miraoui, A. Combined optimal sizing and energy management of hybrid electric vehicles. In Proceedings of the 2012 IEEE Transportation Electrification Conference and Expo, Dearborn, MI, USA, 18–20 June 2012; pp. 1–6. [Google Scholar]
- Hu, X.; Zou, C.; Tang, X. Cost-optimal energy management of hybrid electric vehicles using fuel cell/battery health-aware predictive control. IEEE Access 2019, 35, 382–392. [Google Scholar] [CrossRef] [Green Version]
- Jiang, H.; Xu, L.; Li, J. Energy management and component sizing for a fuel cell/battery/ultra-capacitors hybrid powertrain based on two-dimensional optimization algorithms. Energy 2019, 177, 386–396. [Google Scholar] [CrossRef]
- Porstmann, S.; Wannemacher, T.; Richter, T. Overcoming the Challenges for a Mass Manufacturing Machine for the Assembly of PEMFC Stacks. Machines 2019, 7, 66. [Google Scholar] [CrossRef] [Green Version]
- Shahverdi, M.; Mazzola, M.S.; Grice, Q. Pareto front of energy storage size and series HEV fuel economy using bandwidth-based control strategy. IEEE Acess 2016, 2, 36–51. [Google Scholar] [CrossRef]
- Madani, S.S.; Schaltz, E.; Kær, S.K. Characterization of the Compressive Load on a Lithium-Ion Battery for Electric Vehicle Application. Machines 2021, 9, 71. [Google Scholar] [CrossRef]
- Panday, A.; Bansal, H.O. Energy management strategy for hybrid electric vehicles using genetic algorithm. J. Renew. Sustain. Energy 2016, 8, 015701. [Google Scholar] [CrossRef]
- Kandidayeni, M.; Macias, A.; Boulon, L. Online modeling of a fuel cell system for an energy management strategy design. Energies 2020, 13, 3713. [Google Scholar] [CrossRef]
- Carignano, M.; Roda, V.; Costa-Castelló, R. Assessment of energy management in a fuel cell/battery hybrid vehicle. IEEE Access 2019, 7, 16110–16122. [Google Scholar] [CrossRef]
- Kandidayeni, M.; Macias, A.; Boulon, L. Efficiency enhancement of an open cathode fuel cell through a systemic management. IEEE Access 2019, 68, 11462–11472. [Google Scholar] [CrossRef]
- Yue, M.; Jemei, S.; Gouriveau, R.; Zerhouni, N. Review on health-conscious energy management strategies for fuel cell hybrid electric vehicles: Degradation models and strategies. Int. J. Hydrogen Energy 2019, 44, 6844–6861. [Google Scholar] [CrossRef]
- Ettihir, K.; Boulon, L.; Agbossou, K. Energy management strategy for a fuel cell hybrid vehicle based on maximum efficiency and maximum power identification. IET. Electr. Syst. Transp. 2016, 6, 261–268. [Google Scholar] [CrossRef]
- Sulaiman, N.; Hannan, M.A.; Mohamed, A.; Ker, P.J.; Majlan, E.H.; Daud, W.W. Optimization of energy management system for fuel-cell hybrid electric vehicles: Issues and recommendations. Appl. Energy 2018, 228, 2061–2079. [Google Scholar] [CrossRef]
- Min, C.; Rincon-Mora, G.A. Accurate electrical battery model capable of predicting runtime and I-V performance. IEEE Access 2006, 21, 504–511. [Google Scholar]
- Kim, M.; Sohn, Y.; Lee, W.; Kim, C. Fuzzy control based engine sizing optimization for a fuel cell/battery hybrid mini-bus. J. Power Source 2008, 178, 706–710. [Google Scholar] [CrossRef]
- Zhang, H.; Yang, X.; Sun, X.; Liang, J. Optimal design of shift point strategy for DCT based on particle swarm optimization. Machines 2021, 9, 196. [Google Scholar] [CrossRef]
- Naderi, E.; Pourakbari-Kasmaei, M.; Cerna, F.V.; Lehtonen, M. A novel hybrid self-adaptive heuristic algorithm to handle single-and multi-objective optimal power flow problems. Int. J. Electr. Power Energy Syst. 2021, 125, 106492. [Google Scholar] [CrossRef]
- Naderi, E.; Asrari, A. Hardware-in-the-loop experimental validation for a lab-scale microgrid targeted by cyberattacks. In Proceedings of the 2021 IEEE 9th International Conference on Smart Grid, Setubal, Portugal, 29 June–1 July 2021; pp. 57–62. [Google Scholar]

Publisher’s Note: MDPI stays neutral with regard to jurisdictional claims in published maps and institutional affiliations. |
© 2022 by the authors. Licensee MDPI, Basel, Switzerland. This article is an open access article distributed under the terms and conditions of the Creative Commons Attribution (CC BY) license (https://creativecommons.org/licenses/by/4.0/).