Article

Online Capacity Estimation for Lithium-Ion Batteries Based on Semi-Supervised Convolutional Neural Network

1
College of Automation & College of Artificial Intelligence, Nanjing University of Posts and Telecommunications, Nanjing 210023, China
2
Center on Frontiers of Computing Studies, Peking University, Beijing 100871, China
*
Author to whom correspondence should be addressed.
World Electr. Veh. J. 2021, 12(4), 256; https://doi.org/10.3390/wevj12040256
Submission received: 24 September 2021 / Revised: 7 November 2021 / Accepted: 2 December 2021 / Published: 6 December 2021

Abstract

:
Accurate capacity estimation can ensure the safe and reliable operation of lithium-ion batteries in practical applications. Recently, deep learning-based capacity estimation methods have demonstrated impressive advances. However, such methods suffer from limited labeled data for training, i.e., the capacity ground-truth of lithium-ion batteries. A capacity estimation method is proposed based on a semi-supervised convolutional neural network (SS-CNN). This method can automatically extract features from battery partial-charge information for capacity estimation. Furthermore, a semi-supervised training strategy is developed to take advantage of the extra unlabeled sample, which can improve the generalization of the model and the accuracy of capacity estimation even in the presence of limited labeled data. Compared with artificial neural networks and convolutional neural networks, the proposed method is demonstrated to improve capacity estimation accuracy.

1. Introduction

Due to high power density, low self-discharge rate, and long service life, lithium-ion batteries are widely used as energy storage devices for various applications such as smart grids, electric vehicles, etc. The stabilization of lithium-ion batteries is the cornerstone of the safety and reliability of the entire system. To improve stabilization and prevent severe accidents through the use of lithium-ion batteries, good battery management systems (BMSs) for safety monitoring and timely maintenance are in great demand [1,2]. Regarding BMSs, various sensors and algorithms are adopted to improve performance. Particularly, a battery capacity estimation, which provides rich information on batteries [3], is the essential element of BMSs.
The capacity estimation method for lithium-ion batteries can be divided into model-based and data-driven methods in general [4]. Model-based methods yield estimation by identifying the model parameters of the battery (e.g., equivalent circuit model and electrochemical model, etc.) [5,6,7]. However, this these methods require precise models that are not trivial in practice. Data-driven methods attempt to estimate the capacity of batteries using a two-step fashion, feature extraction and machine-learning based regression [8,9]. In the first step, available features that can indicate battery degradation are extracted based on the operation data, such as the slope of the charging curve [10], the time interval of an equal voltage difference [11], the incremental capacity [12], or the differential temperature [13]. Then, machine learning methods, such as the support vector machine (SVM) [8], Gaussian process regression (GPR) [14], or random forest (RF) [15], are used to model the relationship between the capacity and features. Data-driven methods reduce the dependence on precise battery models. They still have potential in terms of their generalization ability and capacity estimation accuracy.
Recently, deep learning methods have attracted significant attention due to their capability of automatic feature extraction and good generalization performance [16]. The seminal works of deep learning methods for battery capacity estimation, including long short term memory (LSTM) [17], convolutional neural network (CNN) [18], etc., provide huge advantages. Even though deep learning methods achieve compelling battery capacity estimation results, they suffer from limited training data as a large amount of labeled data is needed for training. However, data annotation is costly, time-consuming, and even impractical under specific working conditions for batteries.
In this paper, we proposed a battery capacity estimation approach based on a semi-supervised convolutional neural network (SS-CNN). The key contribution is introducing unsupervised learning into the CNN-based method to reduce the dependency of labeled data. The basis of our method is a CNN with battery local charging information as the input. Firstly, unsupervised pre-training of the model is performed based on unlabeled battery samples. Secondly, the model is trained under supervision based on a small number of labeled samples. The experiments show that our SS-CNN method not only maintains annotation data, but also improves the CNN model’s generalization ability and the accuracy of capacity estimation.

2. Methodology

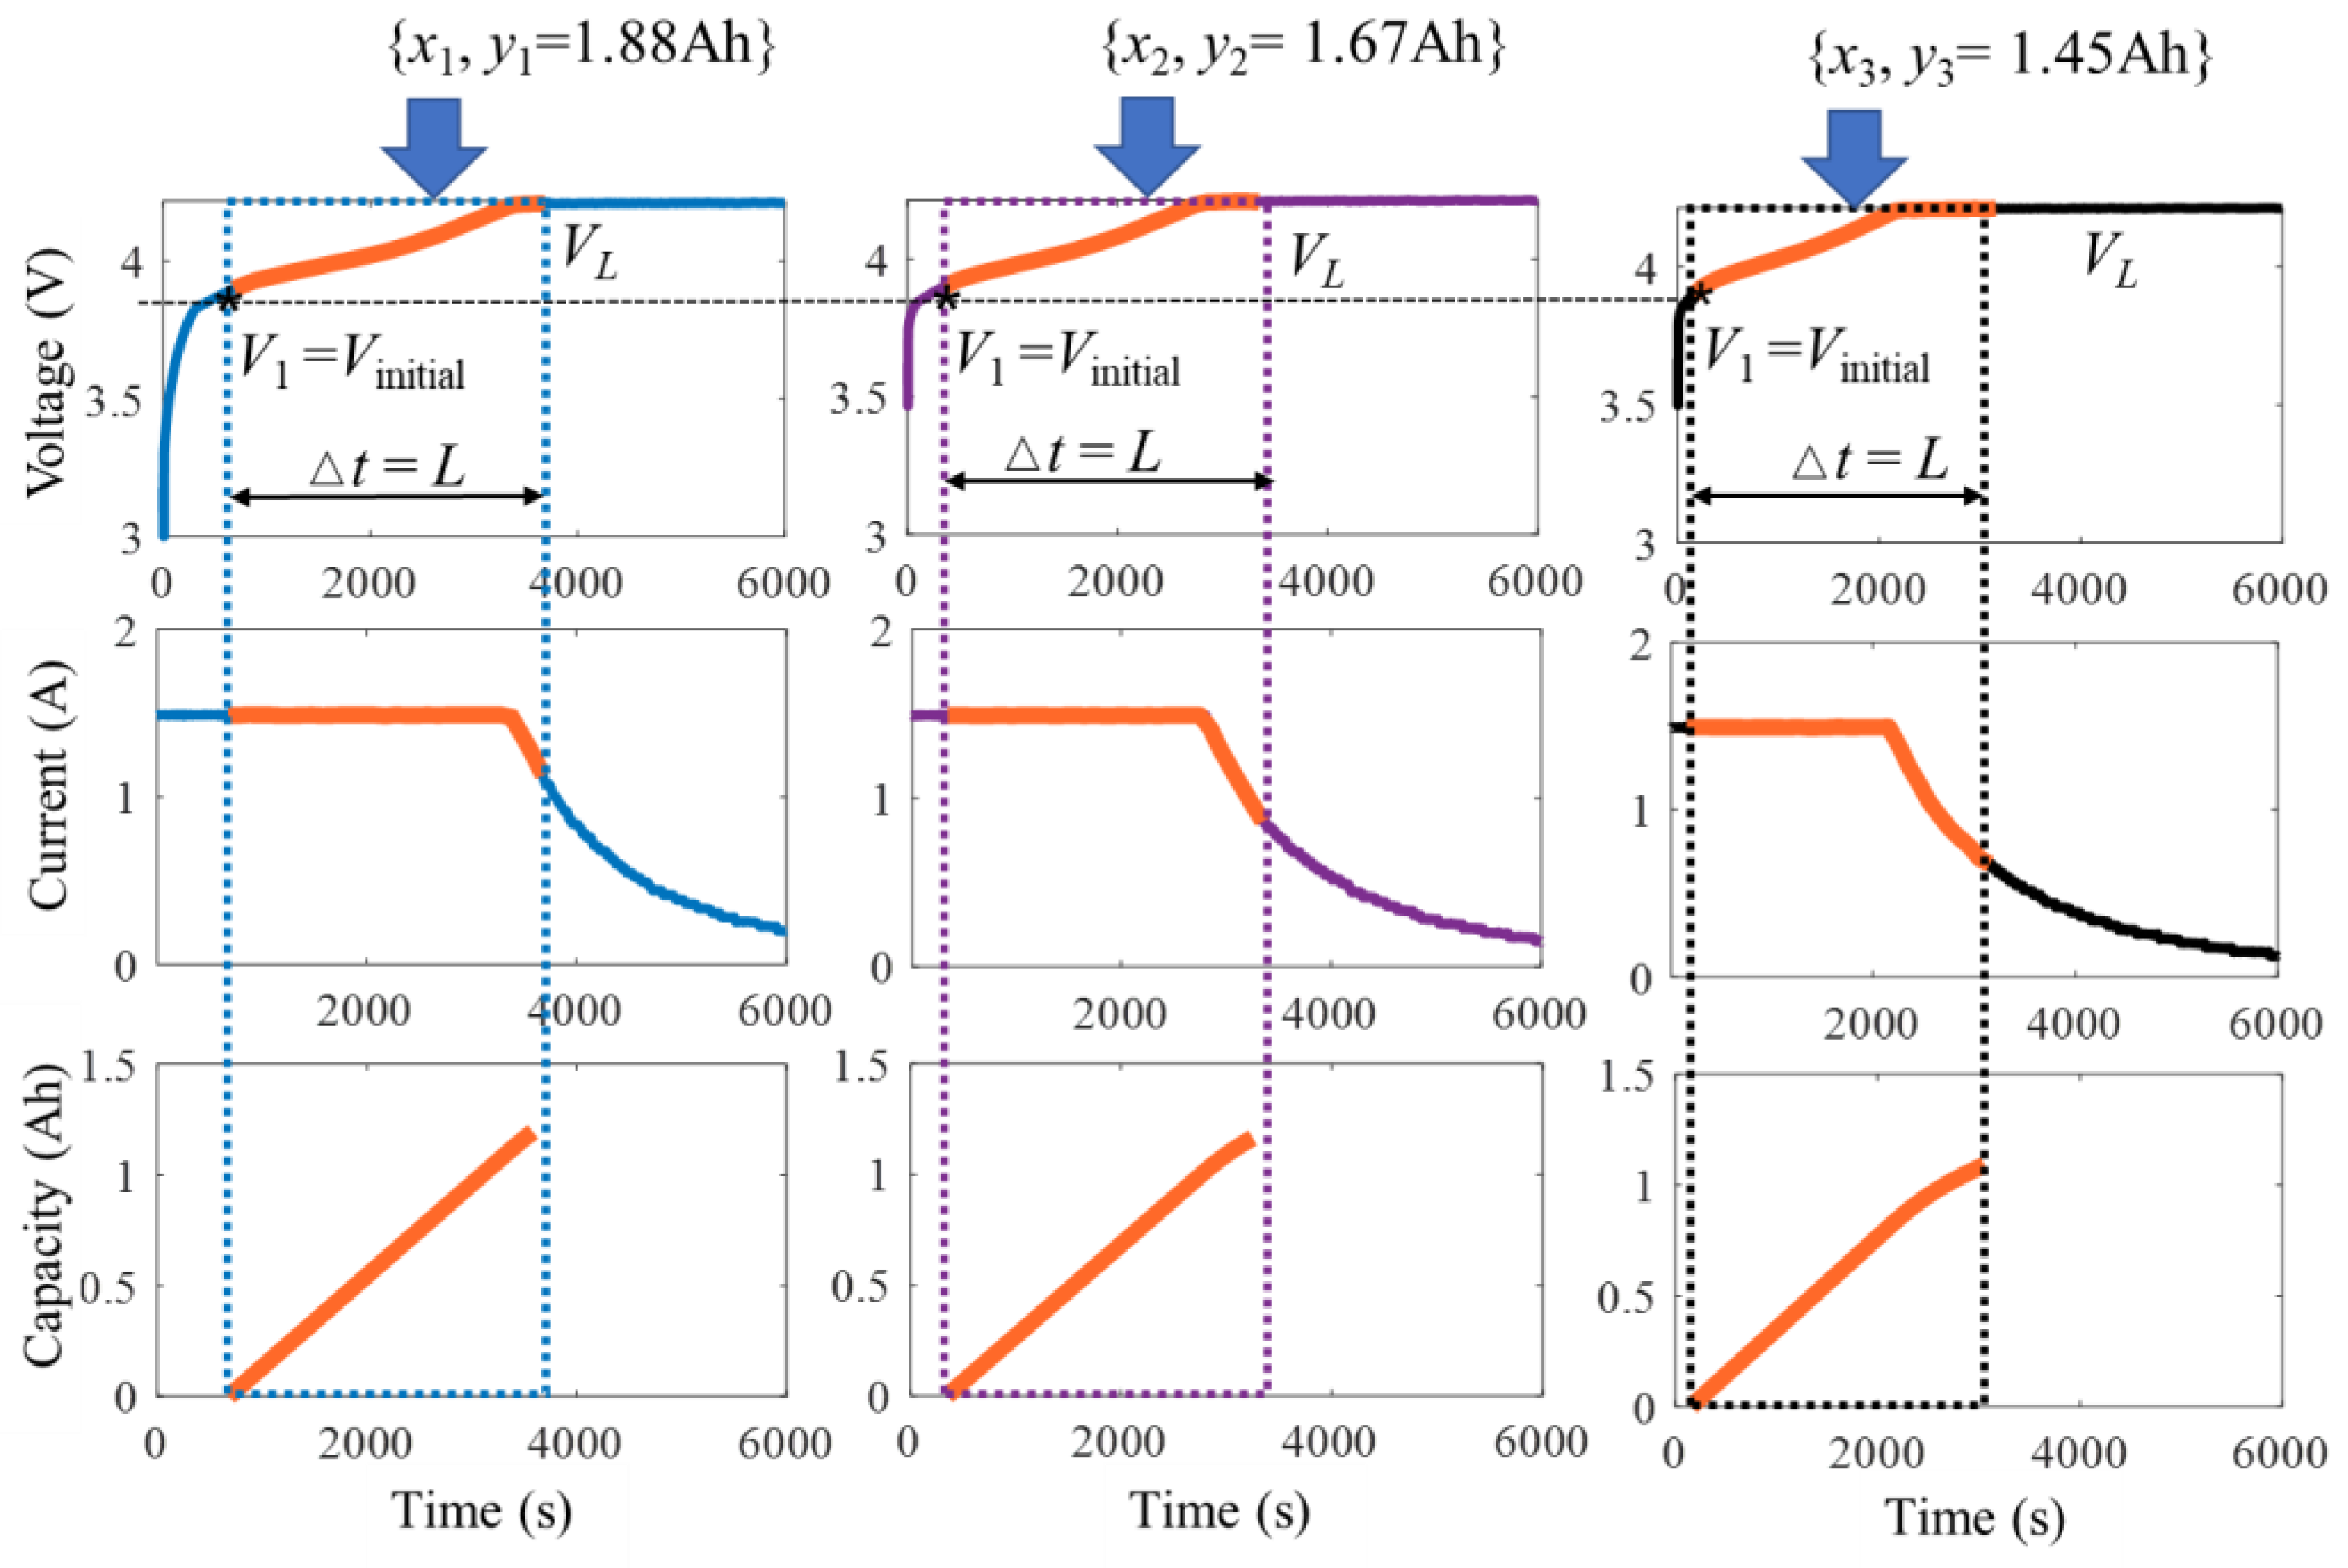
2.1. Input and Output Structures

In order to establish the lithium-ion battery capacity estimation model, it is necessary to construct the input and output vectors {xi, yi} of the SS-CNN. The output vector is the discharge capacity (i.e., yi = Qi). The input vector is obtained from the battery monitoring signal.
The battery usually works under dynamic discharging conditions, while the charging method follows a standard procedure. Therefore, we use partial charge information to construct the input vector. The structure of the input vector is shown in Figure 1. To make full use of the charging information, the voltage (V), current (I), and charging capacity (C) are used to construct the input vector. The initial voltage (V1 = Vinitial) is selected according to the depth of discharge. Then, the charging data from t1 (time corresponding to V1) to a fixed length of time interval (tL) are used to build the input vector, which is defined as:
x = [ V 1 I 1 C 1 V l I l C l V L I L C L ] L × 3
where, V l and I l are the charging voltage and current at the l time interval, respectively. C l denotes the charging capacity from t1 to tl, which is calculated using the coulomb counting method C l = t 1 t l I d t .

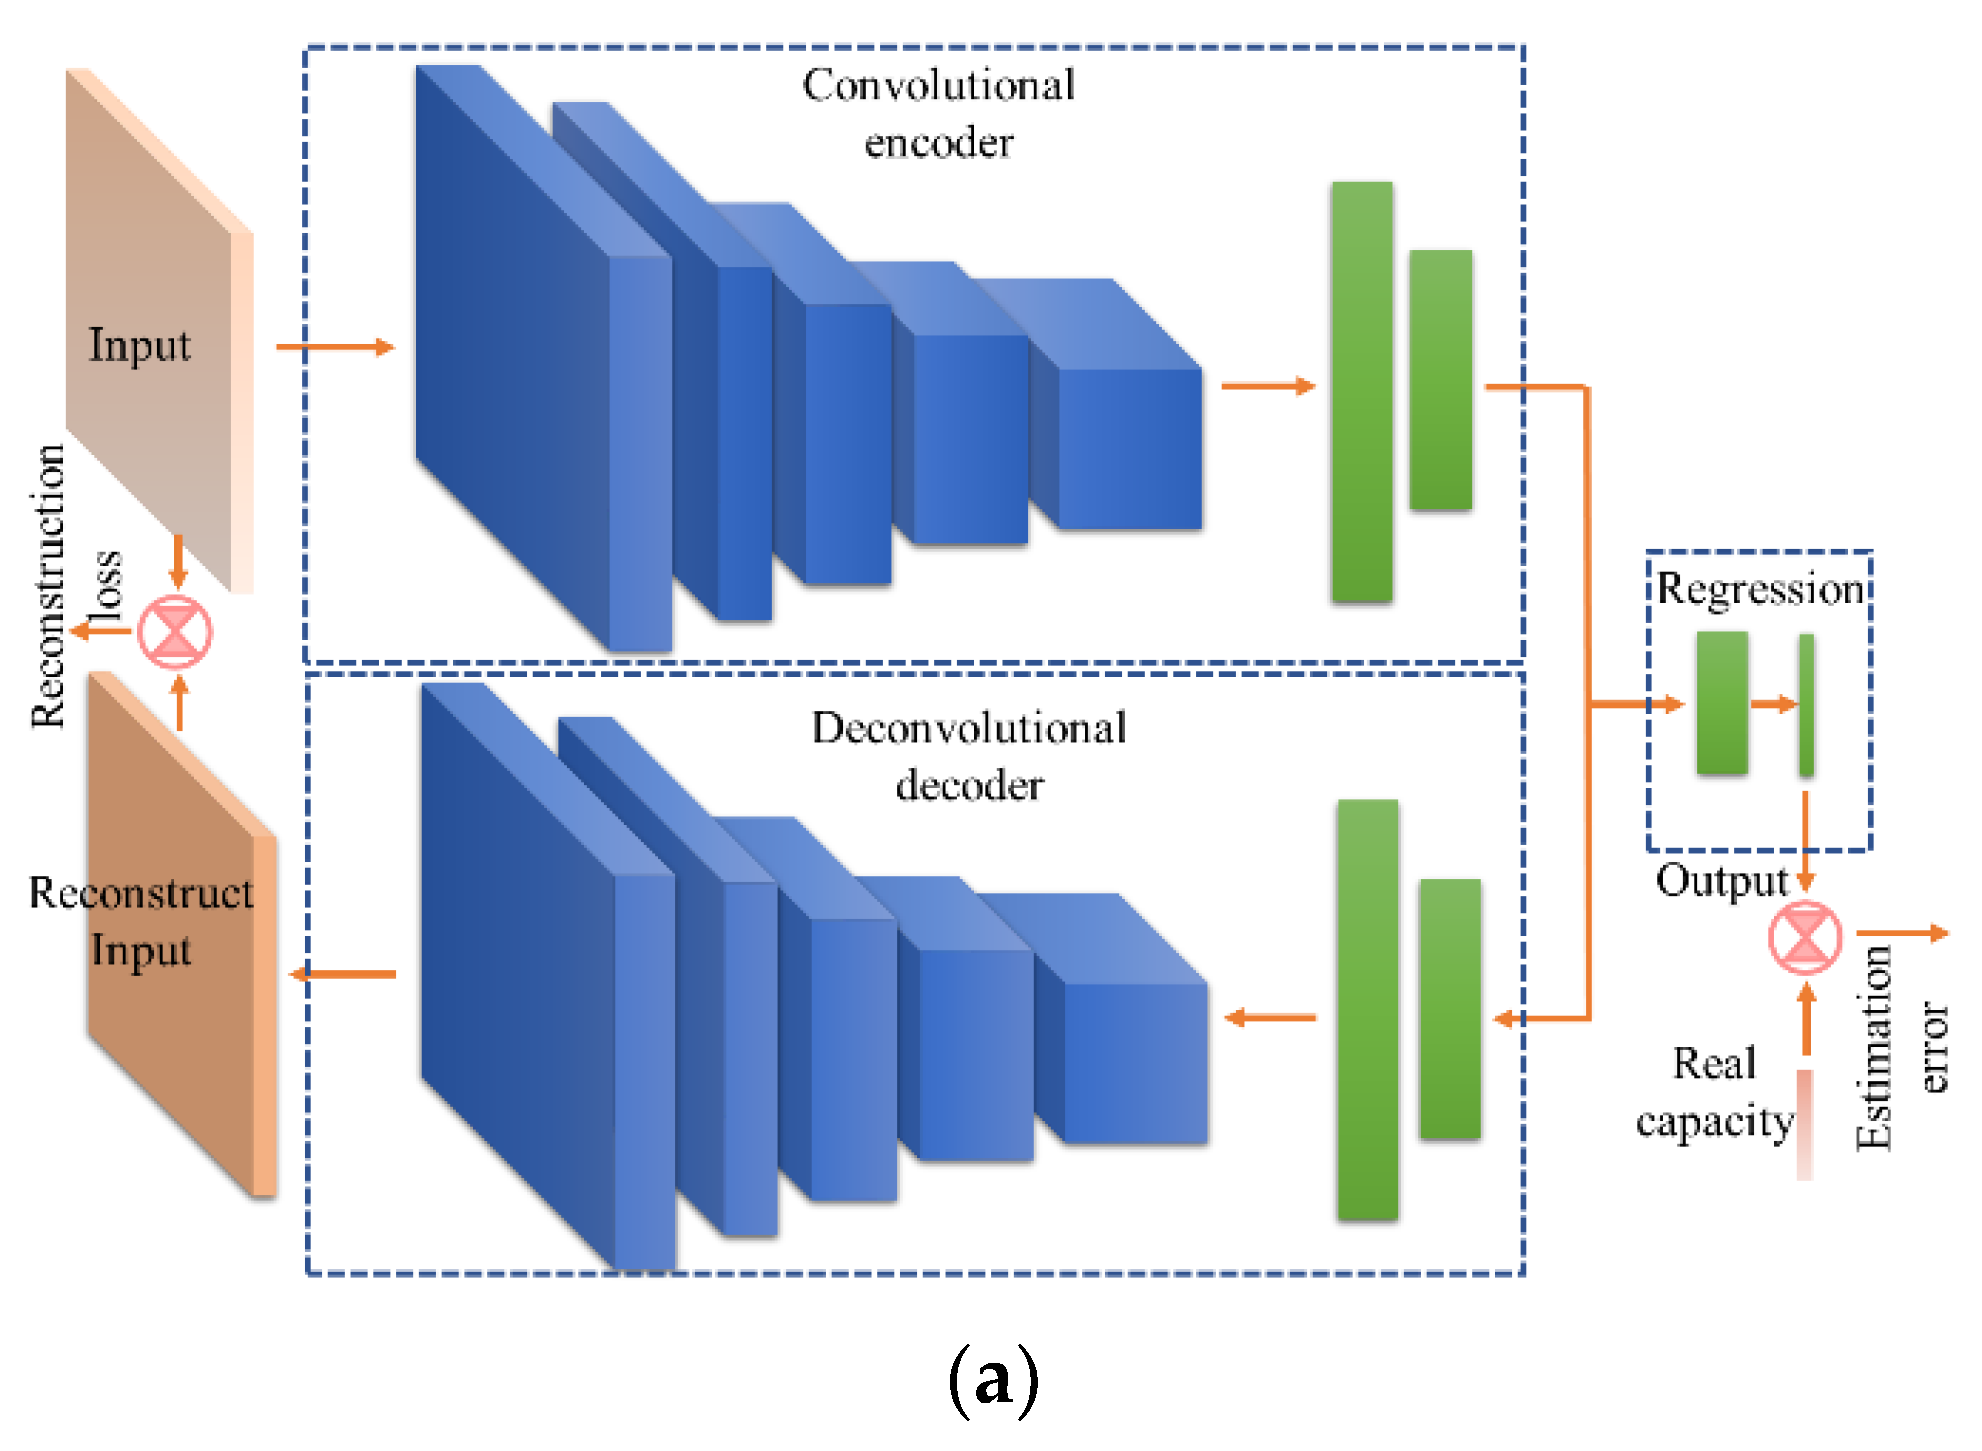
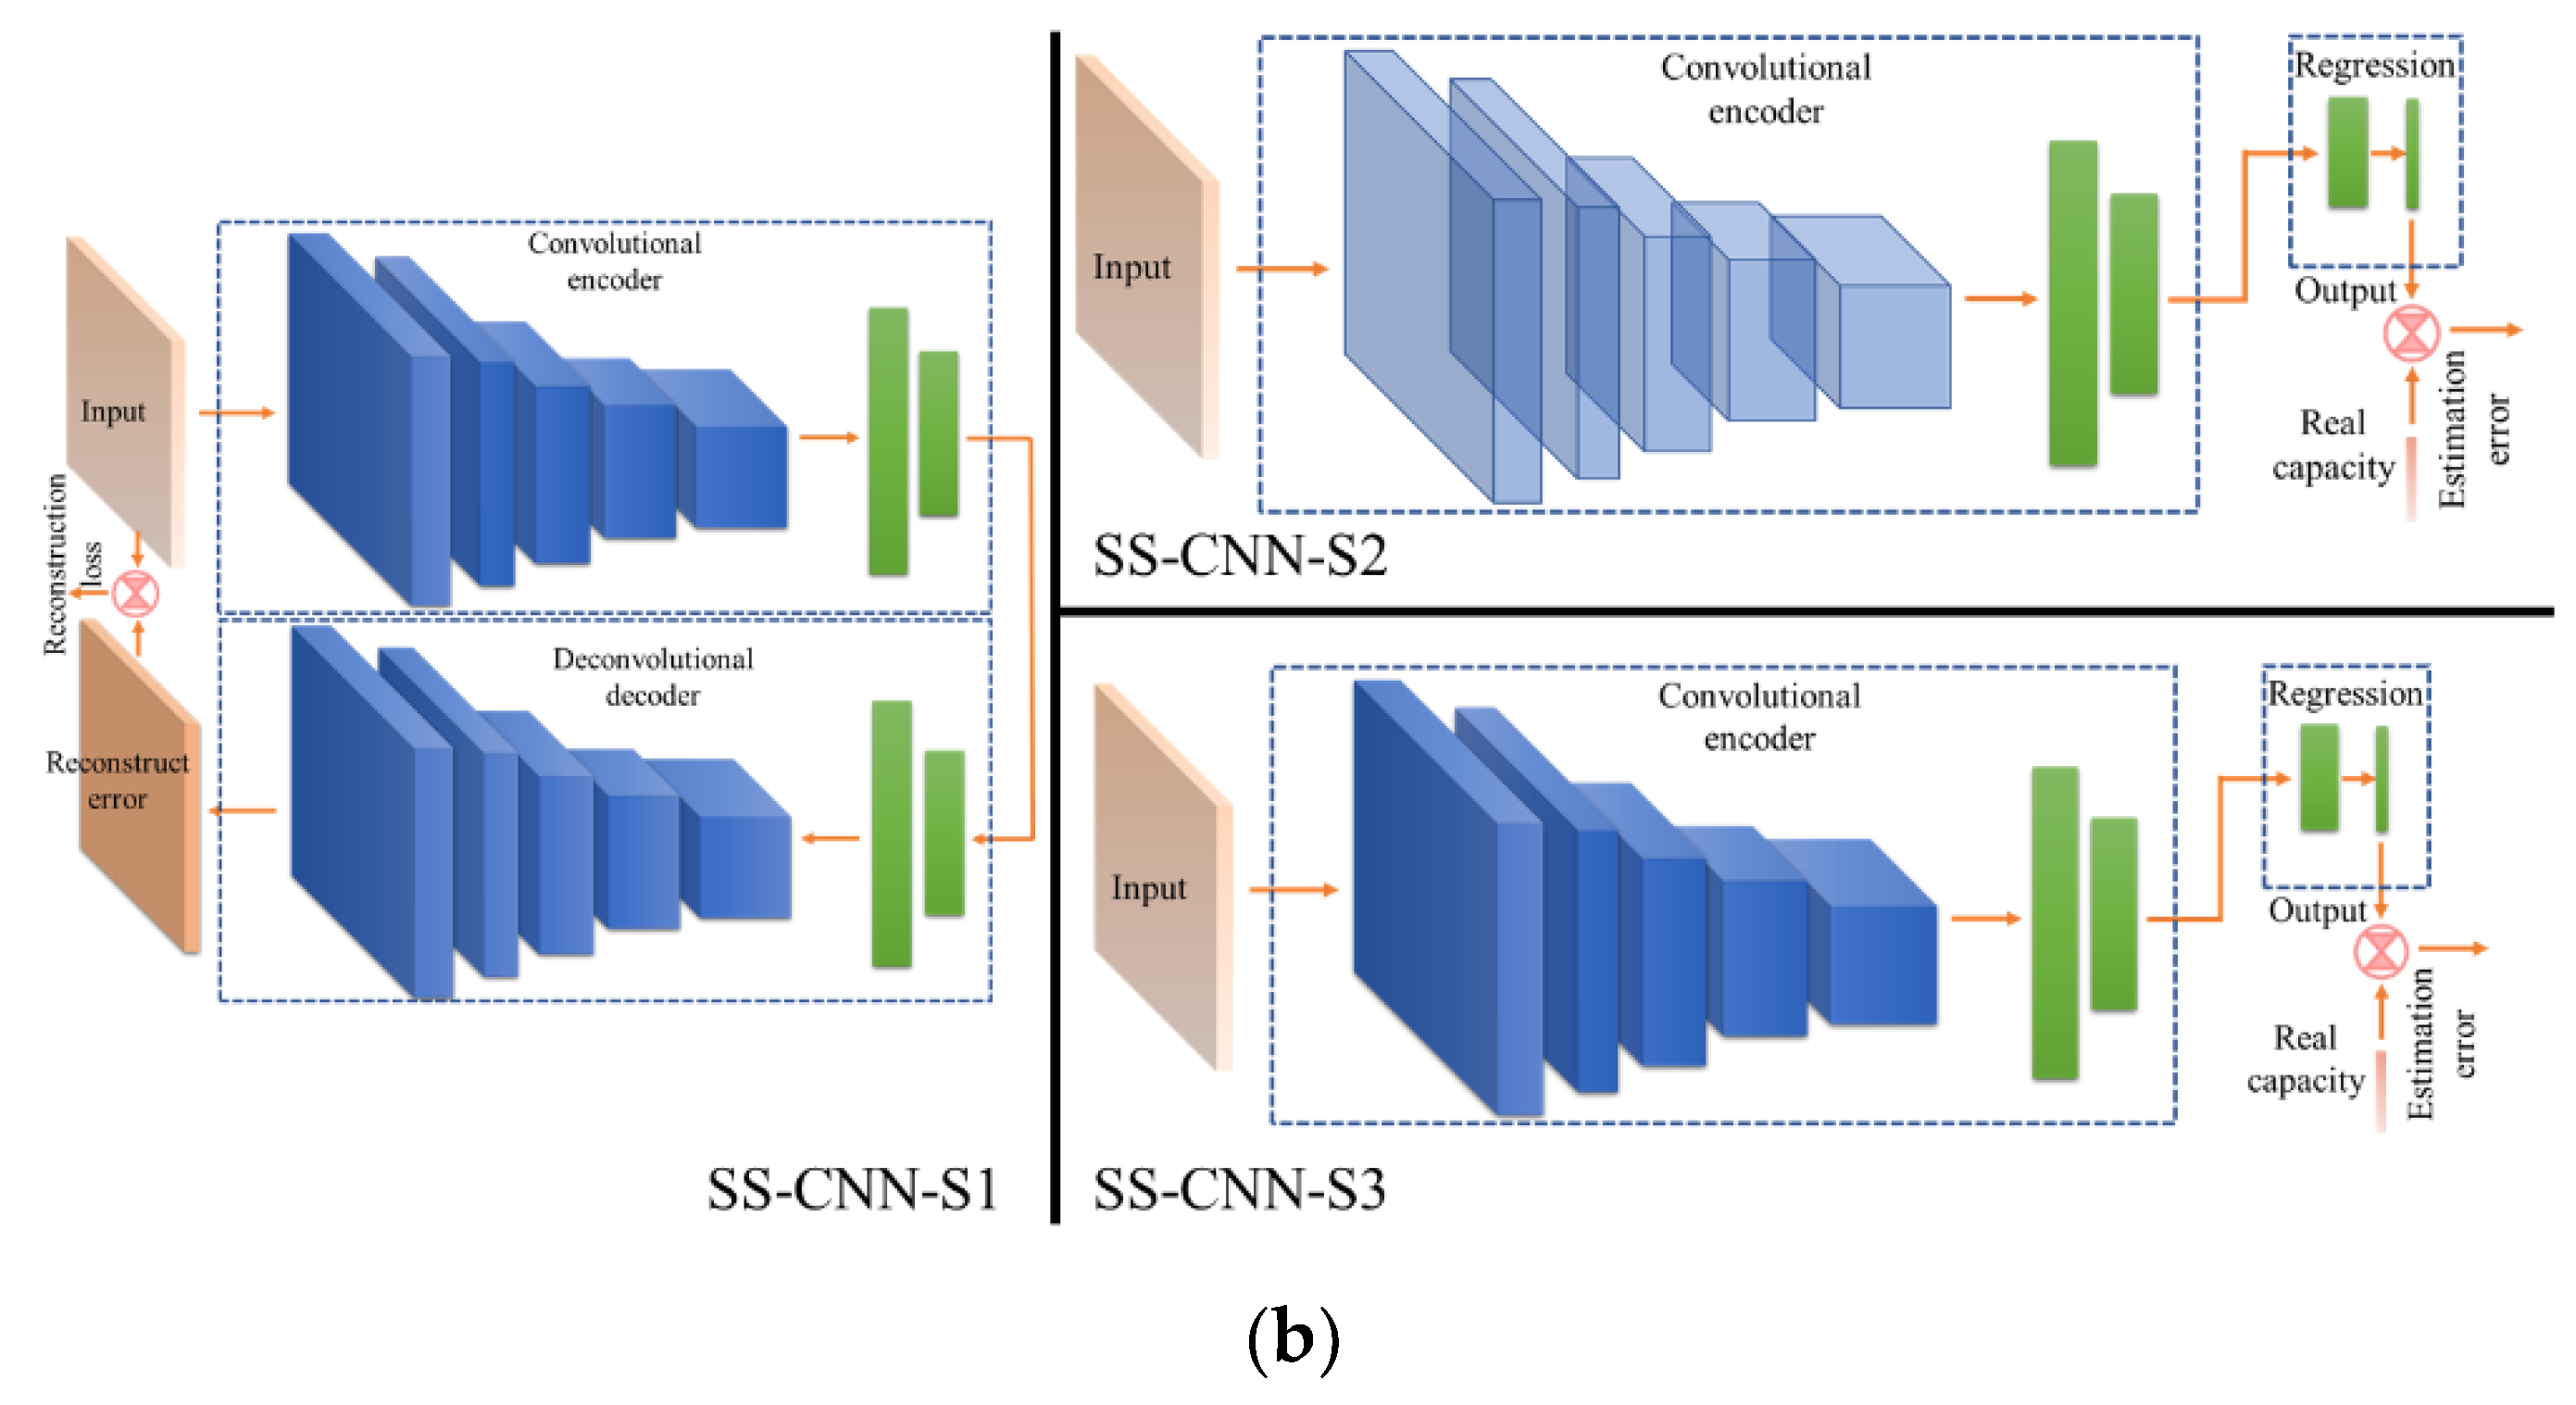
2.2. Design of the SS-CNN

The basis of the SS-CNN is a CNN. By introducing the convolution operation, which naturally supports processing on multiple input signals, CNN has better performance, especially for multi-channel input based battery capacity estimation systems.
However, the hyperparameters of the CNN are randomly initialized before training, which may lead to local optimization. Hinton et al. proposed a method to initialize the network by unsupervised pre-training, called the autoencoder model [19]. An autoencoder directly learns features by encoding and decoding the input vector, and then minimizes the error between the reconstructed and the original signal. Inspired by the unsupervised training from the autoencoder, this paper introduces the unsupervised mechanism to pre-train the CNN using a large amount of unlabeled data. The pipeline of the proposed SS-CNN is shown in Figure 2.
SS-CNN consists of three sub-networks shown in Figure 2a, i.e., a convolutional encoder, deconvolutional decoder, and regression branch. As shown in Figure 2b, the training scheme includes three steps. First, unsupervised training is performed using the convolutional encoder and deconvolutional decoder by minimizing the reconstruction error. Thus, the convolutional encoder branch can be pre-trained without using any labeled data. Then, the convolution encoder is frozen to the train regression branch using labeled data. Finally, the weights of the convolutional encoder and regression branch are fine-tuned under supervised training.
Specifically, in the SS-CNN model, supposing that the input vector is x i , the output vector is y ^ i , and y i represents the ground-truth of the output vector. The labeled dataset consists of N samples, i.e., X = { x 1 , x i , , x N } , and Y = { y 1 , y i , , y N } . The unlabeled dataset contains M samples, which has the input vector X = { x N + 1 , x N + 2 , , x N + M } . SS-CNN contains a set of convolutional layers, pooling layers and fully connected layers, which can be described by the hypothesis function h ( x i ) :
y ^ i , z i ( l ) , , z i ( l ) = h ( x i )
where z i ( l ) = { z i 1 ( l ) , z i 2 ( l ) , z i d ( l ) } denotes the outputs of the hidden layers, l represents the lth layer of the network, the parameters of the h ( x i ) need to be identified during the training process, and are composed of weights and bias. The hypothesis function can be expressed as:
h θ ¯ ( x i ) = b 0 x i ( 0 ) + ω 1 x i ( 1 ) + + ω n x i ( n )
where x i ( n ) and ω n represent the nth input and the corresponding unknown weights, respectively. b0 is the bias while x i ( 0 ) = 1 .
The training process of SS-CNN is used to identify the weights and bias of the h ( x i ) . To identify these parameters, we define the loss functions to measure the differences between the model predictions and ground-truth. Stochastic gradient descent (SGD) with momentum is used to iteratively optimize the loss functions. During each iteration, θ ¯ can be updated as:
θ ¯ j + 1 = θ ¯ j α g ^ + γ ( θ ¯ j θ ¯ j 1 ) λ α θ ¯ j
where g ^ is the gradient of , θ ¯ j is the parameter in the jth iteration, γ denotes the optimized momentum, which can accelerate the change of the gradient vector in the relevant direction. λ is the weight coefficient, α is the learning rate, which determines the step size at each iteration while moving toward the minimum of the loss function.

2.3. Design of the Training Strategy

The training process of the SS-CNN model consists of three steps: (1) unsupervised reconstruction (named as SS-CNN-S1), (2) supervised regression (named as SS-CNN-S2), and (3) supervised fine-tuning (named as SS-CNN-S3), as shown in Figure 2b. In this section, we will introduce each step and the corresponding loss functions we designed in detail.

2.3.1. Unsupervised Reconstruction

The purpose of this step is to use large amount of unlabeled data to obtain the convolutional coding branch parameters, used to extract effective features. In the reconstruction training step, the regression estimation branch is frozen. The input variable x i is convolutionally encoded to obtain the hidden variable z i , and then a deconvolutional decoder is used to reconstruct the input variable, denoted as x ^ i . The loss function s 1 is used to minimize the error between the input x i and the reconstructed input x ^ i . Then, the parameters for convolutional coding and deconvolutional decoding can be obtained. The loss function is defined as:
s 1 = x + K L + R
where, x is the reconstructed constraint term, which is used to constrain the reconstruction input x ^ i as similar as possible to the input data x i .
x = 1 N + M i = 1 N + M x ^ i x i 2
K L is the KL (Kullback–Leibler) divergence constraint term:
K L = λ K L 1 2 sum ( 1 + log ( σ 2 ) μ 2 σ 2 )
where, μ and σ are the mean and variance of the distribution which hidden variable z i is subjected to, respectively. The KL divergence can encourage the diversity of features to improve the generalization of the network. λ K L is the weight of the KL divergence constraint term.
R is the regularization term, which is used to prevent from network overfitting:
R = λ R 1 2 ω T ω
where, λ R is the weight of the regularization term.

2.3.2. Supervised Regression

In the supervised regression stage, we freeze the convolutional encoder branch and deconvolutional decoder branch to train only the regression branch. Using the trained weights of convolutional encoder branch in the last stage, input x i can be inferenced to yield hidden variable z i . As z i can yield y ^ i using regression branch, we use y ^ i and its corresponding ground-truth y i to formulate a supervised loss s 2 . Parameters of regression branch can be trained using s 2 . Note that, as the convolutional encoder branch is frozen, its parameters are not updated during training in this stage. The loss function s 2 is defined as:
s 2 = r + R
where, r is the regression term, used to constraint the network output close to ground-truth. r is defined as:
r = 1 N i = 1 N y ^ i y i 2

2.3.3. Supervised Fine-Tuning

Using the previous two training stages, the parameters of the convolutional encoder branch and regression branch are updated, respectively. In this last supervised fine-tuning stage, we use s 2 to jointly train the two branches to obtain a better regression model. Note that the deconvolutional decoder branch is not used in this stage.

3. Results and Discussion

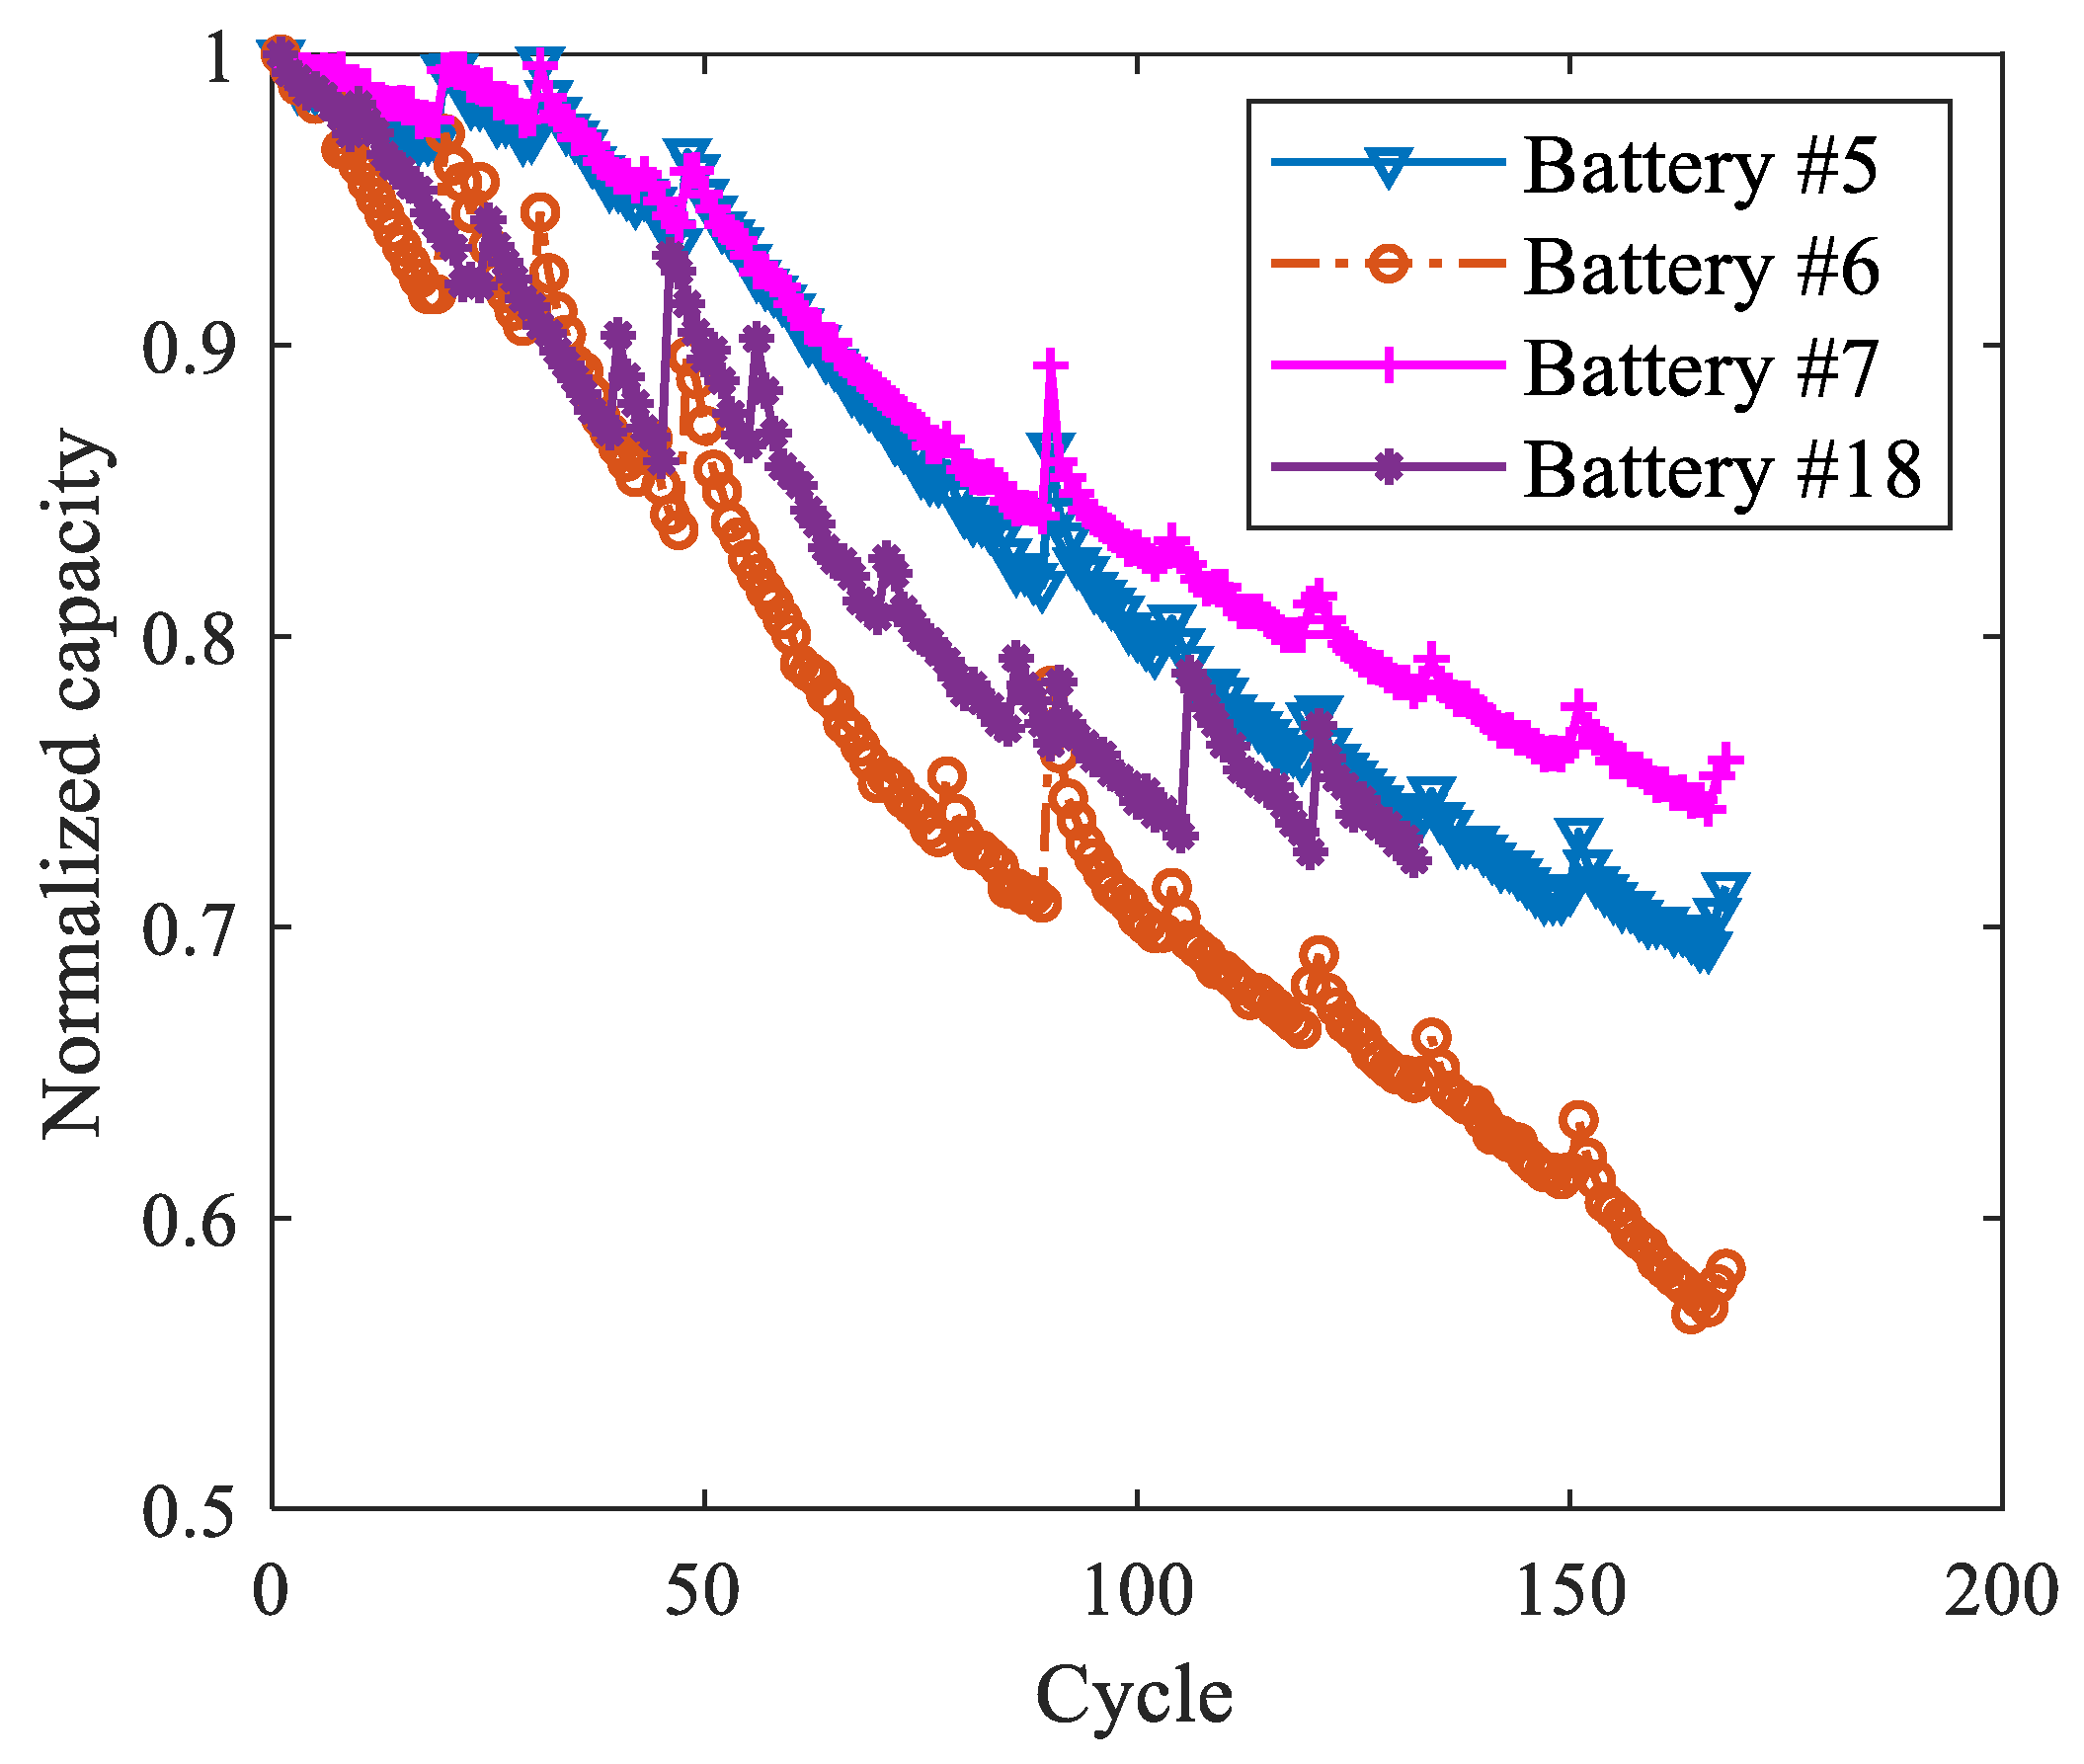
3.1. Battery Dataset

The dataset from NASA [20] is employed to investigate the performance of the SS-CNN capacity estimation model. Four sets of batteries with 2 Ah nominal capacity were cycled under different operating conditions. In our experiment, the test data from the first set with four batteries (batteries #5, #6, #7, and #18) are set as the labeled data (627 samples). These batteries were fully charged with the standard charging method, and then discharged under a 1C rate (2A) current. The discharge cut-off voltages are 2.7 V, 2.5 V, 2.2 V, and 2.5 V, respectively. The discharge capacity is calculated to 2.7 V as the ground-truth. The change of the battery capacity with the cycle is shown in Figure 3. The remaining three sets of battery data are utilized as the unlabeled samples (747 samples), which means only the battery charging current and voltage are known while the discharge capacity under each cycle is unknown.

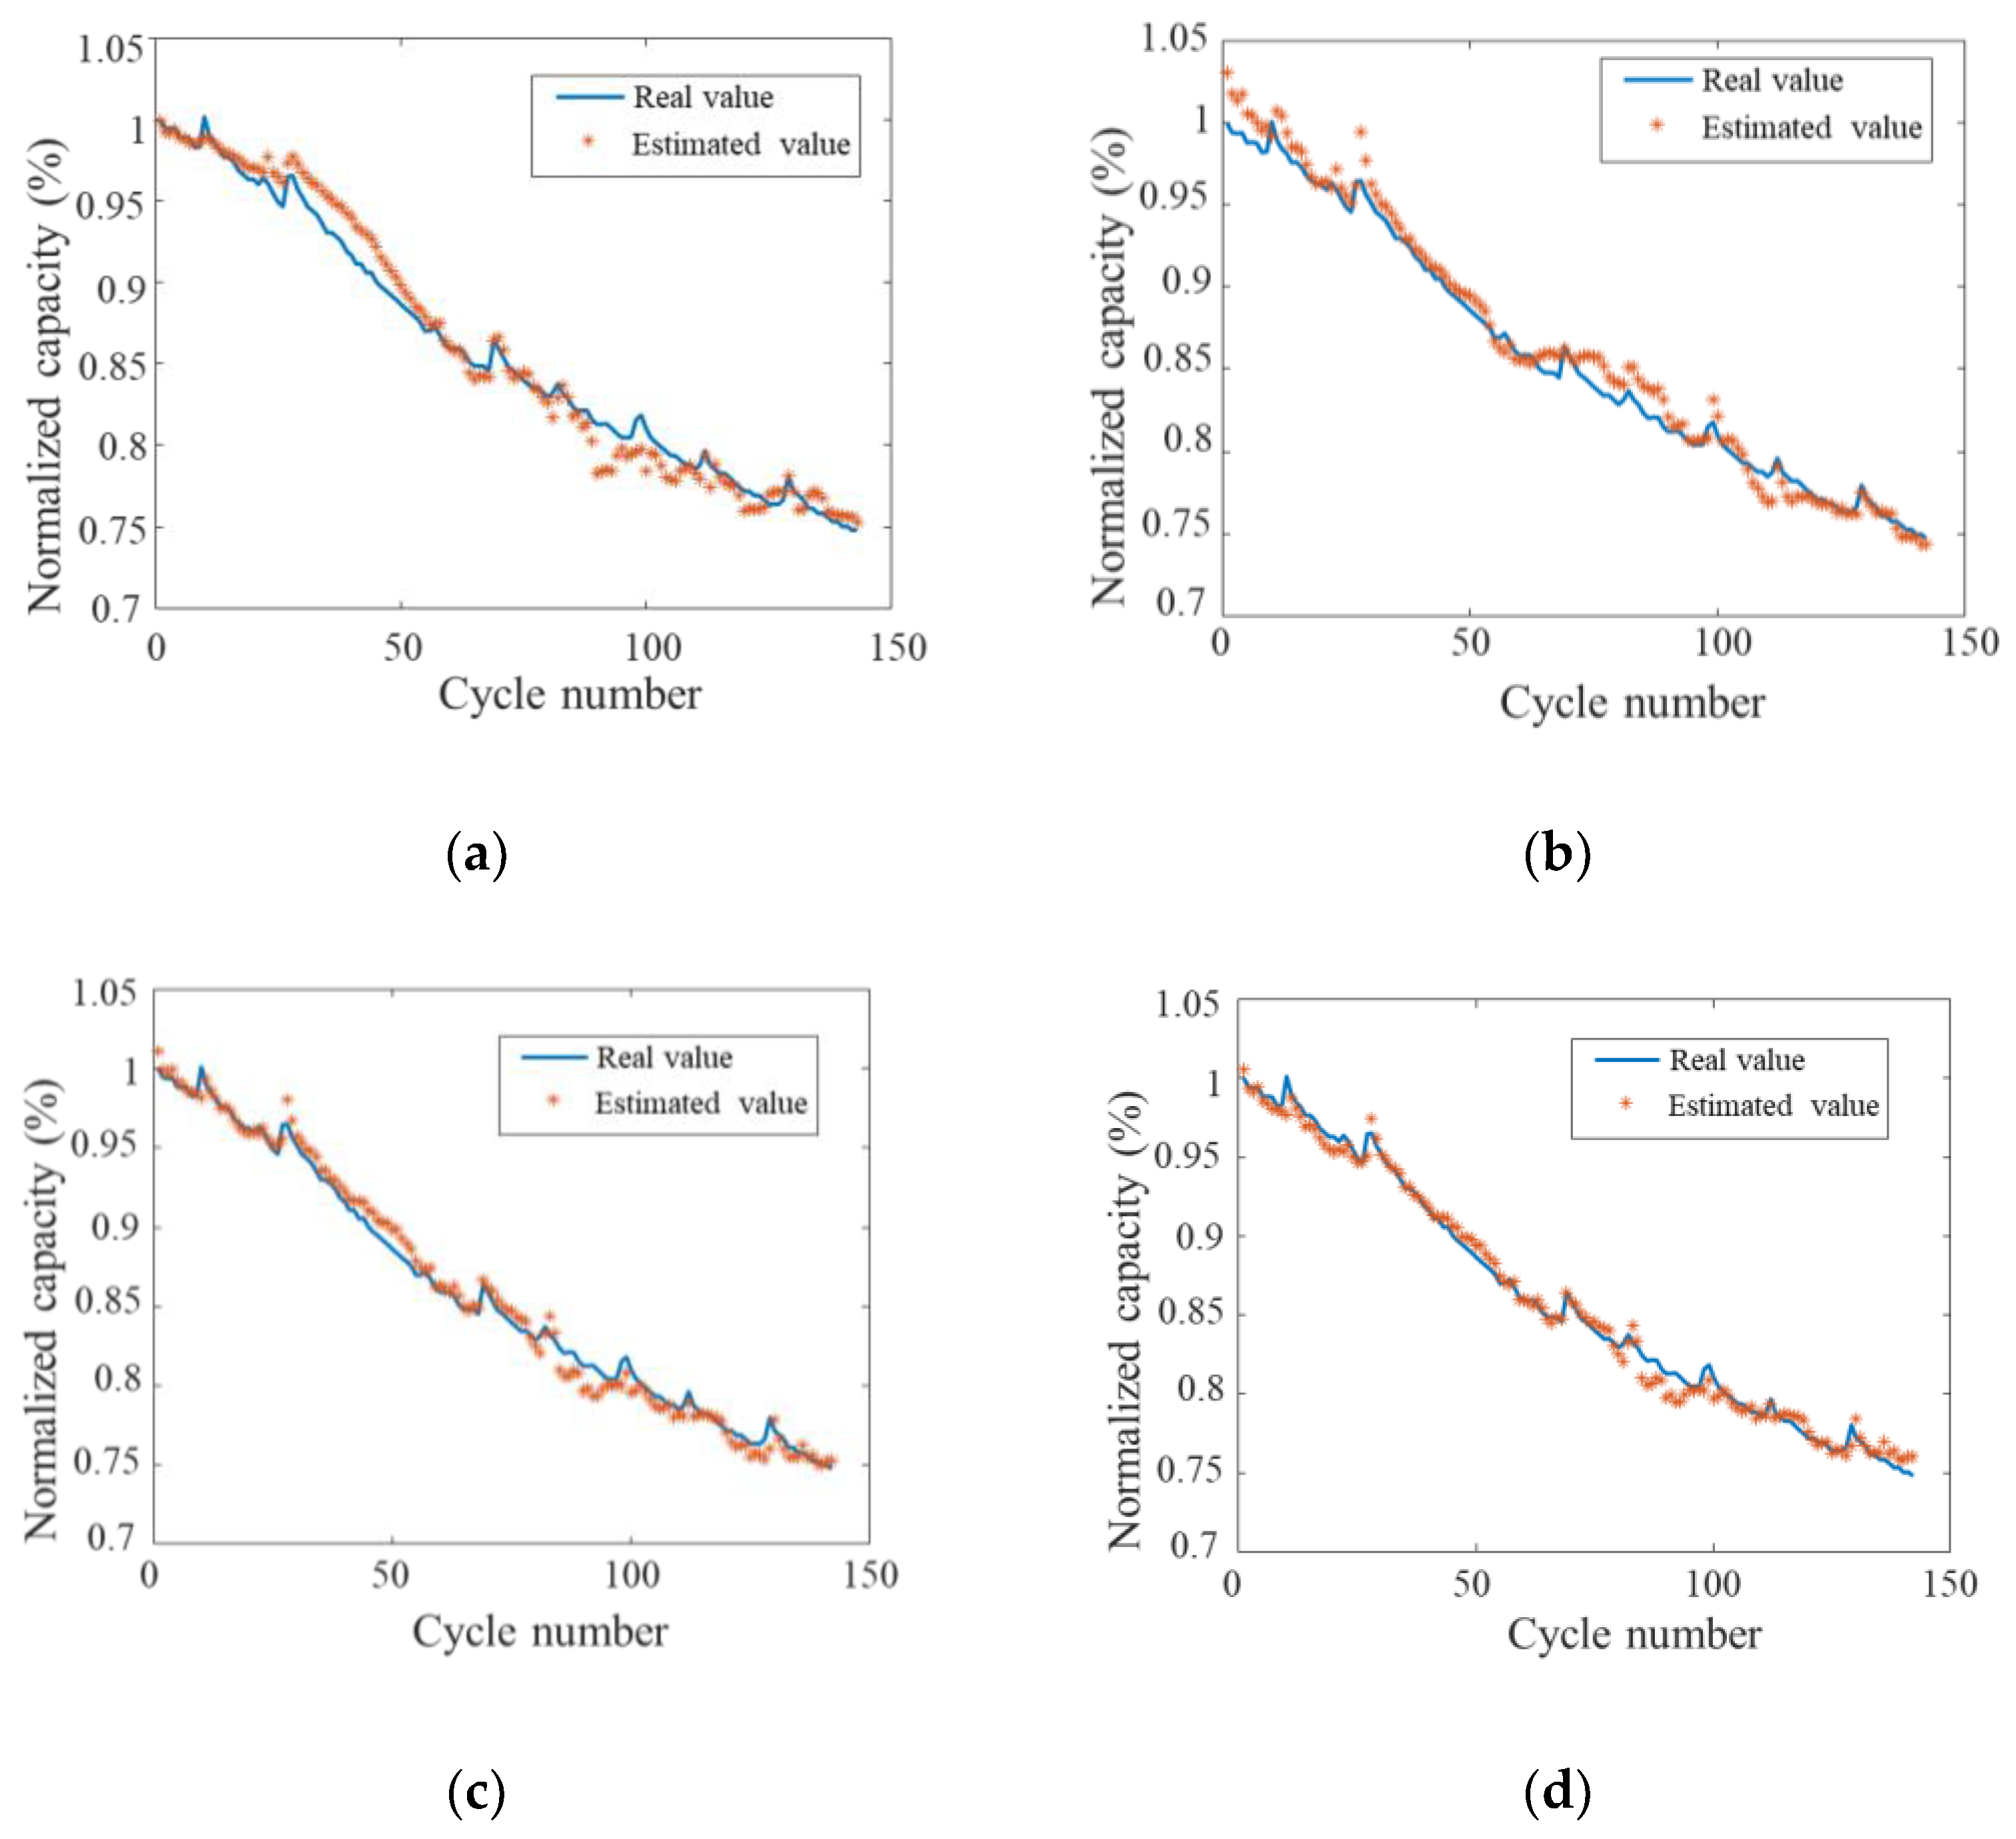
3.2. Capacity Estimation Results

In order to evaluate the performance of the SS-CNN capacity estimation method, the artificial neural network (NN) and conventional CNN are also implemented to compare with SS-CNN. Considering the operating range and overall sampling data, the starting charging voltage is selected as 3.8 V. The subsequent 3000 s voltage, current, and capacity data are used as the model input. Thus, the size of the input for CNN and SS-CNN are both 3000 × 3. The structure for the CNN is consistent with the SS-CNN, but without semi-supervised branches. For the NN model, two hidden layers are used, and the network structure is 9000-(256-128)-1. The learning rate for NN and CNN is 0.01, the number of iterations is 35, and the batch size is 64. The cross-validation method is used for a performance analysis, that is, one battery among all the four batteries (batteries #5, #6, #7, and #18) is selected as the test sample, and the remaining three batteries are used as the labeled training sample. For the SS-CNN model, additional unlabeled training samples are used to pre-train the network training. The average value of 10 repetitions is calculated as the final result for all methods. Root mean square errors (RMSE), mean absolute error (MAE), and maximum relative error (MaxRE) are utilized to evaluate the capacity estimation performance. The expressions of these metrics are shown as follows:
RMSE = 1 n i = 1 n ( Q i , true Q i , est ) 2
MAE = 1 n i = 1 n | Q i , true Q i , est |
MaxRE = max ( | Q i , true Q i , est Q i , true | × 100 % )
where, Q i , est is the average estimation value of 10 repetitions, Q i , true is the true capacity value, and n is the number of samples.
The capacity estimation results for the three methods are listed in Table 1, and the estimation results for battery #7 are shown in Figure 4. According to Table 1 and Figure 4, all methods can accurately estimate the capacity for different batteries, which verifies the effectiveness of capacity estimation based on partial charge information. The capacity estimation results based on CNN and SS-CNN outperform the NN model for the same battery. For example, for battery #5, the RMSE based on NN model is 1.2983%, while the RMSEs for CNN and SS-CNN are 1.1349% and 0.7382%, respectively. These results indicate that, compared to the artificial neural network, deep networks can extract the hidden features better, thereby improving the accuracy of capacity estimation. Furthermore, the SS-CNN-S2 model is effectively achieved through unsupervised and supervised training, so the estimation error is smaller than the CNN model which only uses label training data. In addition, compared with the SS-CNN-S2 stage, the SS-CNN-S3 stage adds a fine-tuning training step, which further improves the estimation performance.

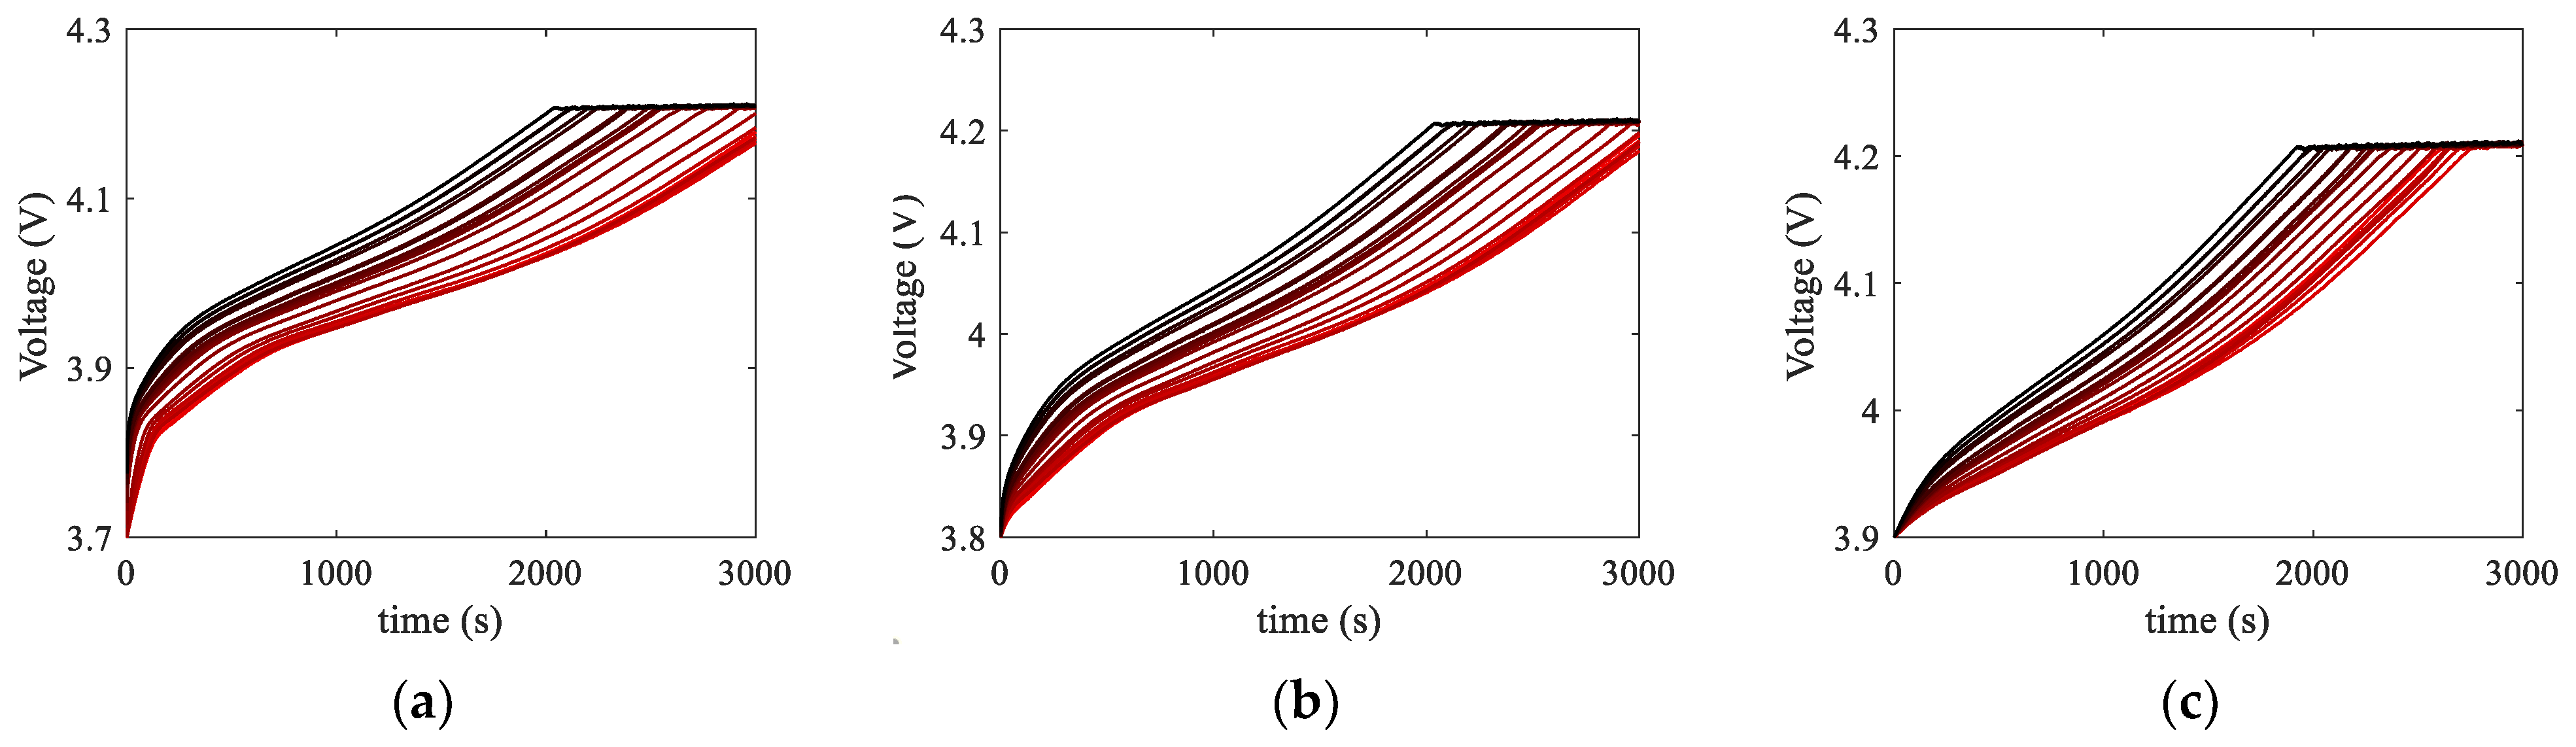
3.3. Effect of the Starting Charge Voltage

Lithium-ion batteries usually work under partial discharge conditions, which means the starting charge voltage used to construct the input vector varies under practical applications. Therefore, the effect of the starting charging voltage on the estimation results is investigated. Different starting voltages (3.7 V, 3.75 V, 3.8 V, 3.85 V, and 3.9 V) are selected to represent different depths of discharge before charging. Then, the corresponding input vector of the model is constructed to estimate the capacity. Table 2 shows the capacity estimation results for battery #7 based on different charging starting voltages.
It can be seen from Table 2 that the MaxRE among all different starting charging voltages is 3.5384%, which is less than 5%. This means the proposed method can accurately estimate the battery capacity regardless of whether the battery is under deep or shallow discharge conditions. However, the overall performance with 3.7–3.8 V is better than that with 3.85–3.9 V. To further explain this, Figure 5 shows the evolution of the voltage curves over the life of the battery with 3.7 V, 3.8 V, and 3.9 V as the starting voltages, respectively. The colors range from light to dark as the capacity decreases. When the starting voltages are 3.7 V and 3.8 V, most of the voltage information used to construct the input vector originates from the constant current charging step, and the voltage curve changes significantly with the decrease in the capacity. However, the voltage curves have relatively small changes with the starting voltage of 3.9 V. This indicates that phase transitions of the battery electrodes may occur during the constant current charging step, which is closely related to the battery degradation [21]. Hence, the constant current charging voltage is regarded as an important area for identifying the battery degradation, which provides better performance when starting voltage is less than 3.8 V.

3.4. Effect of the Training Sample Size

The key objective of our proposed SS-CNN is to pre-train the model with a large amount of unlabeled data, and then to train the model using the relatively small amount of labeled data. Thus, to thoroughly investigate the performance of the proposed SS-CNN model, we trained the model with different size of labeled and unlabeled samples.

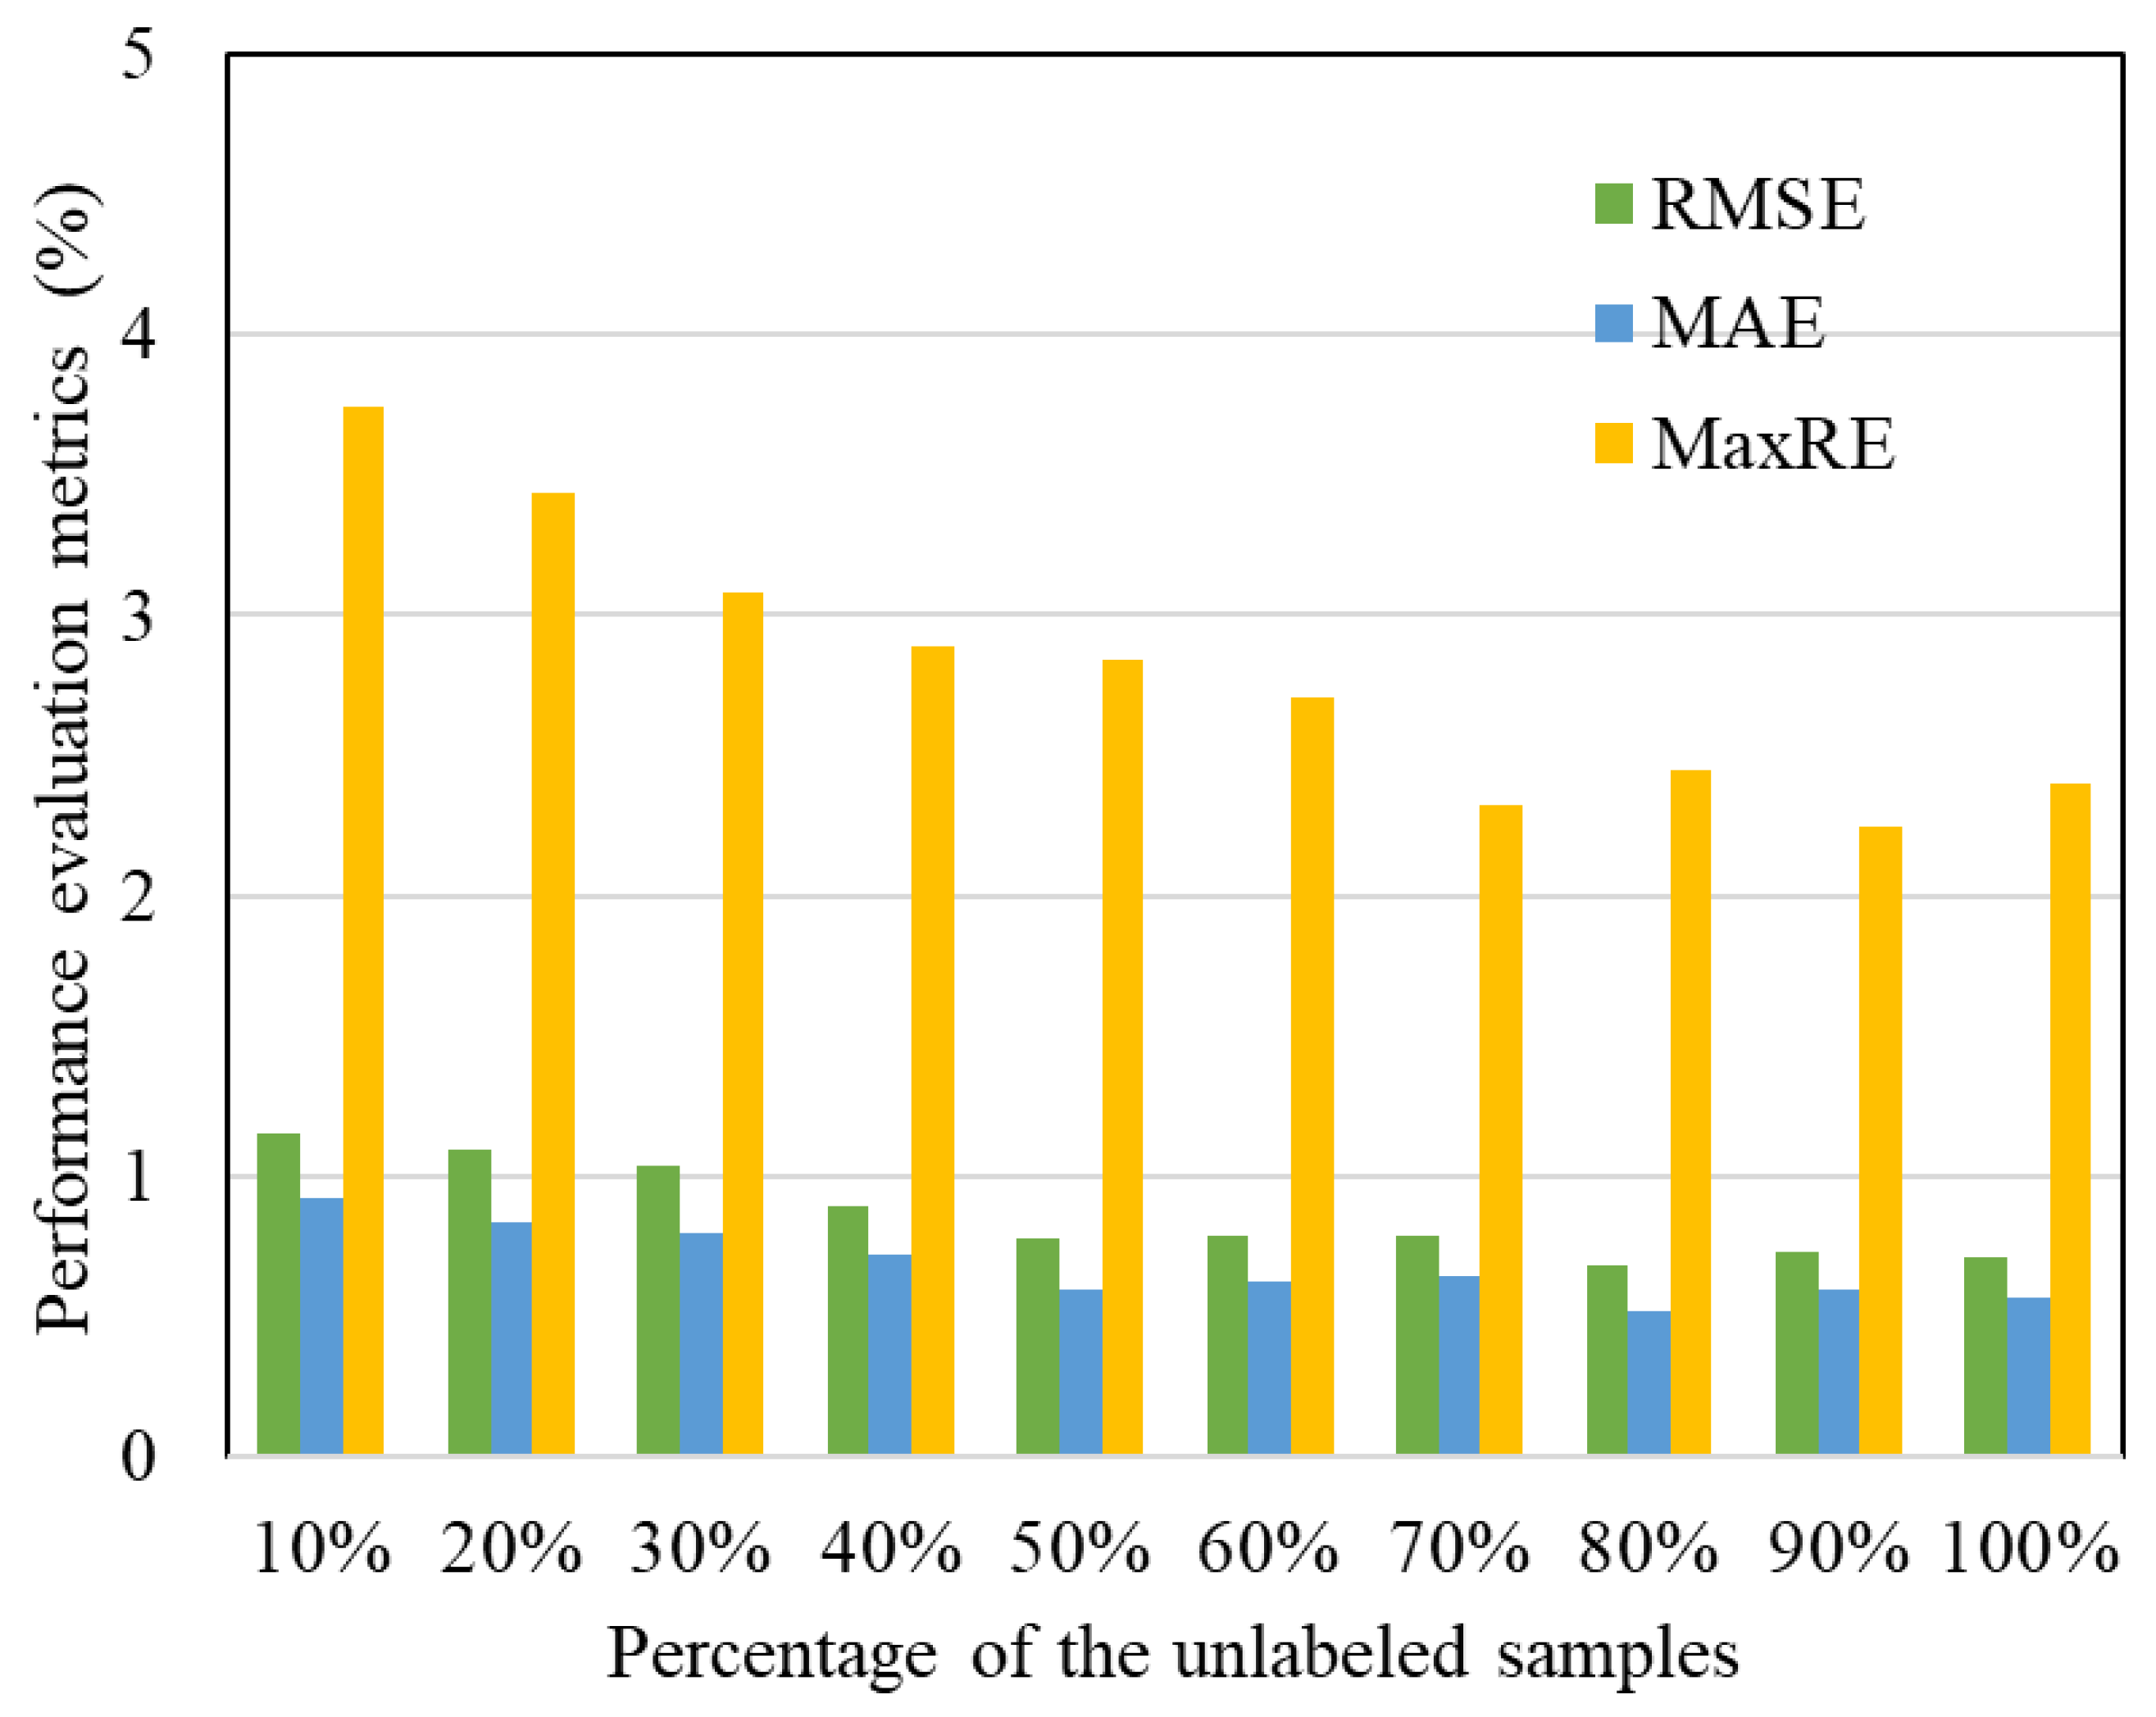
3.4.1. Different Sizes of Unlabeled Samples

We randomly selected 10%, 20%, …, 100% of the total unlabeled samples to pre-train the model, respectively. Then, for each model, the supervised training was performed based on all the labeled samples. The effect of the unlabeled sample size on the overall test performance is shown in Figure 6. It can be seen that, with the increase of the unlabeled sample size, the capacity estimation performance clearly improves. This suggests that better latent features can be extracted in the convolutional encoder–decoder with unlabeled samples. Thus, more unlabeled samples bring better latent features and finally higher capacity estimation accuracy. However, the increase of unlabeled data has an upper limit. In our experiments, along with the percentage of the unlabeled samples increasing, we found that the capacity estimation error reaches the lower bound with small shaking when unlabeled samples are over 60%. Since the unlabeled samples mainly contribute to the latent features extraction, samples become redundant but present with noises when the latent features are well extracted.

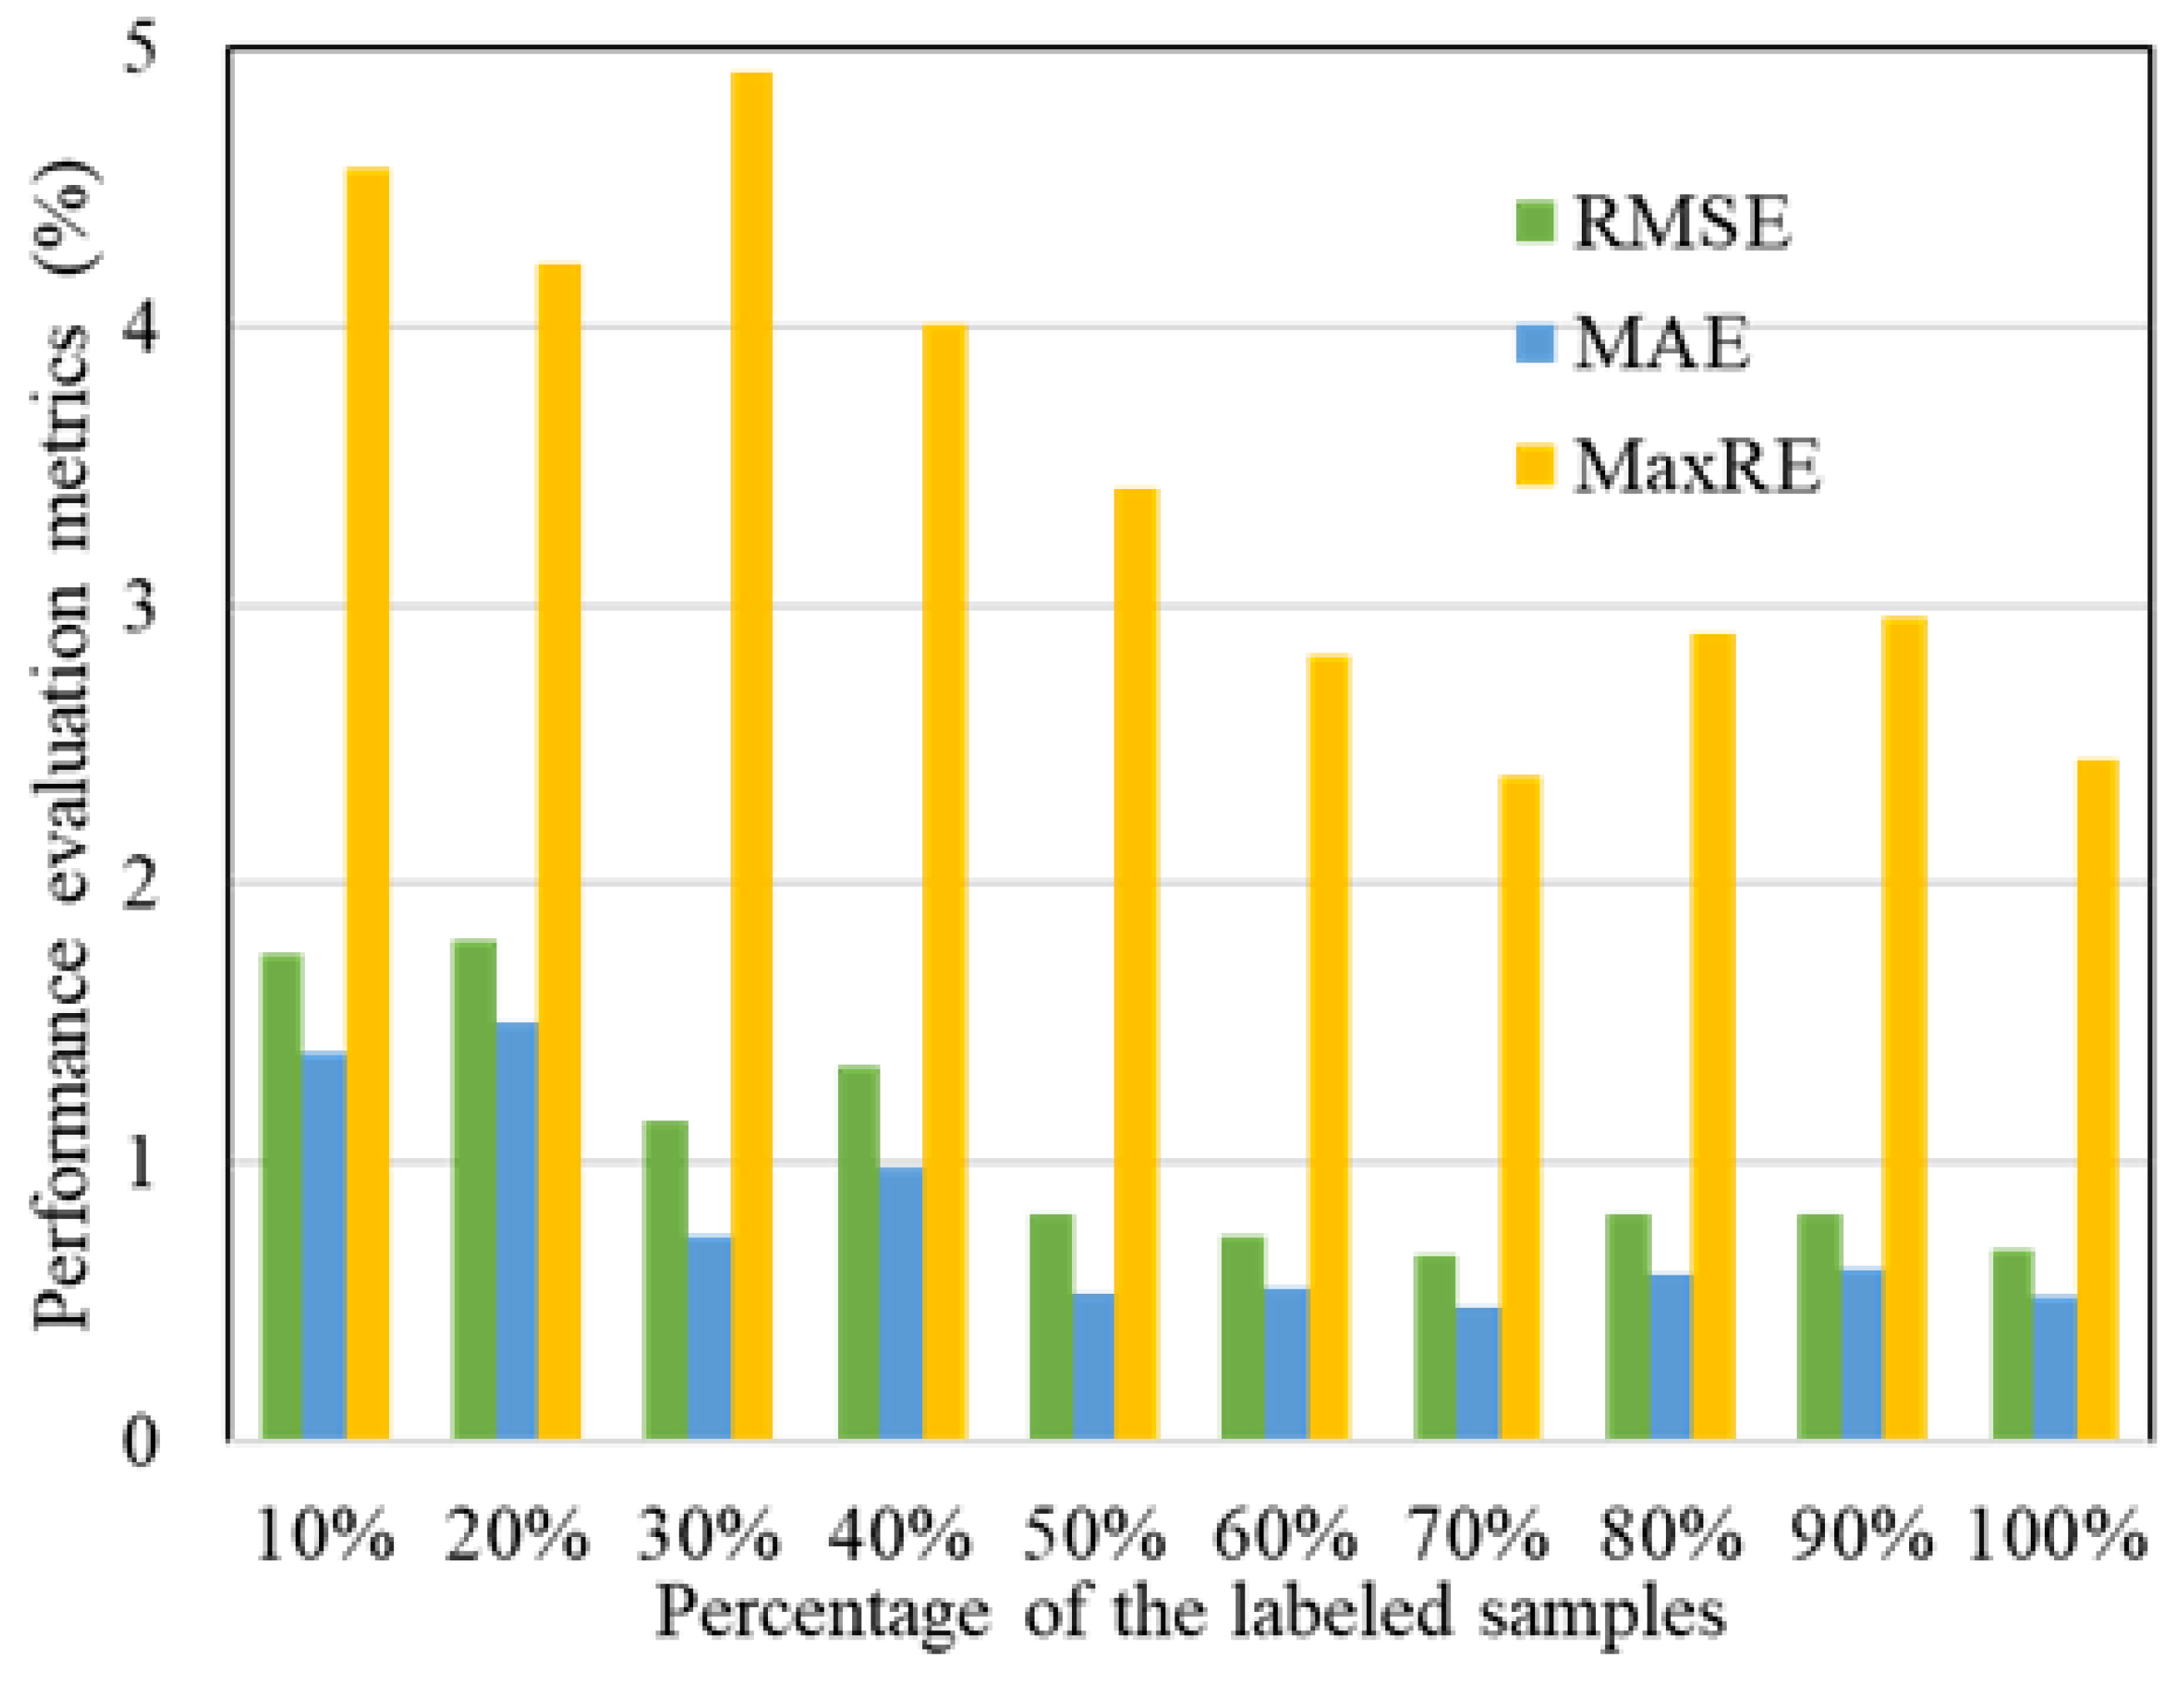
3.4.2. Different Sizes of Labeled Samples

To study the effectiveness of labeled sample size, we randomly selected 10%, 20%, …, 100% of the total labeled samples for supervised training. Figure 7 shows the capacity estimation results based on different labeled samples. It can be seen from Figure 7 that a satisfactory accuracy (MaxRE less than 5%) can be obtained even with 10% labeled samples (63 sets of samples). These results further demonstrate that unsupervised training, based on unlabeled samples, can effectively train the convolutional network for extracting battery degradation features. Therefore, only a small number of labeled samples are required for subsequent training.
When the labeled sample size increases from 10% to 70%, the capacity estimation error correspondingly decreases, indicating that more labeled samples can effectively improve the generalization of the model. When the labeled sample exceeds 70%, the capacity estimation performance shows a fluctuating trend with increasing samples. This may be caused by the inherent differences between the training batteries and test batteries. In addition, the cut-off voltage of the four batteries during the cycling test are also different. Thus, employing too many labeled samples may also introduce random errors to model training, and may prevent further improvements of the model.

4. Conclusions

This paper proposed a capacity estimation method for lithium-ion batteries, based on partial charge information and SS-CNN. The main contributions of this method are as follows: (1) By taking the incomplete charging and discharging state of lithium-ion battery into account, a partial charge information selection method is proposed to construct the capacity estimation model input, which not only considers the actual working conditions, but also avoids the inconsistency of the input data shape under different states; (2) In view of the uncertainty and complexity in the traditional feature extraction process, the advantages of a CNN deep learning network in automatic feature extraction are fully utilized. The feature information, related to battery degradation, is directly mined from the original charging data. Then, the relationship between the original charging information and capacity is automatically constructed; (3) Considering the problem of small-battery capacity annotated samples in practical application, the concept of unsupervised learning is integrated into CNN. Combined with the unsupervised pre-training of the auto-encoder and the supervised regression branch, our method outperforms typical CNN with regard to generalization ability and the accuracy of capacity estimation.

Author Contributions

Conceptualization, Y.W. and W.L.; methodology, Y.W. and W.L.; software, W.L.; validation, Y.W. and W.L.; formal analysis, Y.W.; investigation, Y.W.; resources, Y.W.; data curation, Y.W.; writing—original draft preparation, Y.W.; writing—review and editing, W.L.; visualization, Y.W.; supervision, W.L.; project administration, Y.W.; funding acquisition, Y.W. All authors have read and agreed to the published version of the manuscript.

Funding

This research was funded by the Natural Science Foundation of Jiangsu Province, grant number BK2021060; and NUPTSF, grant number NY220143.

Conflicts of Interest

The authors declare no conflict of interest. The funders had no role in the design of the study; in the collection, analyses, or interpretation of data; in the writing of the manuscript, or in the decision to publish the results.

References

  1. Dai, H.; Jiang, B.; Hu, X.; Lin, X.; Wei, X.; Pecht, M. Advanced battery management strategies for a sustainable energy future: Multilayer design concepts and research trends. Renew. Sustain. Energy Rev. 2021, 138, 110480. [Google Scholar] [CrossRef]
  2. Hossain Lipu, M.S.; Hannan, M.A.; Karim, T.F.; Hussain, A.; Saad, M.H.M.; Ayob, A.; Miah, M.S.; Indra Mahlia, T.M. Intelligent algorithms and control strategies for battery management system in electric vehicles: Progress, challenges and future outlook. J. Clean. Prod. 2021, 292, 126044. [Google Scholar] [CrossRef]
  3. Sarmah, S.B.; Kalita, P.; Garg, A.; Niu, X.D.; Zhang, X.W.; Peng, X.; Bhattacharjee, D. A review of state of health estimation of energy storage systems: Challenges and possible solutions for futuristic applications of li-ion battery packs in electric vehicles. J. Electrochem. Energy Convers. Storage 2019, 16, 40801. [Google Scholar] [CrossRef] [Green Version]
  4. Tian, J.; Xiong, R.; Shen, W. A review on state of health estimation for lithium ion batteries in photovoltaic systems. eTransportation 2019, 2, 100028. [Google Scholar] [CrossRef]
  5. Li, J.; Landers, R.G.; Park, J. A comprehensive single-particle-degradation model for battery state-of-health prediction. J. Power Sources 2020, 456, 227950. [Google Scholar] [CrossRef]
  6. Wang, X.; Wei, X.; Dai, H. Estimation of state of health of lithium-ion batteries based on charge transfer resistance considering different temperature and state of charge. J. Energy Storage 2019, 21, 618–631. [Google Scholar] [CrossRef]
  7. Li, J.; Adewuyi, K.; Lotfi, N.; Landers, R.G.; Park, J. A single particle model with chemical/mechanical degradation physics for lithium ion battery State of Health (SOH) estimation. Appl. Energy 2018, 212, 1178–1190. [Google Scholar] [CrossRef]
  8. Li, X.; Yuan, C.; Wang, Z. State of health estimation for Li-ion battery via partial incremental capacity analysis based on support vector regression. Energy 2020, 203, 117852. [Google Scholar] [CrossRef]
  9. Li, Y.; Liu, K.; Foley, A.M.; Zülke, A.; Berecibar, M.; Nanini-Maury, E.; Van Mierlo, J.; Hoster, H.E. Data-driven health estimation and lifetime prediction of lithium-ion batteries: A review. Renew. Sustain. Energy Rev. 2019, 113, 109254. [Google Scholar] [CrossRef]
  10. Yang, D.; Zhang, X.; Pan, R.; Wang, Y.; Chen, Z. A novel Gaussian process regression model for state-of-health estimation of lithium-ion battery using charging curve. J. Power Sources 2018, 384, 387–395. [Google Scholar] [CrossRef]
  11. Deng, Y.; Ying, H.; E, J.; Zhu, H.; Wei, K.; Chen, J.; Zhang, F.; Liao, G. Feature parameter extraction and intelligent estimation of the State-of-Health of lithium-ion batteries. Energy 2019, 176, 91–102. [Google Scholar] [CrossRef]
  12. Stroe, D.I.; Schaltz, E. Lithium-ion battery state-of-health estimation using the incremental capacity analysis technique. IEEE Trans. Ind. Appl. 2020, 56, 678–685. [Google Scholar] [CrossRef]
  13. Tian, J.; Xiong, R.; Shen, W. State-of-health estimation based on differential temperature for lithium ion batteries. IEEE Trans. Power Electron. 2020, 35, 10363–10373. [Google Scholar] [CrossRef]
  14. Richardson, R.R.; Birkl, C.R.; Osborne, M.A.; Howey, D.A. Gaussian process regression for in situ capacity estimation of lithium-ion batteries. IEEE Trans. Ind. Inform. 2019, 15, 127–138. [Google Scholar] [CrossRef] [Green Version]
  15. Li, Y.; Zou, C.; Berecibar, M.; Nanini-Maury, E.; Chan, J.C.W.; van den Bossche, P.; Van Mierlo, J.; Omar, N. Random forest regression for online capacity estimation of lithium-ion batteries. Appl. Energy 2018, 232, 197–210. [Google Scholar] [CrossRef]
  16. Rezaeianjouybari, B.; Shang, Y. Deep learning for prognostics and health management: State of the art, challenges, and opportunities. Measurement 2020, 163, 107929. [Google Scholar] [CrossRef]
  17. Kaur, K.; Garg, A.; Cui, X.; Singh, S.; Panigrahi, B.K. Deep learning networks for capacity estimation for monitoring SOH of Li-ion batteries for electric vehicles. Int. J. Energy Res. 2021, 45, 3113–3128. [Google Scholar] [CrossRef]
  18. Shen, S.; Sadoughi, M.; Chen, X.; Hong, M.; Hu, C. A deep learning method for online capacity estimation of lithium-ion batteries. J. Energy Storage 2019, 25, 100817. [Google Scholar] [CrossRef]
  19. Hinton, G.E.; Salakhutdinov, R.R. Reducing the dimensionality of data with neural networks. Science 2006, 313, 504–507. [Google Scholar] [CrossRef] [Green Version]
  20. Saha, B.; Goebel, K. Battery Data Set; NASA Ames Res. Center: Moffett Field, CA, USA, 2007. Available online: http://ti.arc.nasa.gov/tech/dash/pcoe/prognostic-data-repository/ (accessed on 5 September 2021).
  21. Li, X.; Yuan, C.; Li, X.; Wang, Z. State of health estimation for Li-Ion battery using incremental capacity analysis and Gaussian process regression. Energy 2020, 190, 116467. [Google Scholar] [CrossRef]
Figure 1. The structure of the input vector for SS-CNN.
Wevj 12 00256 g001
Figure 2. The proposed SS-CNN: (a) Structure of the SS-CNN; (b) Training scheme for the SS-CNN.
Wevj 12 00256 g002aWevj 12 00256 g002b
Figure 3. Discharge capacity vs. cycle for NASA dataset.
Wevj 12 00256 g003
Figure 4. Capacity estimation results for battery #7: (a) NN model; (b) CNN model; (c) SS-CNN-S2 model; (d) SS-CNN-S3 model.
Wevj 12 00256 g004
Figure 5. Evolution of the voltage curves with the battery cycles with different starting voltages: (a) Starting voltage = 3.7 V; (b) Starting voltage = 3.8 V; (c) Starting voltage = 3.9 V.
Wevj 12 00256 g005
Figure 6. Capacity estimation results for battery #7 with different sizes of unlabeled samples.
Wevj 12 00256 g006
Figure 7. Capacity estimation results for battery #7 with different sizes of labeled samples.
Wevj 12 00256 g007
Table 1. Capacity estimation results based on different methods.
MethodIndexBattery #5 (%)Battery #6 (%)Battery #7 (%)Battery #18 (%)Average (%)
RMSE1.29831.32931.15861.42391.3025
NNMAE1.04981.08930.97821.28431.1004
MaxRE3.79453.80983.65554.01284.0128
RMSE1.13491.23021.02041.29831.1709
CNNMAE0.98251.04720.79381.05290.9691
MaxRE3.64163.19833.07813.72313.7231
RMSE0.82480.83390.77020.91490.8359
SS-CNN-S2MAE0.78490.76390.63290.85390.7589
MaxRE2.68392.84932.54793.03293.0329
RMSE0.73820.81370.68390.90870.7861
SS-CNN-S3MAE0.67820.74830.52250.83890.6970
MaxRE2.53922.78392.44402.84032.8403
Table 2. Capacity estimation results under different starting voltages.
Starting Voltage (V)3.73.753.83.853.9
RMSE (%)0.65440.89690.68391.05501.0765
MAE (%)0.49660.71250.52250.76190.7568
MaxRE (%)2.71782.92142.44403.53843.5370
Publisher’s Note: MDPI stays neutral with regard to jurisdictional claims in published maps and institutional affiliations.

