1. Introduction
Due to the development and popularization of the hydrogen fuel cell vehicle in recent years, the hydrogen refueling station (HRS), as the essential infrastructure for commercialization, is highly sponsored by governments around the world [
1]. It is estimated that the number of HRS will reach 26,600 in the USA, 57,000 in Japan, and 236,111 worldwide by 2050 [
2]. In the meantime, the higher working pressure of the equipment in the HRS is required for the sake of the continuous improvement of the hydrogen storage pressure for the range of the vehicles [
3].
Despite all its benefits, hydrogen leakage and diffusion are always a potential risk. According to an early study regarding the risk in HRS [
4,
5], the consequence severity of various failure scenarios has been evaluated. A recent study proposes to classify the accidental incidents involving hydrogen leakage and diffusion into two categories: hydrogen leakage conditions and local environment conditions [
6]. The potential safety issues of the HRS are the blast pressure and jet flame caused by the ignition of hydrogen stored in high-pressure devices, such as 90 MPa hydrogen compressor, 70 MPa hydrogen storage vessel, and 70 MPa hydrogen dispenser. With respect to the safety of HRS, Qian et al. [
7] discussed the influence of the leakage position and the wind velocity on the distribution of the flammable hydrogen gas cloud in the HRS. The results indicate that a narrower space between the obstacle and the leakage position makes the profile of the flammable gas cloud more unpredictable. Additionally, the opposite wind direction may result in a larger profile of the flammable gas cloud. Another example is the study on the HRS in Dalian, China, where the 90 MPa ultrahigh pressure hydrogen compressor and the 70 MPa storage devices are used [
8,
9]. It was concluded that the leakage accident of the 90 MPa hydrogen storage tank may cause the greatest harm in hydrogen explosion.
On the approaches in studying the safety issues, it is always difficult to obtain accurate results via tests, since the weather condition can be a significant factor, and the delay of hydrogen sensors may enlarge the errors as well [
10]. Hence, the qualitative way is often used to evaluate the safety issue for the potential hydrogen leakage and ignition. On this aspect, the risk matrix is often used as a qualitative way, by which the safety of the hydrogen and gasoline dispensers with and without existing safety measures is compared, suggesting that the safety of hydrogen dispenser is acceptable [
11]. To quantify the behaviors of hydrogen, numerical simulations based on computational fluid dynamics (CFD) are carried out by building a concise three-dimensional model of the station [
12,
13]. Moreover, the possible risks can be assessed using CFD combined with the leakage probability, ignition probability, and human hazard criteria, to calculate the personal mortality rate in hydrogen stations [
14,
15,
16].
To evaluate the safety with consideration of accidental events in HRS, the safety distance is put forward as a criterion to prevent people from danger [
17]. A consequence-based study is given by Li et al. [
18] to obtain the safe distance for both 35 MPa and 70 MPa stations, and some mitigation measures are proposed to reduce it. However, the determination of it requires detailed investigations. The aforementioned safety assessment in [
4] claims that a 6 m safety distance is enough for a 70 MPa HRS, while the results in [
9] suggest that when the explosion occurs, the farthest harmful distance is 35.7 m, and the lethal one is 18.8 m, both of which are way larger. It implies that the assessment on the safety of HRS as a whole can be quite complicated. Attentions were mainly paid to the layout and general management of HRS to provide a global view on this issue, while a more detailed investigation focusing on the specific devices can be valuable. On the other hand, the concerned leakage points were mainly located near the high-pressure storage tanks and compressors, and the potential leakage on the hydrogen dispenser was not always taken into account. According to the statistics of the U.S. Department of Energy on various types of malfunctions and failures in HRS, the hydrogen dispenser is one of the pieces of equipment that are prone to these events most, which account for a proportion of 35%. The possible reason is that the service of hydrogen dispensers involves massive manual operations.
Considering the leakage of hydrogen and the possible subsequent accidents, therefore, this study aims to carry out evaluations on the leakage for hydrogen dispensers, which can be quite helpful in optimizing its design and maintenance. For that purpose, the numerical way is preferred given the high costs and risks for an experimental study. In this study, the simulation of hydrogen leakage of a high-pressure dispenser is conducted using the commercial CFD software FLACS. The remaining part of this paper is organized as follows. Firstly, the basic models in the numerical simulation on hydrogen leakage are introduced in
Section 2, together with the establishment of the geometric model and the cases for concerned leaking events.
Section 3 presents the results of the hydrogen distribution after leakage, and then the discussions are given in
Section 4 regarding the optimization of the dispenser design and the possible reaction time to stop the leakage. Finally, the conclusions are drawn in
Section 5.
2. Numerical Simulations on Hydrogen Leakage
2.1. Model Description
To simulate the hydrogen leakage of the dispenser, various stages, including the internal pressure relief, the expansion of the hydrogen, and the diffusion of the hydrogen, should be modeled. By considering the leakage at a certain point of the tube as an under-expanded jet source, a pseudo-source approach was used, in which it is assumed that the gas leaks into the stagnant ambient environment under sonic conditions, and the temperature at the pseudo-source equals the temperature at the leak hole, and the velocity at pseudo-source is sonic.
Based on the momentum balance and the continuity, hence, the velocity at the jet outlet can be given by the state at the leak hole,
Similarly, by introducing the conservation of mass, and ideal gas equation, the enthalpy and the temperature are given by
where
u,
P,
ρ,
h,
T are the velocity, pressure, density, enthalpy, and temperature, respectively,
cp is the specific heat at constant pressure, and subscript 1 and 2 represent the location at the leak hole and at the jet outlet, respectively. More detailed information about the model can be found in References [
19,
20].
Based on the above equations describing the states at the leak hole and pseudo-source, the initial state of the hydrogen in the reservoir and that at the outlet are related. Assuming that the entropy is conservative during the process of the hole pressure release, it gives
where
Pi is the initial pressure of hydrogen,
Ti is the initial temperature of hydrogen,
P0 is the pressure of hydrogen at the leakage location, which can be assumed to be the atmospheric pressure,
T0 is the temperature of hydrogen at the leakage location.
Based on the mass conservation, the pressure at the exit should suffice the following condition,
where
u0 is the hydrogen leakage flow velocity at the exit,
ρ is the local jet density of the leakage location. The mass flow at the exit can be obtained by,
where
A0 is the leakage area, which is an effective value with respect to the leak size and the possible roughness along the tube wall.
As for the numerical approach, the computation based on CFD is used for the stage of hydrogen expansion and diffusion in the atmosphere. According to the comparative study on the turbulence model [
21], the classical two-equation model, namely the standard
k-
ε model, exhibits excellent performance regardless of whether high- or low-momentum hydrogen releases are to be investigated. In FLACS, it is used to solve the turbulence kinetic energy and the dissipation of it, given as follows.
where
βv is the volume porosity of the geometry,
βj is the area porosity in the
j direction,
ρ is the density,
uj is the mean velocity in the
j direction,
k is the turbulent kinetic energy,
ɛ is the dissipation of turbulent kinetic energy,
μeff is the effective viscosity,
μeff =
μ +
μt,
μt is the dynamic turbulent viscosity,
Pk is the production of turbulent kinetic energy,
Pɛ is the production of dissipation of turbulent kinetic energy,
C2ɛ is a model constant in transportation equation for dissipation.
2.2. Geometries and Cases
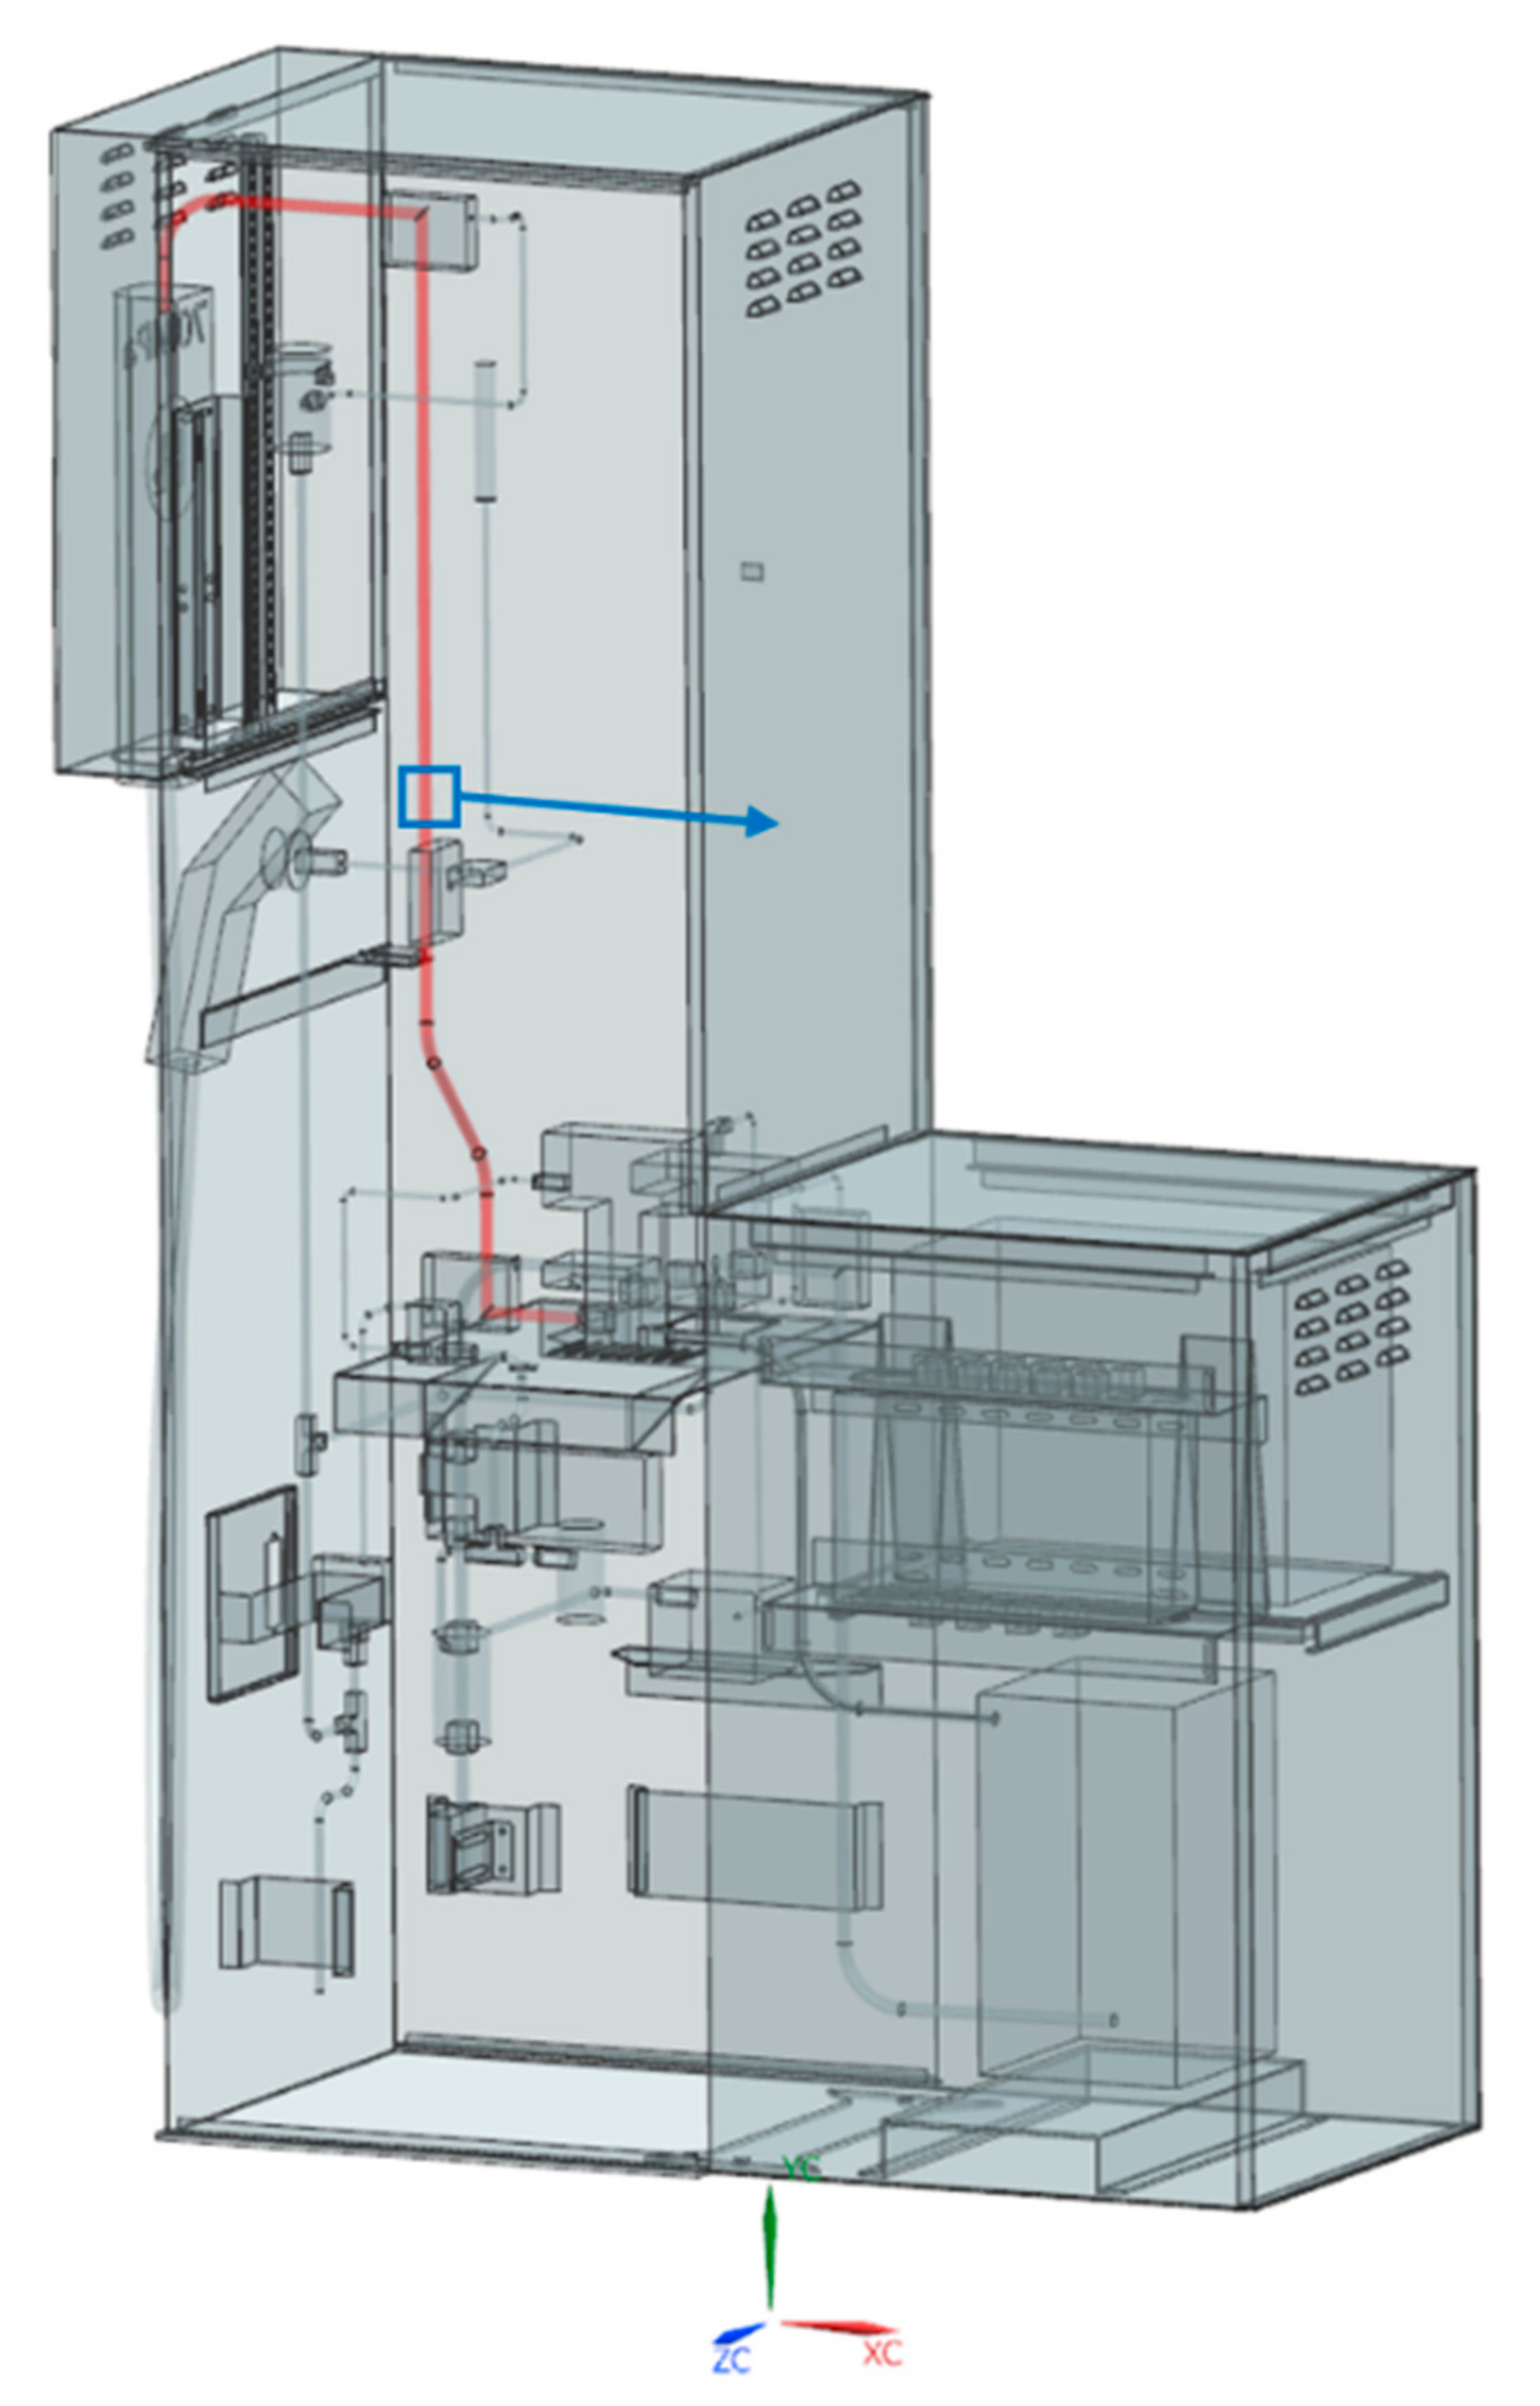
To investigate the leakage and diffusion inside the hydrogen dispenser, the geometry of hydrogen dispenser was built. It is based on the prototype developed to be applied in the 70 MPa HRS in China. It has a total size of about 1.2 m × 2.1 m × 0.6 m, consisting of two cabinets with all components inside included, e.g., the main tubes, heat exchanger, control module, flowmeter, pull-off valve, temperature sensor, hydrogen detector, and the supports of these components, etc. The geometric model is shown in
Figure 1. Given that the simulation is conducted in a transient way, attention should be paid to the computational efficiency as well. Eventually, the model to be put into FLACS was simplified and some components that barely affect the gas diffusion were ignored.
The leaking positions of the dispenser are more likely to locate on the connections between the tubes and the joints. Hence, it is assumed that the leaking position is near such a connection on the main tube, which is nearly in the center of the dispenser.
Figure 1 demonstrates the tube of interest by marking it in red color, and the assumed leaking position in the blue box. According to the recommendations given by the European Industrial Gases Association, the leak sizes were determined to be 1% and 10% of the tube section area, which are defined as small scale leakage and medium scale leakage, respectively [
22]. Additionally, with respect to the high pressure, a smaller leakage case was investigated, whose leak size equals 0.1% of the tube section area. In the simulation, the leak size was set by giving the leak hole diameter. According to the diameter of the main tube, the diameters were 0.2466 mm, 0.78 mm, 2.466 mm for 0.1%, 1%, 10% leak size, respectively. The roughness along the tube wall, as mentioned before, was considered by multiplying the leak hole area by a coefficient of 0.85. Apart from the leak size, the leak direction and the leak time were also considered in the simulation. The summary of the computed cases is shown in
Table 1.
The geometrical model was then introduced to FLACS, and the computational domain was determined and meshed then. Note that the external space of the dispenser should be large enough since the hydrogen may disperse through vent holes on the shell of the dispenser. Hence, for the various leak size to be studied, different computational domain sizes were tested and determined. Specifically, the size along the direction of possible hydrogen diffusion should be large enough so that the boundary will have little effect under such a high pressure. The same applies to the computational domain size in height for the sake of the high buoyancy of hydrogen. As an example, for the case of 0.1% leak size, the computational domain was determined to be 4 m in length, 1.8 m in width, and 4 m in height, i.e., 4 m × 1.8 m × 4 m, as shown in
Figure 2. In contrast, that for the case of 10% leak size was 20 m × 10 m × 10 m. For all cases, the boundary conditions are defined to have free outflow on all sides. The environmental temperature is assumed to be 15 °C, which is used as the temperature in the reservoir before the leakage occurs.
Noteworthily, all the mesh in
Figure 2 uses hexahedron element, which is regulated in FLACS. Consequently, the boundaries of components, which were possibly not right along with the hexahedron elements, will inevitably lead to partially-blocked elements, and the block rate is calculated for such elements to take into account the effects on the gas diffusion.
3. Results
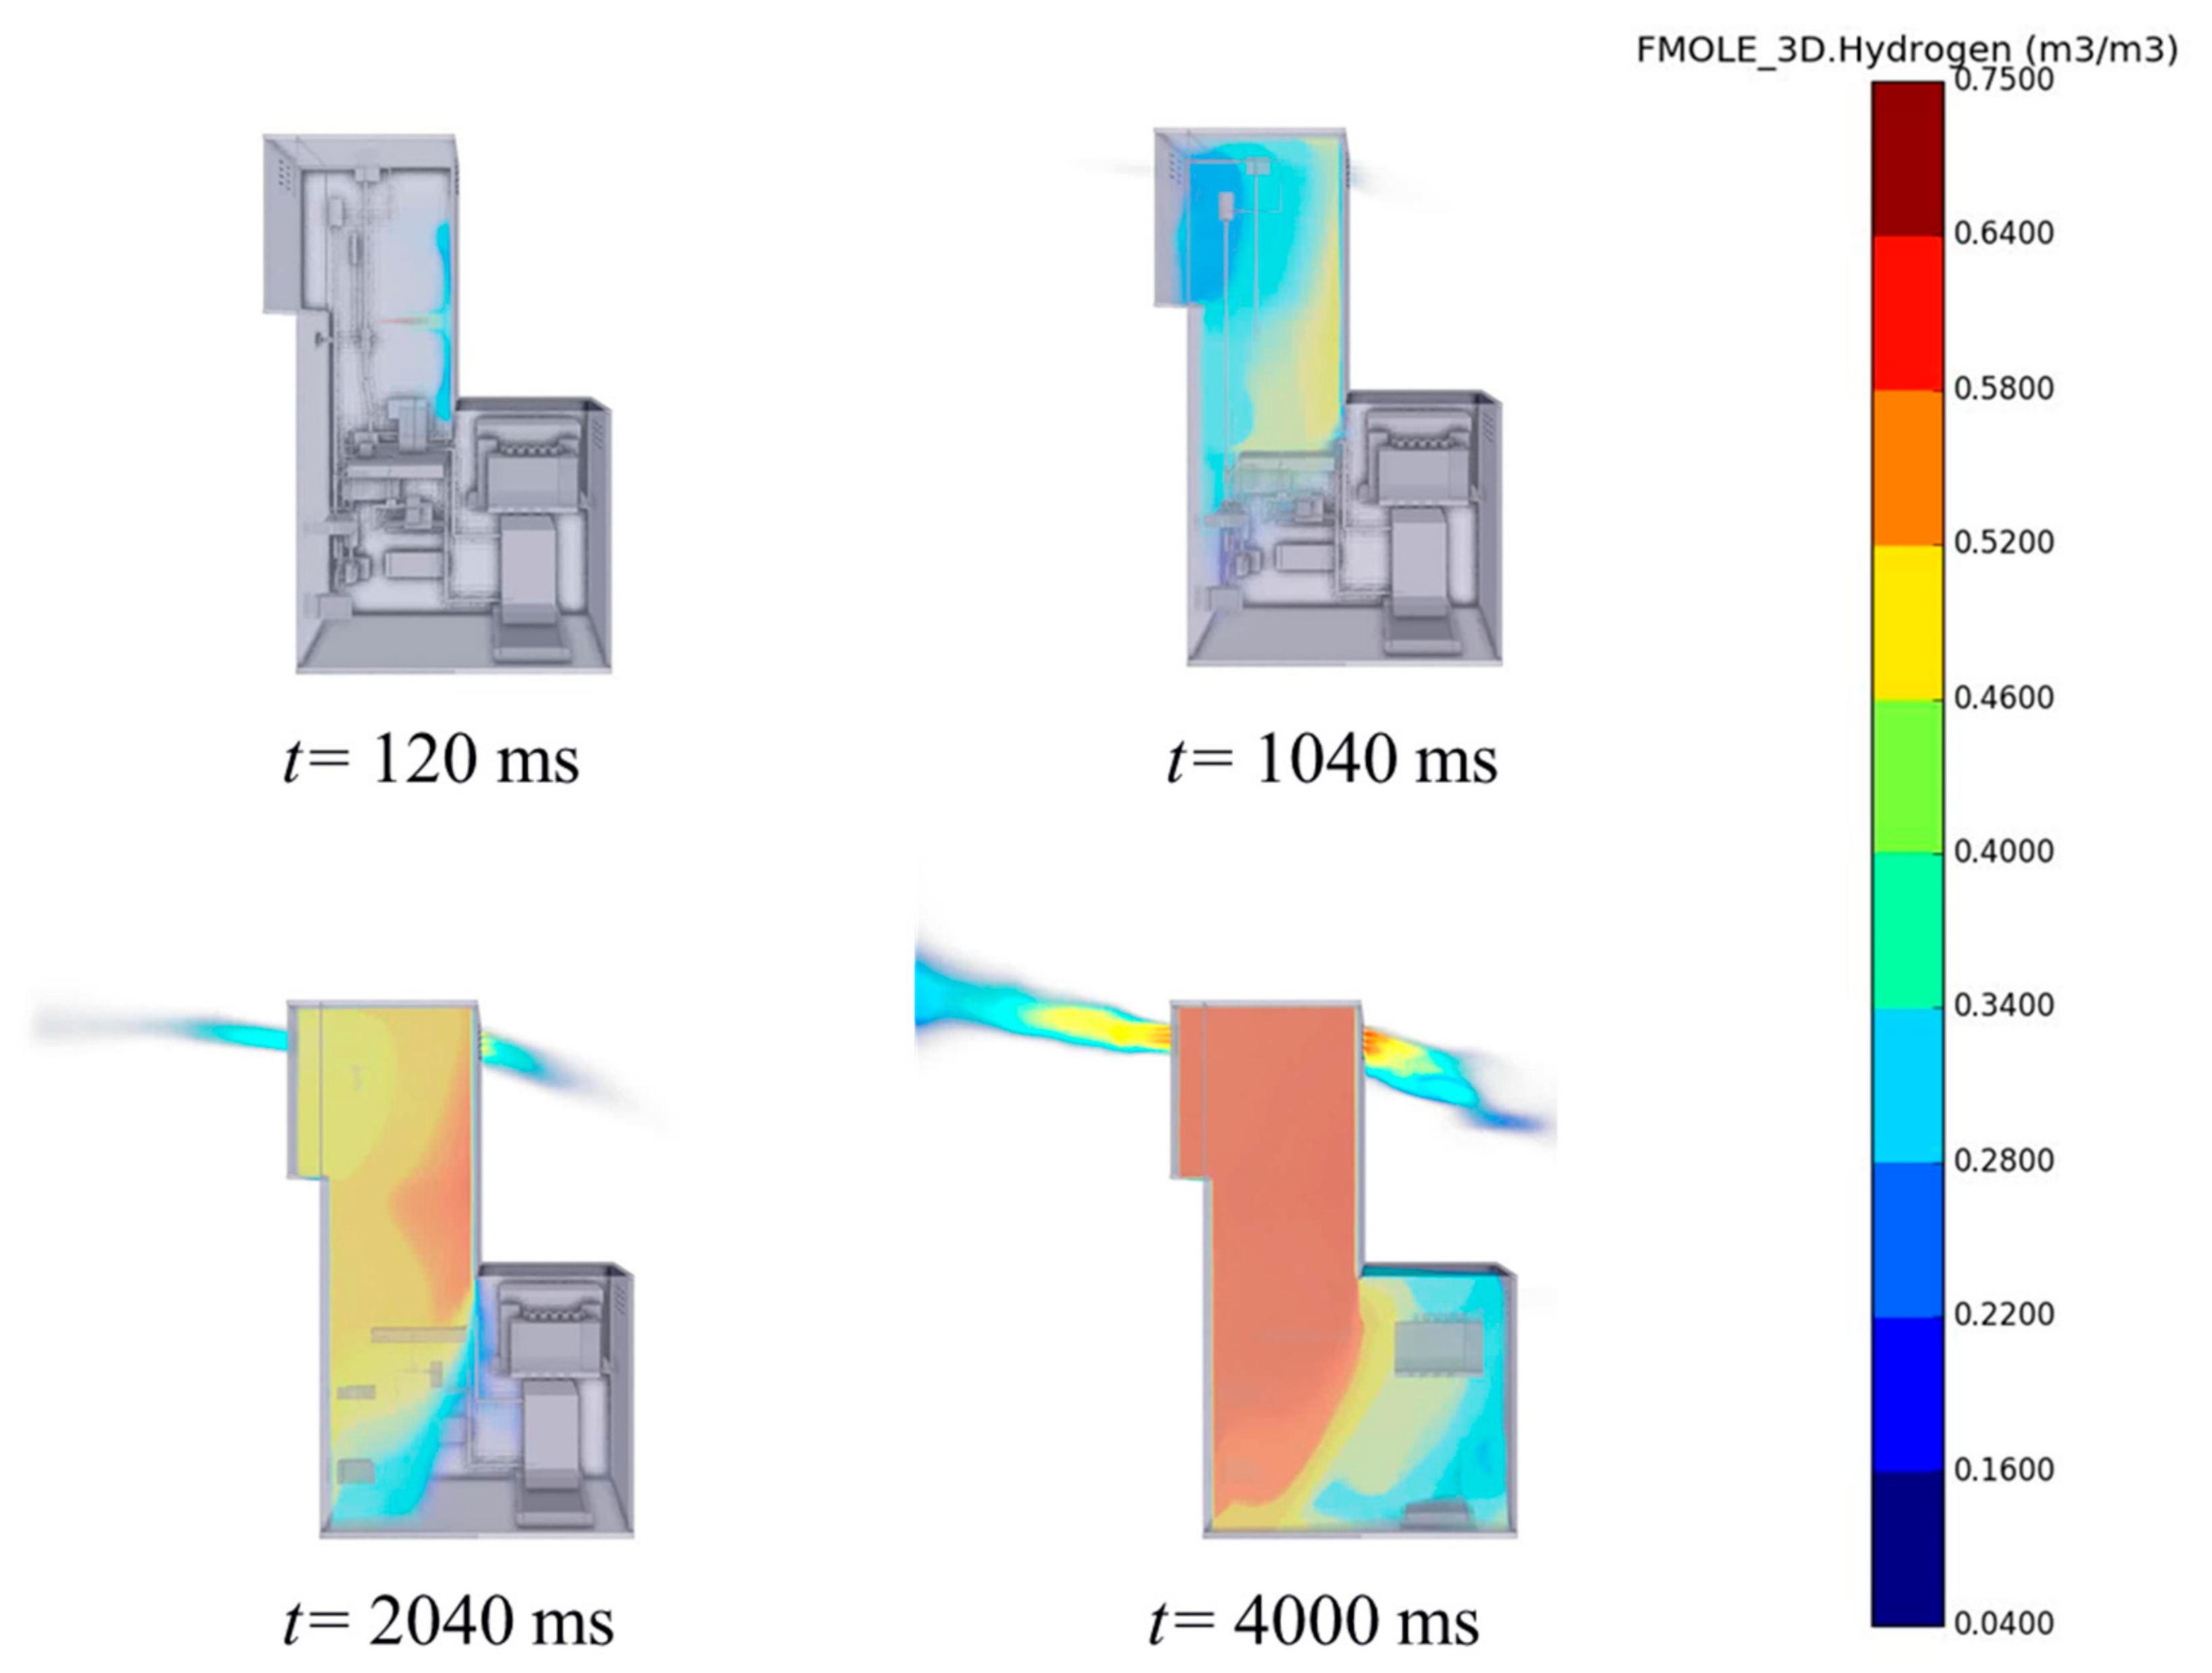
The results of leakage simulation are provided in terms of the volume fraction of hydrogen as the mixed gas will become ignitable when it is in the range of 0.04 to 0.75. Firstly, the results of Case 1 at various time were shown in
Figure 3, as it is expected to be the most dangerous case. Clearly, the leakage of a medium scale and under the pressure of 70 MPa will lead to a quite fast diffusion, so that the hydrogen will gather in the top part of the dispenser, and the ignitable cloud will also start to form near the vent hole in only 0.5 s. The hydrogen will fill the entire device in 2 s, and the flow field in the whole computational domain becomes nearly stable after about 4 s. At that time, the ignitable clouds forms outside the dispenser with a considerable scale.
As a consequence, the layout of the components inside the dispenser becomes insignificant given the rapid spread of hydrogen. In a similar way, the leak direction becomes insignificant as well. When comparing the results between Case 1 and Case 2, there are only slight differences for the first 0.5 s.
Also, interestingly enough, the results of Case 1 and Case 2 suggest that the gas inside the dispenser will not be ignitable as it exceeds the upper limit of 0.75, which leads to a low risk of combustion and the consequent explosion when the hydrogen leakage happens. Hence, when considering the case of a 100% leak size of the main tube inside the dispenser, it is not difficult to imagine that the hydrogen will fill the dispenser in an even shorter time, and the risk of igniting the hydrogen is still low enough.
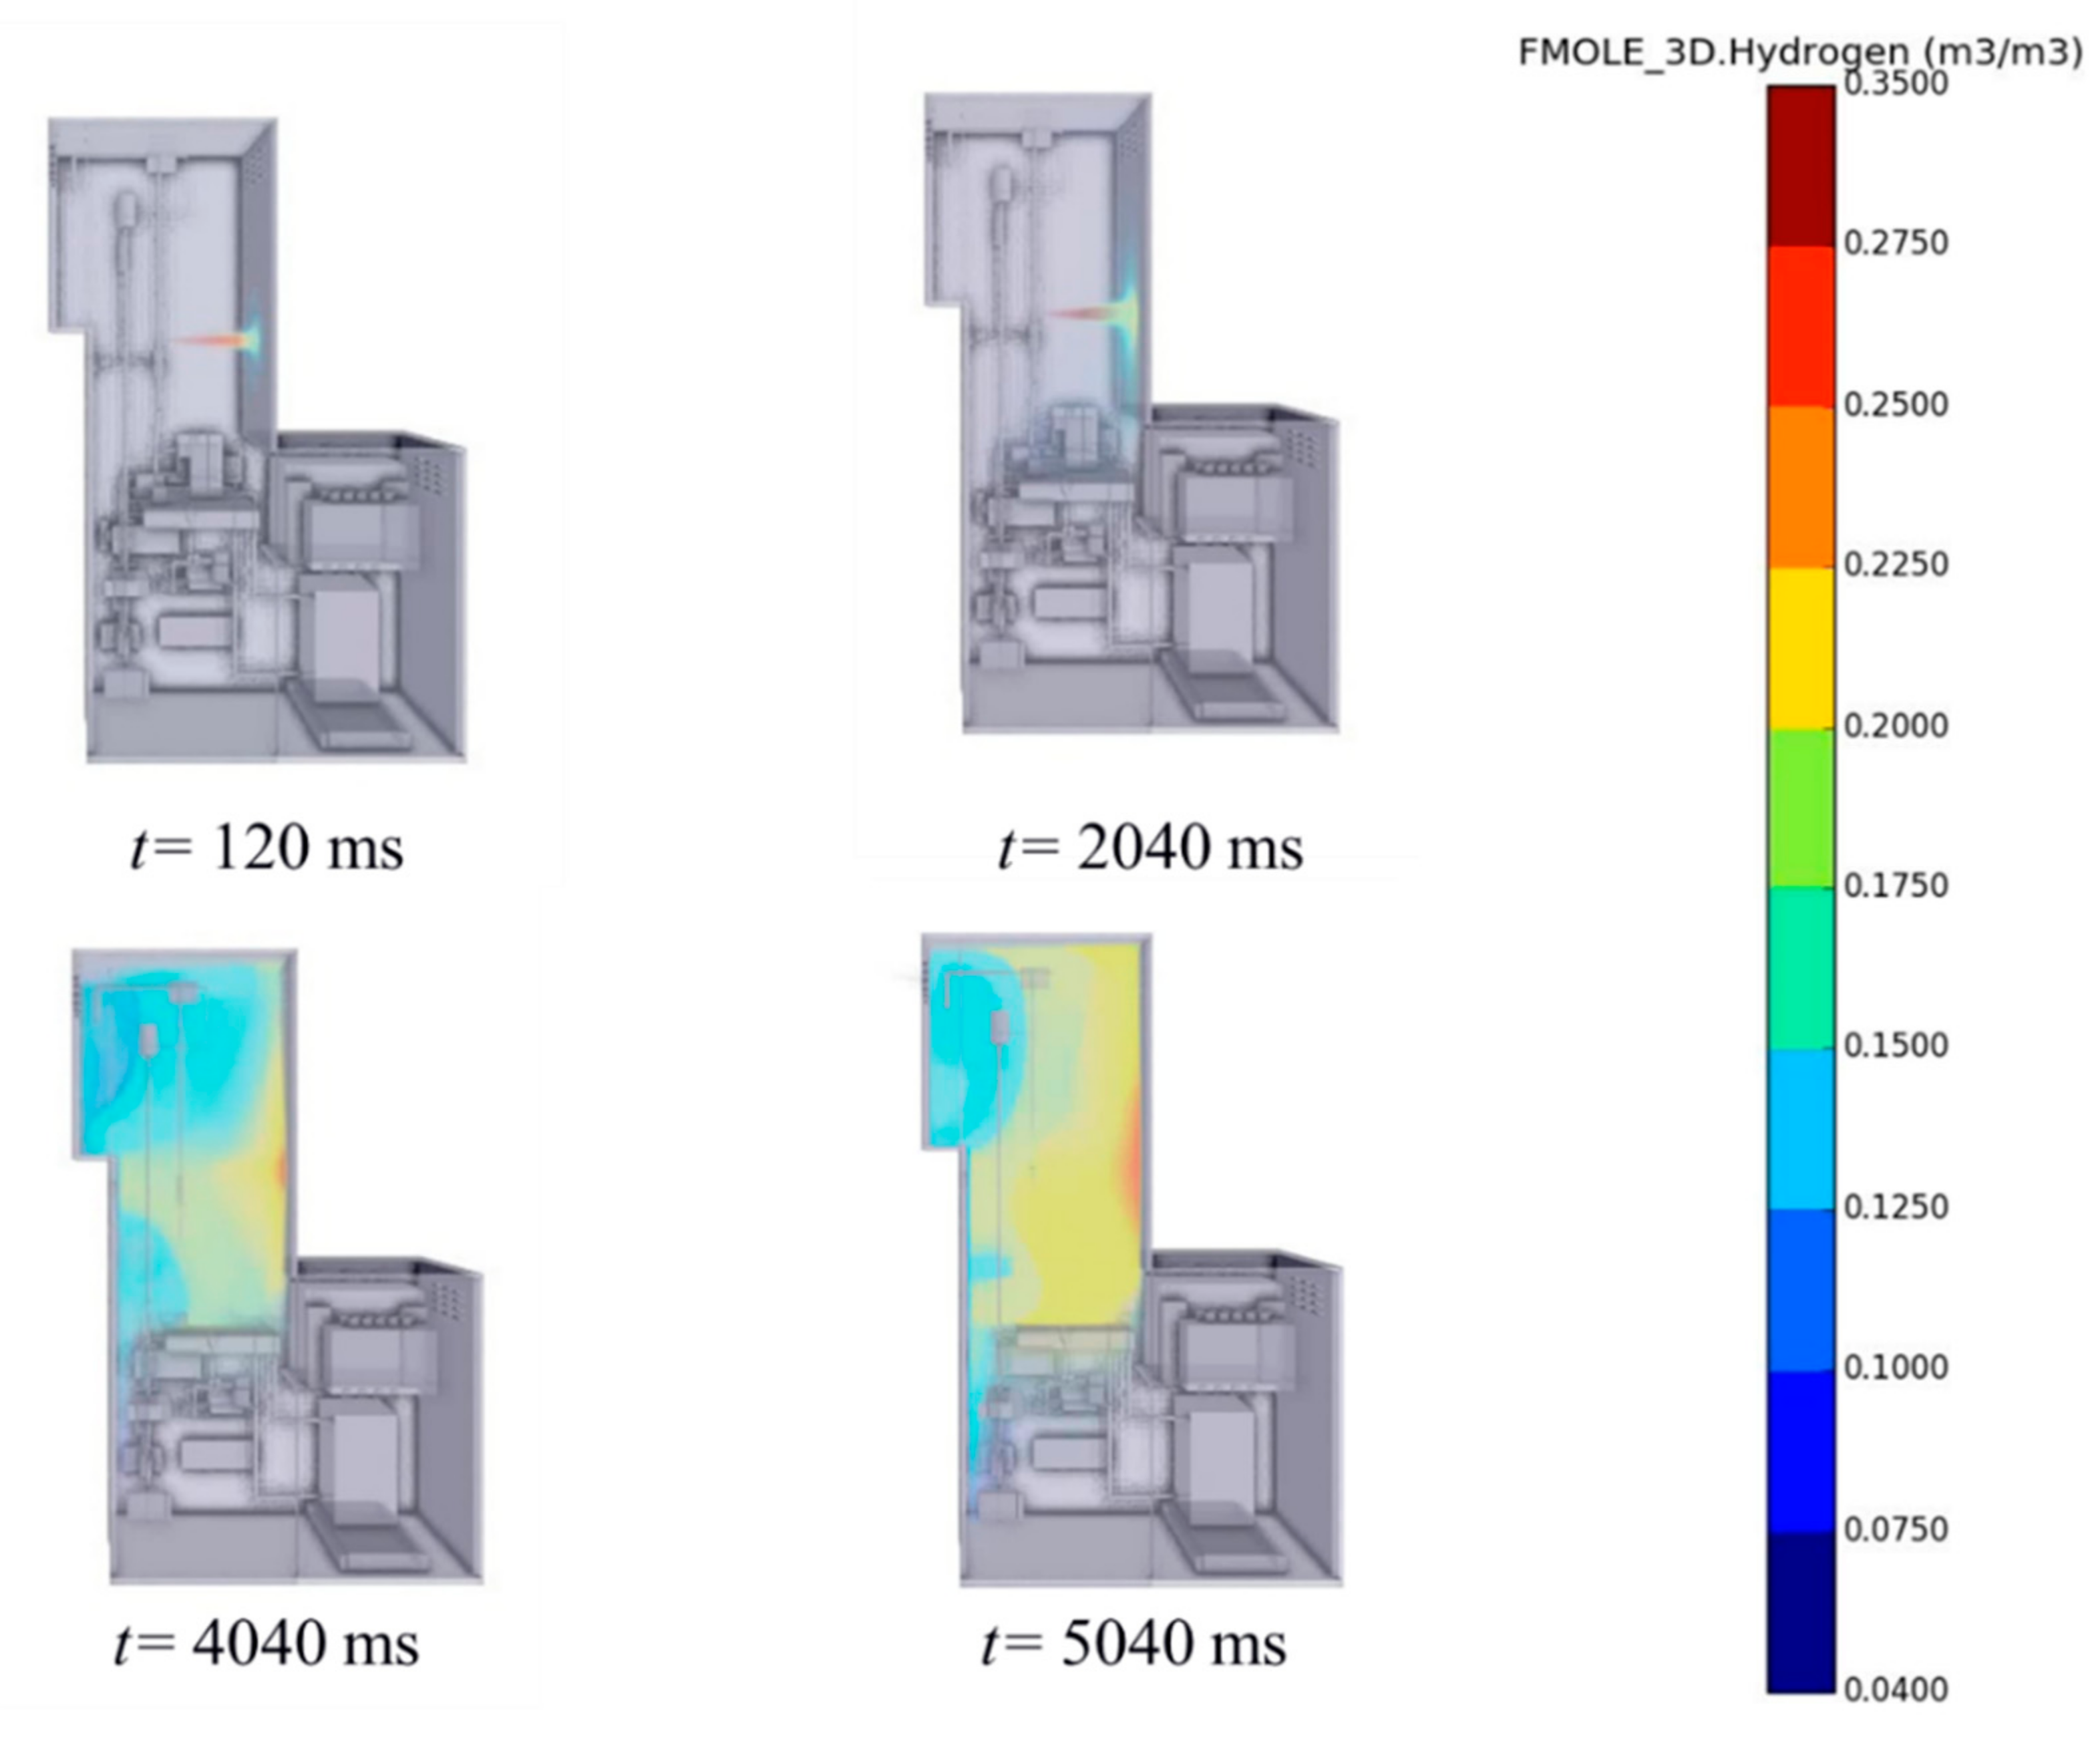
It is certainly not to deemphasize the ignition of hydrogen inside the dispenser. When looking into the events with smaller leak sizes, the volume fraction of hydrogen could be in the ignitable range, for which the studies on Case 4 and Case 5 can be referred. The results of these two cases, namely the ones with the leak size of 1% and 0.1%, are shown in
Figure 4 and
Figure 5, indicating that a much lower volume fraction of hydrogen during the leakage can be expected.
In Case 4, the hydrogen will reach the vent holes in the upper body after 1 s, while hardly diffuse to the lower body at that time. After about 2 s, it starts to form a small region of ignitable clouds outside the dispenser, but the major part inside the dispenser should be noted as being ignitable as well. The leaked hydrogen will not be full of the device after 4 s as in Case 1, and the lower right part, as being further away from the leaking position, remains ignitable then.
As for Case 5, the hydrogen leaking rate is even smaller, and the upper limit of 0.35 is used in
Figure 5 to give a clearer demonstration. Accordingly, the ignitable clouds will start to gather at about 2 s, and form in a considerable size after about 4 s. However, it should be noted that the volume fraction of hydrogen will hardly reach 0.75, which means that the gas will remain ignitable for a quite long period. On the other hand, it is next to impossible to form an ignitable cloud outside the dispenser.
4. Discussions
Given the quantitative results of hydrogen diffusion for various cases in the above, it is valuable to discuss the optimization of the dispenser design and/or other feasible methods to lower the risks induced by the hydrogen leakage.
Firstly, it is quite straightforward to suggest that the hydrogen dispenser is designed with no possible ignition source inside. The higher probability of the small scale leakage will lead to results that are similar to Case 5 more frequently, implying the necessity to attach importance to the possible ignition sources.
In the meantime, the hydrogen detector should be included in the design to ensure an acceptable time to solve the leakage. With consideration of the time that the detector needed to process and pull the alarm, it is assumed that the leakage can be stopped after 5 s, and the numerical simulations on the above cases can be further discussed with respect to the reaction time of the detector. As a part of the reaction time, the time that the hydrogen requires to reach the detector is checked. It can be approximated by the time that the hydrogen reaches the top of the dispenser, where the detector is normally placed.
Figure 6 presents the volume fraction on a section in the middle of the dispenser for different cases. Accordingly, in large size leakages, the reaction time is dependent on the detector itself, as the time for the hydrogen diffusion is negligible. Also, it proves again that the large leak size will fade the effect from the leak direction, since the time in Case 1 and 2 are basically the same. For the cases with smaller leak sizes, the time that hydrogen reaches the top of the dispenser is also obtained and compared, which turns to be quite short as well. For instance, it is less than 1 s in Case 5, which is not much longer than that for Case 4. Whilst in this case, it can be expected that a higher requirement should be applied to the sensitivity of the detector for the timely responses, as the volume fraction around the detector is about 0.07, which is significantly lower than the corresponding result of 0.64 and 0.22 for Case 1 and 4, respectively.
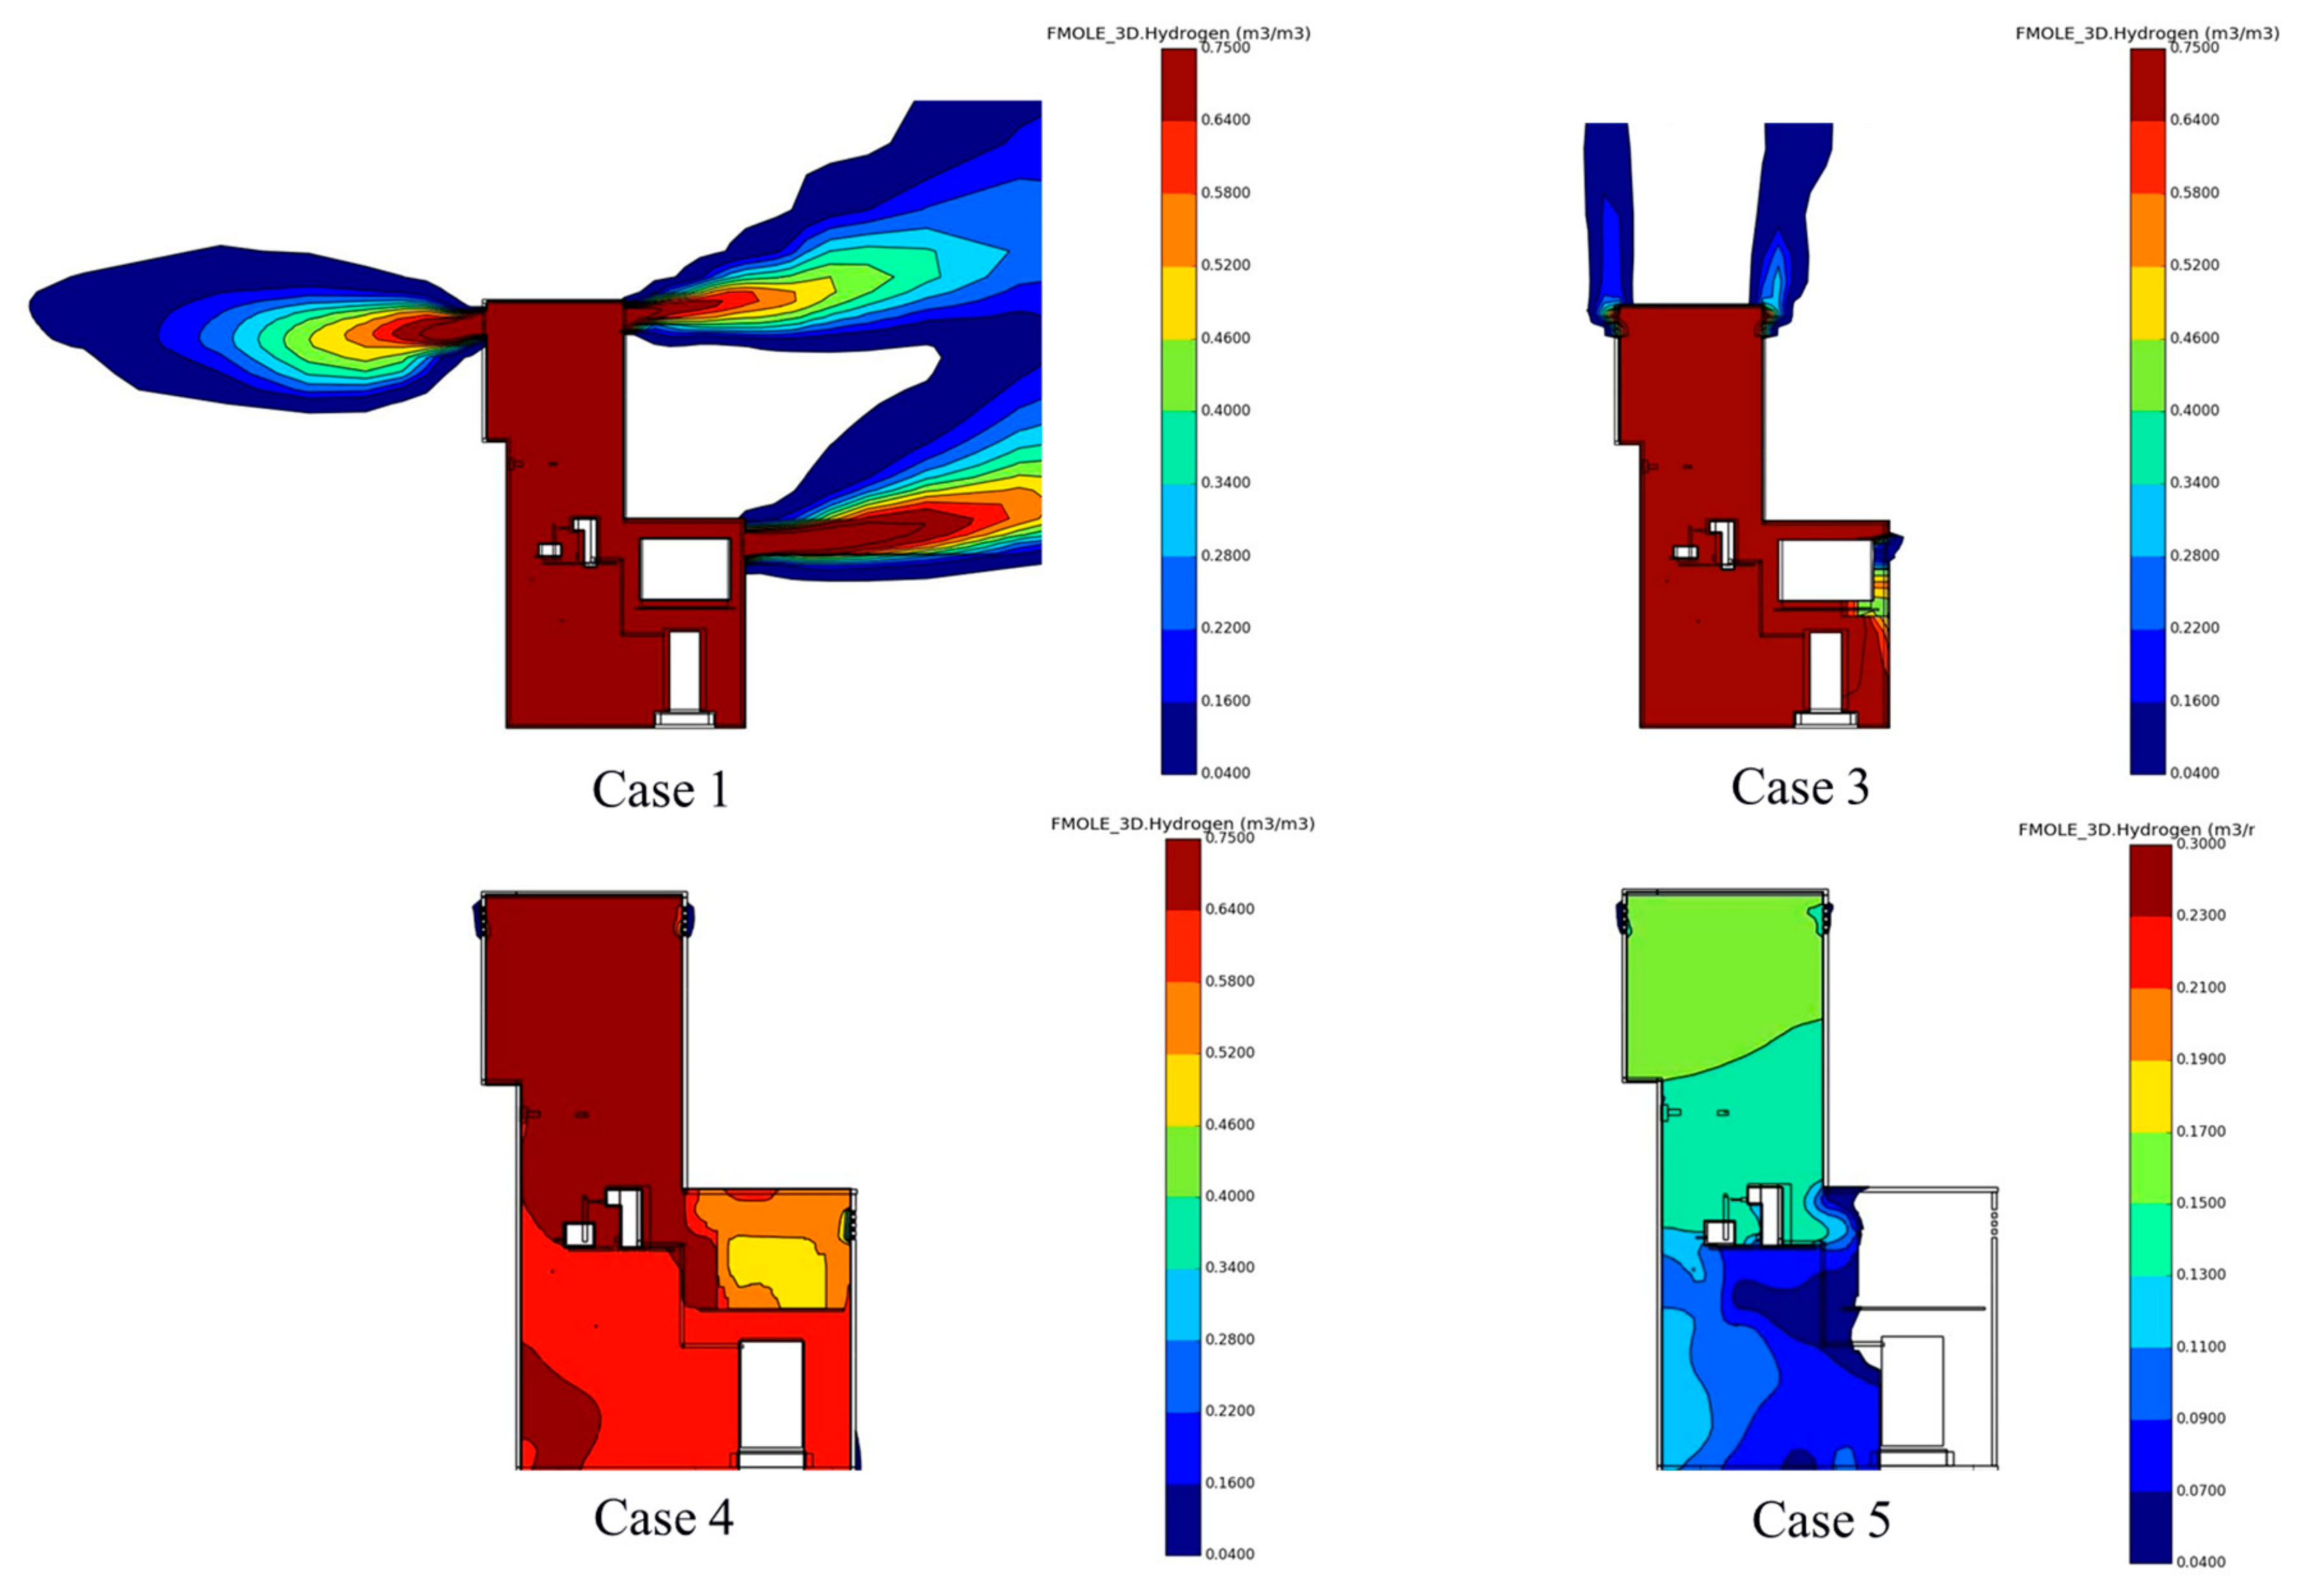
Consequently, the hydrogen distribution after the leakage is stopped can be investigated.
Figure 7 shows the volume fraction on the section in the middle of the dispenser for Case 3, 4, and 5 to show the situation after stopping the leakage, and that of Case 1 is given as a contrast. By comparing the result from Case 1 and Case 3, it is evident that the ignitable clouds outside the dispenser will dissipate in a short time once the leakage is stopped. The same conclusion can be addressed for small scale leakage in Case 4 and Case 5. Hence, attention should be paid to the hydrogen left inside. Due to the slow diffusion, it seems that to design the dispenser with more vent holes with larger sizes may not be effective in case the leakage is not stopped in a timely manner. Further investigations are still required to draw the conclusion though, since the wind effect is not considered in the above analysis.
On the other hand, this part of discussion will not eliminate the risk caused by the ignitable clouds outside the dispenser. The above studies only focus on the leakage on the main tubes inside the dispenser, while further studies and discussions on the cases of leakage on the hose and/or the joint of the hydrogen refueling nozzle can be helpful, by which the specific affecting ranges of the ignited gas can be manifested regarding the crowd safety.
5. Conclusions
This study presents an investigation on the events of hydrogen leakage of the dispenser under 70 MPa pressure. By conducting numerical simulations based on CFD with respect to the leak sizes, leak directions, and the time to stop the leakage, it can be stated in general that the leakage in a conventionally-defined small or medium scale inside the dispenser will cause a rapid spread of hydrogen. More specific conclusions are drawn as follows.
Firstly, the large flow rate caused by the high pressure makes the leak direction and the layout of the components inside the dispenser insignificant. It can be also addressed that the key factor to timely stop the leakage is the reaction time of the detector itself, as the time for hydrogen to reach the detector is short enough.
Secondly, the ignitable clouds will form outside the dispenser in less than 1 s when there is a leakage of 10% leak size. Yet, the risk of ignition by external causes can be eliminated if the leakage is stopped in a timely manner, thanks to the quick dissipation to the atmosphere. On the other hand, the risk of igniting the gas inside the dispenser may persist for a longer time because of the slow diffusion towards outside. Besides, the risk of a smaller scale leakage should be emphasized, e.g., 0.1% leak size. It may result in a longer time to pull the alarm, due to the higher requirement on the sensitivity and the slightly longer time for hydrogen to reach the detector.
Therefore, it is highly important to remove all the possible igniting sources inside the hydrogen dispenser, which is exactly the design principle that this prototype follows. To further optimize the design of the dispenser with concerns on hydrogen safety, future studies can be conducted on the design of vent holes considering the wind effect. A more detailed investigation on the leakage on the hose and/or the joint of the hydrogen refueling nozzle can be valuable to address the effect on fuel cell vehicles and the people nearby.


