Article

Fault Diagnosis for PEMFC Water Management Subsystem Based on Learning Vector Quantization Neural Network and Kernel Principal Component Analysis

School of Electrical Engineering, Southwest Jiaotong University, Chengdu 611756, China
*
Author to whom correspondence should be addressed.
World Electr. Veh. J. 2021, 12(4), 255; https://doi.org/10.3390/wevj12040255
Submission received: 5 October 2021 / Revised: 23 November 2021 / Accepted: 1 December 2021 / Published: 4 December 2021

Abstract

:
To solve the problem of water management subsystem fault diagnosis in a proton exchange membrane fuel cell (PEMFC) system, a novel approach based on learning vector quantization neural network (LVQNN) and kernel principal component analysis (KPCA) is proposed. In the proposed approach, the KPCA method is used for processing strongly coupled fault data with a high dimension to reduce the data dimension and to extract new low-dimensional fault feature data. The LVQNN method is used to carry out fault recognition using the fault feature data. The effectiveness of the proposed fault detection method is validated using the experimental data of the PEMFC power system. Results show that the proposed method can quickly and accurately diagnose the three health states: normal state, water flooding failure and membrane dry failure, and the recognition accuracy can reach 96.93%. Therefore, the method proposed in this paper is suitable for processing the fault data with a high dimension and abundant quantities, and provides a reference for the application of water management subsystem fault diagnosis of PEMFC.

1. Introduction

Fuel cell power generation applications have many advantages such as high efficiency, being clean, quiet and so on. It has been widely used in the field of transportation [1]. Among various types of fuel cell, the proton exchange membrane fuel cell (PEMFC) has attracted extensive attention from all walks of life because of its high power density, high energy conversion efficiency, fast response speed, zero pollution and low operating temperature. However, it still has some disadvantages such as short service life, poor reliability and so on, which greatly limit the development of large-scale industrialization. The fault diagnosis method of the PEMFC system can judge the fault location in time when the fault state occurs, which is conducive to improving the remaining service life of PEMFC system and ensures the safe and stable operation of the PEMFC system [2].
At present, there are many research works on fault diagnosis methods of a PEMFC, which can fall into three categories: model, data-driven and experimental testing [3,4]. In reference [5], Abaza, A. et al. proposed a coyote optimization algorithm (COA) for searching the optimal parameter of PEMFC, and two practical PEMFC fuel cells including 250 Wstack and Ned Stack PS6 are modeled to validate the capability under different operating conditions. However, as the internal reaction mechanism of PEMFC systems has not been fully studied, a mechanism model of PEMFC considering health status still stays in the dark.
The data driven diagnosis method is widely used in the field of PEMFC system fault diagnosis because of its fast speed and comprehensive diagnosis [6]. In recent years, with the advent of the era of big data, deep learning technology continues to break through, and a growing number of researchers use data-driven methods for fuel cell fault diagnosis [7,8]. In order to solve the adverse effects and the interference of unreliable sensors on the diagnosis performance, refs. [9,10,11] used singular value decomposition (SVD) to reduce the dimension of the diagnosis eigenvalues to reduce the calculation workload, providing more effective classification results, and improve the performance of fault prediction. In reference [12], a fault diagnosis method of fuel cell water management based on fluidic model and support vector machine (SVM) was proposed in the literature. Fisher discriminant analysis (FDA) was used to analyze the fault diagnosis results. After feature extraction of fault data, the SVM model is used to realize on-line diagnosis, and the feasibility of on-line diagnosis is verified by taking an actual fuel cell stack as an example. A quantitative fault diagnosis method of PEMFC based on magnetic measurement and the data-driven method is proposed in reference [13]. By measuring the magnetic field around the fuel cell, linear discriminant analysis (LDA) algorithm is used to extract magnetic measurement features. Then, the extracted features are classified into different categories by a spherical-shaped multi-class support vector machine (SSM-SVM) to represent different health states. This method has higher global diagnosis accuracy and lower false alarm rate.
However, the support vector machine only has good performance in small sample data sets, which limit its diagnosis application inevitably. Note that the fault diagnosis of PEMFC water management is much more complex. Both water flooding failure and membrane dry failure can cause the output voltage to decrease and thus the voltage downward trend is not easy to distinguish. The water flooding fault is reversible and the membrane dry fault is irreversible, so there is strong motivation to identify the two faults accurately and quickly.
Dimension reduction can alleviate the dimension disaster, remove the noise, extract the essential features of data, and visualize the data. Kernel principal component analysis (KPCA) is different from basic principal component analysis (PCA), which can complete the nonlinear dimension reduction [14,15,16]. Learning vector quantization neural network (LVQNN) is a kind of self-organizing competitive network with supervised learning, which combines the idea of competitive learning with a supervised learning algorithm. Compared with a self-organizing feature mapping network, it can overcome the weakness of unsupervised learning algorithm and lack of classification information [17,18].
In this paper, a fault diagnosis method of PEMFC water management based on LVQNN and KPCA is proposed. The main contributions of this paper are, (i) the KPCA method is used to reduce the nonlinear dimension of fault feature data and extract the principal feature vector, and reduce the operation time; (ii) the LVQNN method is used to diagnose fault states, which has high fault diagnosis accuracy and less calculation time; and (iii) 14,244 sets of sample data are used to verify the proposed method. The remainder of this paper is organized as follows: in Section 2, the PEMFC test system and the water management faults of PEMFC are studied. In Section 3, KPCA and LVQNN are derived as water management fault diagnosis methods. Section 4 verifies the effectiveness of the proposed KPCA-LVQNN method, and the conclusion is drawn in Section 5.

2. Proton Exchange Membrane Fuel Cell (PEMFC) Power System and Water Management Failures

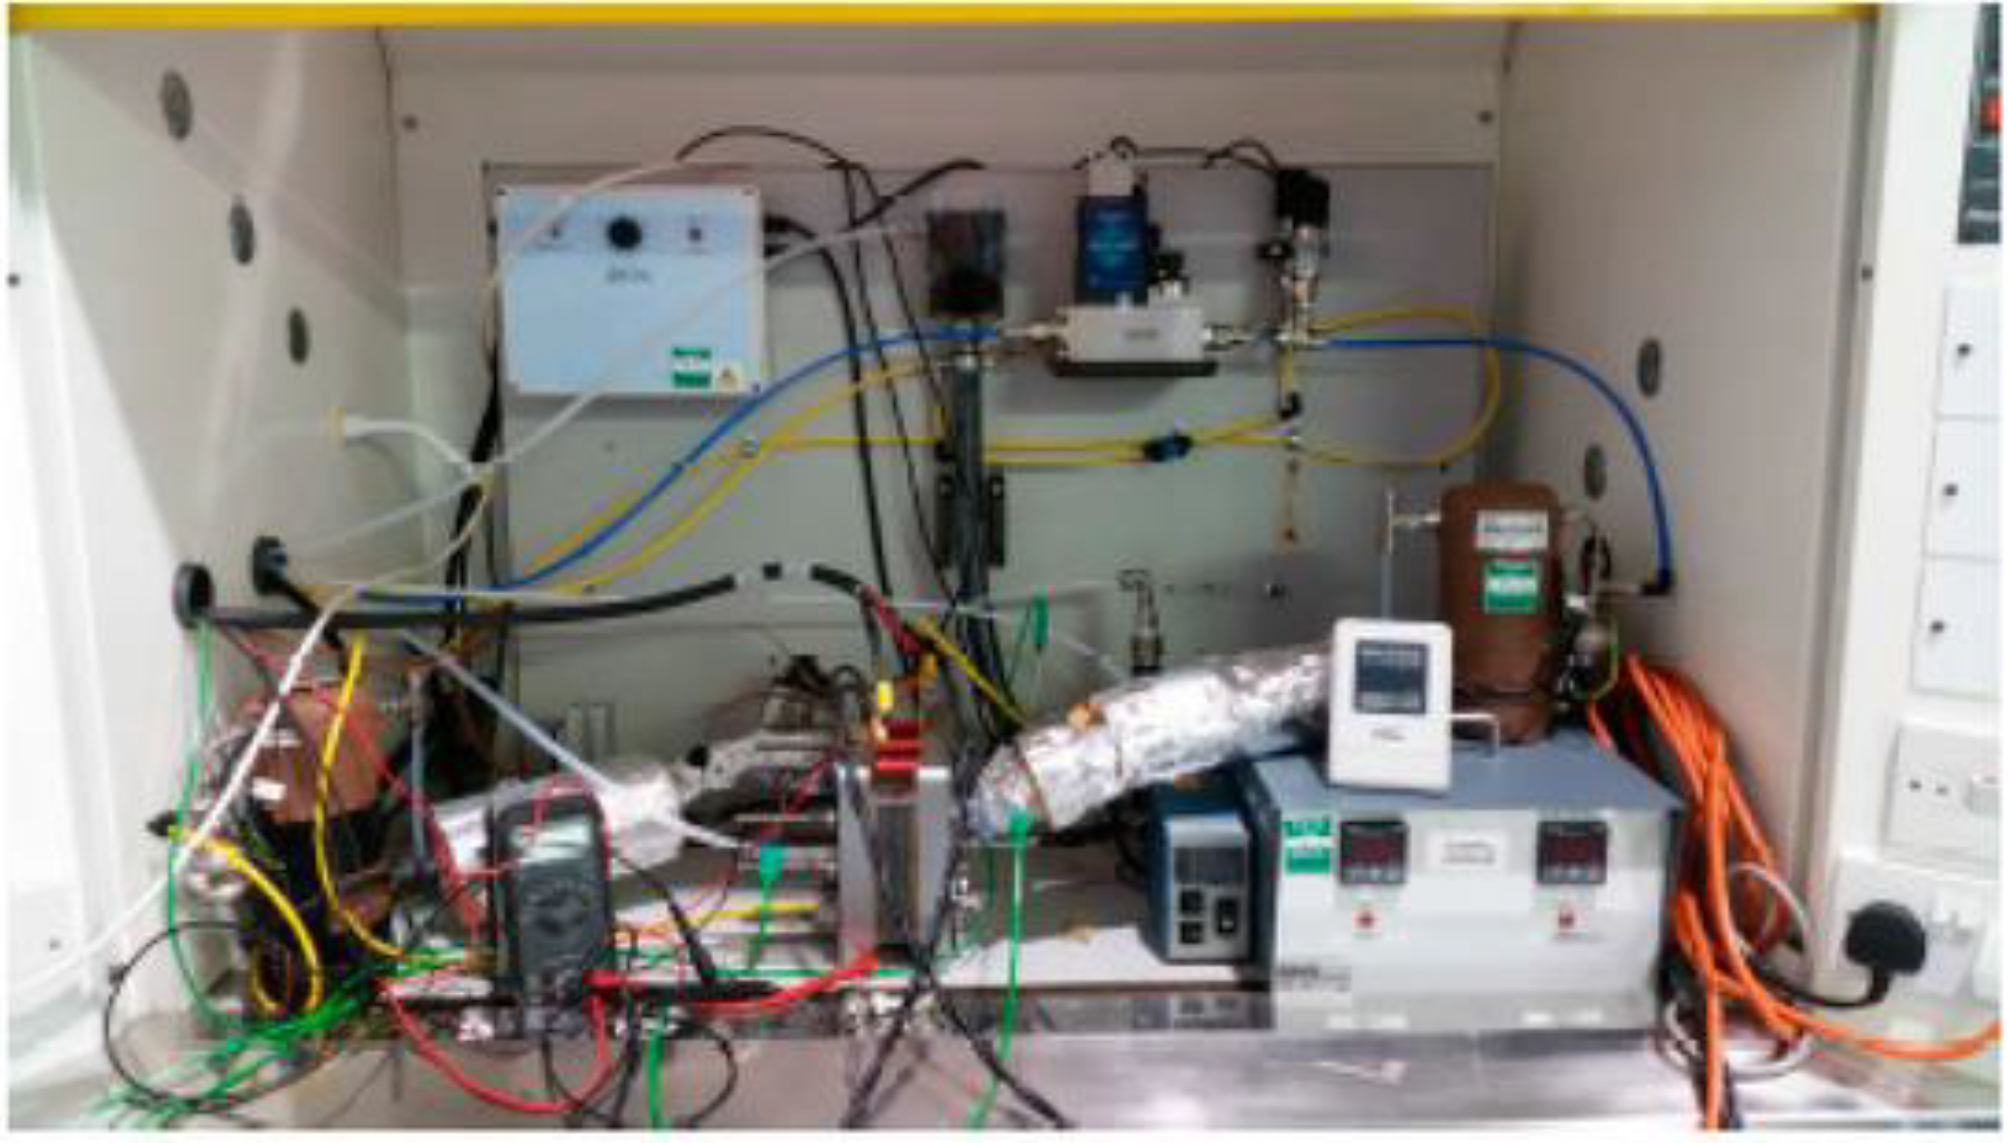
2.1. PEMFC Test System

The PEMFC test system selected in this paper is from the Department of Aeronautics and automotive engineering, Loughborough University, UK [19]. In the test system, an 80 W single cell stack test bench is used, including a fuel cell stack, an air and hydrogen supply system and a cooling system. The test system includes gas temperature and pressure sensors, stack voltage and current sensors, battery terminal voltage sensors, air and hydrogen supply system and cooling system. The test object is shown in Figure 1. The key parameters of PEMFC stack [19] are shown in Table 1.

2.2. Types of Water Management Failure

This paper focuses on the water management faults of PEMFC: Water flooding failure and membrane dry failure. Both water flooding and membrane dry can lead to the degradation of PEMFC. However, by observing the different voltage curves of the two faults during the transition period, it can be seen that the degradation paths of the two faults are different. In addition, using appropriate mitigation strategies can effectively recover from the degradation caused by water flooding of fuel cells. In contrast, the degradation caused by dry membrane is irreversible and the system cannot be recovered. To make it clear, the water flooding failure is reversible and the membrane dry fault is irreversible. Therefore, it is necessary to distinguish these two different failure modes and take appropriate diagnostic strategies to improve the operation of PEMFC.

2.2.1. Water Flooding Failure

The electrochemical reaction of PEMFC takes place at the water–gas proton three-phase interface. Because the reaction product of PEMFC is water, when the drainage is not smooth or the humidification on the air side is too saturated, the internal water content of the anode and cathode will increase. As a result, the electrode will be submerged by water, and the liquid water will cover the electrocatalytic layer, thus reducing the activity of the catalyst. it worth noting that excessive water will reduce the concentration of the reaction gas, and block the mass transfer speed of the reaction gas in the electrode gas diffusion layer, thus increasing the concentration polarization. The output voltage of PEMFC is lower than the normal value, which greatly reduces the performance of the fuel cell.
Take the PEMFC test platform as an example; by reducing the temperature of PEMFC to achieve the fuel cell flooding fault, it can be found that the flooding fault can lead to the decrease of fuel cell voltage. This experiment is set as follows. firstly, the stack temperature is reduced to trigger the PEMFC flooding fault on the cathode side, and then the temperature is increased to eliminate the flooding and recover from the battery degradation. After a period of normal operation, the PEMFC flooding fault is triggered again by lowering the stack temperature, which is shown in Figure 2a.

2.2.2. Dry Membrane Failure

When the air side humidification is insufficient, the water content in PEMFC battery will decrease. Proton exchange membrane cannot be fully humidified, which may result in the decrease of proton conductivity. At the same time, increasing the resistance and ohmic polarization of proton exchange membrane can lead to the decrease of output voltage. The causes of dehydration failure of PEMFC includes: low extraction current of PEMFC power system, high temperature of PEMFC battery and insufficient humidification of air inlet.
Similarly, to realize the membrane dry failure of the fuel cell, the temperature in the stack is increased by injecting non humidified reactants into the PEMFC. It is found that the fault will also lead to the voltage drop of the fuel cell, as shown in Figure 2b. Therefore, a conclusion can be drawn that both water flooding failure and membrane dry failure of fuel cell will lead to the rapid deterioration of fuel cell performance. In order to address such an issue, it is necessary to strengthen the water management fault diagnosis of PEMFC.

3. Diagnostic Methods

3.1. Kernel Principal Component Analysis (KPCA)

KPCA is different from the basic PCA, which directly reduces the original high-dimensional data to low-dimensional data by linear mapping. The basic idea of KPCA is to map the original data to a high-dimensional space non-linearly through the kernel mapping technology, and then reduce the dimension by using linear mapping in the new space, namely principal component analysis. Thus the key of KPCA is to generate a kernel matrix and then present it in a new direction. KPCA follows the same steps as PCA, but uses a kernel instead of the original data.
For the data set D = {x1, x2, …, xn}, assuming the mapping function is φ(x), when mapped to higher dimensions, the data become a linearly independent variable: φ(x1), φ(x2), …, φ(xn) and choose the appropriate kernel function [20] for D:
K i , j = k ( x i , x j ) = [ φ ( x i ) ] T φ ( x j )
Calculate the kernel matrix corresponding to the kernel function K [21]:
K ˜ = K 1 n K K 1 n + 1 n K 1 n
where 1n is an n × n matrix, where all the elements are 1/n. Note that the eigenvalues are corresponding to the kernel matrix K and then arrange them in order from the largest to the smallest.
The eigenvalues L with the highest contribution rate and the corresponding eigenvectors (a1, a2, …, aL) can be calculated and present a new direction to reduce the dimensionality of high-dimensional data [21], as shown below:
z l = i = 1 n a l n k ( x i , x )
where Zl is the first element of the projection vector (l ∈ 1, 2, … L), and aln is the corresponding value in the eigenvector calculated above.
The appropriate number of principal components is determined by Equation (4) [9]:
i = 1 L λ i i = 1 n λ i < T
where, λi is the i-th principal component, n is the number of total principal components, L is the choice number of principal components, and T is the threshold (according to previous studies, 0.95 is selected in this case).

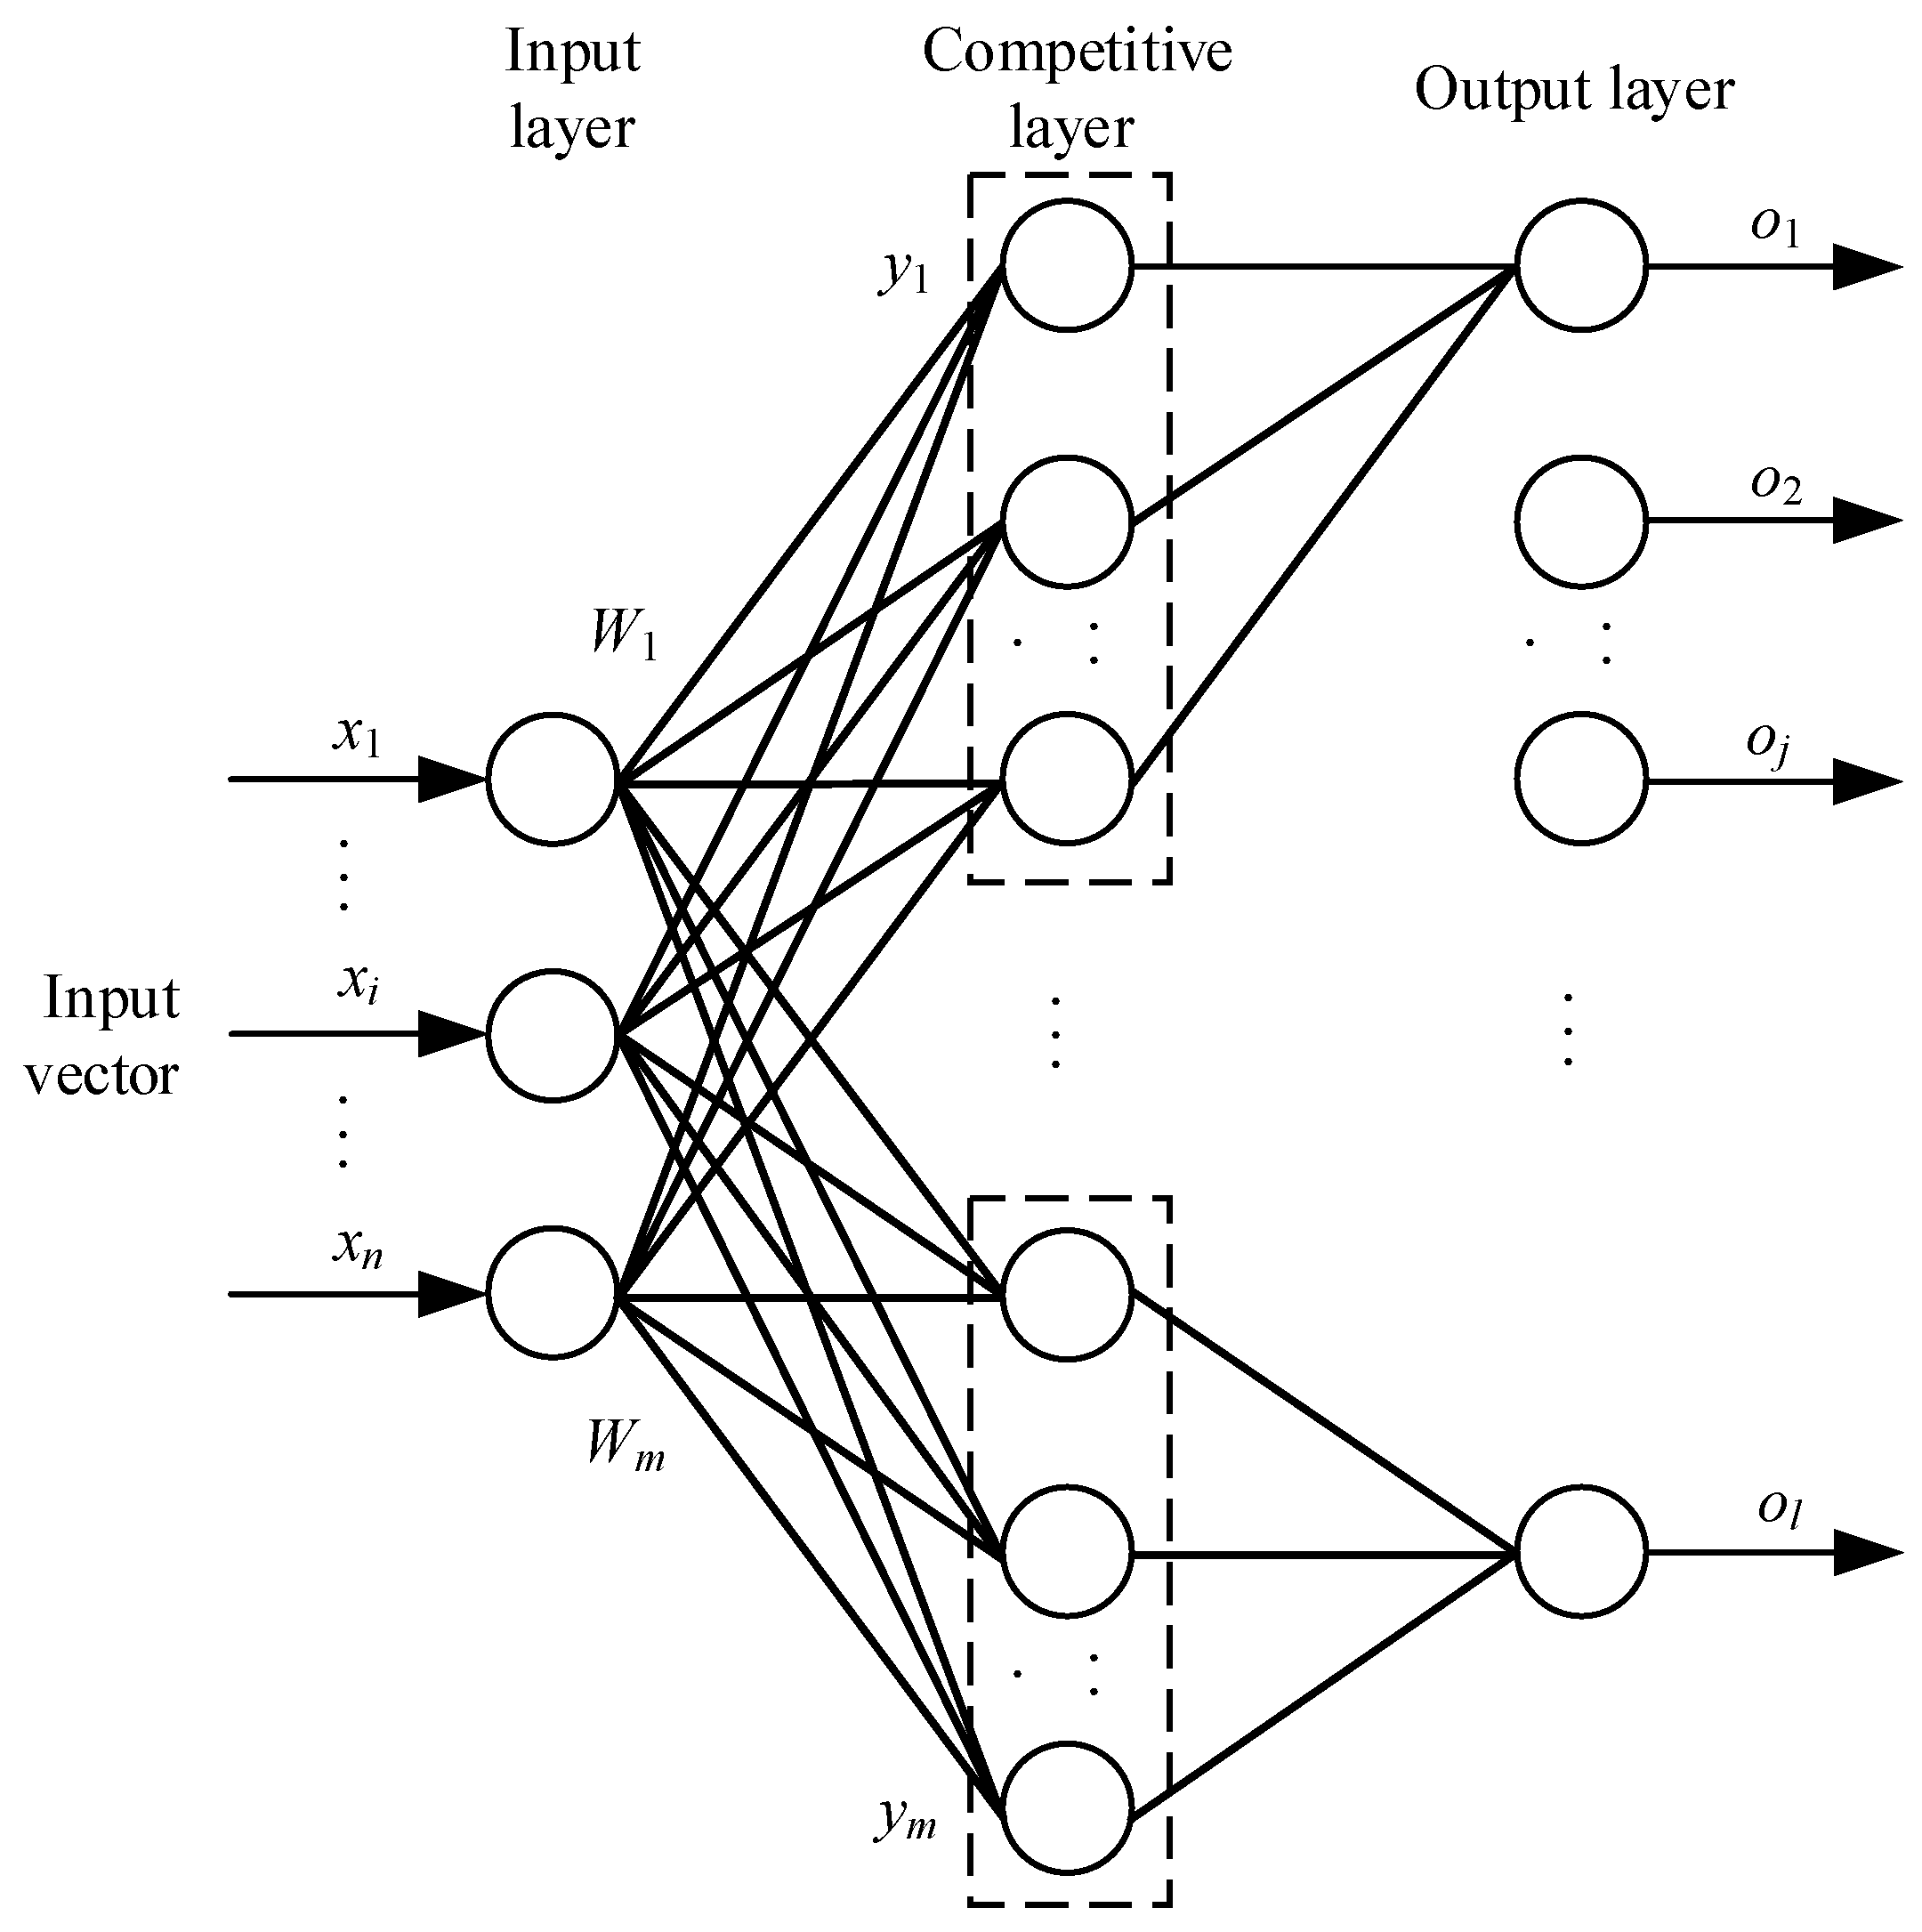
3.2. Learning Vector Quantization Neural Network (LVQNN)

LVQNN is a self-organized competitive network with supervised learning. Since the supervised signal regulates the distribution category of input samples, the weight can be adjusted through competition between competing elements to achieve the pattern recognition or classification. Compared with the self-organizing feature map (SOM), it can overcome the weakness caused by unsupervised learning algorithm and lacking classification information.
The structure of the LVQNN is shown in Figure 3.
An LVQNN consists of three layers of neurons, namely, the input layer, the competition layer and the output layer. The input layer is completely connected to the competition layer, and a reference vector is specified for each neuron in the competition layer. The weights of the connection between the input layer and the neurons in the competition layer constitute the components of the reference vector. In the process of neural network training, these weights are modified by supervised learning. There is a partial connection between the competition layer and the output layer, and the weight is a fixed value of 1.
The output values of neurons in the competing layer and the linear output layer are binary. When an input vector is given and sent to the network, the competing neuron closest to the input mode of the reference vector wins the competition and is activated as “1”, while other competing neurons are forced to be “0”. At the same time, the neurons in the output layer connected with the winning neurons are also set to “1”, and the neurons in other output layers are set to “0”. The output neuron that produces the “1” is the type of the input.

3.3. KPCA-LVQNN

KPCA-LVQNN is used to diagnose a water management subsystem fault of a PEMFC system, and the process is shown in Figure 4.
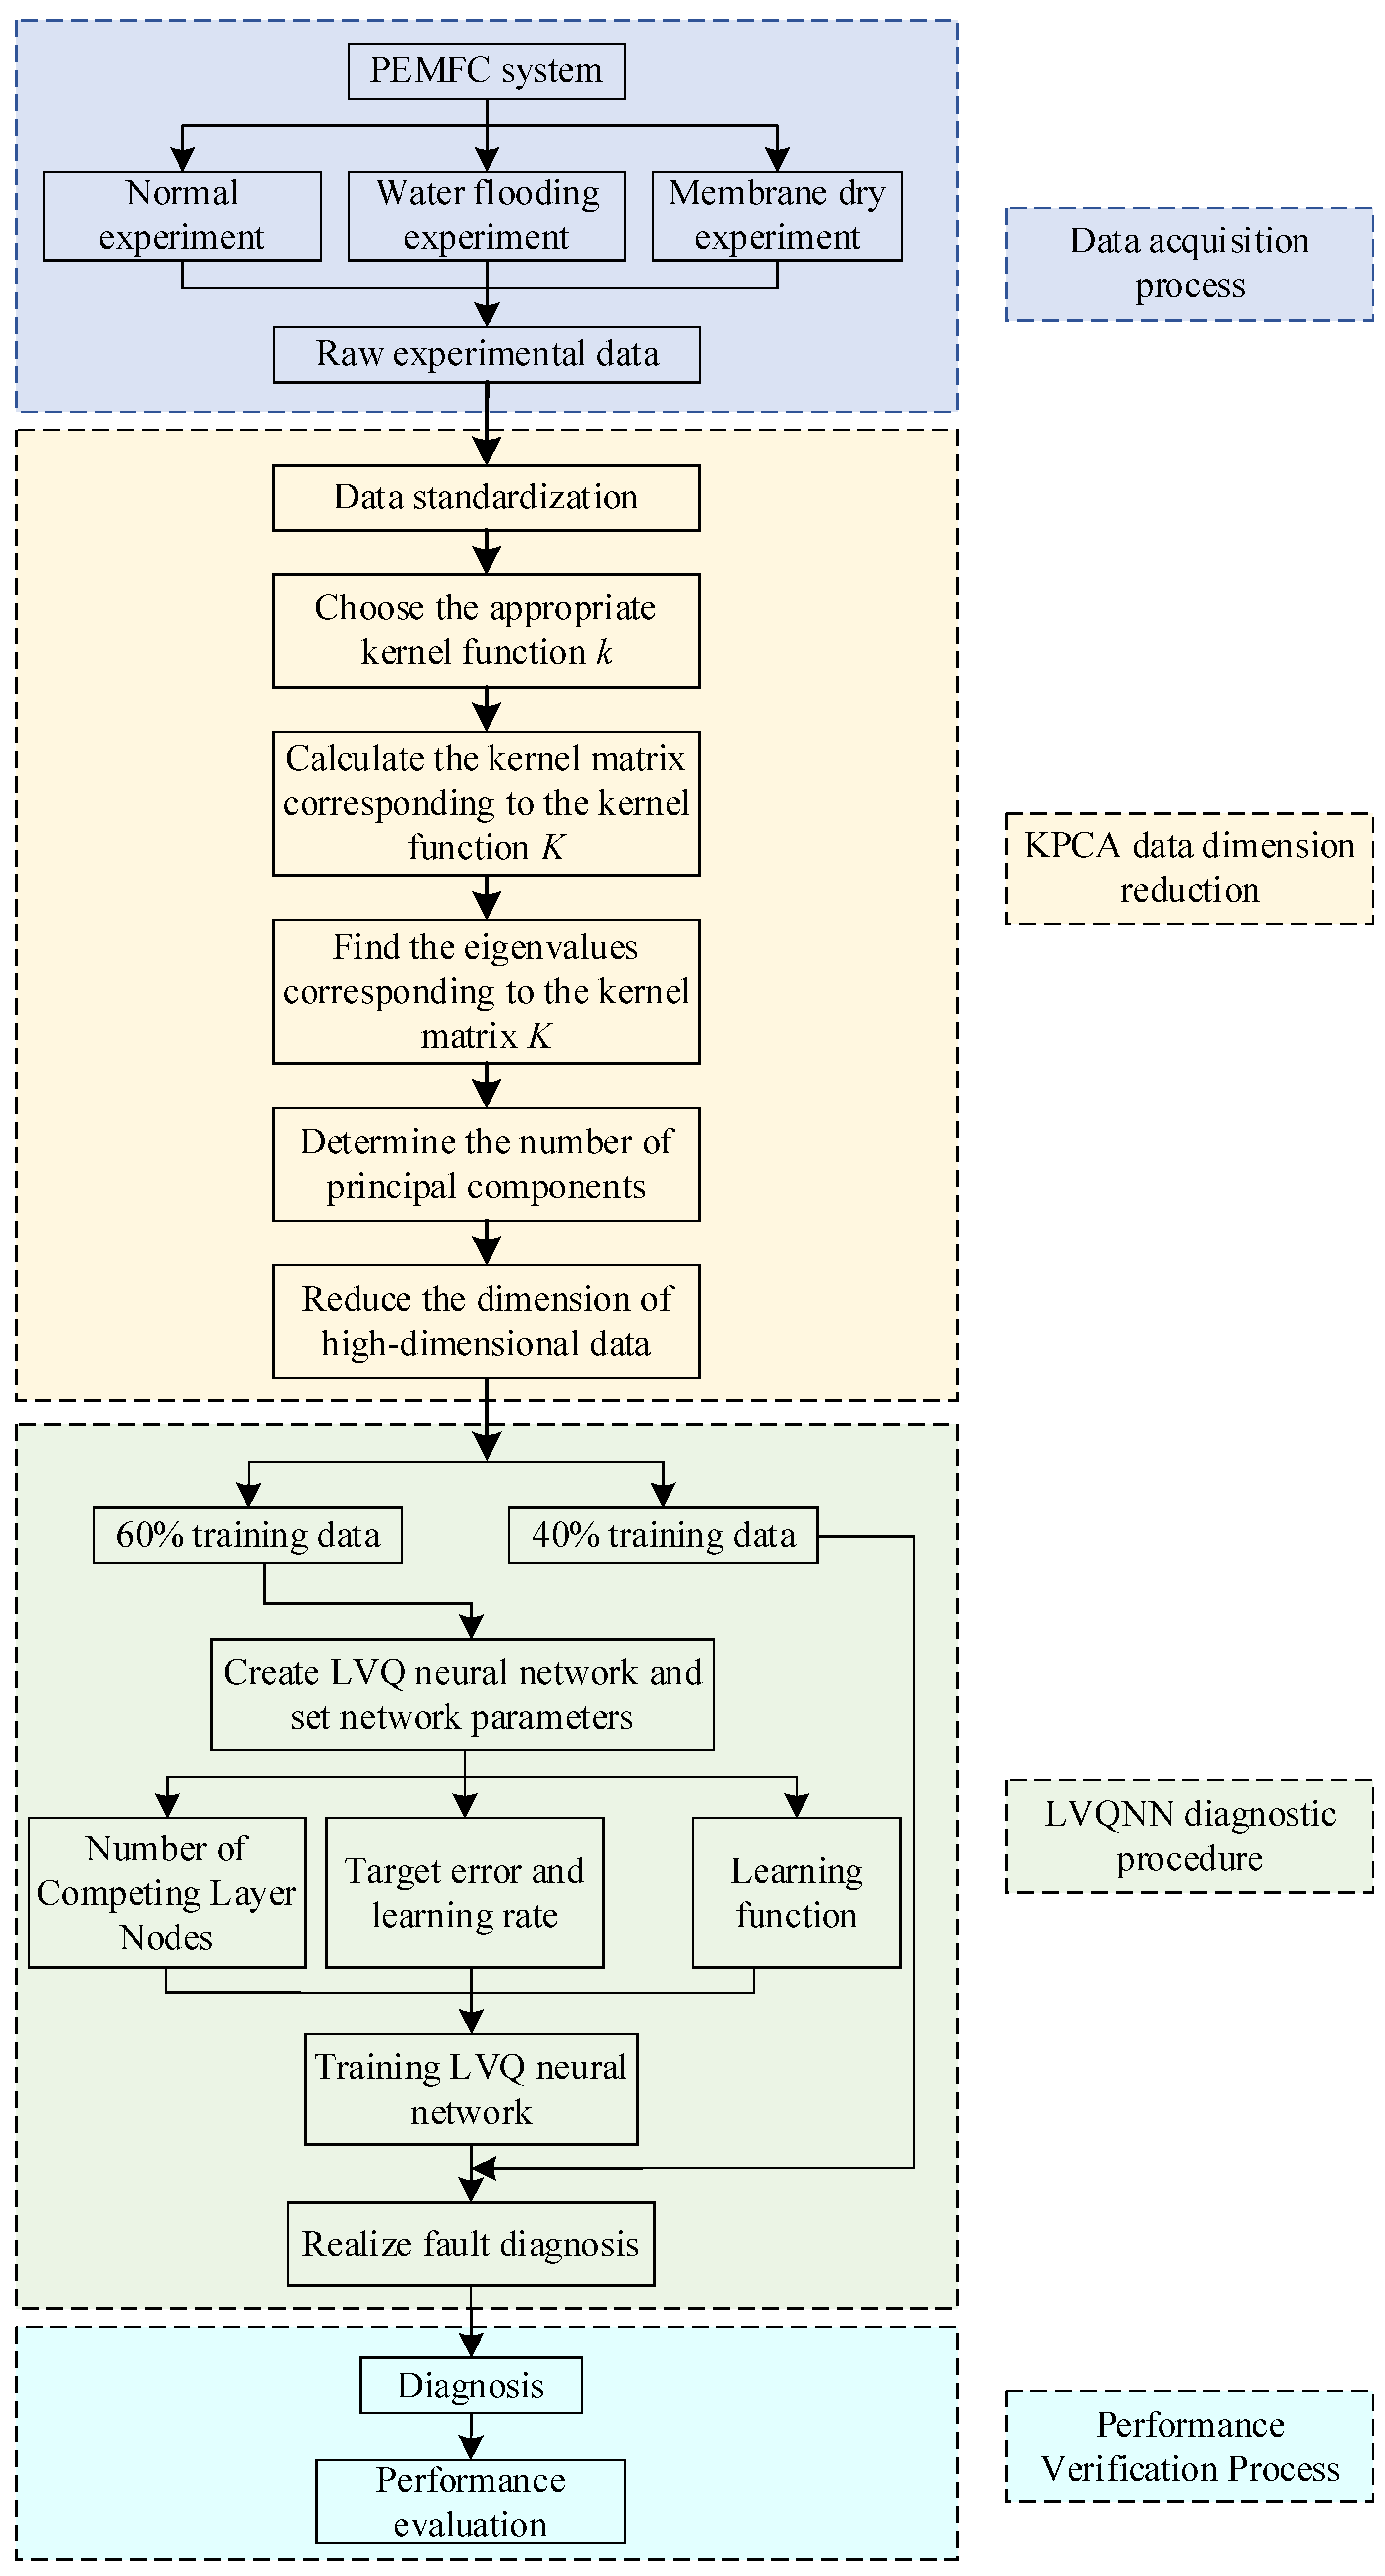
  • Collect the original data. By setting the operating parameters at the rated value, reducing the temperature of PEMFC and reducing the humidity of reaction gas, the PEMFC stack can be in a normal state, water flooding fault state and membrane dry fault state, respectively. The original experimental data of PEMFC system can then be collected in real time with the help of temperature, pressure, flow and voltage sensors.
  • Pre-process data. In order to reduce the dimensional differences between different parameters in the original experimental data, the original experimental data are standardized.
  • Reduce data dimension. In the original experimental data standardization, the dimension of the data is still very high and has strong coupling, and there are characteristic parameters not related to the diagnosis results. KPCA is used to determine the variance contribution rate and the number of principal components, reduce the dimension of the input feature quantity, and change it into a group of linearly unrelated variables, and finally complete the extraction of fault feature vector.
  • Divide the dimensionality-reduced feature data of health status into training and test samples with an ratio of 60% and 40%, respectively.
  • Train the neural network. The training set is introduced into LVQNN model to get the trained LVQNN diagnosis model.
  • Test the diagnostic results. The test set is input into the trained KPCA-LVQNN and the fault detection results are output.
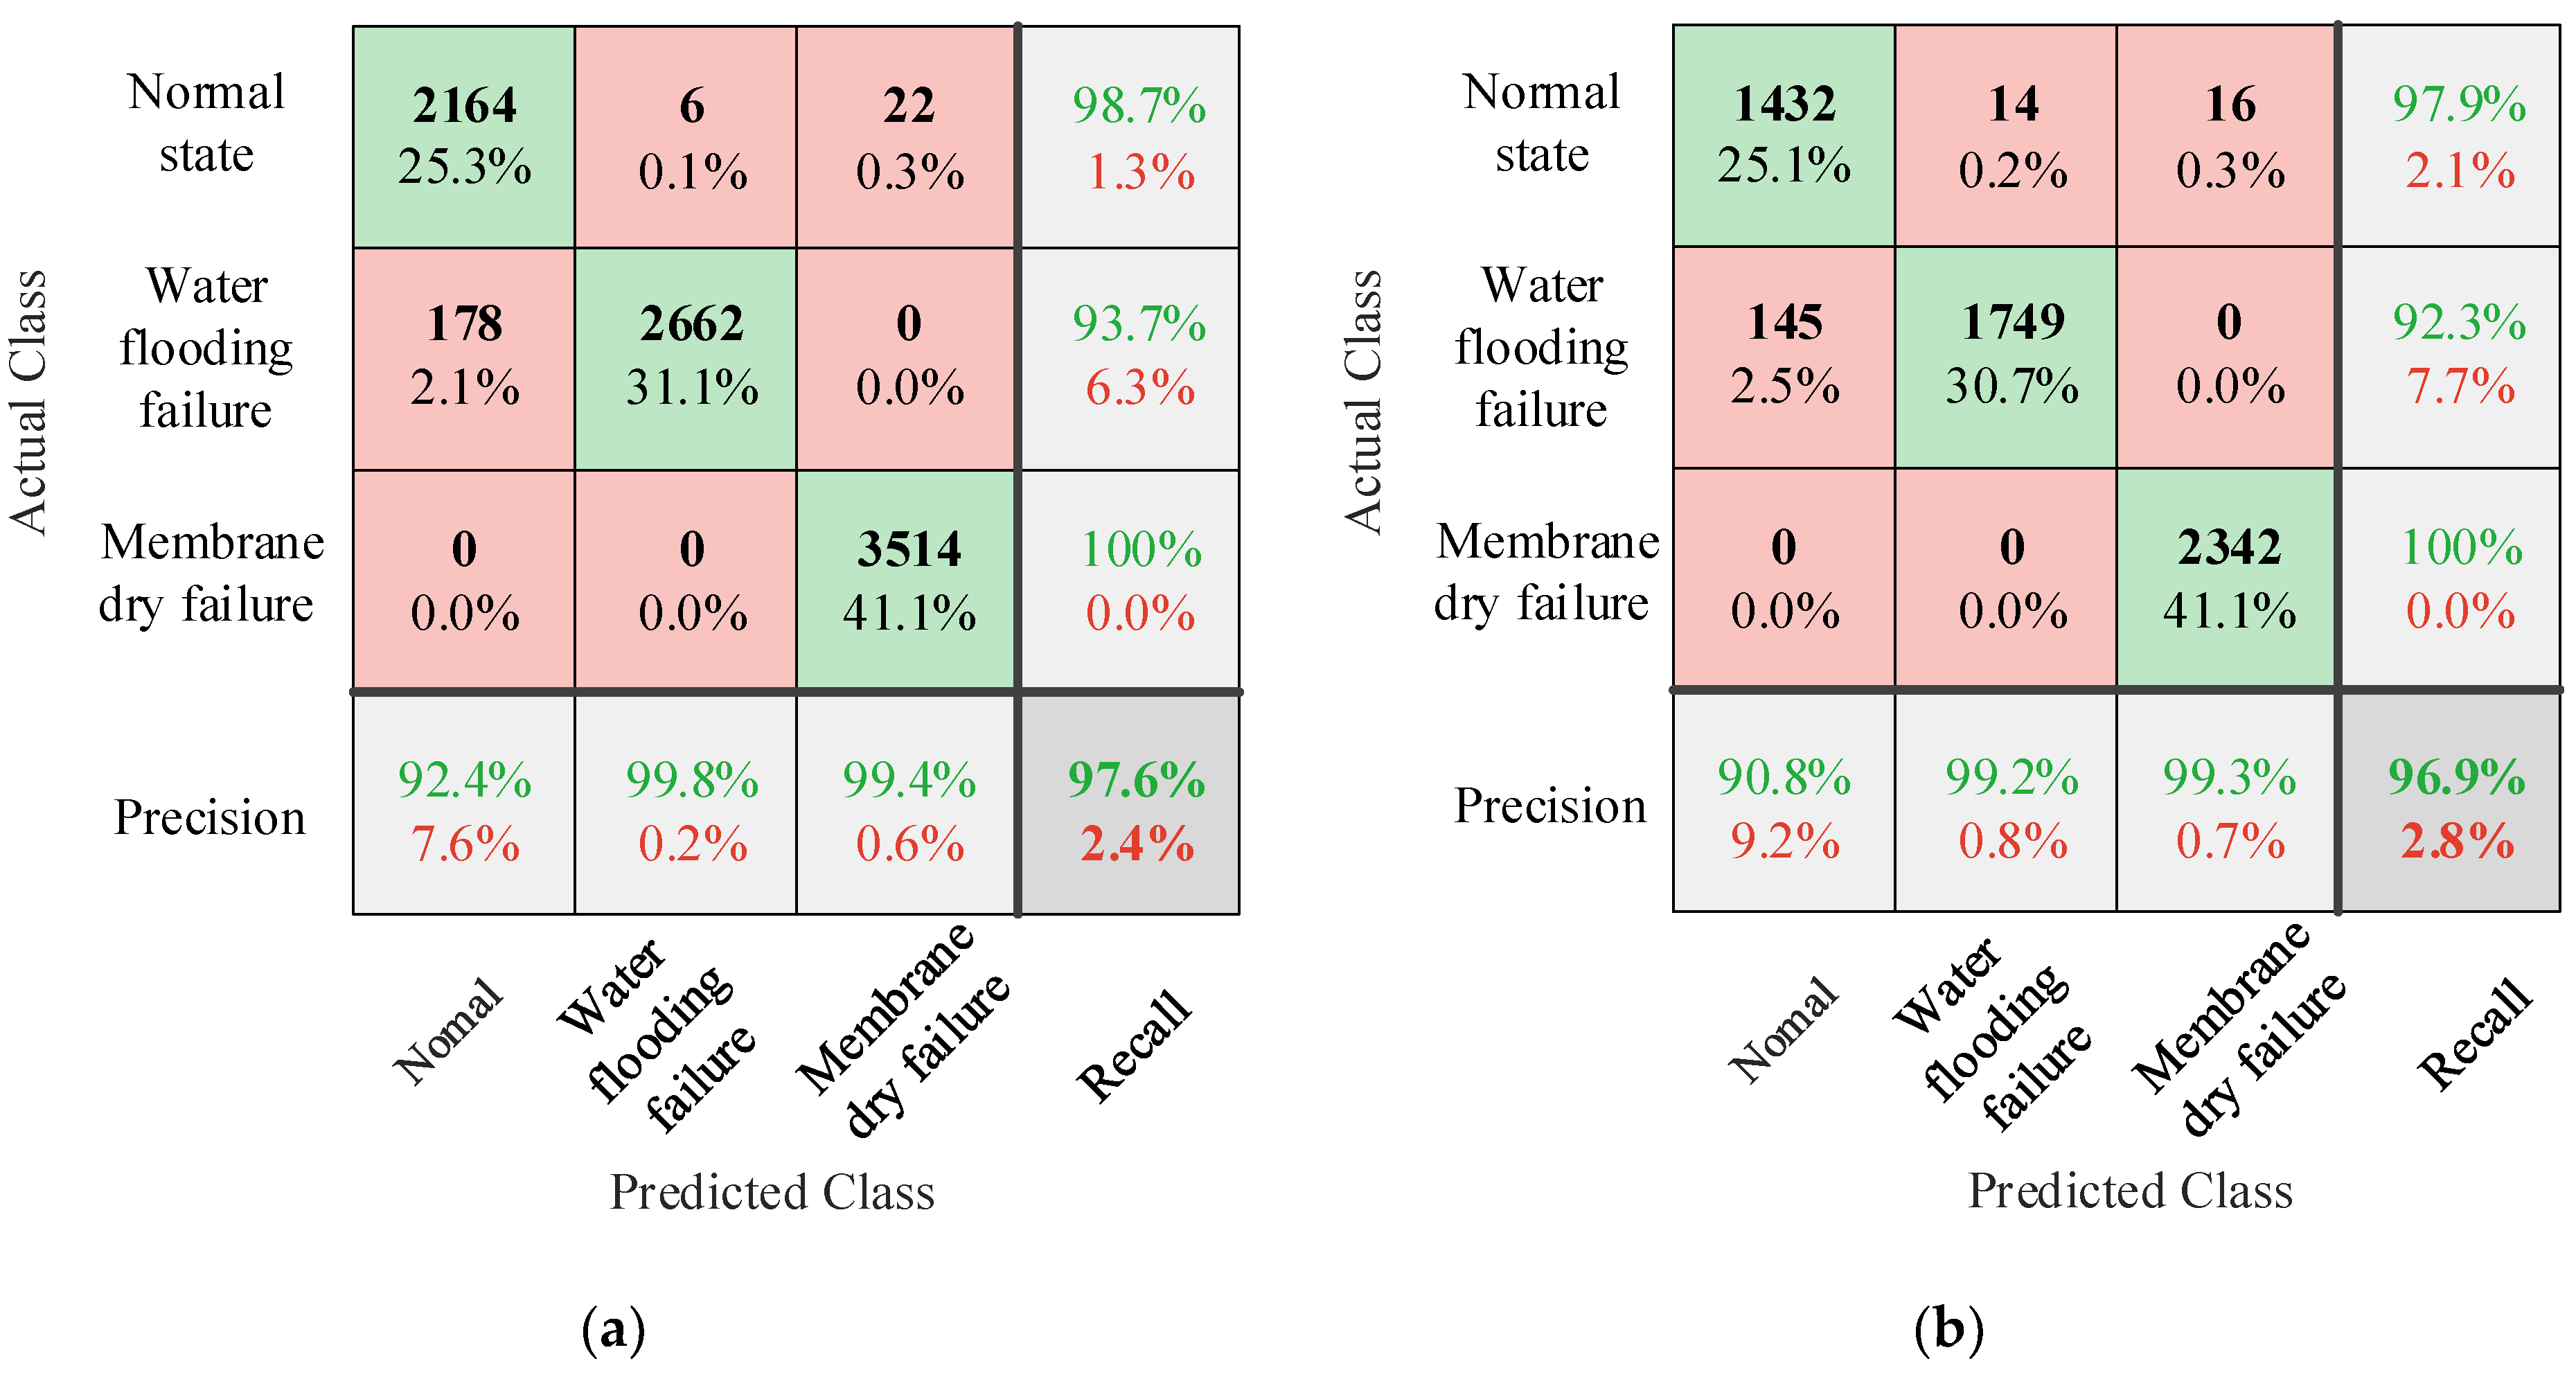
  • Analyze diagnostic results. The performance and feasibility of KPCA-LVQNN are evaluated by calculating the correct rate, false alarm rate and rejection rate, drawing the diagnosis result graph and establishing the confusion matrix. The feasibility of the method is evaluated by comparing with back propagation neural network (BPNN).

4. Results and Discussion

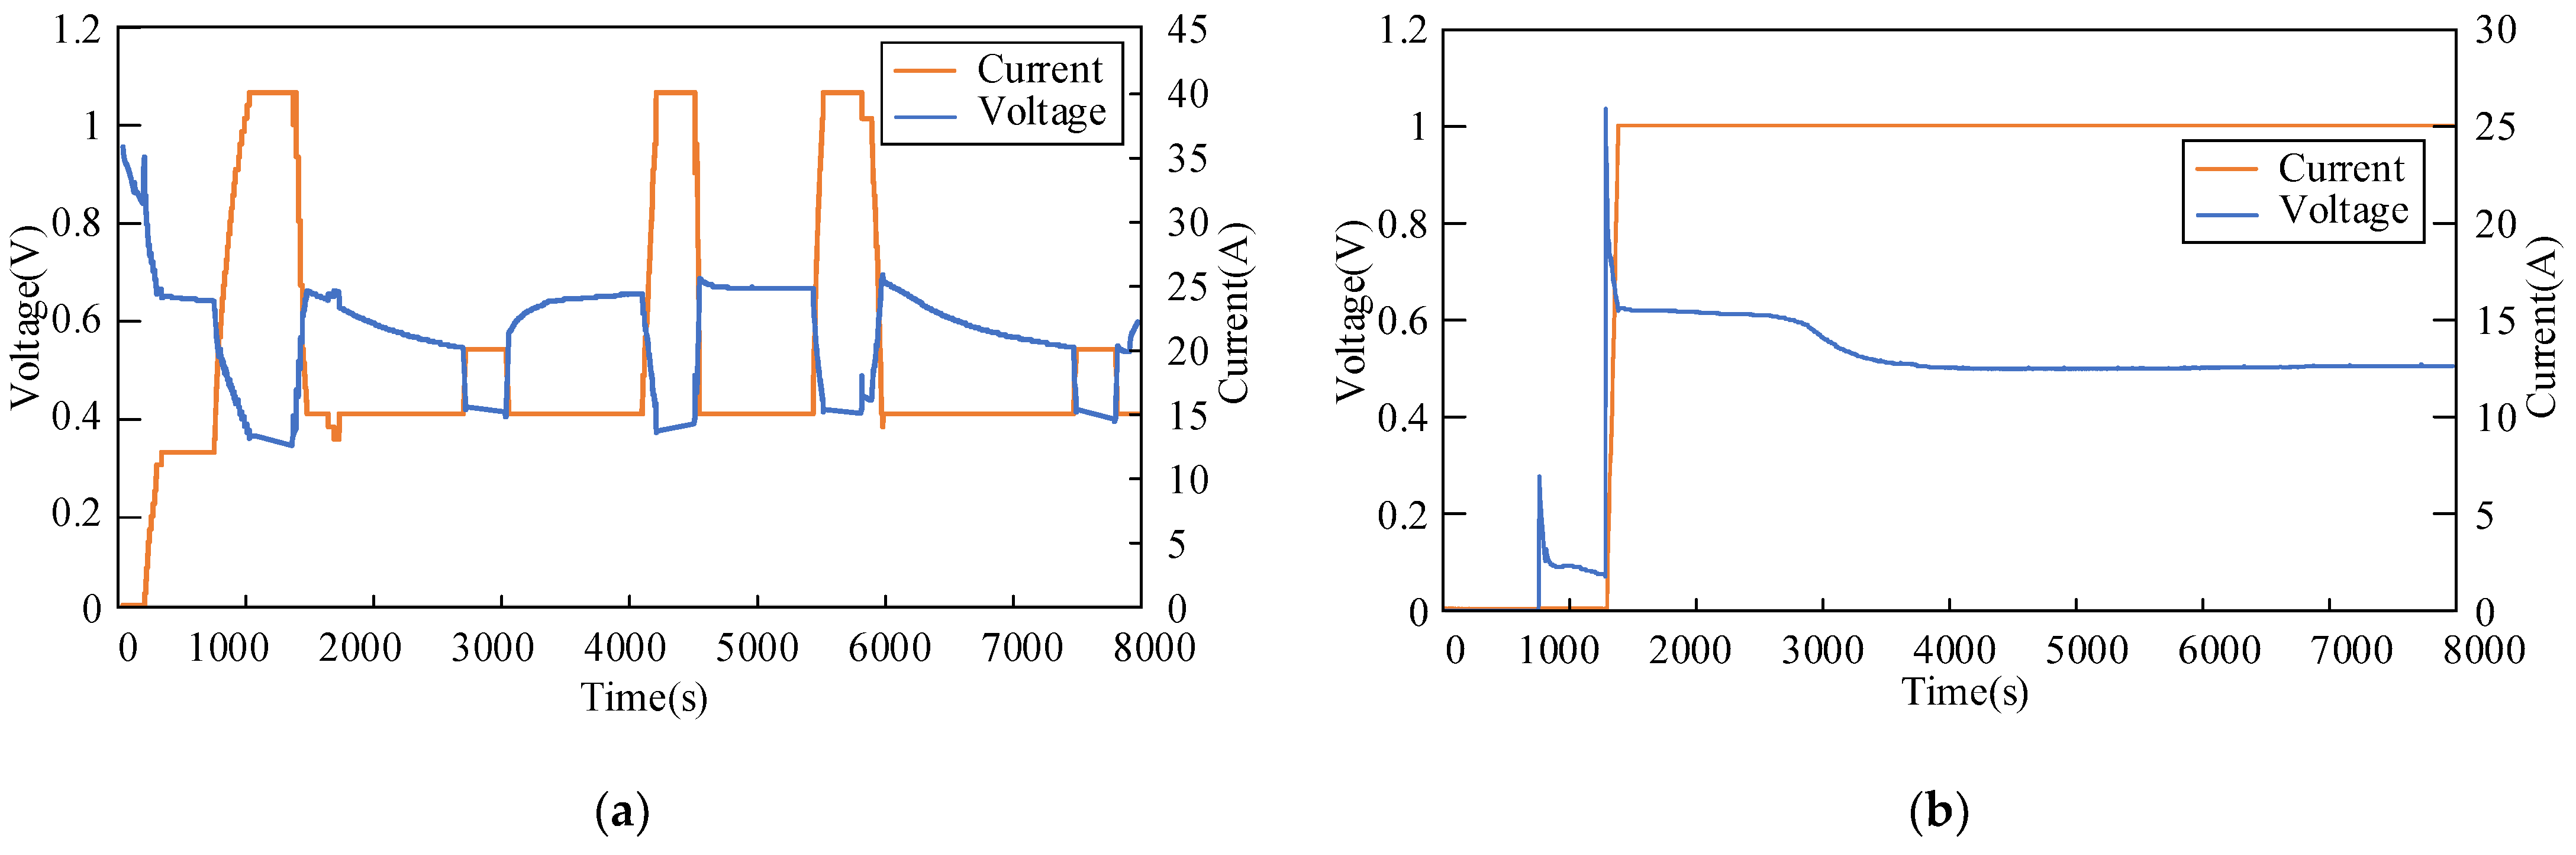
4.1. Experimental Data Acquisition

In order to verify the effectiveness of the KPCA-LVQNN method, it is vital, of necessity, to select the experimental data of three water management states: normal state, flooding failure and membrane dry failure. The specific acquisition methods are as follows.
Firstly, according to the test data of the PEMFC power system during the flooding failure experiment, define the 3% voltage drop of battery stack as the flooding failure, and the rest of the data as the normal state. Secondly, similarly, define 3% voltage drop of the battery stack as membrane dry failure, and the rest of the data are normal. A total of groups of experimental data are obtained, including 3654 groups under normal conditions, 4734 groups with flooding failures, and 5856 groups with membrane dry failures. It should be noted that the data of each health state are divided into training sample set and test sample set by 60% and 40%, respectively. The data division diagram and the number of samples for each water management state are shown in Figure 5.

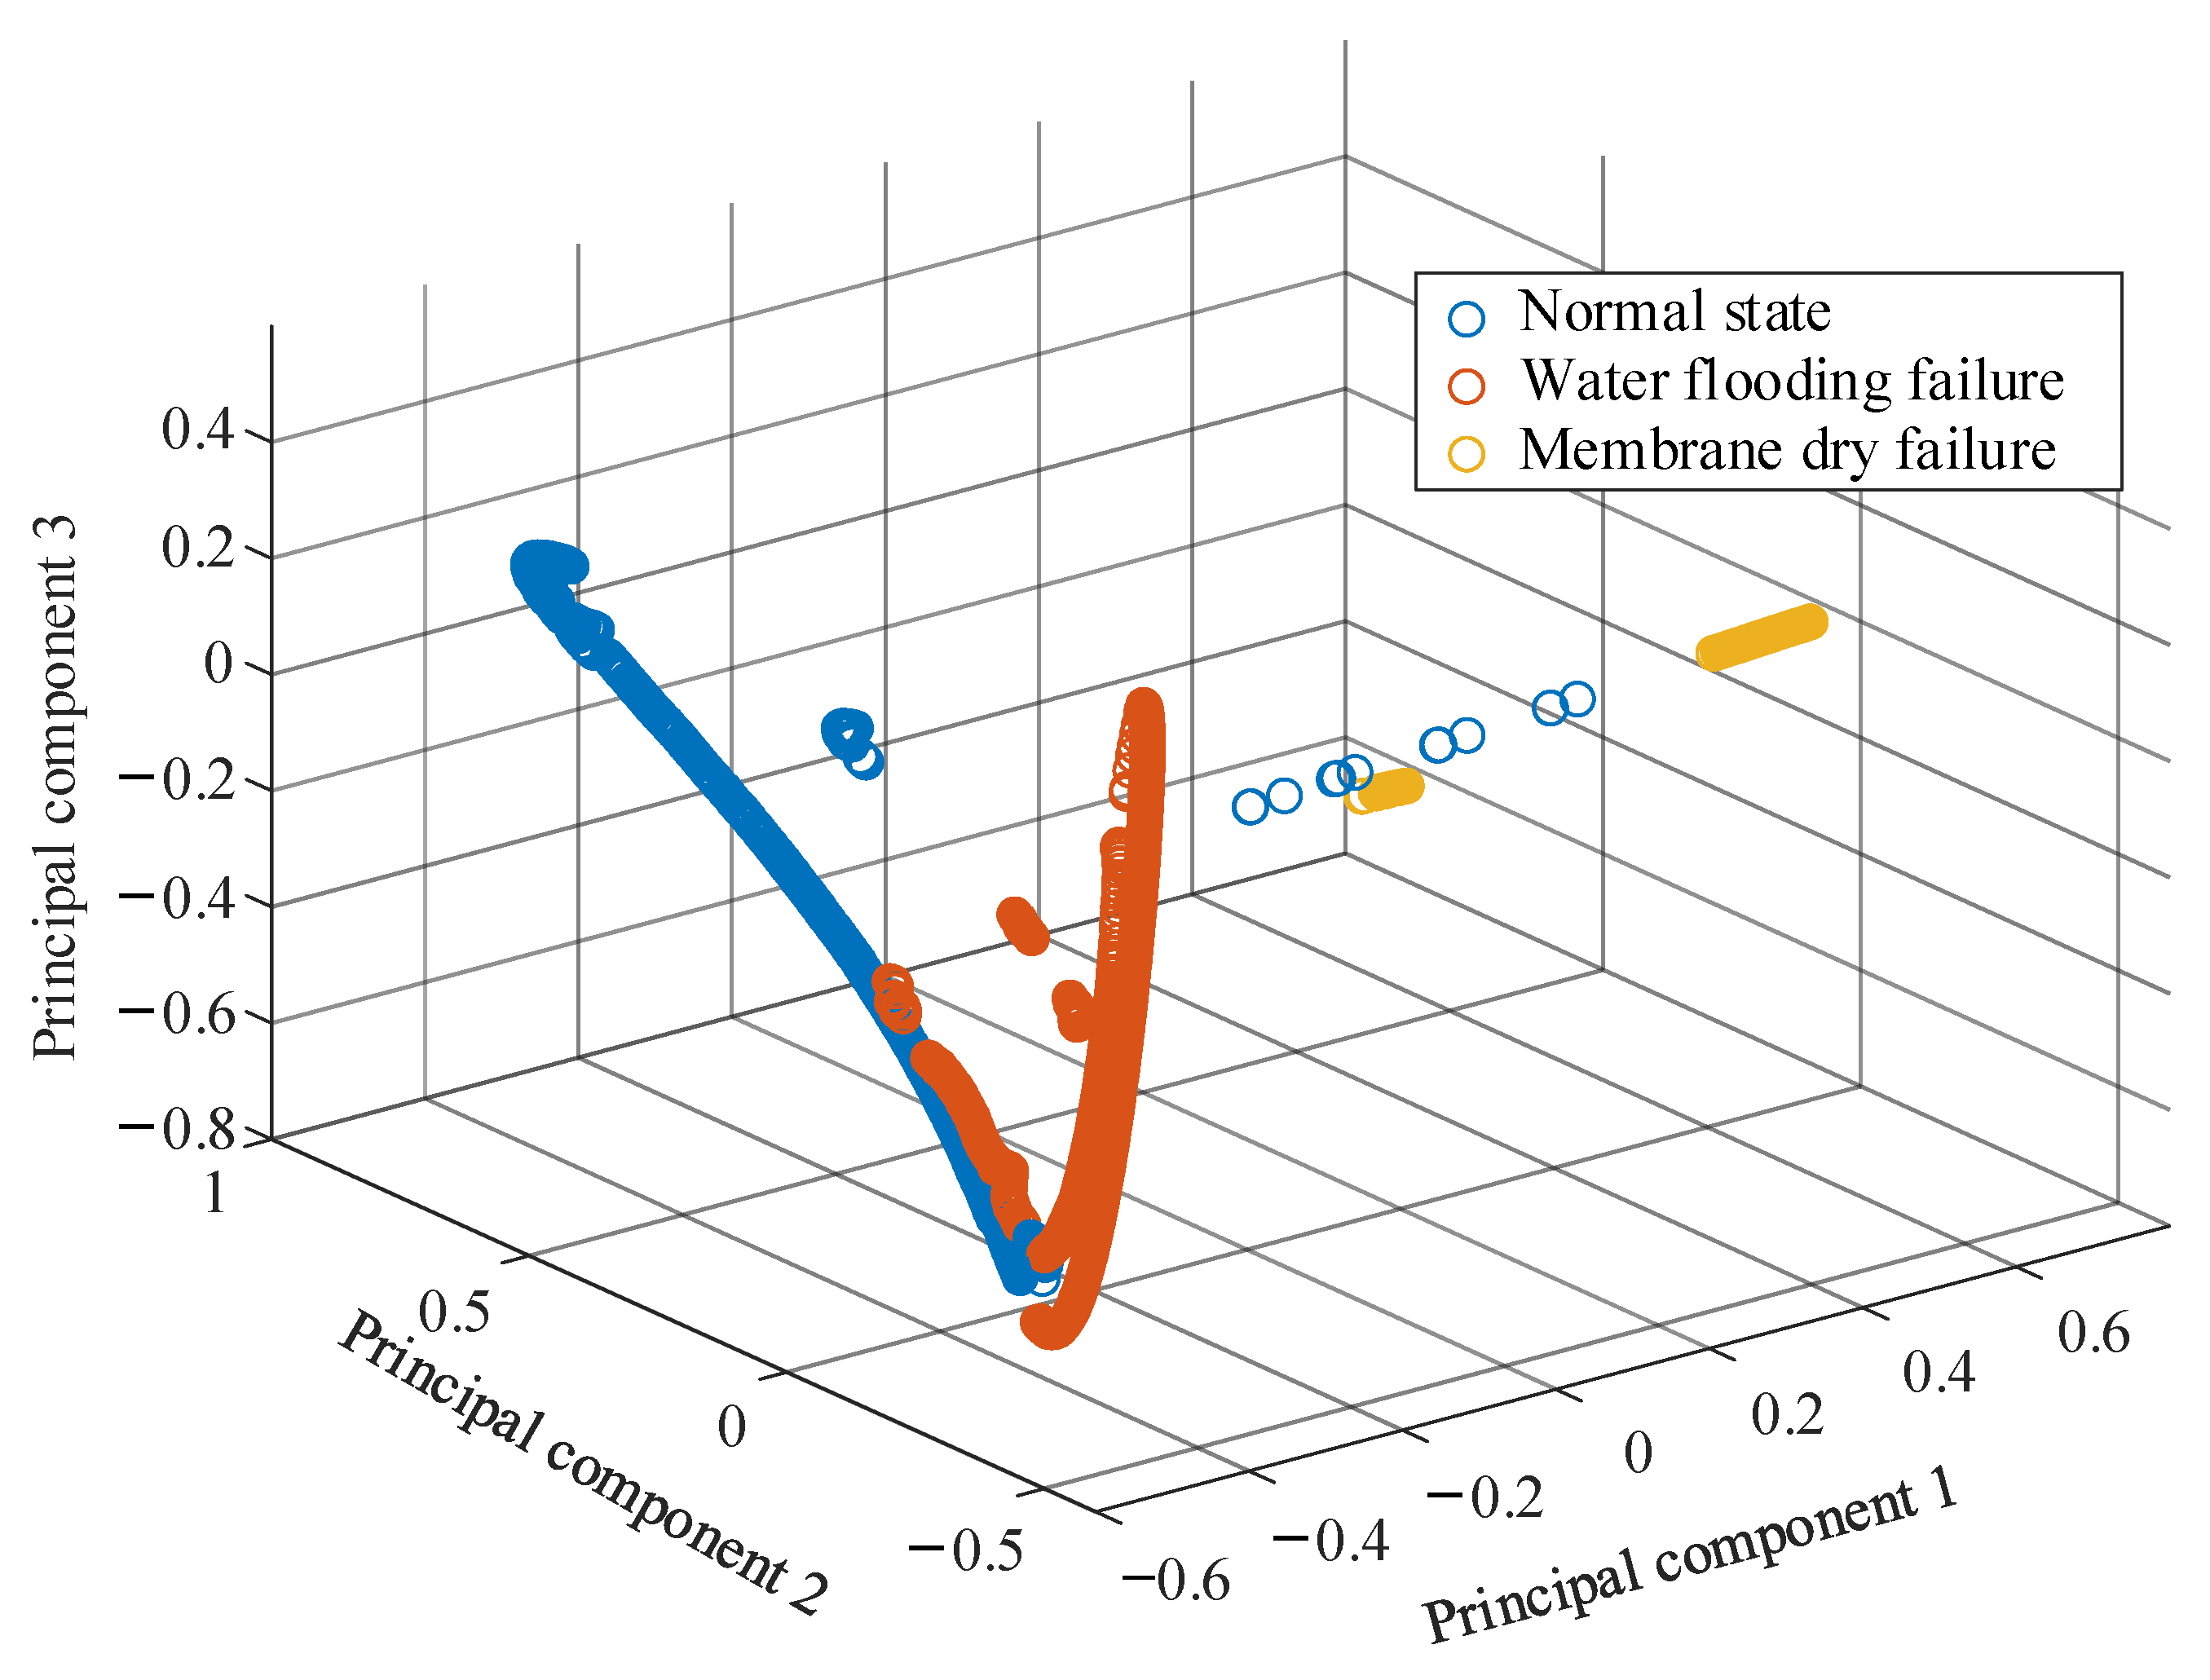
4.2. Fault Feature Vector Extraction

When the PEMFC power system is tested by water flooding fault experiment and membrane dry fault experiment, the sensor detects 14 kinds of feature variables related to the performance of PEMFC, so the fault characteristic variables of the original experimental data is 14 dimensions, and the specific variables are shown in Table 2.
In order to decouple the data to remove the irrelevant data interference and improve the visualization effect of the data, the KPCA is used to reduce the dimension of the original fault data and extract the principal components. The dimension reduction result is shown in Figure 6. Taking five projection vectors into account, the cumulative contribution rate has reached 95%, which indicates that the first five principal components contain most of the information of 14-dimensional original variables. Therefore, the 14-dimensional fault variables can be represented by five-dimensional vectors.
The visualization of three-dimensional features without KPCA is shown in Figure 7. Because the data of some normal states and the data of a flooding fault are taken from the same fault experiment, they are overlapped. Most of the data of the three states are distributed in different independent regions of three-dimensional space. If the data are presented in the five-dimensional feature space, the three types of fault feature data can be separated and easily distinguished, so the extracted five-dimensional fault feature vector can be used in the subsequent fault diagnosis process.
The data samples of the health status characteristics after dimension reduction are shown in Table 3. Given the large amount of sample data, only part of the sample data of health status is listed. A total of nine groups of three health states are presented here.

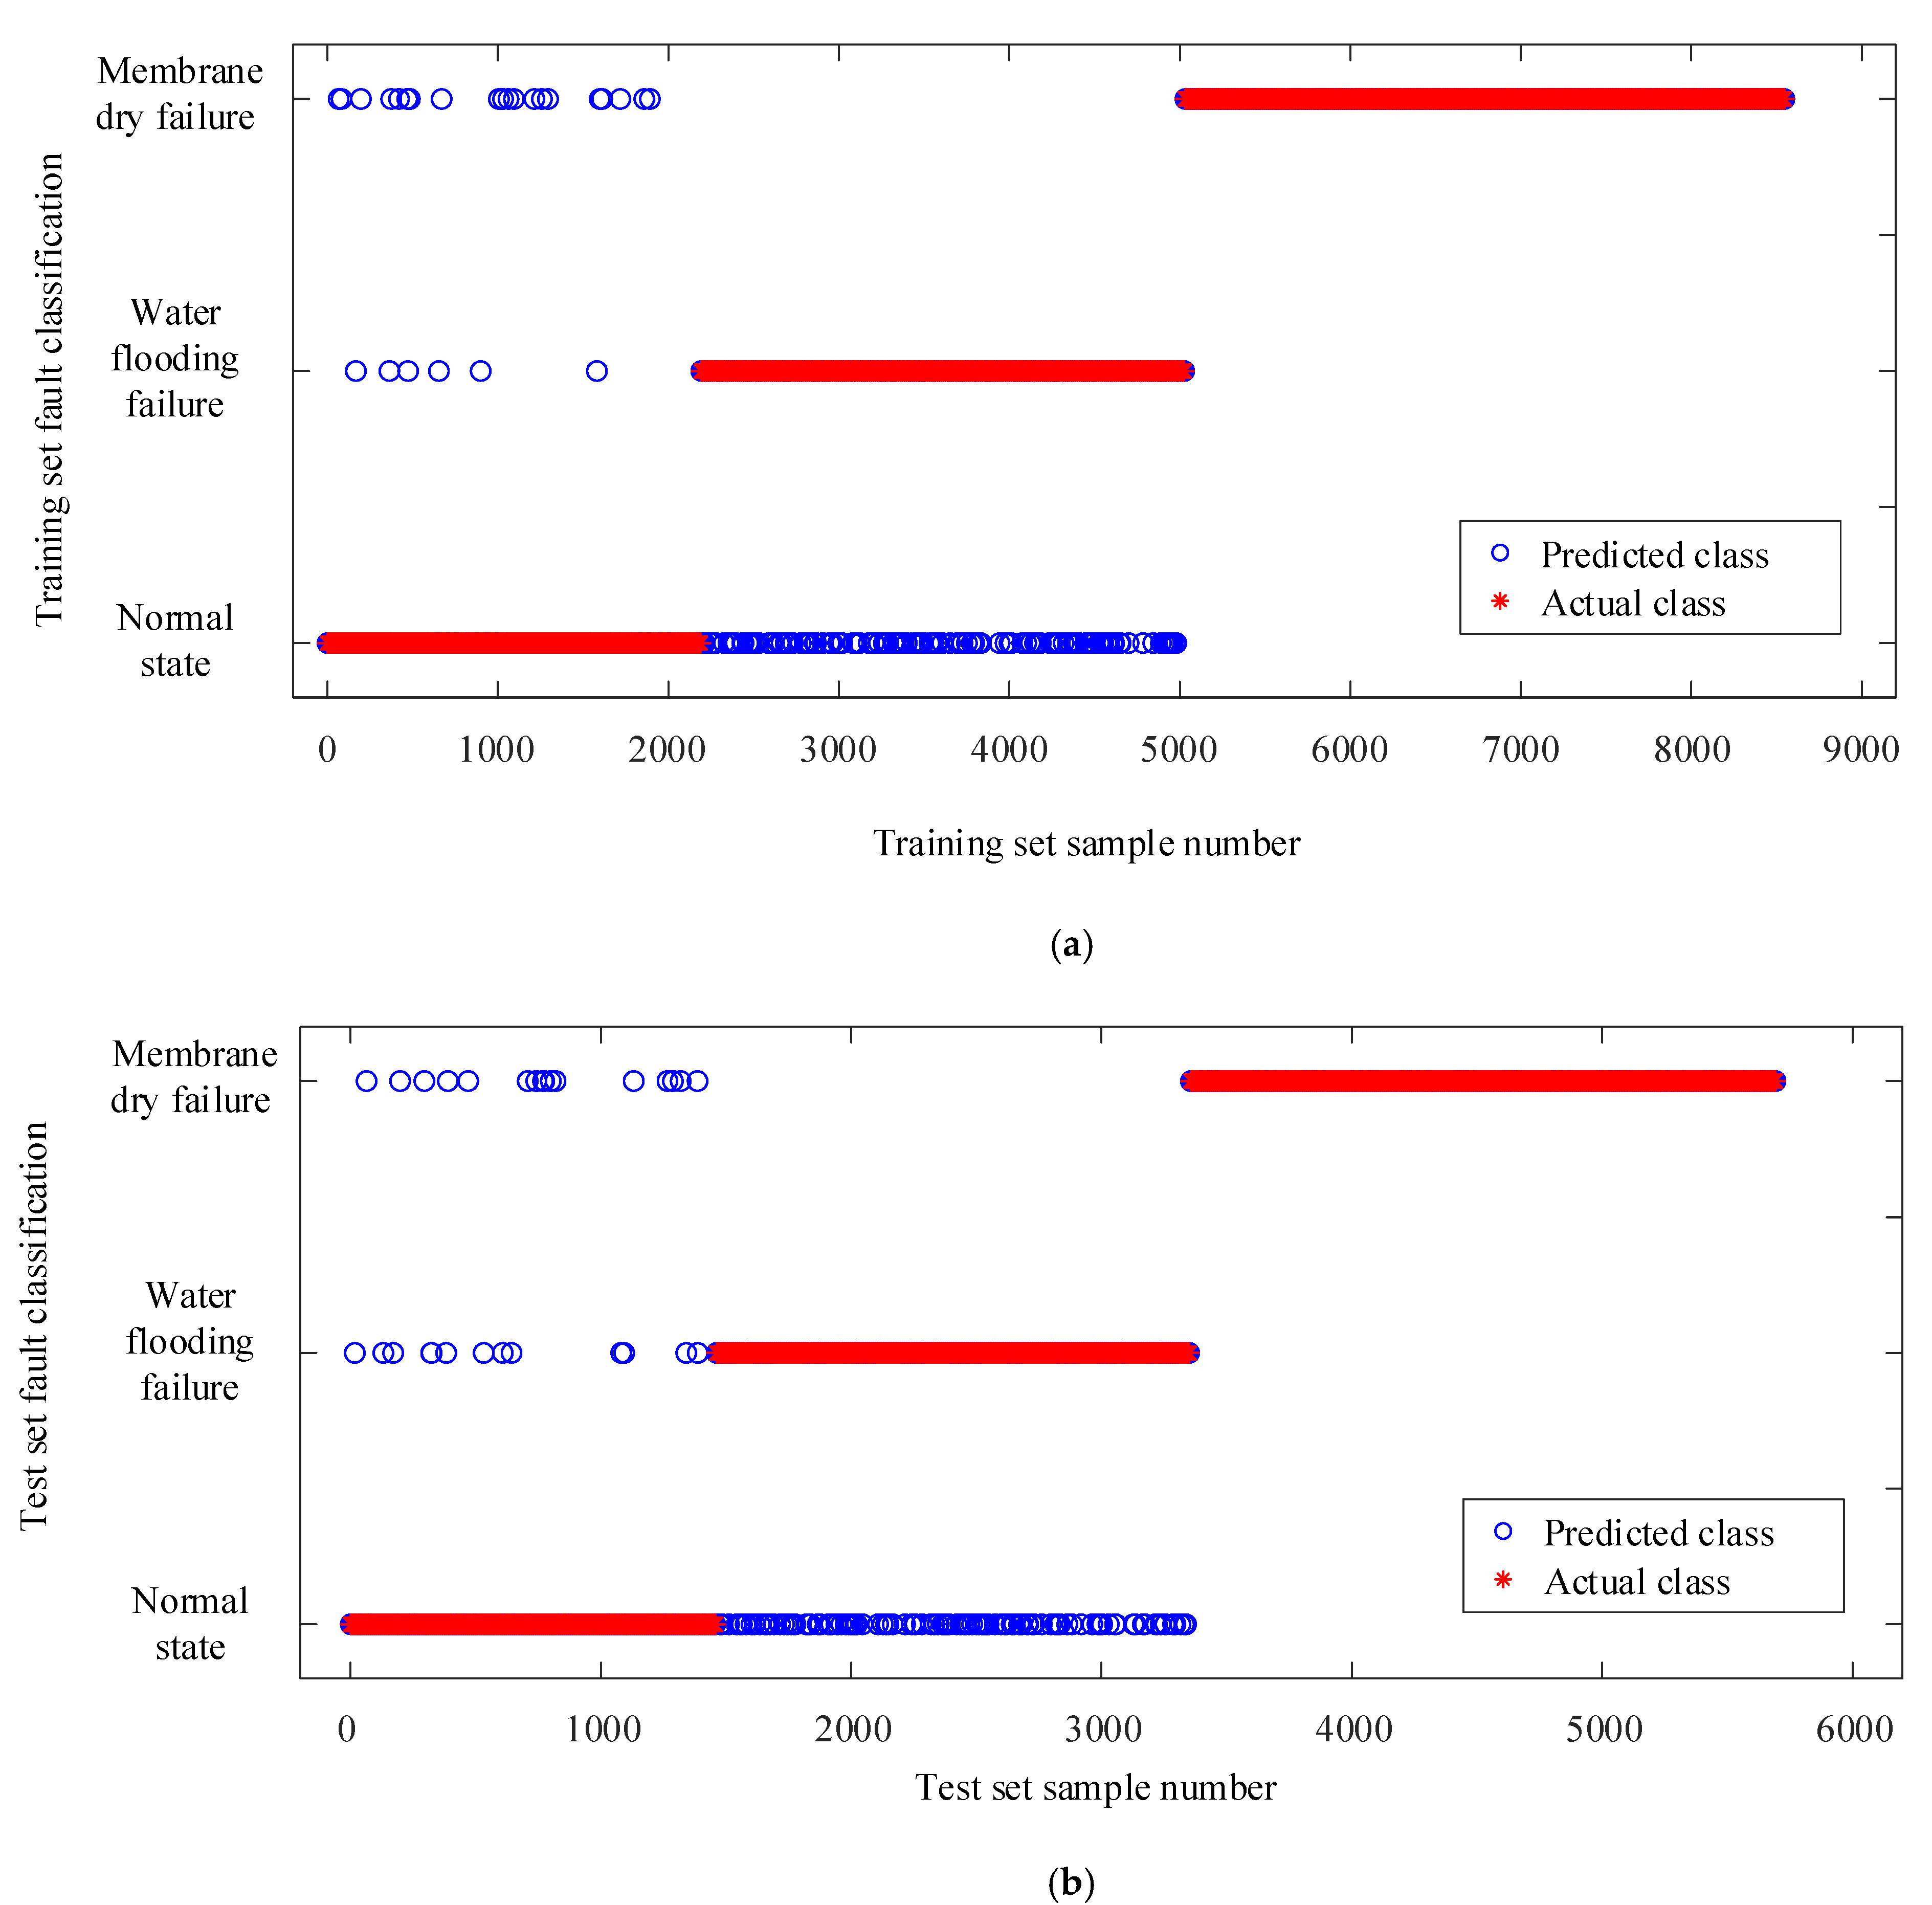
4.3. Fault Diagnosis Results

The function parameters of LVQNN are as follows. The learning function as “learn lv 1” is set by default. The maximum number of iterations of setting network parameters is 1000. The period of displaying intermediate results is 10. The learning rate is 0.1. The target error is 0.1. The five-dimensional fault feature vectors of the training set are input into the LVQ neural network model to train the KPCA-LVQNN neural network, and then the fault feature vectors of the test set are input into the trained LVQ neural network for fault diagnosis.
The fault diagnosis results of the test set based on KPCA-LVQNN are shown in Figure 8. In the figure, with an LVQ neural network training classifier, the recognition accuracy of training set samples and test set samples are 97.6% and 96.9%, respectively.
In order to better describe and analyze the diagnosis results, false alarm rate (FAR) and false rejection rate (FRR) are used to further analyze the diagnosis results. The FAR is defined as the percentage of the samples that are misdiagnosed as fault state in the total samples of normal state, and the FRR is defined as the percentage of the samples that are misdiagnosed as normal state in the total samples of fault state. The FAR of the KPCA-LVQNN training set is 1.28%, and the FRR is 2.80%. The FAR of test set is 2.05%, and the FRR is 3.42%. It can be found that a small number of normal states are misjudged as flooding and membrane dry fault, and some flooding fault cannot be diagnosed with KPCA-LVQNN. The reason is that the degree of water flooding and membrane dry fault in this part is relatively slight, and the reduction of voltage is relatively small, which is similar to the experimental data in normal state.
A confusion matrix is used to visualize the prediction effect, which is usually used in supervised learning. The total number of each column of the confusion matrix represents the total number of samples predicted for the category, and each row represents the actual total number of samples for the category. The confusion matrix of the training set and test set samples are shown in Figure 9.
At the same time, precision and recall rate are used to evaluate the proposed approach effect. Precision rate is defined as the percentage of the number of correct samples of each type of prediction in the total number of samples. It can reflect the probability of successful prediction when the prediction is in a certain health state. Recall rate is calculated by taking the number of correctly predicted samples of each class divided by the total number of actual samples. Recall rate reflects the ability of the classifier to identify each health state, and is usually used as an important index when the number of data is skewed.
In Figure 9, the green square represents the number of samples identified accurately, and the pink square represents the number of samples identified incorrectly. The bottom square represents the precision rate of the three health states, of which the precision rates of the test sets are 90.8%, 99.2% and 99.3%, respectively. The right square represents the recall rate of each category, of which the recall rates of the three health state test sets are 97.9%, 92.3% and 100%, respectively. The dark square in the lower right corner represents the correct recognition rate of the predicted sample, and the correct recognition rate is 96.9%.
To further illustrate the classification effect, the index receiver operating characteristic (ROC), can be used to evaluate a classifier and has a helpful property in that it can remain constant even when the distribution of the samples in the test set changes. The abscissa of ROC curve is false positive rate (FPR), and the ordinate is true positive rate (TPR). The ROC curve of the proposed KPCA-LVQNN for training can be obtained by calculating multi-classification FPR and TPR. The result is shown in Figure 10. It can be seen that when TPR = 1 and FPR = 0, the closer ROC curve is to the point (0, 1) in the figure, the better the recognition effect is. Therefore, the KPCA-LVQNN method proposed has a good recognition effect.

4.4. Comparative Analysis

In order to illustrate the feasibility of the proposed KPCA-LVQNN method, BPNN is used as the comparative verification method, and the data after dimension-reduction of KPCA in Section 4.2 is used as the sample data in the BPNN method. In addition, to illustrate the necessity of the dimension-reduction algorithm, feature data without dimension-reduction is also set for health status identification. The parameters of BPNN are listed as follows. The number of neurons in the hidden layer is 2n + 1 (n is the dimension of fault features). The learning rate is 0.1. The target error is 0.1. The recognition accuracy of test sets with different detection methods is shown in Table 3, and the identification time of different detection methods is shown in Table 4.
As can be seen in Table 4, the data after dimension reduction by the KPCA algorithm can greatly improve the accuracy of fault diagnosis. In Table 5, the identification time of LVQNN and BPNN data after dimension reduction is reduced. Therefore, it can be shown that the KPCA algorithm reduced computational complexity, obtained essential features and removed useless noise. At the same time, it can be seen from Table 4 and Table 5 that by comparing the recognition results of LVQNN and BPNN, LVQNN is much better than BPNN in accuracy and calculation time of the three health states. Compared with the conventional approach of BPNN, the testing accuracy of the proposed method of KPCA-LVQNN is improved with 21.22%, and the calculation time is shortened with 6.2743 s, which indicates that LVQNN is effective for pattern recognition.
In conclusion, the fault diagnosis method of PEMFC water management based on KPCA and LVQNN has higher recognition accuracy and short operation time, which is suitable for abundant sample data and can realize the fault diagnosis of a fuel cell system effectively.

5. Conclusions

In this paper, a PEMFC water management subsystem fault diagnosis method based on LVQNN and KPCA is proposed to realize fault diagnosis of three health states. The conclusions are as follows:
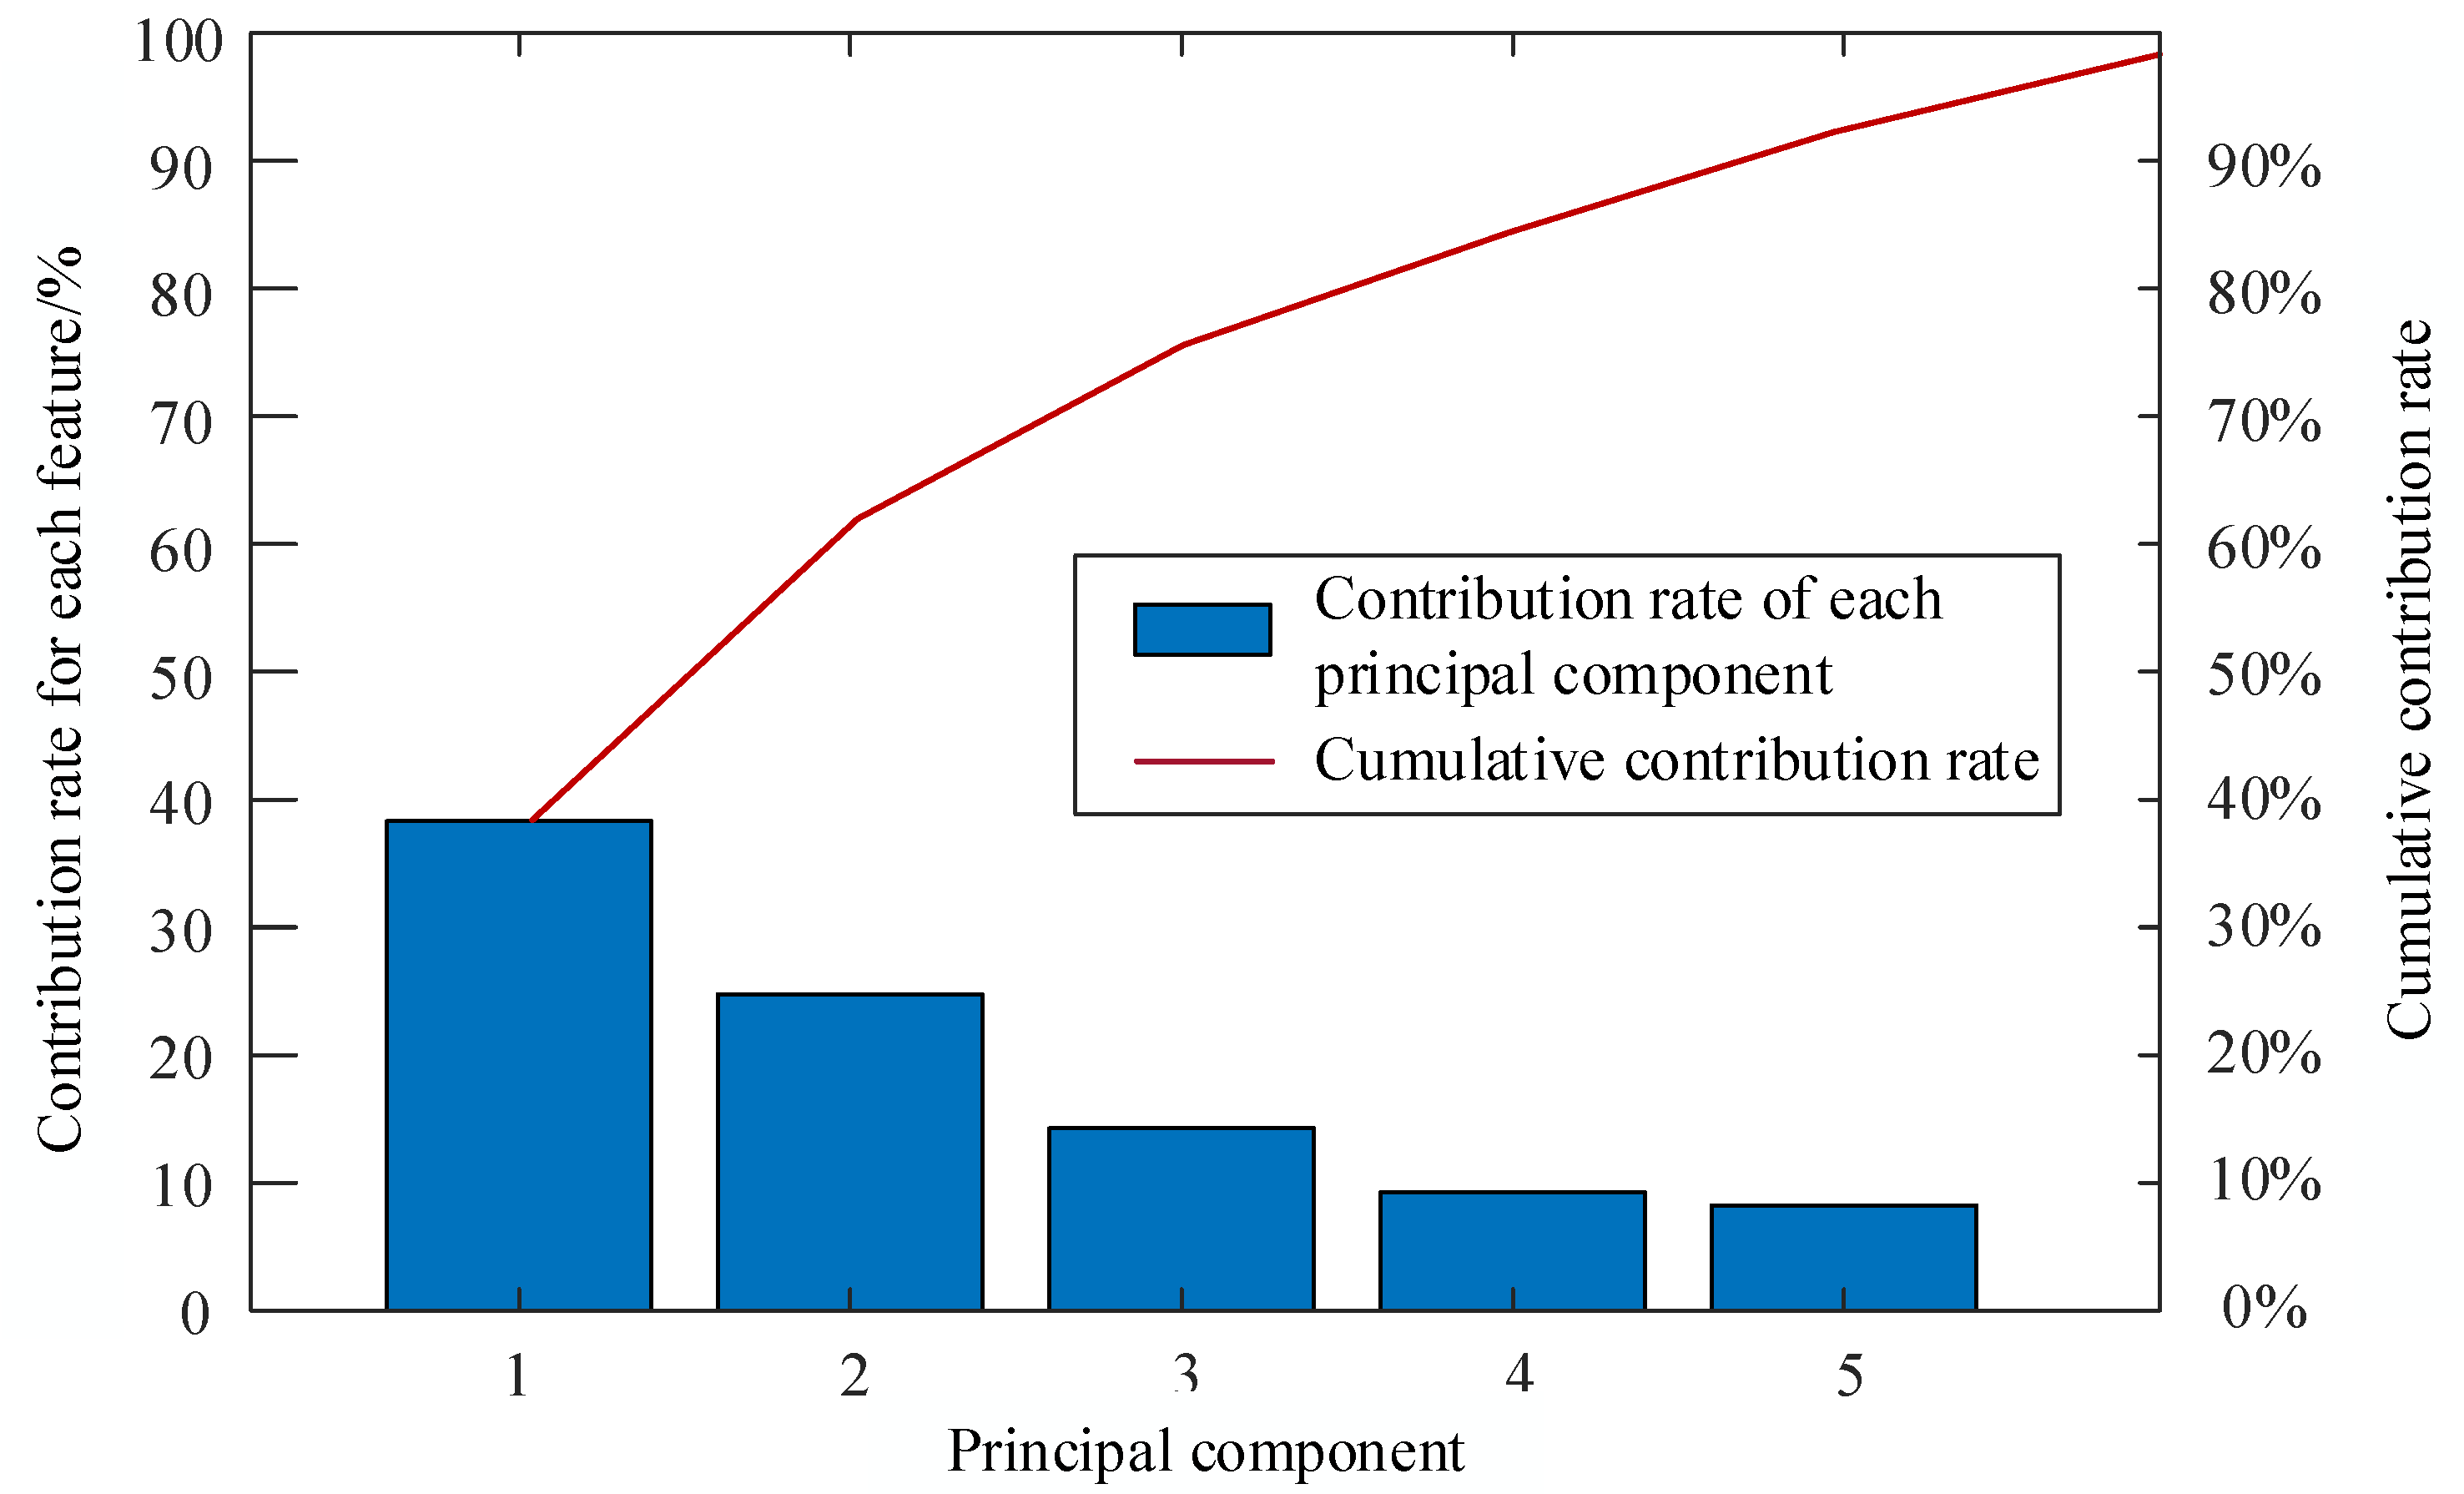
  • The KPCA algorithm can reduce the dimension of high-dimensional data, which can extract the essential characteristics of data, and reduce the calculation time. The cumulative contribution rate reaches 95% in the experiment, indicating that the first five principal components can characterize 14-dimensional sample data.
  • LVQNN is a self-organizing competitive network with supervised learning, which has a good performance in recognition effect. The analysis results of samples show that the proposed method can accurately diagnose the PEMFC system with three health states: normal state, membrane dry fault and water flooding fault. The recognition accuracy of training set samples and test set samples are 97.6% and 96.9%, respectively, and the operation time is 2.5333 s. The FAR of training set is 1.28% and the FRR is 2.80%. The FAR of the test set is 2.05% and the FRR is 3.42%.
  • The proposed method is particularly suitable for processing health status data with high dimensions and abundant samples. Compared with the BPNN method, it is found that the proposed method has higher fault diagnosis accuracy and less computation time, with the testing accuracy improved by 21.22% and the time is shortened by 6.2743 s.
  • The proposed KPCA-LVQNN method can not only solve the problem of PEMFC water management subsystem fault diagnosis, but also can be applied in a broader range of engineering fields. Given insufficient experimental conditions, only three health states were detected in this work. Future studies will include more types of health state for detection by collecting more original feature data of failure types.

Author Contributions

Conceptualization, S.J., Q.L. and W.C.; methodology, S.J; software, S.J.; validation, S.J., Q.L. and R.G.; formal analysis, S.J. and R.G.; writing—original draft preparation, S.J.; writing—review and editing, S.J.; funding acquisition, Q.L. and W.C. All authors have read and agreed to the published version of the manuscript.

Funding

This work was supported by the National Natural Science Foundation of China (NSFC) under Grant No. 51977181 and No. 52077180.

Conflicts of Interest

The funders had no role in the design of the study; in the collection, analyses, or interpretation of data; in the writing of the manuscript, or in the decision to publish the results.

References

  1. Chen, W.; Liu, J.; Li, Q. Review and Prospect of Fault Diagnosis Methods for Proton Exchange Membrane Fuel Cell. Proc. CSEE 2017, 37, 4712–4721. (In Chinese) [Google Scholar]
  2. Li, Q.; Liu, J.; Chen, W. Review and Prospect of Remaining Useful Life Prediction Methods for Proton Exchange Membrane Fuel Cell. Proc. CSEE 2019, 39, 2365–2375. (In Chinese) [Google Scholar]
  3. Ghoneim, S.S.; Mahmoud, K.; Lehtonen, M.; Darwish, M.M. Enhancing Diagnostic Accuracy of Transformer Faults Using Teaching-Learning-Based Optimization. IEEE Access 2021, 9, 30817–30832. [Google Scholar] [CrossRef]
  4. Abbas, A.S.; El-Sehiemy, R.A.; El-Ela, A.; Ali, E.S.; Mahmoud, K.; Lehtonen, M.; Darwish, M.M. Optimal Harmonic Mitigation in Distribution Systems with Inverter Based Distributed Generation. Appl. Sci. 2021, 11, 774. [Google Scholar] [CrossRef]
  5. Abaza, A.; El-Sehiemy, R.A.; Mahmoud, K.; Lehtonen, M.; Darwish, M.M. Optimal Estimation of Proton Exchange Membrane Fuel Cells Parameter Based on Coyote Optimization Algorithm. Appl. Sci. 2021, 11, 2052. [Google Scholar] [CrossRef]
  6. Yu, J.; Li, Q.; Chen, W. A Fault Classification Method of High-power Proton Exchange Membrane Fuel Cell Systems Based on the Random Forest. Proc. CSEE 2020, 40, 5591–5599. (In Chinese) [Google Scholar]
  7. Tran, M.Q.; Elsisi, M.; Mahmoud, K.; Liu, M.K.; Lehtonen, M.; Darwish, M.M. Experimental setup for online fault diagnosis of induction machines via promising IoT and machine learning: Towards industry 4.0 empowerment. IEEE Access 2021, 9, 115429–115441. [Google Scholar] [CrossRef]
  8. Elsisi, M.; Tran, M.Q.; Mahmoud, K.; Mansour, D.E.A.; Lehtonen, M.; Darwish, M.M. Towards Secured Online Monitoring for Digitalized GIS Against Cyber-Attacks Based on IoT and Machine Learning. IEEE Access 2021. to be published. [Google Scholar] [CrossRef]
  9. Lei, M.; Jackson, L. Effect of sensor set size on polymer electrolyte membrane fuel cell fault diagnosis. Sensors 2018, 18, 2777. [Google Scholar]
  10. Lei, M.; Jackson, L.; Davies, B. Investigation of PEMFC fault diagnosis with consideration of sensor reliability. Int. J. Hydrogen Energy 2018, 43, 16941–16948. [Google Scholar]
  11. Lei, M.; Jackson, L.; Davies, B. Effectiveness of a novel sensor selection algorithm in PEM fuel cell on-line diagnosis. IEEE Trans. Ind. Electron. 2018, 65, 7301–7310. [Google Scholar]
  12. Li, Z.; Giurgea, S.; Outbib, R. Online diagnosis of PEMFC by combining support vector machine and fluidic model. Fuel Cells 2014, 14, 448–456. [Google Scholar] [CrossRef]
  13. Li, Z.; Cadet, C.; Outbib, R. Diagnosis for PEMFC Based on Magnetic Measurements and Data-Driven Approach. IEEE Trans. Energy Convers. 2019, 34, 964–972. [Google Scholar] [CrossRef]
  14. Wang, H.; Peng, M.; Yu, Y. Fault identification and diagnosis based on KPCA and similarity clustering for nuclear power plants. Ann. Nucl. Energy 2021, 150, 107786. [Google Scholar] [CrossRef]
  15. Montazeri, A.; Kargar, S.M. Fault detection and diagnosis in air handling using data-driven methods. J. Build. Eng. 2020, 31, 101388. [Google Scholar] [CrossRef]
  16. Neffati, S.; Ben Abdellafou, K.; Taouali, O. Enhanced SVM–KPCA method for brain MR image classification. Comput. J. 2020, 63, 383–394. [Google Scholar] [CrossRef]
  17. Qu, N.; Zuo, J.; Chen, J. Series arc fault detection of indoor power distribution system based on LVQ-NN and PSO-SVM. IEEE Access 2019, 7, 184020–184028. [Google Scholar] [CrossRef]
  18. Liu, J.; Zuo, B.; Zeng, X. Nonwoven uniformity identification using wavelet texture analysis and LVQ neural network. Expert Syst. Appl. 2010, 37, 2241–2246. [Google Scholar] [CrossRef]
  19. Mao, L.; Davies, B.; Jackson, L. Application of the sensor selection approach in polymer electrolyte membrane fuel cell prognostics and health management. Energies 2017, 10, 1511. [Google Scholar] [CrossRef] [Green Version]
  20. Ni, J.; Zhang, C.; Yang, S.X. An adaptive approach based on KPCA and SVM for real-time fault diagnosis of HVCBs. IEEE Trans. Power Deliv. 2011, 26, 1960–1971. [Google Scholar] [CrossRef]
  21. Simmini, F.; Rampazzo, M.; Peterle, F.; Susto, G.A.; Beghi, A. A Self-Tuning KPCA-Based Approach to Fault Detection in Chiller Systems. IEEE Trans. Control Syst. Technol. 2021. [Google Scholar] [CrossRef]
Figure 1. Physical graph of proton exchange membrane fuel cell (PEMFC) test system.
Wevj 12 00255 g001
Figure 2. Voltage and current diagram of PEMFC water flooding and membrane dry experiment: (a) water flooding; (b) dry membrane.
Wevj 12 00255 g002
Figure 3. The network structure of the learning vector quantization neural network (LVQNN).
Wevj 12 00255 g003
Figure 4. Fault diagnosis process of PEMFC water management based on kernel principal component analysis (KPCA)-LVQNN.
Wevj 12 00255 g004
Figure 5. Partition graph of training set and test set.
Wevj 12 00255 g005
Figure 6. Dimensional reduction graph of KPCA.
Wevj 12 00255 g006
Figure 7. Visual views of the first three features of KPCA.
Wevj 12 00255 g007
Figure 8. Diagnostic results of KPCA-LVQNN. (a) Training diagnostic results; (b) test diagnostic results.
Wevj 12 00255 g008
Figure 9. The confusion matrix of KPCA-LVQNN. (a) Training confusion matrix; (b) test confusion matrix.
Wevj 12 00255 g009
Figure 10. The receiver operating characteristic (ROC) curve of the KPCA-LVQNN for training and test samples. (a) Training samples; (b) test samples.
Wevj 12 00255 g010
Table 1. Key parameters of the PEMFC stack.
ParameterValue
Active area (cm2)100
rated power (W)80
film thickness (μm)25
Platinum loading(mg/cm2)0.2
Thickness of gas diffusion layer (μm)415
Table 2. Variables monitored by the PEMFC test system.
NumberVariableUnit
1Single stack voltageV
2Single stack currentA
3Single stack powerW
4Stack inlet air flow rate SPLM
5Stack inlet hydrogen flow rateSPLM
6Stack inlet air pressure Bar
7Stack inlet hydrogen pressureBar
8Stack outlet air pressureBar
9Stack outlet hydrogen pressureBar
10Stack inlet air temperature°C
11Stack inlet hydrogen temperature°C
12Stack outlet temperature°C
13Heater temperature°C
14Heater powerW
Table 3. Characteristic data with KPCA dimension reduction.
TypeNumberPrincipal Component
12345
Normal state1−0.2393 0.7391 −0.2429 0.1793 0.0036
2−0.2393 0.7391 −0.2429 0.1793 0.0036
3−0.2391 0.7372 −0.2401 0.1744 0.0116
Water flooding failure4−0.5418 −0.4562 −0.4788 −0.0598 0.1566
5−0.5418 −0.4562 −0.4787 −0.0598 0.1566
6−0.5414 −0.4558 −0.4785 −0.0597 0.1565
Membrane dry failure70.6790 −0.1276 0.0063 0.0980 0.0342
80.6790 −0.1276 0.0063 0.0980 0.0342
90.6796 −0.1278 0.0063 0.0984 0.0344
Table 4. Health status recognition accuracy of test sets with different detection methods.
Health ConditionNormal StateWater Flooding FaultMembrane Dry FaultTotal Correct Rate
Detection Method
KPCA and LVQNN98.95%92.34%100%96.93%
Unpretreated LVQNN96.51%82.31%100%93.23%
KPCA and BPNN96.51%84.37%71.14%82.04%
Unpretreated BPNN66.07%74.87%82.41%75.71%
Table 5. Recognition time of different detection methods.
Detection MethodLVQNNBPNN
Using KPCA Dimension ReductionWithout Dimension ReductionUsing KPCA Dimension ReductionWithout Dimension Reduction
Computation time (s)2.53333.97436.92508.8076
Publisher’s Note: MDPI stays neutral with regard to jurisdictional claims in published maps and institutional affiliations.

