
Data Analysis and Visualization Platform Design for Batteries Using Flask-Based Python Web Service


Abstract
:1. Introduction
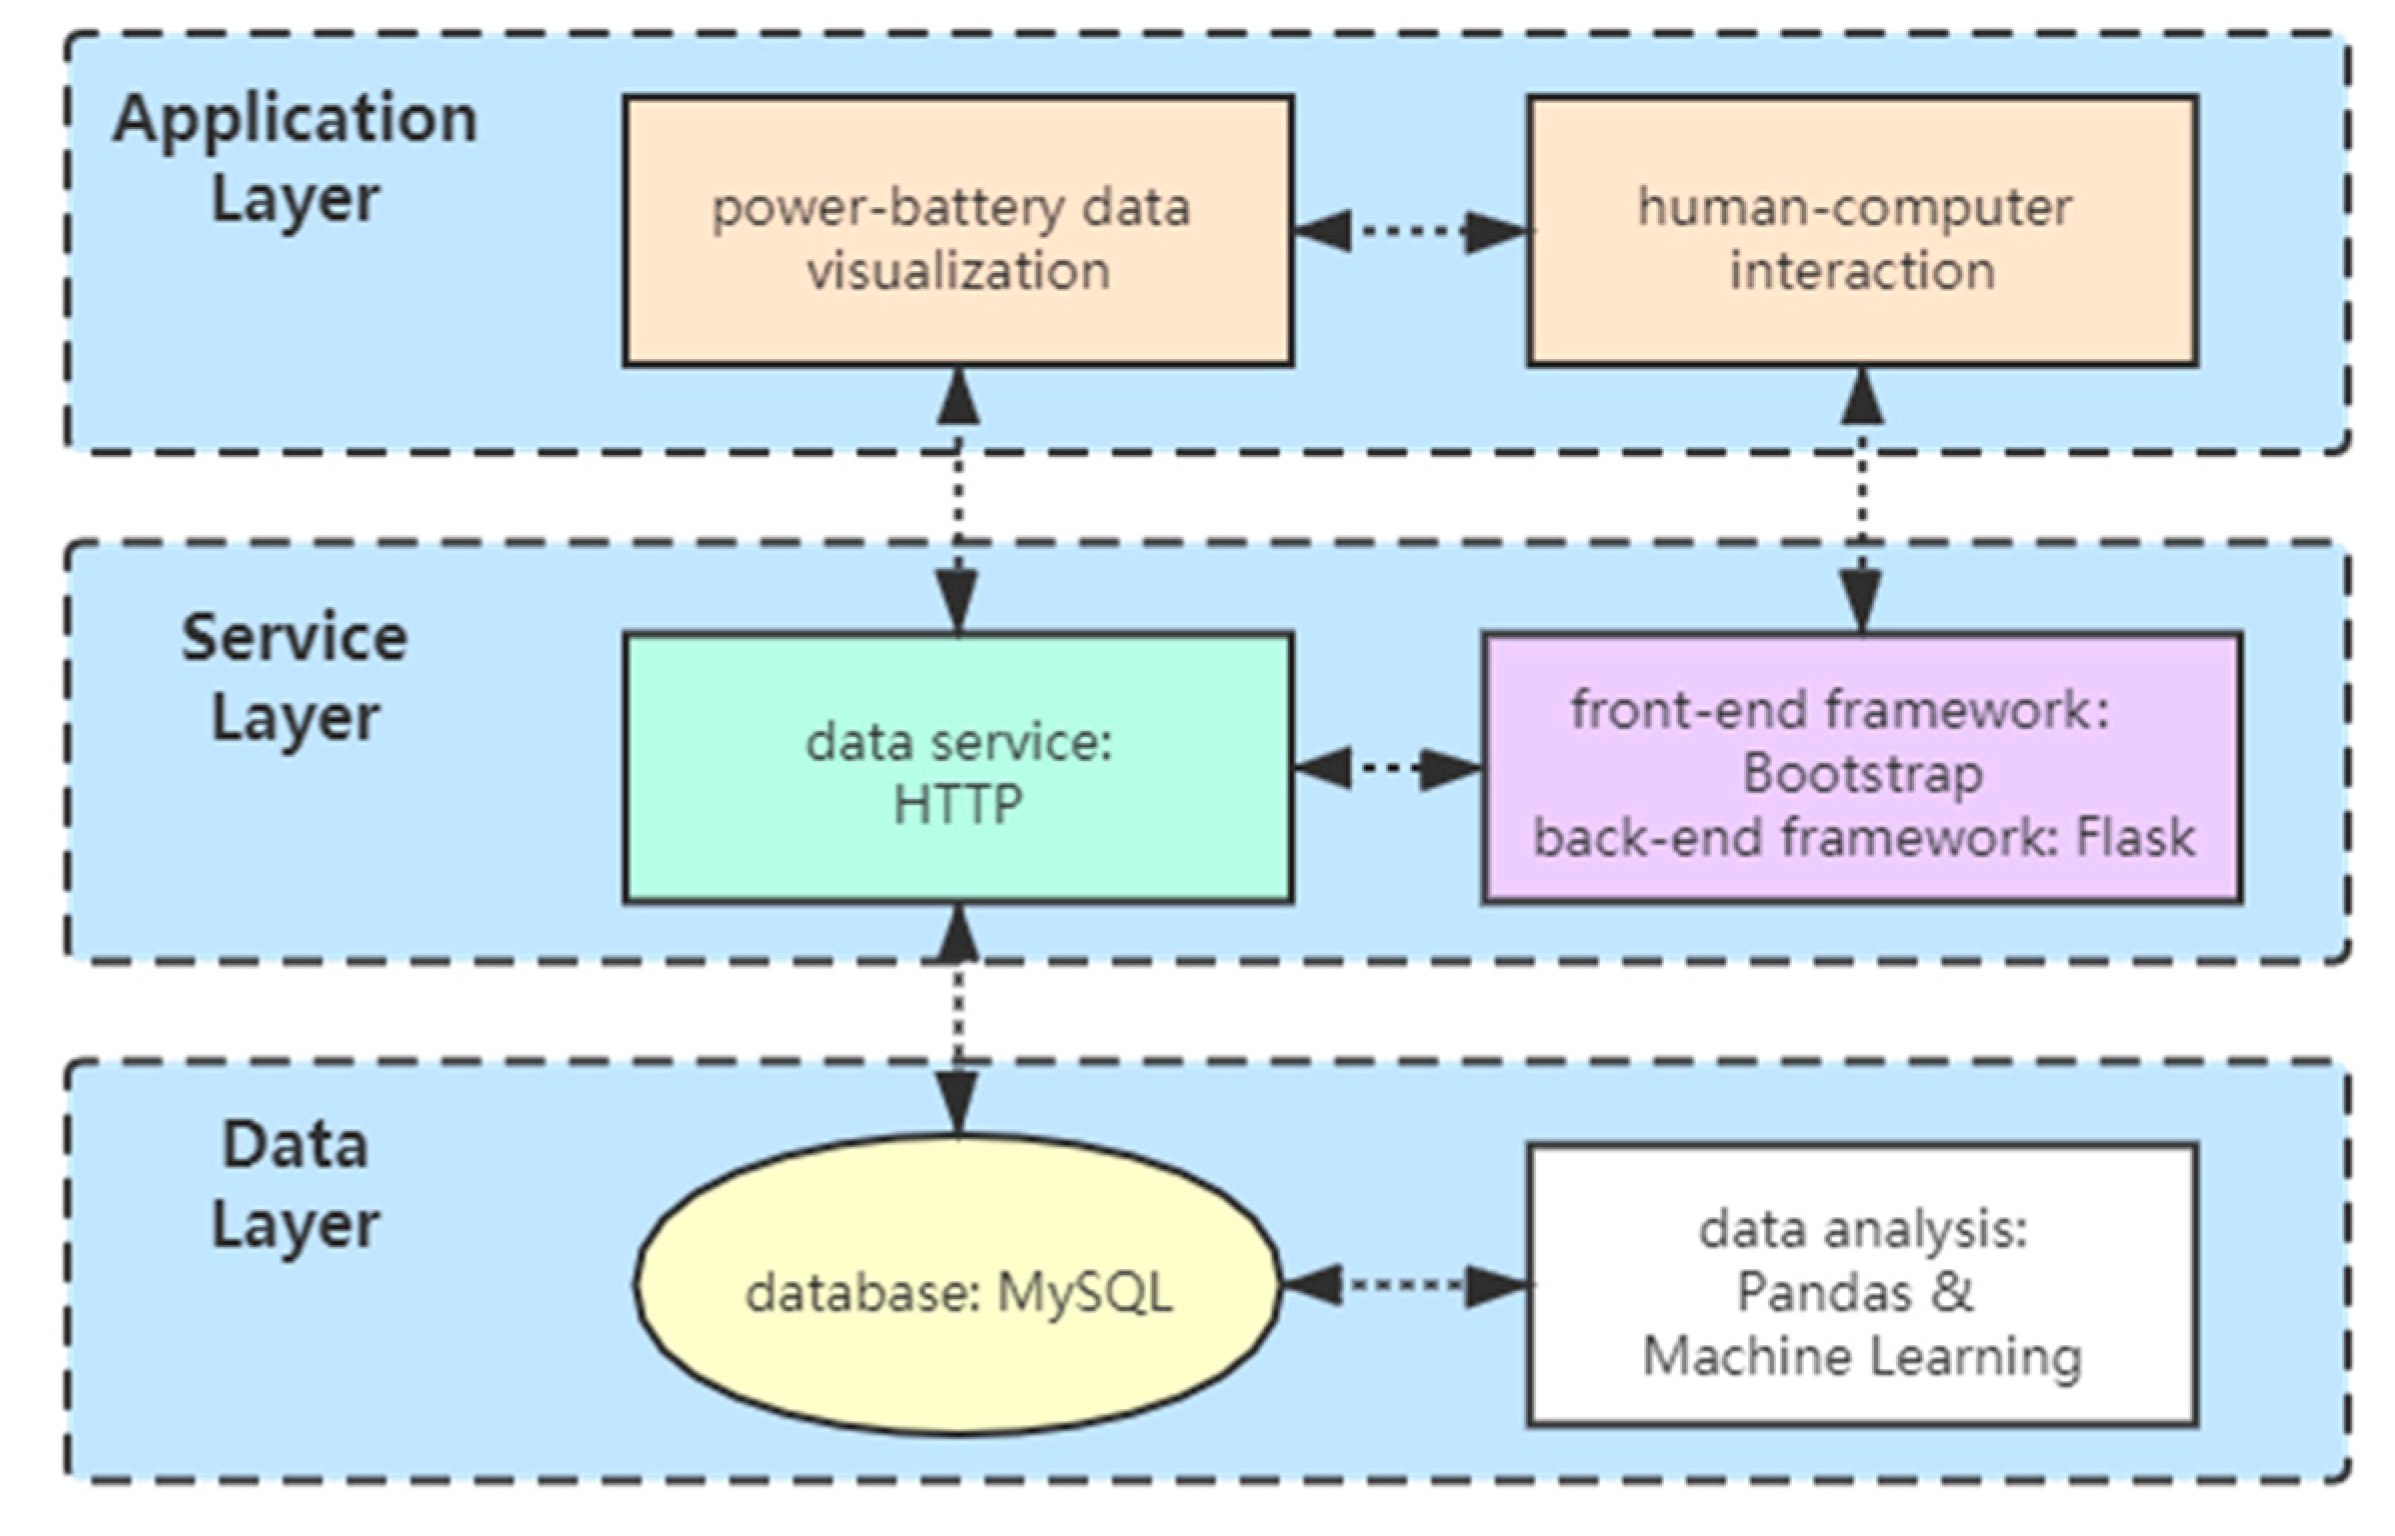
2. System Design
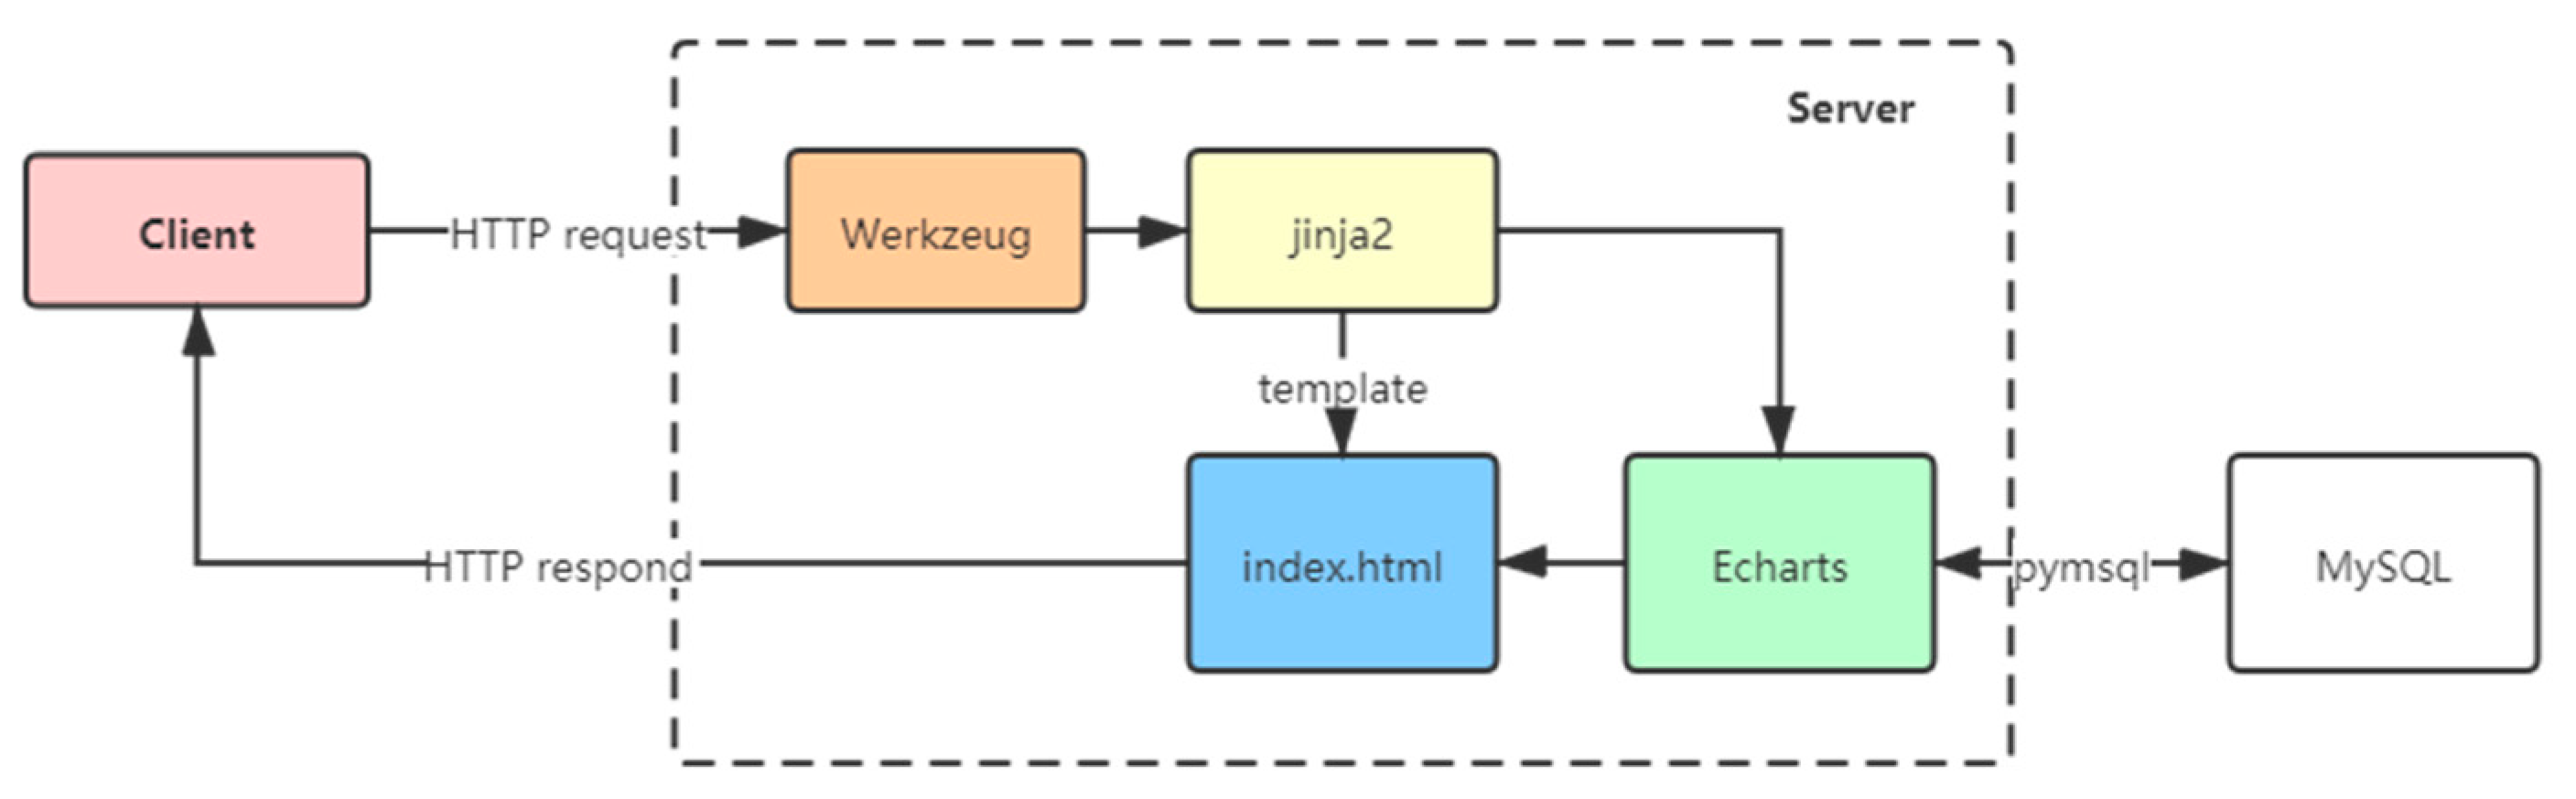
2.1. Framework
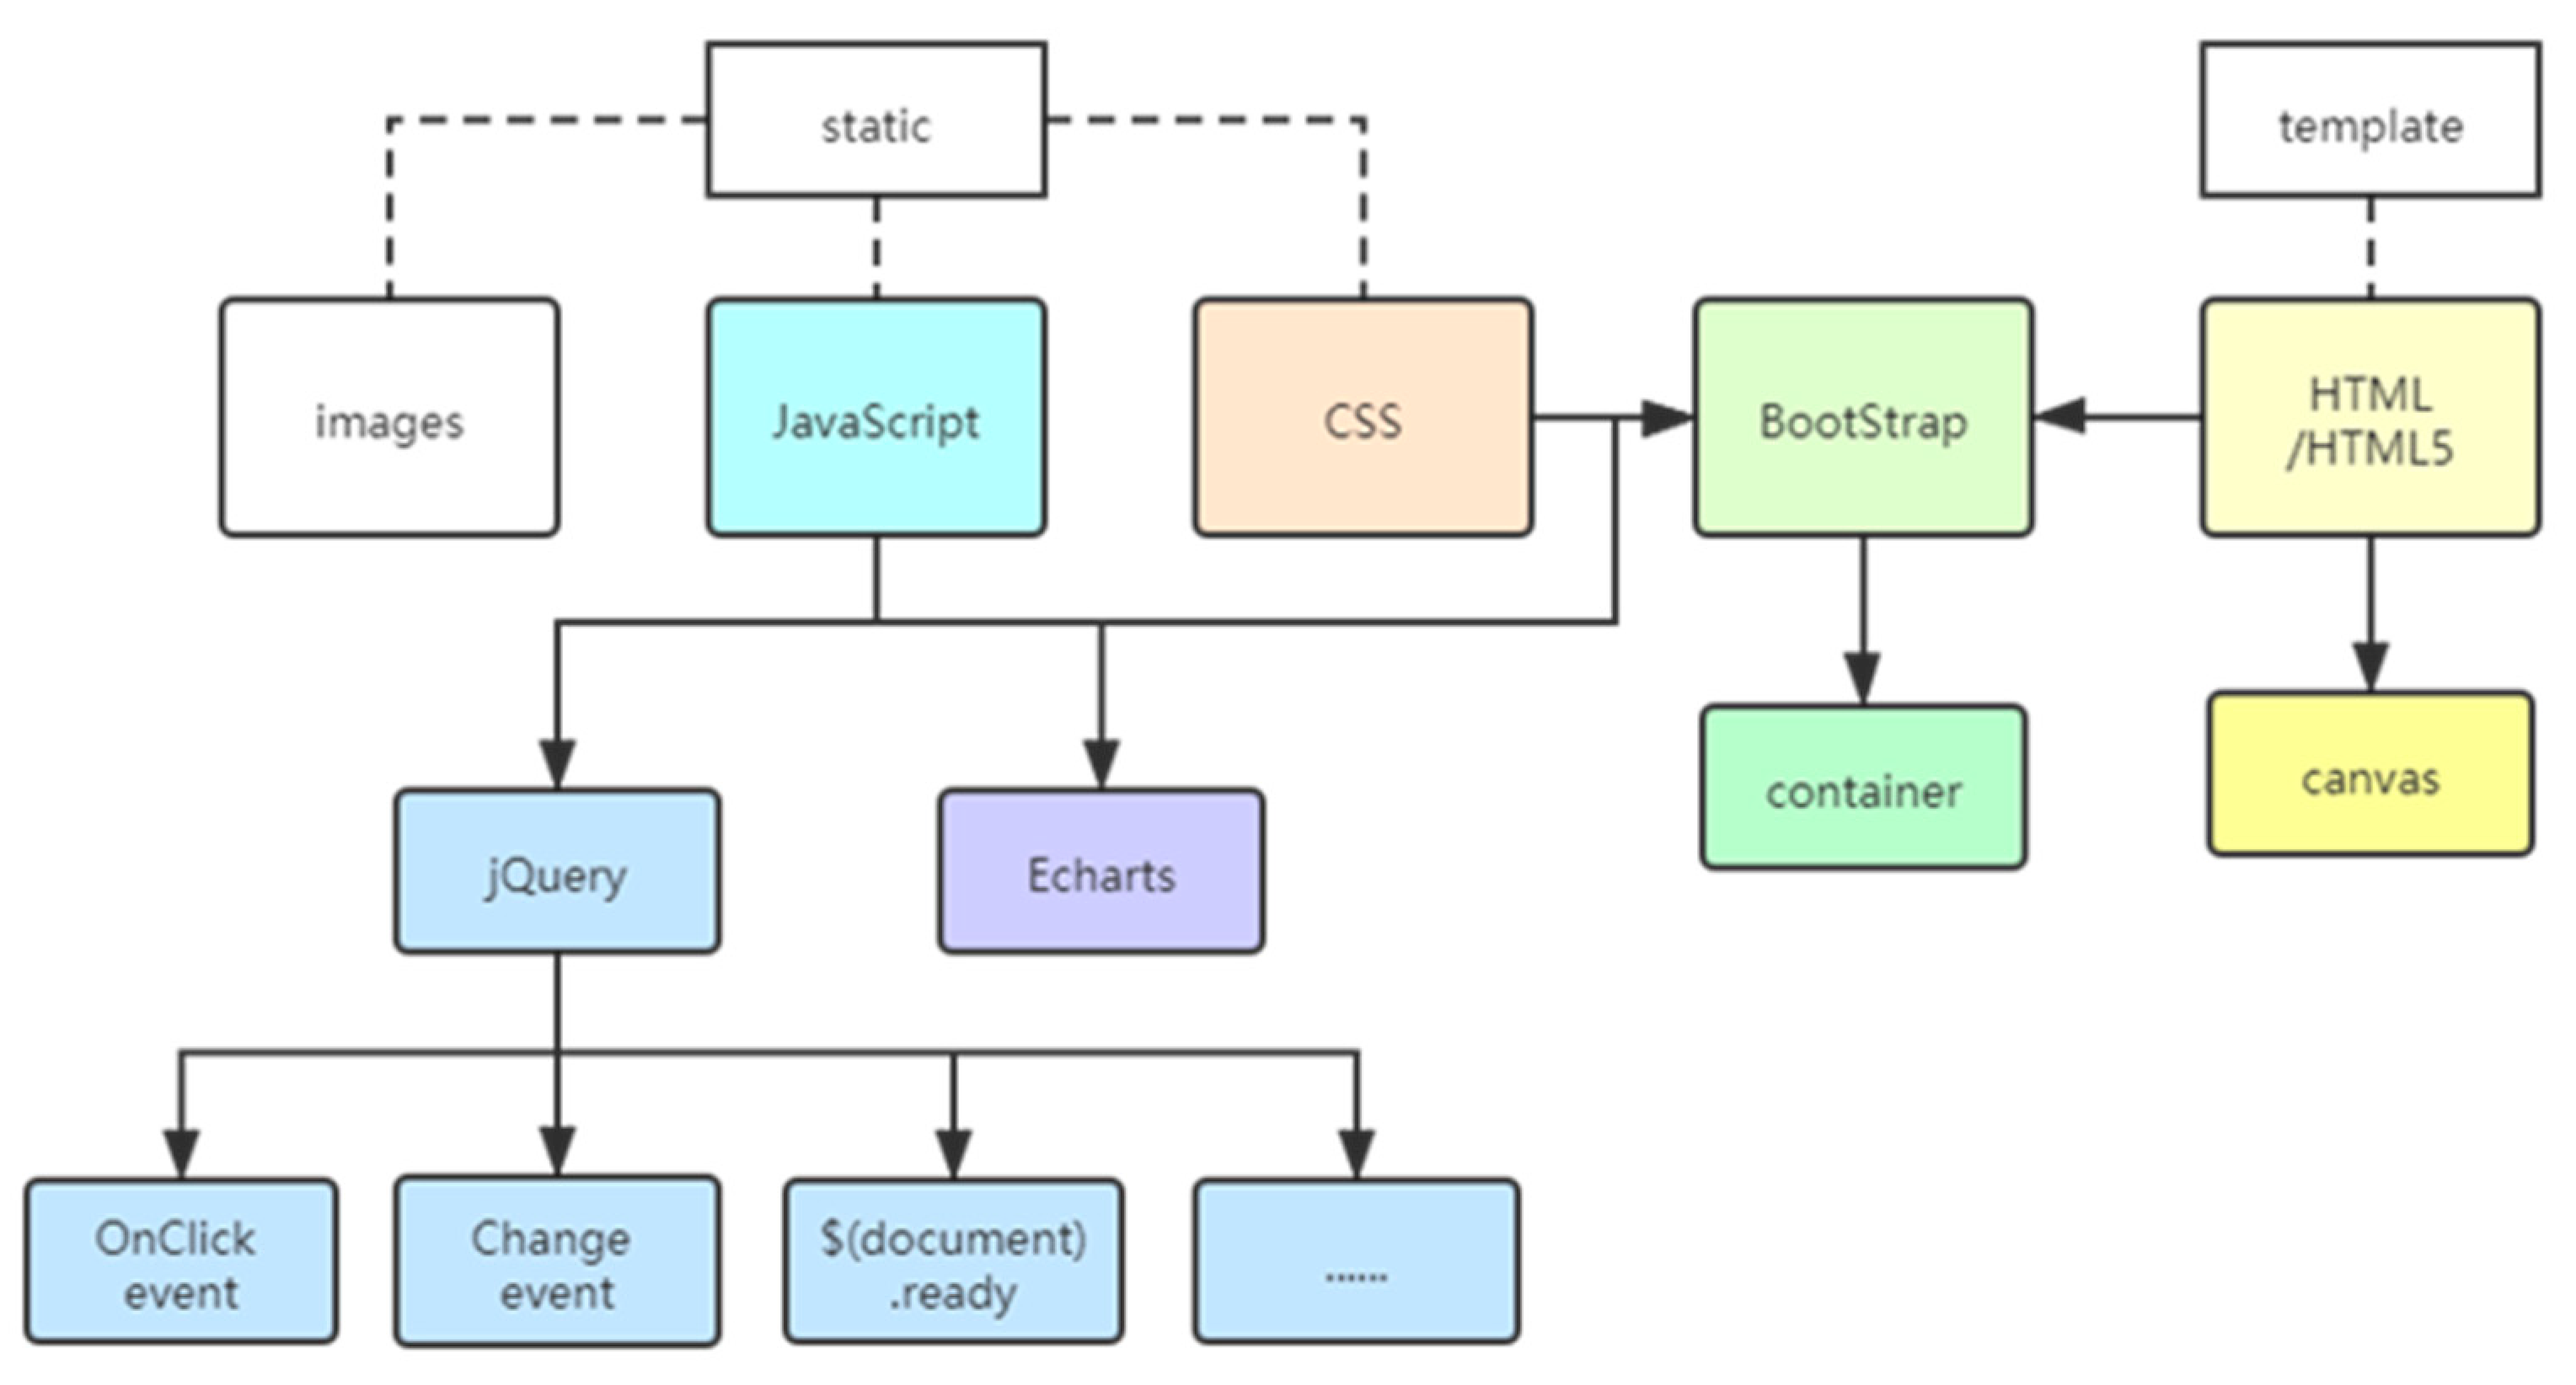
2.1.1. Front-End Construction
2.1.2. Back-End Construction
2.2. Data Preprocessing
2.3. Data Visualization
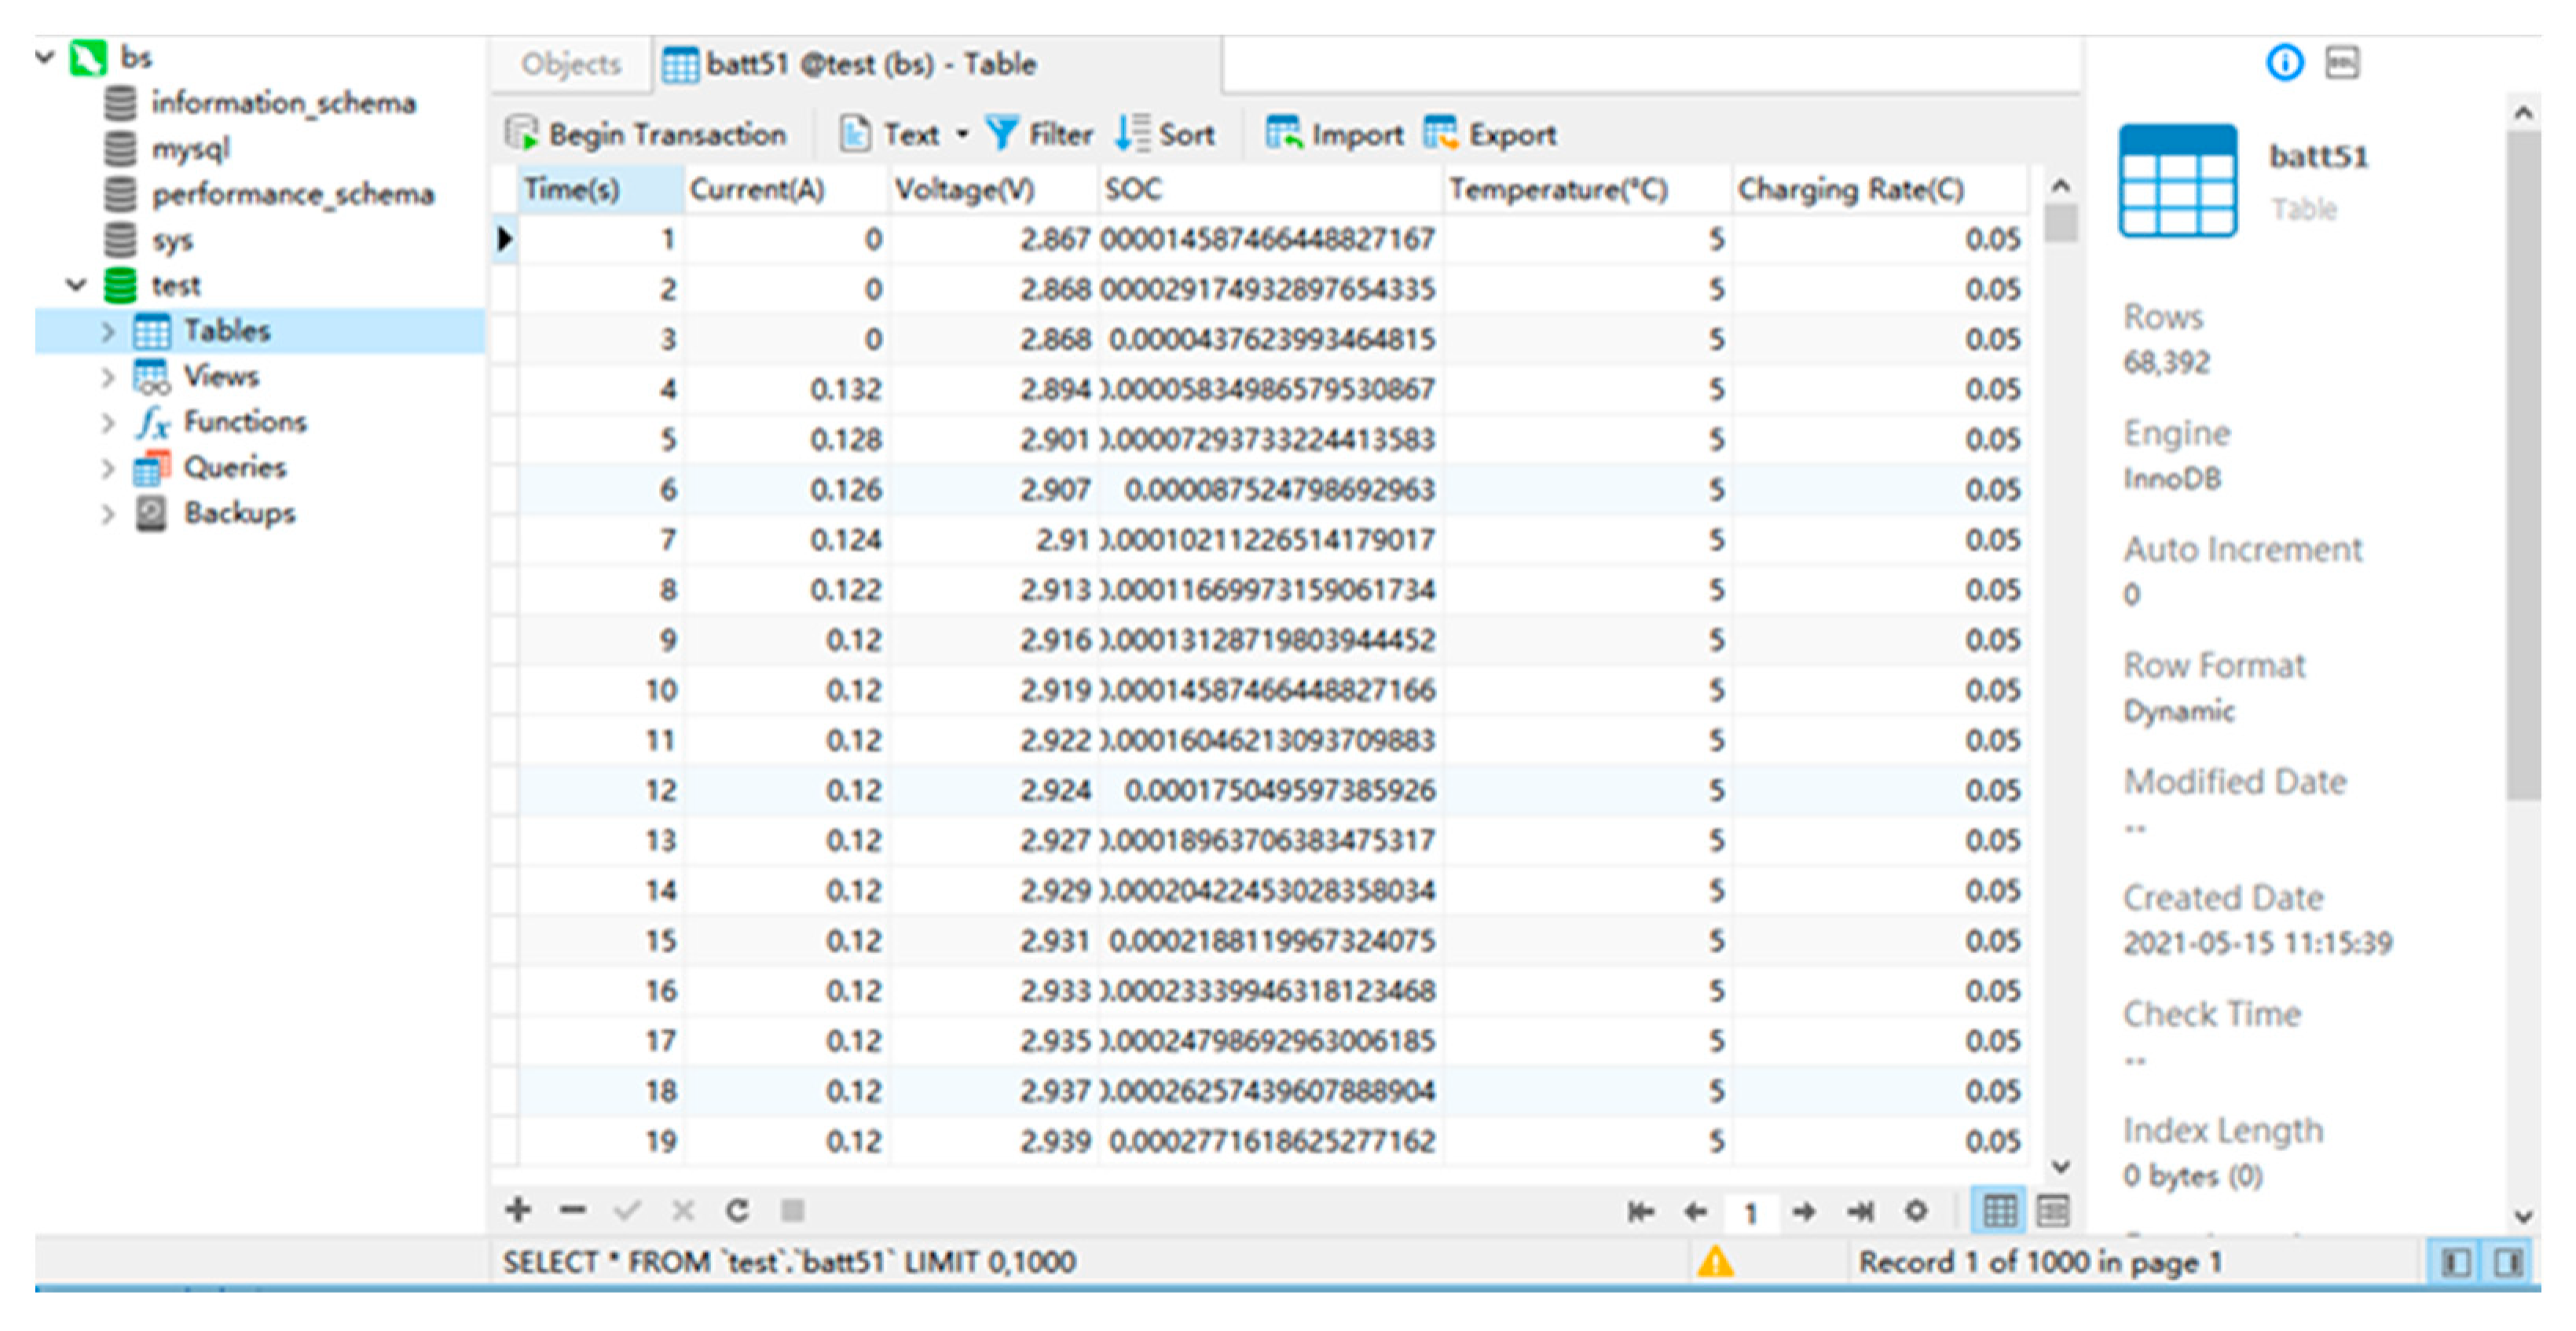
2.4. Data Storage
3. Application Results
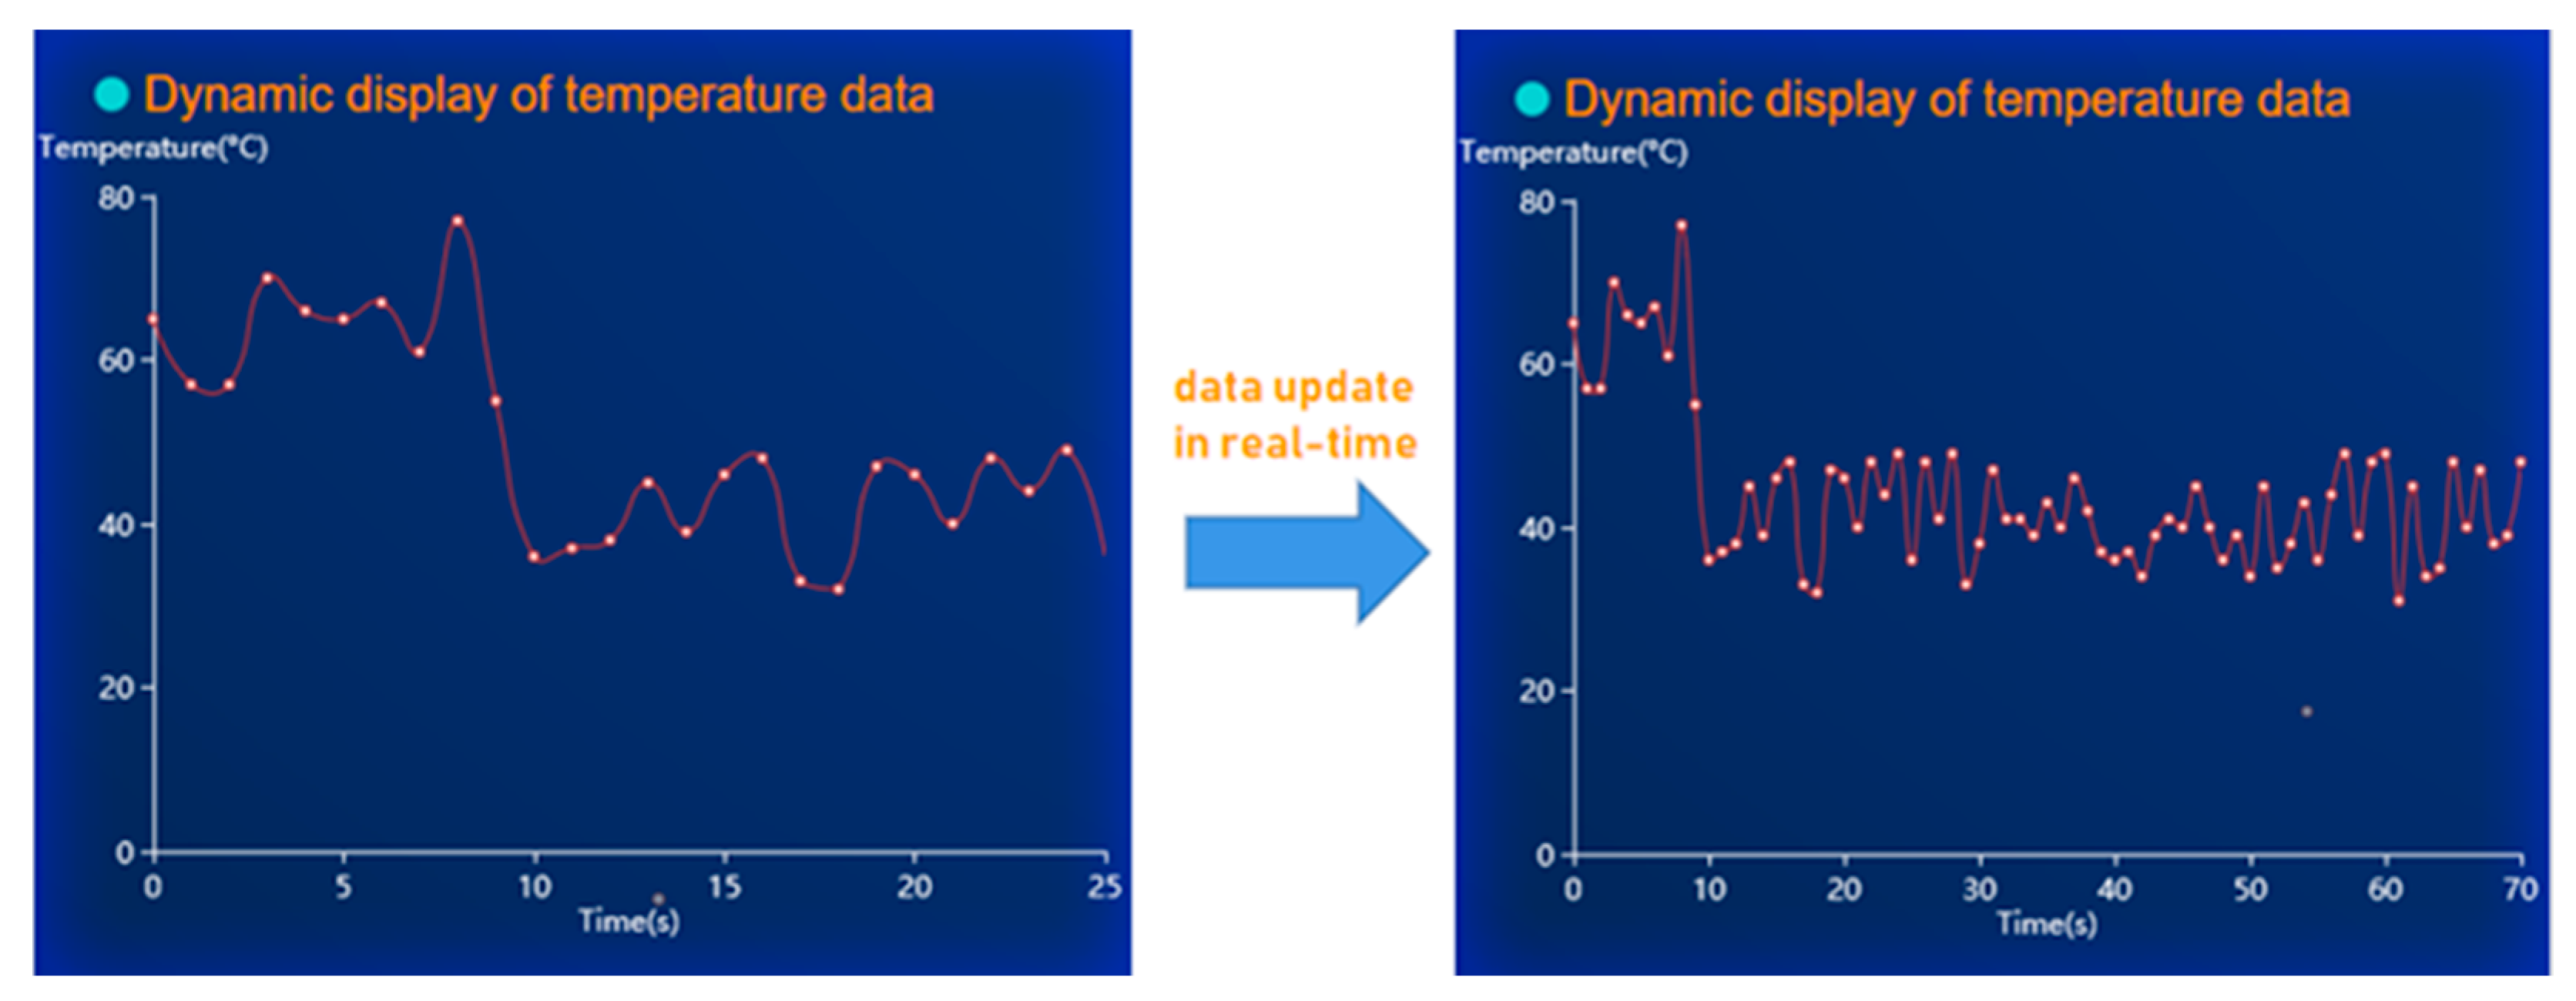
3.1. Asynchronous Refresh Based on Ajax
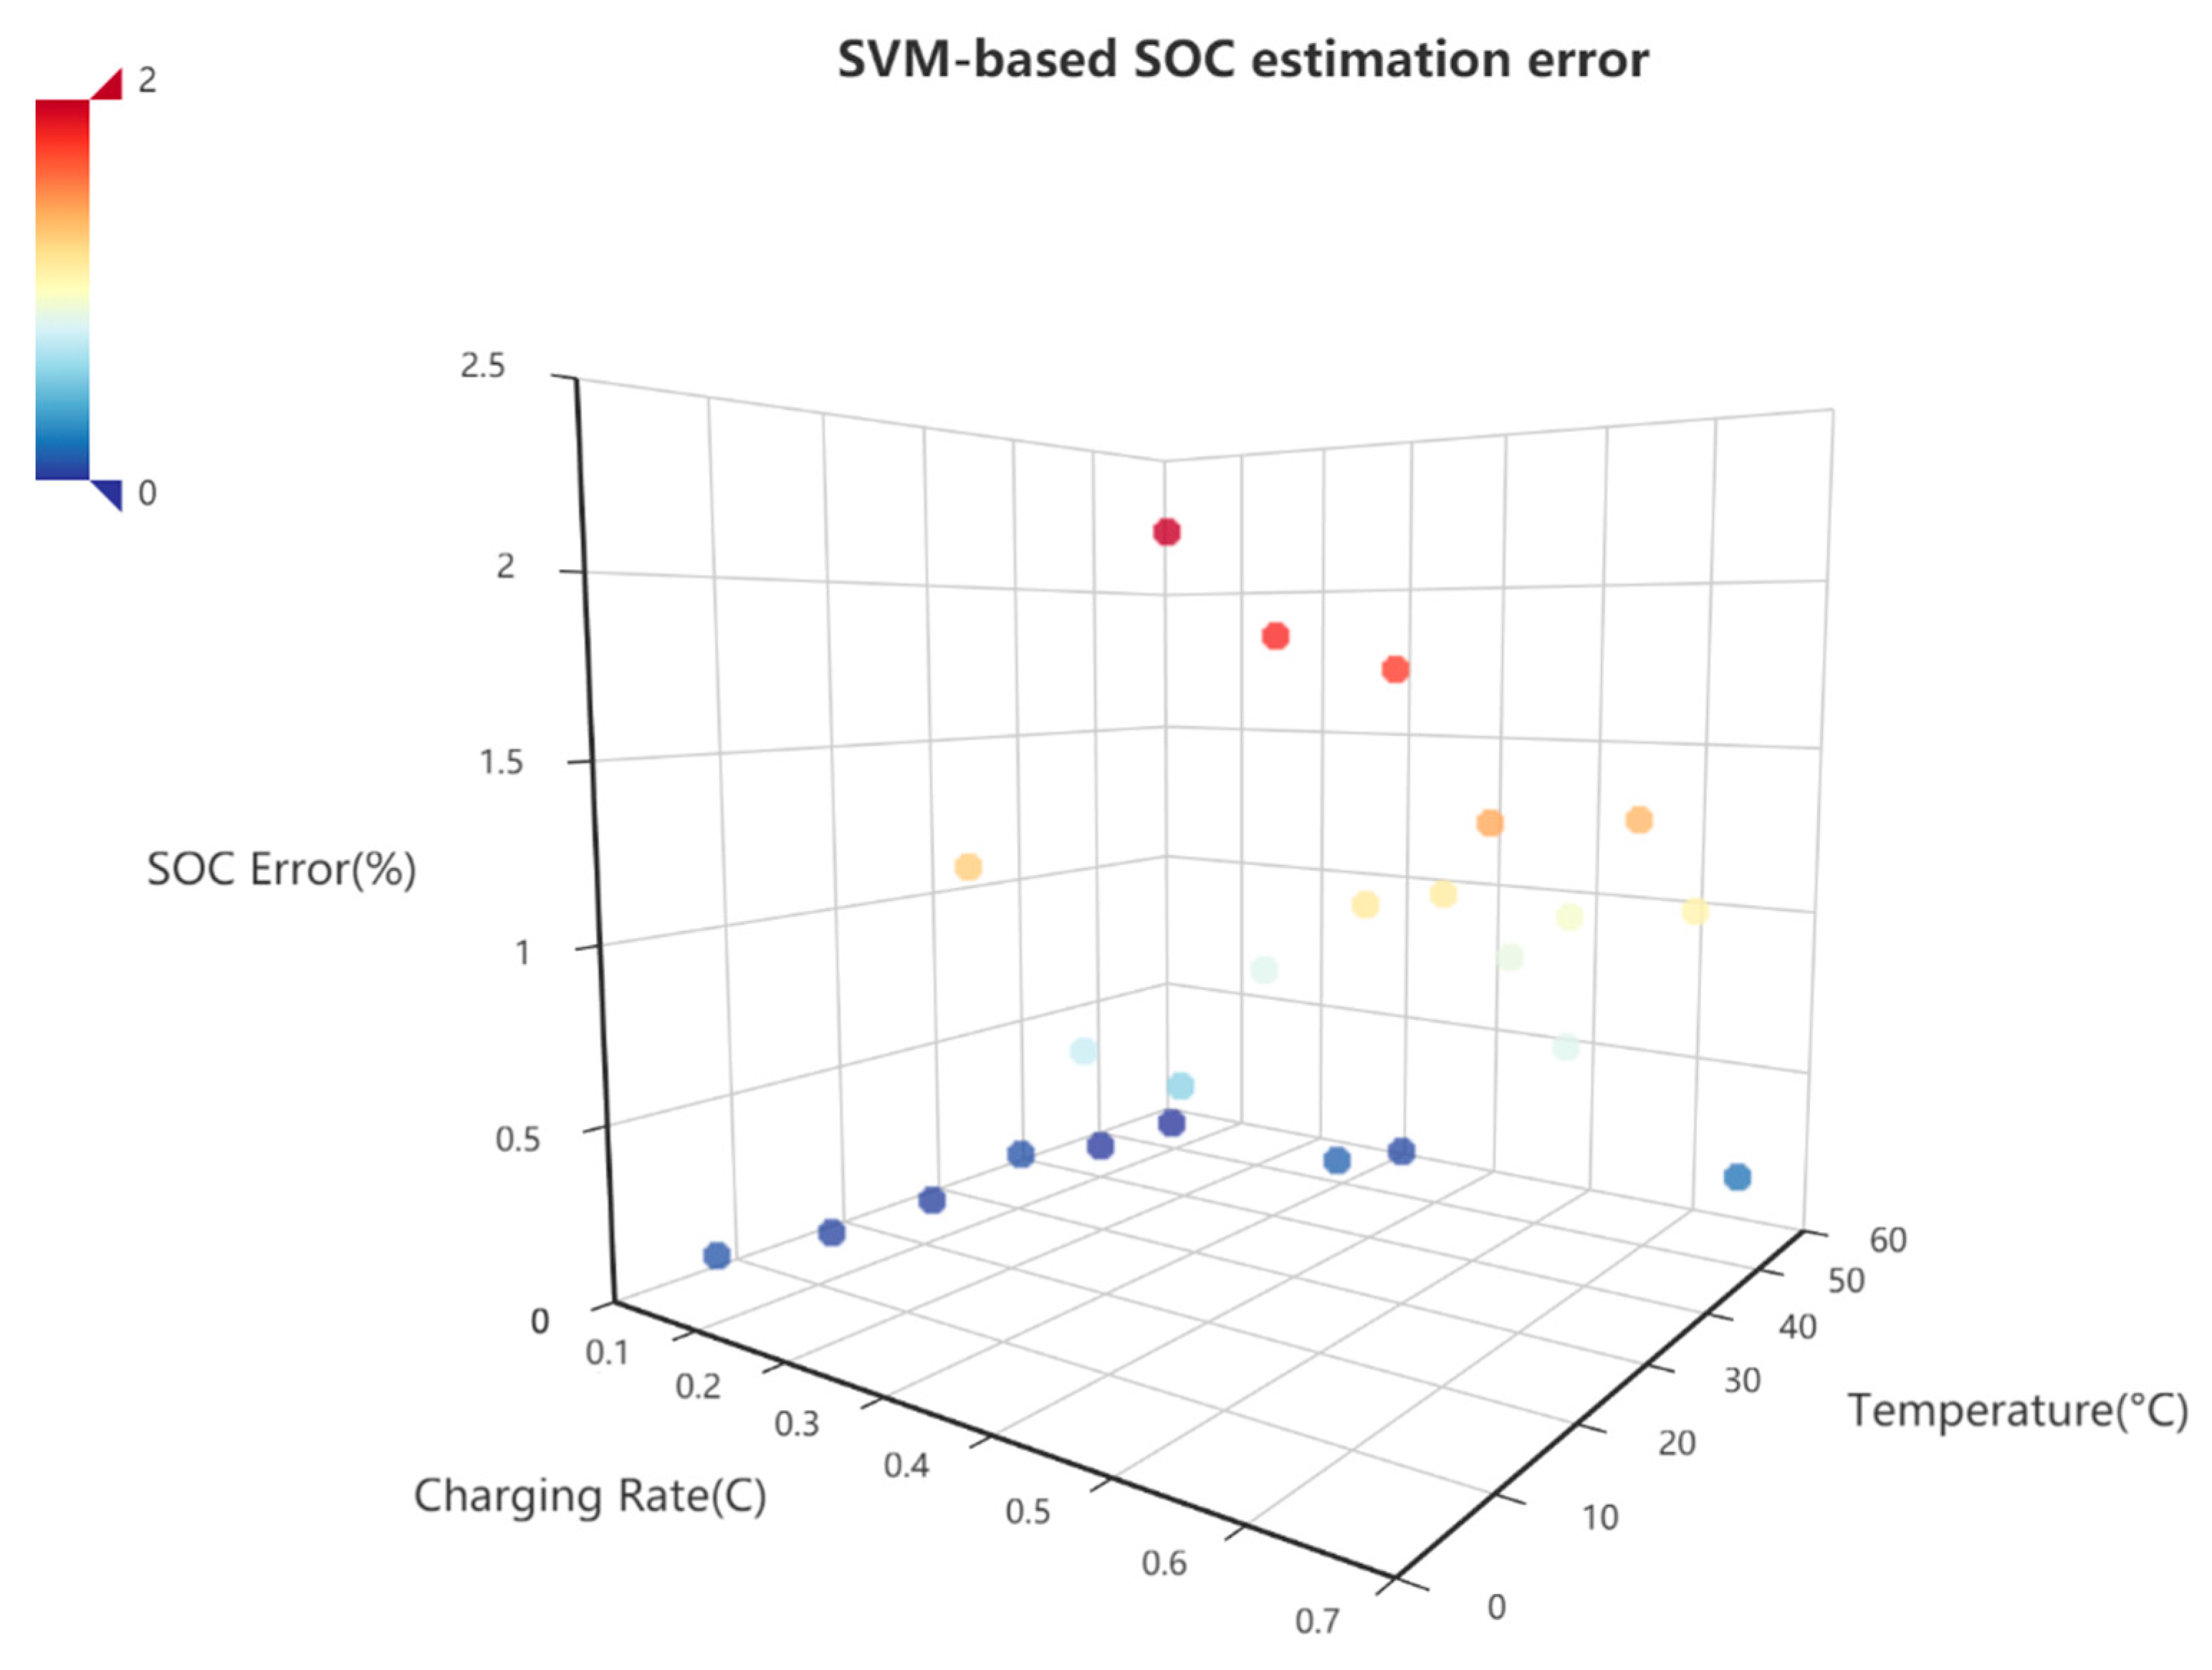
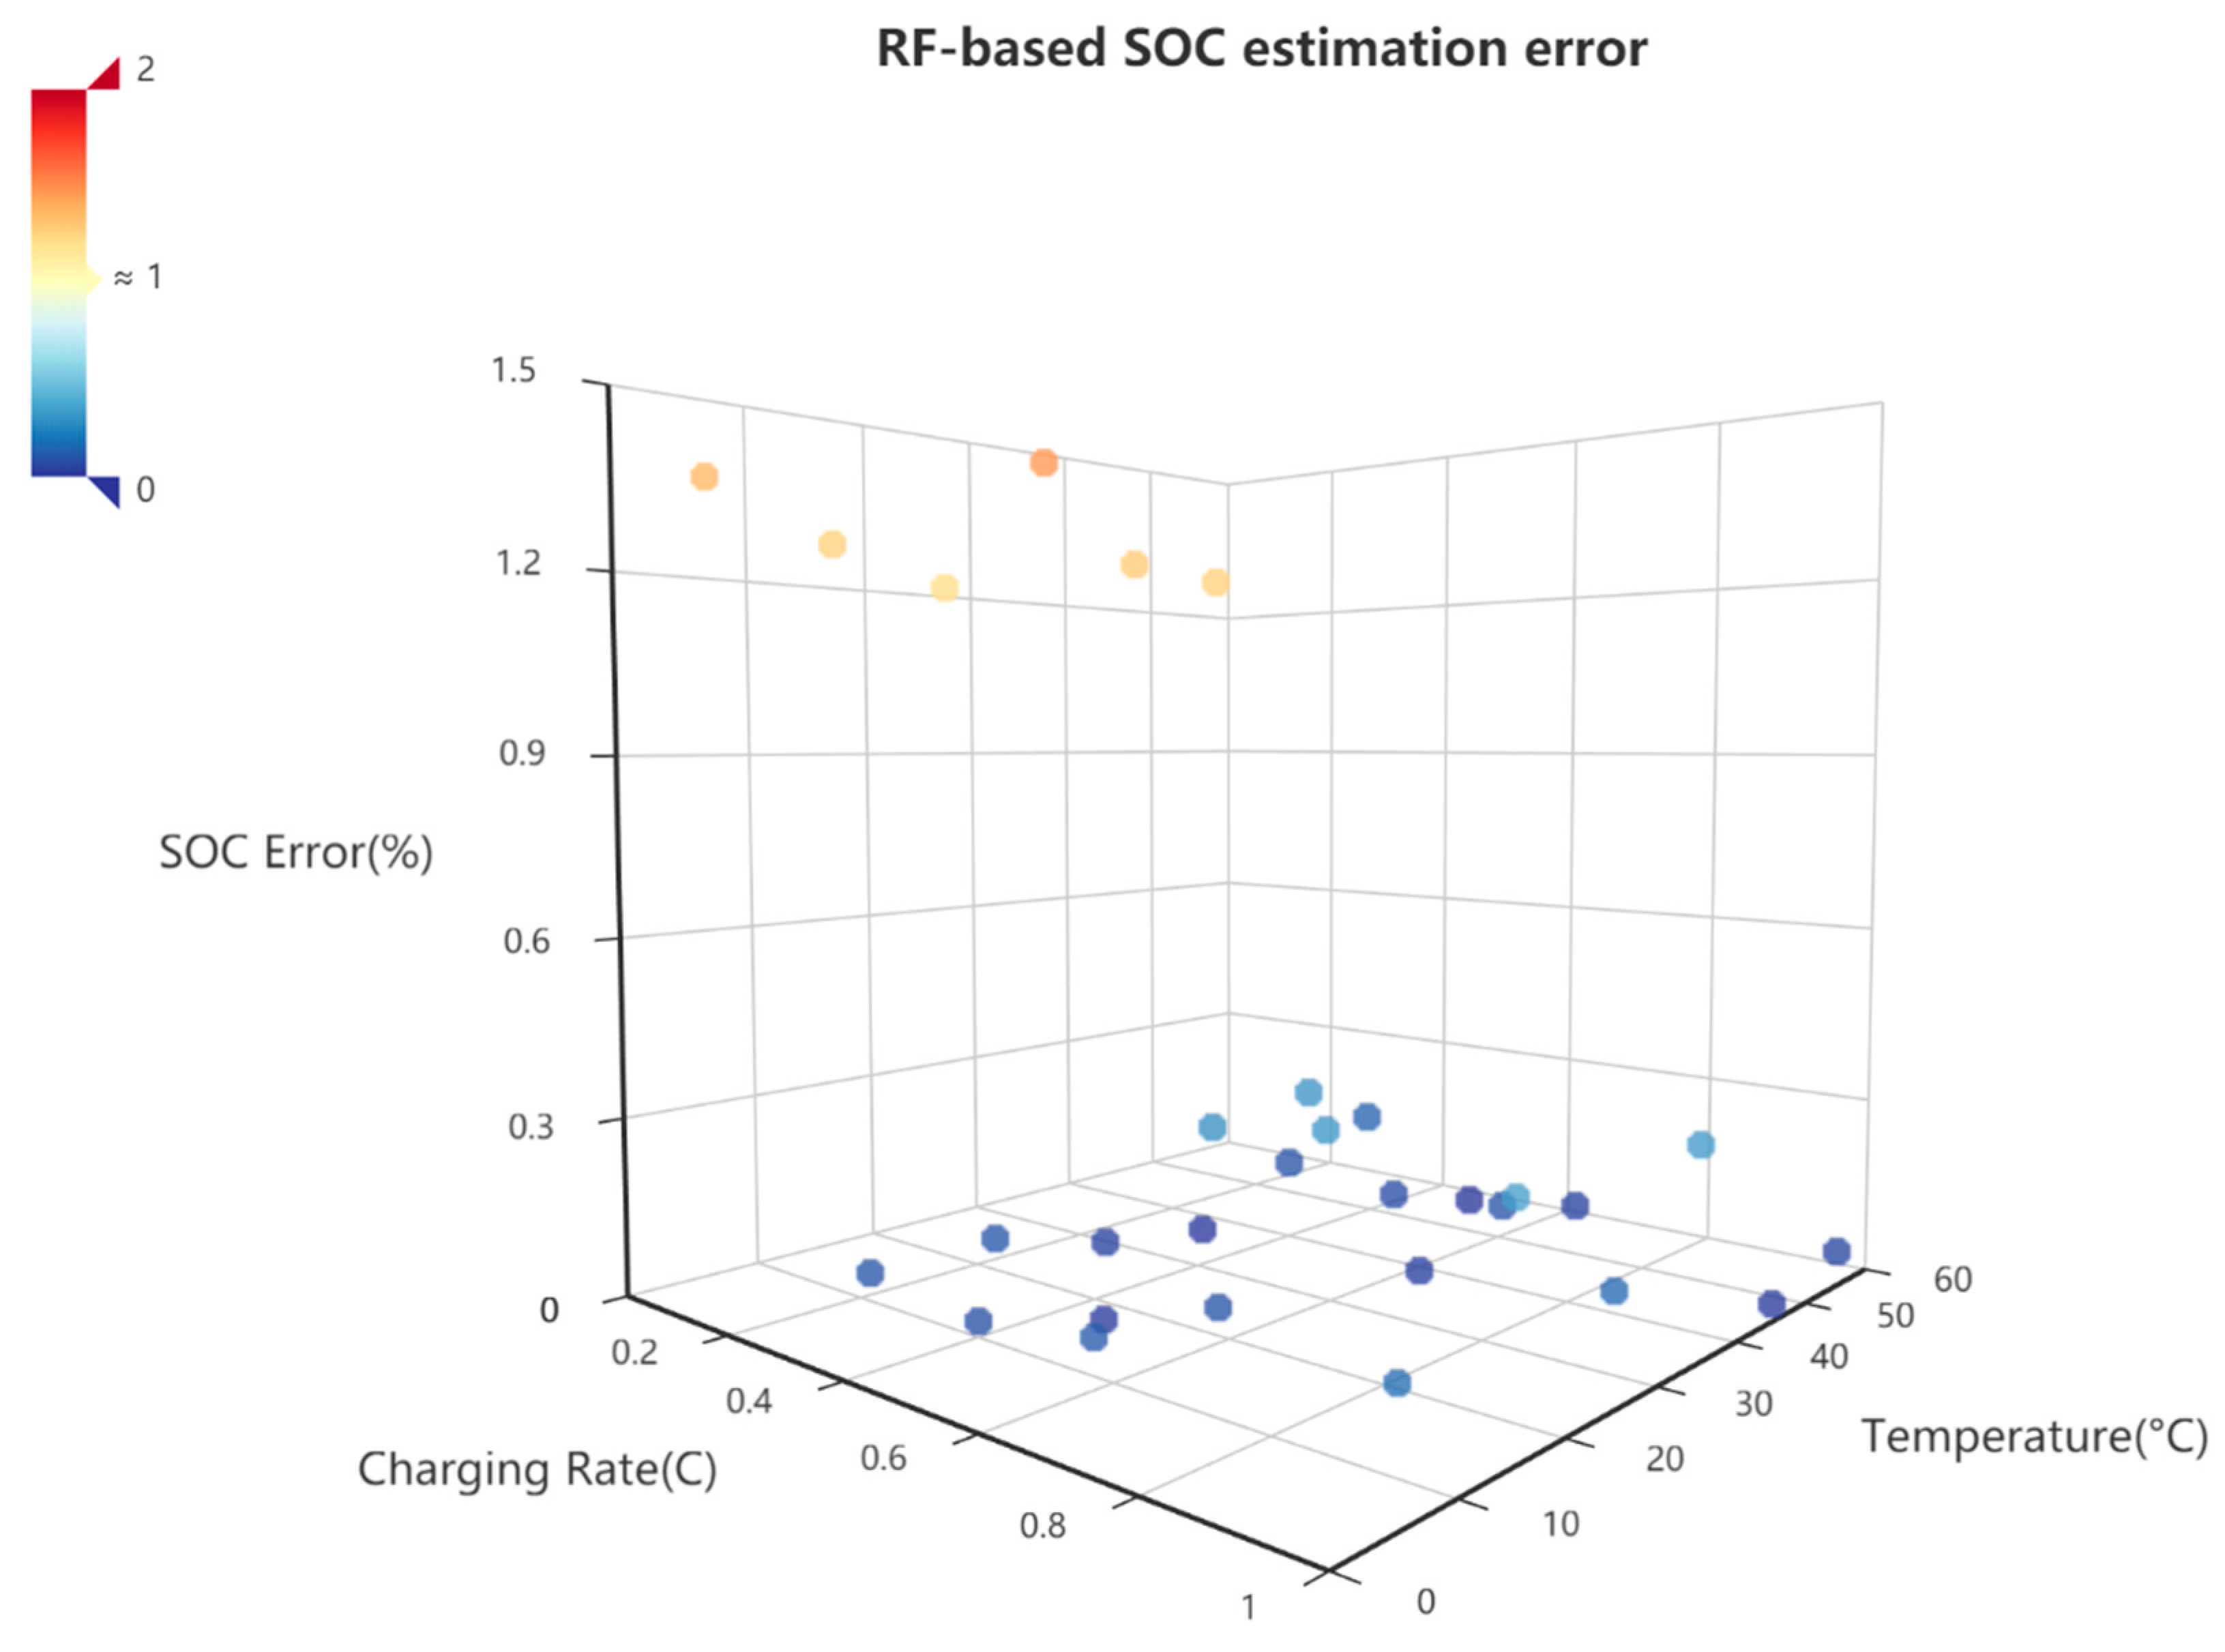
3.2. SOC Estimation Based on Machine Learning Methods
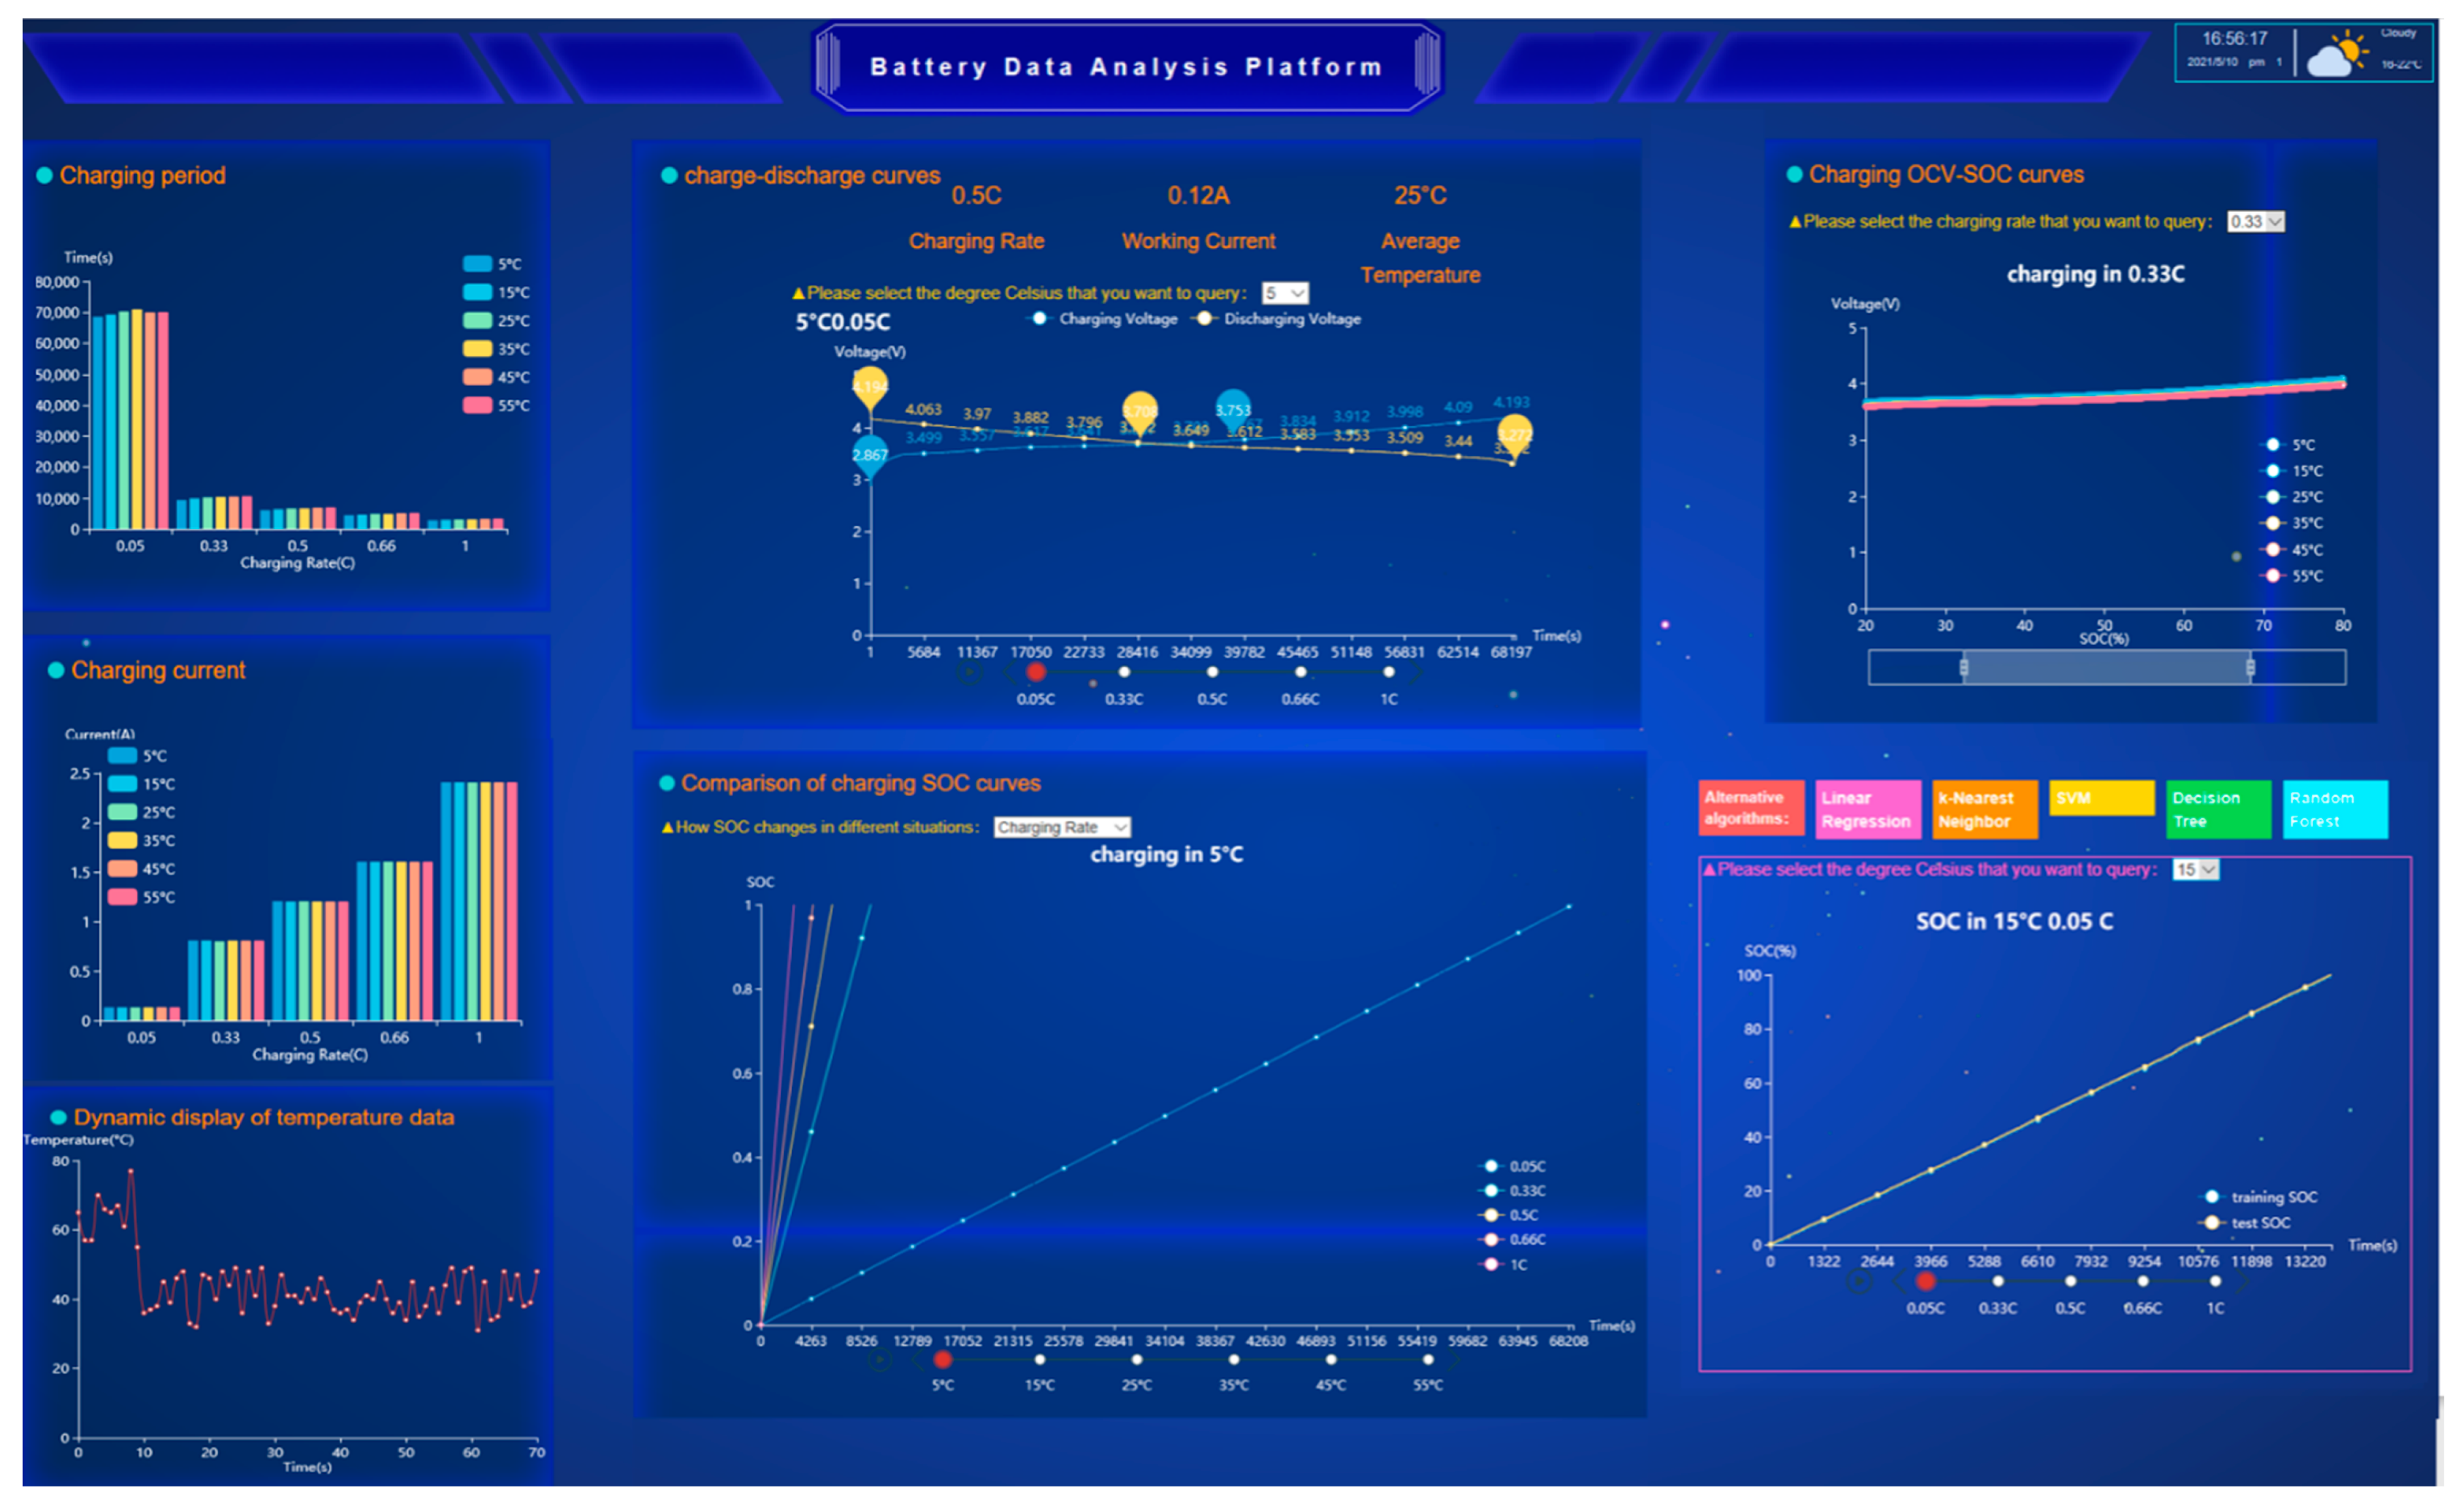
3.3. Overview of the Proposed Data Platform
4. Conclusions
Author Contributions
Funding
Conflicts of Interest
References
- Sun, X.; Li, Z.; Wang, X.; Li, C. Technology development of electric vehicles: A review. Energies 2020, 13, 90. [Google Scholar] [CrossRef] [Green Version]
- Li, S.; He, H.; Li, J. Big data driven lithium-ion battery modeling method based on SDAE-ELM algorithm and data pre-processing technology. Appl. Energy 2019, 242, 1259–1273. [Google Scholar] [CrossRef]
- Tingfeng, D. Research and Design on Electric Vehicle Power Battery Assembly Testing System. Master’s Thesis, Chongqing University, Chongqing, China, 2016. [Google Scholar]
- Rahmawatie, B.; Sutopo, W.; Fahma, F.; Purwanto, A.; Nizam, M.; Louhenapessy, B.B.; Mulyono, A.B. Designing framework for standardization and testing requirements of battery management system for electric vehicle application. In Proceedings of the 2017 4th International Conference on Electric Vehicular Technology (ICEVT), Bali, Indonesia, 2–5 October 2017; IEEE: New York, NY, USA, 2018. [Google Scholar]
- He, H.; Xiong, R.; Peng, J. Real-time estimation of battery state-of-charge with unscented Kalman filter and RTOS μCOS-II platform. Appl. Energy 2016, 162, 1410–1418. [Google Scholar] [CrossRef]
- Lee, K.S.; Moon, C.J.; Kim, T.G.; Jeong, M.S.; Kim, S.M.; Park, B.J. A development of battery monitoring and management system. In Proceedings of the 2012 IEEE Vehicle Power and Propulsion Conference, Seoul, Korea, 9–12 October 2012; IEEE: New York, NY, USA, 2013. [Google Scholar]
- Teng, Z. Building and Applying Online/Offline Data Platform in Data Analysis of Battery with Python Programming Language. Master’s Thesis, Beijing Jiaotong University, Beijing, China, 2016. [Google Scholar]
- Lee, C.H.; Wu, C.H. Collecting and mining big data for electric vehicle systems using battery modeling data. In Proceedings of the 2015 12th International Conference on Information Technology-New Generations, Las Vegas, NV, USA, 13–15 April 2015; IEEE: New York, NY, USA, 2015. [Google Scholar]
- Wu, B.; Chen, Q.-Y.; Liu, B.; Wei, K.-X. Design of the Battery Management System Monitoring Platform. Electr. Meas. Instrum. 2013, 50, 112–116. [Google Scholar]
- Song, Y.; Huang, R.; Wang, J. Research on Data Analysis and Visualization Platform Based on Python. Mod. Inf. Technol. 2019, 3, 7–9. [Google Scholar]
- Zhang, Y.; Song, W.; Lin, S.; Feng, Z. A novel model of the initial state of charge estimation for LiFePO4 batteries. J. Power Sources 2014, 248, 1028–1033. [Google Scholar] [CrossRef]
- Paschero, M.; Storti, G.L.; Rizzi, A.; Mascioli, F.M.F.; Rizzoni, G. A novel mechanical analogy-based battery model for SoC estimation using a multicell EKF. IEEE Trans. Sustain. Energy 2016, 7, 1695–1702. [Google Scholar] [CrossRef] [Green Version]
- He, Z.; Chen, D.; Pan, C.; Chen, L.; Wang, S. State of charge estimation of power Li-ion batteries using a hybrid estimation algorithm based on UKF. Electrochim. Acta 2016, 211, 101–109. [Google Scholar]
- Wassiliadis, N.; Adermann, J.; Frericks, A.; Pak, M.; Reiter, C.; Lohmann, B.; Lienkamp, M. Revisiting the dual extended Kalman filter for battery state-of-charge and state-of-health estimation: A use-case life cycle analysis. J. Energy Storage 2018, 19, 73–87. [Google Scholar] [CrossRef]
- Ren, L.; Zhu, G.; Kang, J.; Wang, J.V.; Luo, B.; Chen, C.; Xiang, K. An algorithm for state of charge estimation based on a single-particle model. J. Energy Storage 2021, 39, 102644. [Google Scholar] [CrossRef]
- Jiang, C.; Wang, S.; Wu, B.; Fernandez, C.; Xiong, X.; Coffie-Ken, J. A state-of-charge estimation method of the power lithium-ion battery in complex conditions based on adaptive square root extended Kalman filter. Energy 2021, 219, 119603. [Google Scholar] [CrossRef]
- Tong, S.; Lacap, J.H.; Park, J.W. Battery state of charge estimation using a load-classifying neural network. J. Energy Storage 2016, 7, 236–243. [Google Scholar] [CrossRef]
- Tian, J.; Xiong, R.; Shen, W.; Shen, W.; Lu, J. State-of-charge estimation of LiFePO4 batteries in electric vehicles: A deep-learning enabled approach. Appl. Energy 2021, 291, 116812. [Google Scholar] [CrossRef]
- Ng, M.F.; Zhao, J.; Yan, Q.; Conduit, G.J.; Seh, Z.W. Predicting the state of charge and health of batteries using data-driven machine learning. Nat. Mach. Intell. 2020, 2, 161–170. [Google Scholar] [CrossRef] [Green Version]
- Deng, Z.; Yang, L.; Cai, Y.; Deng, H.; Sun, L. Online available capacity prediction and state of charge estimation based on advanced data-driven algorithms for lithium iron phosphate battery. Energy 2016, 112, 469–480. [Google Scholar] [CrossRef]
- Shrivastava, P.; Soon, T.K.; Bin Idris, M.Y.I.B.; Mekhilef, S. Overview of model-based online state-of-charge estimation using Kalman filter family for lithium-ion batteries. Renew. Sustain. Energy Rev. 2019, 113, 109233. [Google Scholar] [CrossRef]
- Wang, Y.; Tian, J.; Sun, Z.; Wang, L.; Xu, R.; Li, M.; Chen, Z. A comprehensive review of battery modeling and state estimation approaches for advanced battery management systems. Renew. Sustain. Energy Rev. 2020, 131, 110015. [Google Scholar] [CrossRef]
- Taivalsaari, A.; Mikkonen, T.; Systä, K.; Pautasso, C. Web User Interface Implementation Technologies: An Underview. In Proceedings of the 14th International Conference on Web Information Systems and Technologies (WEBIST 2018), Seville, Spain, 18–20 September 2018; SCITEPRESS–Science and Technology Publications, Lda.: Setubal, Portugal, 2018; pp. 27–136. [Google Scholar]
- Vogel, P.; Klooster, T.; Andrikopoulos, V.; Andrikopoulos, V.; Lungu, M. A low-effort analytics platform for visualizing evolving Flask-based Python web services. In Proceedings of the 2017 IEEE Working Conference on Software Visualization (VISSOFT), Shanghai, China, 18–19 September 2017; IEEE: New York, NY, USA, 2017. [Google Scholar]
- Opmane, B. Web Application Development Using the Latest Possibilities of MySQL Database Technologies. Master’s Thesis, Riga Technical University, Riga, Latvia, 2018. [Google Scholar]
- Li, D.; Mei, H.; Shen, Y.; Su, S.; Zhang, W.; Wang, J.; Zu, M.; Chen, W. ECharts: A declarative framework for rapid construction of web-based visualization. Vis. Inform. 2018, 2, 136–146. [Google Scholar] [CrossRef]
- Zhao, H.-G. The realization of ECharts technology with real-time refresh of dynamic data under the support of Ajax technology. Electron. Technol. 2018, 47, 25–27. [Google Scholar]
- Andre, D.; Appel, C.; Soczka-Guth, T. Dirk Uwe Sauer. Advanced mathematical methods of SOC and SOH estimation for lithium-ion batteries. J. Power Sources 2013, 224, 20–27. [Google Scholar] [CrossRef]
- Pedregosa, F.; Varoquaux, G.; Gramfort, A.; Michel, A.; Thirion, B.; Grisel, O.; Blondel, M.; Prettenhofer, P.; Weiss, R.; Dubourg, V.; et al. Scikit-learn: Machine learning in Python. J. Mach. Learn. Res. 2011, 12, 2825–2830. [Google Scholar]
- Chandran, V.; Patil, C.K.; Karthick, A.; Ganeshaperumal, D.; Rahim, R.; Ghosh, A. State of charge estimation of lithium-ion battery for electric vehicles using machine learning algorithms. World Electr. Veh. J. 2021, 12, 38. [Google Scholar] [CrossRef]


| Algorithm | Module | Function |
|---|---|---|
| Linear Regression | linear model | LinearRegression |
| K-NearestNeighbor | neighbors | KNeighborsRegressor |
| Support Vector Machine | svm | SVC |
| Decision Tree | tree | DecisionTreeRegressor |
| Random Forest | ensemble | RandomForestRegressor |
Publisher’s Note: MDPI stays neutral with regard to jurisdictional claims in published maps and institutional affiliations. |
© 2021 by the authors. Licensee MDPI, Basel, Switzerland. This article is an open access article distributed under the terms and conditions of the Creative Commons Attribution (CC BY) license (https://creativecommons.org/licenses/by/4.0/).
Share and Cite
Liang, Z.; Liang, Z.; Zheng, Y.; Liang, B.; Zheng, L. Data Analysis and Visualization Platform Design for Batteries Using Flask-Based Python Web Service. World Electr. Veh. J. 2021, 12, 187. https://doi.org/10.3390/wevj12040187
Liang Z, Liang Z, Zheng Y, Liang B, Zheng L. Data Analysis and Visualization Platform Design for Batteries Using Flask-Based Python Web Service. World Electric Vehicle Journal. 2021; 12(4):187. https://doi.org/10.3390/wevj12040187
Chicago/Turabian StyleLiang, Zuyi, Zongwei Liang, Yubin Zheng, Beichen Liang, and Linfeng Zheng. 2021. "Data Analysis and Visualization Platform Design for Batteries Using Flask-Based Python Web Service" World Electric Vehicle Journal 12, no. 4: 187. https://doi.org/10.3390/wevj12040187
APA StyleLiang, Z., Liang, Z., Zheng, Y., Liang, B., & Zheng, L. (2021). Data Analysis and Visualization Platform Design for Batteries Using Flask-Based Python Web Service. World Electric Vehicle Journal, 12(4), 187. https://doi.org/10.3390/wevj12040187