Abstract
At present, the DC busbar design is one of the bottlenecks restricting the improvement of the power density of motor drives. Therefore, this paper proposes a three-dimensional line probe algorithm, which can realize the automatic routing of laminated busbar in motor drives. The specific rules and implementation of this method are introduced in detail in this paper. Finally, an example of busbar design of a vehicle motor drive is given to verify the routing rate and execution speed of the algorithm.
1. Introduction
To cope with the pollution problem caused by automobile exhaust emissions, governments around the world have strongly supported the development of electric vehicles. As a result, electric vehicles have gained an increasing market share [1,2,3,4]. As one of the three core technologies of electric vehicles, high power density and high efficiency motor drive is a key factor affecting costs of whole vehicles [5,6,7,8,9]. Compared with traditional silicon devices, wide band-gap devices have several advantages, such as high switching frequency, small on-resistance, high operation temperature and high blocking voltage [8,10,11]. High switching frequency can support high speed motor with a smaller torque vibration at high speed, and DC busbar capacitors can be optimized to reduce the volume of the whole machine [12]. However, high switching frequency requires low stray inductance of DC busbar. High stray inductance will push power devices to high voltage spikes, which makes them easily damaged [13,14]. Therefore, the low stray inductance design of DC busbar is of great significance to the power density and reliability of motor drive.
Compared with the traditional copper bar, the laminated busbar has the advantages of low stray inductance and uniform current distribution, which has become the main connection component in power converters [15]. The laminated busbar with lower stray inductance can reduce the voltage stress of the power device and improve the thermal management to some extent. Distributed capacitors have better heat dissipation but require a careful busbar design. Therefore, the use of the busbar with low stray parameters can further decrease the volume of the whole system and make it more compact [16,17].
Many researchers have analyzed and studied the design and optimization of busbars. References [18,19] studied the positions of openings and holes in the busbar. By adjusting the positions of openings and holes in the stacked busbar, the stray inductors in the commutator circuit of power devices were kept symmetrical. A design method for a low sensitivity busbar was proposed to improve the current flow path. Reference [20] studied the influence of busbar size, hole and connecting terminal on stray parameters of the busbar, and obtained the influence of different physical structures on stray inductance of the busbar. References [21,22] studied the structural parameters of laminated busbars, simulated and analyzed the influence of different physical structures on the overall stray inductance of busbars, and proposed the theoretical calculation method of stray inductance of busbars and structural parameters of busbars. According to the above references, there are three main principles for busbar design: (1) the placement of devices is perpendicular to the direction of the current; (2) as far as possible each floor bus should be tiled; (3) the area of the hole should be minimized under the condition of ensuring insulation. At present, busbar design is mainly based on the experience of designers, which leads to low design efficiency, inconstancy and low feasibility. To solve these difficulties in laminated busbar layout, this paper proposes an automatic three-dimensional line probe method for busbar interconnection, which can improve the efficiency of routing. This method fills the gap between PCB routing and 3D busbar routing and provides design guidelines for converter designers.
2. Three-Dimensional Line Probe Algorithm
VLSI design is usually divided into layout design and wiring design. The wiring design is an important part of the whole design and takes up 25%~50% of the total design time [23]. The integration design of motor drives can learn from VLSI design and the idea of power module automatic layout. However, unlike VLSI routing, busbar routing is designed in a three-dimensional space, which makes wiring more complex and takes more design time. Thus, it is necessary to make some improvements and modifications to VLSI routing algorithms. Lie’s maze algorithm can find the best path between any two points on a plane if there is a feasible path [18]. The algorithm is widely used because of its simplicity. However, when converter systems become complex, Lie’s maze algorithm always takes too much time and has storage issues. To solve the problem, Hightower and Mikaami introduced the line exploration algorithm. Compared with the Lie’s maze algorithm, the line probe algorithm requires much less storage space and exploration time.
The basic process of line probe algorithm in two-dimensional plane is depicted in Figure 1. First, an escape line is generated at the source and target point, and stored in Slist and Tlist, respectively. The escape line cannot pass through obstacles. In Slist and Tlist, if intersecting segments appear, the exploration process is complete. Otherwise, a new escape line is generated and added to Slist and Tlist. The new escape line is generated from the escape point on the last escape line. By repeating the process, the final routing can be realized. Only if a intersecting line appears between Slist and Tlist, a routing solution comes, and a tracing back will be conducted to both sides to form the connection.
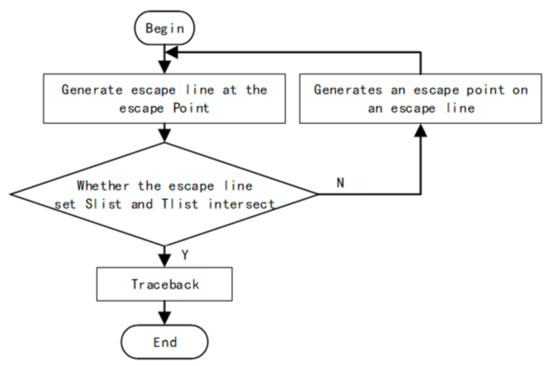
Figure 1.
Design process of line exploration algorithm.
The design flow of line probe algorithm in 3D space proposed in this paper is similar to the above 2D designs. The inverter system of a motor drive is mainly composed of bus capacitors, power modules, driving boards, control boards and other components. For facilitating the algorithm design, each component can be approximated to a cube of equal volume, as shown in Figure 2. Each component is regarded as an obstacle to the wiring of busbar, and the completed wiring in busbar is also seen as a new obstacle. Therefore, according to the characteristics of the vehicle motor drives, the wiring obstacles in the three-dimensional space can be classified into two categories, surface and line obstacles.
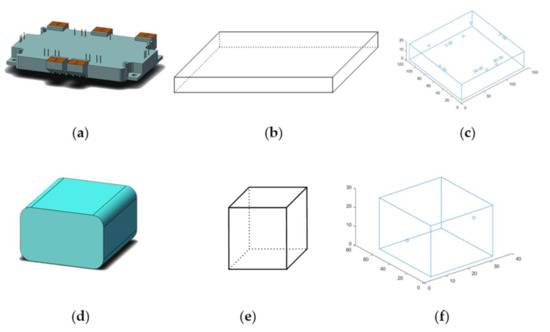
Figure 2.
(a) Power module, (b) The equivalent cube of the power module, (c) A model of a power module and its connecting terminals in a program, (d) Capacitor core, (e) The equivalent cube of a capacitor core, (f) The model of the capacitor core and its connecting terminals in the program.
To reduce the storage space and the search time, the three-dimensional line exploration algorithm proposed in this paper does not divide the entire wiring space into grids. Instead, it uses the relationship between point and surface, point and line to explore the path. As shown in Figure 3, the relationship between point and surface refers to that the surface obstacle is in the orthogonal directions of x-axis, y-axis and z-axis of the point. As shown in Figure 4, the relationship between point and line means that the line becomes an obstacle to escape lines generated from the escape point to x-axis, y-axis and z-axis. Through the relationship between points, surfaces and lines, the escape line from an escape point can be figured out. Finally, whether a connected path exists is determined by judging line-segment intersects between Slist and Tlist.
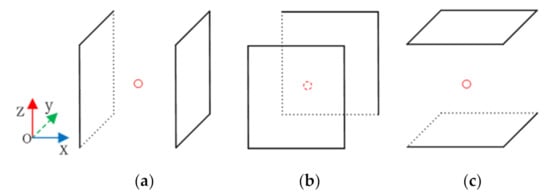
Figure 3.
(a) The surface obstacle is in the orthogonal directions of x-axis. (b) The surface obstacle is in the orthogonal directions of y-axis. (c) The surface obstacle is in the orthogonal directions of z-axis.
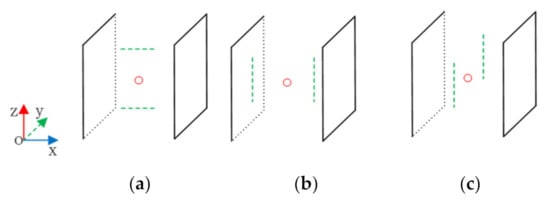
Figure 4.
(a) The line obstacle is in the orthogonal directions of z-axis. (b) The line obstacle is in the orthogonal directions of x-axis. (c) The line obstacle is in the orthogonal directions of y-axis.
The intersection of two line-segments in Slist and Tlist has three types, i.e., intersection planes parallel to the xoz plane, the xoy plane and the yoz plane, as shown in Figure 5. Therefore, the determination of line intersection can be converted into the determination of whether two line-segments intersect on the plane. For example, for the case of two line-segments parallel to xoy, the possible relationships between two line-segments on the plane is depicted in Figure 6. In Figure 6, the intersections of two lines are (a), (b) and (e). Therefore, only line-segments intersects need to be judged, according to the above three situations. As shown in Figure 6a, the necessary and sufficient condition for the intersection of line-segment lab and lcd is, point a and point b are on the opposite sides of line-segment lcd, and points c, point d are on the opposite sides of line-segment lab. According to the cross product of the vector, the judgement of intersection can be interpreted as, is different from , and is different from . The situation in Figure 6b can be regarded as a special case of Figure 6a. In Figure 6b, line-segment lac and lab are collinear. Therefore, for the situation in Figure 6b, the judgement of intersection can be interpreted as, one value of and is equal to 0, and is different from . For the case where two lines are parallel, as shown in Figure 6c–e, only Figure 6e has the intersected lines. Therefore, if two parallel line segments intersect, they must be collinear. However, their intersecting is not necessarily guaranteed if they are collinear. As shown in Figure 6e, to ensure the intersection, the starting point of lab must be less than or equal to the starting point of lcd, and the starting point of lcd must be less than or equal to the end point of lab.
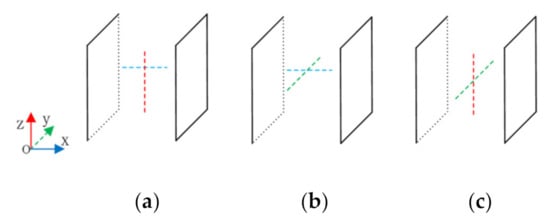
Figure 5.
Three cases of intersection of two line- segments in Slist and Tlist. (a) The intersection plane is parallel to xoz. (b) The intersection plane is parallel to xoy. (c) The intersection plane is parallel to yoz.
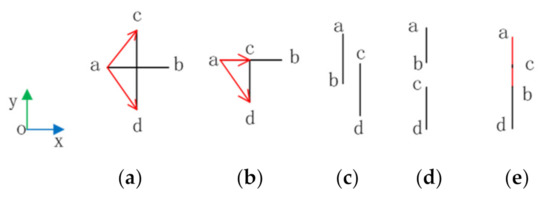
Figure 6.
Intersection of two line-segments in a plane; (a,b) shows the two line-segments are perpendicular; (c–e) shows the two line-segments are parallel.
3. The Implement of Three-Dimensional Line Probe Algorithm in Three-Dimensional Space
To implement the three-dimensional line probe algorithm, the first job is to determine the escape line. As introduced in Section 2, the wiring obstacles include surfaces and lines. Different from the two-dimensional plane, the three-dimensional line probe algorithm needs to extend escape lines in multiple directions at the same time. As demonstrated in Figure 7, the source point S elongates in six orthogonal directions to x-axis, y-axis and z-axis at the same time. It does not stop the elongation until encountering obstacles (lines or planes). As can be seen from Figure 7b, the escape line (red dotted line) of point S along z-axis stops the elongating when it encounters line obstacles. Because the escape line along the y-axis never encounter any obstacles, it can elongate infinitely. To avoid this issue, the boundary constraint of the whole system is added, which is equivalent to the shell of the motor drive.
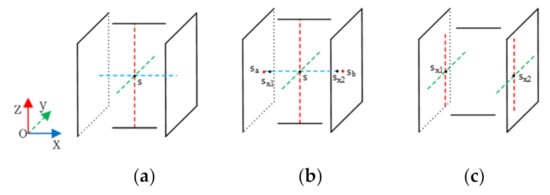
Figure 7.
(a)The source point S stop the elongation for encountering obstacles (lines or planes). (b) Coordinate selection of the escape point. (c) The extension of new escape points.
The second issue is the selection of escape points. As showed in Figure 7b, it is assumed that the endpoint position of the escape line lab in x-axis direction are Sa(xa,ya,za) and Sb(xb,yb,zb), respectively. Taking the escape points along the x-axis as an example, the position of the left escape point Sx1 is (xa + u, ya,za), and the position of the right escape point Sx2 is (xb − u, yb,zb), where u is the minimum wiring spacing. Similarly, the positions of escape points in y-axis and z-axis directions can be defined.
Then, new escape lines are generated from the new escape points Sx1 and Sx2. Different from escape lines generated from the source point S, new escape lines are generated from both the escape points Sx1 and Sx2, and only towards the y and z axes, as is shown in Figure 7c.
Similarly, the same operations from the target point T can be conducted, and recorded in Tlist, until there is an intersection point between the line-segments in Slist and Tlist. Then, a tracing back will be carried out, and the connection of all intersections comes to the routing plan.
4. Verification of the Three-Dimensional Line Probe Algorithm
To verify the feasibility of the three-dimensional line probe algorithm, the busbar of a 50 kW vehicle motor drive is designed. The inverter is composed of eight capacitors in parallel and one three-phase power module. The parameters of the components are listed in Table 1, and the connection point positions are listed in Table 2. The positions of the components are randomly placed to verify the routing capability of the presented algorithm. The experimental results are shown in Table 3. One thousand layouts are randomly generated, and the average routing time of each layout mode is 0.6943 s, the maximum routing time is 1.7359 s.

Table 1.
Parameters of each component of vehicle motor drive.

Table 2.
Connection point location of bus capacitance and power module.

Table 3.
Routing speed of three-dimensional line probe algorithm.
For example, the randomly generated layouts are shown in Figure 8a, Figure 9a and Figure 10a, and the wiring results of each are shown in Figure 8c, Figure 9c and Figure 10c. The red line is the positive connection of the busbar, and the black line is the negative connection of the busbar.

Figure 8.
(a) The randomly generated layouts; (b) the routing results of our routing algorithm; (c) the final result of the bus connection.

Figure 9.
(a) The randomly generated layouts; (b) the routing results of our routing algorithm; (c) the final result of the bus connection.

Figure 10.
(a) The randomly generated layouts; (b) the routing results of our routing algorithm; (c) the final result of the bus connection.
5. Expansion of Bus Structure
The line skeleton of the bus can be obtained by the three-dimensional line probe algorithm, but the width of the bus is not negligible. Therefore, after the three-dimensional line probing is conducted to form the skeleton of a bus, it is necessary to further expand it and finally complete the design of the bus. When routing is completed, plane expansion is required for the bus in the same plane. First of all, all the wiring needs to identify the specific position of all the line segments in space (including the direction of the line segment and its obstacles in different directions of expansion). Secondly, the expansion of the bus is completed according to some expansion rules of the bus. The basic expansion rules aim at making the structure of the whole system more compact. As shown in Figure 11, it is assumed that a bus of 10 mm width and 1 mm thickness is to be passed between two horizontal distributed components. To make the system structure more compact, the horizontal spacing between elements d is minimized. According to the above busbar rules, when the direction of the busbar is the z-axis direction, the busbar extension mode is shown in Scheme ① in Figure 11b. If the direction of the bus is in y-axis direction, scheme ④ in Figure 11b should be selected according to the above rules.

Figure 11.
(a) A situation where two components are distributed horizontally; (b) Different ways of spreading through the bus between two components distributed horizontally.
Another example is shown in Figure 12. It is assumed that a bus with a width of 10 mm and a thickness of 1 mm is to be passed between the upper and lower distributed components. When the direction of the bus is in the y-axis direction, according to design rules, the scheme ① shown in Figure 12b should be selected. If the direction of the bus is in the direction of the x-axis, scheme ④ in Figure 12b should be selected according to the above busbar expansion design rules.

Figure 12.
(a) A situation where two components are distributed vertically; (b) Different ways of spreading through the bus between two components distributed vertically.
To verify the feasibility of the bus automatic design method proposed in this paper, an automatic bus design of a vehicle motor drive controller with a peak power of 85 kW was conducted. With the help of a genetic algorithm, the busbar was optimized with the presented line probing method, the design result of the busbar is shown in Figure 13, with the original capacitance and power module shown in Figure 13a. According to the bus design results in Figure 13b, the actual bus structure designed in SolidWorks is shown in Figure 13c. The explosion diagram of the whole motor controller is shown in Figure 13d.
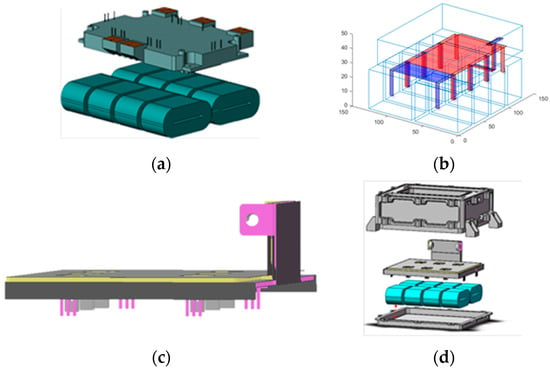
Figure 13.
(a) Layout of bus capacitance and power modules; (b) Results of automatic bus design; (c) 3D model of the actual bus designed according to the results of the automatic bus design; (d) Explosion diagram of the entire motor controller.
To verify the low stray inductance of the designed bus, a double-pulse test was carried out on the designed bus. The device tested is a MD300FFC120P3H SiC MOSFET from Starpower (Jiaxing city, China) and the test conditions are, load inductance 45 μH, Rg = 10 Ω, UGE = +20 V/−5 V. The test waveform under the conduction conditions of 600 V/300 A is shown in Figure 14. Test data of stray inductance are shown in Table 4, where it can be seen that the stray of the bus is less than 38 nH and the bus meets the design requirements of the motor control system.
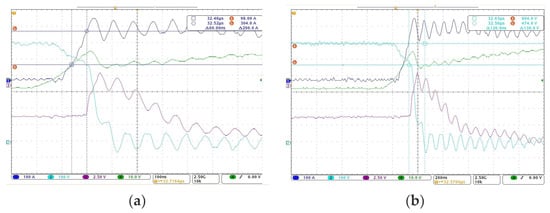
Figure 14.
(a) ΔI of the test waveform under the conduction condition of 600 V/300 A; (b) ΔU of the test waveform under the conduction condition of 600 V/300 A.

Table 4.
Stray inductance test data of bus.
Finally, the design method proposed in this paper is compared with the methods of other groups, as shown in Table 5. As can be seen from Table 5, the current busbar design method is mainly based on the results of Ansys Q3D simulation software to summarize the rules, repeatedly adjust the structure of the busbar, and the design cycle is long. According to the research of other teams, the bus design rules are obtained, and the automatic bus design is realized by combining with the three-dimensional line probe algorithm. Moreover, the model of the components in the proposed method can be modified according to the needs, which is beneficial to the overall integrated optimization design of the motor control system.

Table 5.
Comparison of busbar design methods among different teams.
6. Conclusions
A three-dimensional line probe algorithm to solve the busbar design issue of a motor drive is proposed in this paper, where the principle and design flow of the method are described in detail, and the model expression of the motor controller components in the algorithm is introduced. One thousand layouts are tested as an example in a short time and three typical connections are shown. According to the automatic design method proposed in this paper, the development of a physical prototype is completed. The experimental results verify that the bus design method can meet the requirements of actual inverters.
Finally, the existing busbar design methods and the proposed method are compared. Future research may focus on further improvements to three-dimensional line probe algorithm, such as goal-driven active exploration to minimize point-to-point distance. In summary, the problem of automatic wiring of a busbar can be solved by the method proposed in this paper, which lays a good foundation for the integration design of a motor drive systems in EV applications.
Author Contributions
Conceptualization, Y.H. and P.N.; methodology, Y.H. and P.N.; software, Y.H. and H.C.; validation, Y.H., H.C., P.N. and T.F.; writing—original draft preparation, Y.H.; writing—review and editing, P.N.; project administration, P.N. and T.F.; funding acquisition, P.N. and T.F. All authors have read and agreed to the published version of the manuscript.
Funding
This research was funded by National Key R&D Program of China No.2016YFB0100600 and the Institute of Electrical Engineering, CAS (E155310101).
Acknowledgments
This research is supported by National Key R&D Program of China No.2016YFB0100600 and the Institute of Electrical Engineering, CAS (E155310101).
Conflicts of Interest
The authors declare no conflict of interest.
References
- Ding, Z.; Teng, F.; Sarikprueck, P.; Hu, Z. Technical Review on Advanced Approaches for Electric Vehicle Charging Demand Management, Part II: Applications in Transportation System Coordination and Infrastructure Planning. IEEE Trans. Ind. Appl. 2020, 56, 5695–5703. [Google Scholar] [CrossRef]
- Turker, H.; Bacha, S. Optimal Minimization of Plug-In Electric Vehicle Charging Cost with Vehicle-to-Home and Vehicle-to-Grid Concepts. IEEE Trans. Veh. Technol. 2018, 67, 10281–10292. [Google Scholar] [CrossRef]
- Jian, L. Electric vehicle charging infrastructure assignment and power grid impacts assessment in Beijing. Energy Policy 2012, 51, 544–557. [Google Scholar]
- Su, W.; Eichi, H.; Zeng, W.; Chow, M.Y. A Survey on the Electrification of Transportation in a Smart Grid Environment. IEEE Trans. Ind. Inform. 2012, 8, 1–10. [Google Scholar] [CrossRef]
- Joseph, J.J.; Juliha, J.L.; Josh, F.T. Review on the recent development of the power converters for electric vehicle. In Proceedings of the 2017 2nd International Conference on Communication and Electronics Systems (ICCES), Coimbatore, India, 19–20 October 2017; pp. 641–644. [Google Scholar]
- Sahinler, G.B.; Poyrazoglu, G. V2G Applicable Electric Vehicle Chargers. In Proceedings of the Power Converters & Their Controllers: A Review, 2020 2nd Global Power, Energy and Communication Conference (GPECOM) 2020, Virtual, Izmir, Turkey, 20–23 October 2020; pp. 59–64. [Google Scholar]
- Habib, S.; Khan, M.M.; Abbas, F.; Ali, A.; Faiz, M.T.; Ehsan, F.; Tang, H. Contemporary trends in power electronics converters for charging solutions of electric vehicles. CSEE J. Power Energy Syst. 2020, 6, 911–929. [Google Scholar]
- Ding, N.; Prasad, K.; Lie, T.T. The Electric Vehicle: A Review. Int. J. Electr. Hybrid Veh. 2017, 9, 49–66. [Google Scholar] [CrossRef]
- Wang, X. Researches and Applications of Wide Bandgap SiC Power Devices in Electric Vehicles. Proc. Chin. Soc. Electr. Eng. 2014, 34, 371–379. [Google Scholar]
- Ning, P.; Wang, F.; Ngo, K.D. Automatic Layout Design for Power Module. IEEE Trans. Power Electron. 2013, 28, 481–487. [Google Scholar] [CrossRef]
- Ning, P.; Yuan, T.; Cao, H.; Li, L.; Kang, Y. The development of 1200 V SiC Hybrid Switched power modules. In Proceedings of the 2019 IEEE International Workshop on Integrated Power Packaging (IWIPP), Toulouse, France, 24–26 April 2019; pp. 7–11. [Google Scholar]
- Lemmon, A.N.; Cuzner, R.; Gafford, J.; Hosseini, R.; Brovont, A.; Mazzola, M.S. Methodology for Characterization of Common-Mode Conducted Electromagnetic Emissions in Wide-Bandgap Converters for Ungrounded Shipboard Applications. IEEE J. Emerg. Sel. Top. Power Electron. 2018, 6, 300–314. [Google Scholar] [CrossRef]
- Zhang, B.; Wang, S. Parasitic Inductance Modeling and Reduction for a Wire Bonded Half Bridge SiC MOSFET Multichip Power Module. In Proceedings of the IEEE Applied Power Electronics Conference and Exposition-APEC, Anaheim, CA, USA, 17–21 March 2019; pp. 656–663. [Google Scholar]
- Ning, P.; Yuan, T.; Kang, Y.; Han, C.; Li, L. Review of Si IGBT and SiC MOSFET based on hybrid switch. Chin. J. Electr. Eng. 2019, 5, 20–29. [Google Scholar] [CrossRef]
- Chang, Y.; Luo, H.; Iannuzzo, F.; Bahman, A.S.; Li, W.; He, X.; Blaabjerg, F. Compact Sandwiched Press-Pack SiC Power Module With Low Stray Inductance and Balanced Thermal Stress. IEEE Trans. Power Electron. 2019, 35, 2237–2241. [Google Scholar] [CrossRef]
- Chen, C.; Pei, X.; Chen, Y.; Kang, Y. Investigation, Evaluation and Optimization of Stray Inductance in Laminated Busbar. IEEE Trans. Power Electron. 2014, 29, 3679–3693. [Google Scholar] [CrossRef]
- Dong, Z.; Tao, F.; Xuhui, W.; Puqi, N.; Lei, L.; Xiang, T.; Ye, L.; Zhuolin, D.; Guolin, L.; Shaokun, Z.; et al. Research on High Power Density SiC Motor Drive drive. Proc. Chin. Soc. Electr. Eng. 2019, 39, 5624–5634. [Google Scholar]
- Bo, L.; Liu, W.; Kan, D.; Qiang, M.; Diao, L. Analytical Calculation Method for Stray Inductance of Converter Busbar Based on Full Silicon Carbide Power Module. Trans. China Electrotech. Soc. 2021, 36, 2105–2114. [Google Scholar]
- Pasterczyk, R.J.; Martin, C.; Cuichon, J.M.; Schanen, J.L. Planar busbar optimization regarding current sharing and stray inductance minimization. In Proceedings of the 2005 European Conference on Power Electronics and Applications, Dresden, Germany, 11–14 September 2005; pp. 1–9. [Google Scholar]
- Yuan, L.; Yu, H.; Wang, X.; Zhao, Z. Design, simulation and analysis of the low stray inductance bus bar for voltage source inverters. In Proceedings of the 2011 International Conference on Electrical Machines and Systems, Beijing, China, 20–23 August 2011; pp. 1–5. [Google Scholar]
- Zare, F.; Ledwich, G.F. Reduced Layer Planar Busbar for Voltage Source Inverters. IEEE Trans. Power Electron. 2002, 17, 508–516. [Google Scholar] [CrossRef][Green Version]
- Zare, F.; Ledwich, G. A plane busbar impedance calculation using Maxwell’s equations. In Proceedings of the 1999 11th International Symposium on ‘High Voltage Engineering’ (ish99), London, UK, 23–27 August 1999. [Google Scholar]
- Hightower, D.W. A solution to line-routing problems on the continuous plane. In Proceedings of the 1988 ACM Design Automation Conference, DAC 1988, Anaheim, CA, USA, 12–15 June 1988; Institute of Electrical and Electronics Engineers Inc.: Anaheim, CA, USA, 1988; pp. 11–34. [Google Scholar]
Publisher’s Note: MDPI stays neutral with regard to jurisdictional claims in published maps and institutional affiliations. |
© 2021 by the authors. Licensee MDPI, Basel, Switzerland. This article is an open access article distributed under the terms and conditions of the Creative Commons Attribution (CC BY) license (https://creativecommons.org/licenses/by/4.0/).