1. Introduction
In recent decades, the level of urban air pollution, based on historical GHG emissions [
1], has increased considerably in Mexico City, leading to harmful effects on the ecosystem. Therefore, Mexico has become a global focus in terms of the pollution level. Air pollution originates mainly from anthropogenic activities, resulting in changes to natural resources such as water, air, and soil. Global population growth has increased fossil fuel use to fulfill population energy needs [
2], resulting in environmental pollution, mainly air and water pollution. To perform a cost-environmental impact assessment, it is necessary to determine the trajectory of pollutant emissions [
3]. Environmental pollution involves contributions from different sectors and activities, such as industry, agriculture, mining, livestock, and mobility. The transport sector represents one of the largest consumers of fossil fuels [
4]. In Mexico, the transport sector contributes approximately 53.3% of pollutant emissions [
5], as this sector is primarily based on internal combustion vehicles (ICVs), which work by burning fossil fuels. The constant use of ICVs increases levels of pollutants including carbon dioxide and nitrous oxide.
Some studies [
6,
7,
8] have proposed measures to mitigate or reduce pollutant emissions caused by the transport sector. There have been proposals to standardize fuels in order to make efficiency improvements through the removal of inefficient products from the market by manufacturers, allowing final consumers to make a decision based on efficiency and cost information. It has been argued that, through this measure, the contribution of the transport sector to environmental pollution could be reduced. However, other studies argue that air pollution could be reduced by accelerating the introduction of clean and efficient technologies in the transport sector [
9], specifically biofuels [
10,
11], which could reduce the level of dependence on fossil fuels. According to the International Energy Agency forecast [
12], by the year 2050, global CO
2 levels may decrease by approximately 2 gigatons per year by using biofuels to meet up to 27% of the energy demands of the transport sector. Nevertheless, optimal and sufficient technological development in the production of efficient and economical biofuels is yet to be achieved, resulting in low adoption of biofuels as the main sources of alternative energy.
Other measures that have been proposed to mitigate pollutant emissions are the use and adoption of electric vehicles (EVs) [
9,
13,
14]. Compared with internal combustion vehicles (ICVs), EVs were late to acquire popularity in the market—beginning in the 1970s, due to the high price of fuel [
15], and ending in the 1990s, with a mandate of zero emissions introduced in the USA [
16]. In 2019, 4.79 million EVs were being used worldwide [
17], and this number is expected to increase to 43 million units by 2030 [
18].
The studies presented in [
19,
20,
21,
22,
23,
24,
25,
26,
27] addressed the economic effectiveness of EVs on the market compared with ICVs and hybrid electric vehicles (HEVs) using the life-cycle cost methodology and considering different stages, such as production, operation, maintenance, and depreciation/end of life. Many of these studies assessed the competitiveness of EVs in a market that has been monopolized by ICVs and the petrol industry.
This paper aims to perform a cost-environmental impact assessment of electric vehicles, specifically taxis in Mexico City, in order to assess the feasibility of using EVs compared with ICVs. Additionally, a sensitivity analysis is performed to observe the effects of possible variations in the parameters used. Despite our use of specific parameters for the Mexican market, the methodology used in this paper can be applied worldwide to calculate the LCC and assess pollutant emissions.
The geographical area to be studied is Mexico City. According to data obtained through the INEGI portal [
28], the CDMX territory has an area of 1487 km
2, which represents 0.08% of the total territory of Mexico, and is divided into 16 municipalities. According to the last census (conducted in 2015), it has a total population of approximately 8,985,339 inhabitants. The total emissions per year in Mexico City is 16,745,438 tons of CO
2 equivalents, 5.23% of the average annual national emissions [
29].
This study contributes to the literature in two areas. Firstly, it evaluates the feasibility of introducing EVs to the Mexican market and for use in public transport, specifically taxis, by using local data to conduct a technoeconomic analysis of electric vehicles and identify dominant factors that affect the total LCC. Furthermore, this study determines the environmental impact of EVs in terms of GHG emissions.
2. Literature Review
Multiple LCC papers have been published in order to assess the effectiveness of introducing new technologies into the vehicle market: for example, EVs (e.g., Mitropoulos et al. [
19] and Breetz [
21]), electric buses (e.g., Li et al. [
25]), and hybrid electric trucks (e.g., Vora et al. [
26]).
Some studies have argued that the parameters for LCC calculation might vary depending on the study area: for example, the annual driving mileage [
19,
21], fuel price, annual taxes, and insurance costs [
30].
Geographically, multiple economic evaluations have been performed to measure the competitiveness of the introduction of EVs into the market [
19,
20,
21,
22,
23] in areas such as Europe, the USA, Singapore, and Australia. Some studies have concluded that the LCC of EVs is lower than that of ICVs in countries such as Japan, the UK, the USA, France, and Norway [
23,
24]. On the contrary, in some countries, such as Italy, Hungary, Portugal, Germany, and Austria, the LCC of EVs is higher [
23].
In China, the EV fleet has increased considerably over the years. Thus, many economic studies of EVs have been conducted. The authors of [
31] compared the cost effectiveness of EVs and ICVs. They concluded that the LCC of EVs could be lower if longer distances were considered. The authors in [
32] assessed the LCC with the consideration of tangible and intangible costs of traffic policies. The results showed that the incorporation of intangible costs, such as purchasing and driving restrictions, would make the EVs more cost competitive. He et al. [
33] considered the point of view of potential consumers to estimate the LCC of EVs and defined a critical acquisition cost as a break-even point for potential consumers to choose EVs over ICVs. The authors of [
34] compared the economic benefits of EVs in three different countries: China, the United States, and Germany. They showed that despite differences in parameters, such as fuel prices, subsidies, and driving patterns, the economic benefits barely differed among these regions.
Previously conducted studies have shown different results when conducting LCCs to assess the feasibility and competitiveness of EVs in the automotive market with results depending on the values of the local parameters used. Some studies concluded that parameters such as the annual driving mileage used for the LCC calculation [
19,
21] vary in terms of the total number of miles or kilometers. For instance, [
21,
31] emphasized that the LCC of EVs is lower than that of ICVs and HEVs. They considered longer distances in the analysis, which suggests a greater benefit of EVs in terms of fuel cost savings.
The influence of the annual distance traveled has been identified as important in some studies. Nevertheless, other dominant parameters affect the LCC results, such as taxes [
20,
24], acquisition or purchase costs, and local electricity prices [
20,
22]. On the contrary, [
21] did not identify dominant parameters in the LCC.
Most studies in this area considered all LCC factors and stages for their calculations; however, some factors were excluded from the LCC analysis in various studies: for example, the maintenance cost [
22] and the effects of the different parameters in the sensitivity analysis [
19,
22].
Mixed LCC results have been published worldwide. Differences have been influenced by the local market parameters used and different values in, for example, the acquisition cost, fuel prices, efficiencies, taxes, and subsidies, among others. Therefore, to perform an analysis of the cost-technical impacts of different vehicles, it is important to consider the appropriate use of local parameters.
3. Methods and Data
3.1. Vehicle Selection
As this research used Mexico City as the area of study, ICVs such as the Nissan Versa and Chevrolet Beat were used. These models are the most appropriate for use as taxis at the economic and technical levels. Additionally, electric cars such as the Nissan Leaf and Chevrolet Bolt were chosen, as these can be more easily purchased from the Mexican market. This selection was made with the objective of comparing the LCC and polluting emissions of EVs and ICVs.
The vehicles were chosen according to different factors, such as the popularity and prestige of the brands. According to the INEGI database [
35], in the period from January to September 2020, these vehicles were the best-sellers in Mexico.
Some general characteristics and parameters of the chosen vehicles can be seen in
Table 1.
3.2. Life Cycle Cost Analysis
3.2.1. LCC Overview
The life-cycle cost [
38] refers to all costs incurred throughout the lifetime of an object. This approach can be extrapolated to perform an analysis in the economic context considering all costs involved in a vehicle’s lifetime, such as the acquisition cost, operating cost, depreciation cost, and maintenance cost. The life-cycle cost analysis is also useful for the identification of expensive components that may block the rapid expansion of products (in this case automobiles) on the market. Equation (1) was used to calculate the LCC, which involves all costs related to the use of the vehicles:
where
,
,
and
MC = maintenance cost.
3.2.2. Acquisition Cost
Based on manufacturers’ suggested retail prices (MSRPs), the acquisition cost of EVs has been high throughout the years. Nevertheless, one of the advantages of promoting the development of the internal automobile market through a decree published by the Mexican government [
39] is the exemption of tariffs for electric vehicles.
One of the main causes of EVs’ high acquisition cost is the cost of batteries. This considerably affects their sale price. Therefore, it affects both the expansion of EVs in the market and the adoption of this type of vehicle by society. Nonetheless, studies related to batteries and their energy storage [
40] have estimated that the cost per Kilowatt/hour decreased in the period from 2007 to 2014 by approximately 14% each year. The cost of batteries used by the main manufacturers of electric vehicles is even lower, around USD 299, which is equivalent to MXN 6000, per kWh. Annually, an 8% reduction in the battery cost is projected. This could be advantageous for the EV market and could lead to a noticeable decrease in environmental pollution.
3.2.3. Operation Costs
As cited in [
40], according to Frenning (2001), the operating costs include all costs related to the consumption of energy supply, water, service, security, and administration, among others. The operating costs applied to vehicles include the fuel cost (for ICVs) and the average recharge cost (for EVs). Furthermore, service fees include holding taxes, pollutant emissions checks, and the insurance cost.
The operating costs can be calculated by Equation (2):
where
,
,
and
CS = Insurance covering.
To determine the real cost of fuel, parameters such as the vehicle efficiency type
j (
ηj), the domestic recharging efficiency (for EVs) [
41] (
ηcharging), the annual distance traveled (
Di) in period
i, the electricity cost [
42] (
Celect,i) and the gasoline fuel cost [
43] (
Cgas,i) are used. The fuel cost for ICVs can be calculated with Equation (3), and that for EVs can be calculated with Equation (4).
3.2.4. Maintenance Cost
The maintenance cost applied to vehicles includes preventive and corrective maintenance costs, such as the service cost based on the distance traveled, battery cost, and tire replacement cost. Preventive maintenance of vehicles avoids the need for larger repairs by prioritizing smaller ones throughout a vehicle’s lifetime. In other words, preventive maintenance is car servicing to prevent failure over the vehicle’s lifetime, while corrective maintenance considers changes in vehicle batteries and tires.
The maintenance cost can be calculated with Equation (5):
where
PMC = preventive maintenance cost and
CMC = corrective maintenance cost.
The preventive maintenance cost can be calculated using the preventive maintenance index (
IMPi) and the distance traveled. The preventive maintenance cost can be calculated with Equation (6):
The
IMPi can be calculated with Equation (7):
where
pmi = maintenance cost in each period
i.
The corrective maintenance cost can be calculated using cost parameters such as the battery change cost
(CBi) and tire replacement cost
(CNi), both in period
i. Equation (8) is used to calculate the corrective maintenance cost:
where
BC = battery cost, and
tC = tires cost.
The cost of batteries is one of the most important factors to consider since it is one of the main contributors to both the total LCC and the cost of corrective maintenance. Nonetheless, as previously mentioned, by the reducing battery cost [
40,
44], the maintenance cost should decrease, allowing a much greater benefit for electric vehicles.
3.2.5. Depreciation/Disposal Cost
The depreciation cost includes factors that reduce the price of a new item. Applied to vehicles, depreciation represents the difference between the acquisition cost and the vehicle’s current value in the market. According to the Income Tax Law [
45] and the depreciation rates seen in Article 34, the depreciation rate of new cars is around 10–25% per year.
The depreciation/disposal cost was calculated with Equation (9) using parameters such as the depreciation cost of the vehicle at the end of period
n and the battery scrap cost:
where
CDV = vehicle depreciation cost, and
CSB = battery scrap cost.
Assuming the vehicle owner earns income from the sale of the vehicle, the amount will be negative, because the costs of scrapping/selling the vehicle and the battery are subtracted from the total life-cycle cost.
3.3. LCC Data Requirements
For collection of the LCC main parameters, it was necessary to identify the cost-technical characteristics of the different vehicles chosen. The data were collected from research articles, databases of technical specifications, and economic data provided by the manufacturers of the chosen vehicles and web pages. The costs of the LCC are given in Mexican pesos (MXN) and US dollars (USD) using the conversion rate from January 2021 of USD 1 = MXN 20.12. The chosen annual distance (
Di) was 15,000 km with a vehicle lifetime of 8 years. Nevertheless, this annual distance was set as a reference. Since taxis use longer distances for their services, the average distance per trip in a day for taxis was taken as 4.9 km [
46], assuming 20 trips per day and a six-day working week. In a year, the average travel distance for a taxi was determined to be around 31,066 km. The parameters used for the LCC calculations can be seen in
Appendix A Table A1.
Data on the average cost of domestic electricity consumpton were obtained from the National Electricity Sector data portal [
42]. Furthermore, the average cost of gasoline was obtained from the Energy Regulatory Commission portal [
43].
Holding taxes and verification costs were omitted for EVs [
39]. On the other hand, for ICVs, these costs were MXN 650 (USD 32.30) and MXN 1100 (USD 54.67), respectively. The insurance coverage cost varies depending on an automobile’s insurance company (see
Table A1).
The cost of the preventive maintenance index (
IMPi) for ICVs is USD 0.0334 per km [
19] or MXN 0.6699 per km. This analysis included an estimate of the service cost for any internal combustion vehicle. In this study, real service costs were considered for each selected ICV. The maintenance cost of an electric vehicle, which has fewer mechanical components than an ICV, was estimated to be approximately 30% lower than that of the average maintenance cost for an ICV [
47].
The cost of batteries in the year 2020, in terms of their storage capacity limit, was deemed to be USD 193.83 kWh/km based on an annual reduction in the cost of batteries of 8% [
40]. A useful life of 100,000 miles or 169,934.4 km [
48] was considered for EV batteries. On the contrary, a useful life of 5 years was considered for ICV batteries. Their useful life is shorter because they contain more corrosive components.
3.4. LCC Sensitivity Analysis
As already mentioned above, the life-cycle cost uses technical and economic parameters for its calculation. The sensitivity analysis allowed us to determine the effects of different factors on the LCC, such as the acquisition and battery costs, electricity and fuel costs, and the distance traveled per year.
The acquisition cost was mainly based on the manufacturer’s suggested retail price (MSRP) and the official brand website for each vehicle. These costs may vary depending on factors related to each location, such as import taxes, variations in the market caused by supply and demand, and the addition of new technologies, among others. The sensitivity analysis applied to the acquisition cost allowed us to determine the percentage decrease required for EVs to compete with ICVs and have a greater level of expansion in the market.
The fuel cost influences the total operating costs. The variation in fuel prices—electricity for EVs (CComEV,i) and gasoline for ICVs (CComVCI,i)—depends on the parameters of the area to be studied. A change in the price of gasoline will not directly affect EVs. Nevertheless, if the cost of gasoline is too high, the LCC of ICVs will increase, making EVs more affordable for users.
Additionally, the battery cost factor is one of the most influential factors in the economic analysis, because it affects both the changing battery cost (
BCi) and the maintenance cost (
MC), thus affecting the life-cycle cost. Several studies have argued that the battery cost is the most important factor to consider while analyzing the LCC in terms of electric vehicles [
40,
44].
Finally, an analysis of the annual distance traveled was performed. This factor mainly influences the results of the LCC, the operating costs (OC) and the maintenance cost (MC). Despite assuming the same average distance for all vehicles, it is essential to know the annual distance variation, because users are expected to have different mileages every year.
3.5. Environmental Impact Analysis
One of the problems related to environmental pollution in Mexico and Mexico City is the increase in greenhouse gases (GHG) [
1]. These gases can be represented by an intensity factor given in terms of the equivalent carbon dioxide (
CO2) concentration. The greenhouse gas concentration can be analyzed in terms of the mass of carbon dioxide [
49], which can be calculated using Equation (10):
where
m represents the masses of the different components, such as carbon dioxide (
CO2), methane (
CH4) and nitrous oxide (
N2O). Other components, such as hydrofluorocarbons (
HCFCs), perfluorocarbons (
PFCs), and sulfur hexafluorides (
SF6), are omitted from Equation (10) due to their minimal contributions to the combustion process [
41].
Coefficients 1 for (CO2), 21 for (CH4) and 310 for (N2O) refer to the Global Warming Potential index (GWP), which is a measure of absorbed heat trapped by a certain greenhouse gas compared with a reference gas, in this case (CO2). In other words, it can be interpreted as the damage caused by gases in the atmosphere: for instance, each unit of methane (CH4) is equivalent to 21 units of carbon dioxide (CO2).
In this study, the equivalent emissions of (CO2) were analyzed in three stages of the life cycle of vehicles: production, operation, and disposal.
3.5.1. GHG Emissions in the Vehicle Production Phase
To assess the environmental impact of vehicle production type
j, we considered the weight of the vehicle, the battery’s weight, the greenhouse gas emissions per kilogram of the vehicle, and the battery [
50]. To calculate the polluting emissions resulting from a vehicle’s production, Equation (11) was used:
where
IAVi environmental impact during production phase,
mv = vehicle weight,
mbat = battery weight,
EGHGv = GHG vehicle emissions, and
EGHGbat = GHG battery emissions.
For the production of vehicles, it was assumed that the average emissions per kilogram for vehicles (EGHGv) and batteries (EGHGbat) were the same for all models.
3.5.2. GHG Emissions in the Vehicle Operation Phase
In this phase, the greenhouse gas emissions produced by both the driving of vehicles and the fuel generation plants (gasoline for ICVs and electricity for EVs) were considered. A proportional part of the power created by the electric power generation plant (1–𝜂𝑇𝐸%) is lost during its creation and distribution [
51]. 𝜂𝑇𝐸 refers to the efficiency of the electricity distribution which, in Mexico, has an average value of 86.8094% [
52]. Furthermore, it was necessary to consider the amount of energy lost during local recharging of EVs: (1–𝜂charge%) [
22].
The amount of fuel (electric energy) required by an EV is given by the following equation:
where
ReqEnergyEV is the energy required for an electric vehicle. It can be calculated as follows:
Additionally,
EP is the plant’s electricity production, which can be calculated as the product of the efficiency of electricity production (
ηEP) (38%) [
53], since most electricity in Mexico City is produced by natural gas, and the heating value produced by the fuel used for that production is (
HVfuel). The
EP was calculated by
Then, the total greenhouse gas emissions during the operation stage was calculated by Equations (15) and (16).
The tailpipe emissions pelled by the EVs were not considered because this type of vehicle produces zero polluting emissions.
The equation represents the GHG in CO2 terms.
For ICVs,
where
CComVCI,i is the fuel consumption in liters, which can be calculated by Equation (3) with the fuel cost omitted.
Additionally,
ECGVCI is the polluting emissions due to gasoline refining, which can be calculated with Equation (17):
3.5.3. GHG Emissions in the Vehicle End-of-Life Phase
In this stage, emissions that only occur in the last stage of the life cycle were considered. Thus, the same factors as in the production stage were used. These were calculated with Equation (11) in the same way as for the production phase. Furthermore, it was assumed that the average emissions per kilogram for vehicles (
EGHGv) and batteries (
EGHGbat) during the disposal of vehicles were the same for all models. The emissions per kilogram can be seen in
Table A2.
3.5.4. Environmental Impact Analysis Data Requirements
A pollutant emissions analysis was performed for the production, operation, and disposal phases of the different vehicles chosen using the technical parameters shown in
Table A1. Furthermore, factors and parameters such as the vehicle efficiency, GHG emissions during the production phase, power plant electricity distribution efficiency, local charging efficiency, and energy requirements were used. The parameters used for the calculations can be found in
Table A3. For the vehicle production phase, GHG emissions from extraction and processing, manufacturing, and end-of-life stages were considered, and the values can be seen in
Table A2.
To calculate the values for the operation stage, the fuel heating value used for the production of electricity in Mexico City (e.g., from natural gas) was considered (see
Table A4).
4. Results
The methodologies outlined in
Section 3 were used for the LCC and environmental emissions calculations.
4.1. LCC Analysis
The results obtained for the LCC of the chosen vehicles are shown in
Table 2 and
Figure 1. Furthermore, ICVs are compared with EVs.
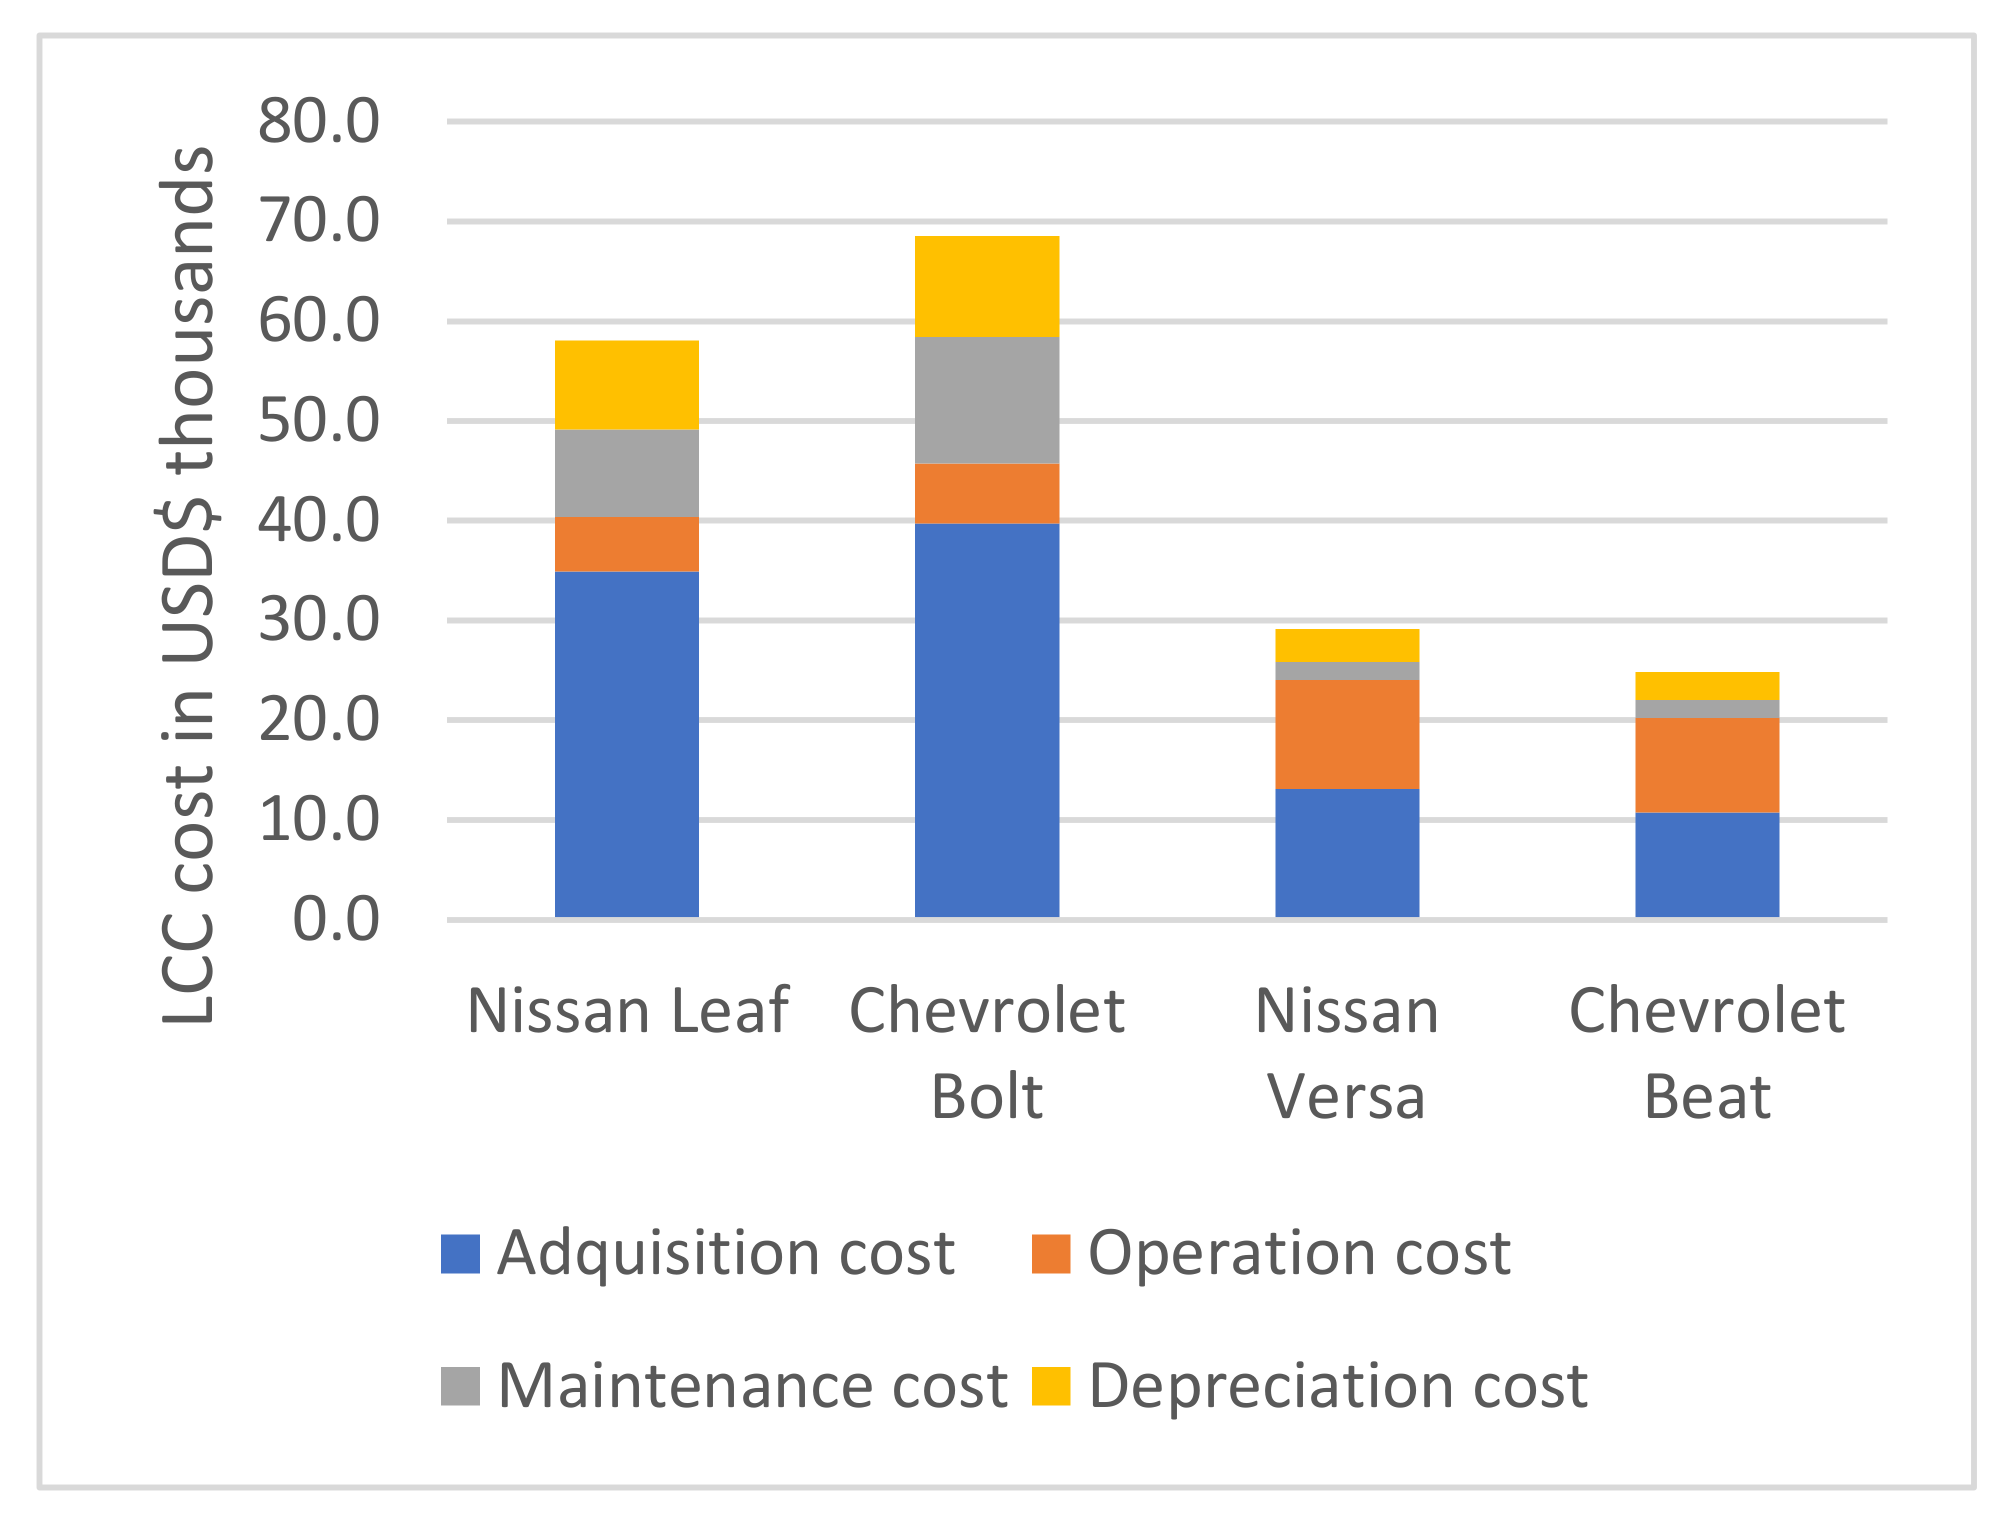
LCC values over the EV lifetime of 8 years were far larger than those of ICVs. For instance, the LCC values were USD 41,793 and USD 49,963 for the Nissan Leaf and Chevrolet Bolt, respectively. In the case of ICVs, the LCC values were USD 25,284 and USD 21,736 for the Nissan Versa and Chevrolet Beat, respectively. These LCC values were calculated with an average annual distance of 15,000 km.
As can be seen from
Table 2, the highest percentage of the LCC is attributed to the acquisition cost. The LCC of EVs is still far larger than that of ICVs; this difference can be seen graphically in
Figure 1. The acquisition cost for EVs was found to contribute to 86.64% and 82.21% of the LCC for the Nissan Leaf and Chevrolet Bolt, respectively, whereas in the ICVs, the contribution was approximately 30% less. Regarding the operating costs, the EVs have a certain advantage because of savings in fuel costs per year, verification costs, and holding taxes. The operating costs were found to contribute to only 13.58% and 12.48% of the LCC for the Nissan Leaf and Chevrolet Bolt, respectively. It can be seen in
Table 2 that the contribution of the operating costs was the lowest among all costs involved in the LCC.
The results show a benefit of EVs in terms of operation costs when the distance was set at 15,000 km. The difference in the operation cost between EVs and the ICV with the closest result (Chevrolet Beat) was 34.90% and 36% for the Nissan Leaf and Chevrolet Bolt, respectively. The EV maintenance cost was identified as the second most relevant factor, because it contributes to at least 20% of the LCC. Furthermore, the preventive maintenance cost of EVs is almost nil because they have fewer mechanical components than ICVs.
The cost of batteries is a significant factor due to their high corrective maintenance cost, which was found to contribute to 20% and 25% of the total LCC of the Nissan Leaf and Chevrolet Bolt, respectively. Nevertheless, when an average annual distance of 31,066 was considered, as described in 3.3, the maintenance cost of the EVs increased drastically to around 95.39% for the Nissan Leaf and 96.80% for the Chevrolet Beat (see
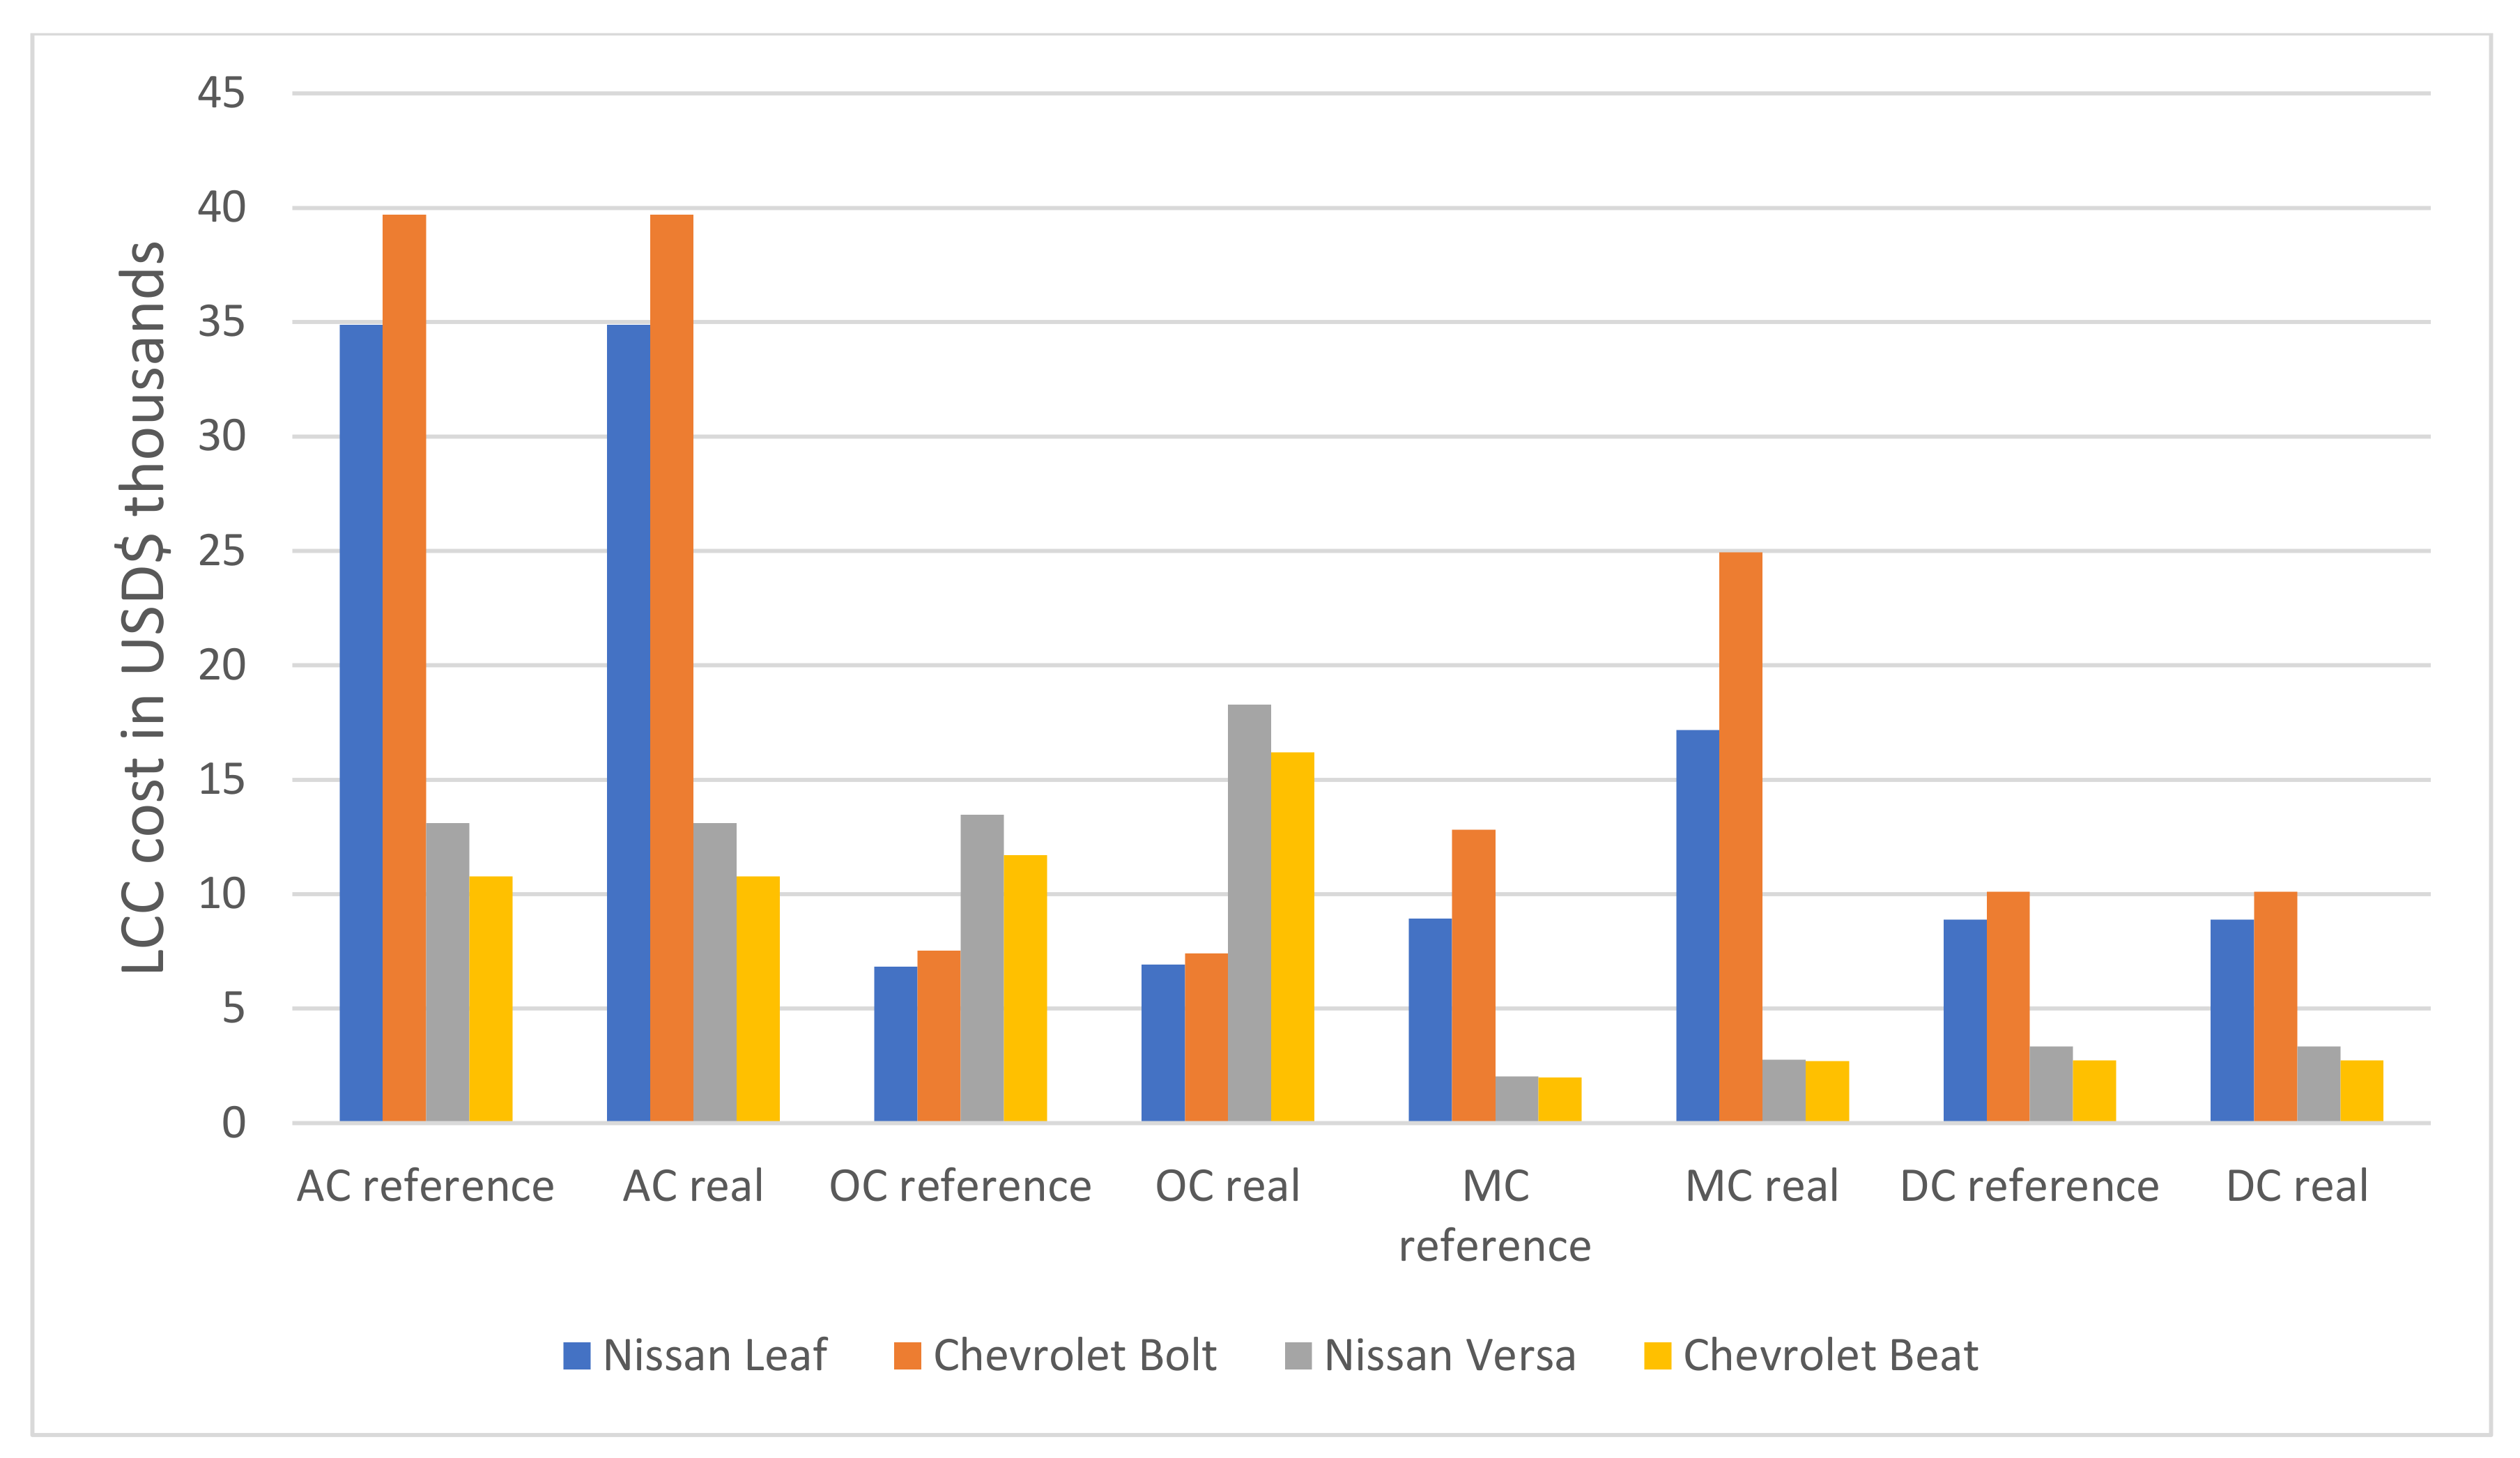
Figure 2). The increased maintenance cost was due to the battery change required after five years of EV usage. Furthermore, the operation cost for ICVs increased to 67.74% and 70.84% for the Nissan Versa and Chevrolet Beat, respectively. The operation costs of ICVs are larger than those of EVs because of the holding taxes and pollutant emissions checks.
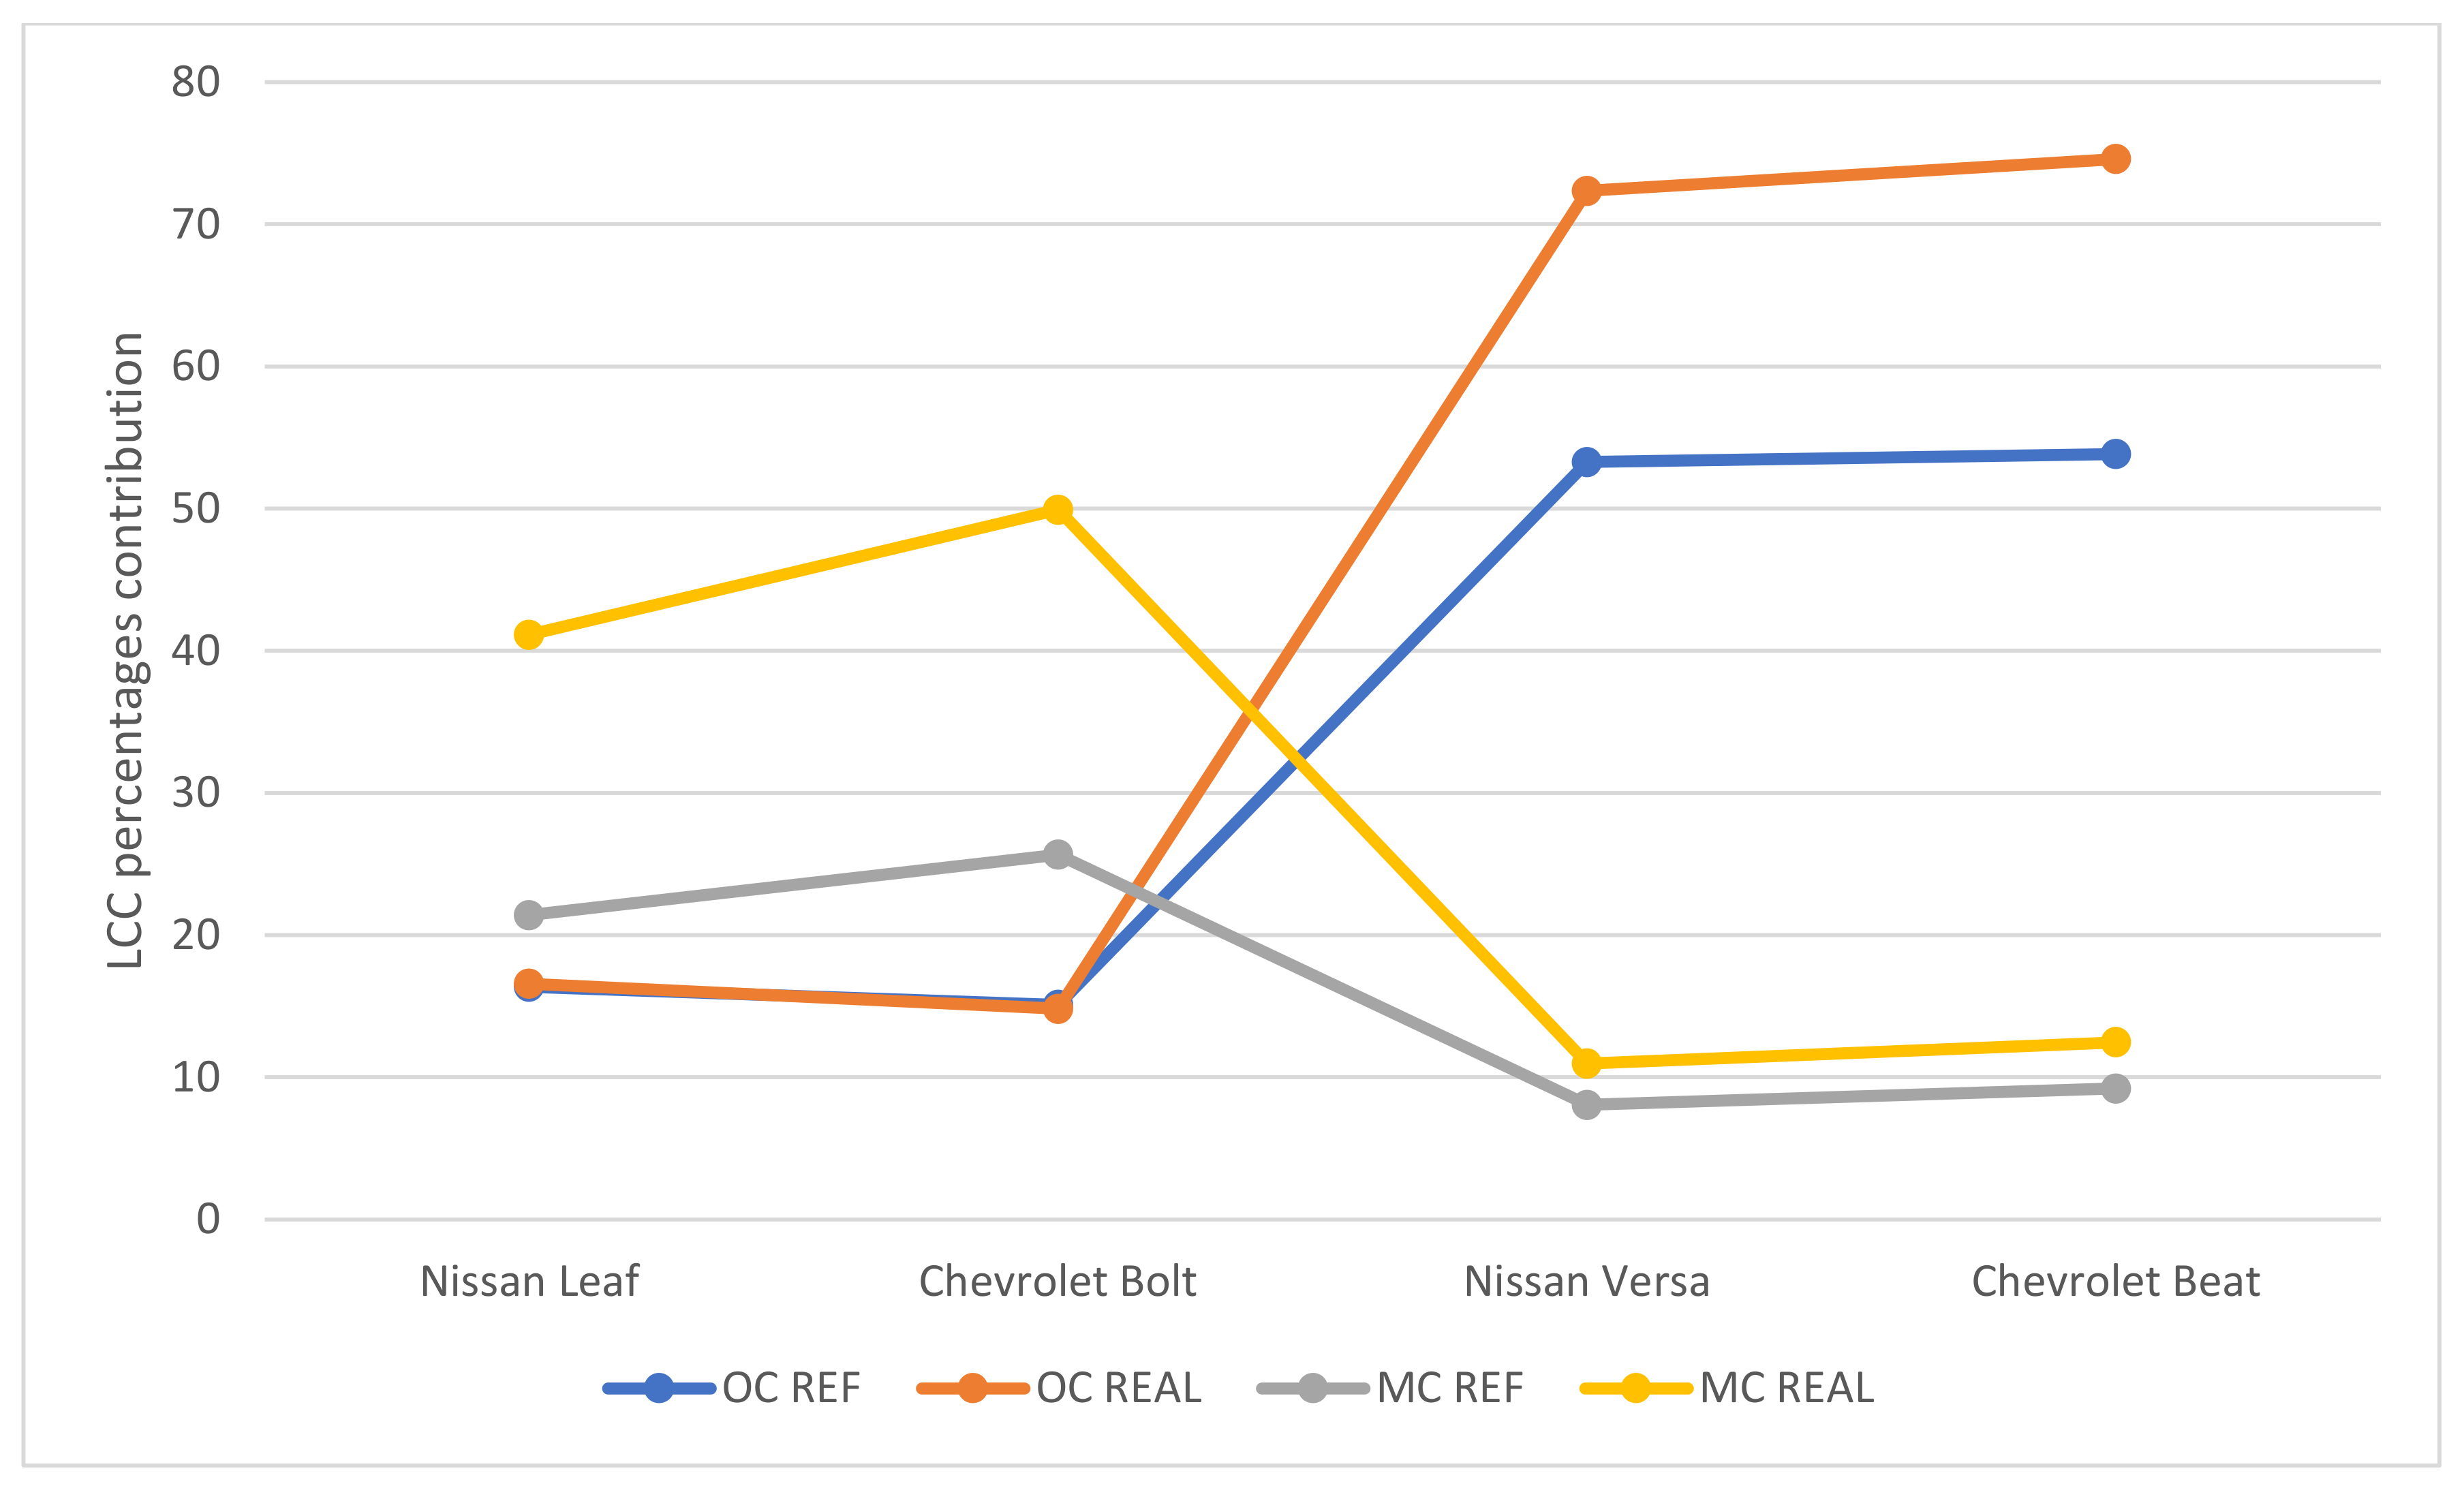
The different contributions of the operation and maintenance costs to the LCC when the real annual average distance travelled was considered versus the annual average distance (set as a reference) are depicted in
Figure 3.
For the scrap/depreciation cost, the cost of sale was considered after the depreciation of the vehicle, which represented a larger percentage for EVs than for ICVs.
In some areas, the LCC of EVs can be lower than ICVs, whereas in others, it can be higher. This difference is because of the variation of factors in each country: for example, taxes, fees, fuel prices, and electrical energy cost.
4.2. Sensitivity Analysis
A sensitivity analysis was performed to determine the effects of different factors that may affect the LCC, such as the acquisition, electricity, and fuel costs and the price of the battery. The real distance traveled was set as 31,066 km for the analysis.
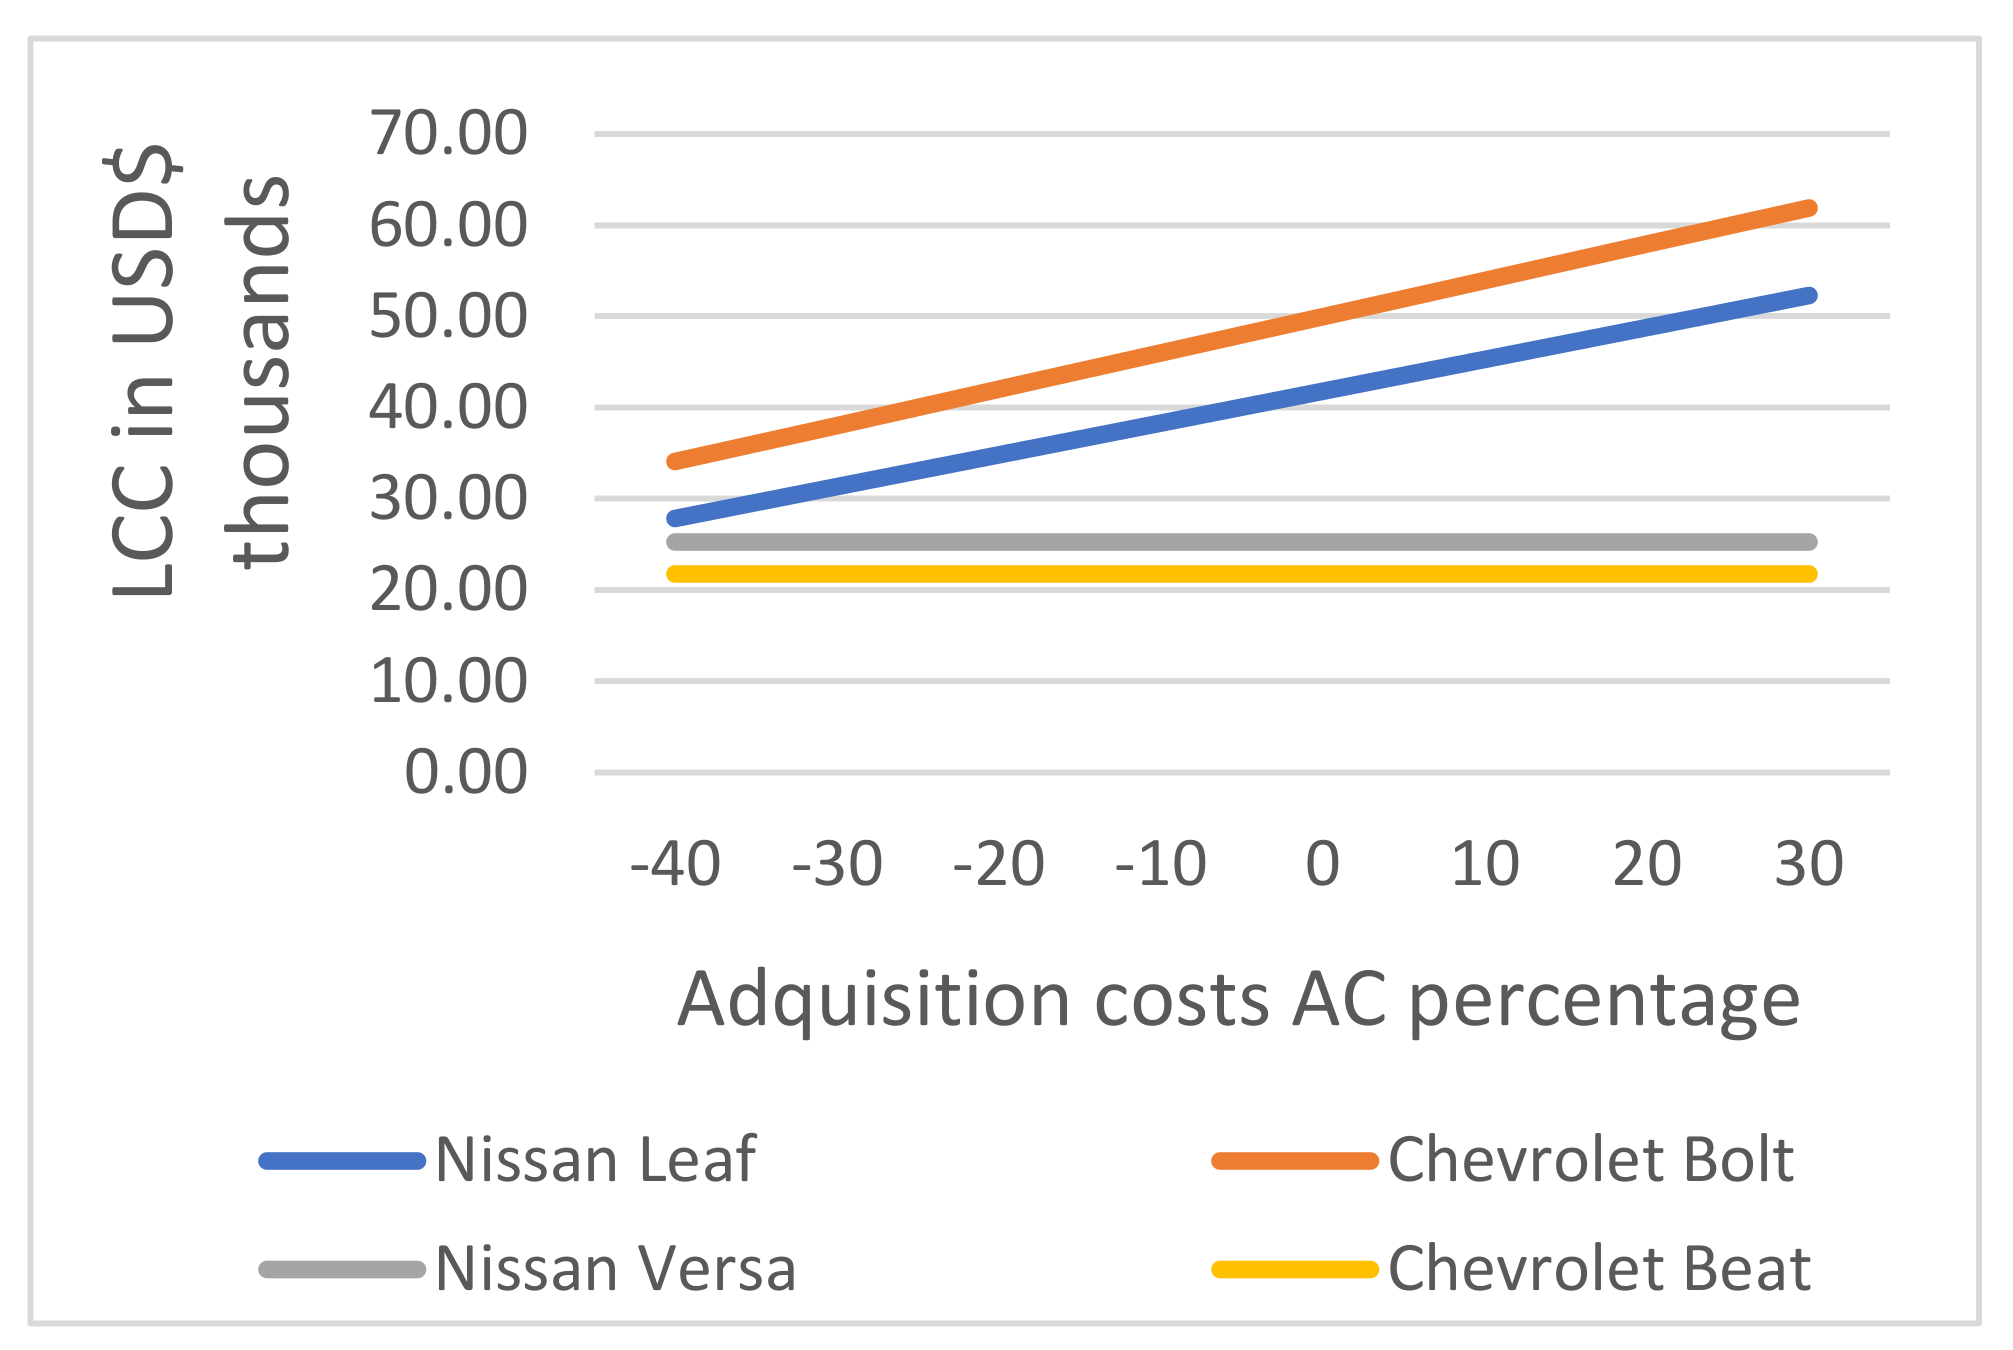
In order to make EVs more competitive in a market that has been ruled by ICVs, an acquisition cost percentage decrease of approximately 40% is required. This would increase the expansion of EVs in Mexico’s market (see
Figure 4). Furthermore, it is necessary to reduce the acquisition cost, which could be achieved through two scenarios: an increase in production and a decrease in the cost of components used in the final product or a government subsidy. This would give EVs a greater level of acceptance in the market [
21,
22]. Subsidies, including taxes of between 11% and 25% applied to an automotive credit [
54], would increase the LCC.
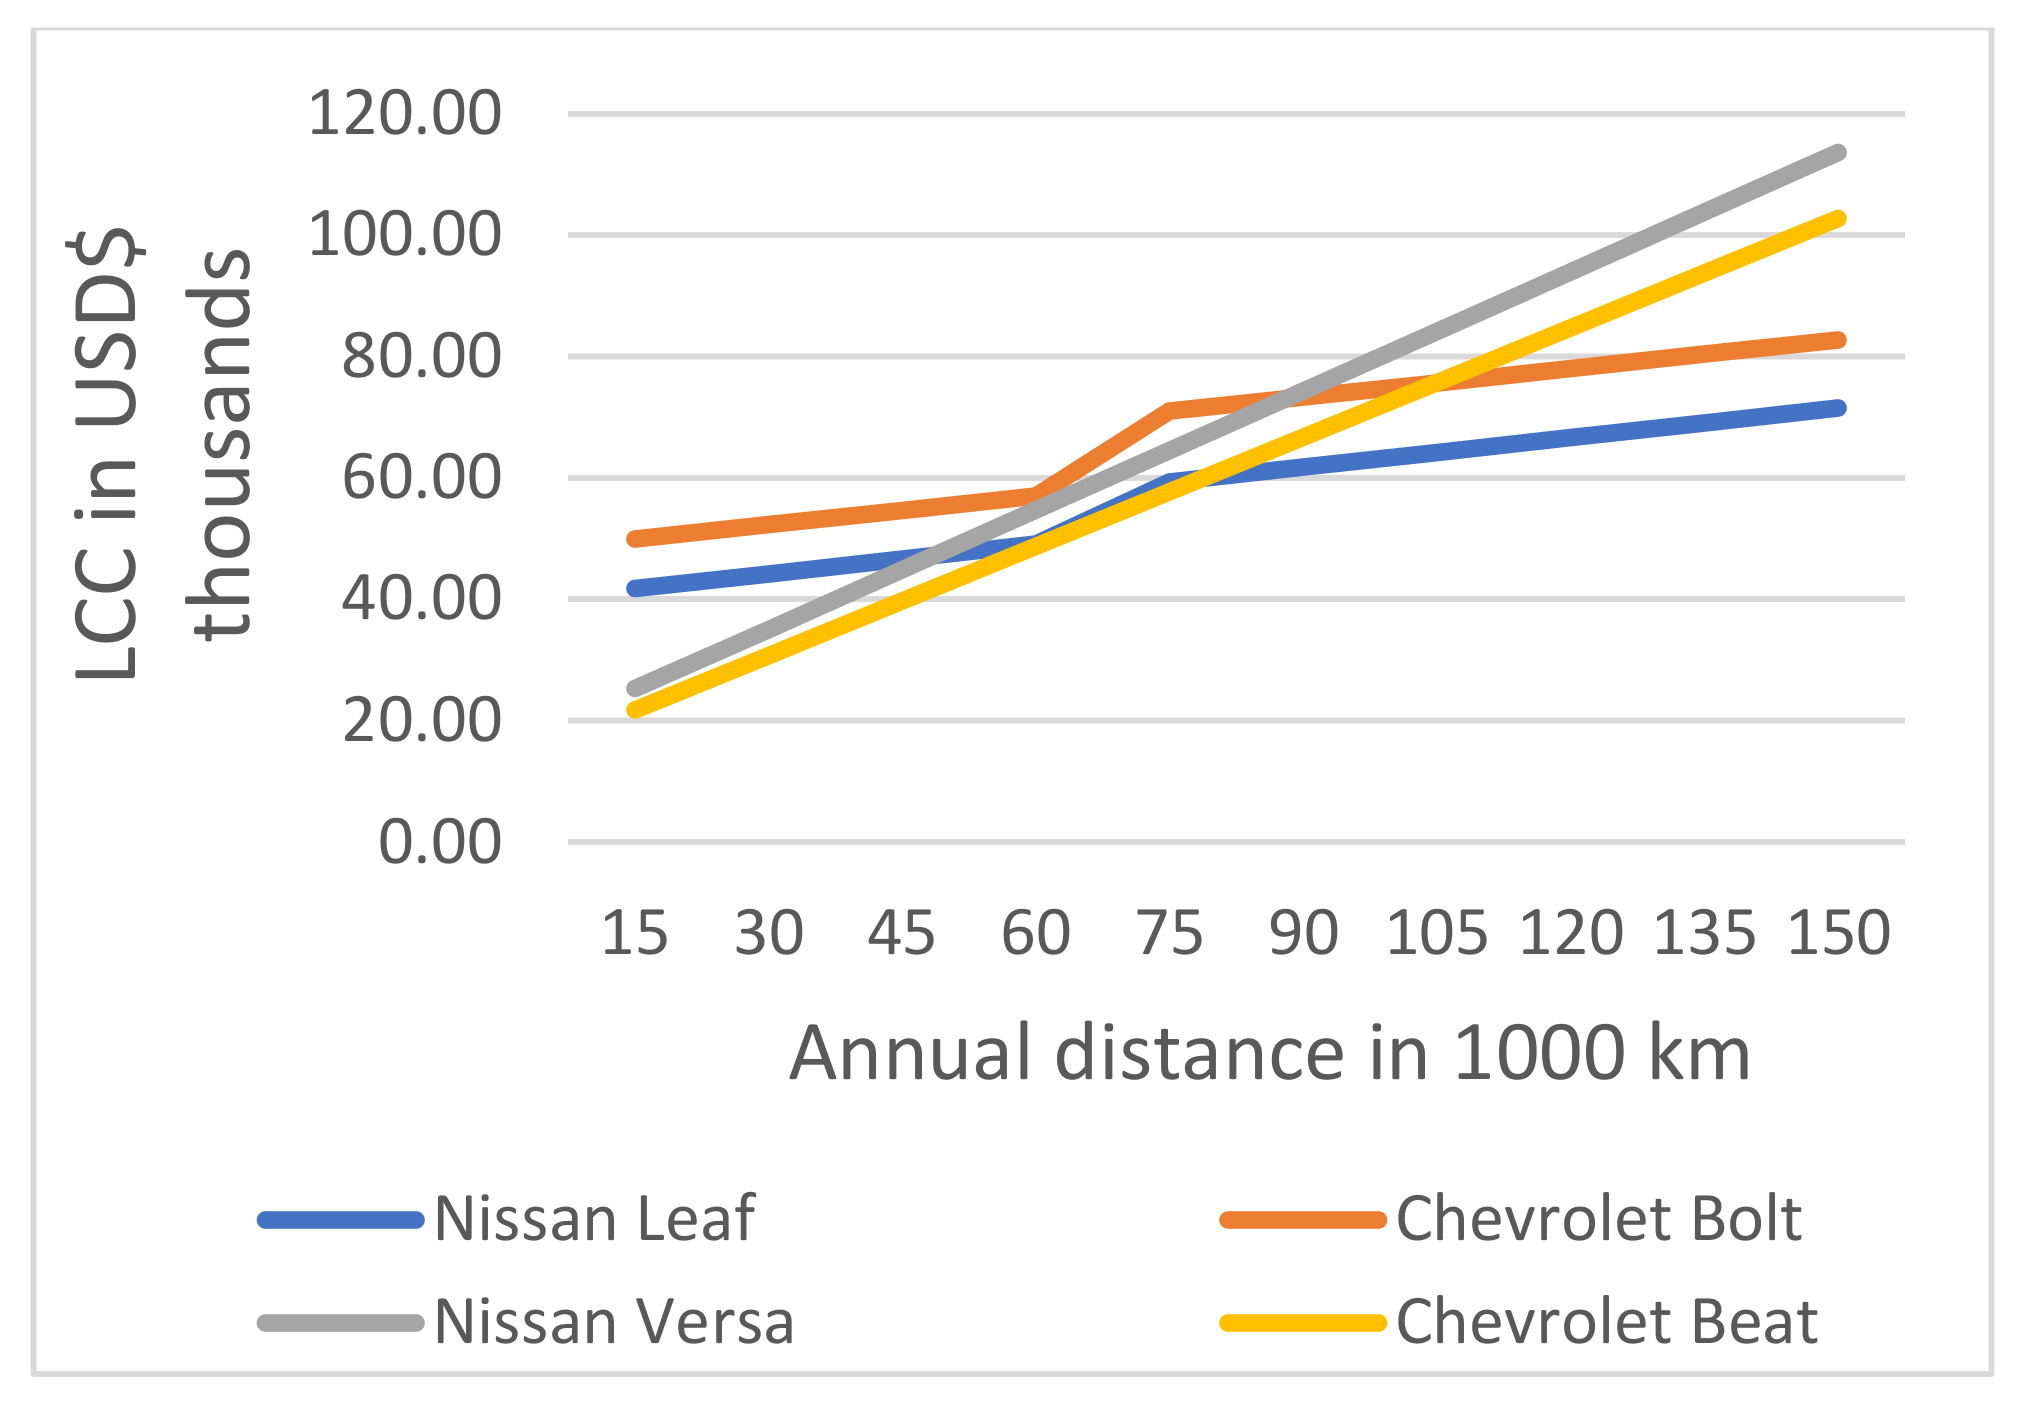
As can be seen from
Figure 5, the larger the annual distance traveled, the larger the LCC, especially for ICVs. This can be observed in the curves, where the slopes are more pronounced for the Nissan Versa and Chevrolet Beat compared with those for the EVs. These curve shapes result from the fact that most of the LCC of ICVs is attributed to the operating costs, which increase by approximately 4–5% if 15,000 km is covered every year. The battery change cost was considered to decrease as the annual distance increases; this can be seen in the change of the slopes in
Figure 5.
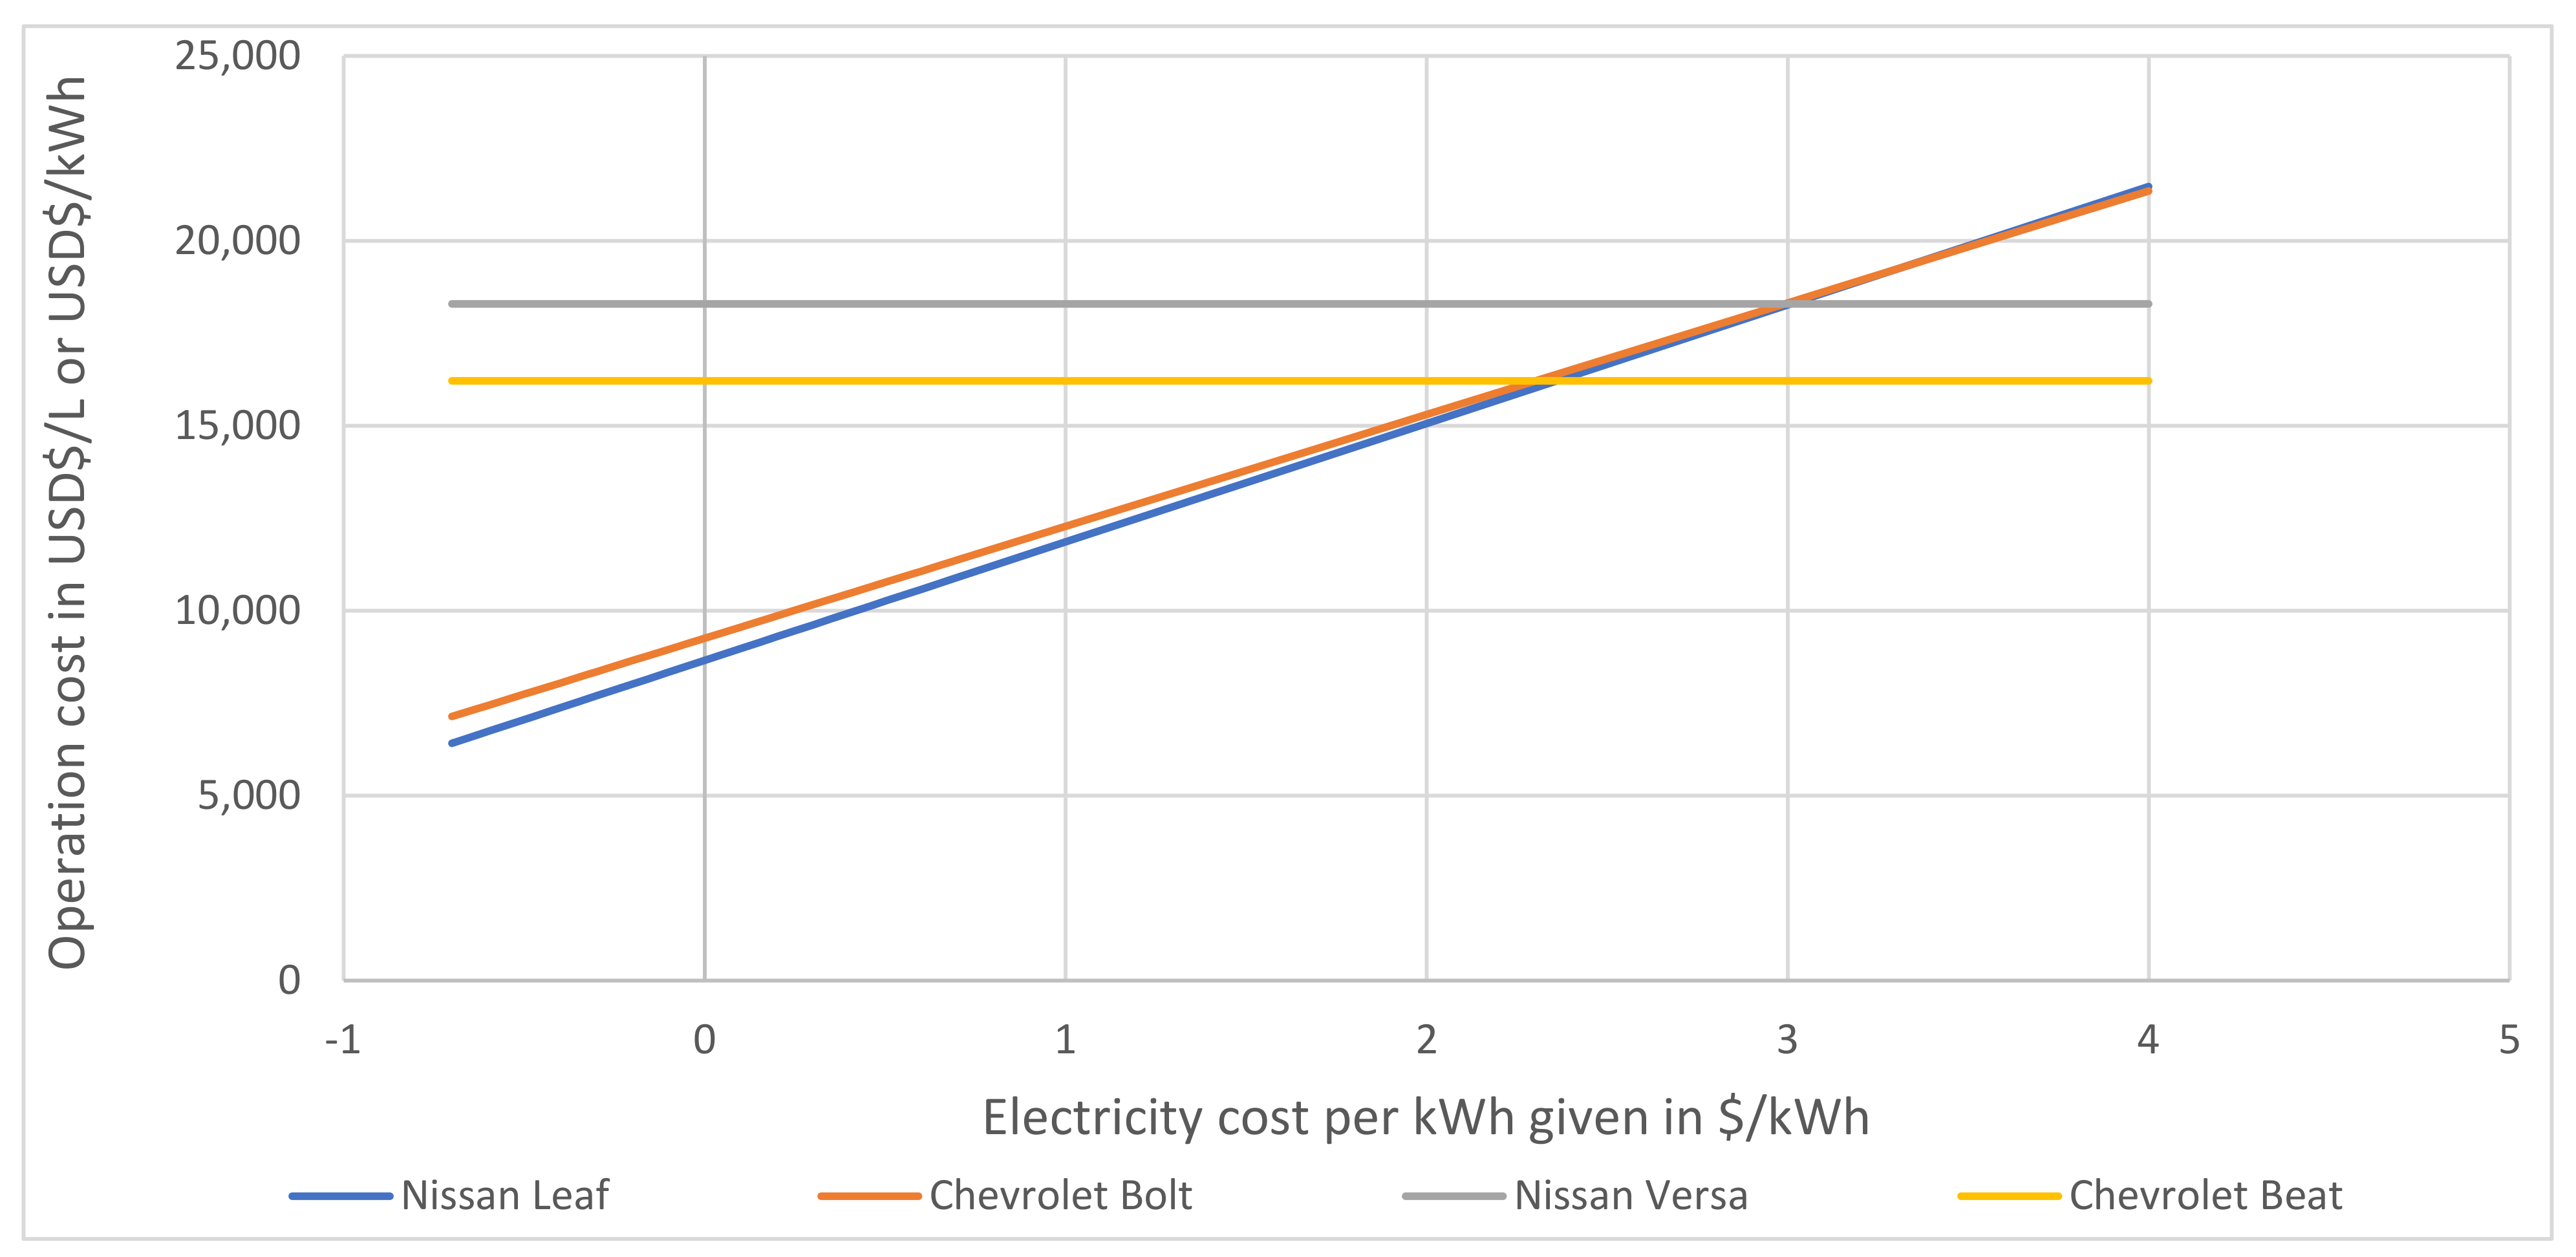
Additionally, the price of electricity in kWh would have to increase by 3 units. Therefore, the operating costs of EVs would be larger than those of ICVs (see
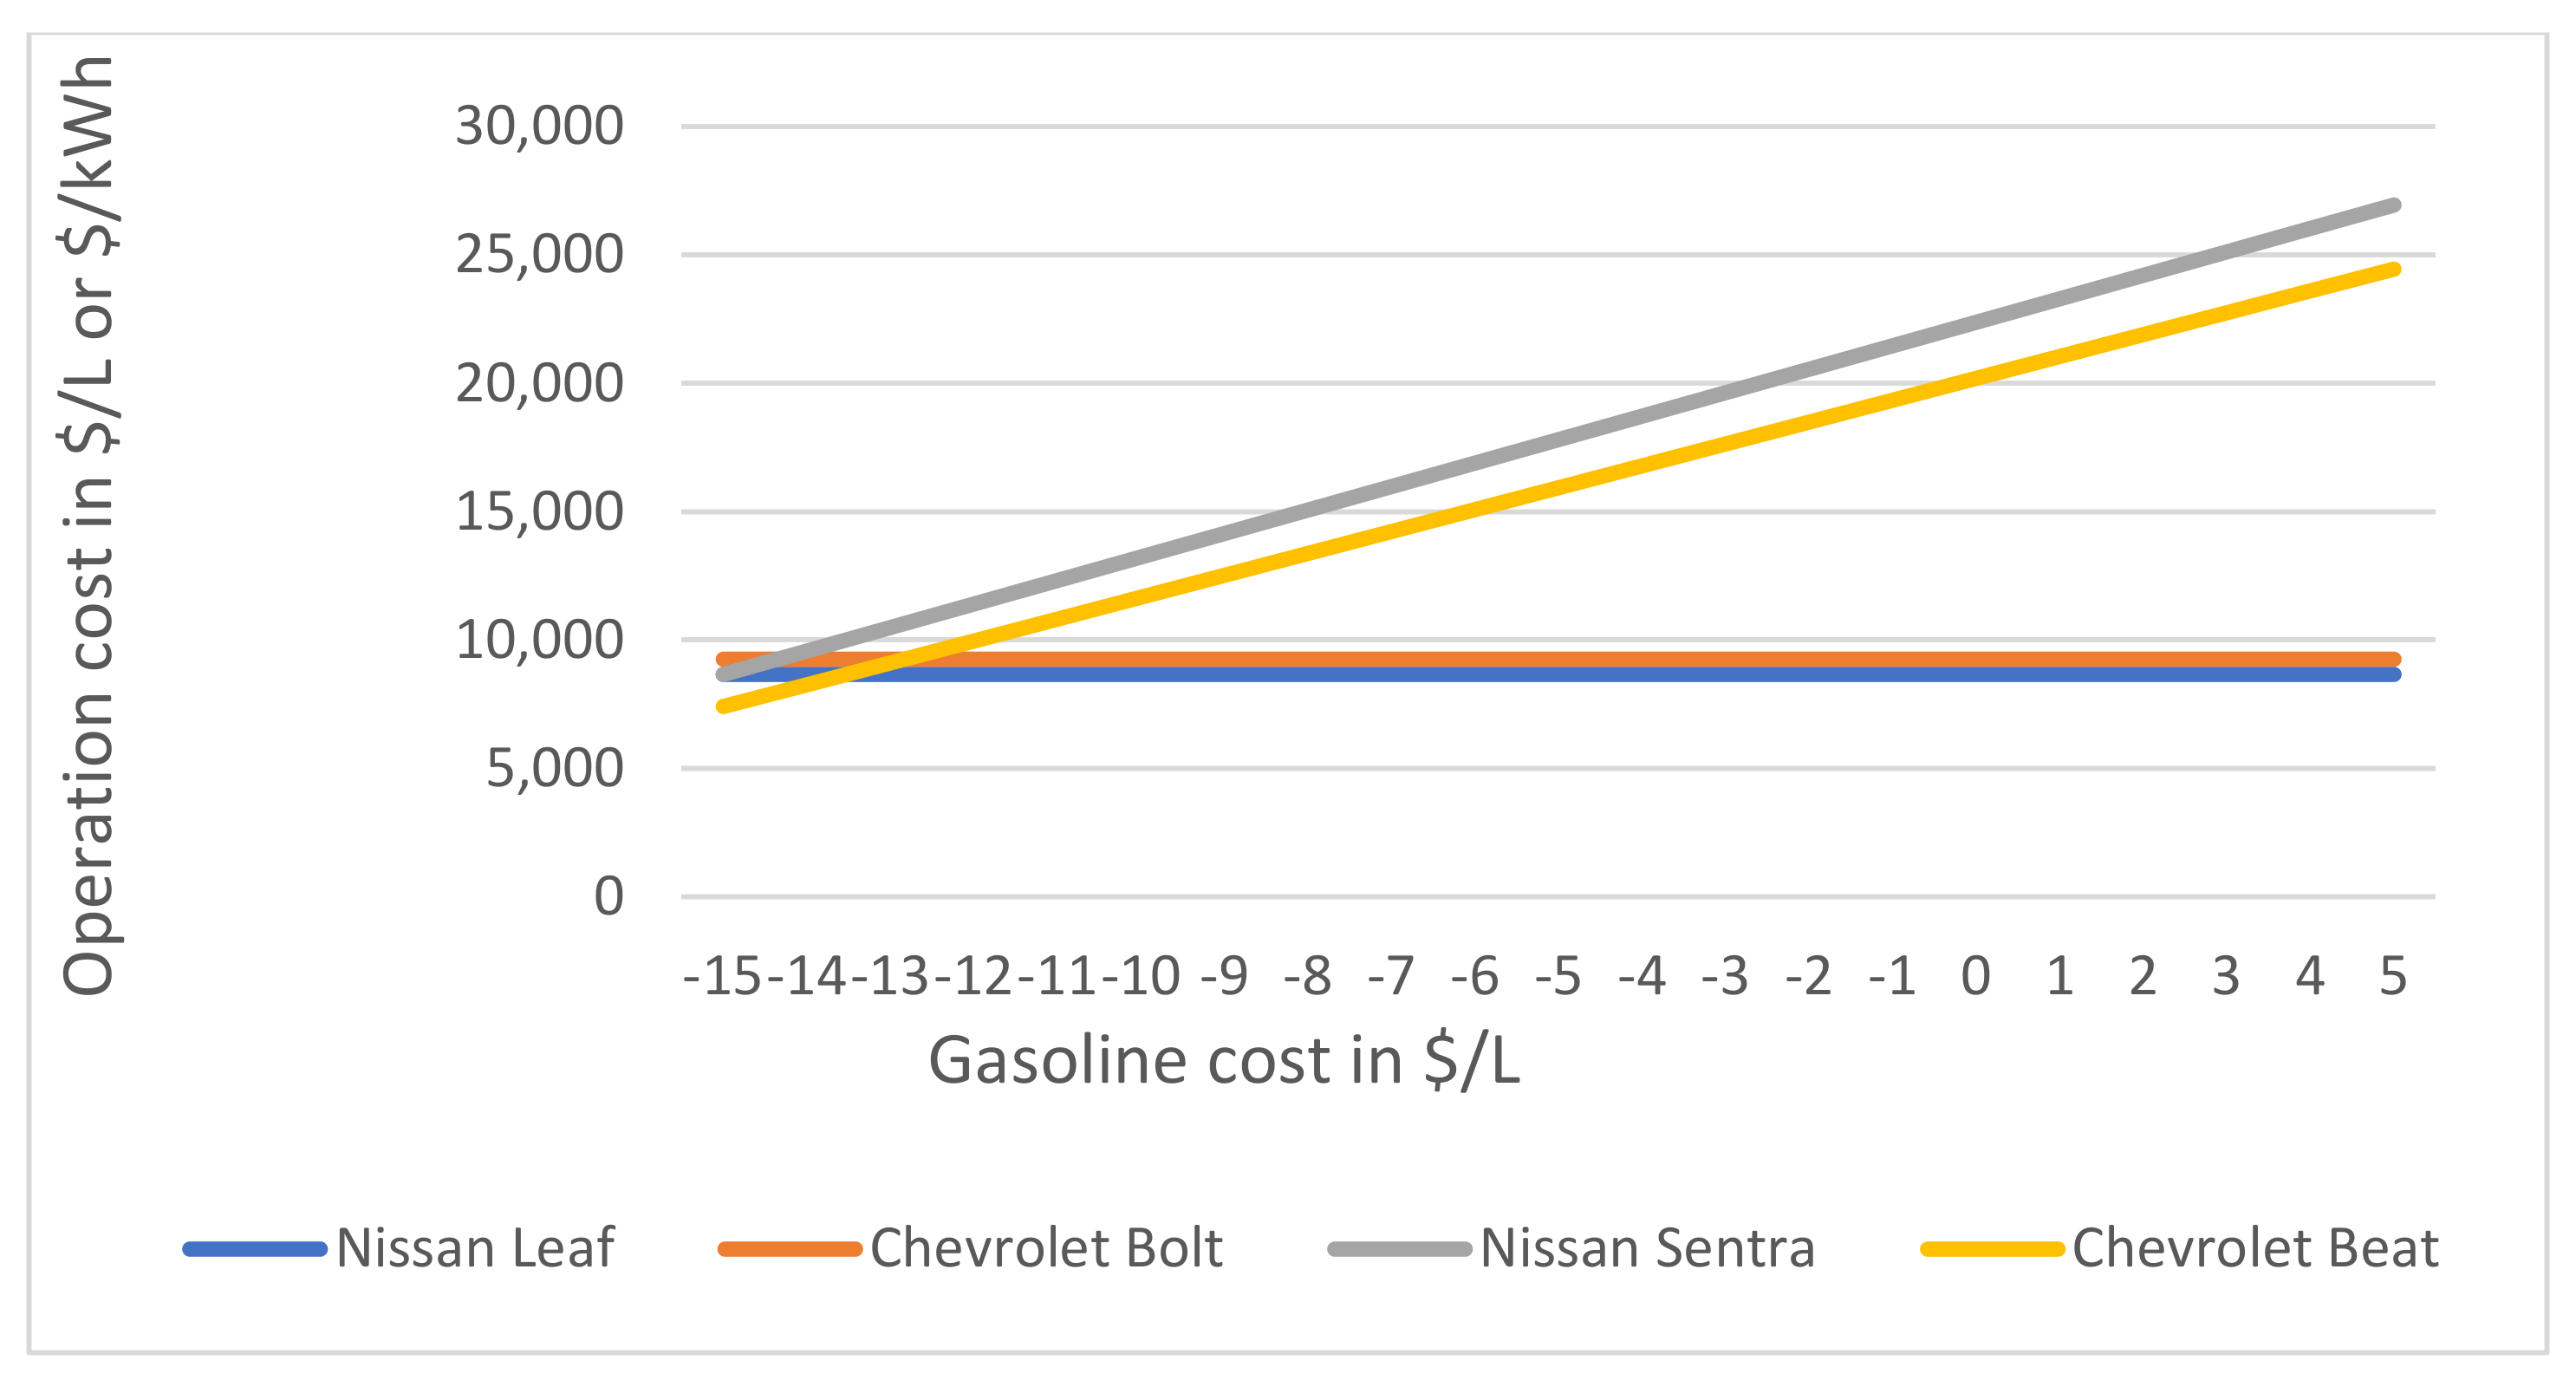
Figure 6). Similarly, in terms of fixing the operating costs of electric vehicles and changing the price of fuel for ICVs, it would be necessary to reduce the cost of fuel by at least 15 units. Thus, the operating costs would be similar to that of EVs (see
Figure 7). It is worth mentioning that the operating costs of ICVs are greater, because of fees and taxes that are mandatory for their circulation. In addition, an increase in the cost of fuel by at least USD 20 per liter is necessary. Therefore, the LCC of EVs would be similar to that of ICVs.
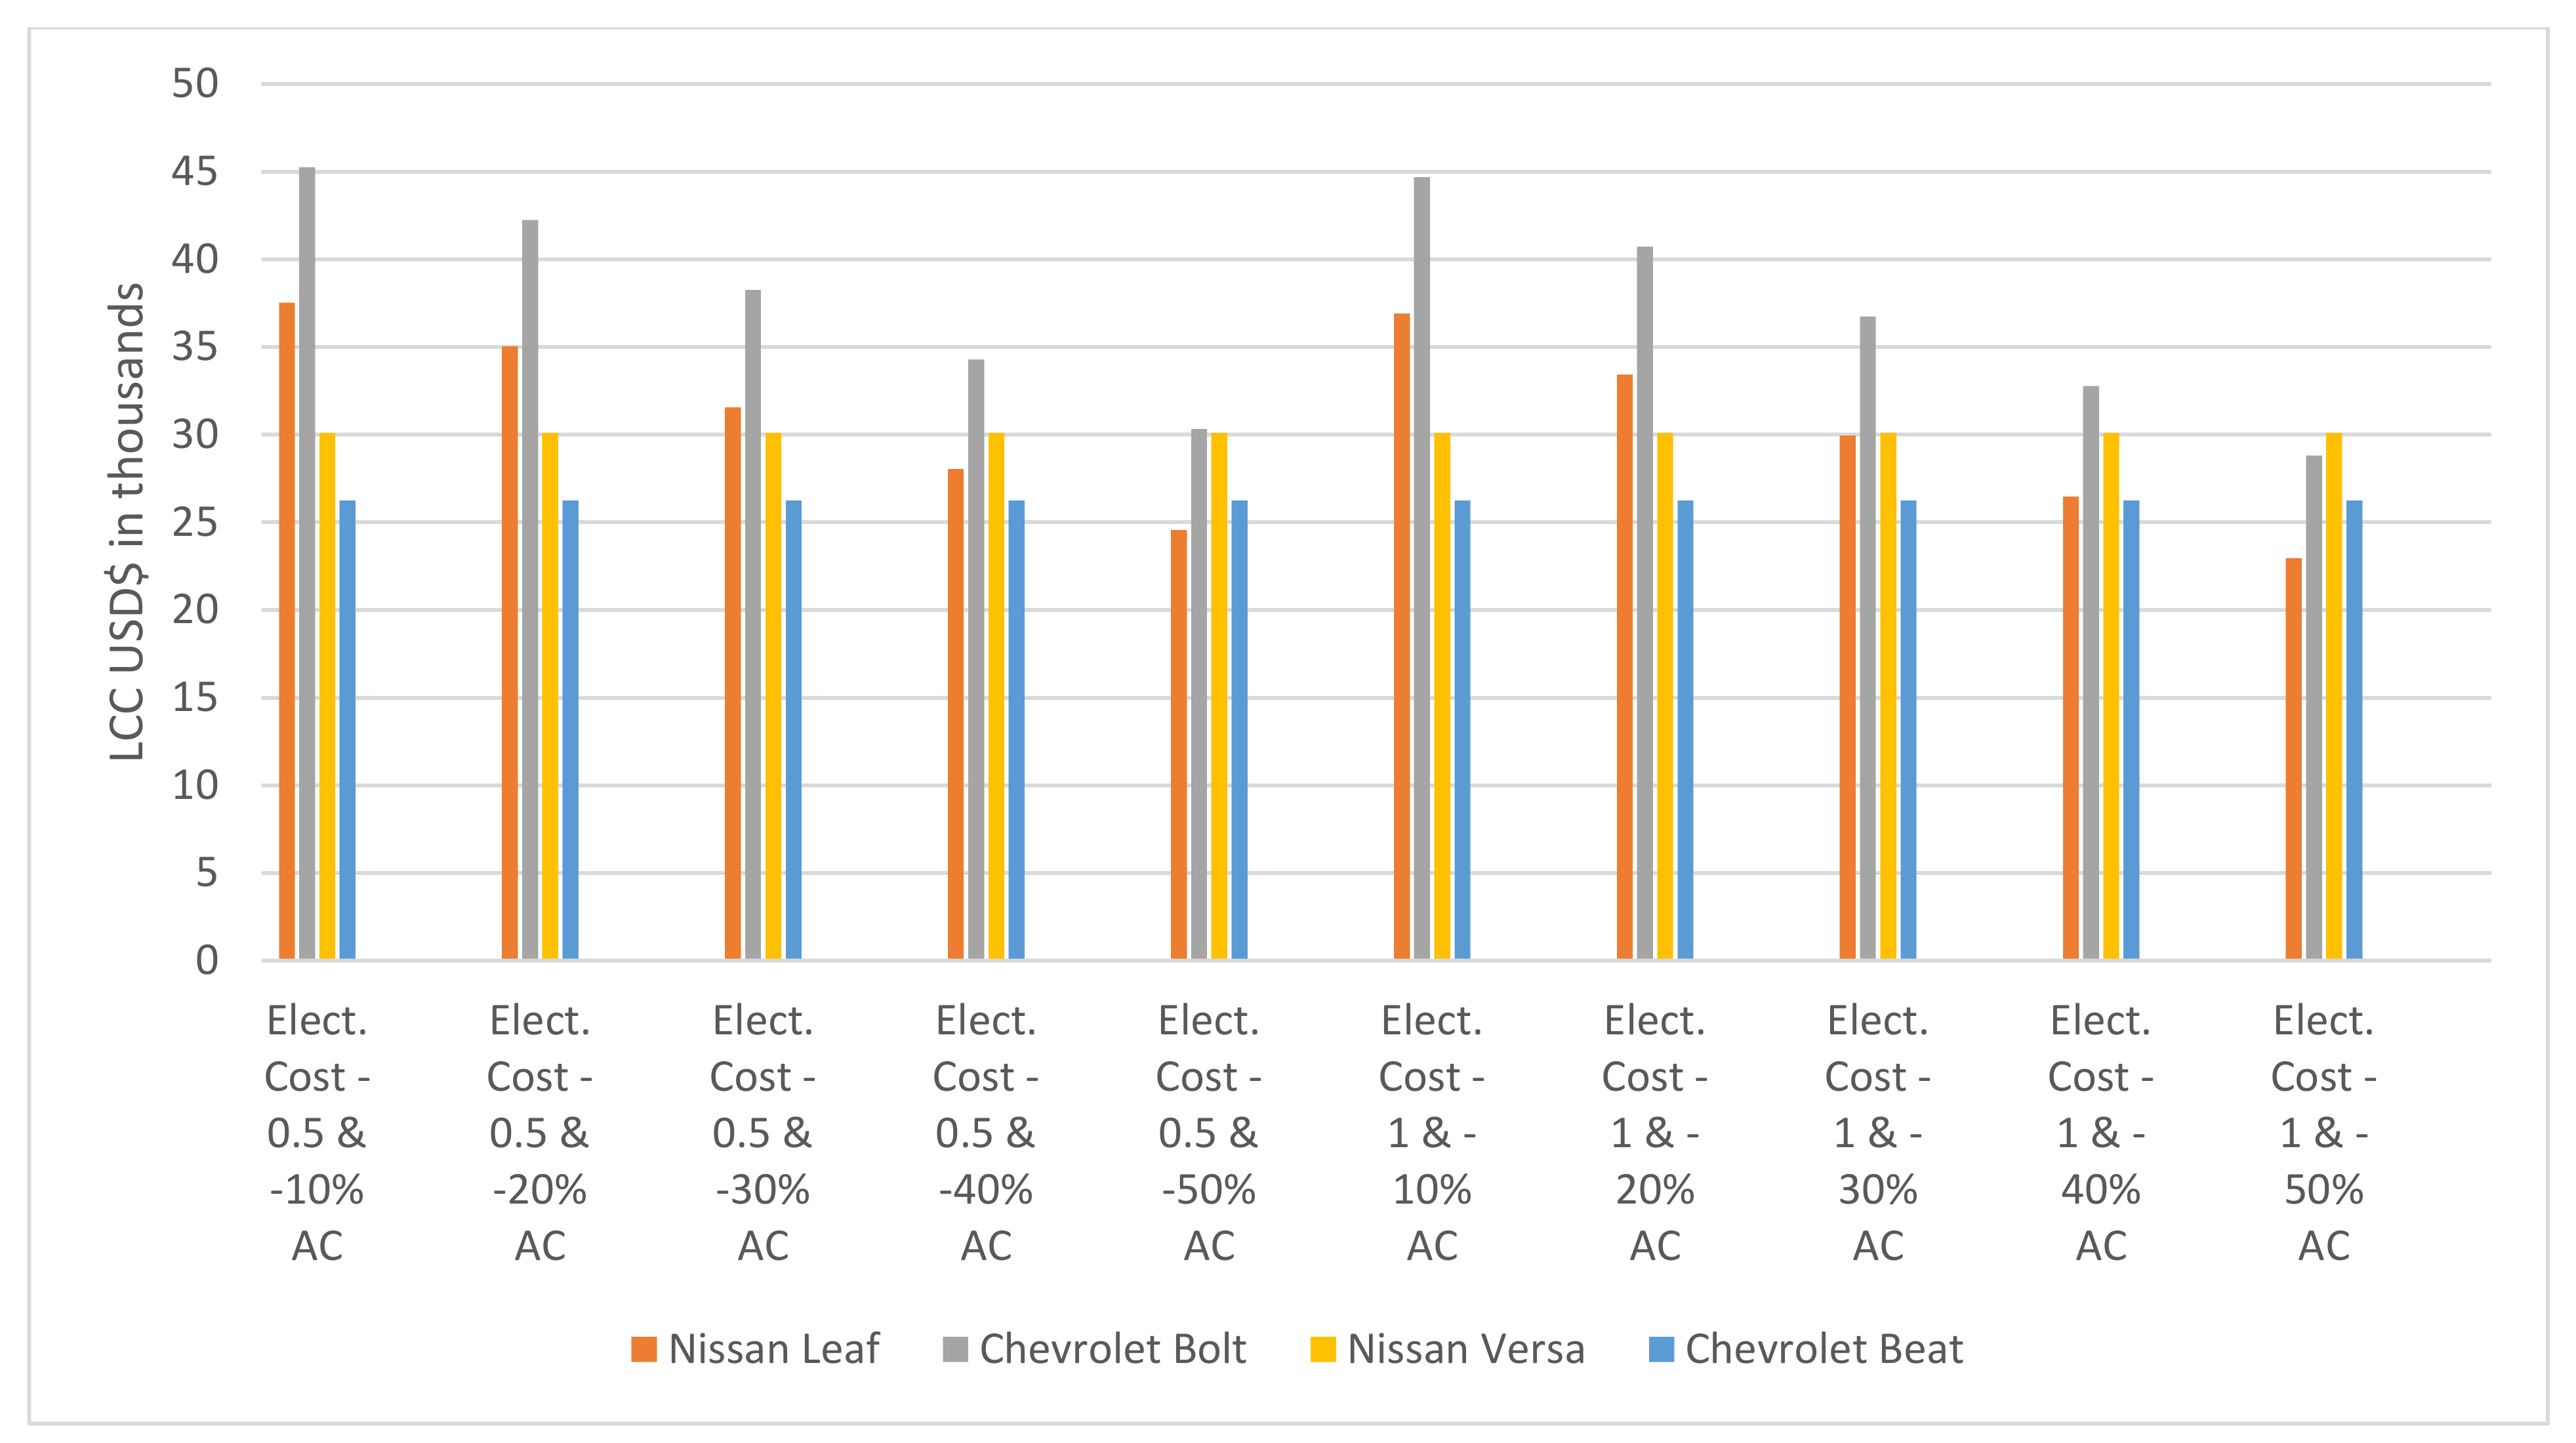
In order to improve the feasibility of EVs being sold on the market, a different outlook was used. Namely, the ICV fuel cost was fixed at USD 0.96/liter and the acquisition cost was fixed at USD 30,104 and USD 26,246 for the Nissan Versa and Chevrolet Beat, respectively. A reduction in the electricity cost of USD 1/kWh and a decrease in the EV acquisition cost of around 40% are required (see
Figure 7). The LCC of the Nissan Leaf was USD 26,456, which was USD 3648 lower than the Nissan Versa and USD 209.72 greater than the Chevrolet Beat (see
Figure 8). Additionally, the LCC of Chevrolet Bolt was USD 32,775, which is USD 2671 and USD 6529 greater than the Nissan Versa and Chevrolet Beat, respectively.
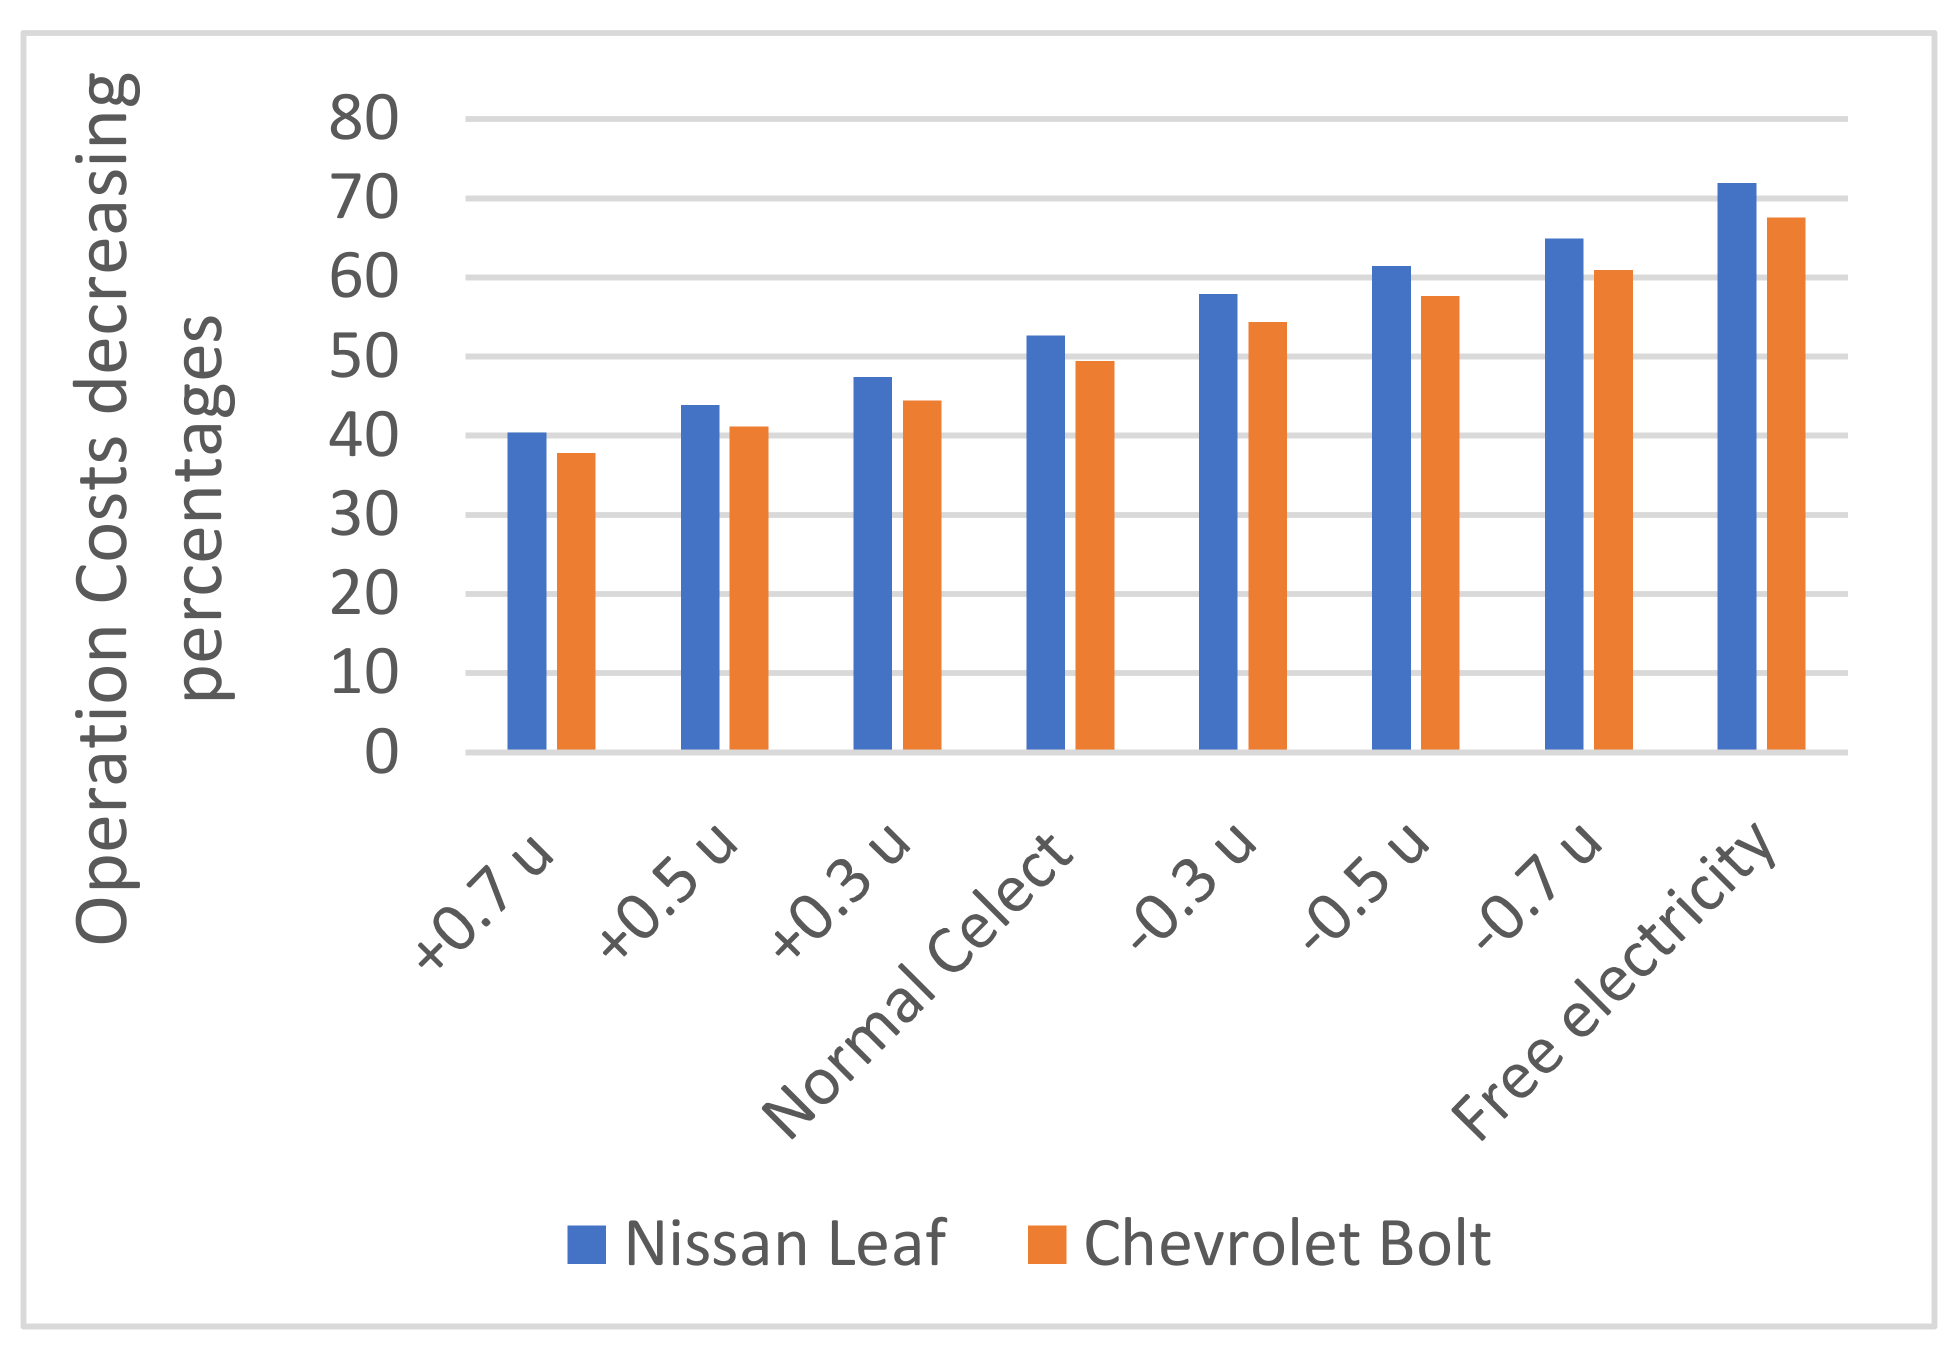
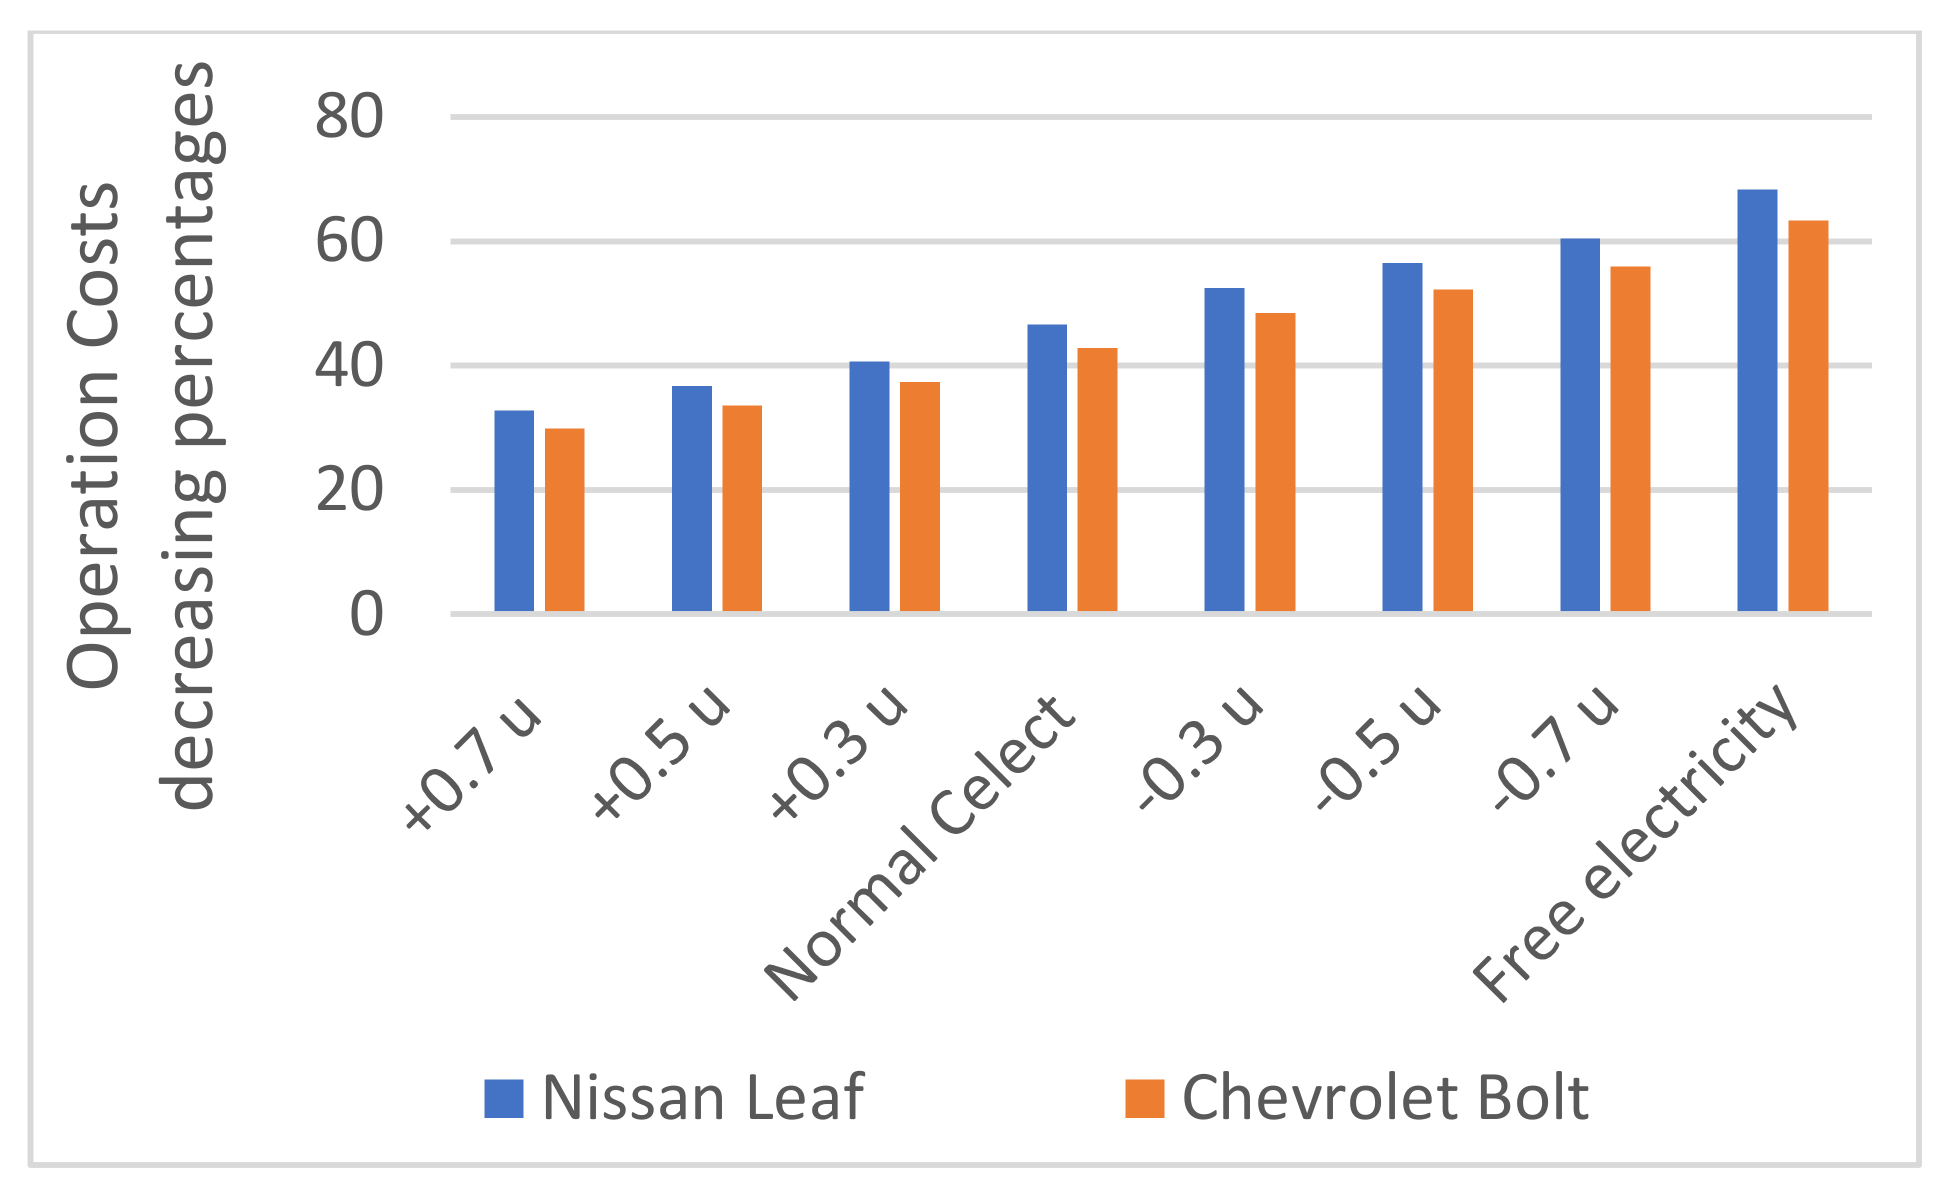
Considering a free electricity scenario, it can be observed in
Figure 9 and
Figure 10 that there would be a noticeable decrease in percentage in terms of the operating costs. Compared with the Nissan Sentra, the decrease in the OC percentage would be around 71% and 67% for the Nissan Leaf and Chevrolet Bolt, respectively. Similarly, for the Chevrolet Beat comparison, the decrease in the OC percentage would be around 68% and 63% for the Nissan Leaf and Chevrolet Bolt, respectively.
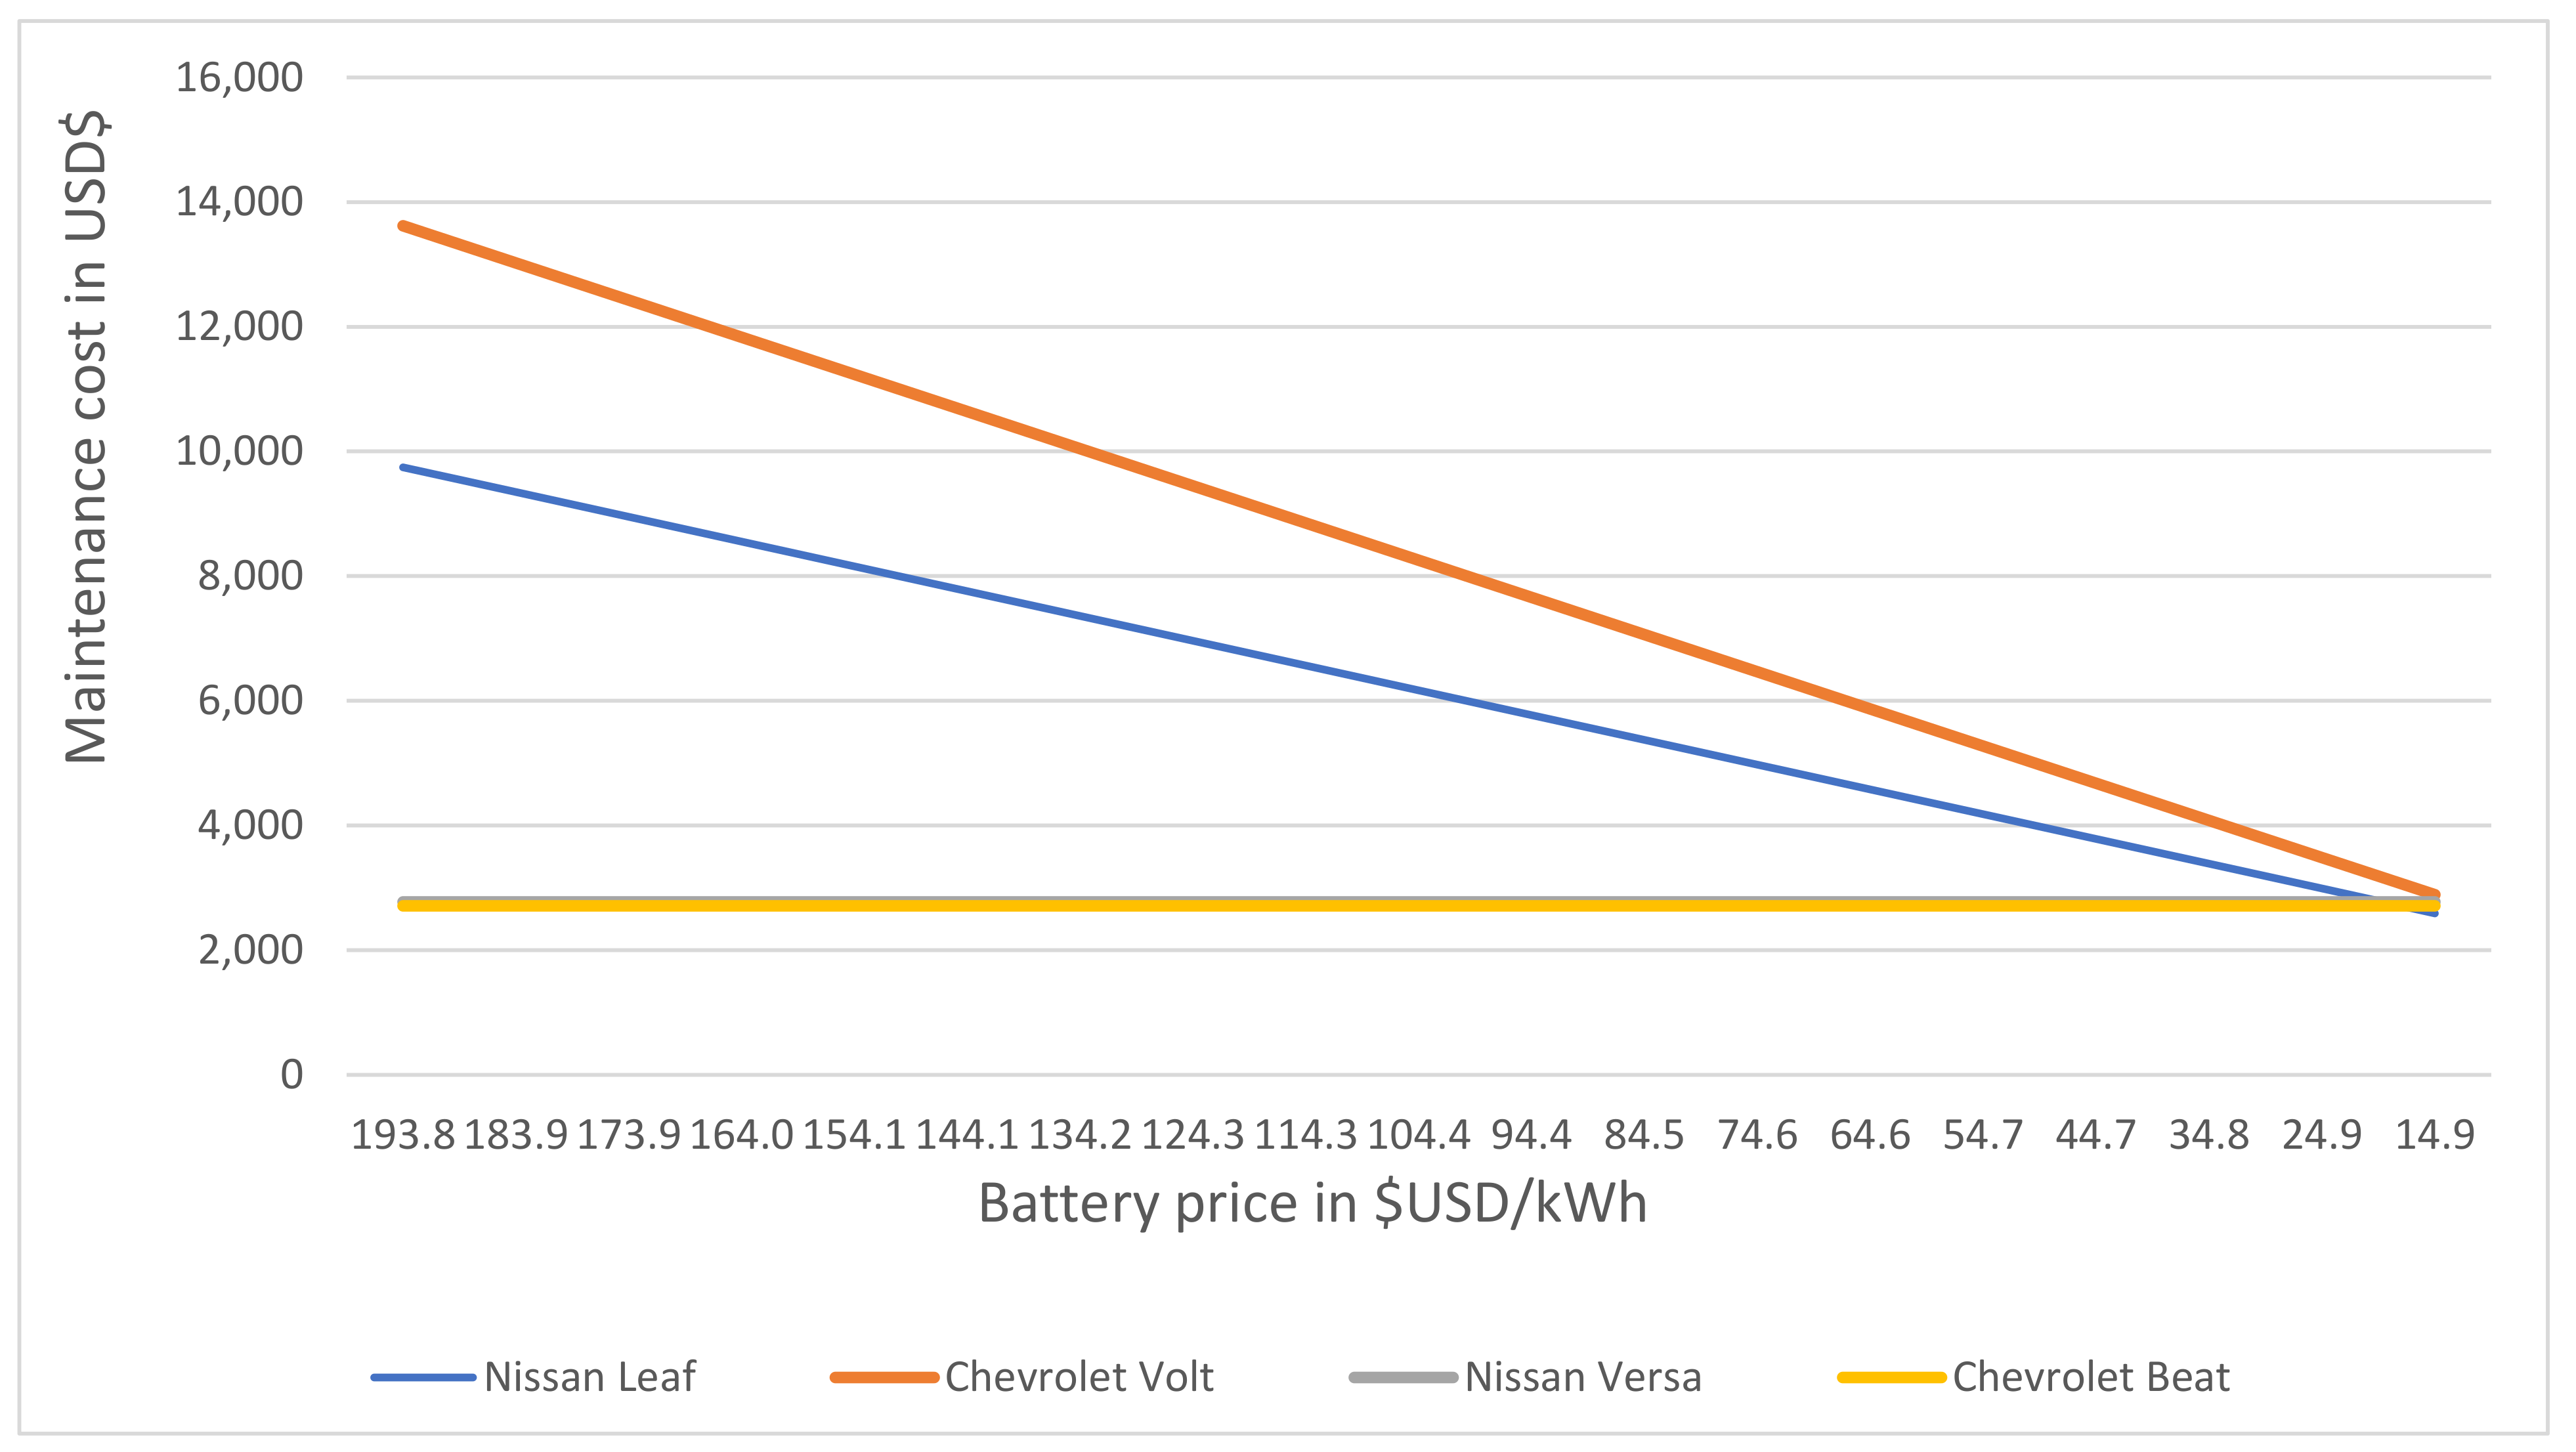
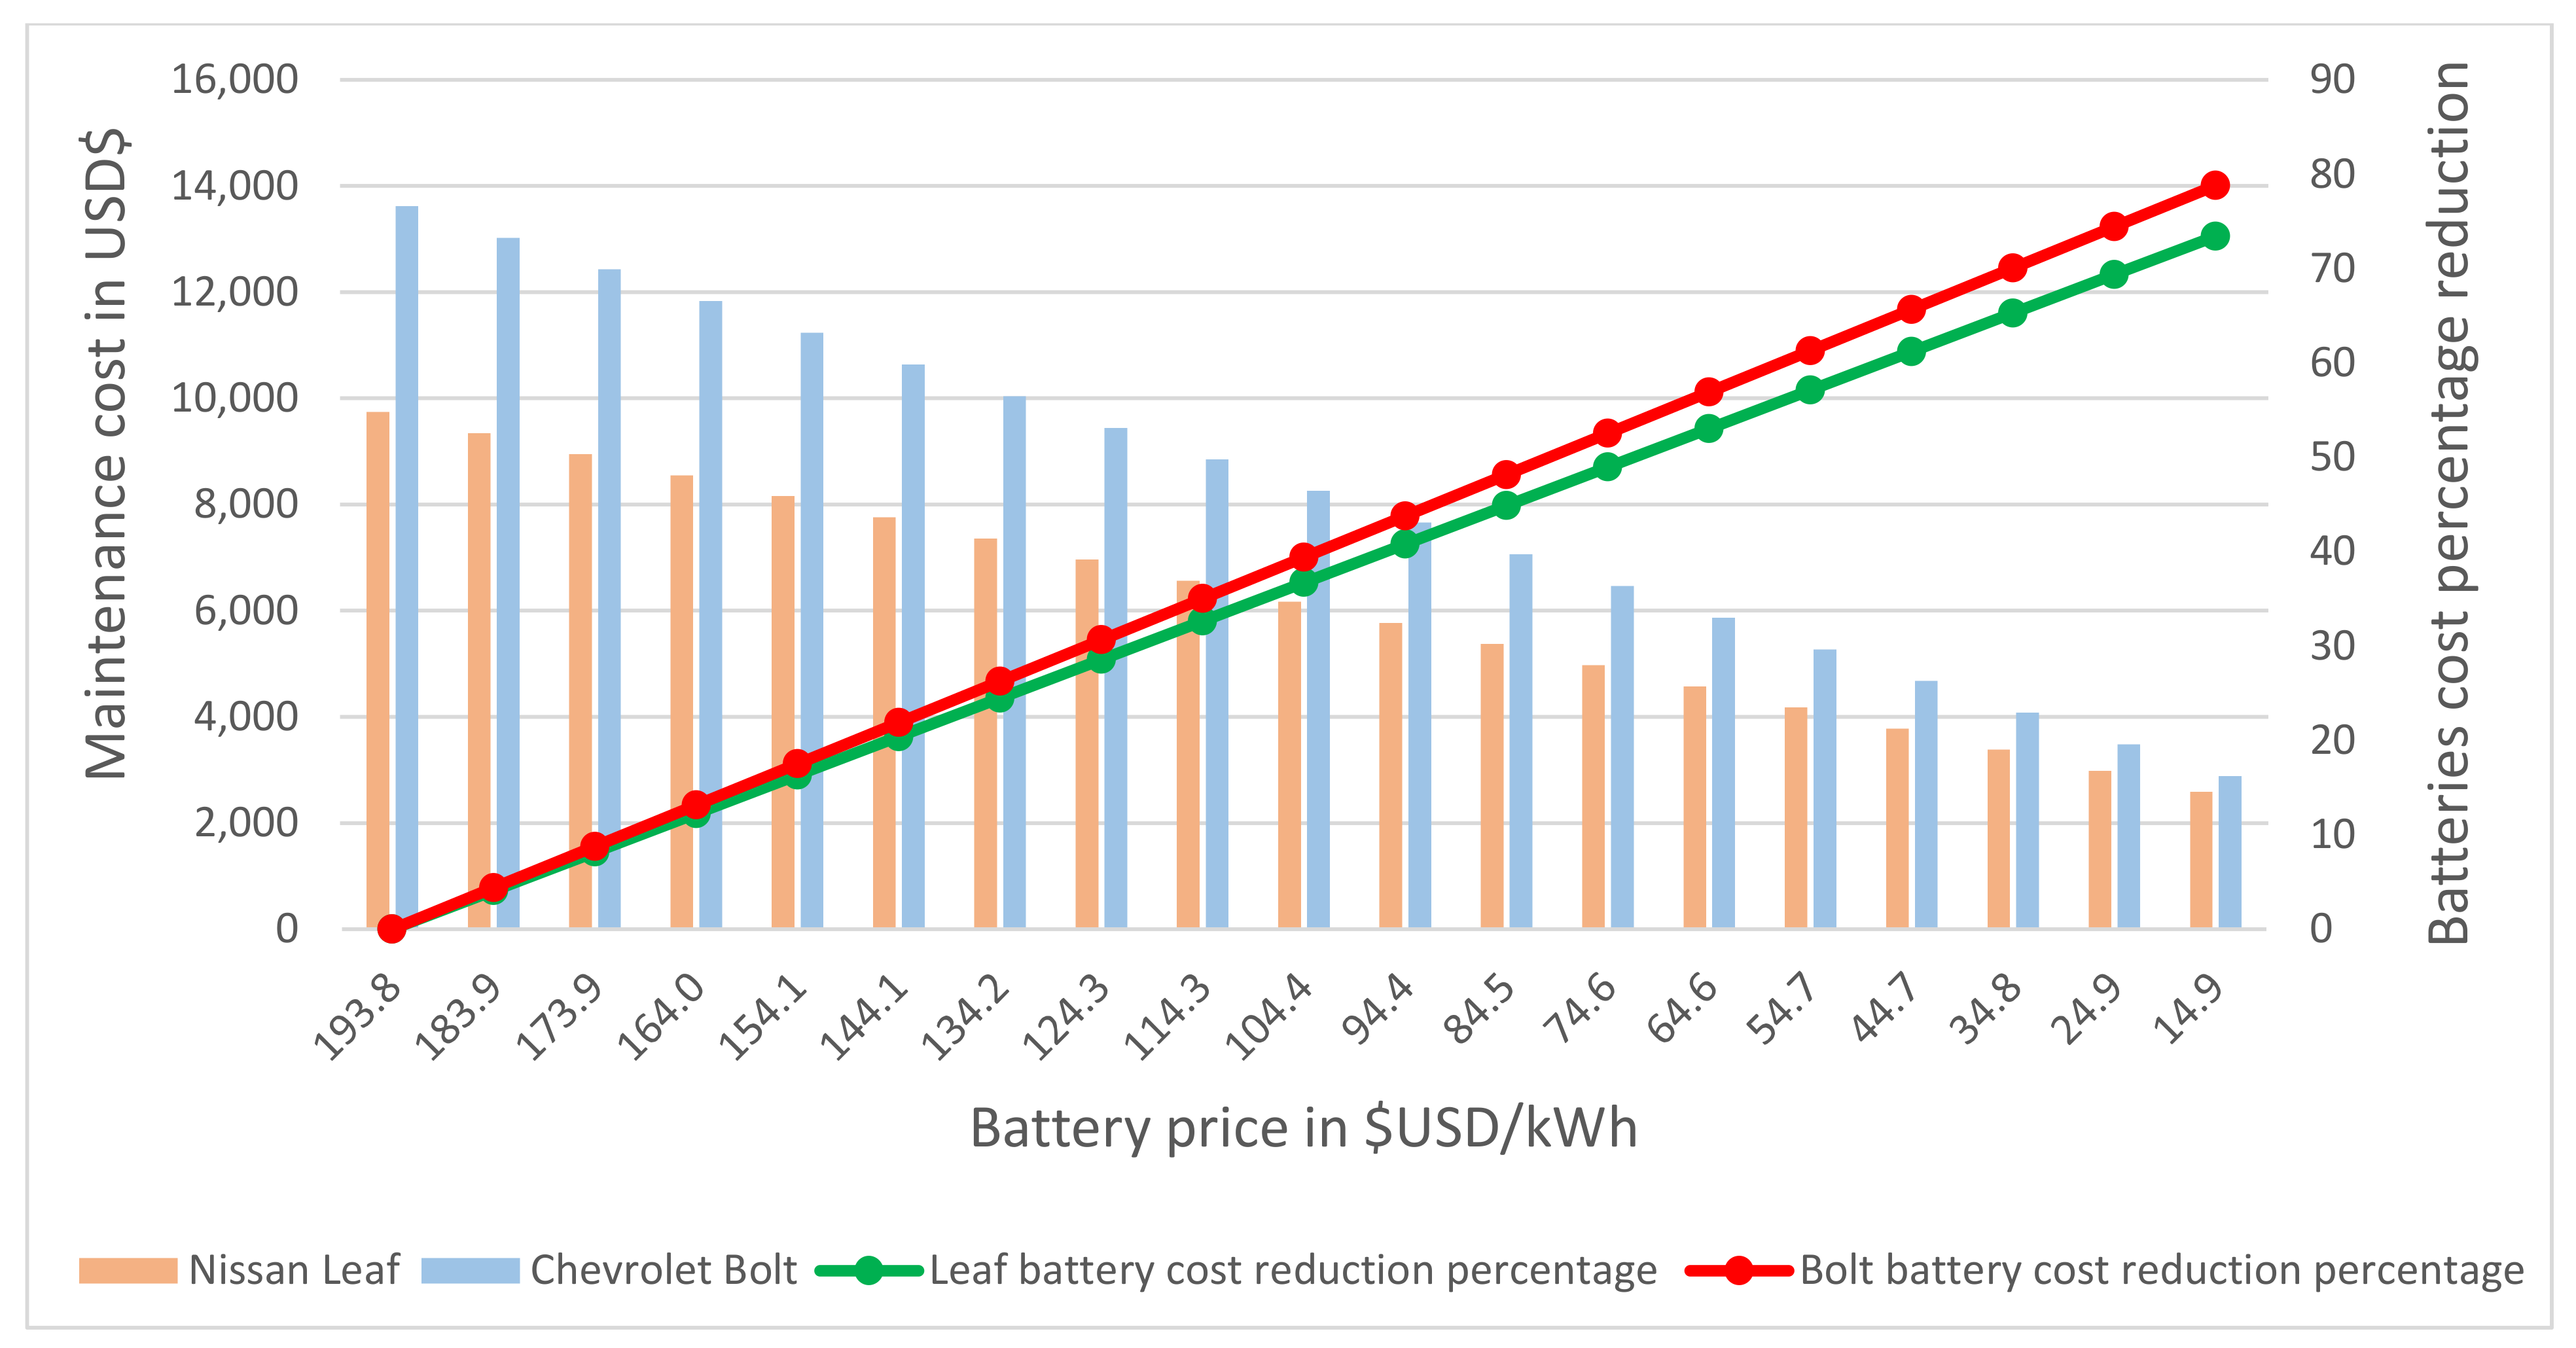
Finally, when assessing the contribution of the maintenance cost to the LCC, the predominant factor was the cost of batteries. The effect of decreasing battery prices was considered, as depicted in
Figure 11. The total maintenance cost was found to decrease gradually as the battery price decreased from its current value of USD 193.83/kWh to USD 14.91/kWh. Therefore, EVs would be competitive with ICVs in terms of the total maintenance cost. Similarly,
Figure 12 shows the effect of the battery cost percentage reduction relevant to the total maintenance cost. Battery price percentage reductions of 73.44% and 78.81% were found to be required (which represents a battery price of USD 14.91/kWh) for the Nissan Leaf and Chevrolet Bolt, respectively. Thus, EVs would be similar to ICVs in terms of the total maintenance cost. The battery cost is expected to reduce by 7–9%, which would significantly reduce the acquisition cost of electric cars [
40].
However, a battery price percentage reduction of between 73% and 78% seems unrealistic. To balance the LCC of EVs with ICVs, a combination of different parameters and factors that affect the LCC, such as acquisition and operation costs and battery prices, needs to be considered.
4.3. Environmental Impact Analysis
Equations (11)–(17) were used to calculate the pollutant emissions in terms of GHG.
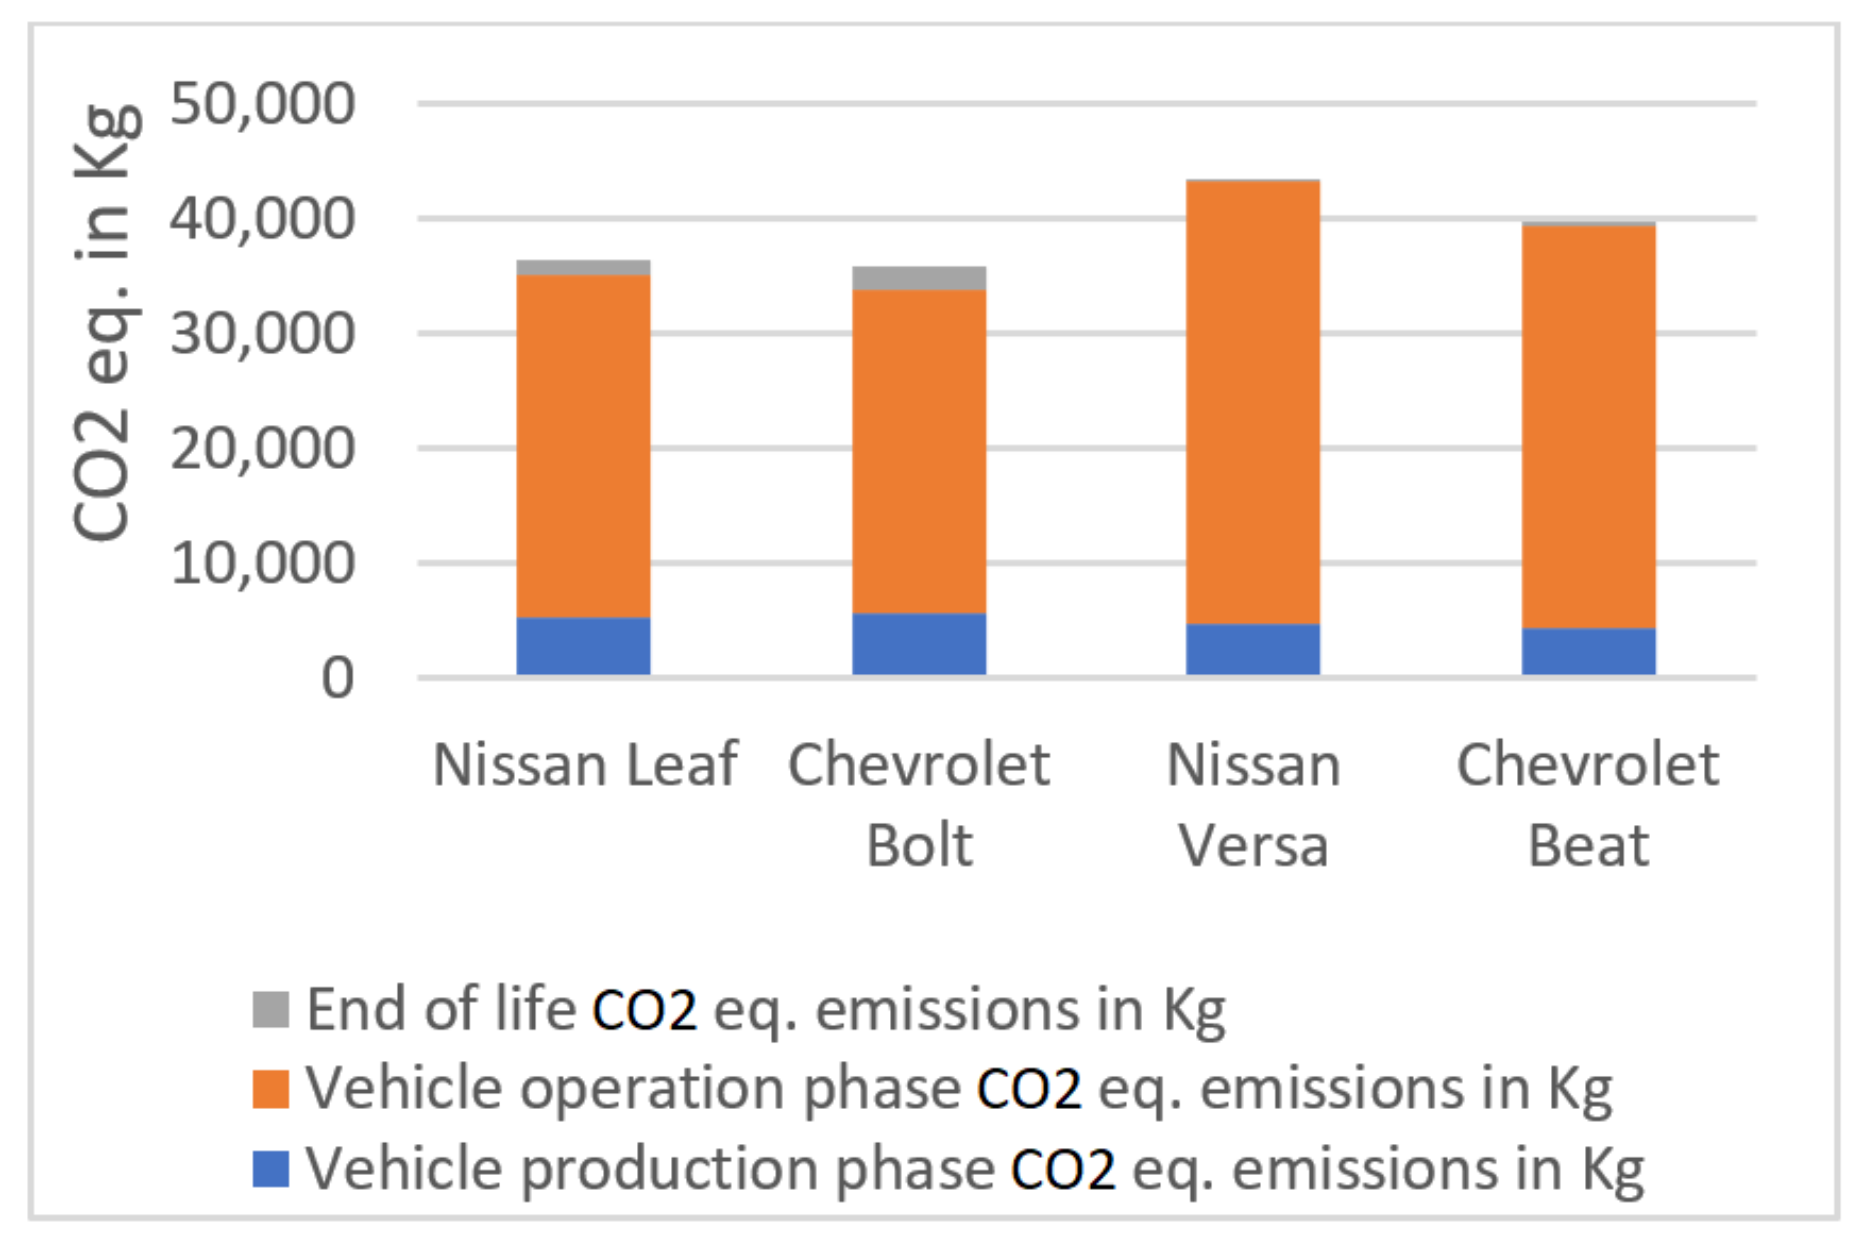
Figure 13 and
Table 3 show the GHG emissions over an 8-year period.
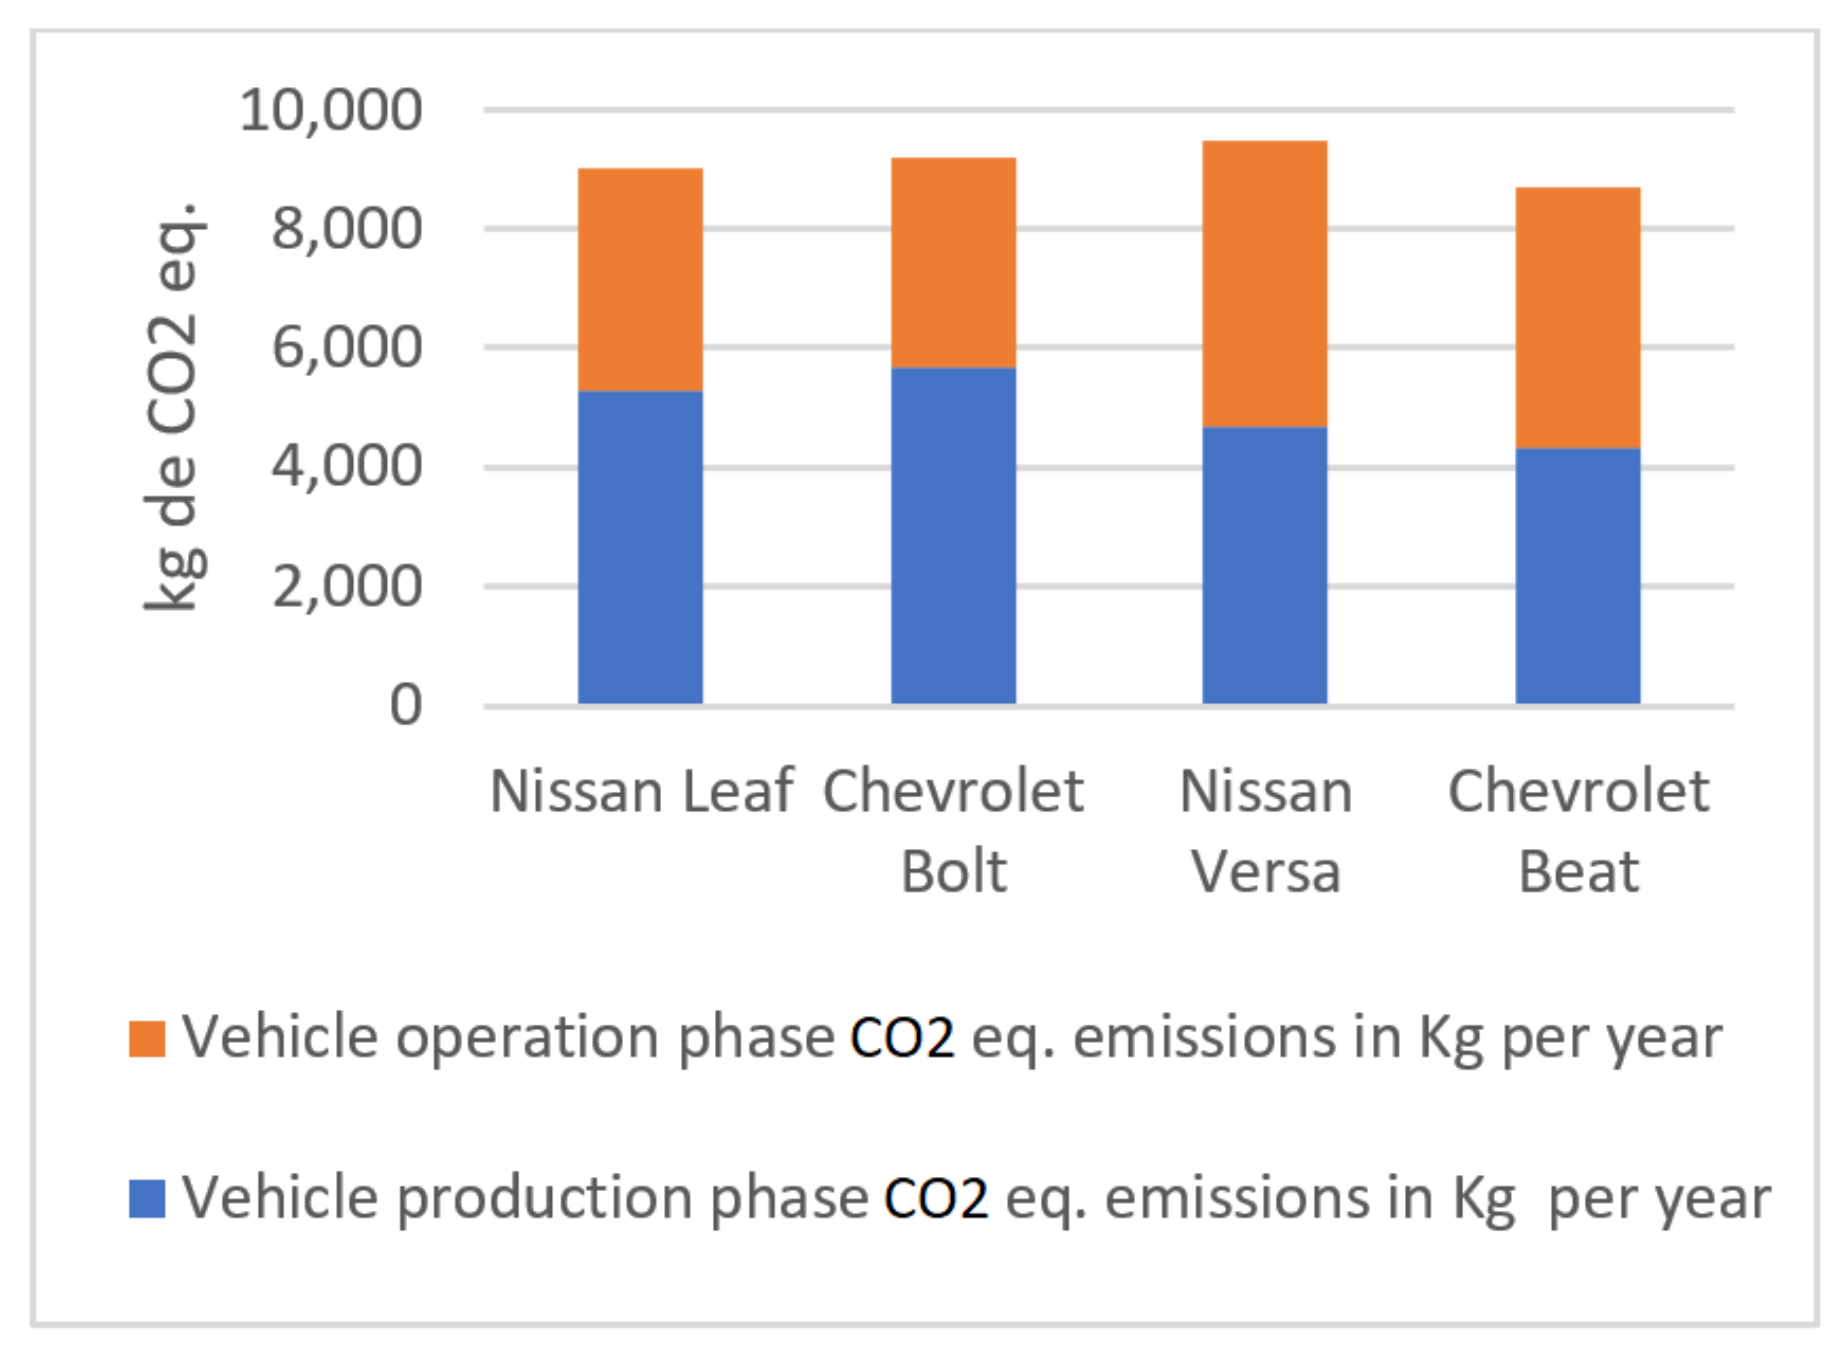
Figure 14 presents the average annual GHG emissions, omitting the end-of-life or disposal stage. It can be seen that the environmental impact of the production of EVs is a little larger than that of ICVs. This is due to the size and weight of lithium-ion batteries. Furthermore, in the operation stage, a decrease in polluting emissions per year can be noticed for EVs because EVs have zero tailpipe emissions. Nonetheless, the generation of electricity is still a problem, as compared with the generation and refinement of gasoline; in Mexico City, most electricity is generated using fossil fuels, mainly natural gas.
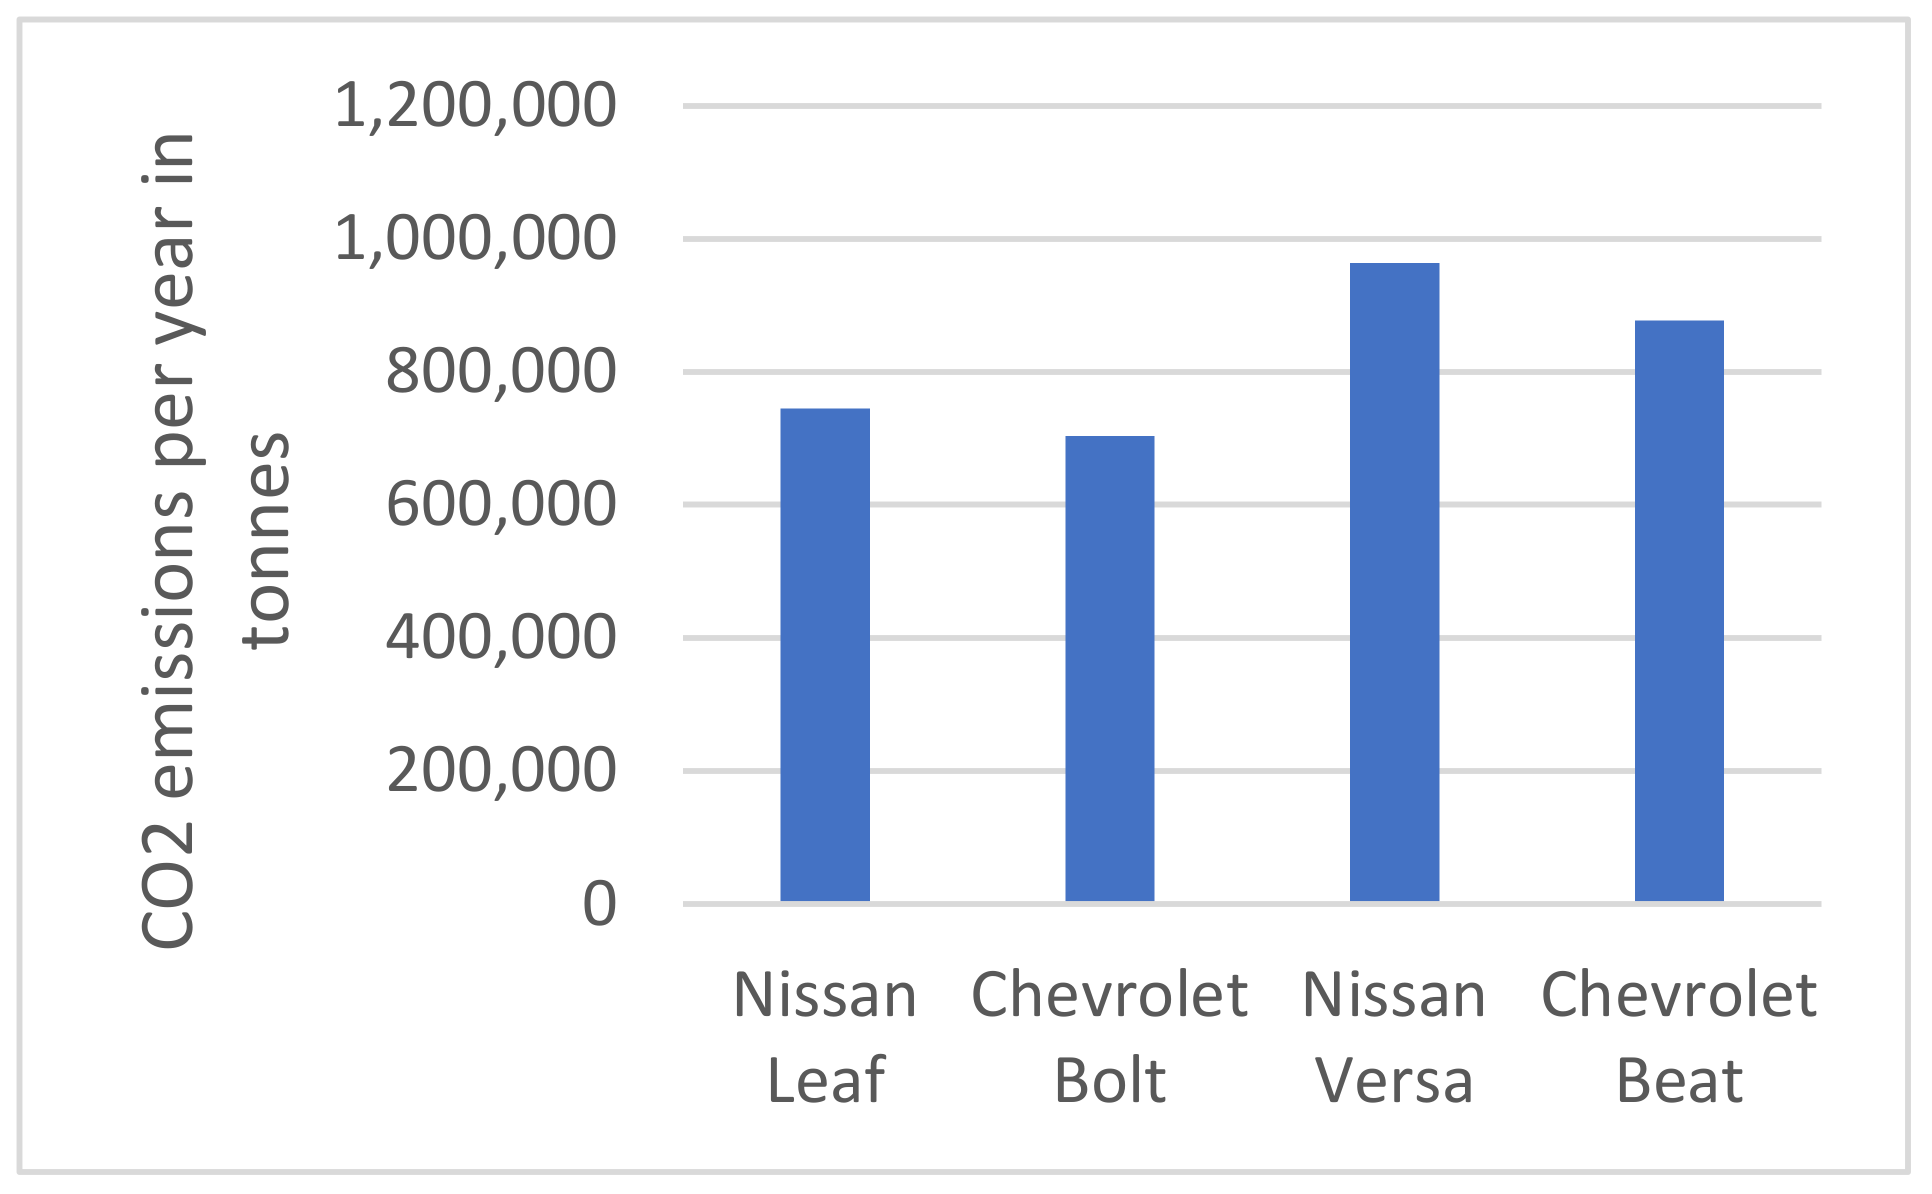
4.4. Environmental Impact of EVs Applied in Taxis
We considered the introduction of EVs into public transport, specifically the case of taxis. There are approximately 160,000 public taxis [
55] and 40,000 of private origin, such as those used for Uber, Didi, and Cabify services. These were all considered for the analysis, resulting in a total of 200,000. Only the polluting emissions produced during the operation phase of the vehicles were considered: in other words, those produced through the generation of fuel (electricity for EVs and gasoline for ICVs) and the polluting emissions produced while driving. The results can be seen in
Figure 15.
As can be seen in
Figure 13 and
Figure 14, the greatest contributor to emissions in the operation stage is the Nissan Versa. Compared with the Nissan Versa, the
CO2 equivalent emissions per year produced in the operation stage are approximately 22.66% and 27% lower for the Nissan Leaf and Chevr1olet Bolt, respectively. According to the Mexico City Emissions Inventory published by Sedema [
29], the total emissions produced per year in Mexico City is 16,745,438 tons of
CO2 equivalents, which corresponds to 5.23% of the national annual average emissions. Thus, there would be reductions of 1.30% and 1.55% for the Nissan Leaf and Chevrolet Bolt, respectively. Nevertheless, the transport sector contributes to 32.1% of the national emissions, which corresponds to a total of 5,375,285 tons of
CO2 equivalents. Therefore, there would be reductions in polluting emissions of 4.06% and 4.84% for the Leaf and Bolt, respectively.
6. Conclusions
Currently, environmental pollution and global warming are increasingly threatening natural, social, and economic environments. In Mexico, climate change is a problem that has been suffered for more than three decades. Thus, looking for alternatives to reduce pollution levels is not an option but a necessity. As most polluting emissions originate in the transport sector, this paper presented a proposal for the introduction of electric vehicles to the taxi sector in Mexico City. The main objective was to measure the decrease in environmental pollution through an assessment of the cost-environmental impact.
Methodologies to calculate the LCC and analyze the polluting emissions from the chosen vehicles were used to conduct an environmental impact analysis to assess the feasibility of using EVs in the market. The methodologies were based on the different phases of a vehicle’s life cycle: production, operation, maintenance, and depreciation/disposal. Furthermore, a sensitivity analysis was performed to identify dominant factors that could affect the LCC.
The results obtained by analyzing the LCC values of the chosen vehicles showed that one of the main problems of EVs is their acquisition cost, as this accounts for approximately 80% of the total LCC. The maintenance cost was found to be the second greatest contributor to the LCC, and the battery cost represents more than 90% of the total maintenance cost. The cost of batteries is high, but in the future, this is expected to decrease by 7 to 9% per year. One of the economic advantages of the use of EVs is that their operating costs are lower than those of ICVs by approximately 50%. This difference is because of the significant savings in vehicle verification costs, holding taxes, and fuel (electricity price for EVs).
In order to have a greater impact on the use and introduction of EVs into the market in Mexico, it will be necessary to reduce the acquisition cost. This could be achieved by increasing the production of vehicles and reducing the cost of components through an EV government subsidy; by increasing and decreasing the costs of gasoline and electricity, respectively; through effective implementation of recharging infrastructure; and through technical improvements, such as efficiency and autonomy. This would provide EVs with a greater level of acceptance in the market.
According to the sensitivity analysis that was performed, in order to make EVs more affordable and competitive with ICVs in terms of the LCC, it is necessary to reduce the acquisition cost of EVs by at least 40%. Thus, the LCC of EVs would be similar to that of ICVs. A reduction in the battery cost per kWh of between 73.44% and 78.81% is needed. The analysis of the environmental impact showed a reduction in the total amount of CO2 equivalent emissions of between 15% and 17% over a period of 8 years. Furthermore, the CO2 equivalent emissions of EVs in the production stage were found to be larger than those of ICVs because of the differences in weight and battery size. In addition, in the operation stage, the polluting emissions were considered during fuel generation and driving. In the operation stage, there was a noticeable reduction in CO2 equivalent emissions for the EVs compared with the ICVs. This difference can be attributed to the zero tailpipe emissions of the EVs.
When the results of this study were applied to the taxi fleet, considering the total number of taxis in Mexico City, we found a reduction of tons of CO2 of between 22% and 27% per year compared with the situation when ICVs were used, which represents a reduction in the transport sector’s contribution to the total CO2 emissions of between 4% and 5%. Nonetheless, although electric cars do not emit pollutants through combustion, the generation of electricity using fossil fuels prevents a greater decrease in the amount of environmental pollution.
Finally, the reduction of polluting emissions would be much more noticeable if an electricity generation system using clean and renewable energies, such as wind and solar, was adopted in Mexico.


