Abstract
Aiming at the accelerated aging problem that may occur during the use of high specific energy lithium-ion batteries, this article proposes a method to judge the accelerated aging of lithium-ion batteries. Taking the IC curve and DV curve as the starting point, the complete characteristic curve of the new battery is used as a comparison benchmark, and the battery characteristic curves of different aging stages are compared and analyzed, and the parameters that have obvious changes before and after the accelerated aging of the battery are extracted as the characteristics that the battery has accelerated aging. It is important to establish the relevant characteristic parameter matrix, and use the logistic regression method to train the accelerating aging model of the battery to realize the diagnosis of accelerating aging fault. In view of the fact that lithium batteries rarely undergo a complete charging process, the characteristic parameter sets established in this paper are based on the IC curve and the DV curve in the 15–75% SOC range, which have certain practicability.
1. Introduction
In order to reduce greenhouse gas emissions and pollution caused by fossil fuels, the promotion of new energy vehicles worldwide has become a general trend. As the market share of new energy vehicles increases, the service life and safety of power batteries have become topics of widespread concern.
Under this circumstance, battery technology is the main source of power for new energy vehicles, and its development and breakthroughs have become one of the key technologies restricting the development of new energy vehicles. Lithium-ion batteries have become the main research object of new energy vehicle power sources due to their better comprehensive performance and cost advantages. Especially in recent years, in order to pursue a higher cruising range, a large number of high specific energy ternary lithium-ion batteries have been used. However, the application of high specific energy lithium-ion batteries has also brought potential safety hazards. The accelerated aging phenomenon significantly reduces the service life of the battery and increases the economic cost [1]. If the battery that has already undergone accelerated aging continues to be used, it is extremely easy to cause an internal short circuit of the battery, cause a fire, and cause a serious safety accident. Therefore, realizing the recognition of the inflection point of accelerated aging of lithium-ion batteries and establishing relevant predictive models are of great significance to the operation and maintenance of lithium batteries [2].
At present, the recognition of the inflection point of accelerated aging of lithium-ion batteries is mainly based on two ideas. One is based on the life prediction model, through the known battery operating state, combined with historical data, to estimate the aging state of the battery, and then use machine learning methods to predict the evolution trend of battery performance [3,4,5]. The literature [6] uses an optimized AR model to predict battery capacity attenuation, and uses a particle swarm algorithm to adaptively change the model order. The AR model is linear, and the battery capacity decay process is usually non-linear. This difference will cause the model to underfit in the long-term prediction process; within the literature [7], starting from the lithium-ion battery charging voltage and charging current curve, a method for battery capacity prediction based on the sparse Bayesian learning method is proposed. Five characteristics of initial charging voltage, constant current charging capacity, constant voltage charging capacity, cut-off charging voltage, and cut-off charging current, are input into the correlation vector machine regression model. The parameters are used to predict the battery capacity, but the complete charging curve of the battery needs to be obtained, and the applicability is general. Another way is to extract the characteristic parameters that have a strong correlation with capacity changes during battery cycles, and use the characteristics of different characteristics of the characteristic parameters before and after the inflection point of the battery capacity diving to set the threshold for stable battery operation. Once the threshold is exceeded, it is considered that the battery has undergone capacity diving. The literature [8] takes the median voltage of each constant power charge and discharge cycle of the ternary battery as the characteristic parameter, and finds the slope of the median voltage V and the number of cycles’ N curve. When the slope exceeds the preset threshold, the battery accelerates aging; the preset threshold value needs a lot of experiments to obtain, otherwise it may lead to prediction deviation. The literature [9] established a linear regression model based on the capacity data of the stable working area, and established a belt-shaped safety zone based on the residual distribution obeying the normal distribution. When the capacity continuously exceeds the seat belt, the battery capacity is considered. It starts diving and has high reliability. However, in practice, battery capacity parameters are difficult to obtain directly, and there are certain limitations. On this basis, the literature [10] improved the method for determining the upper and lower bounds of the belt-shaped safe area. Based on the idea of probability statistics, the probability of the data point corresponding to the normal decline of the battery falling in the belt-shaped area reached 95% as the standard. Through the Monte Carlo simulation of the residual distribution to calculate the probability, the value of the upper and lower bounds of the safe area is finally determined.
Based on the current research status at home and abroad, the current realization of the recognition of lithium-ion battery capacity diving is mainly based on data-driven methods. Although this method requires a large amount of data for training, the prediction accuracy is greatly affected by the choice of kernel function. There is no need to consider the complicated internal physical and chemical changes in the battery aging process, only starting from the historical real-time data of battery operation, which has high practical value. However, most of the current methods still need to obtain a complete charging curve of the battery. In response to this phenomenon, this article proposes a method for diagnosing whether accelerated aging occurs according to the change in the characteristic curve of a part of the battery (15–75%). Taking the IC curve and the DV curve as the entry point, the complete characteristic curve of the new battery is used as a comparison benchmark, and the battery characteristic curves of different aging stages are compared and analyzed, and the parameters that have obvious changes before and after the accelerated aging of the battery are extracted as the characteristics of whether the battery has accelerated aging. It is possible to establish the relevant characteristic parameter matrix, and use the logistic regression method to train the accelerating aging model of the battery to realize the diagnosis of accelerating aging fault. The characteristic parameter sets established in this paper are based on the IC curve and the DV curve in the range of 15–75% SOC, which have certain practicability.
2. Accelerated Aging Characterization Parameters and Change Characteristics of Lithium Batteries
This section is mainly based on the capacity increase curve (IC curve) and voltage difference curve (DV curve) of the lithium battery to extract the characteristic parameters that characterize the accelerated aging of the battery, and establish the relevant characteristic parameter matrix. Taking the DV curve of the new battery as a benchmark, it is possible to obtain the DV curve of the battery under different aging states, use the DTW method to match the curve, analyze the change of the DV curve of the lithium battery during the aging process, and extract the obvious difference before and after the accelerated aging of the lithium battery. The characteristic parameters of the lithium battery characterize the accelerated aging state of the lithium battery; based on the main peak area of the IC curve of the new battery, the change of the main peak area of the IC curve of the lithium battery during the aging process is analyzed to characterize the aging state of the lithium battery.
2.1. Curve Matching Method
Dynamic time warping (DTW) can shorten or enlarge two time series of unequal length, and realize two time series of unequal length by converting the one-to-one alignment of the midpoints of the two time series into one-to-many [11] alignment, and then compare the similarity between the two sequences. Supposing there are two time series, and , whose lengths are m and n (m ≠ n), respectively. The point-to-point distance function chooses the Euclidean distance, and its distortion of the path can be expressed as:
At the same time, the twisted path requires continuity and monotonicity, so the following three constraints need to be met:
(1) Boundary conditions:
(2) Continuity: if then
(3) Monotonicity: if then means the Euclidean distance between point in X and point in Y. The DTW algorithm is to minimize the sum of the distances and use it to represent the similarity of two curves [11].
2.2. Characteristic Parameters in DV Curve
The voltage difference curve (DV curve) is obtained by deriving the OCV-capacity curve of the battery, which represents the voltage change of a unit capacity lithium battery. Through the horizontal comparison analysis between the DV curve of the battery with accelerated aging and the battery without accelerated aging, the characteristic parameters that can characterize the accelerated aging of the lithium battery are extracted, and then through the longitudinal comparison and analysis of the DV curve of different aging stages in the aging process of the lithium battery, one can judge the change rule of characteristic parameters before and after accelerated aging of the lithium battery, and then use the change of characteristic parameters to judge whether the lithium battery has accelerated aging failure.
As shown in Figure 1 below, as the lithium battery ages, the overall DV curve shifts to the left. At this time, the difference between the two DV curves cannot be directly analyzed. Take the complete DV curve of the new battery as a benchmark and use the DTW algorithm to align the DV curve of the same battery at different aging stages with it, and then calculate the points and points between the two curves after alignment within the range of 40–60% SOC. The Euclidean distance is taken as one of the characteristic parameters that characterize the aging state of the lithium-ion battery.
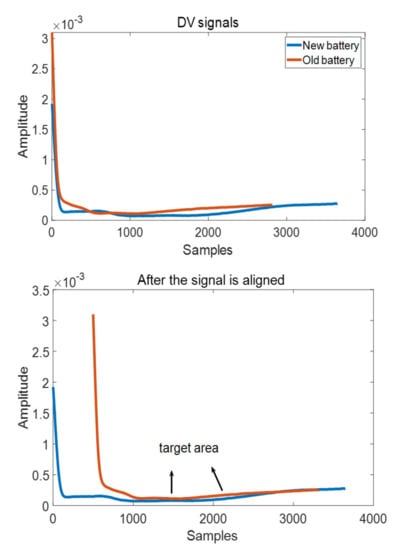
Figure 1.
Comparison of DV curve of new battery and aging battery.
At the same time, the height of the main peak of the IC curve has a strong linear relationship with the capacity of the lithium-ion battery. When the capacity of the lithium- ion battery continues to decline with the deepening of aging, the height of the main peak also decreases, and the height of the main peak of the IC curve corresponds to the DV trough on the curve; therefore, the minimum trough of the DV curve can be used as one of the characteristic parameters to characterize the aging state of the lithium battery.
Taking into account that it is difficult to obtain a complete DV curve in practical applications, the DV curve used as a pairing reference should be a complete curve, including the range of 0–100% SOC, and the matching DV curve can include 20% of any segment of the DV curve within 70% SOC range.
2.3. Characteristic Parameters in IC Curve
The capacity increment curve (IC curve) is obtained by deriving the capacity-OCV curve of the battery, and the change of each peak reflects the different stages of the battery in the electrochemical reaction process. Among them, the area of the main peak of the IC curve has a certain correlation with the capacity of the lithium-ion battery. When a lithium-ion battery undergoes accelerated aging, the area of the main peak of its IC curve is usually significantly reduced. This feature can be used as a basis for judging the inflection point of the accelerated aging of the lithium-ion battery. As shown in Figure 2:
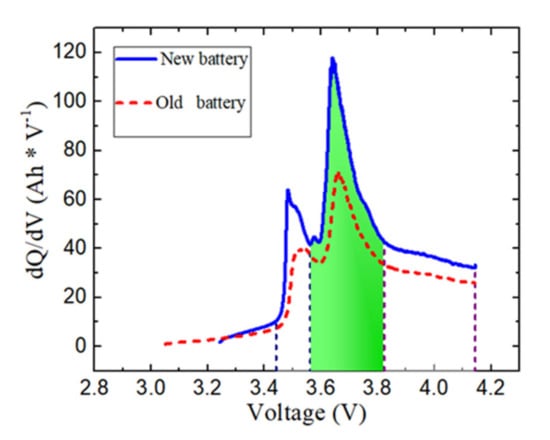
Figure 2.
Difference of main peak area of IC curve between new and old battery.
In addition, based on the main peak area of the IC curve of the new battery, the difference between the main peak area of the IC curve obtained at different subsequent cycles and the difference sequence of the main peak area is obtained. This sequence can reflect the capacity decline of the lithium battery when the battery is aging to a certain speed.
2.4. Correlation Analysis between the Change of Characteristic Parameters and the Inflection Point of Accelerated Aging
The characteristic parameters extracted by the above methods should have a certain correlation with the inflection point of the accelerated aging of the lithium battery. The main performance is: after the accelerated aging of the lithium battery, the characteristic parameters should also have obvious changes, that is, the characteristics before and after the accelerated aging of the lithium battery. The parameters have obvious inconsistencies.
The following Figure 3 shows the capacity change of a certain type of ternary lithium-ion battery during the aging process. The experiment does a capacity calibration every 200 cycles, and the capacity of the lithium-ion battery begins to dive around 1400 cycles. Figure 4 shows the variation of the average distance between the 40–60% SOC of the lithium battery DV curve with the number of cycles, and Figure 5 shows the change of the minimum valley value at the bottom of the DV curve of the lithium battery with the number of cycles, at 1600–1800 cycles. When the left and right lithium batteries begin to accelerate the aging of the inflection point, the characteristic parameters in Figure 4 and Figure 5 also expand rapidly, indicating that the speed of the DV curve shifts upward after the accelerated aging of the lithium battery increases. Figure 6 shows the change of the main peak area of the lithium battery IC curve with the number of cycles. When the lithium battery capacity is in the linear decline stage, the main peak area of the IC curve also linearly declines, and when the lithium battery capacity starts to dive, the main peak area also drops rapidly, appearing at the obvious inflection point. Therefore, the characteristic parameters that are related to the accelerated aging of lithium-ion batteries include: the area of the two peaks of the IC curve, the distance between the DV curve (40–60% SOC), and the minimum valley of the DV curve. At the same time, for the main peak, the characteristic parameter of area is further processed. Taking the main peak area of the IC curve of the new battery as the benchmark, the difference between the main peak area of the IC curve obtained at different subsequent cycles and the difference sequence of the main peak area is obtained, and this sequence is used to represent the lithium battery rate of decline of aging.
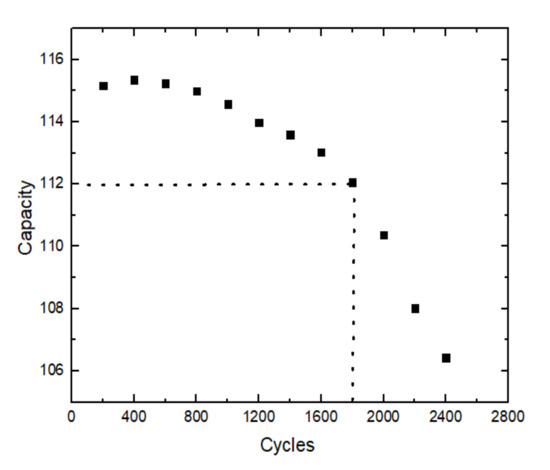
Figure 3.
Li-ion battery capacity changes with the varies with the number of cycles.
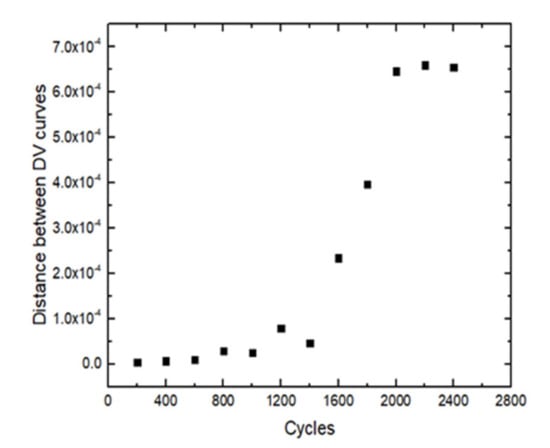
Figure 4.
The distance between DV curves number of cycles.
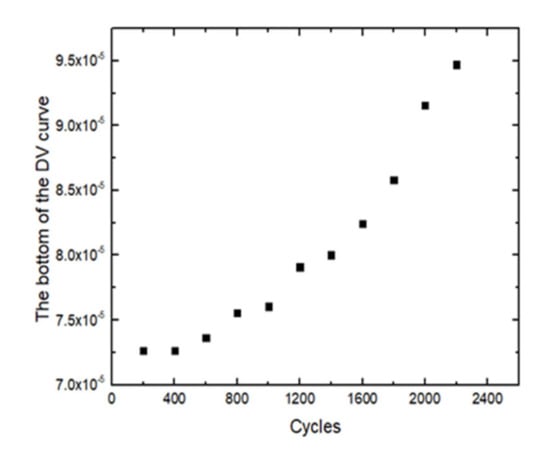
Figure 5.
The bottom of the DV curve changes with changes with the number of cycles.
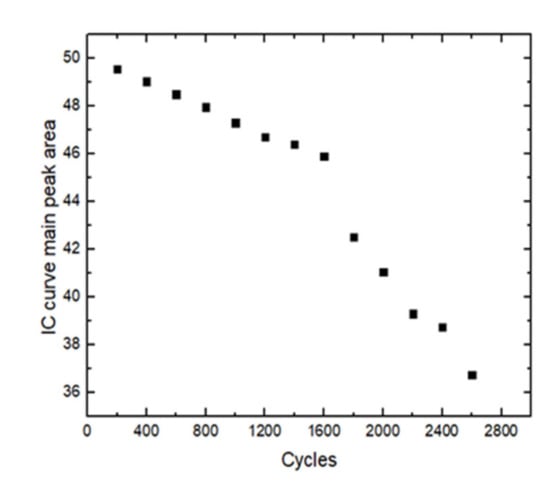
Figure 6.
The area of the main peak of the IC curve the number of cycles.
The above characteristic parameters all have a certain correlation with the accelerated aging phenomenon of lithium-ion batteries, and the changes in the characteristic parameters before and after accelerated aging of the lithium-ion battery can be used to judge the aging state of the battery.
Finally, a characteristic parameter system including the distance between the DV curve (40–60% SOC), the minimum valley value of the DV curve bottom, the main peak area of the IC curve, and the difference sequence of the main peak area is established, as shown in Table 1.

Table 1.
Characteristic parameter system characterizing accelerated aging.
3. Recognition Model of the Inflection Point of Accelerating Aging of Battery
At present, data-driven methods are widely used to predict the inflection point of accelerated aging of lithium batteries. This method ignores the physical and chemical reactions inside lithium-ion batteries. It uses battery history and real-time operating data to determine the aging state of the battery, and predicts its evolutionary law to realize the battery accelerates the judgment and the prediction of aging.
This section mainly adopts the method of logistic regression to realize the judgment of accelerated aging of lithium battery. According to the established characteristic parameter system, the characteristic parameters needed in the cycle are extracted and used as the training set of logistic regression. After multiple iterations, the optimal solution of the model parameters is determined, and finally a lithium battery accelerated aging model is established.
3.1. Logistic Regression and Related Theoretical Basis
The accelerated aging of lithium batteries is approximated as a two-class problem. The battery is divided into the accelerated aging phase and the non-accelerated aging phase. The logistic regression method is used to implement a simple binary classification problem by converting the Z value in Z = w × x + b into 0 and 1 of the classification task. This conversion is realized by using the logistic function. The expression is as follows
The Z value output by the regression model is converted into a value between 0 and 1, which is expressed as the probability that the sample label is 1. When the probability of the label being 1 is less than the set threshold, it is judged as 0, and when the probability is greater than the set threshold, it is judged as 1, so as to realize the two classification of data.
3.2. Model Building Method Based on Logistic Regression
In the process of judging whether the lithium-ion battery has accelerated aging using the logistic regression method, the state when the battery has accelerated aging is marked as 1, and the state without accelerated aging is marked as 0. Then, getting Z = w × x + b into Equation (1), we can get:
Take the logarithm of both sides:
h(z) is the probability that the sample label is, 1 − h (z) is the probability that the sample label is, then the above formula is rewritten in the form of probability as:
Therefore, the logistic regression model for the binary classification problem is:
In logistic regression, the maximum likelihood estimation method is used to give reasonable values of W and b, and the maximum likelihood function is:
At the time, finding the “β” ^T that maximizes the value of L is the optimal solution. To facilitate the solution, one must take the negative number of the above formula and average it. The loss function of the logistic regression is calculated as:
To find the β^T when the minimum value in the above formula is obtained is the required model parameter. Specifically, iterative methods such as gradient descent can be used to optimize β^T. The specific flow chart is as follows in Figure 7:
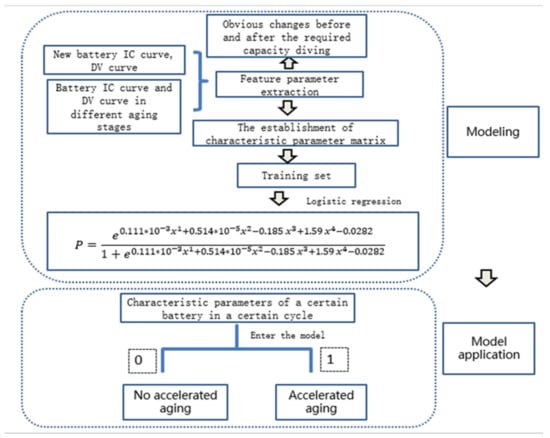
Figure 7.
Flow chart.
4. Experimental Results and Model Verification
For three batteries that have undergone accelerated aging, the characteristic parameters in Table 1 are extracted every 200 cycles. The status data label of the battery that has not undergone accelerated aging is 0, and the data label of the state that has undergone accelerated aging is 1, and a logistic regression is established. Table 2 is the established training set.

Table 2.
Training set.
The final trained model is:
It is necessary to select another battery of the same type to verify the accuracy of the model. Similarly, the characteristic parameters in Table 1 are extracted every 200 cycles, and the characteristic parameters are input into the model in sequence according to the number of cycles. Table 3 shows the results of model verification.

Table 3.
Model verification results of a battery of the same type.
Figure 8 shows that the lithium-ion battery has accelerated aging during 1600–1800 cycles, and the model also gives a judgment of accelerated aging of the battery at 1600 cycles, so the established model can accurately determine the acceleration of lithium batteries’ aging failure.
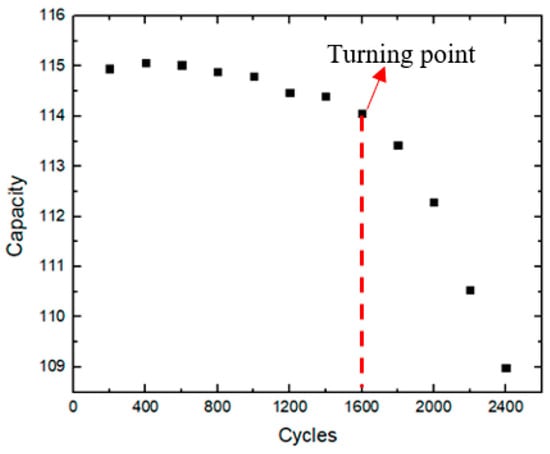
Figure 8.
Capacity decline curve of a battery of the same model.
5. Conclusions
This paper uses the logistic regression method to realize the judgment of the accelerated aging fault of the lithium battery. This method can solve the situation that the complete charging curve of the battery cannot be obtained in practice to a certain extent, focusing on the extraction of the charging curve only in the 15–75% SOC range. It aims to characterize the characteristic parameters of accelerating battery aging, establish the relevant characteristic parameter matrix, and use it as the training set of the logistic regression method. The logistic regression method is used to train the accelerated aging model of the lithium-ion battery, and then the characteristic parameters of the lithium battery to be tested in the current state are input into the established model to realize the diagnosis of the accelerated aging fault of the lithium-ion battery. The specific process is as follows:
- (1)
- In view of the fact that it is difficult to obtain the complete charging curve of the battery, the DTW algorithm is used to realize the matching analysis of the curve, and the battery characteristic curve in the range of 15–75% SOC is compared with the complete characteristic curve of the new battery, and the accelerated aging of the battery is compared. Before and after the change of the battery characteristic curve in this interval, it is necessary to extract the characteristic parameters that have obvious changes before and after the accelerated aging of the battery. Finally, a characteristic parameter system including the distance between the DV curve (40–60% SOC), the minimum valley value of the DV curve bottom, the main peak area of the IC curve, and the difference sequence of the main peak area is established.
- (2)
- As the lithium-ion battery ages, the DV curve moves upward, the distance between the curves expands, and the main peak area of the IC curve decreases. When accelerating aging of the battery occurs, the capacity decay rate increases, and an obvious inflection point appears, and the corresponding characteristic parameters also change significantly. The bottom of the DV curve and the distance between the DV curve are significantly increased, while the main peak of the IC curve is rapidly reduced.
- (3)
- Use logistic regression to train the characteristic parameter set and establish a judgment model for accelerating battery aging. Extract the required characteristic parameters in the characteristic curve of each cycle of the battery to be tested, and input them into the established model in sequence according to the number of cycles. The model output 0 means that the battery has not undergone accelerated aging, and the model output 1 means that the battery has accelerated aging failure.
Supplementary Materials
The following are available online at https://www.mdpi.com/article/10.3390/wevj12030143/s1, Table S1: Training Set.
Author Contributions
Methodology, N.Z.; Software, Y.W.; formal analysis, N.Z.; investigation, L.Z.; writing—original draft preparation, N.Z.; writing—review and editing, C.Z.; funding acquisition, C.Z. All authors have read and agreed to the published version of the manuscript.
Funding
This research was funded by the National Natural Science Foundation of China, grant number: 51977007 and the Beijing Natural Science Foundation of China, grant number: 3212033.
Institutional Review Board Statement
Not applicable.
Informed Consent Statement
Not applicable.
Conflicts of Interest
The authors declare no conflict of interest.
References
- Maheshwari, A.; Heck, M.; Santarelli, M. Cycle aging studies of lithium nickel manganese cobalt oxide-based batteries using electrochemical impedance spectroscopy. Electrochim. Acta 2018, 273, 335–348. [Google Scholar] [CrossRef]
- Schuster, S.F.; Bach, T.; Fleder, E.; Müller, J.; Brand, M.; Sextl, G.; Jossen, A. Nonlinear aging characteristics of lithium-ion cells under different operational conditions. J. Energy Storage 2015, 1, 44–53. [Google Scholar] [CrossRef]
- Gu, W.; Sun, Z.; Wei, X.; Dai, H. A new method of accelerated life testing based on the Grey System Theory for a model-based lithium-ion battery life evaluation system. J. Power Sources 2014, 267, 366–379. [Google Scholar] [CrossRef]
- Liu, J.; Saxena, A.; Goebel, K.; Saha, B.; Wang, W. An adaptive re-current neural network for remaining useful life prediction of lithium-ion batteries. In Proceedings of the Annual Conference of Prognostics and Health Management Society 2010, Portland, OR, USA, 10–16 October 2010; pp. 1–9. [Google Scholar]
- Surendar, V.; Mohankumar, V.; Anand, S.; Prasanna, V.D. Estimation of State of Charge of a Lead Acid Battery Using Support Vector Regression. Procedia Technol. 2015, 21, 264–270. [Google Scholar] [CrossRef] [Green Version]
- Long, B.; Xian, W.; Jiang, L.; Liu, Z. An improved autoregressive model by particle swarm optimization for prognostics of lithium-ion batteries. Microelectron. Reliab. 2013, 53, 821–831. [Google Scholar] [CrossRef]
- Hu, C.; Jain, G.; Schmidt, C.; Strief, C.; Sullivan, M. Online estimation of lithium-ion battery capacity using sparse Bayesian learning. J. Power Sources 2015, 289, 105–113. [Google Scholar] [CrossRef]
- Shi, H.; Wang, Y. A Method for Identifying and Predicting the “Diving” Fault of Ternary Battery Capacity. Patent CN202010010285.2, 1 June 2020. [Google Scholar]
- Guo, Q. Research on Health Feature Extraction and Diagnosis of Lithium-ion Power Battery. Ph.D. Thesis, Beijing Jiaotong University, Beijing, China, 2018. [Google Scholar]
- Zhang, C.; Wang, Y.; Gao, Y.; Wang, F.; Mu, B.; Zhang, W. Accelerated fading recognition for lithium-ion batteries with Nickel-Cobalt-Manganese cathode using quantile regression method. Appl. Energy 2019, 256, 11384. [Google Scholar] [CrossRef]
- Ye, K.; Chen, Z.; Wang, R.; Shi, J.; Hu, C. Dynamic time warping optimization algorithm. Softw. Guide 2021, 20, 1. [Google Scholar]
Publisher’s Note: MDPI stays neutral with regard to jurisdictional claims in published maps and institutional affiliations. |
© 2021 by the authors. Licensee MDPI, Basel, Switzerland. This article is an open access article distributed under the terms and conditions of the Creative Commons Attribution (CC BY) license (https://creativecommons.org/licenses/by/4.0/).