1. Introduction
The U.S. Department of Energy’s Vehicle Technologies Office (DOE-VTO, Washington, DC, USA) evaluates the impact of advances in powertrain technology using a fuel consumption (or fuel economy or CO
g/mile) metric on standard regulatory drive cycles [
1]. Such advances include those made in the engine, battery, vehicle electrification, and materials (e.g., light weighting). Simulating the systems of vehicle models that incorporate the technology advancements is an accepted approach to evaluating the fuel economy potential of such advanced technologies [
2].
DOE-VTO generates the targets for advances in technology and cost for engines, transmissions, batteries, fuel cell technologies, vehicle electrification, light weighting, etc., over a given time frame [
3]. We have used the vehicle system simulation tool Autonomie [
4], a vehicle simulation tool developed by Argonne National Laboratory (Argonne, Lemont, IL, USA), to perform simulations on vehicle models that incorporate baseline and advanced vehicle technology targets as generated by DOE-VTO. The vehicle models used for the simulation include conventional, hybrid electric vehicles (HEVs), plug-in hybrid (PHEVs), extended-range electric vehicles (EREVs), and battery-electric vehicles (BEVs) of different all-electric range (AER) distance values. The advancements in technologies are generally evaluated over standard regulatory driving cycles, for fuel economy and cost impact.
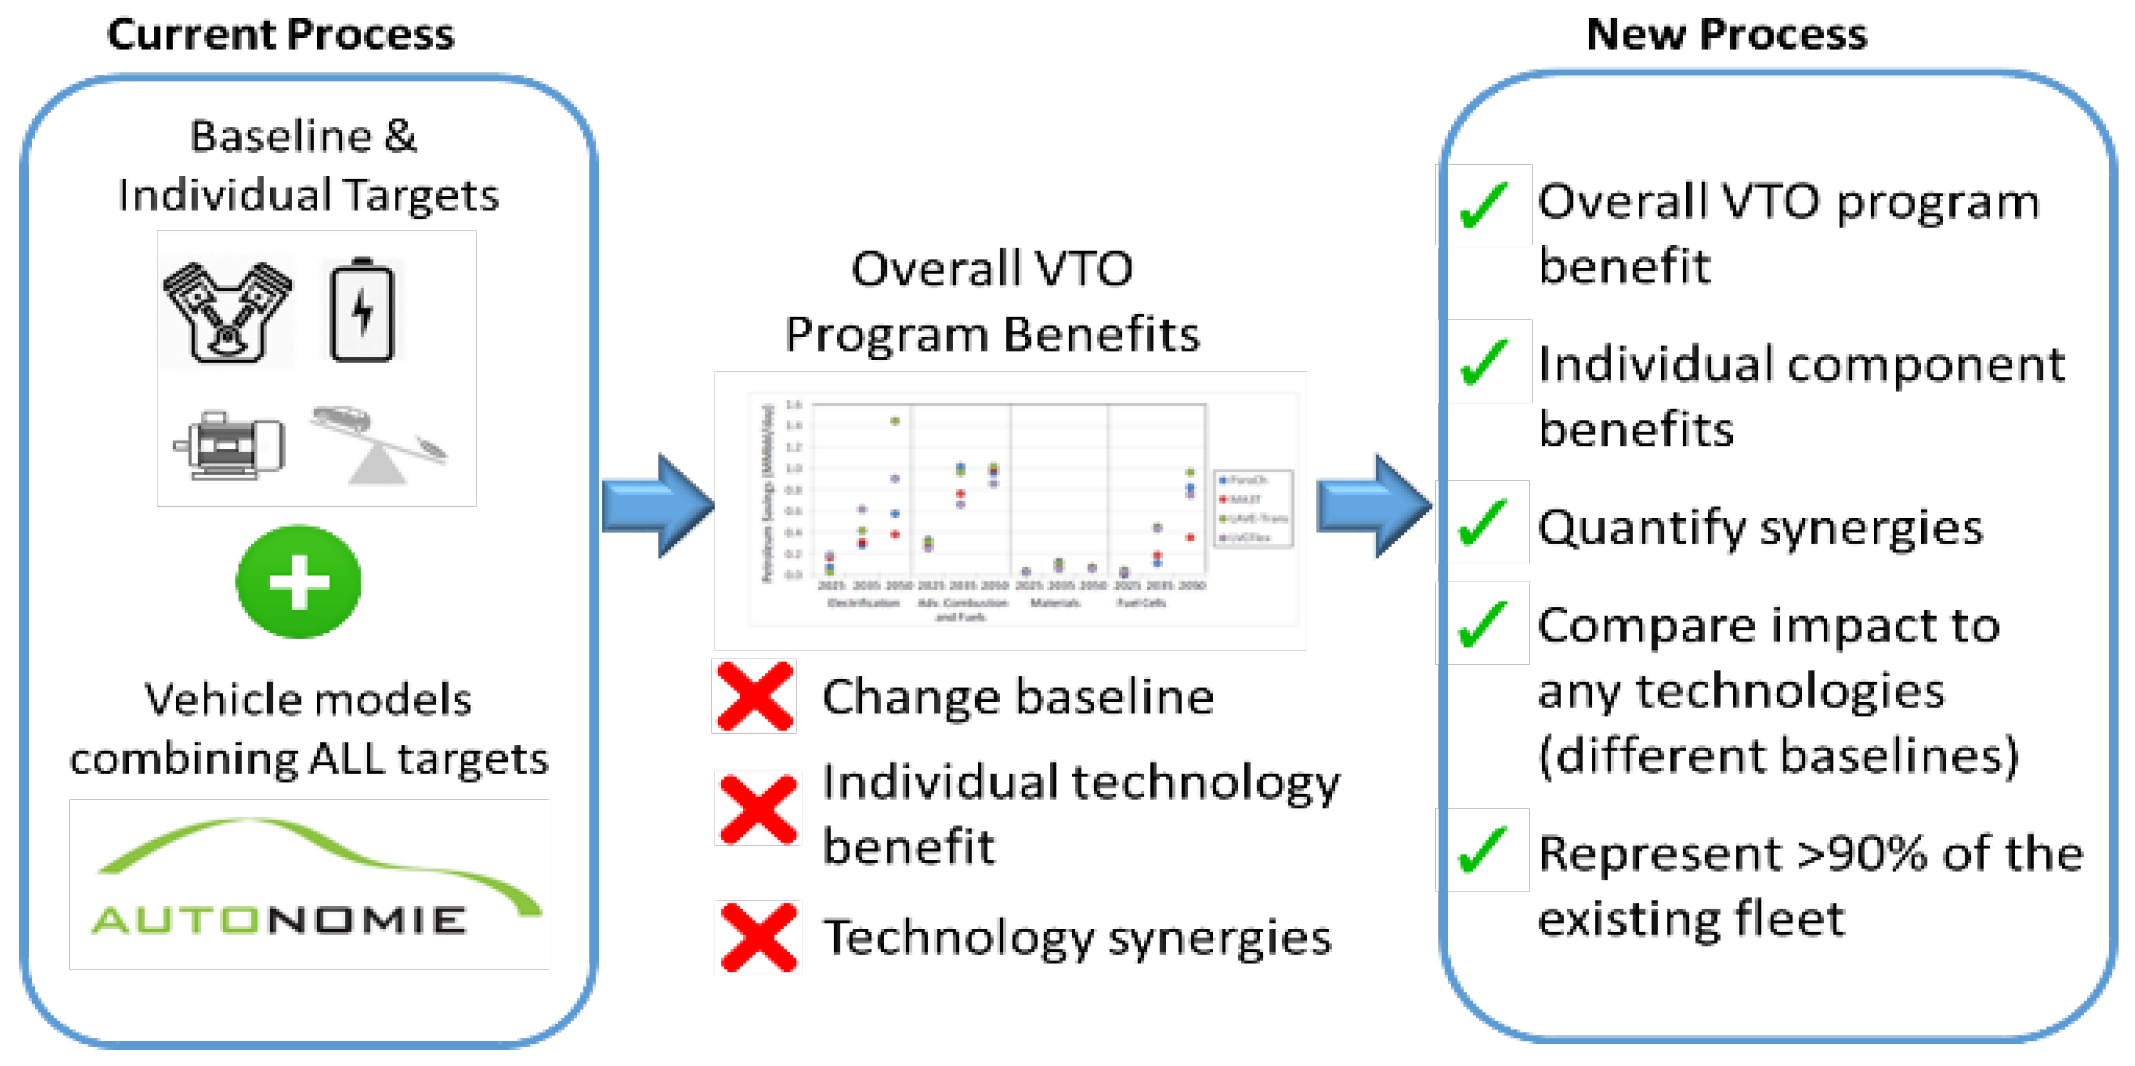
The current approach to DOE-VTO analysis evaluates the overall VTO program benefits. However, there are certain restrictions on the process:
inability to change baseline to evaluate the potential impact;
inability to evaluate individual technology benefits; and
inability to evaluate technological synergies.
Therefore, a new process has been developed as part of a large-scale simulation procedure to evaluate VTO benefits impact across different technological synergies, such as different transmission technologies, different performance targets, etc., for five EPA vehicle classes to better model the vehicles in the market.
Figure 1 shows the new process.
2. Procedure
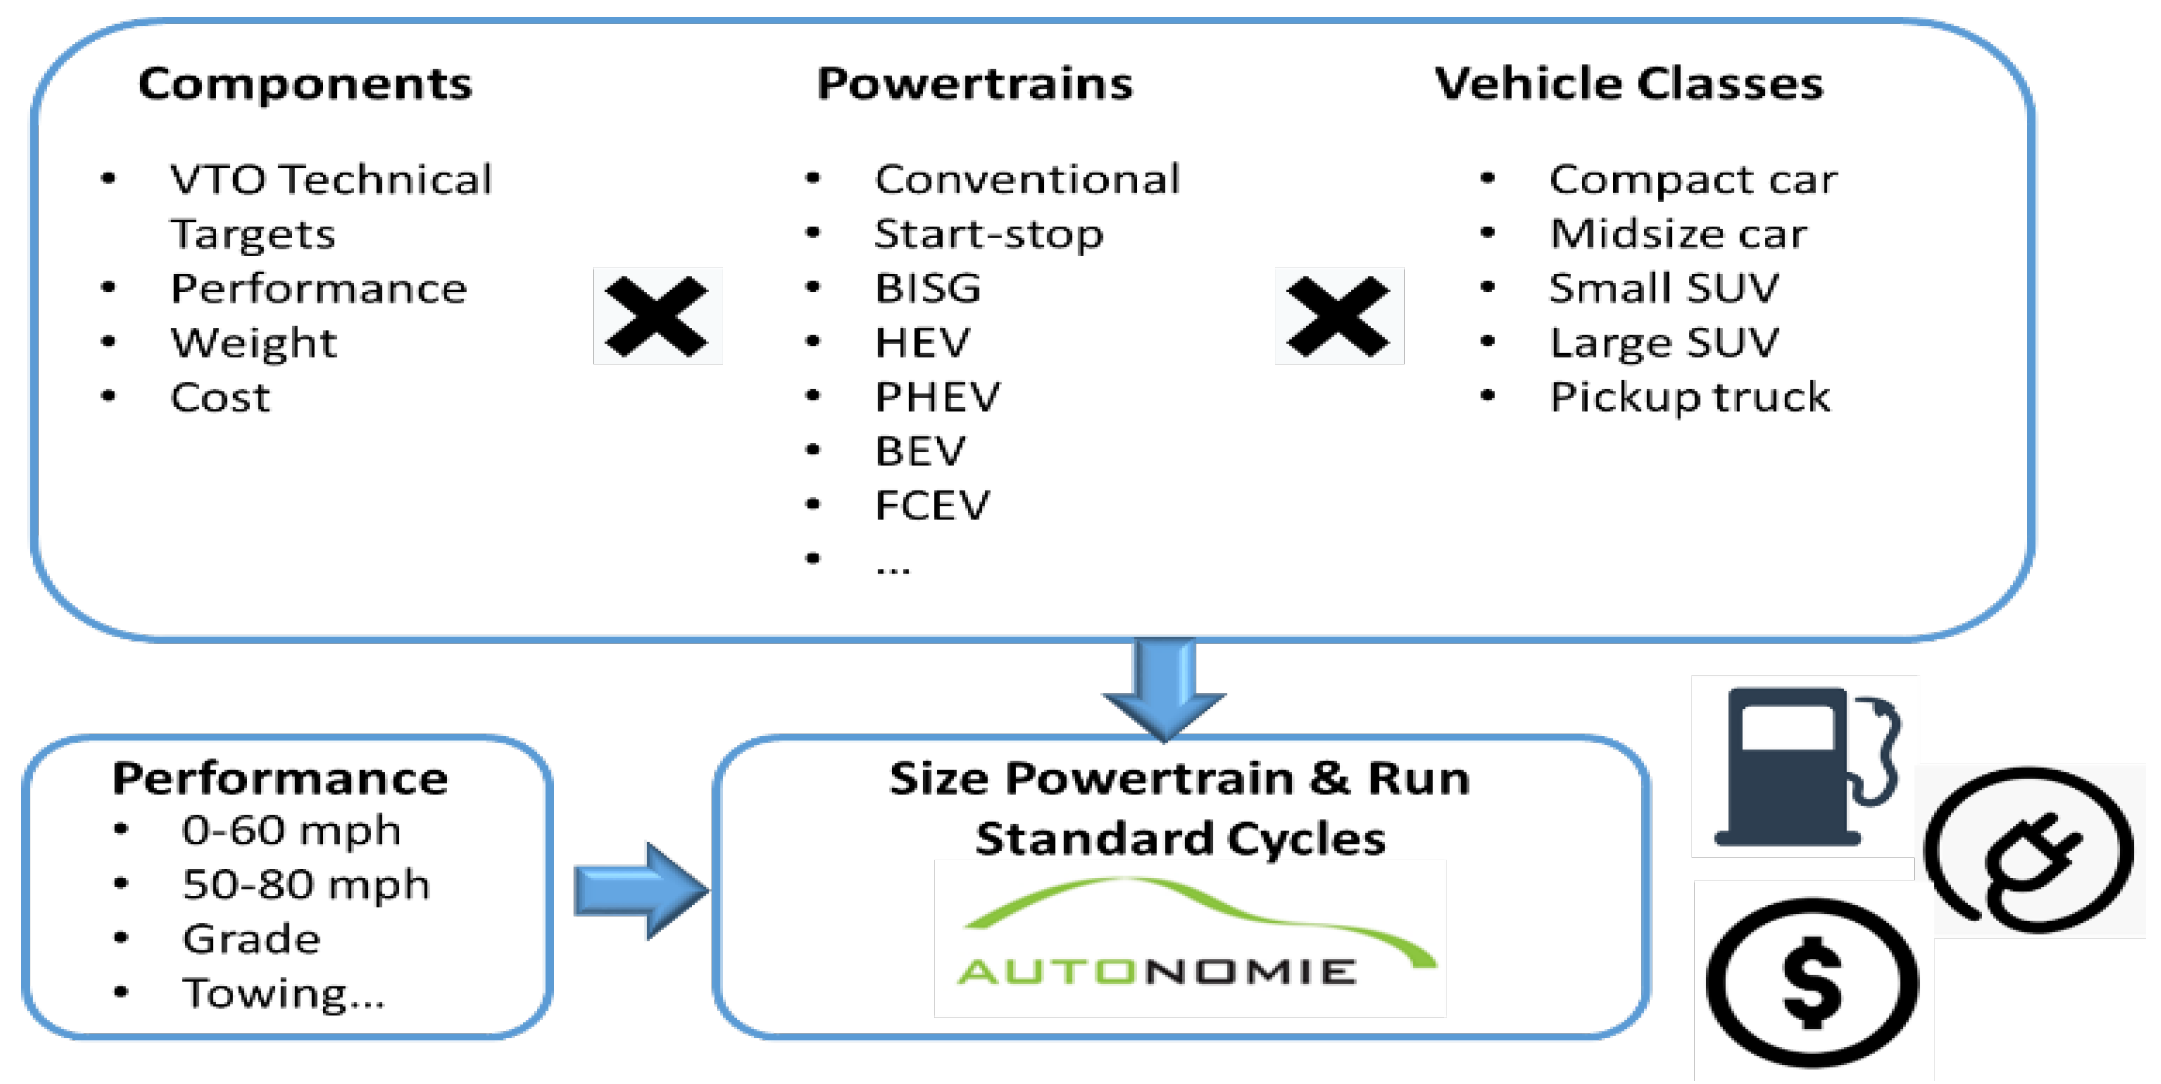
Figure 2 shows the large scale simulation process developed to evaluate the overall impact of VTO targets.
The different vehicle technology targets (engine efficiency, lightweighting percentage, battery energy density, electric machine, etc.) are applied across all the different vehicle powertrains and vehicle classes modeled. These vehicle combinations are sized based on different vehicle technical specifications and run in EPA standard cycles in Autonomie to evaluate the energy and cost benefit across all different combinations.
The different vehicle technology targets set by DOE-VTO are used to build the assumptions that are evaluated over a range of timeframes. This paper will cover the results from 2015, 2020, 2025, 2030, and 2045 “laboratory years”, which correspond to “model year minus 5 years”. For example, a laboratory year 2015 vehicle would reflect a vehicle that is available in the market in 2020, and, similarly, a 2045 laboratory year vehicle would imply a vehicle that is available in the market in 2050.
The following subsections represent the breakdown involved during the vehicle simulation. The latest report from Argonne [
5] details the assumptions and procedure involved behind the vehicle modeling and simulation efforts.
Autonomie
Autonomie is a Mathworks® (MathWorks, Natick, MA, USA) -based software environment and framework for automotive control-system design, simulation, and analysis. The tool, sponsored by the DOE-VTO, is designed for rapid and easy integration of models with varying levels of detail (low to high fidelity), abstraction (from subsystems to systems to entire architectures), and processes (e.g., calibration, validation). Developed by Argonne in collaboration with General Motors, Autonomie was designed to serve as a single tool that can be used to meet the requirements of automotive engineers throughout the development process—from modeling to control. Autonomie was built to:
estimate the energy, performance, and cost impact of advanced vehicle and powertrain technologies;
support proper methods, from model-in-the-loop, software-in-the-loop, and hardware-in-the-loop to rapid-control prototyping;
integrate math-based engineering activities through all stages of development—from feasibility studies to production release;
promote re-use and exchange of models industry-wide through its modeling architecture and framework;
support users’ customization of the entire software package, including system architecture, processes, and post-processing;
mix and match models with different levels of abstraction to facilitate execution efficiency with higher-fidelity models, for which analysis and high-detail understanding are critical;
link with commercial off-the-shelf software applications, including GT-POWER (Gamma Technologies LLC, Westmont, IL, USA), AMESim™ (Siemens, Plano, TX, USA), and CarSim® (Mechanical Simulation Corporation, Ann Arbor, MI, USA), for detailed, physically-based models; and
protect proprietary models and processes.
By building models automatically, Autonomie enables simulation of an unparalleled number of component technologies and powertrain configurations. Autonomie offers the following capabilities:
simulate subsystems, systems, or entire vehicles;
predict and analyze energy efficiency and performance;
perform analyses and tests for virtual calibration, verification, and validation of hardware models and algorithms;
support system hardware and software requirements;
link to optimization algorithms; and
supply libraries of models for propulsion architectures of conventional powertrains, as well as electric-drive vehicles.
In this study, Autonomie is used to assess the energy consumption of advanced powertrain technologies across vehicle classes and configurations. There are several publications that detail the vehicle modeling and controls in Autonomie [
6,
7,
8].
3. Vehicle and Component Assumptions
This section details the different vehicle classifications and some of the major vehicle attribute selections used in the study.
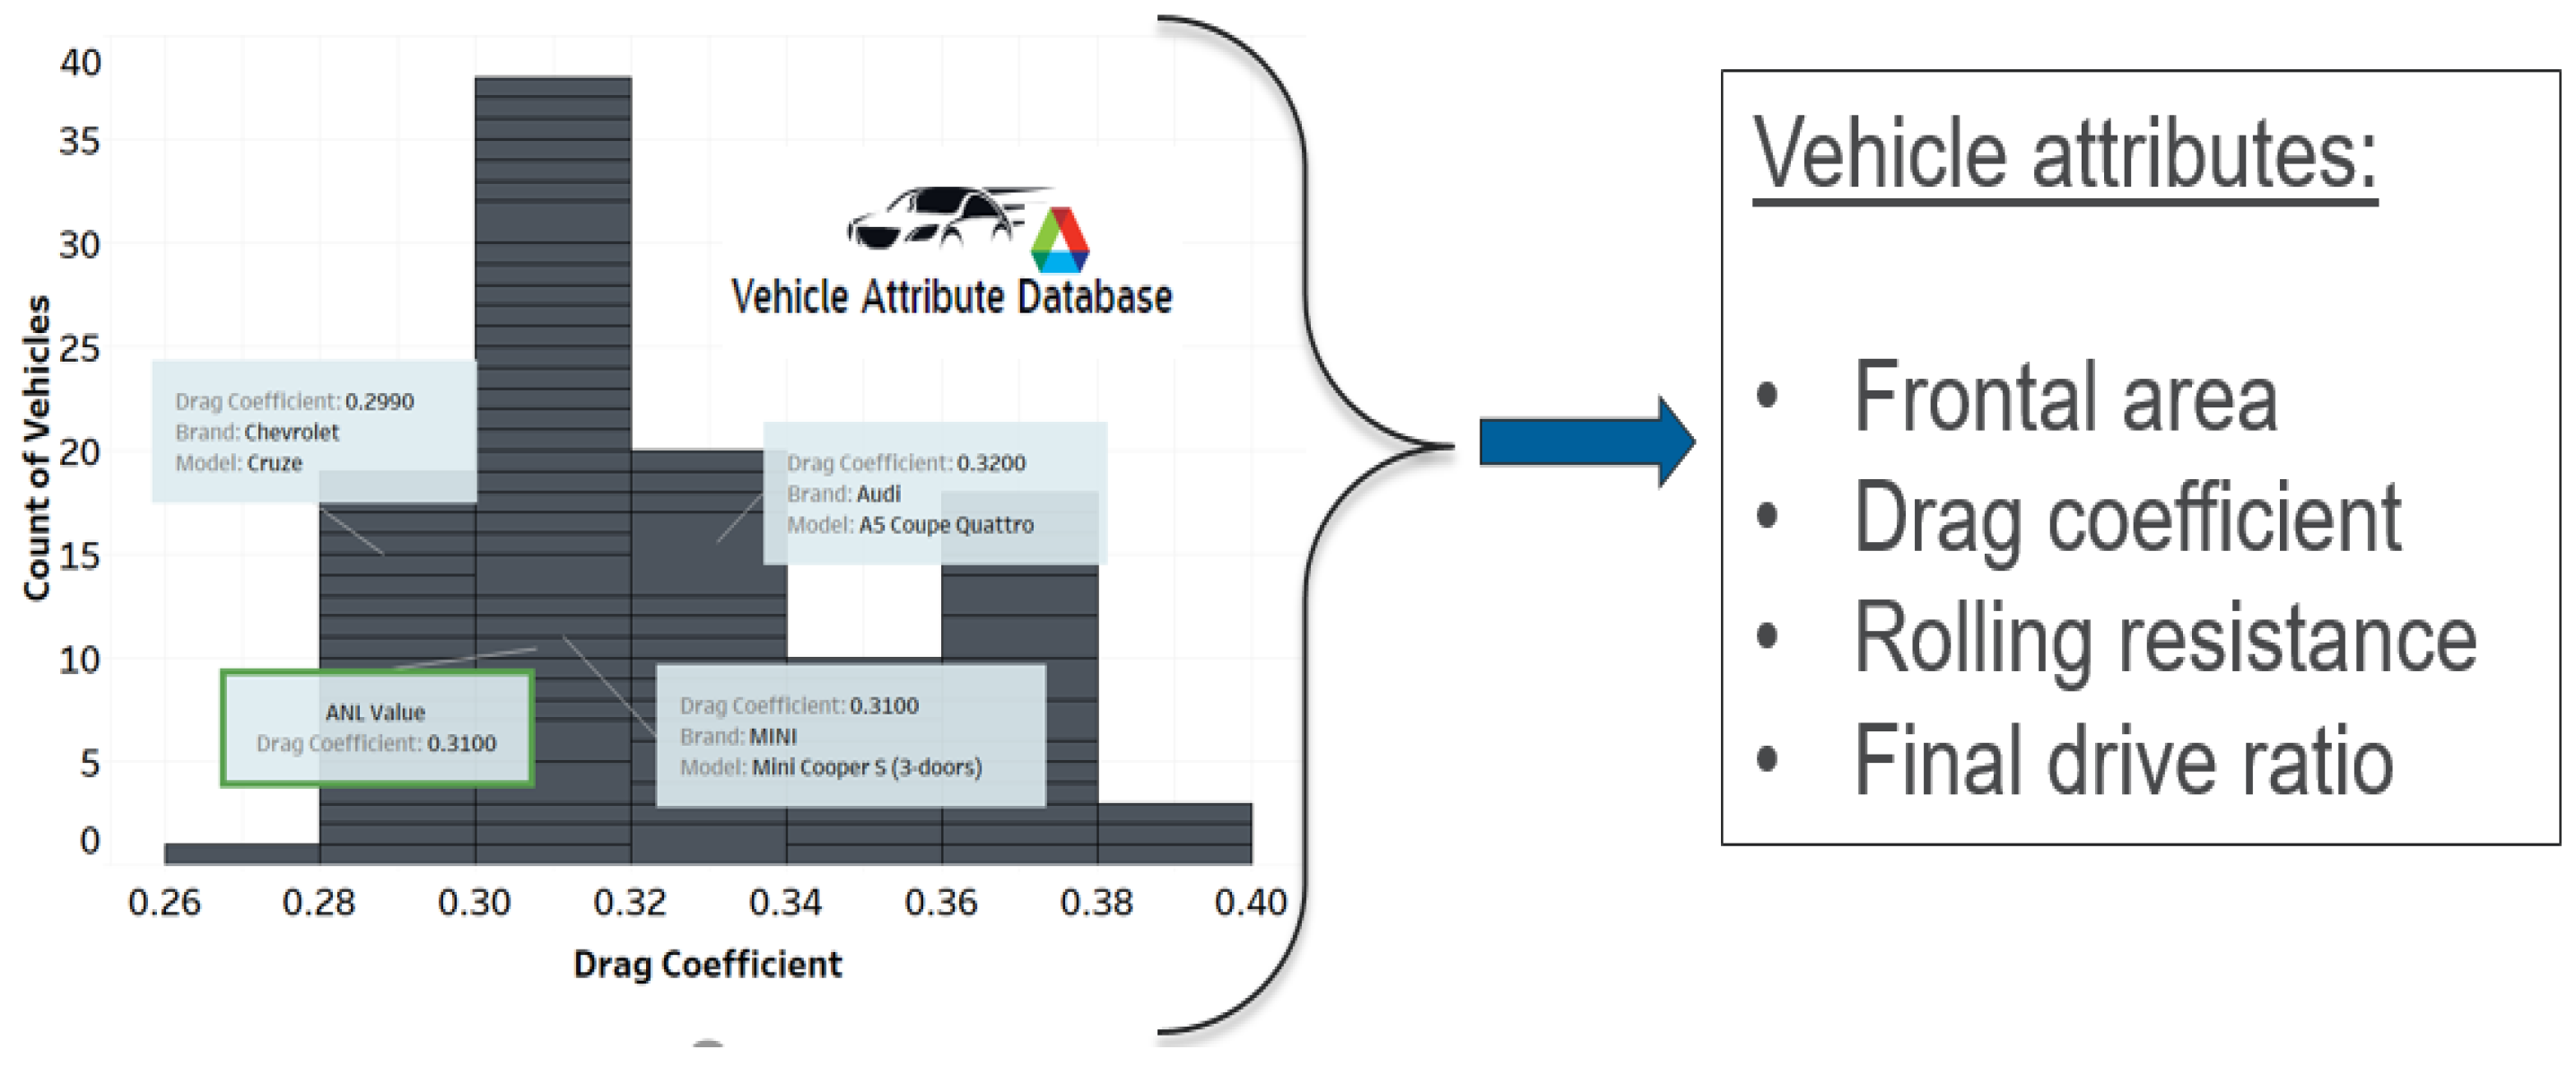
As part of this study, the baseline vehicle assumptions in Autonomie have been updated using multiple databases. The vehicle characteristic attributes (frontal area, drag coefficients, etc.) have been defined by evaluating the market trends, as shown in
Figure 3.
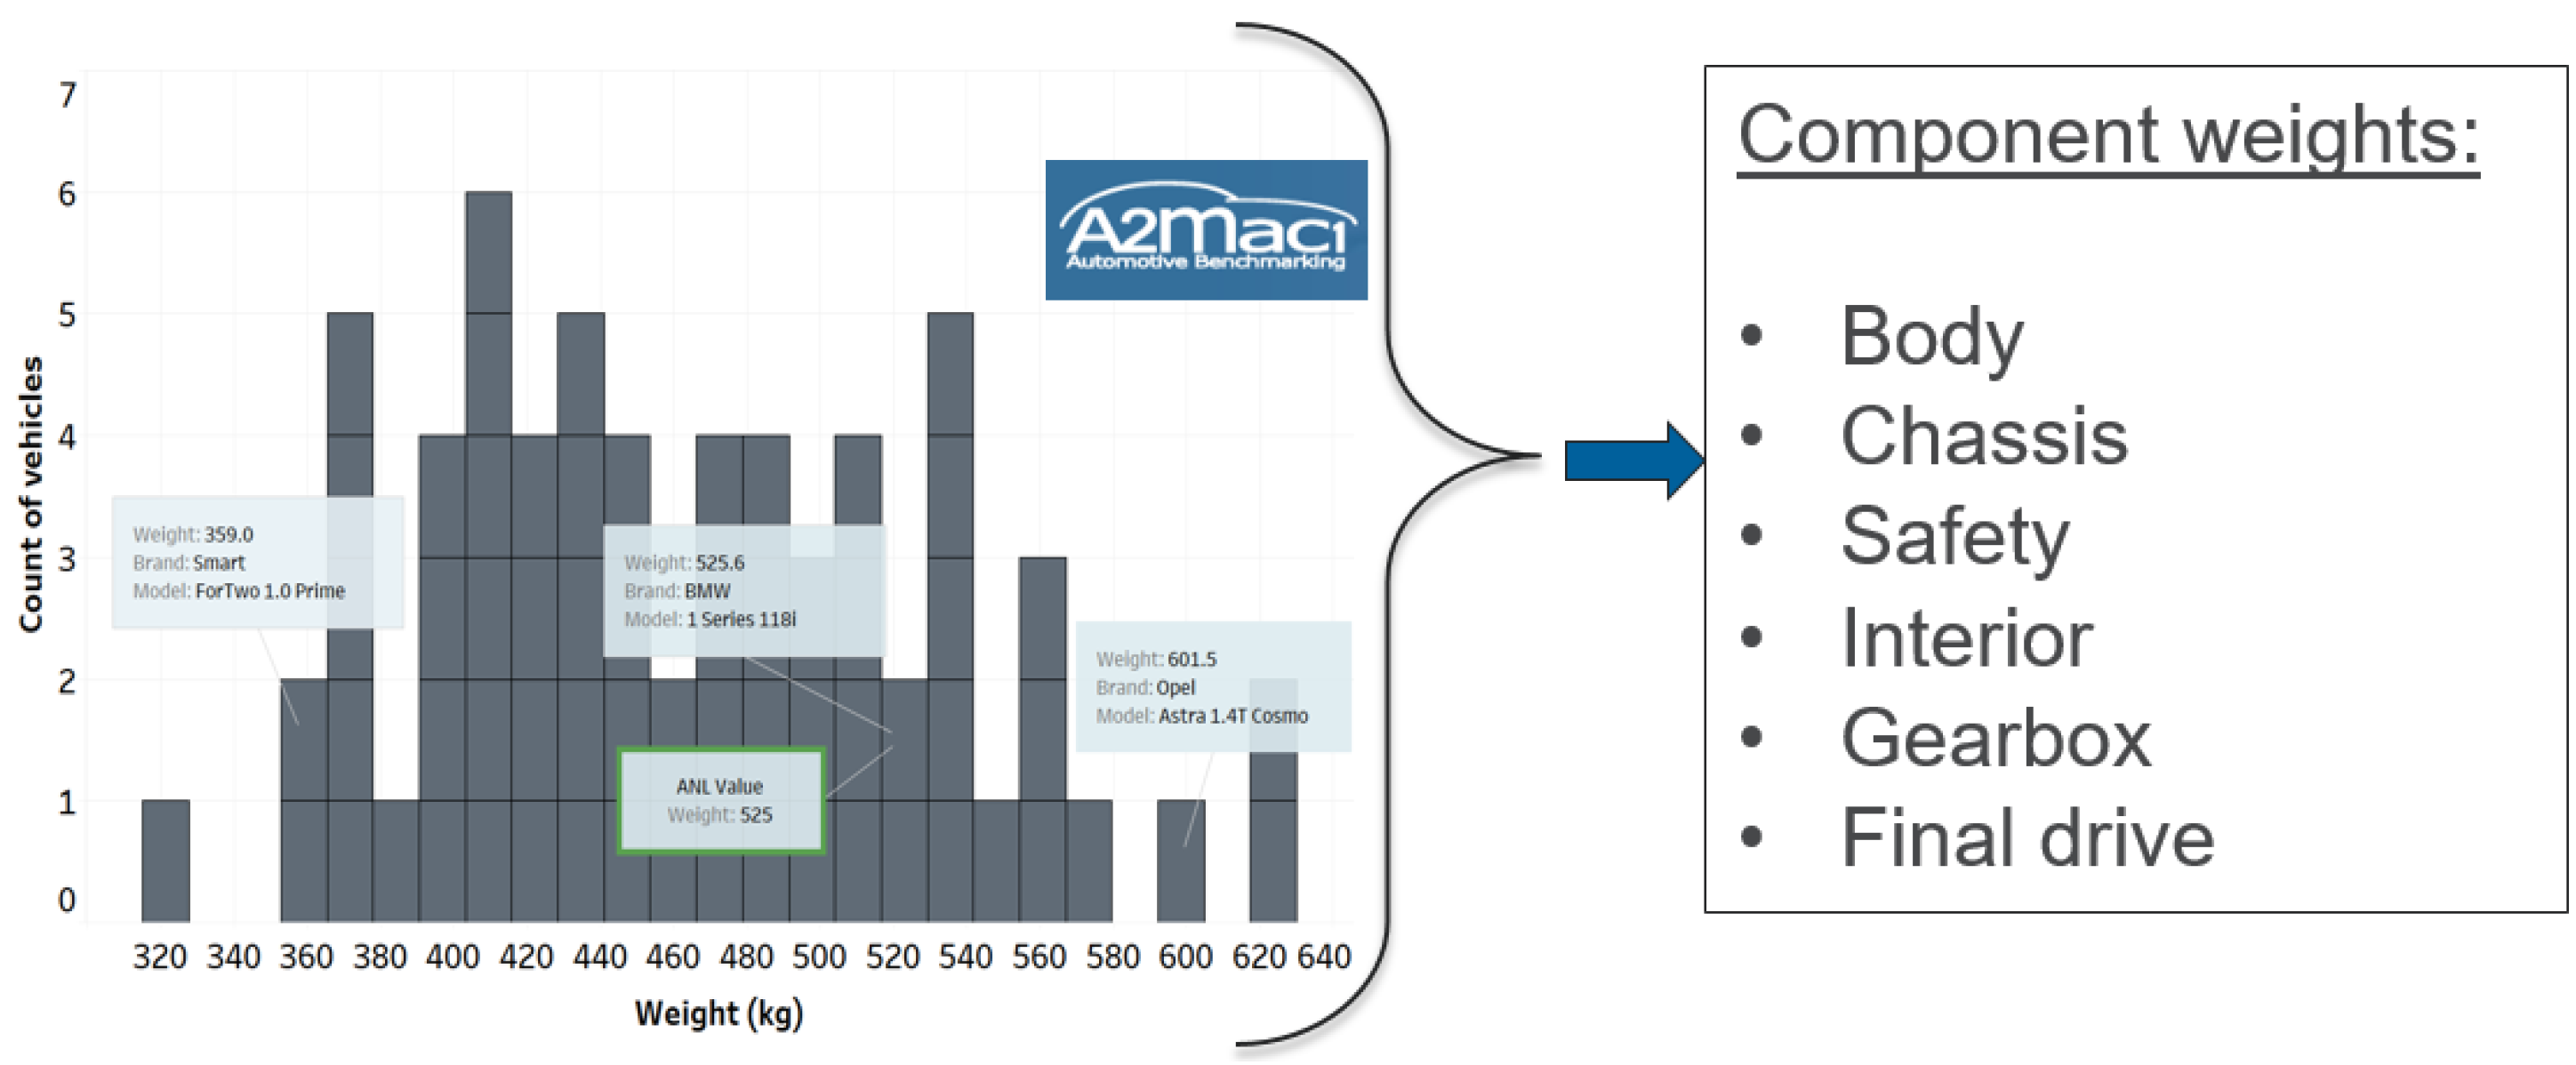
Similarly, the vehicle component weights (such as body, chassis, interior, safety, etc.) have been redefined, as shown in
Figure 4.
Table 1 lists the different vehicle classifications defined for various performance metrics (0–60 mph acceleration time) in seconds, as well as corresponding vehicle attributes.
Table 2 summarizes the main target assumptions associated with the different technologies over time. The vehicle simulations (and results to follow) represent the “laboratory years” 2015, 2020, 2025, 2030, and 2045; however, the assumed values from years 2015, 2020, 2025, and 2045 have been provided in the table, for simplicity.
4. Vehicle Sizing Process
Because of the limited feasibility of sizing individual vehicle components, a generic power-to-weight (P/W) ratio is maintained across the different powertrains that are sized. An inconsistency in the different technologies results from the impact of component maximum torque curves. As a result, each vehicle is sized independently to meet specific vehicle technical specifications (VTSs).
Incorrect sizing of components leads to differences in both energy consumption and cost which influence the results accordingly.
On this basis, several automated sizing algorithms have been developed in Autonomie to provide a fair comparison among technologies. The different algorithms have been defined depending on the powertrain (i.e., conventional, power-split, series, electric) and the application (i.e., HEV, PHEV).
All sizing algorithms follow the same concept: the vehicle is built from the bottom up, meaning that each component-related assumption (specific power, efficiency, and so on) is taken into account to define the entire set of vehicle attributes (vehicle curb weight, and so forth). The process is recursive in the sense that the main component characteristics (maximum power, vehicle weight, and so on) are influenced accordingly until all of the VTSs are met. On average, the sizing algorithm takes between 5 and 10 iterations to converge.
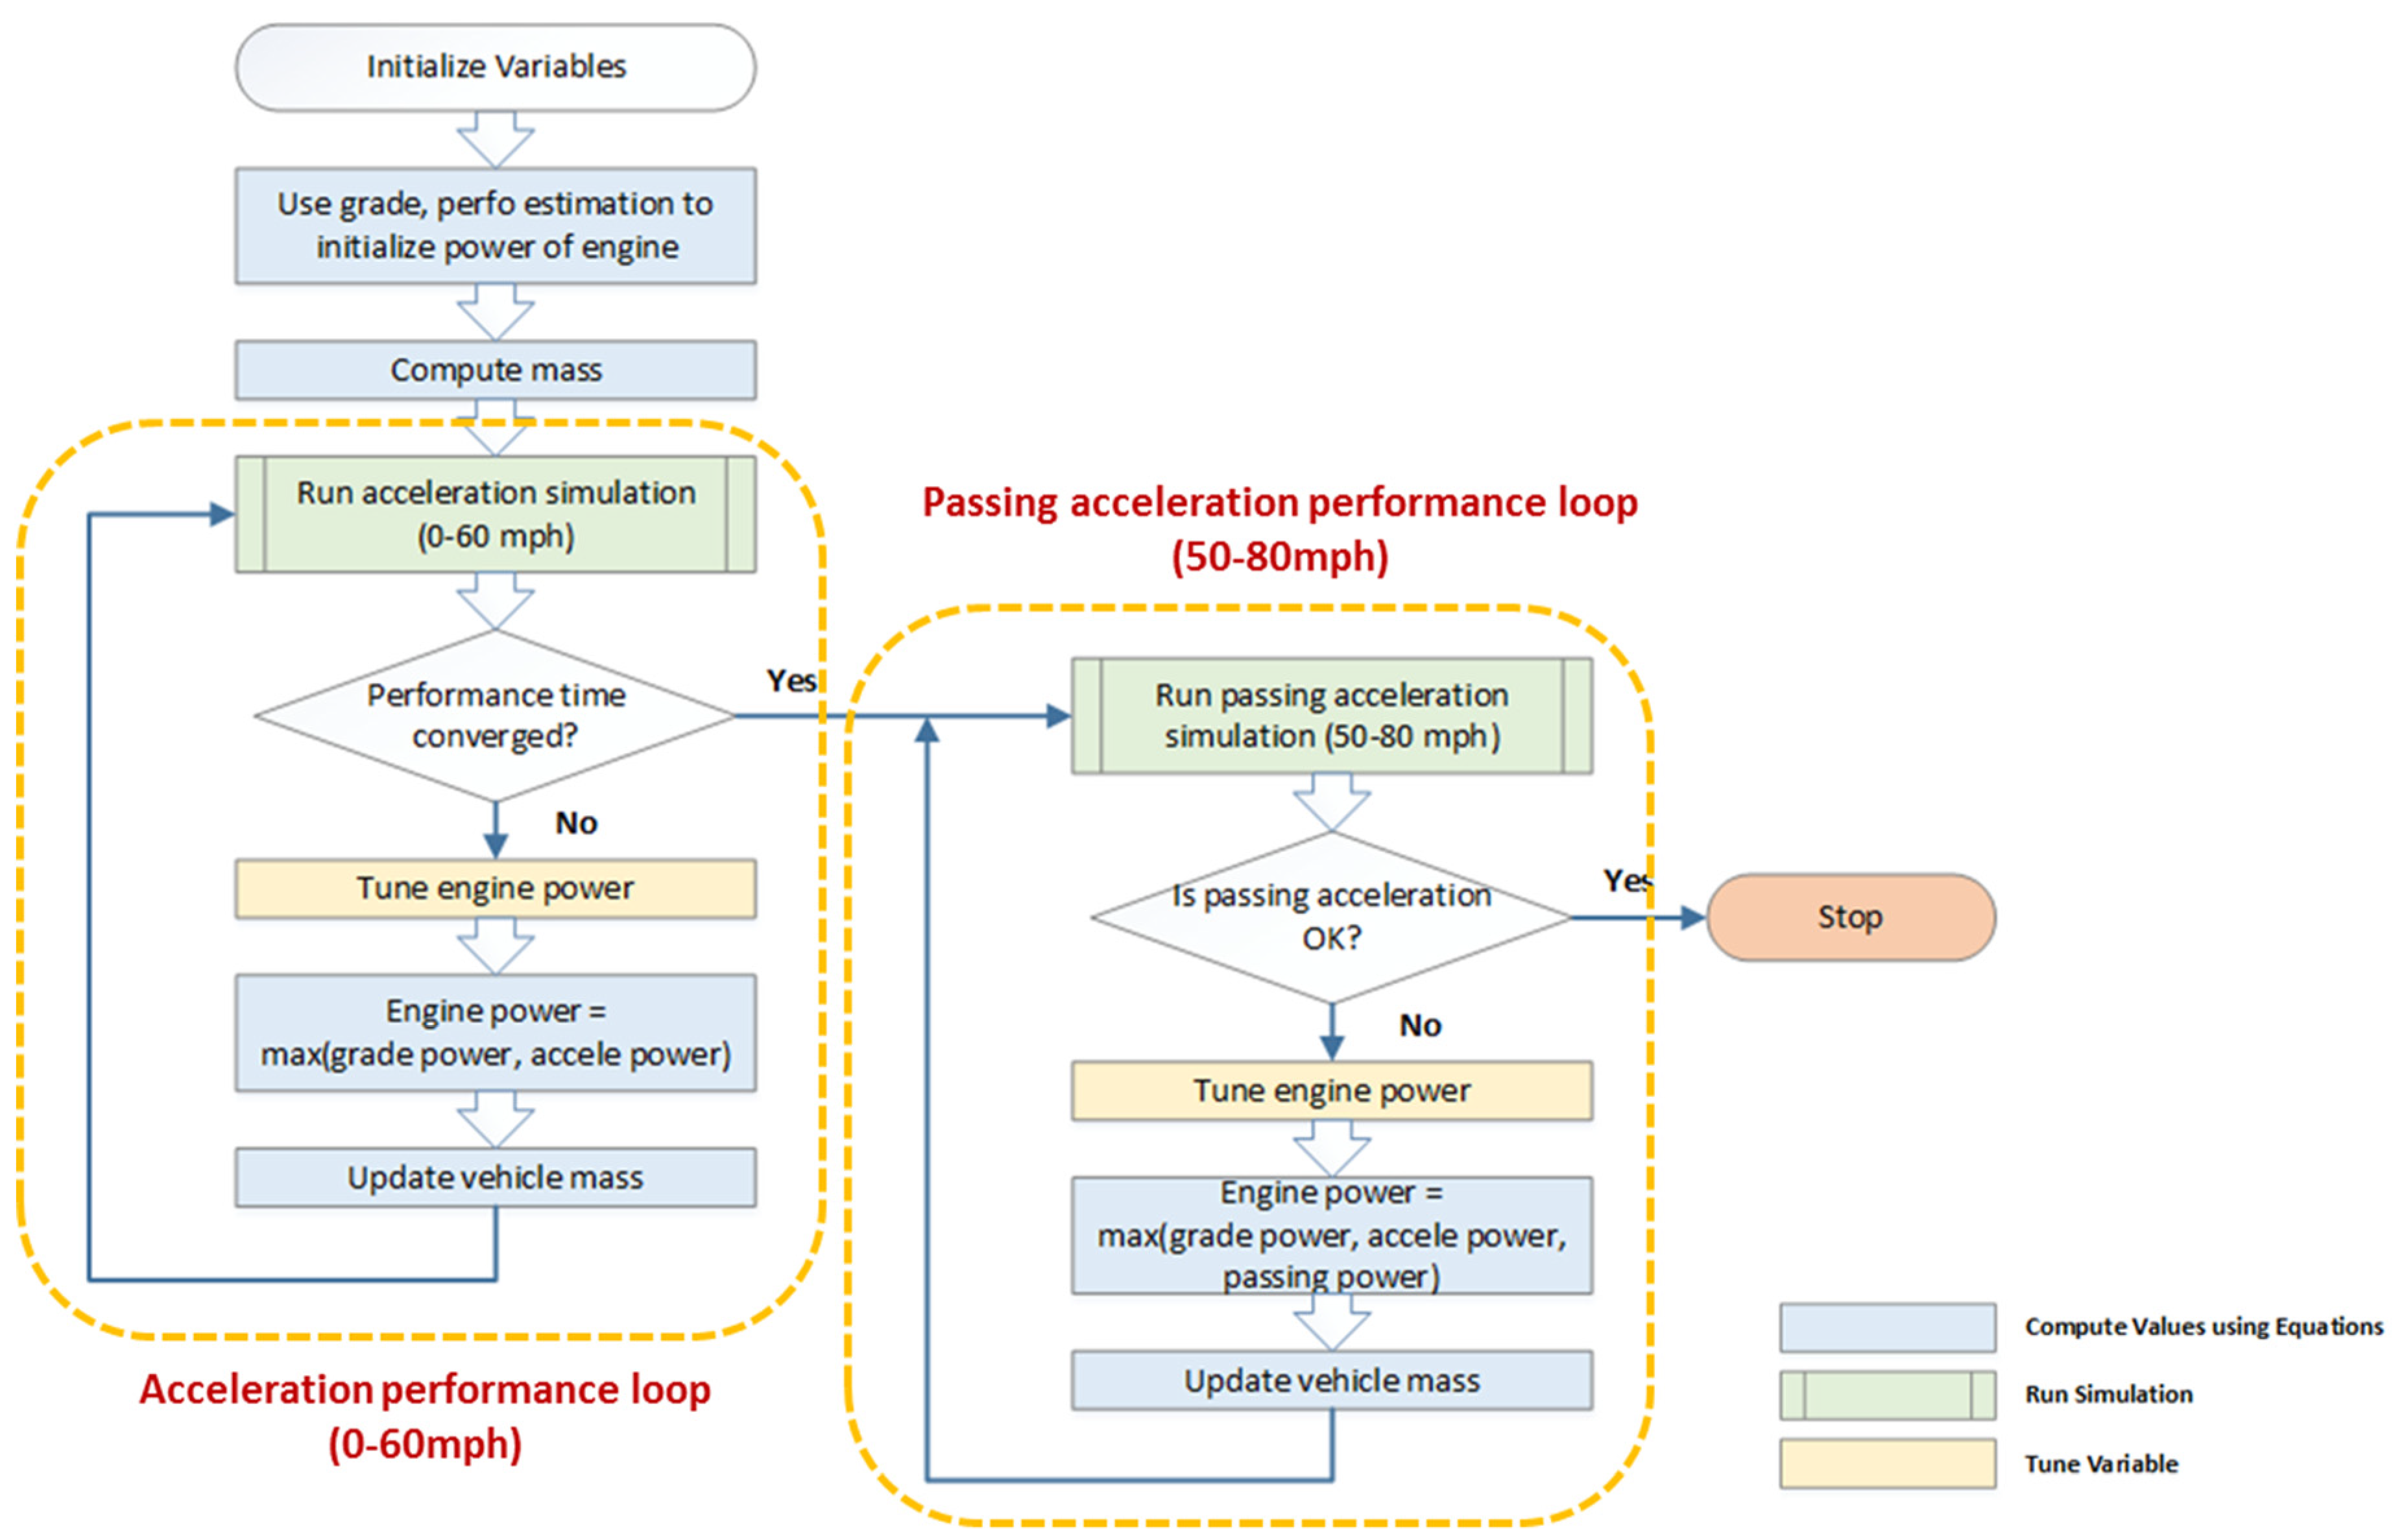
Figure 5 illustrates the different processes involved in sizing a conventional vehicle.
The full report [
5] details the different vehicle sizing processes for the various powertrains (HEVs, PHEVs, and BEVs).
5. Results & Observations
5.1. Component Sizes
5.1.1. Engine Power
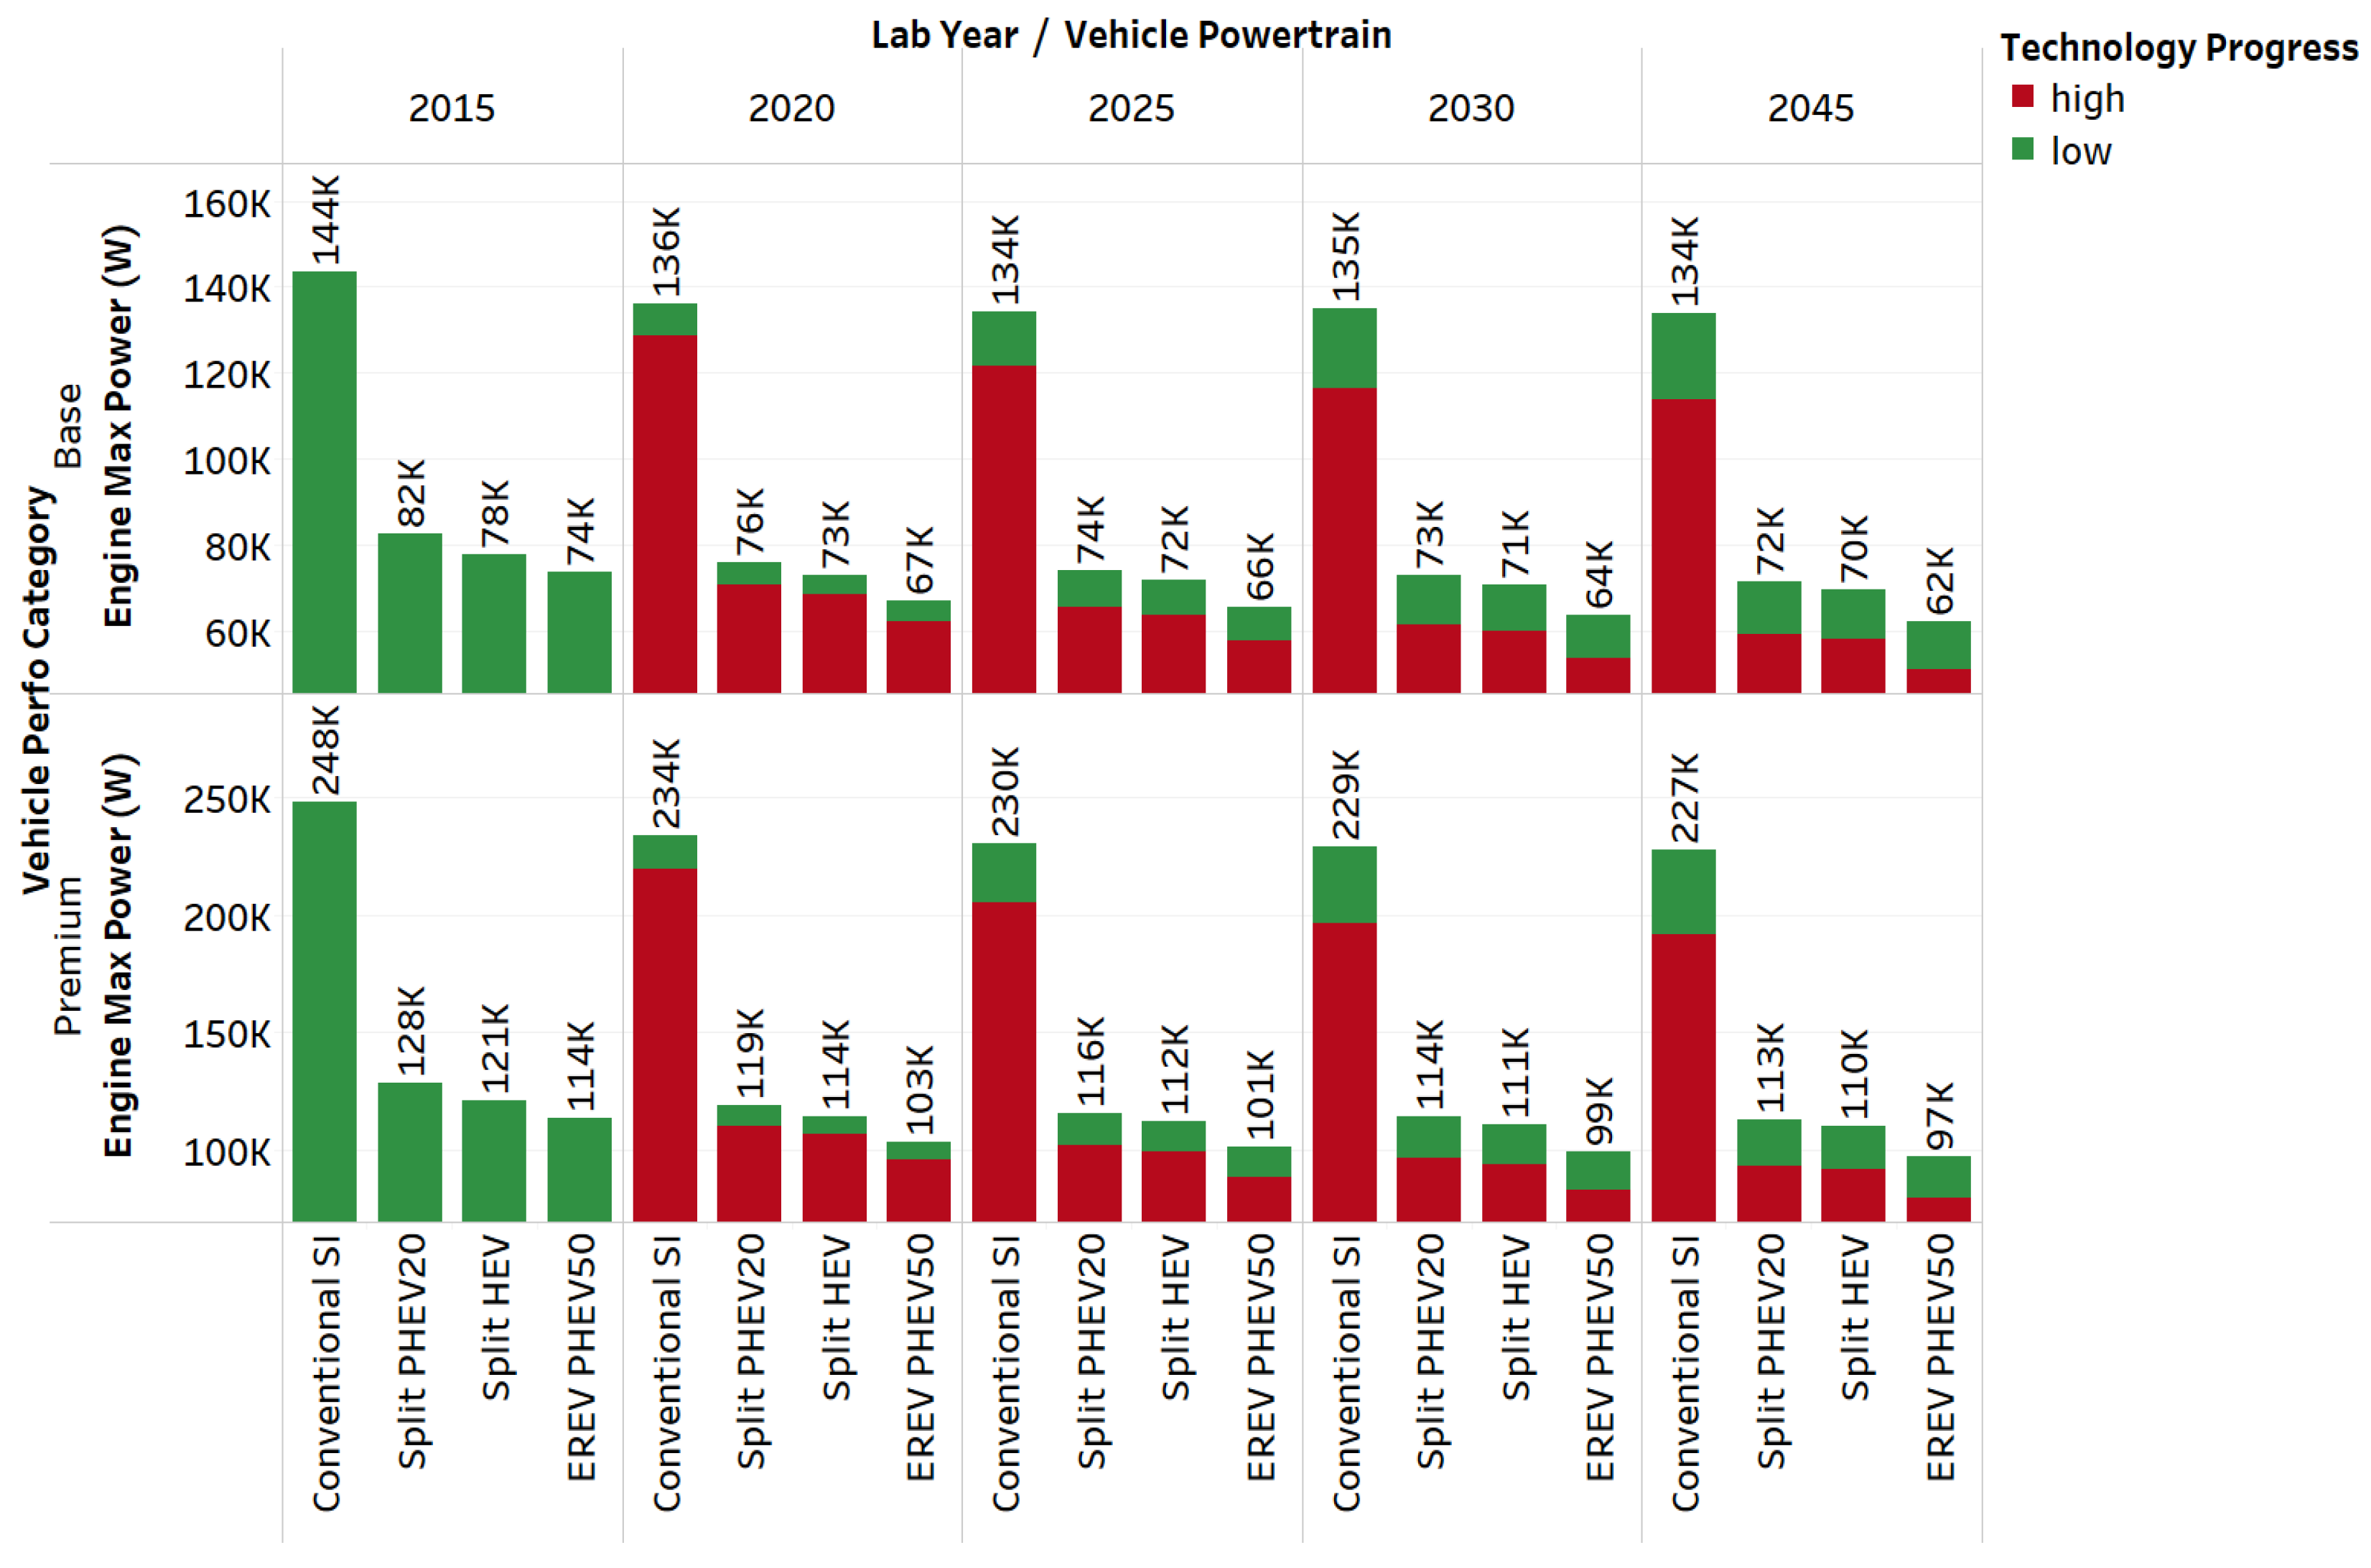
Figure 6 shows the engine peak power for midsize vehicles across the different electrified powertrains for the different performance categories.
It has been observed that over time, the engine peak power decreases across the different powertrains. The effects of vehicle lightweighting with time primarily explain the trend observed. The more aggressive performance targets set for the premium category can explain the difference observed between the base and premium categories.
5.1.2. Motor Power
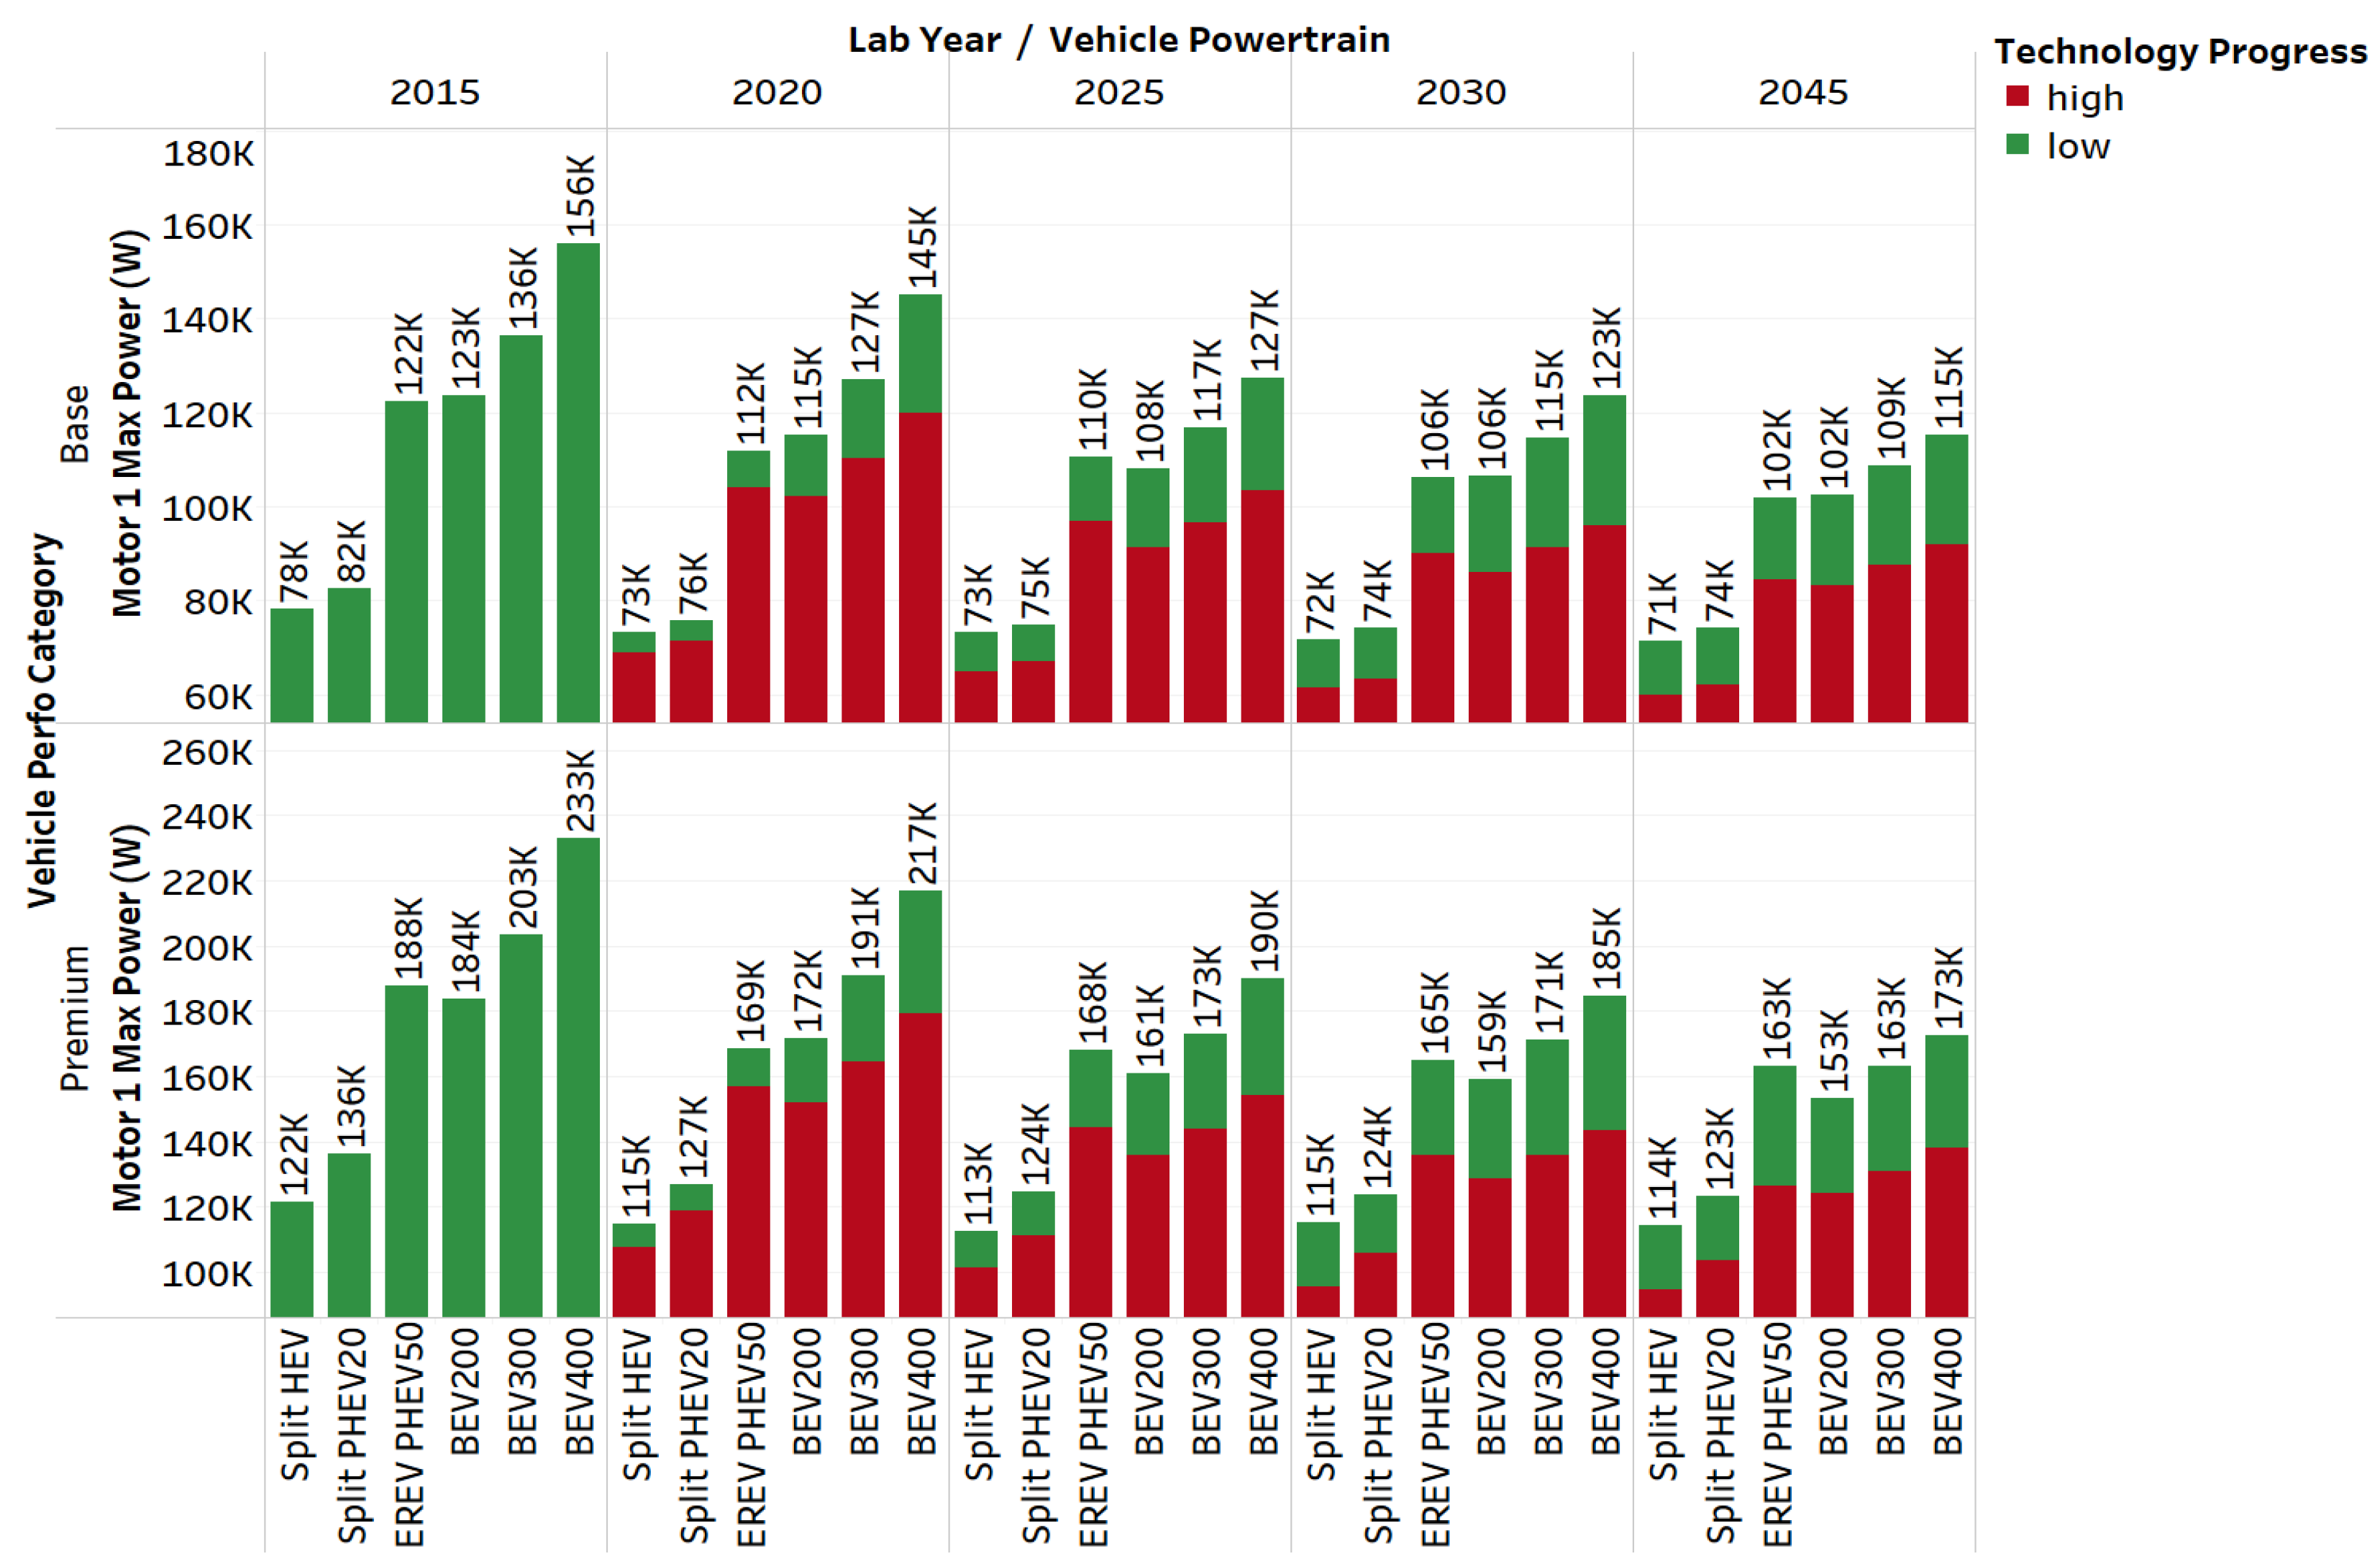
Figure 7 shows the motor peak power for midsize vehicles across the different electrified powertrains for the different performance categories.
Similar to what we observe for the engine power, the motor power also decreases across the different powertrains in future years. Vehicle lightweighting, along with other aggressive targets for different components’ weights (electric machine, battery, etc.), significantly contributes to motor downsizing.
5.1.3. Battery Power
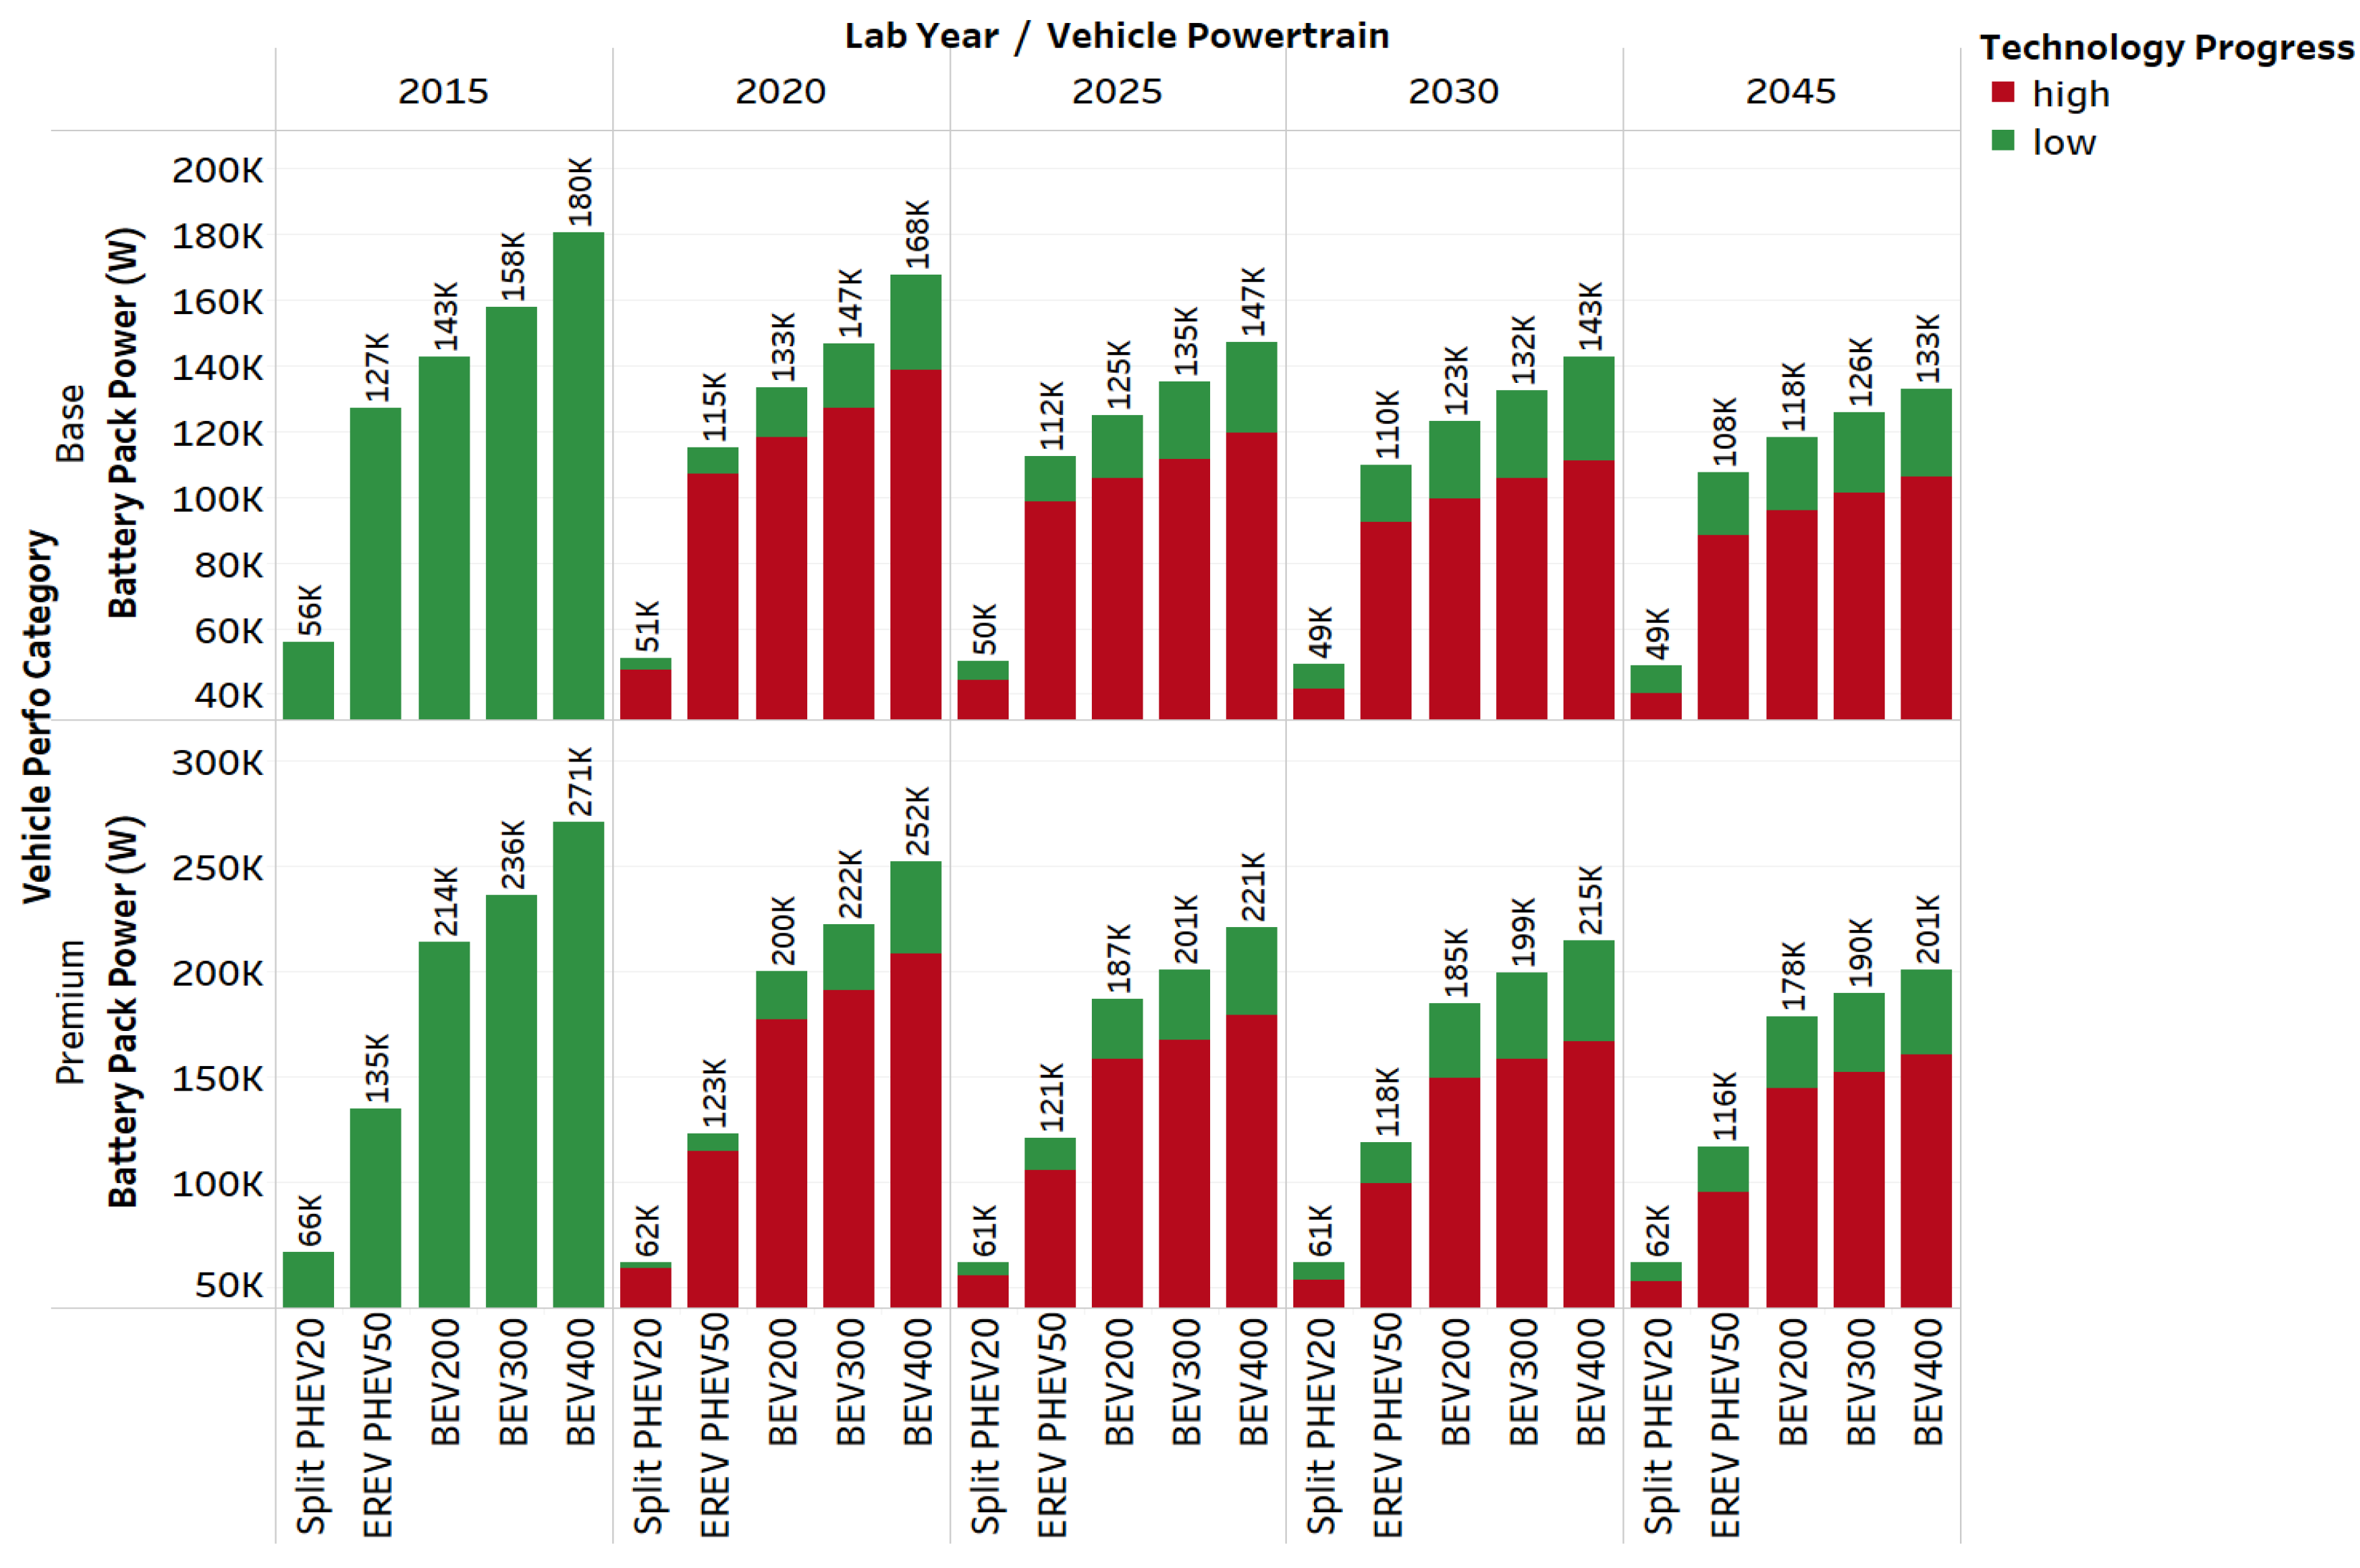
Figure 8 shows the battery peak power for midsize vehicles across the different electrified powertrains for the different performance categories.
The total battery power requirement decreases over time across the different powertrains. The battery power also increases with increasing AER values. The significant difference in battery power from 20AER to 50AER (and beyond) is explained by the more aggressive US06 cycle that 50AER (and beyond) is sized on in the electric vehicle (EV) mode as compared to Urban Dynamometer Driving Schedule (UDDS) for 20AER.
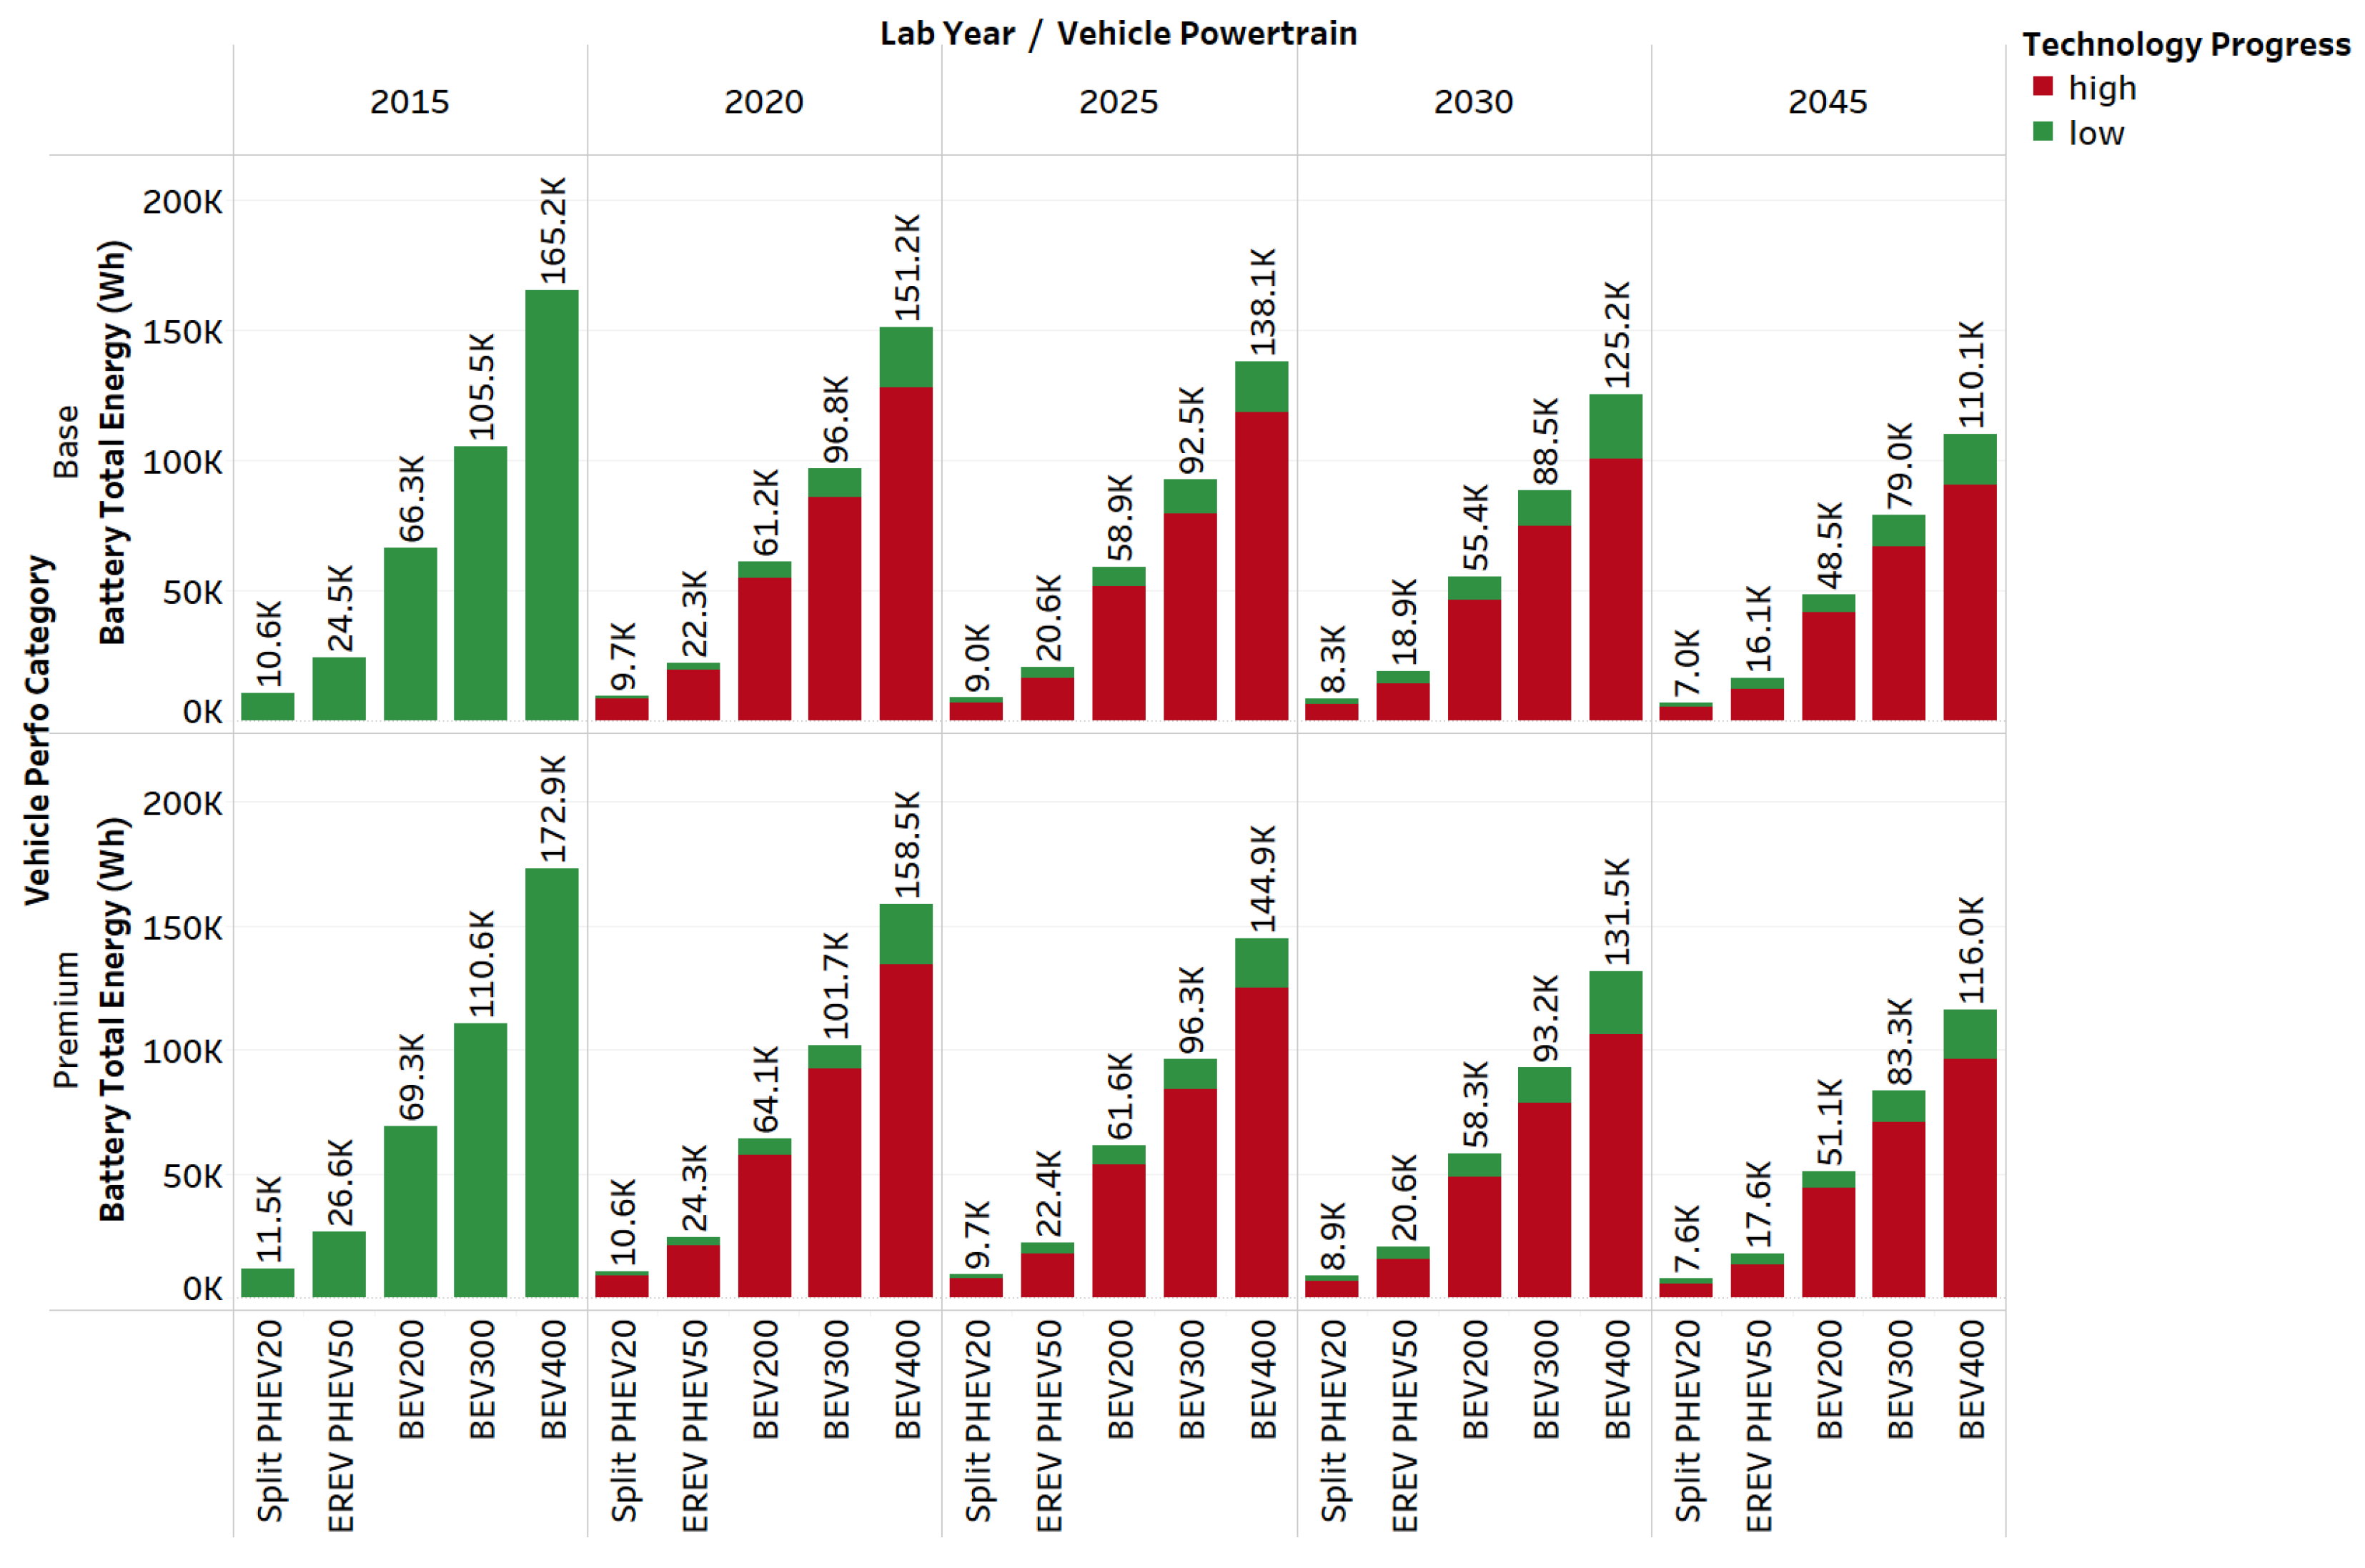
5.1.4. Battery Total Energy
Figure 9 shows the total battery energy required for midsize vehicles across the different electrified powertrains for the different performance categories.
It has been observed that the total battery total required also decreases similarly over time. For the BEV200, the battery pack total energy decreases by 57% for 2045 compared to 2015. This decrement reaches almost an 80% reduction in total battery pack energy for the BEV400. With higher range BEVs, the reduction observed is much greater because of the combined effects of advances in vehicle technology.
5.2. Energy Consumption
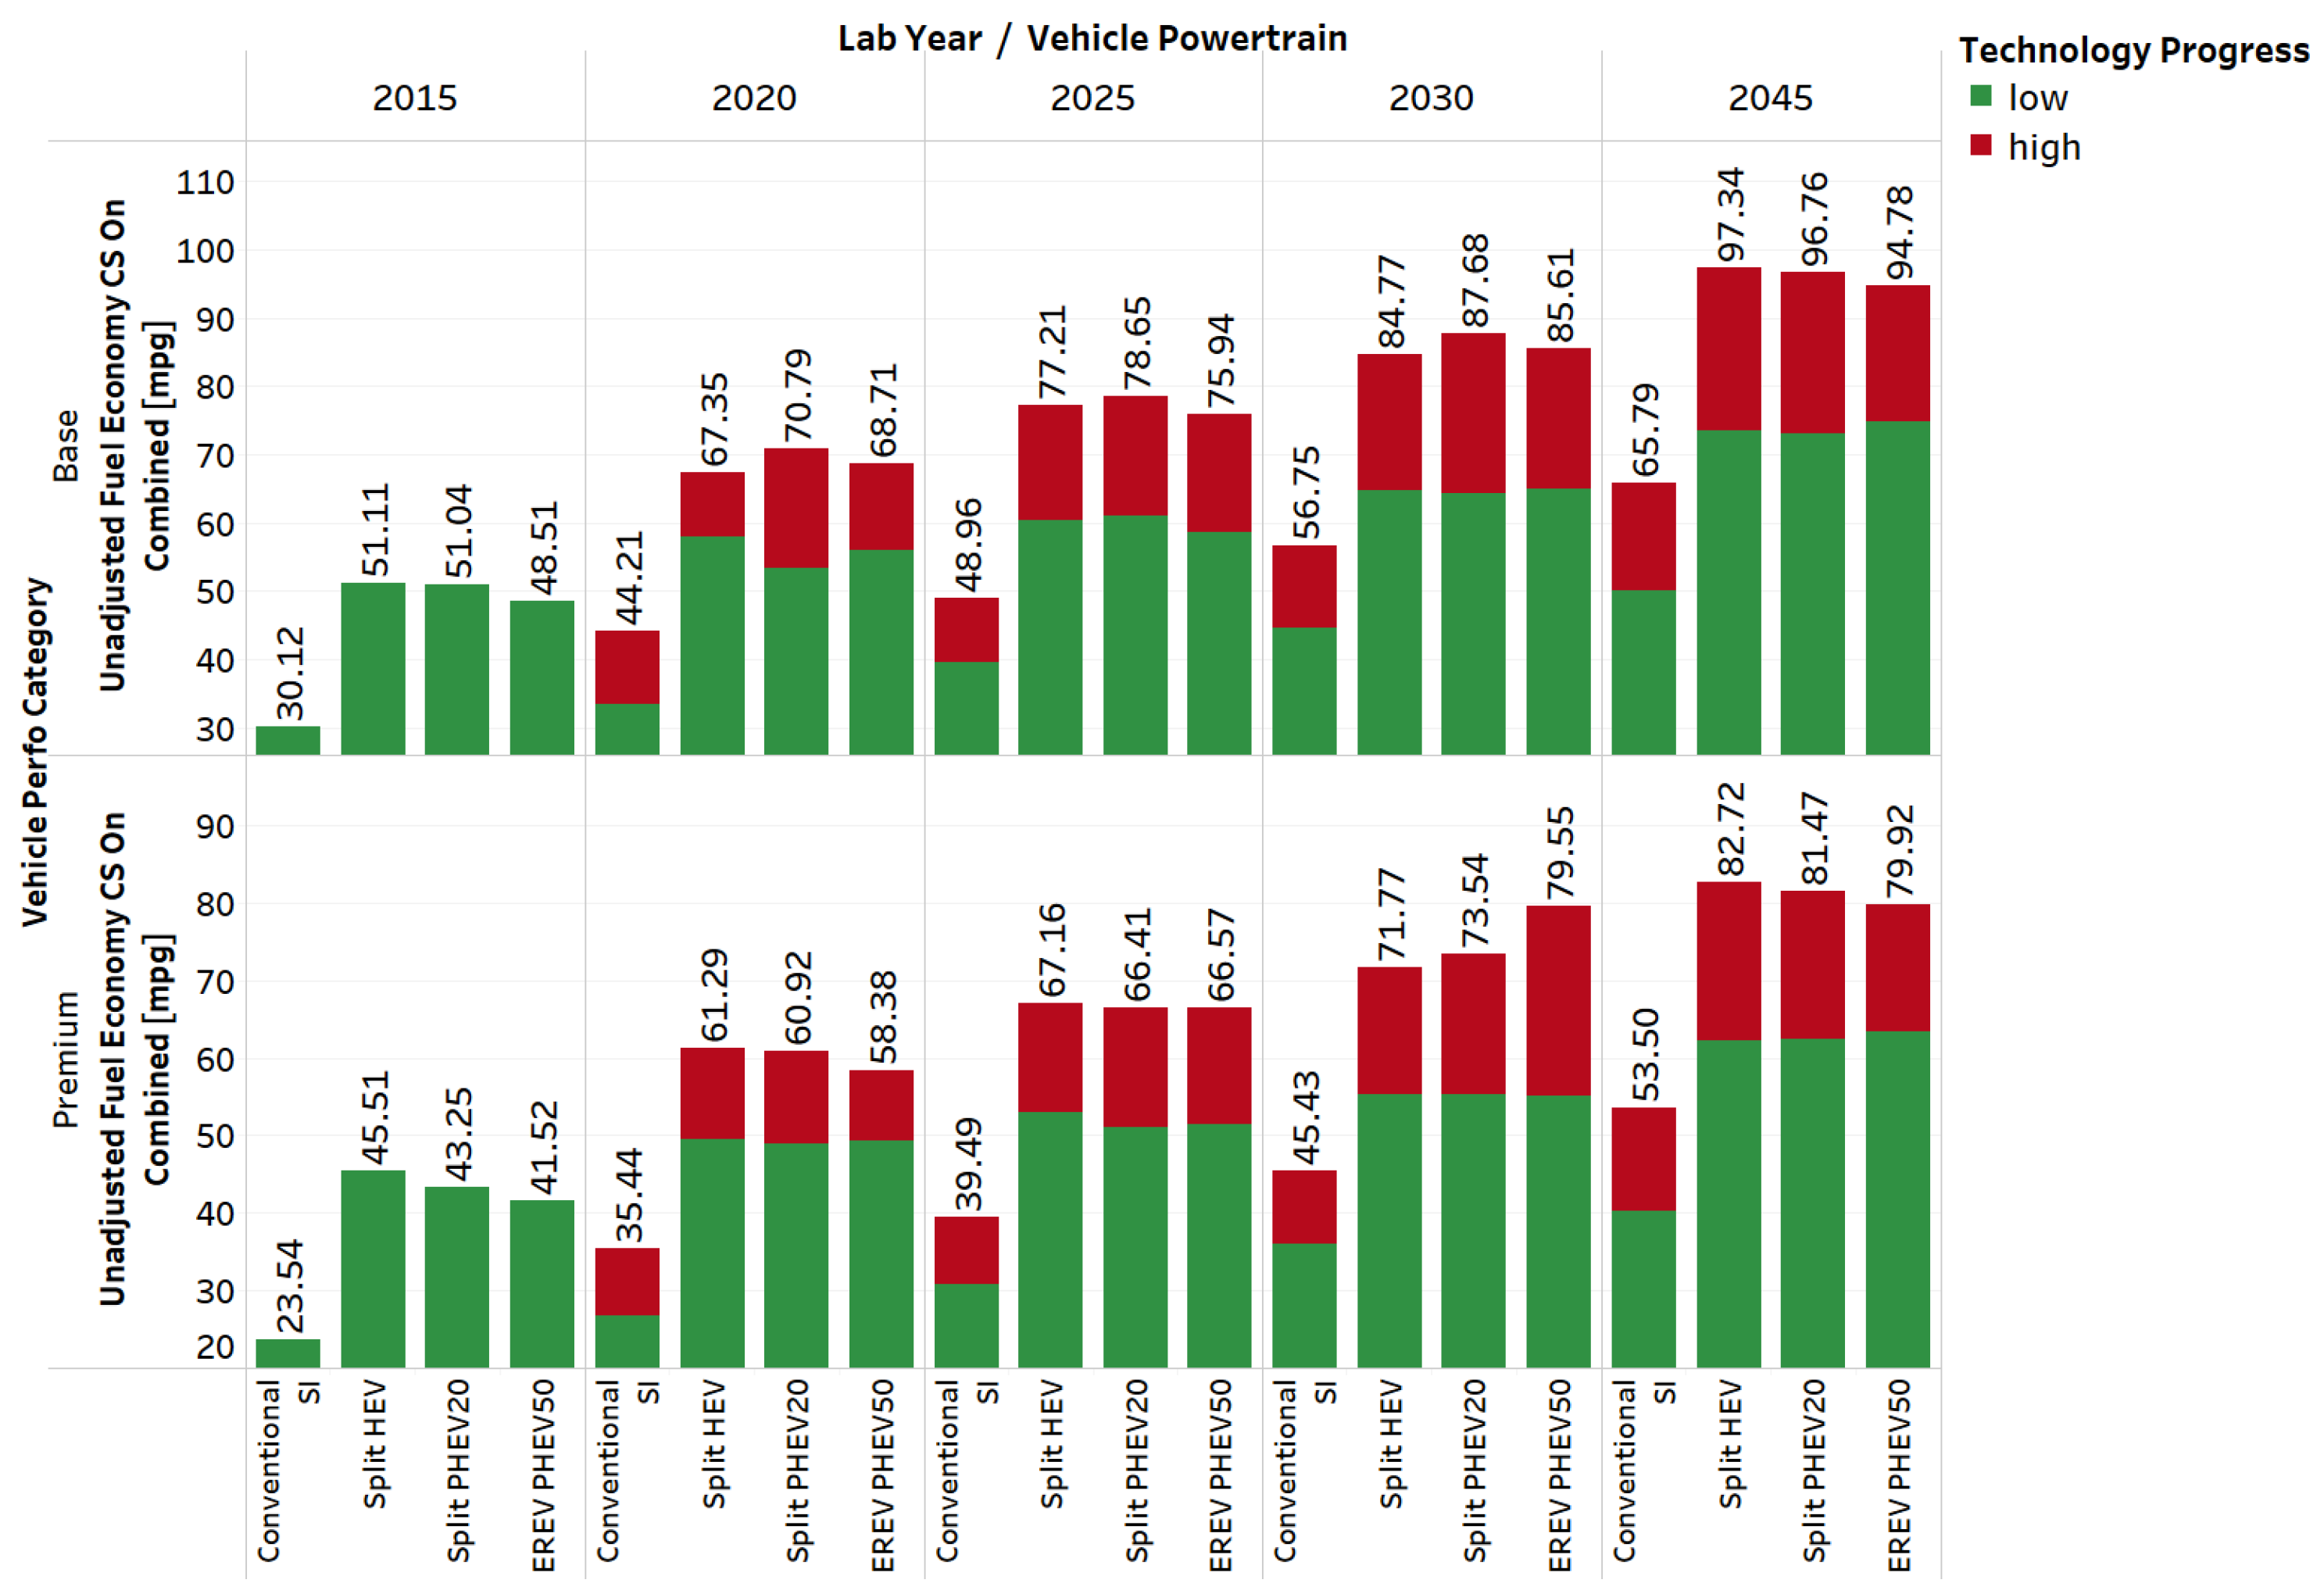
Figure 10 shows the unadjusted fuel economy of midsize vehicles across the different powertrains of the different performance categories.
The fuel economy of the different powertrains increases over time. The effect of the increments varies across the different electrified powertrains, owing to the varying component efficiency targets. The higher vehicle weights contributed by the higher weights of the components explain the difference in the fuel economy observed for the premium category compared to the base category.
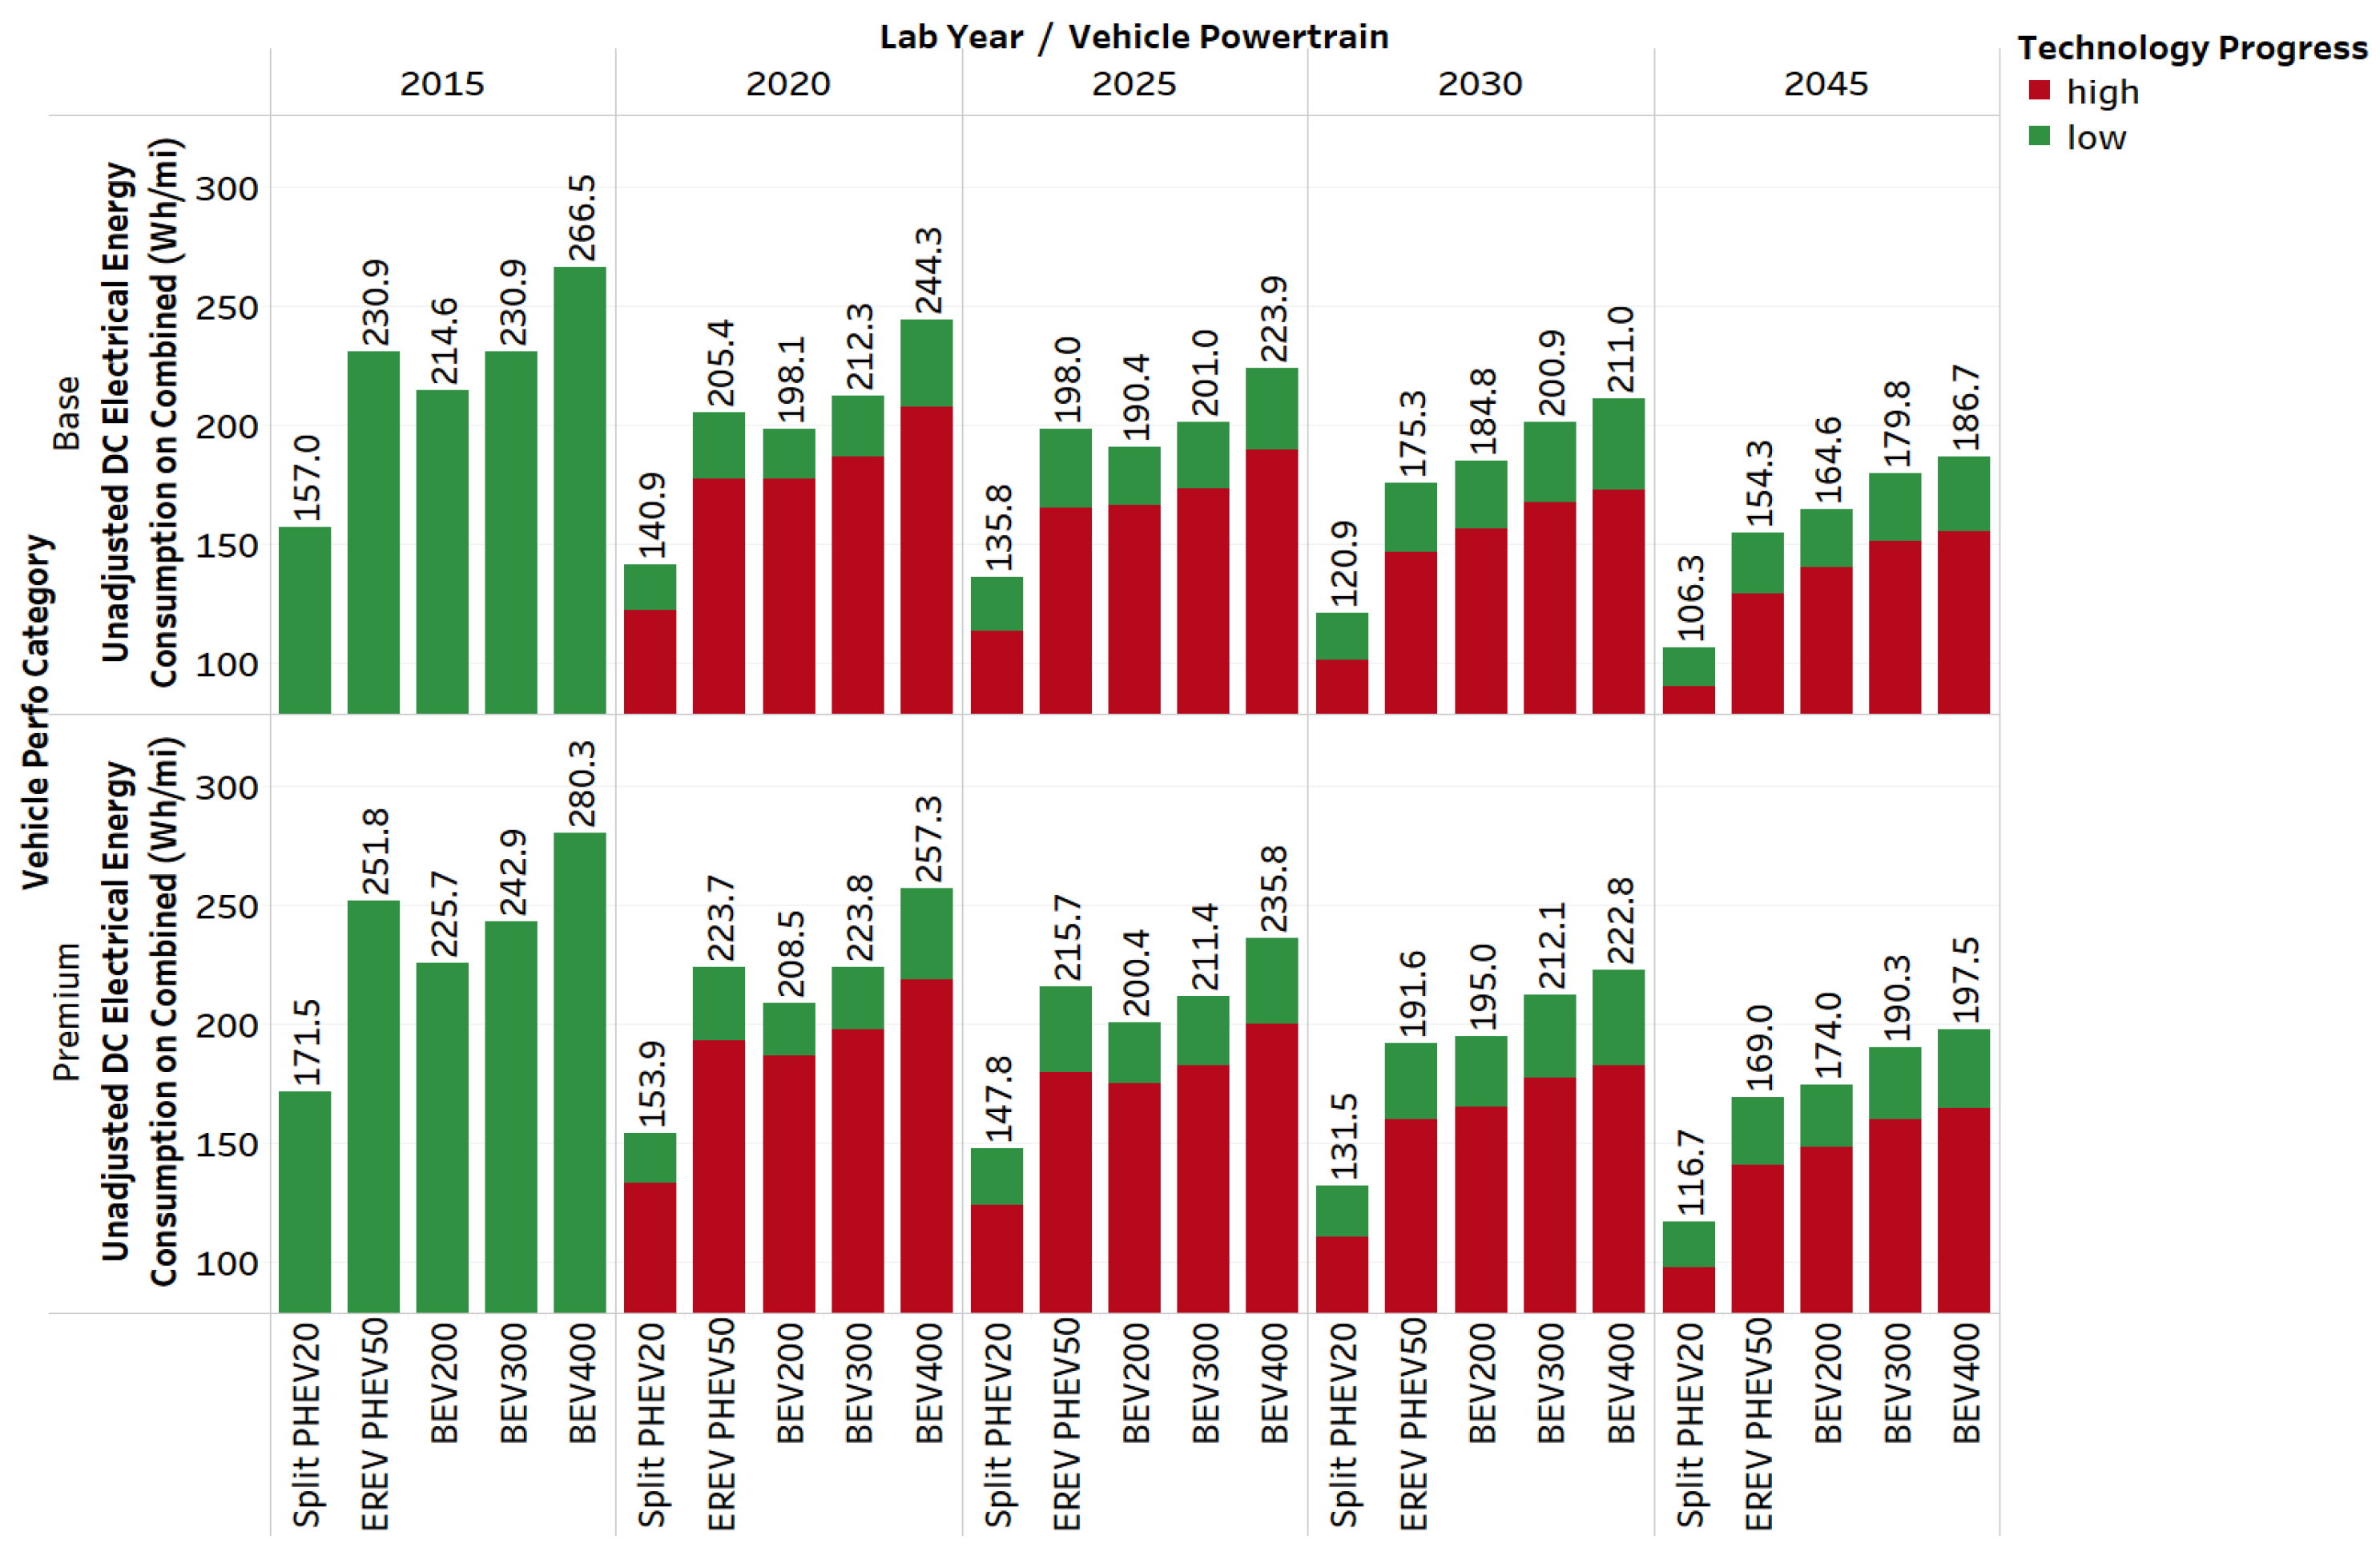
Figure 11 shows the unadjusted electrical energy consumption (utility-weighted for PHEVs) of midsize electrified vehicles for the different performance categories.
Over time, the electrical energy consumption decreases for the different electrified powertrains. The range of reduction varies for the different AERs, as well as the different performance categories.
5.3. Evolution of Electrified Powertrains
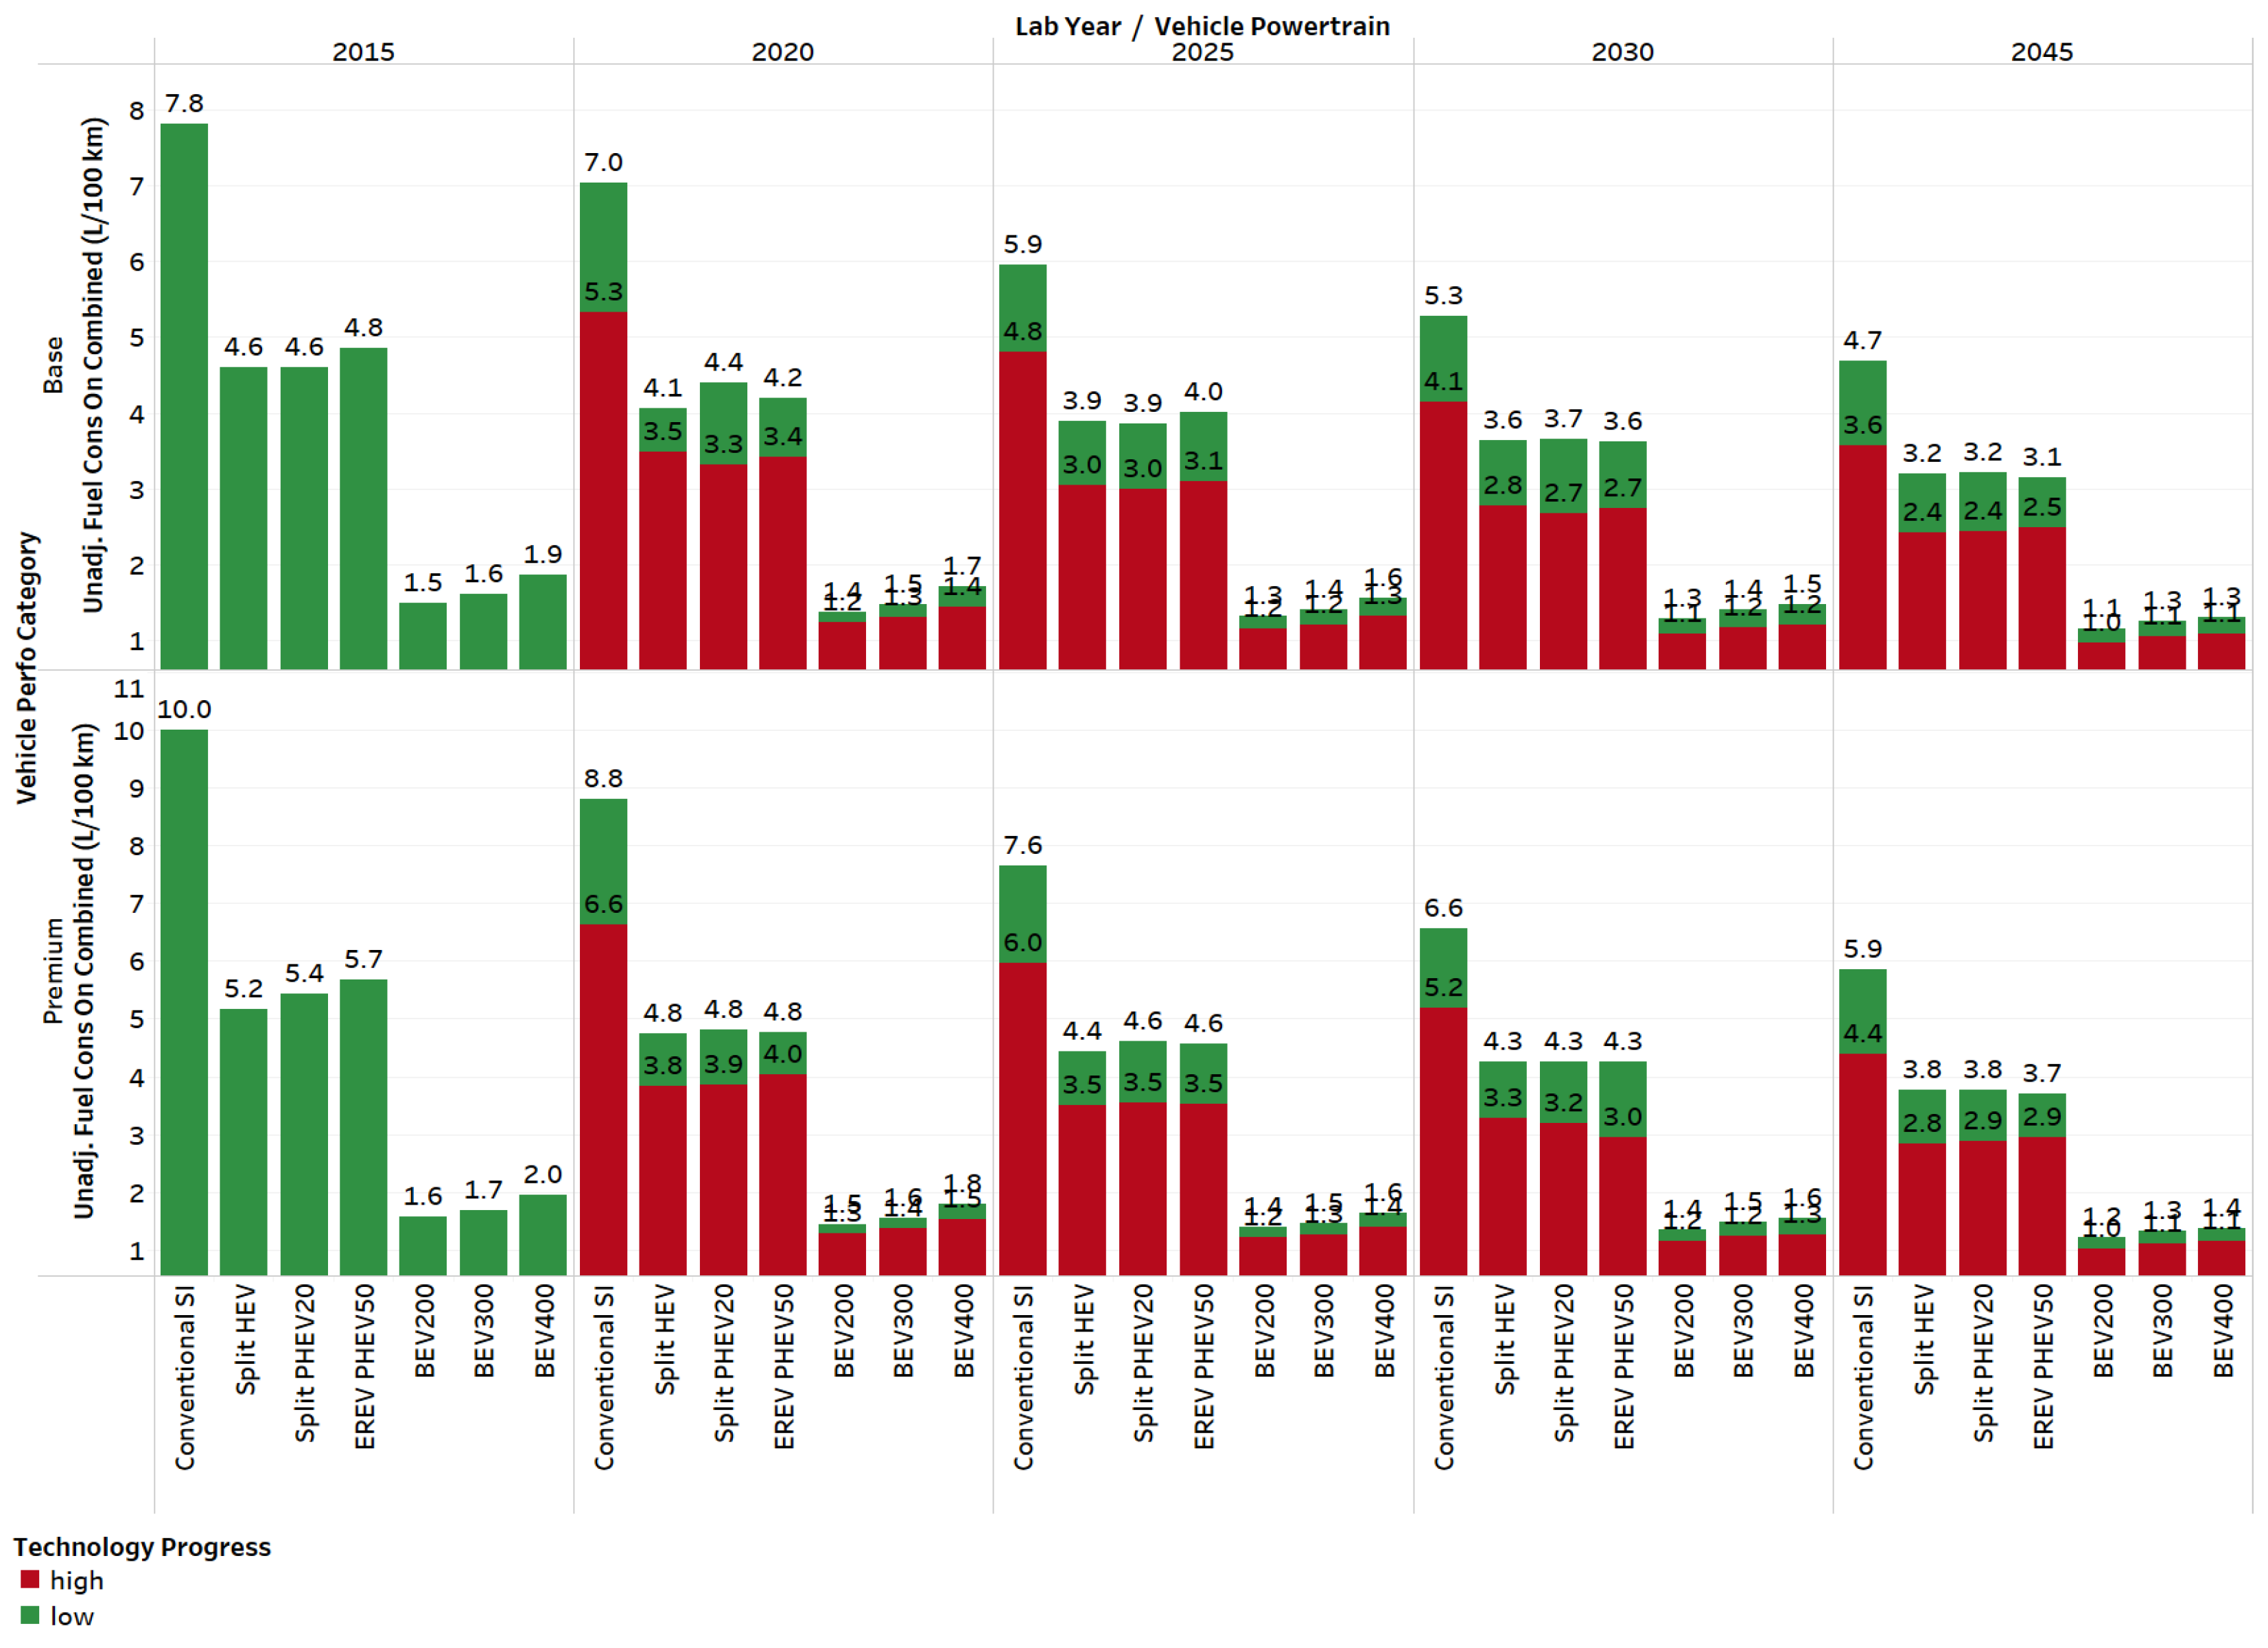
The comparison of the different midsize electrified powertrains and conventional gasoline vehicles in terms of fuel consumption is illustrated in
Figure 12. The labels “low” and “high” refer to the different technology performance cases.
The figure shows that the ratio follows a slowly decreasing trend line for HEVs and PHEVs. The midsize power-split HEV, PHEV20, and PHEV50 vehicles consume about 40–50% less fuel than conventional vehicles in laboratory year 2015, and the drop becomes about 30–40% in laboratory year 2045. This result shows that the advances in technology for conventional vehicles are much greater in the later years compared to those for power-split vehicles. The improvements in the fuel consumption of power-split HEVs are lower than those of conventional vehicles in later years.
Figure 12 also shows the evolution of BEVs of different AERs compared to that of conventional gasoline vehicles in the midsize vehicle class in terms of gasoline-equivalent fuel consumption. For the BEV200, the improvement in fuel consumption over that of conventional vehicles is reduced from 80% in laboratory year 2015 to about 77% in laboratory year 2045. For the BEV300, the improvement in fuel consumption over that of conventional vehicles is reduced from 79% to about 72% in 2045. For the BEV400, the improvement in fuel consumption over that of conventional vehicles decreases from 76% in 2015 to about 72% in 2045. This result shows that the evolution of conventional vehicles is much more aggressive than that of battery electric vehicles and leads to a much more aggressive reduction in fuel consumption than occurs in BEVs.
5.4. Cost Analysis
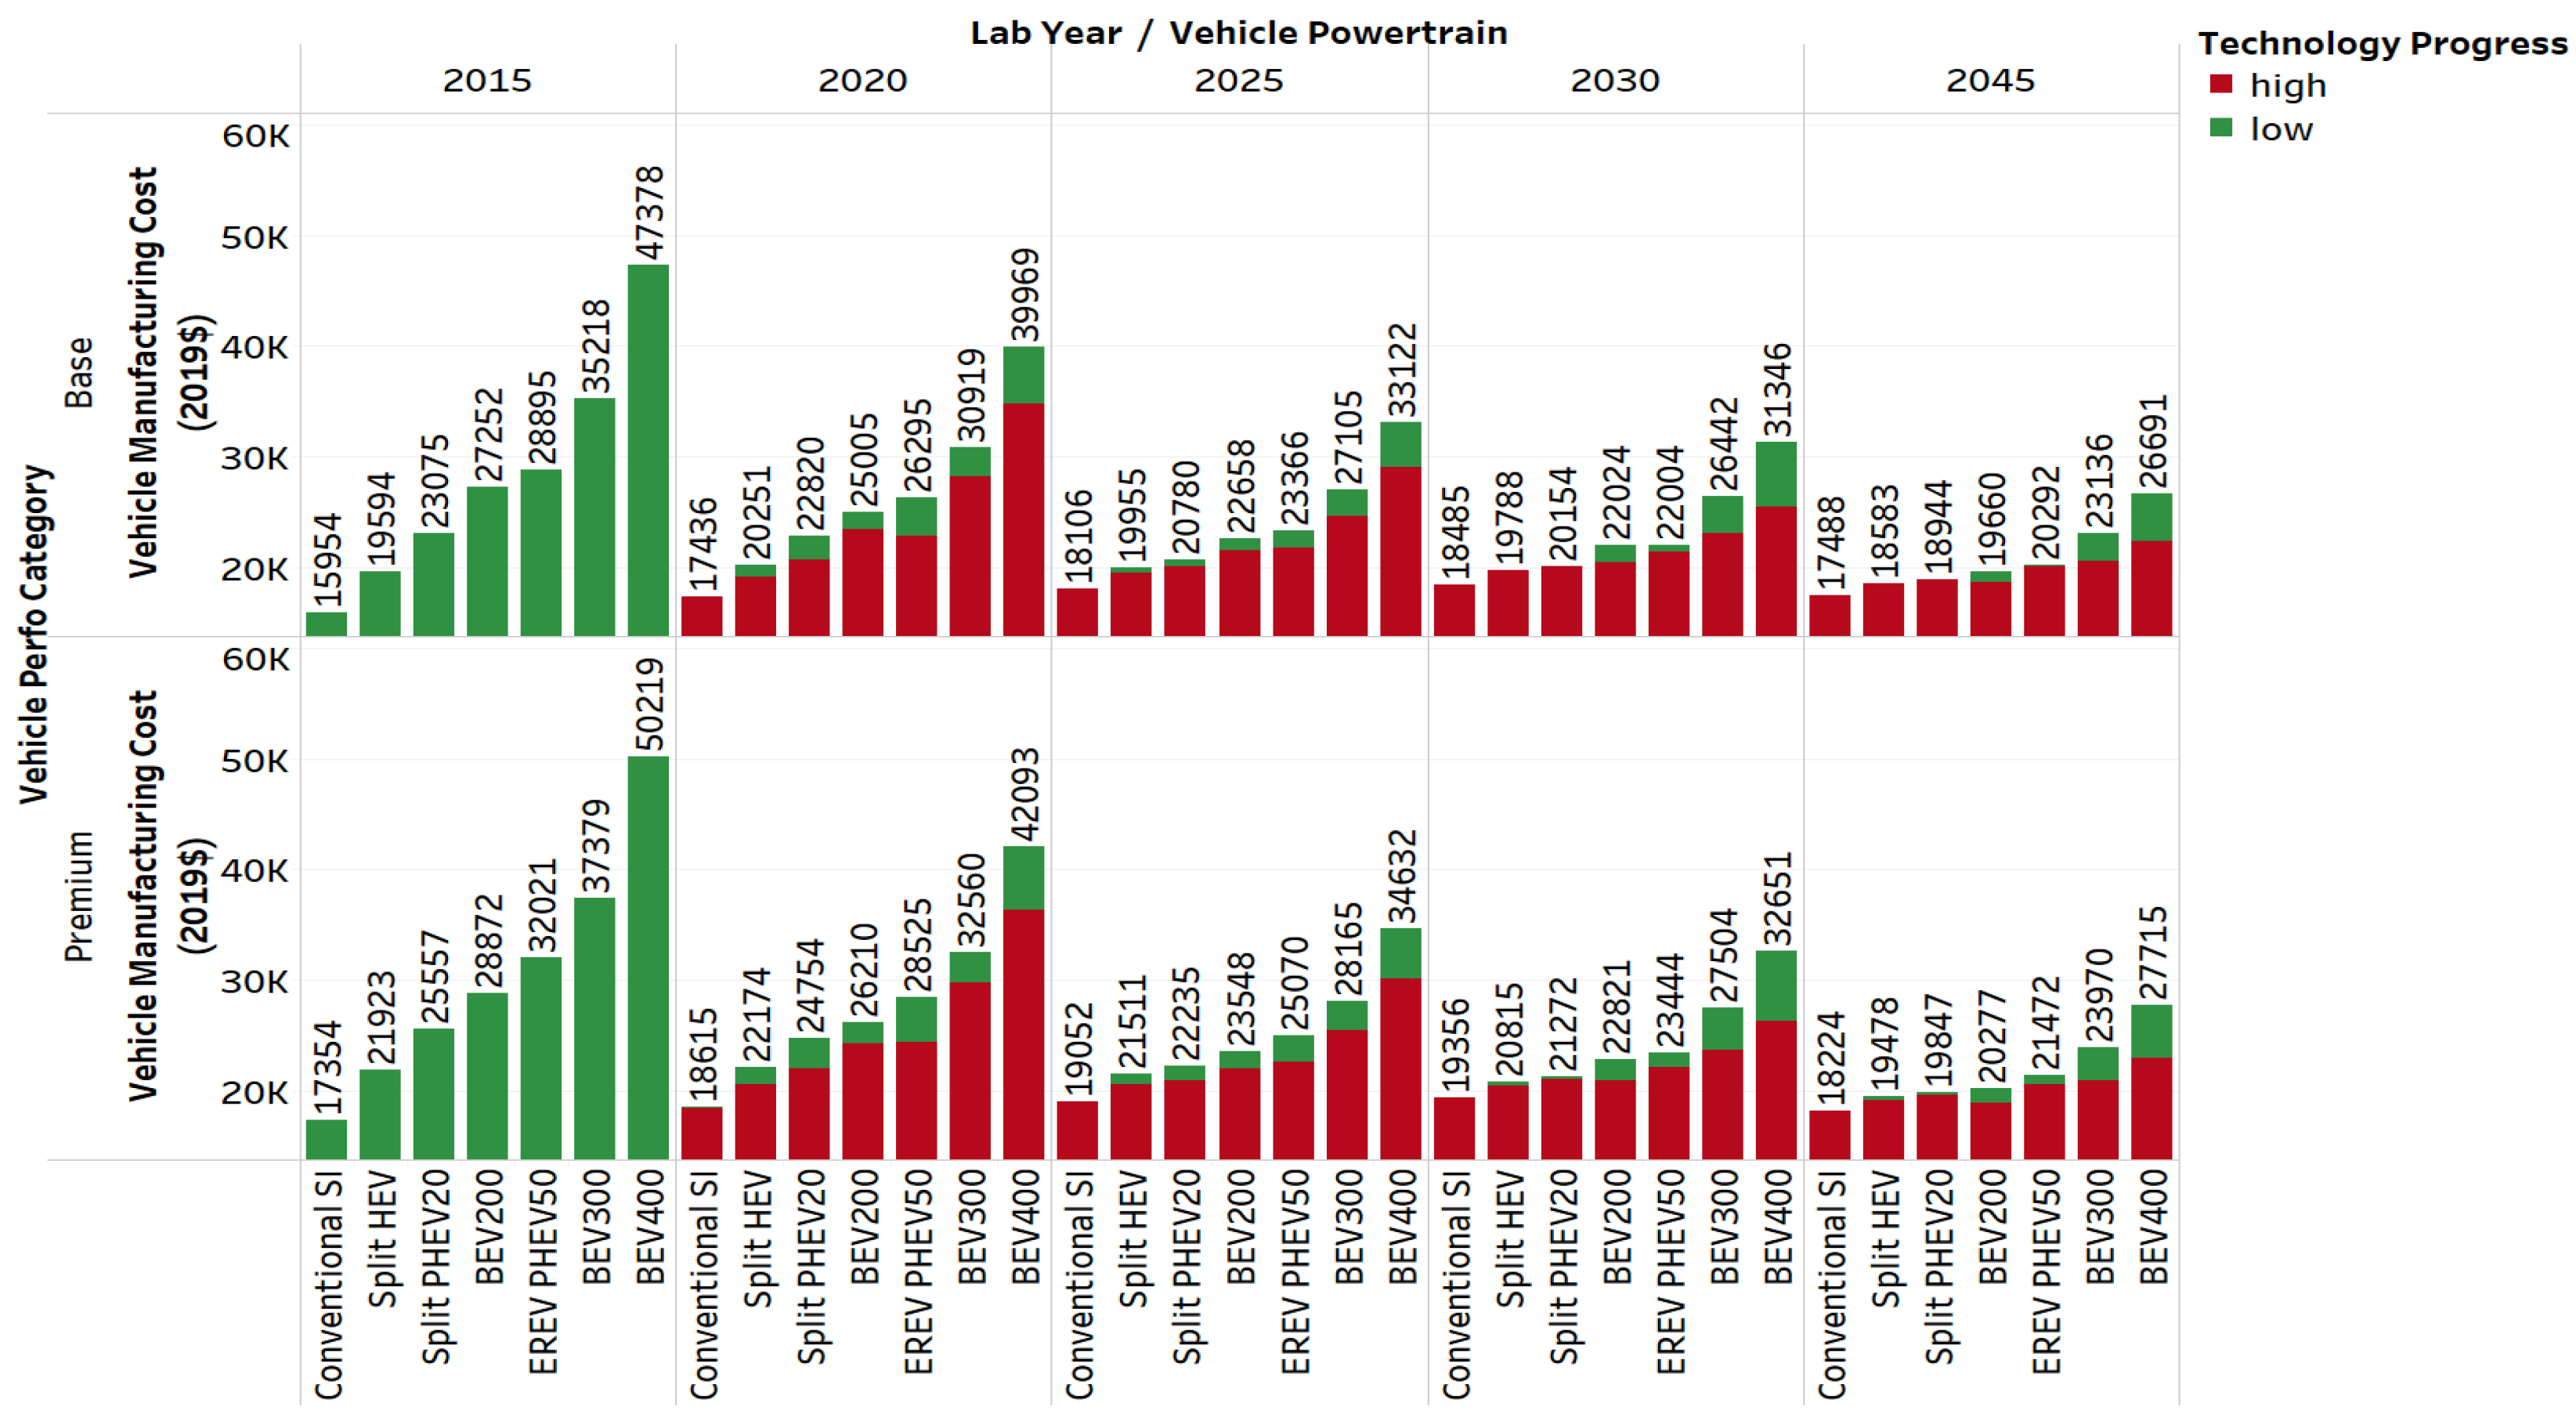
Manufacturing Cost
Figure 13 illustrates the manufacturing costs for the different powertrains considered in this analysis for the midsize vehicles class. The illustration further reflects the effect in manufacturing cost across the two performance categories considered (base and premium).
It can be observed that over time, the manufacturing cost for conventional vehicle increases. This is due to the increase in glider costs, owing to lightweighting applications. However, with increasing vehicle electrification (i.e., HEVs, PHEVs, and BEVs), the manufacturing costs decreases. This is because the VTO target advances in different component cost reductions (battery, electric machine, etc.) results in a significantly larger drop in manufacturing cost compared to the increase in glider costs.
5.5. Energy Consumption vs. Vehicle Manufacturing Cost
This section discusses the evolution of fuel consumption with respect to vehicle manufacturing cost for the different vehicle powertrains modeled across the five vehicle classes (compact, midsize, small sports utility vehicle (SUV), midsize SUV, and pickup).
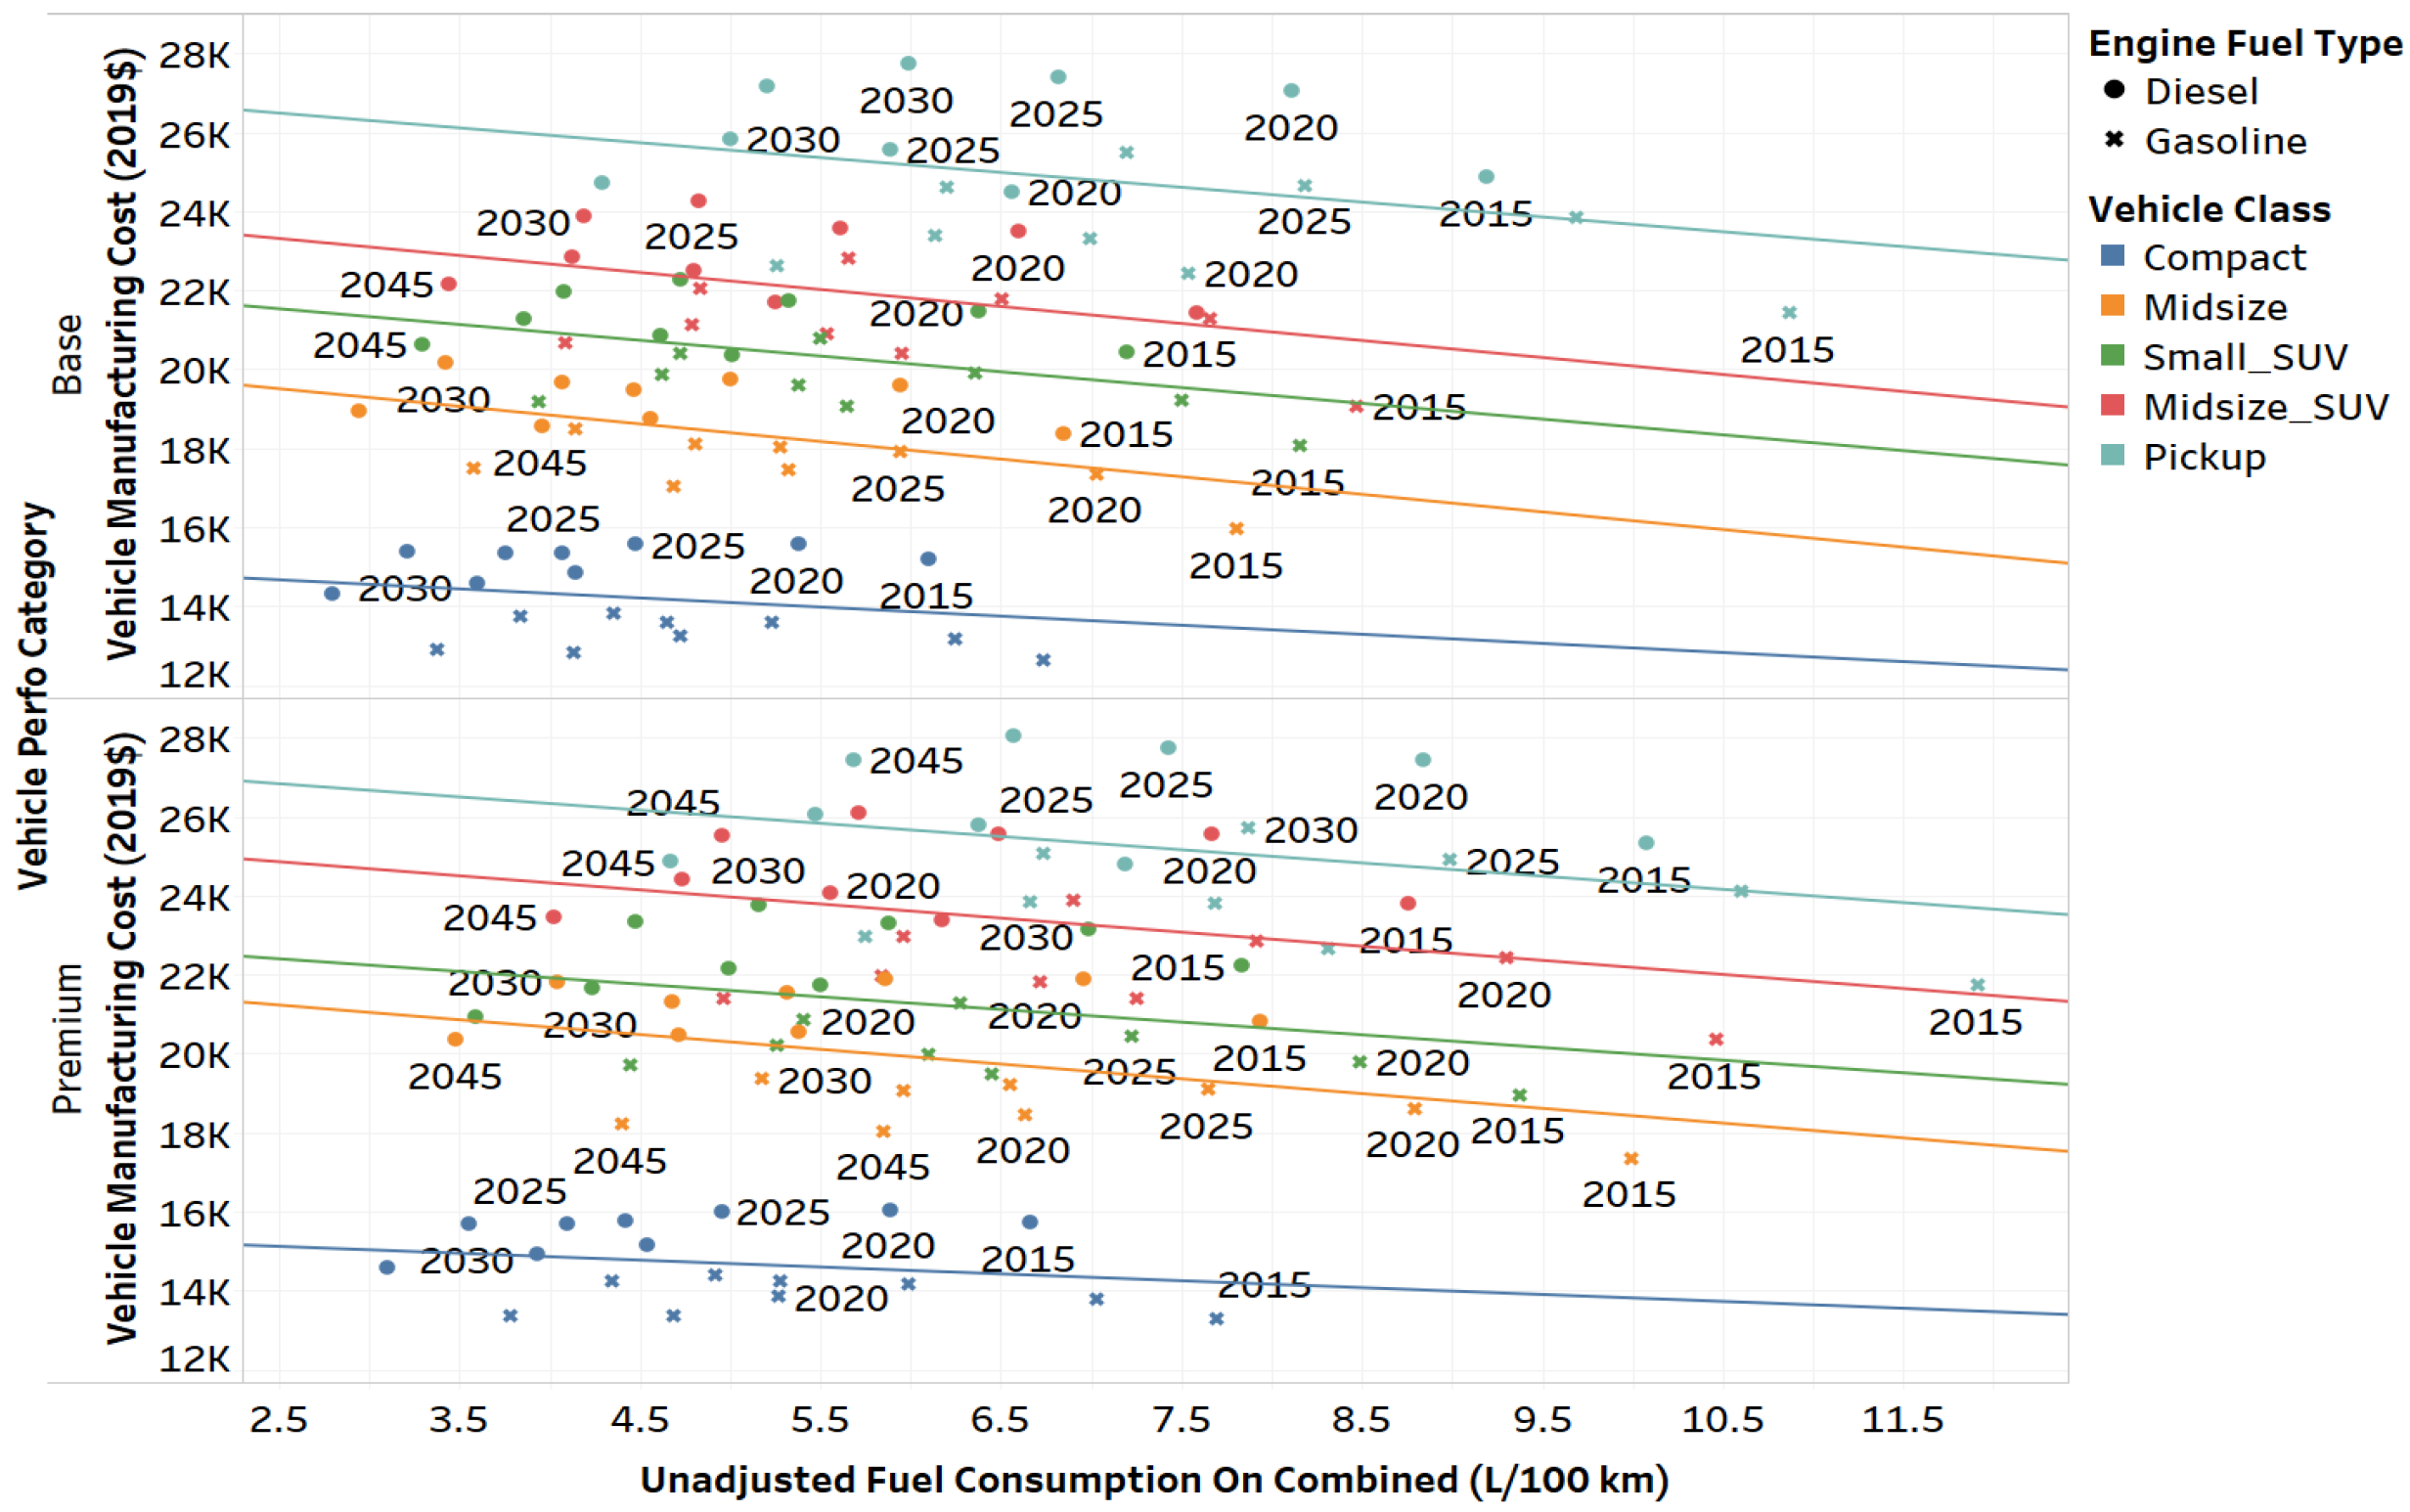
5.5.1. Conventional
Figure 14 illustrates the comparison of vehicle manufacturing cost versus fuel consumption for conventional vehicles across multiple vehicle classes. The different-colored lines represent the trend lines of vehicle manufacturing cost versus fuel consumption for the different vehicle classes.
A key observation is that diesel vehicles have relatively higher manufacturing costs than gasoline vehicles. In addition, the figure shows the relative position of the different vehicle classes in terms of fuel consumption and manufacturing costs: midsize vehicles, small SUVs, and midsize SUVs cluster closely to each other, whereas compact and pickup classes lie on the two extremes. The trend line in the plot also confirms this observation.
5.5.2. Split HEV
Figure 15 illustrates the comparison of vehicle manufacturing cost versus fuel consumption for the split HEVs across multiple vehicle classes.
The figure shows how the fuel consumption and manufacturing costs progress across the different laboratory years. As shown by the trend lines, over time, both fuel consumption and manufacturing costs decrease. As discussed earlier, these decreases are a result of the drop in battery and electric machine costs, which play a dominant role in manufacturing cost. The trend line also confirms the clustering.
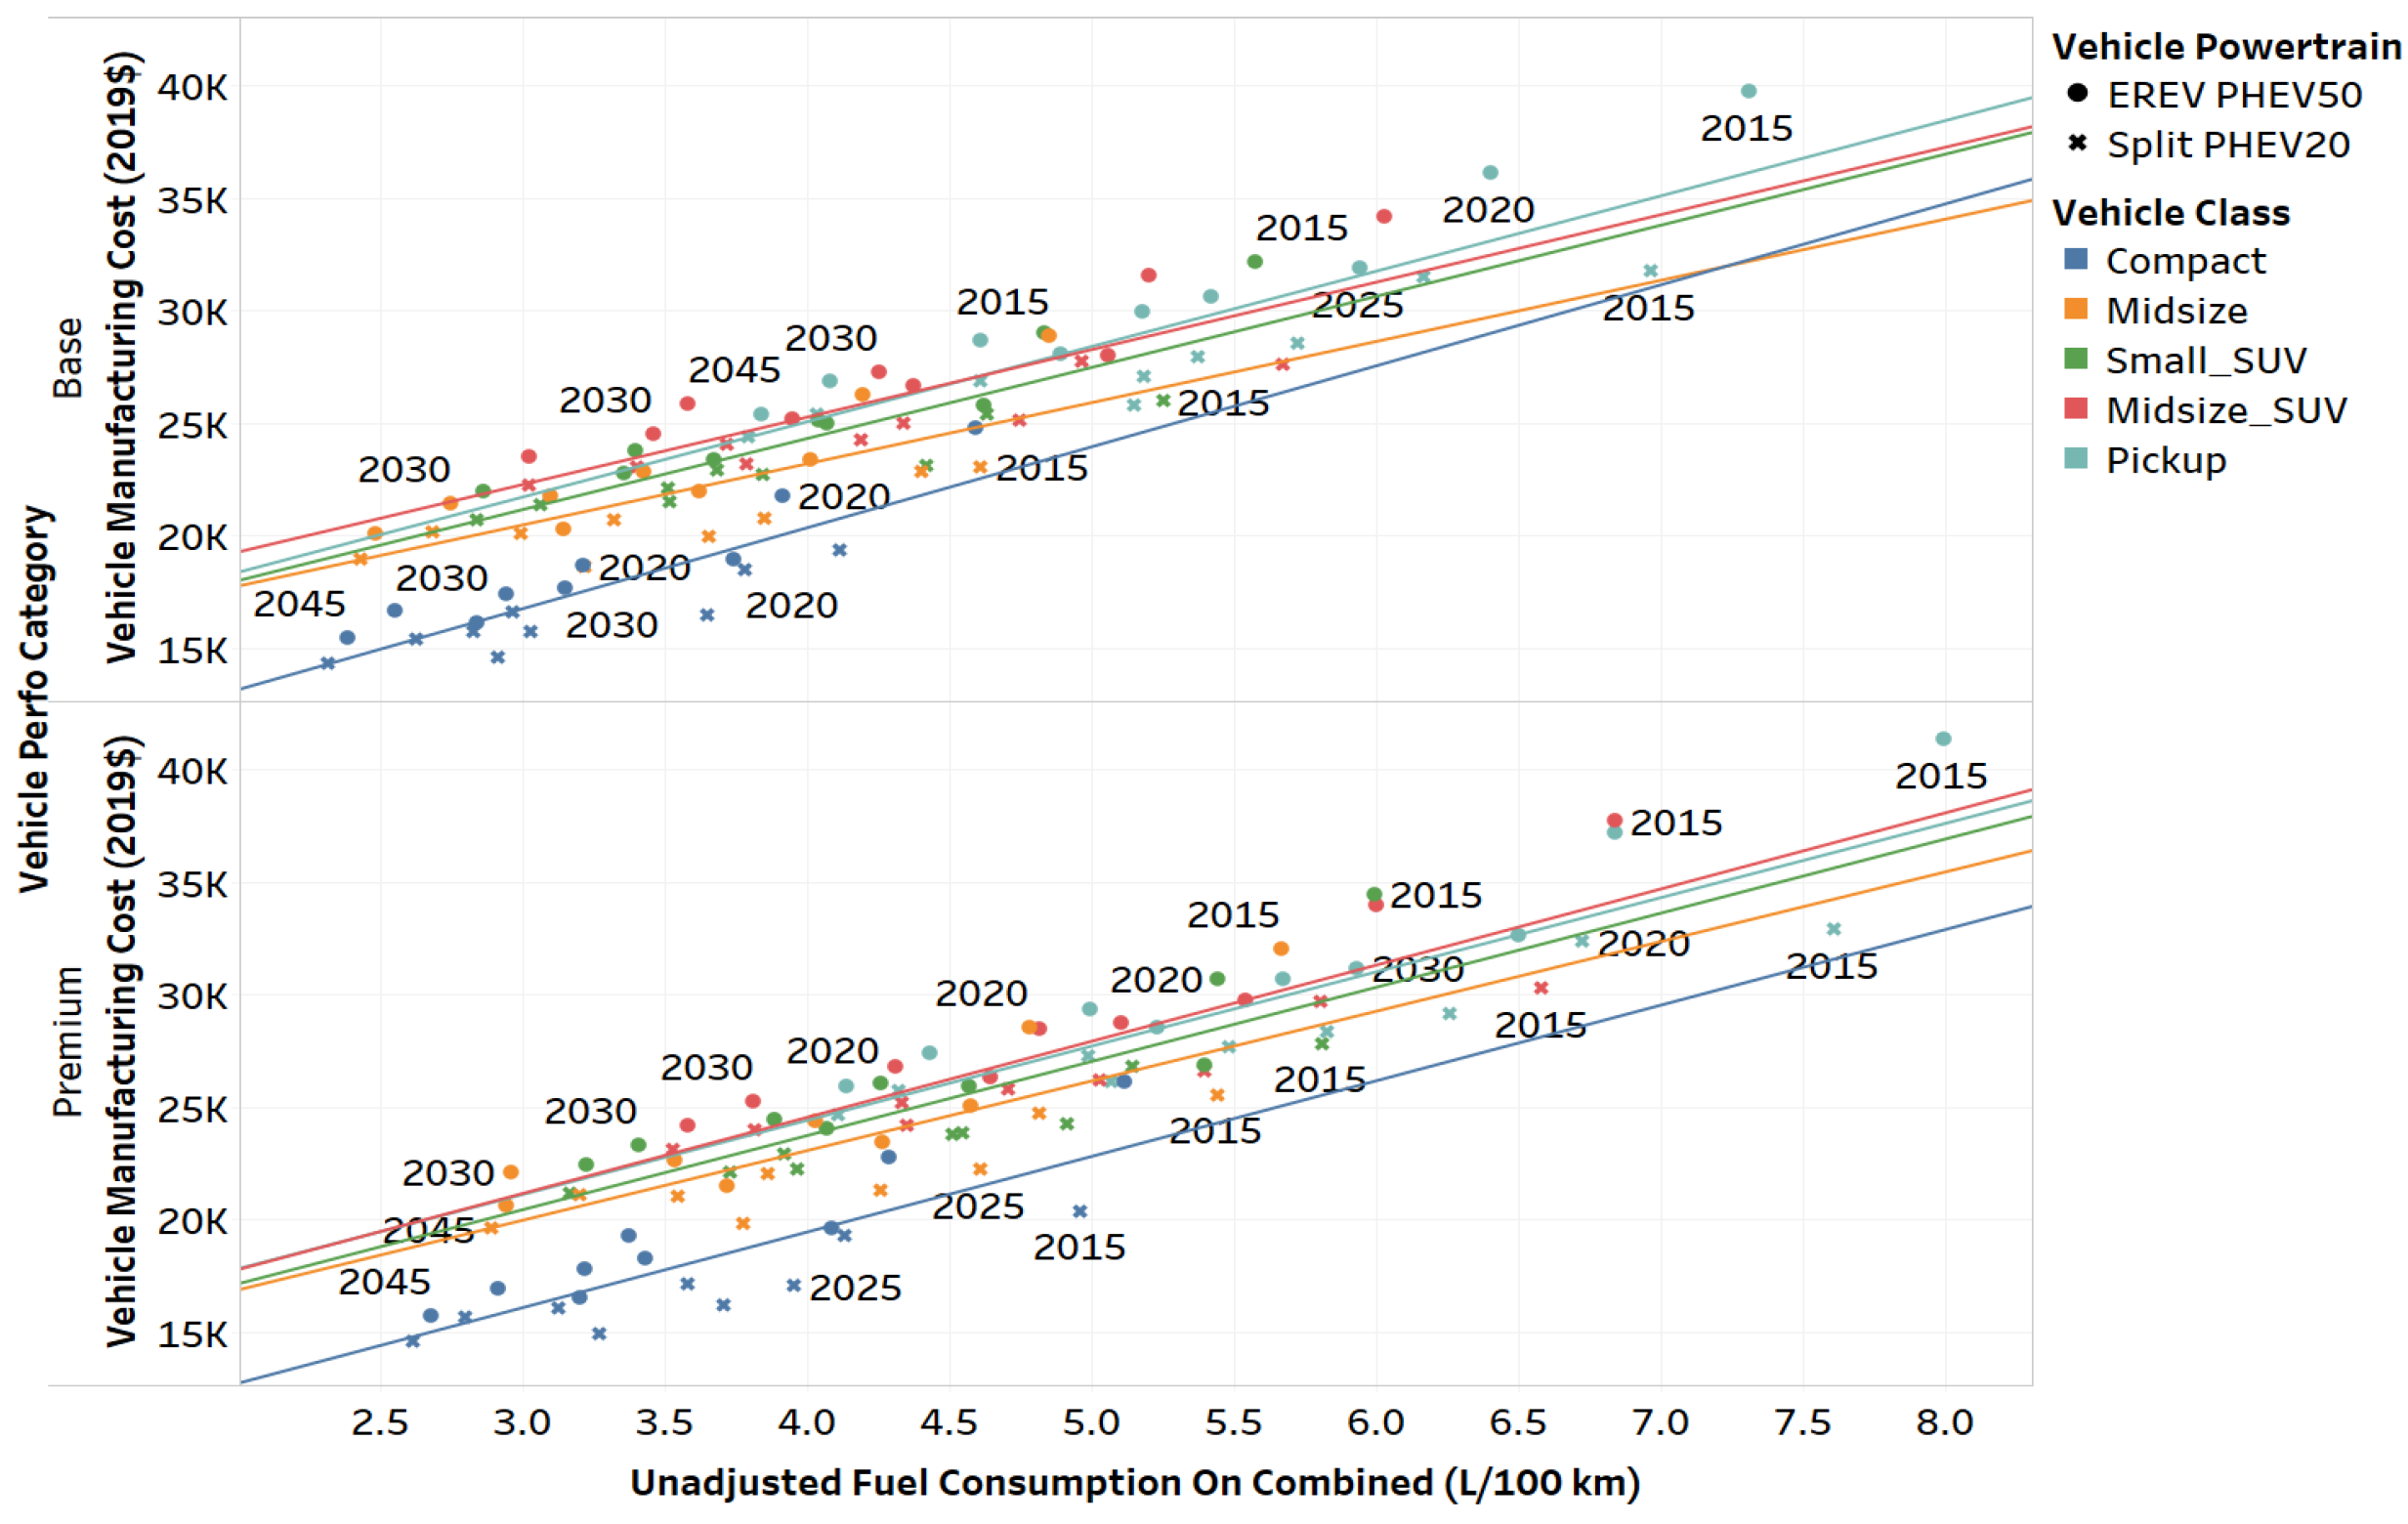
5.5.3. Split/EREV PHEV
Figure 16 illustrates the comparison of vehicle manufacturing cost versus fuel consumption for the PHEVs across multiple vehicle classes.
The different-colored lines represent the trend lines of vehicle-manufacturing cost versus fuel consumption for different types of PHEVs. The different vehicle classes follow trends similar to those previously discussed. As AER increases, manufacturing cost increases (owing to larger battery sizes), and fuel consumption decreases. The effect of technological improvements over the years is evident in the reduction in fuel consumption and manufacturing cost from the laboratory year 2015 to 2045. Furthermore, the trend lines show an aggressive drop in manufacturing costs with respect to improved fuel consumption for PHEVs with higher AERs. This cost decrease can be explained by the improvement in component specifications, followed by the decrease in battery costs over time.
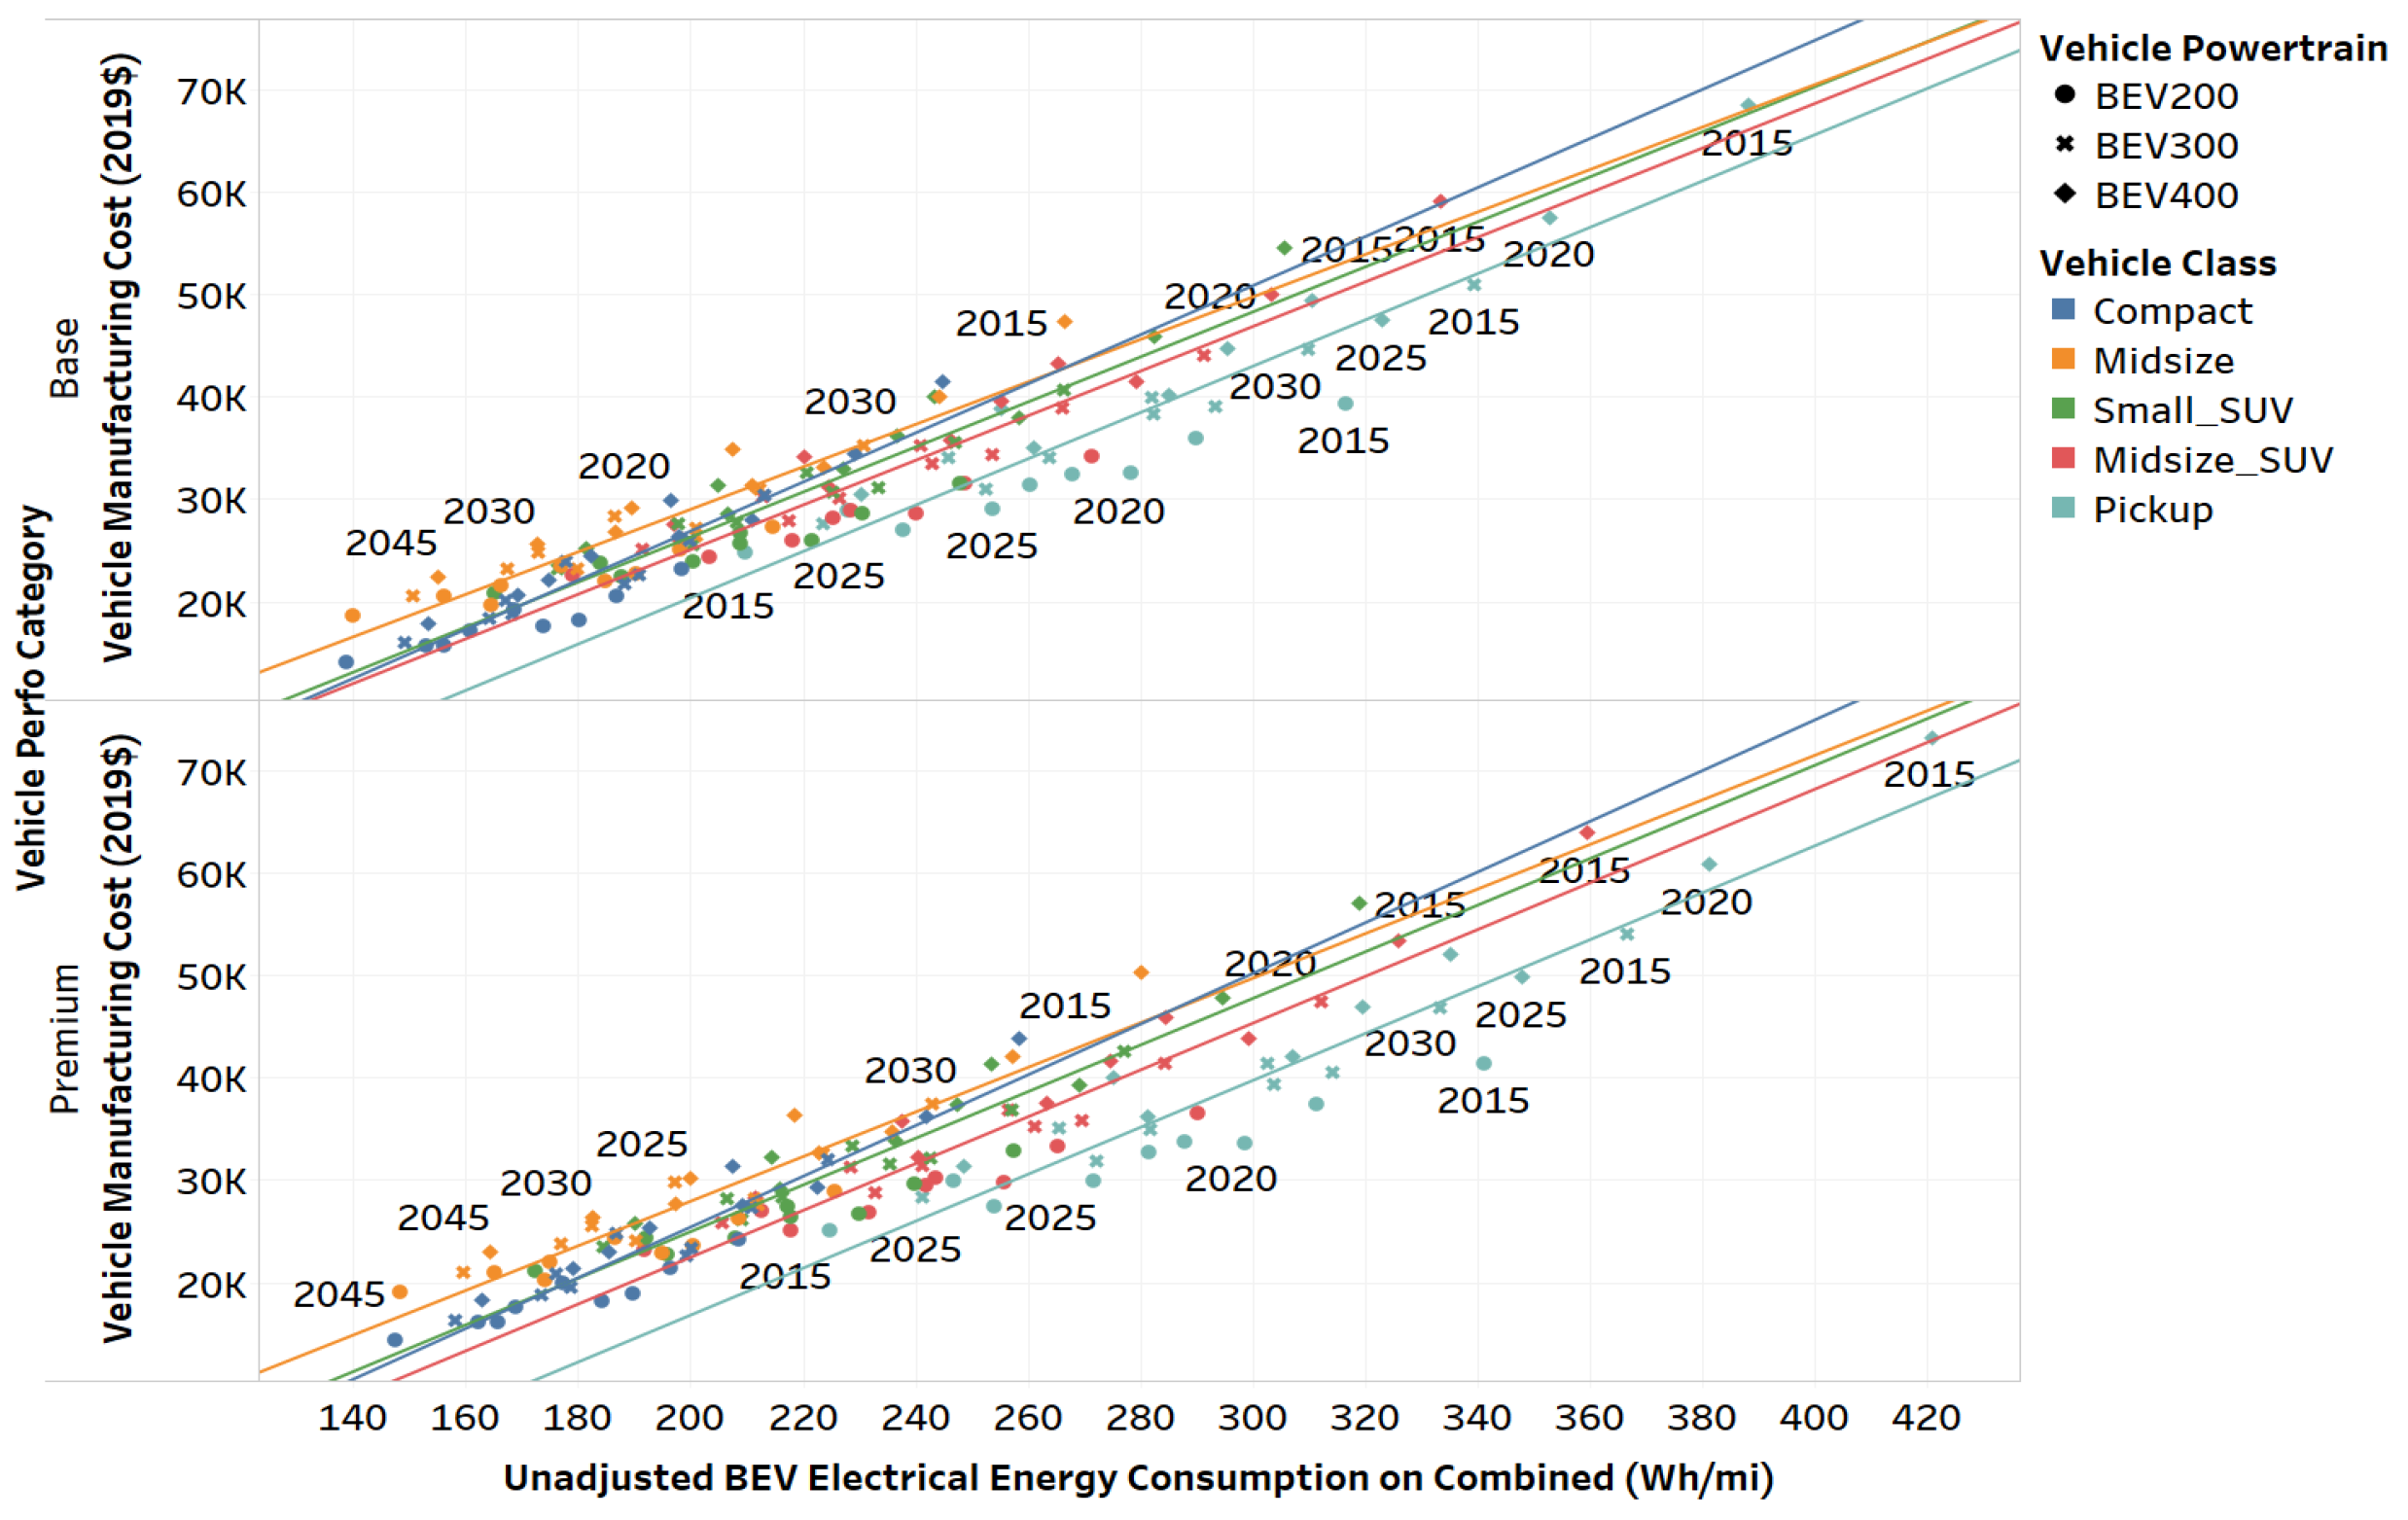
5.5.4. BEV
Figure 17 illustrates the comparison of vehicle manufacturing cost versus electrical energy consumption for the BEVs across multiple vehicle classes.
It is evident that, as AER increases, manufacturing cost increases (owing to larger battery sizes), and fuel consumption decreases. The effect of technological improvements over the years shows in the reduction in fuel consumption and manufacturing cost from laboratory year 2015 to 2045. Furthermore, the trend lines show an aggressive decline in manufacturing costs with respect to improved fuel consumption for BEVs with higher AERs. This cost decrease can be explained by the improvement in component specifications, followed by the decrease in battery costs over time.
6. Conclusions
The paper presents a large-scale simulation process used to evaluate the potential benefits of vehicle electrification over a period of time, along with a comparison of HEVs and PHEVs to conventional vehicles. For the sake of simplicity, the metric for the comparison is limited to fuel consumption and cost. The following conclusions can be drawn from the study:
For the fuel consumption comparison of conventional and power-split HEV vehicles, a slowly decreasing ratio trend line is evident. The power-split midsize vehicle consumes about 41% less fuel compared to conventional vehicles in the 2015 laboratory year. This drop ranges to about 32% in the 2045 laboratory year. For midsize PHEVs with 20 mi of AER (PHEV20s), the reduction in fuel consumption compared to that for conventional gasoline vehicles improves over time from 41% in the 2015 laboratory year to between 59% and 69% in 2045. For midsize PHEVs with 50 mi of AER (PHEV50s), the reduction in fuel consumption improves over time from 38% in the 2015 laboratory year to between about 60% and 68% in 2045. The electrical energy consumption reductions by the laboratory year 2045 for high-energy vehicles range from between 34% and 43% across the different AERs. The higher degrees of reduction are observed for increasing AERs because of the observed benefits from advanced component targets.
In terms of a manufacturing costs comparison, a higher drop in hybridized vehicles is observed compared to conventional vehicles. The drop is higher for higher degrees of hybridization. This result occurs because of the greater influence of the lower battery and electric machine costs. The reductions in energy consumption levels are related to advanced lightweighting and highly efficient vehicle components in the future.
The paper details the evaluation impacts of combination effects of DOE-VTO technology assessment targets. The current limitation to this approach is the individual impacts of each technology target (engine, lightweighting, battery, etc.) is not being isolated. Future research will include segregation of each technology combinations to evaluate the range of benefits across the different vehicle component assessments.
Author Contributions
Conceptualization, E.S.I. and A.R.; methodology, E.S.I. and A.R.; software, E.S.I.; validation, E.S.I. and A.R.; formal analysis, E.S.I., A.M. and N.K.; investigation, E.S.I. and A.R; resources, A.R.; data curation, E.S.I. and A.R.; writing—original draft preparation, E.S.I.; writing—review and editing, E.S.I.; visualization, E.S.I., A.M. and N.K.; supervision, A.R.; project administration, E.S.I. and A.R.; funding acquisition, A.R. All authors have read and agreed to the published version of the manuscript.
Funding
This research was funded by Vehicle Technologies Office | Office of Energy Efficiency and Renewable Energy | U.S. Department of Energy (DE-AC02-06CH11357).
Data Availability Statement
Acknowledgments
This work was supported by the U.S. Department of Energy’s Vehicle Technologies Office under the direction of Jacob Ward. The submitted manuscript has been created by UChicago Argonne, LLC, Operator of Argonne National Laboratory (“Argonne”). Argonne, a U.S. Department of Energy Office of Science laboratory, is operated under Contract No. DE-AC02-06CH11357. The views and opinions of the authors expressed herein do not necessarily state or reflect those of the United States Government or any agency thereof. Neither the United States Government nor any agency thereof, nor any of their employees, makes any warranty, expressed or implied, or assumes any legal liability or responsibility for the accuracy, completeness, or usefulness of any information, apparatus, product, or process disclosed, or represents that its use would not infringe privately owned rights.
Conflicts of Interest
The authors declare no conflict of interest. The funders had no role in the design of the study; in the collection, analyses, or interpretation of data; in the writing of the manuscript, or in the decision to publish the results.
Abbreviations
The following abbreviations are used in this manuscript:
| AER | All-Electric Range |
| Argonne | Argonne National Laboratory |
| BEV | Battery-Electric Vehicle |
| DOE | U.S. Department of Energy |
| DOT | U.S. Department of Transportation |
| EPA | U.S. Environmental Protection Agency |
| EREV | Extended-Range Electric Vehicle |
| HEV | Hybrid-Electric Vehicle |
| PHEV | Plug-In Hybrid Electric Vehicle |
| VTO | Vehicle Technologies Office (DOOE) |
References
- U.S. Department of Energy Vehicle Technologies Office. Transportation Fact of the Week. Fact 943: 19 September 2016 Fuel Economy Being Chosen as the Most Important Vehicle Attribute is Related to the Price of Gasoline. Available online: https://energy.gov/eere/vehicles/fact-943-september-19-2016-fuel-economy-being-chosen-most-important-vehicle-attribute (accessed on 17 April 2020).
- Moawad, A.; Balaprakash, P.; Rousseau, A.; Wild, S. Novel Large Scale Simulation Process To Support DOT’s CAFE Modeling System. In Proceedings of the EVS28 International Electric Vehicle Symposium and Exhibition Policy Strategies for an Emergent Technology; Lessons from the Analysis of EV-Policy in 8 North-European Countries, Goyang, Korea, 3–6 May 2015. [Google Scholar]
- Islam, E.; Kim, N.; Moawad, A.; Rousseau, A. An Extensive Study on Sizing, Energy Consumption, and Cost of Advanced Vehicle Technologies; Contract ANL/ESD-17/17; Argonne National Laboratory: Lemont, IL, USA, October 2018.
- Autonomie. Argonne National Laboratory. Available online: http://www.autonomie.net (accessed on 17 April 2021).
- Islam, E.; Kim, N.; Moawad, A.; Rousseau, A. Energy Consumption and Cost Reduction of Future Light-Duty Vehicles Through Advanced Vehicle Technologies: A Modeling Simulation Study Through 2050; Contract ANL/ESD-19/10; Argonne National Laboratory: Lemont, IL, USA, June 2020.
- Halbach, S.; Sharer, P.; Pagerit, S.; Rousseau, A.P.; Folkerts, C. Model Architecture, Methods, and Interfaces for Efficient Math-Based Design and Simulation of Automotive Control Systems; SAE Technical Paper 2010-01-0241; SAE International: Warrendale, PA, USA, 2010. [Google Scholar] [CrossRef]
- Rousseau, A.; Halbach, S.; Michaels, L.; Shidore, N.; Kim, N.; Kim, N.; Karbowski, D.; Kropinski, M. Electric Drive Vehicle Development and Evaluation using System Simulation. J. Soc. Instrum. Control. Eng. 2014, 53, 7886–7891. [Google Scholar] [CrossRef]
- Pagerit, S.; Roudier, T.; Sharer, P.; Rousseau, A. Complex System Engineering Simulation through Co-Simulation; SAE Technical Paper 2014-01-1106; SAE International: Warrendale, PA, USA, 2014. [Google Scholar] [CrossRef]
Short Biography of Authors
 | Ehsan Sabri Islam completed his M. Sc. in Interdisciplinary Engineering from Purdue University, USA in 2019 and his B.A.Sc in Mechatronics Engineering from the University of Waterloo, Canada, in 2016. His skill set and interests focus on applying mechatronics principles to innovate systems and processes in advanced vehicle technologies and controls systems. At Argonne National Laboratory, he focuses his research on vehicle energy consumption analyses and inputs for U.S. DOE-VTO and the National Highway Transportation Safety Administration/U.S. Environmental Protection Agency/U.S. Department of Transportation (DOT) Corporate Average Fuel Economy (CAFE) and CO standards using innovative, large-scale simulation processes and applications of artificial intelligence. |
 | Ayman Moawad is a research engineer at Argonne National Laboratory. He graduated from the Ecole des Mines, France, in 2009 with a Master of Science in Mechatronics, Robotics, and Computer Science. His research interests include energy consumption prediction and analysis of electrified vehicles, large scale simulation, high performance computing, machine learning and data analysis. |
 | Namdoo Kim graduated in 2007 from the University of Sungkyunkwan, South Korea, with a Master’s Degree in Mechanical Engineering. He is currently working in Argonne National Laboratory’s Vehicle Modeling and Simulation Group. |
 | Aymeric Rousseau is the Manager of the Systems Modeling and Control Section at Argonne National Laboratory. He received his engineering diploma at the Industrial System Engineering School in La Rochelle, France in 1997 and an Executive MBA from Chicago Booth School of Business in 2019. For the past 20 years, he has been evaluating the impact of advanced vehicle and transportation technologies from a mobility and energy point of view including the development of Autonomie (vehicle system simulation) and POLARIS (large-scale transportation system simulation). In addition to leading numerous projects for OEMs and US Department of Energy, Aymeric Rousseau has been providing the vehicle energy consumption analysis for the US CAFE regulations and has authored or co-authored more than 80 papers related to vehicle electrification. |
Figure 1.
Innovative process to quantify VTO R&D portfolio.
Figure 1.
Innovative process to quantify VTO R&D portfolio.
Figure 2.
A large scale simulation process to quantify cost-benefits analysis.
Figure 2.
A large scale simulation process to quantify cost-benefits analysis.
Figure 3.
Vehicle attribute selection for different vehicle combinations.
Figure 3.
Vehicle attribute selection for different vehicle combinations.
Figure 4.
Vehicle component weight selection for different vehicle configurations.
Figure 4.
Vehicle component weight selection for different vehicle configurations.
Figure 5.
Conventional sizing process.
Figure 5.
Conventional sizing process.
Figure 6.
Engine peak power for midsize vehicles.
Figure 6.
Engine peak power for midsize vehicles.
Figure 7.
Motor peak power (W) for midsize vehicles.
Figure 7.
Motor peak power (W) for midsize vehicles.
Figure 8.
Battery peak power (W) for midsize vehicles.
Figure 8.
Battery peak power (W) for midsize vehicles.
Figure 9.
Total battery energy for midsize vehicles.
Figure 9.
Total battery energy for midsize vehicles.
Figure 10.
Unadjusted fuel economy on combined driving cycle for midsize vehicles.
Figure 10.
Unadjusted fuel economy on combined driving cycle for midsize vehicles.
Figure 11.
Unadjusted direct current (DC) electrical energy consumption on combined driving cycle (Wh/mile) for midsize vehicles.
Figure 11.
Unadjusted direct current (DC) electrical energy consumption on combined driving cycle (Wh/mile) for midsize vehicles.
Figure 12.
The gasoline-equivalent unadjusted fuel consumption of different vehicle powertrains on the combined driving cycle.
Figure 12.
The gasoline-equivalent unadjusted fuel consumption of different vehicle powertrains on the combined driving cycle.
Figure 13.
Manufacturing cost of midsize vehicles.
Figure 13.
Manufacturing cost of midsize vehicles.
Figure 14.
Manufacturing cost versus fuel consumption of conventional vehicles.
Figure 14.
Manufacturing cost versus fuel consumption of conventional vehicles.
Figure 15.
Manufacturing cost versus fuel consumption of split HEVs.
Figure 15.
Manufacturing cost versus fuel consumption of split HEVs.
Figure 16.
Manufacturing cost versus fuel consumption of PHEVs.
Figure 16.
Manufacturing cost versus fuel consumption of PHEVs.
Figure 17.
Manufacturing cost versus electrical energy consumption of BEVs.
Figure 17.
Manufacturing cost versus electrical energy consumption of BEVs.
Table 1.
Vehicle classification, performance categories, and characteristics.
Table 1.
Vehicle classification, performance categories, and characteristics.
| Vehicle Class | Performance Category | 0–60 mph Time (s) | Frontal Area (m) | Drag Coefficient | Rolling Resistance |
|---|
| Compact | Base (NonPerfo) | 10 | 2.3 | 0.31 | 0.009 |
| Compact | Premium (Perfo) | 8 | 2.3 | 0.31 | 0.009 |
| Midsize | Base (NonPerfo) | 9 | 2.35 | 0.3 | 0.009 |
| Midsize | Premium (Perfo) | 6 | 2.35 | 0.3 | 0.009 |
| Small SUV | Base (NonPerfo) | 9 | 2.65 | 0.36 | 0.009 |
| Small SUV | Premium (Perfo) | 7 | 2.65 | 0.36 | 0.009 |
| Midsize SUV | Base (NonPerfo) | 10 | 2.85 | 0.38 | 0.009 |
| Midsize SUV | Premium (Perfo) | 7 | 2.85 | 0.38 | 0.009 |
| Pickup | Base (NonPerfo) | 7 | 3.25 | 0.42 | 0.009 |
| Pickup | Premium (Perfo) | 7 | 3.25 | 0.42 | 0.009 |
Table 2.
Technology assumptions.
Table 2.
Technology assumptions.
| | 2015 | 2020 | 2025 | 2045 |
|---|
| | Low | Low | High | Low | High | Low | High |
| Conventional Engine Peak Efficiency (%) | 36 | 38 | 43 | 40 | 43 | 44 | 47 |
| Hybrid Engine Efficiency (%) | 39 | 40 | 46 | 41 | 46 | 45 | 50 |
| Electric Machine Cost ($/kW) | 17 | 13 | 10 | 10 | 6 | 6.3 | 4 |
| Specific Power at 70% SOC—HEVs (W/kg) | 2750 | 3000 | 4000 | 4000 | 5000 | 5000 | 6000 |
| Power Cost Term—HEVs ($/W) | 20 | 20 | 16 | 19 | 15 | 17 | 13 |
| Energy Density (usable)—PHEV20 (Wh/kg) | 60 | 80 | 100 | 105 | 125 | 115 | 170 |
| Energy Density (usable)—PHEV50 (Wh/kg) | 70 | 95 | 105 | 105 | 125 | 115 | 170 |
| Energy Density (usable)—BEV (Wh/kg) | 170 | 170 | 230 | 230 | 310 | 280 | 320 |
| Energy Cost Term (usable)—PHEV20 ($/kWh) | 530 | 460 | 300 | 210 | 160 | 160 | 120 |
| Energy Cost Term (usable)—PHEV50 ($/kWh) | 500 | 365 | 300 | 210 | 160 | 160 | 120 |
| Energy Cost Term (usable)—BEV ($/kWh) | 220 | 180 | 170 | 144 | 125 | 120 | 80 |
| Publisher’s Note: MDPI stays neutral with regard to jurisdictional claims in published maps and institutional affiliations. |
© 2021 by the authors. Licensee MDPI, Basel, Switzerland. This article is an open access article distributed under the terms and conditions of the Creative Commons Attribution (CC BY) license (https://creativecommons.org/licenses/by/4.0/).


