1. Introduction
Electric Vehicles (EVs) are rapidly emerging vehicle technologies that are currently being developed and have been significantly growing in the automotive industry. These vehicles support the world’s new shift towards utilizing clean energy resources [
1]. In the past decade, a lot of research and efforts were invested in EVs technologies for ensuring drivers’ safety and promoting environmental-friendly alternatives. In addition, transportation researchers and agencies have introduced more connected and automated applications in modern vehicles to enhance transportation safety [
2,
3]. Past research work has focused on the safety benefits of electric vehicle applications. Researchers reported comprehensive methods that can be utilized to justify the investment in the new vehicle technologies and Intelligent Transportation safety applications [
4]. The latest vehicle models feature an application that improves safety and reduces crash severity called Skid Control System (SCS) (or Traction Control System).
The SCS is an anti-skid application that is used to estimate the optimal engine torque that can be produced and transferred to the drive wheels to maintain stable tire-road traction. This phenomenon is critical as it ensures drivers’ safety and influences the longitudinal dynamics of an electric vehicle. Most of the existing studies in the literature focused on estimating the tire slip ratio in the design of skid control applications. The slip ratio can be defined as the difference between the velocity of the tire contact patch (i.e., the contact area between the tire and the pavement surface) and the wheel center velocity. Given the fact that driving conditions are highly uncertain, researchers developed many skid control prediction algorithms that are based on the estimation of the slip-ratio parameters.
Robust skid resistance measurements can significantly influence the efficiency of the current application introduced in modern vehicles. The assumptions and predictions of the SCS parameters should be avoided in the design stage. Therefore, the design of a resilient skid control application based on reliable pavement skid resistance measurements is crucial for the system’s performance. Accordingly, it becomes increasingly important to identify the skid resistance of the most common pavement surface treatments known as sealcoats. This paper proposes a range of skid resistance thresholds for the SCS application based on different pavement British Pendulum skid numbers (BPN) [
5]. In addition, the impacts of snow on the functionality of the sealcoat skid resistance are examined to underline any necessary consideration in the application’s design parameters for vehicles operating in cold regions.
Skid resistance is one of the most critical pavement surface characteristics that highly impacts the design of the skid control parameters in an EVs. It is a serious issue for many transportation agencies and highway engineers, as it is associated with both pavement serviceability and transportation safety. In cold regions, pavement skid resistance plays a significant role in securing safe and smooth traffic flow. Skid resistance is defined under locked non-rotating conditions to be the friction force produced as a result of the interaction between vehicle tires and the pavement surface [
5]. Sealcoats are contemporary techniques commonly used to improve the skid resistance of highway bituminous pavements [
6]. The main objective of this paper is to investigate the impacts of sealcoats on pavement skid resistance under different simulated driving conditions (i.e., dry conditions and snow conditions) and recommend a range of BPNs to be used in the design of Skid Control applications in EVs. references.
2. Literature Review
A reliable skid control system is based on improving the skid resistance ability during the acceleration of EVs. Nam et al., (2015) utilized the features of electric motors and proposed an algorithm to estimate the EVs velocity. One of the advantages offered by EVs is the presence of dedicated in-wheel electric motors where the acting torques on each wheel can be measured easily. The proposed sliding mode control algorithm was based on measurable motor torque, wheel velocity, and rotational dynamics of the wheel. The researchers conducted real field tests and simulations using a real-world electric vehicle and CarSim software. The results proved the advantages and reliability of the implemented control design [
7].
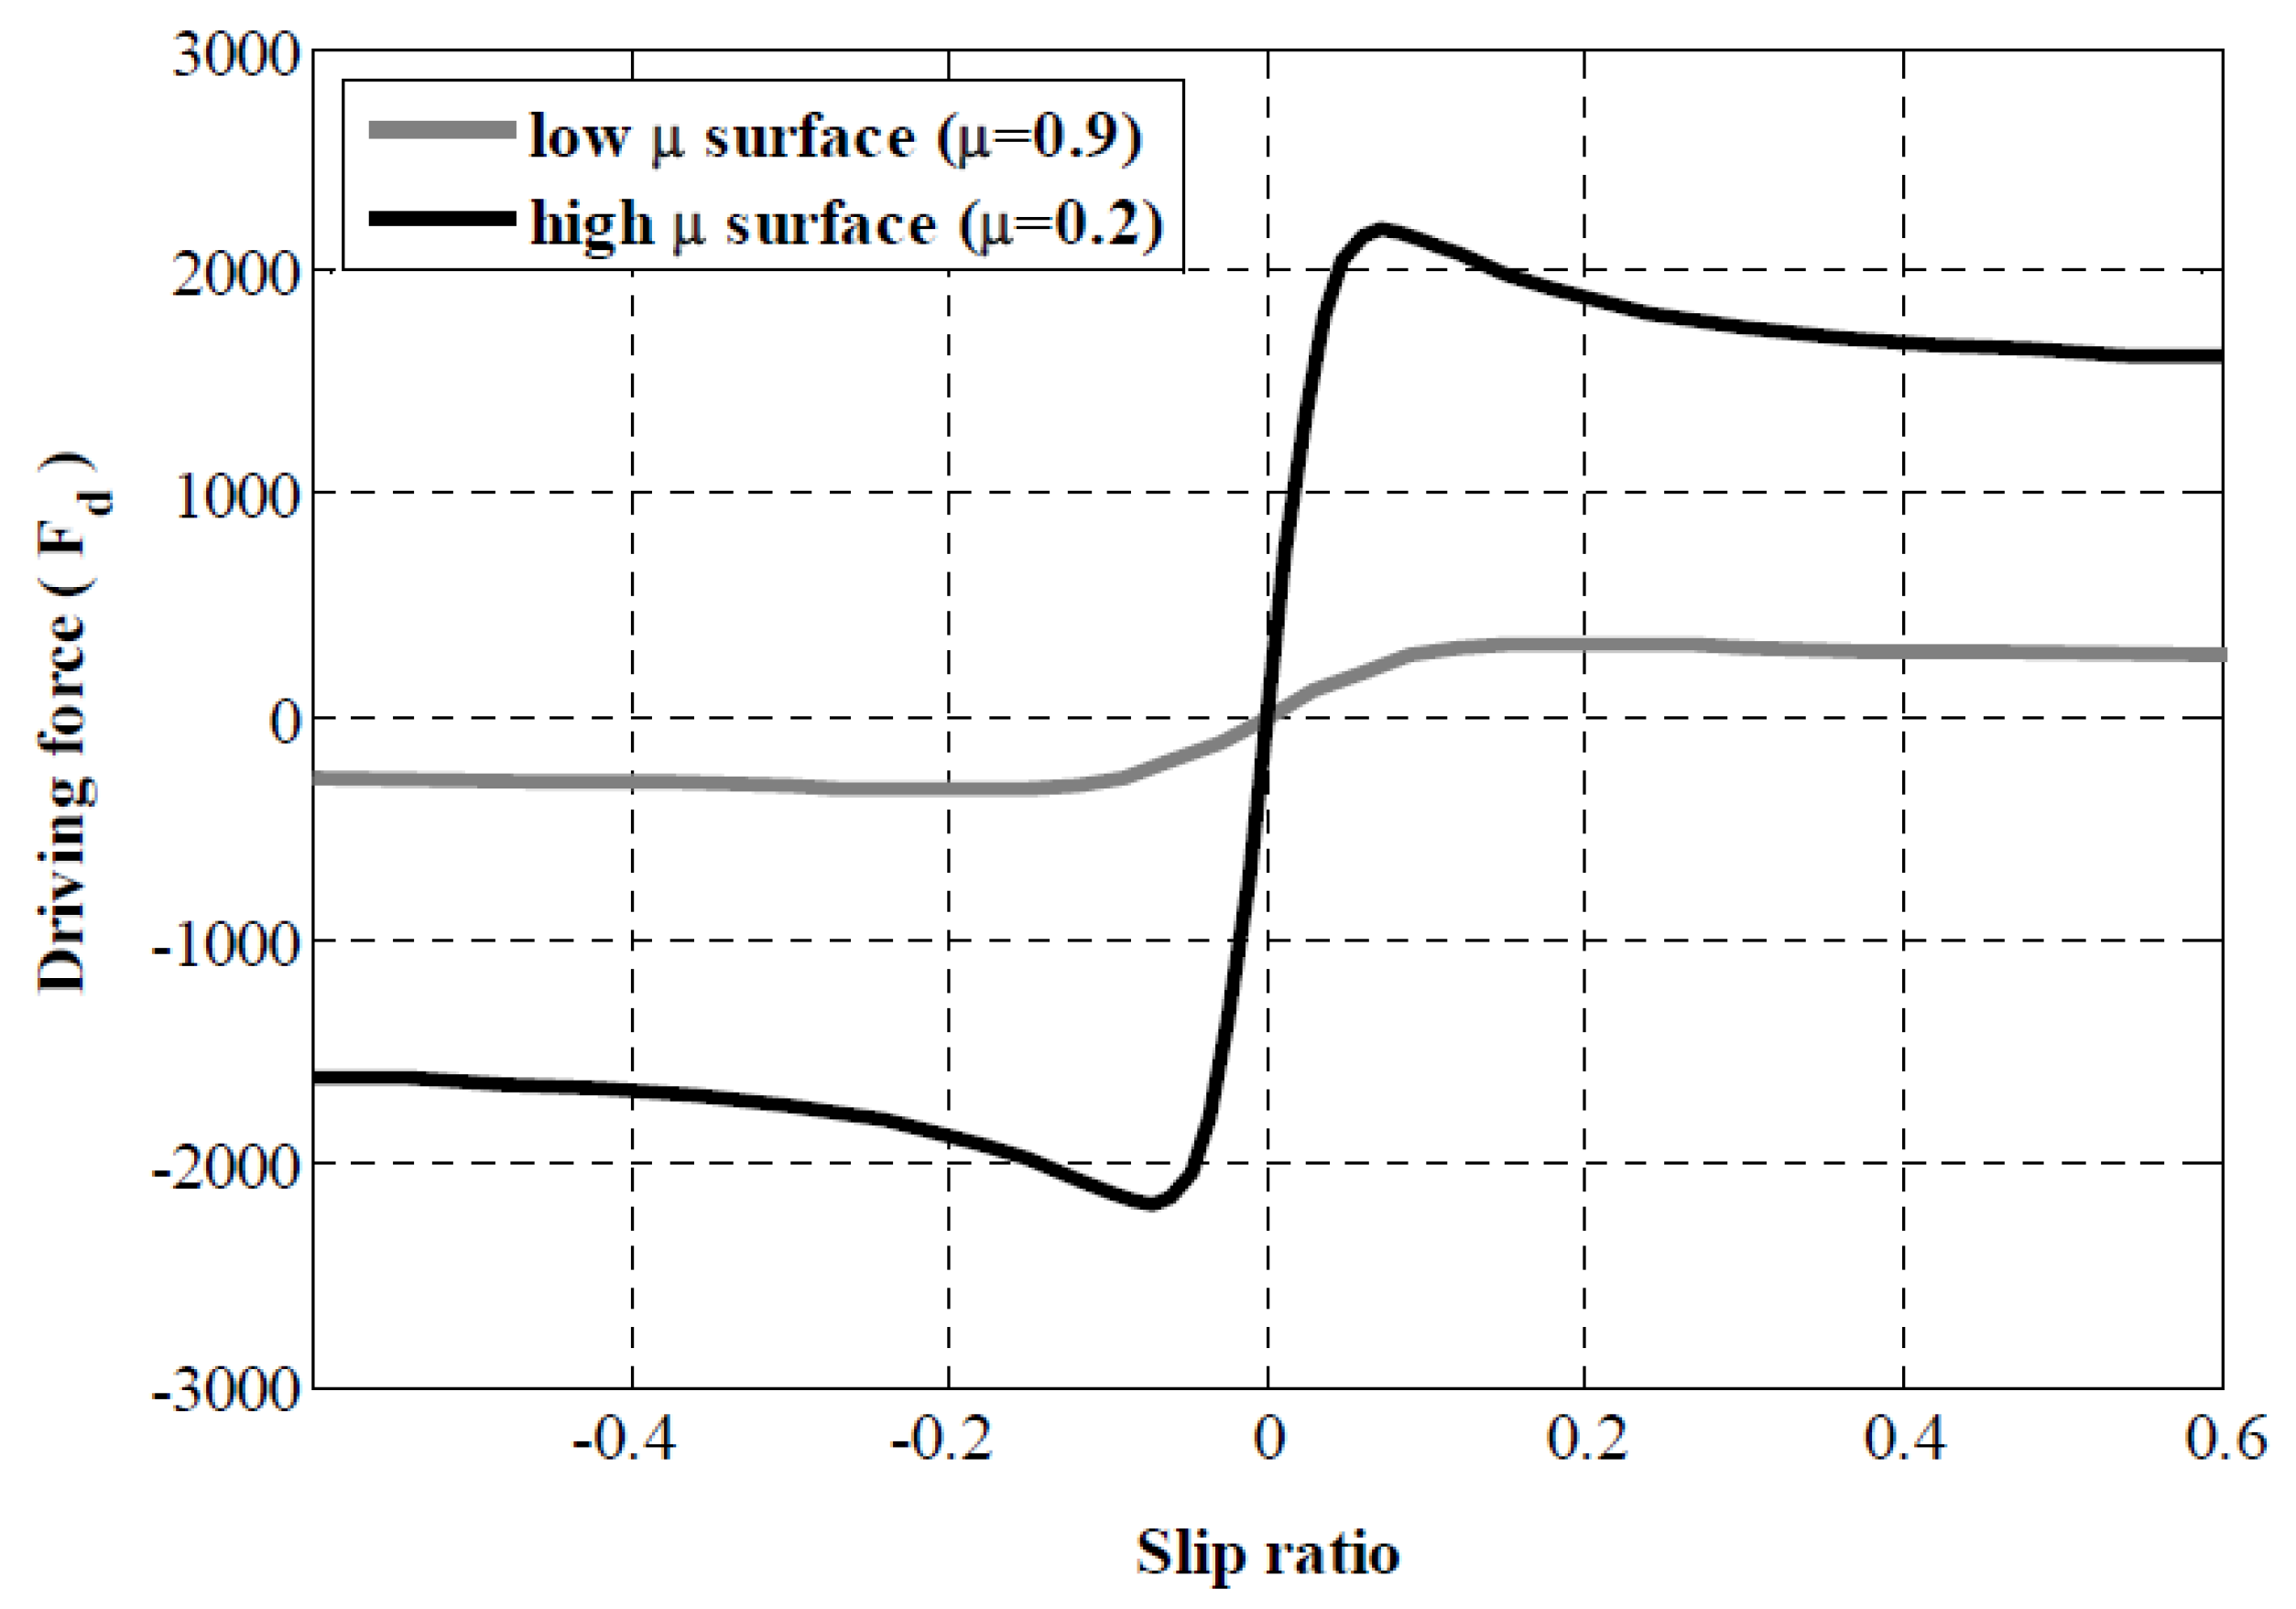
The driving forces (i.e., traction forces) generated by the tire-road interaction are normally defined as a function of the wheel slip ratio, and the normal force acting on wheel. The normal forces occur as a result of the weight of the vehicle carried by each wheel. In addition, driving forces include the pavement friction coefficient, which depends on roadway surface characteristics. This wheel slip ratio is one of the most important control variables in all modern traction control systems due to its influence on the generated traction forces. Deur et al., (2011) and Subudhi et al., (2012) proposed skid control algorithms based on controlling the wheel slip ratio [
8,
9]. As shown in
Figure 1, Rajamani (2005) reported the relationship between a typical vehicle’s driving force and the slip ratio for low and high slippery surfaces [
10].
Slip ratio is a representation of the slip characteristics during the tire rotation. The friction coefficient is defined as the friction between pavement and the tire when it is about to slide in the first contact, in which the tire velocity is zero. It can be inferred from the above figure that the slip ratio, road friction coefficient, and pavement skid resistance are significant parameters in the design of an efficient Skid Control System (SCS).
Skid resistance is a vital contributing factor in controlling the stability of vehicles and can directly impact the safety of drivers. The skid resistance depends on several variables such as pavement surface, weather conditions, vehicle tires, and wheel slip ratio. In addition, the characteristics of these variables are highly uncertain and challenge the automotive industry in the design of skid control safety applications [
11]. Therefore, the main goal of the traction control is to operate such that a maximum friction coefficient is obtained between the vehicle and the pavement surface. Due to the uncertainties associated with the aforementioned variables, many studies in the literature relied on the prediction of the tire slip ratio in the design of skid control applications. Kuntanapreeda (2014) proposed a sliding-mode control approach to develop a reliable vehicle traction control system. The main idea was to maintain a safe wheel slip ratio. The study estimated the road-tire tractive forces that were utilized in the application design. Based on simulation and laboratory testing, the results showed a successful and efficient skid control application [
11].
Li et al., (2018) reported an advanced skid control system that can be used in EVs equipped with in-wheel motors. The proposed SCS design is considered a model predictive control (MPC) that predicts the skid parameters. This algorithm estimates the optimal braking torque on the wheels by controlling the slip ratio on each tire. According to simulation and theoretical analysis, the results showed a quick response of the braking system and improved slip control performance. Moreover, the proposed skid controller delivered an effective anti-lock wheel system [
12].
Traffic safety is considered one of the highest priorities for transportation agencies and researchers [
13,
14]. In the mid-90s, the Anti-Lock Brakes system (ABS) was first introduced in the US and UK. The ABS functionality is similar to SCS technologies. Both applications support the drivers’ safety by preventing locked wheels and skidding under heavy breaks, which provides continuous steering control. According to Forkenbrock, (1999) report for the National Highway Traffic Safety Administration (NHTSA), the stopping distances with ABS were increased by an average of 27.2% on loose gravel [
15]. Both ABS and SCS depend on the road surface skid characteristics and skid numbers. Derived from the concept of skid resistance, Bera et al., (2011) designed an ABS application which provides the highest braking performance at high driving speeds [
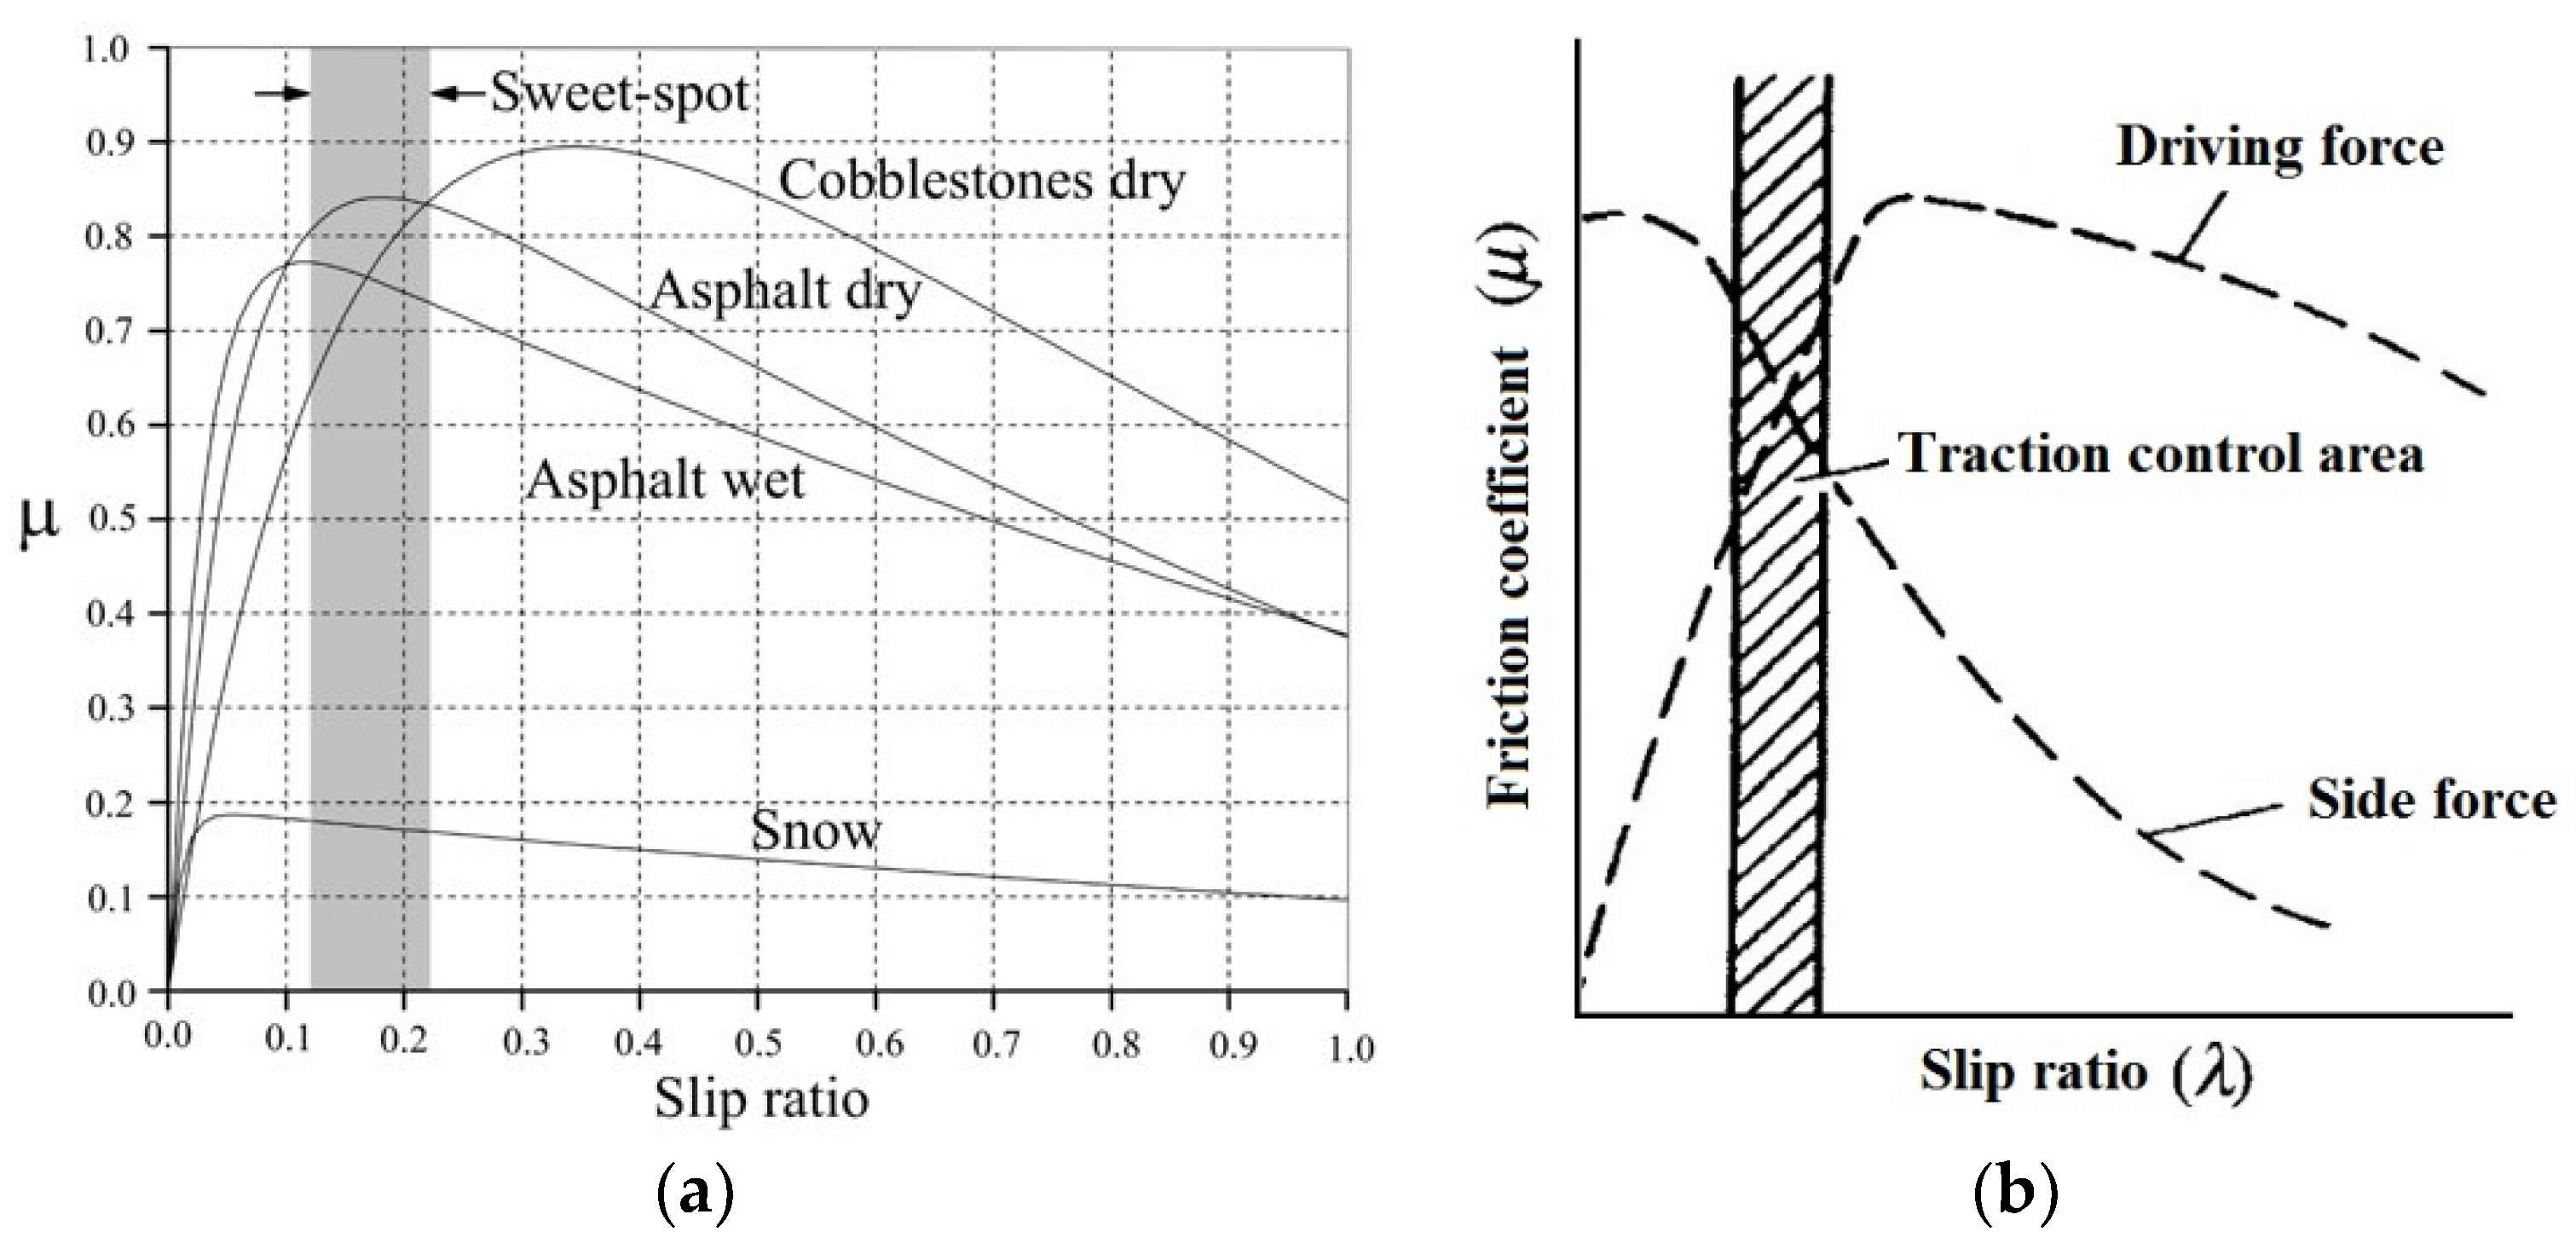
16]. The researchers reported that it is challenging to ascertain the pavement skid condition using onboard measurements. Accordingly, the study recommended a slip ratio that ranges between 0.2 and 0.25 after a sweet-spot range (0.125–0.215) to be considered for the application design. The results showed that the proposed range provides a maximum friction coefficient for all types of road surfaces, which supported the aforementioned challenge and eliminated the need for predicting a certain skid resistance value in the model. Hori et al., (1998) developed traction control models utilizing the advantage of having a quick and precise motor torque in EVs. The proposed SCS application was in agreement with the optimal slip ratio control and model following control. The researchers reported the significant relationship between the vehicle driving forces, traction control area, and skid resistance [
17].
Bera et al., (2011) explained the relationship between the pavement friction coefficient and the slip ratio considering several pavement conditions that include dry asphalt, wet asphalt, and snow as shown in
Figure 2a [
16]. In addition, Hori et al., (1998) explained the relationship between the pavement friction coefficient and the slip ratio considering the vehicle’s driving forces, traction control area, and side forces as shown in
Figure 2b [
17].
It can be argued from the review of literature that many researchers rely on predicting the skid control parameters based on the vehicle kinematics. Thus, detailed guidelines for real skid numbers such as the BPNs of pavement surface under different driving conditions (i.e., dry and snow) is important to improve the current application’s design strategies.
Influence of Sealcoats on Skid Resistance
Abdul-Malak et al., (1988) reported that the skid resistance occurs when the tire rolls over the pavement surface [
18]. Skidding depends on the quality and texture of the pavement surface. The performance of pavement skid resistance can be significantly varied by the type and the materials used in the construction of sealcoats. Sealcoats provide benefits to pavement surfaces by reducing further asphalt deterioration, which prolongs the lifecycle of pavement structures. The Washington Department of Transportation (WDOT) concluded that sealcoats can improve pavement friction by enhancing the texture of aged or distressed roadways [
19].
On low-volume roads, the Utah Department of Transportation (UDOT) utilizes aggregate sealcoats for pavement maintenance. An aggregate sealcoat, which is commonly called “Chip seal”, improves the roadway skid resistance by removing the polished aggregate of the roadway and replacing it with a rough-textured aggregate material [
20]. It should be noted that the aggregates used to build sealcoats shall meet specific standards. The aggregate must be resistant to polishing, clean, and free of fine materials. As long as these standards are met, almost any type of aggregate can be used successfully in pavement maintenance and rehabilitation projects.
In cold regions, many roads experience excessive ice and snow during the long winter seasons. Drivers tend to use studded tires and similar alternatives to improve the friction between the pavement and the tires, which provides safer driving conditions. However, such use might not be the best solution because it causes faster roadway deterioration, cracks, and asphalt rutting. Transportation agencies utilize sealcoats as a pavement treatment and preservation technique to enhance the roadway skid resistance. An effort was made by Zubeck et al., (2012) to survey and recognize the best practices of pavement preservations and sealcoats. The study concluded that Fog seals, Chip Seals, and Slurry Seals are used in cold regions and have the potential for use in a state like Alaska [
21].
3. Materials and Methodology
The methodology is divided into three main sections. The first section defines the materials used and the construction stages of each selected sealcoat in a dry laboratory-controlled environment and in the field under a snow testing environment. The second section describes the British pendulum tester (BPT) that is used for collecting the skid measurements for the sealcoats. The third section shows the statistical analysis used to capture the differences in the British Pendulum Numbers (BPNs).
3.1. Skid Simulation of Sealcoat Materials
Researchers have relied on simulation tools to estimate the benefits of new vehicle-based applications and technologies in a risk-free controlled laboratory environment [
22,
23]. In addition, several studies developed co-simulation platforms based on multiagent systems and machine learning algorithms to evaluate the advantages and disadvantages of the system [
24,
25,
26,
27]. In our study, the results from six-selected sealcoats, high friction seal treatment (HFST), sand seal treatment, fog seal treatment, cape seal treatment, chip seal treatment, and slurry seal treatment, were adopted from Abaza et al., (2017) for comparing the skid resistance under different simulated weather condition [
28]. The simulation of sealcoats was carried out by applying the material on a standard 20-inch by 20-inch plywood section that replicates a complete cross-section of a hot mix asphalt pavement as shown in
Figure 3. A portable British pendulum apparatus (BPT) is used for measuring the simulated pavement skid resistance.
According to the International Slurry Surfacing Association (ISSA, 2012) and AASHTO (2002–2015), the construction of sealcoats must follow the industry standards [
29,
30]. The high friction surface treatment (HFST) was prepared by spreading KwikBond HFST over calcium bauxite. In this study, a total of 0.1 gallons of KwikBond HFST resin was applied over 6 pounds of calcium bauxite. This was followed by sweeping the coated surface to remove the extra aggregates after reaching full cured resin. The sand seal consisted of applying the aggregate according to the AASHTO (2015) specification [
30]. A total of 8 pounds of clean sand was applied over 0.09 gallons of heated liquid bitumen. The fog seal consisted of applying heated liquid bitumen over the designated plywood surface. According to the California Department of Transportation specifications, a total of 0.07 gallons of bitumen was diluted with 43% of water to construct the fog seal [
31]. The chip seal was constructed by applying 3/8-inch chips (or aggregates) on a heated liquid bitumen. In this paper, a total of 11 pounds of aggregate was used over 0.16 gallons of bitumen. The slurry seal was constructed by mixing mineral aggregates with asphalt emulsions according to the ISSA standards. For preparing the slurry samples, a total of 5 pounds of slurry aggregate was mixed with 1.1 pounds of preheated emulsions along with 4 pounds of Type (II) aggregate. Manual hand spreaders were used for applying an even amount of slurry seal on the designated plywood surface. The cape seal was a mixture of chip seal and slurry seal. Based on the construction methods mentioned above, a chip seal surface of plywood was left to dry for 24 hours before adding the slurry seal. All sealcoats were left for 24 h to dry and cure before running the test.
3.2. Skid Resistance Data Collection
The British Pendulum Tester (BPT) was developed by the United Kingdom transportation research laboratory in 1960. It is considered a dynamic pendulum impact-type tester that can be used to test the energy loss when the edge of a rubber slider is propelled over a test surface. This test was used in this paper to mimic the sliding of a vehicle on a pavement surface for adjusting the skid control application’s parameters.
The BPT tester can be used in a laboratory environment as well as field testing. An operator needs to maintain the test on flat surfaces or using curved specimens in a laboratory-controlled environment from accelerated polishing-wheel tests. The BPT is used to measure the energy loss when the rubber slider slides along the pavement test section. The value measured with the pendulum apparatus is defined as “BPN”. This BPN is used to estimate the surface skid resistance and to correlate with the efficiency of a vehicle traveling at a speed of approximately 10 km/hr in real-world driving conditions. The pavement surface skid resistance can be influenced by several factors, such as the vertical loads and vehicle velocity. It should be noted that all such factors can remain constant and controlled in the simulated laboratory. The remaining variable in this experiment is the sealcoat surface skid characteristics.
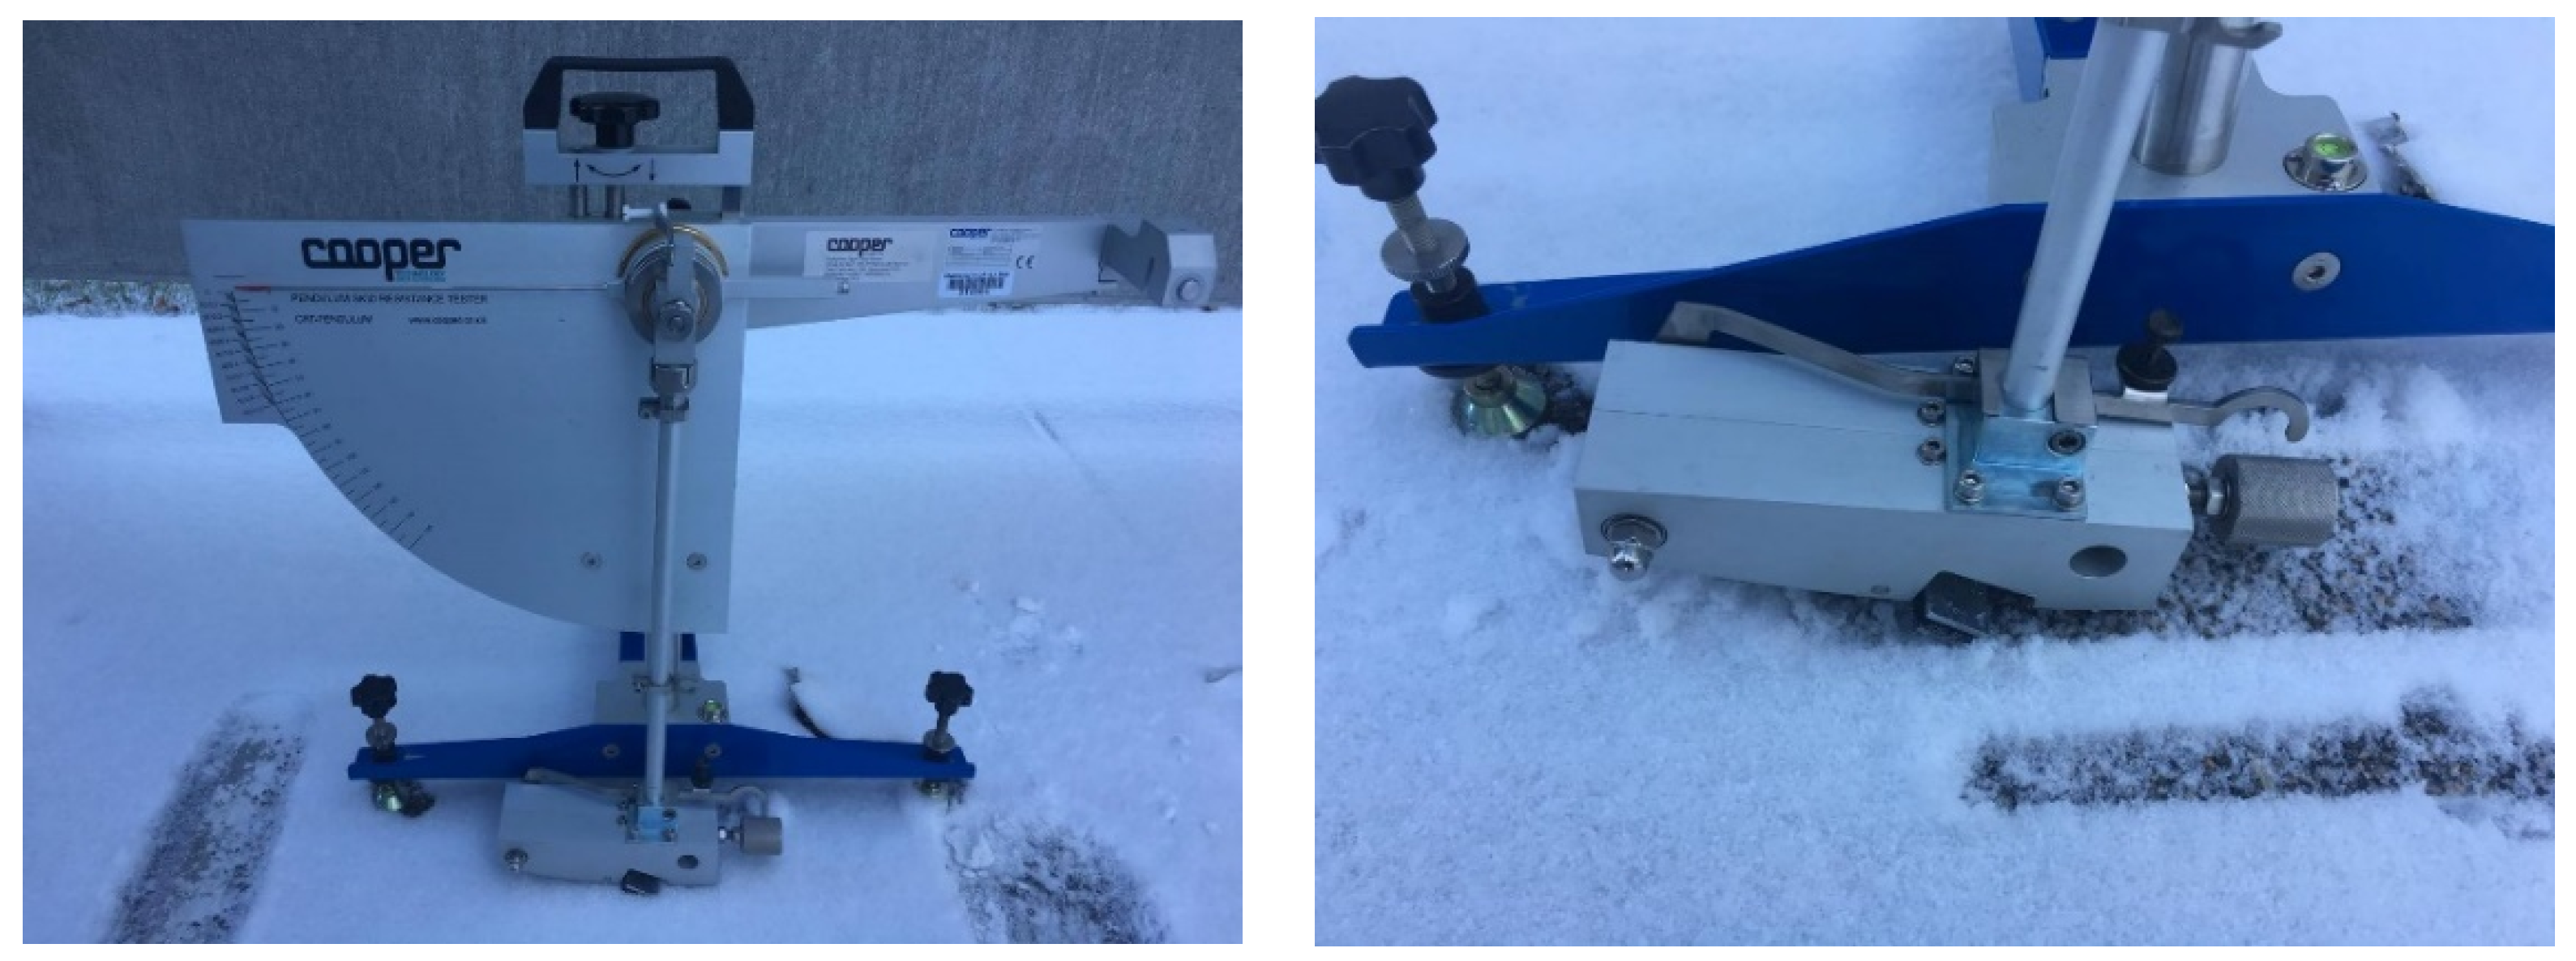
For measuring the skid resistance under snow weather conditions, an open hot mix asphalt (HMA) field location was designated in an open parking lot to simulate the sealcoats as shown in
Figure 4. The pendulum-type tester method consists of utilizing a slider made of rubber similar to the most common rubber materials used in tires. Simulated testing surfaces were cleaned and wetted prior to conducting the test. The BPT was raised to a locked non-rotating position then released using a designated button to allow the rubber slider to make direct contact with the simulated sealcoat. The Pendulum Skid Number BPN was measured using the drag pointer indicating a friction between the rubber slider and the pavement surface. A large skid number indicates a high friction testing surface and vice versa.
3.3. British Pendulum Numbers and Statistical Analysis
Data were collected from a total of 24 BPT runs on each simulated sealcoat under both weather conditions. A student t-test was used to compare the mean BPNs of the dry weather conditions and snow weather conditions. The hypothesis testing of the results highlighted:
Ho: There is no difference between the summer and snow results.
Ha: There exists a significant difference between the summer and snow results.
The results of the test statistics and
p-values are shown in
Table 1. In addition, a descriptive analysis was done to identify the differences between the average BPNs for each sealcoat as shown in
Table 2. Based on the results, the lowest BPN could be selected for future design of the skid control systems in modern vehicles. The analysis highlighted the impact of pavement surface conditions on fine-tuning the skid control parameters.
4. Results
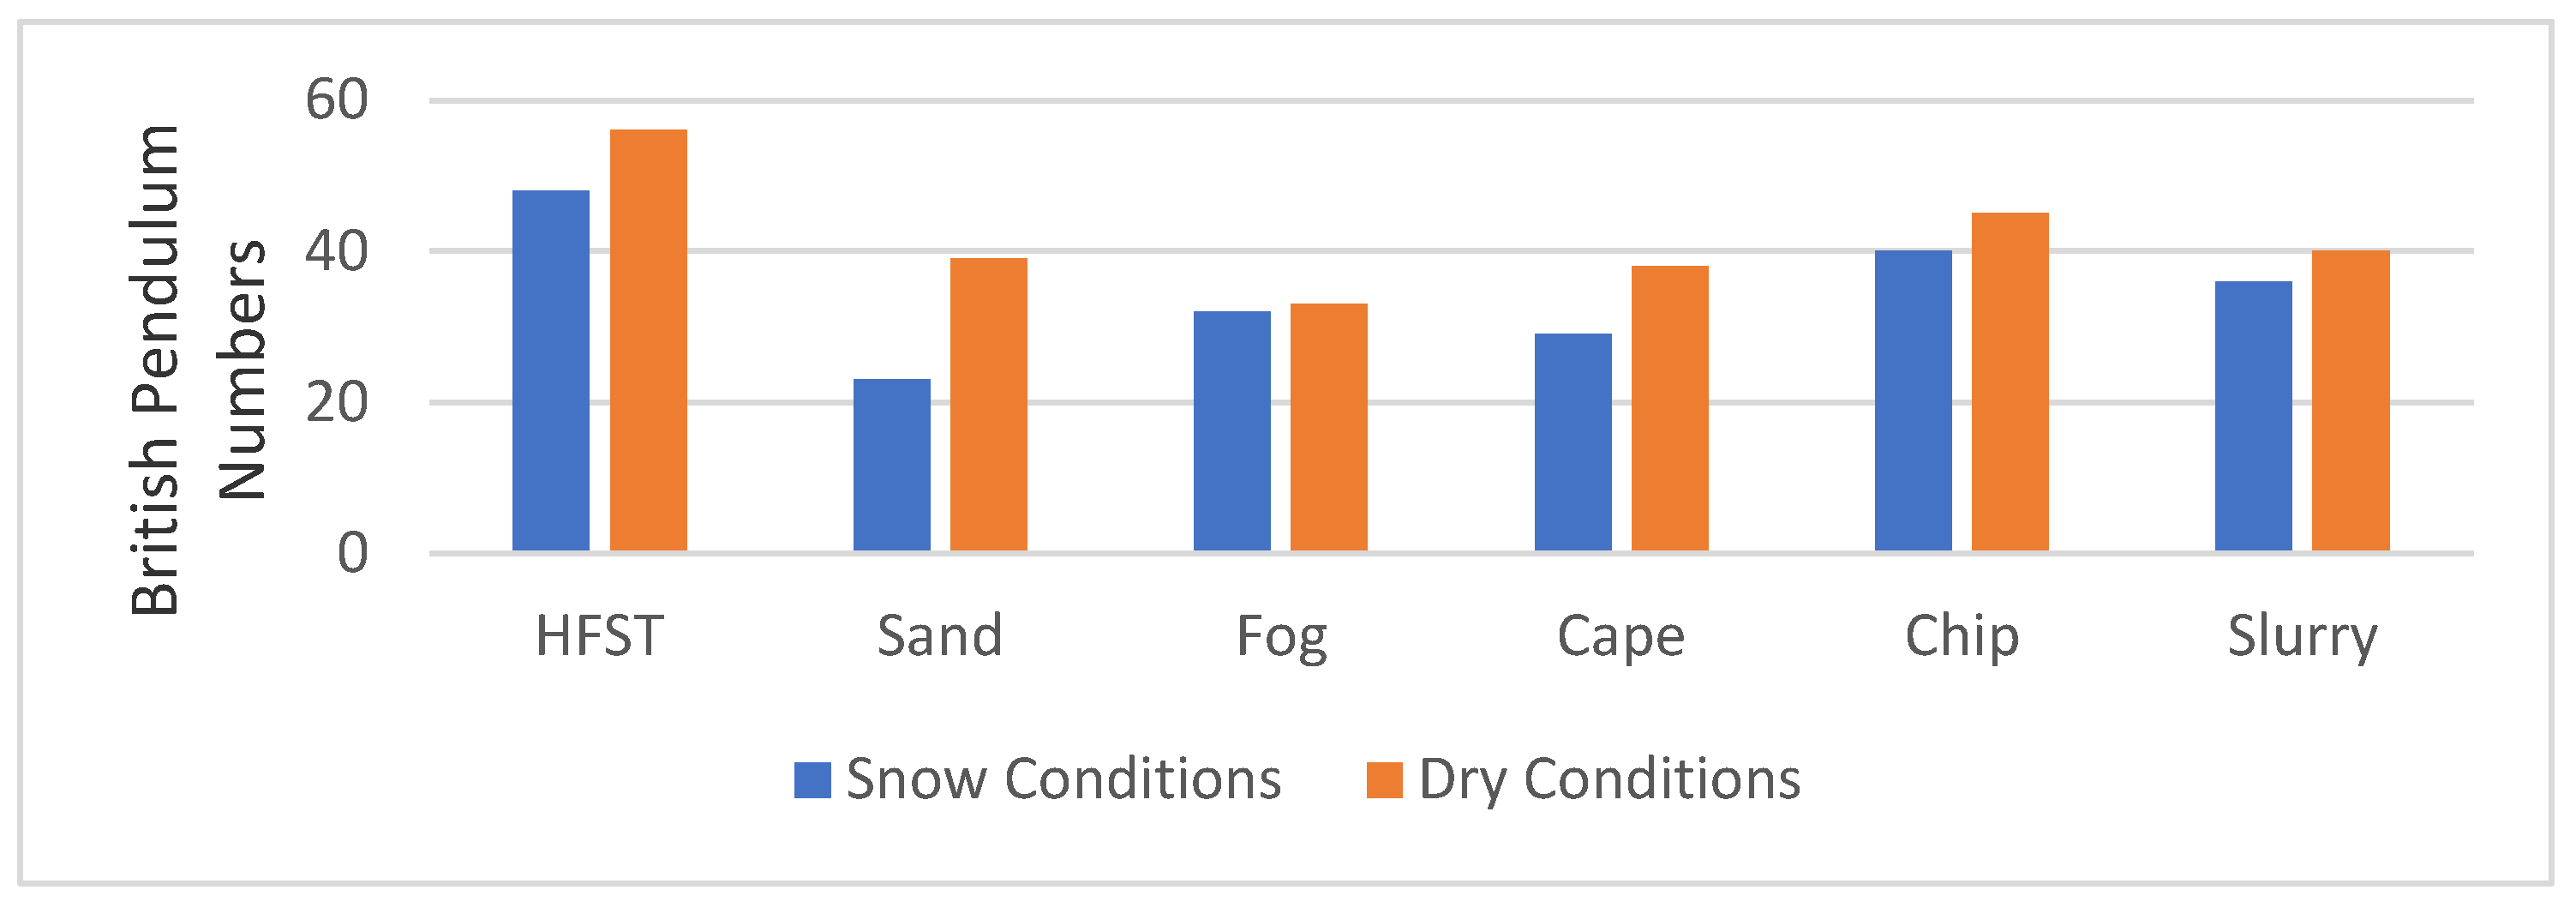
Skid BPNs were collected from a total of 24 BPT runs over each simulated sealcoat under both dry (i.e., laboratory) weather conditions and snow (i.e., field) weather conditions. It should be noted that the construction of the cape seal was the most challenging as it requires mixing two types of sealcoats together, however, the sand seal was the easiest in construction because an even surface could be achieved smoothly. The results of the mean BPNs are shown in
Figure 5. The results show that the HFST scored the highest number with an average BPN of 46.29, and 53.75 for snow and dry weather conditions, respectively. However, the sand seal scored the lowest BPN under snow weather conditions with an average BPN of 22.63, while the fog seal showed the lowest BPN under dry conditions with an average BPN of 31.94.
The statistical analysis results showed that, except for fog sealcoat, the p-values for the five sealcoats (HFST, sand, cape, chip, and slurry) suggested rejecting the null hypothesis to conclude that the skid resistance of sealcoats was significantly different when tested under different snow and dry conditions. The presence of snow had a significant impact on reducing the surface friction and texture of the examined sealcoats.
There is no sufficient evidence at the 95% confidence interval that there is a significant difference in the mean skid numbers for the fog sealcoat.
Based on the result of the skid resistance testing,
Table 2 shows a set of BPNs suggested to be used in SCS applications. Maintaining these thresholds in the SCS design will prevent the vehicle wheels from sliding during acceleration or sudden brakes particularly on low skid resistance roads. The proposed numbers can be used to assist the predictive skid control-based applications that rely on predicting the pavement slip ratio.
5. Conclusions
Twenty-four readings under both conditions (dry and snow) were sorted. Based on the t-test analysis, there is a significant difference between the BPNs for (HFST, Sand, Cape, Chip, and Slurry) surface treatments in comparing snow weather conditions and dry weather conditions. Based on evaluating the performance of the skid resistance on the samples, the skid control application can be designed to maintain the minimum average skid number with a need for further adjusting the application threshold to accommodate for cold regions. The most conservative approach is to design the application considering the lowest skid number that ranges between BPN 22.63 and 31.94. The results of this study can be beneficial to the automotive industry and transportation agencies when deciding to fine-tune the parameters of the skid control applications in modern vehicle technologies.
It should be noted that the results reported in this paper have potential limitations. First, the average skid numbers were based on data collected from 24 test runs, which is considered a relatively small sample size. Second, the sealant preparation was done manually in a laboratory environment according to the industrial specifications and standards. Surface treatments are considered vendor-dependent materials and can vary from one manufacturer to another. Future research work will focus on conducting wide-scale testing for constructed sealcoats under real driving conditions.


