1. Introduction
Nowadays, product innovation is required to shift to a more sustainable innovation due to raising environmental issues. One of the cases of sustainable innovation implementation is in the transportation sector. The sustainability transition in the transportation sector is deemed necessary due to some emerging warning signs such as high traffic congestion rates (especially in the big cities), high-dependence on fossil fuels, and increased pollution rates [
1]. In the more contextual scope of Southeast Asia, there is a vision on transforming the vehicle market of Southeast Asia into the most fuel-efficient in the world by 2025 as a form of supporting the ASEAN Economic Community 2025 vision [
2]. EV implementation is one of the solutions to establish this vision. Moreover, from the economic standpoint, transportation and mobility are critical since it is one of the backbones of the national economic advancement, with an extremely high economic multiplier effect. This is because the transportation industry is supported by many layers of tier suppliers, which develop different components and sub-assemblies for the vehicle systems.
Although many developed countries have been successfully implementing EV as their majority mode of transportation, developing countries are still struggling in the early stage to make a transition to use EV as one of the efforts to reduce carbon emissions. In Indonesia, this transition is even more challenging due to the population distribution, which is very scattered, thus developing a government initiative has been unevenly implemented [
3]. Simultaneously, government initiative is one of the central stimuli for EV adoption, particularly in developed countries [
4,
5]. Therefore, it is deemed necessary to ensure that the transition process into a cleaner transportation mode runs effectively. However, the acceptance of a government initiative depends on the people’s decision to adopt EV. Besides government initiatives, other factors may influence the EV adoption rate, such as price, technical aspects, performance, style, etc. Moreover, in this era of vastly developed information technology, the internet and social media have been the main factors influencing decision-making [
6].
This research aims to combine the aforementioned factors in an agent-based modeling framework to investigate EV adoption in Indonesia. Agent-Based Modeling is chosen for its ability to inspect the effect of agents’ interaction and other influential factors (microlevel) on the big picture of a particular problem (macrolevel). The microlevel and macrolevel are derived from the multi-level perspective (MLP) framework, which is equipped by the nature of agents in terms of their adopter’s category and communication mechanism on social media. The results of this framework modeling are expected to provide insight into how the particular factors should be tuned to ensure the acceleration of EV adoption in Indonesia runs effectively and efficiently.
2. Literature Review
2.1. Fundamental Theory of Sustainable Innovation Ecosystem
Since EV is one example of sustainable innovation products, a previous theory of sustainable innovation ecosystems will be beneficial in recreating the initial framework to identify the involved actors and mechanisms. Several supporting theories have been found to build a more comprehensive construct of a sustainable innovation ecosystem. The main idea of the ecosystem, which is conceptualized by frameworks, has been studied from a myriad of perspectives. In sustainable innovation, the studies stem from the institutional theory, resource-based view, stakeholders’ theory, and evolutionary theories [
7]. The earliest framework emphasizing the innovation-related actor and mechanism is the Technological Innovation System (TIS). This framework views that the innovation system consists of the interacting stakeholders in the specific institutionalized economic area [
8]. While this framework is deeply concerned with the rigid hierarchical entities rather than the resource-based view with its social dynamics, another framework incorporating the Socio-Technological Transition (STT) view is suggested. This perspective on social dynamics embraces the uncertainty factors, which also differ in each stage of the innovation process [
9]. Since these two fundamental frameworks are complementary, the multi-level perspective (MLP) framework to integrate these views was developed [
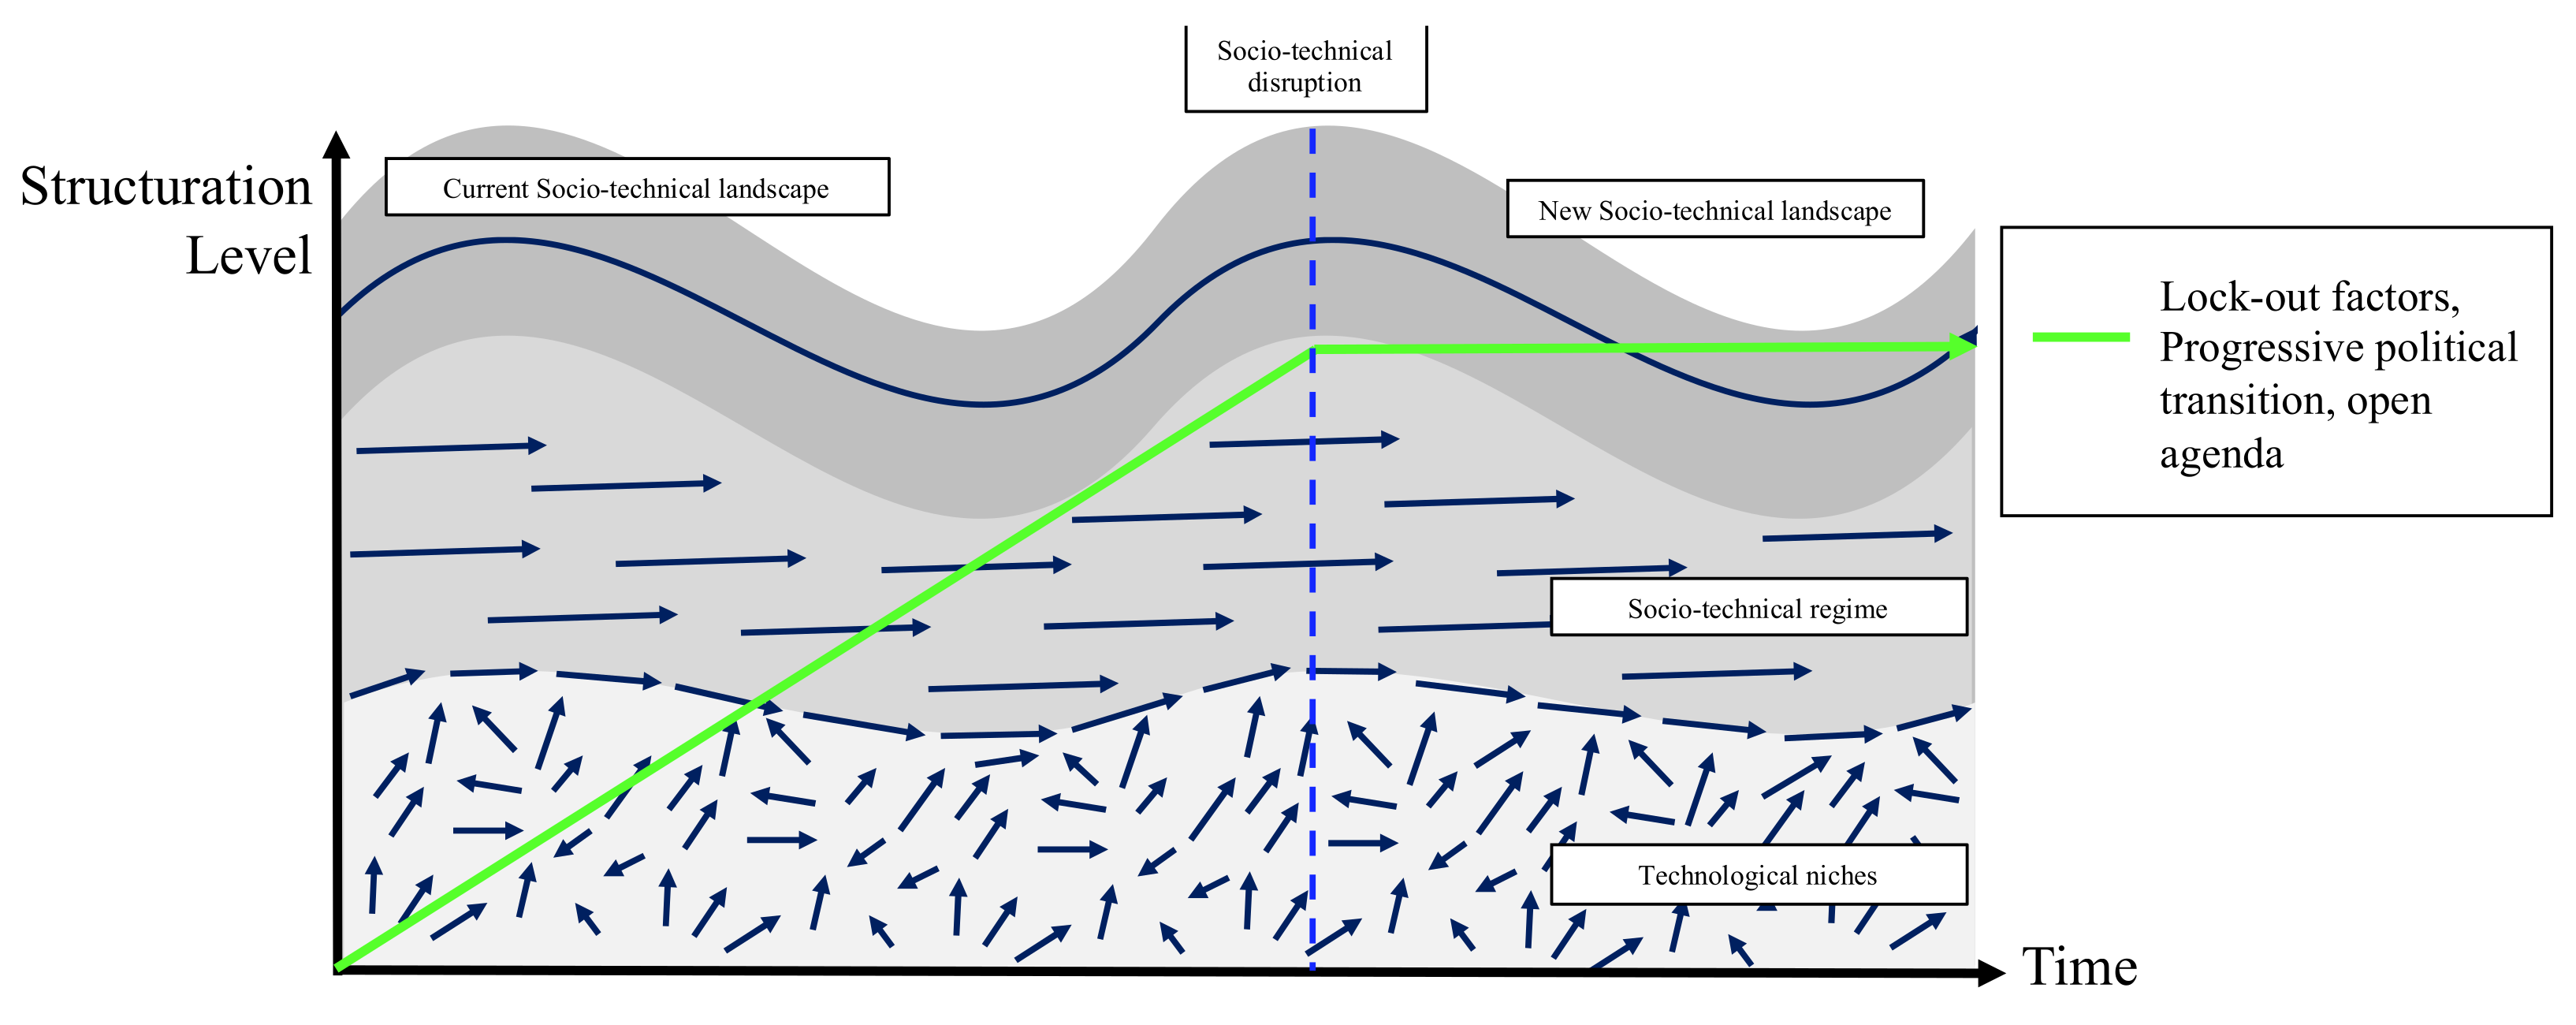
10]. This framework resulted in layers of innovation systems consisting of technological niches (derived from TIS), socio-technical regimes (derived from STT), and the socio-technical landscape. The latter level of MLP provides additional insight into adding the factor of context to this discussion.
In the milieu of the transition towards sustainable innovation, MLP is driven by many influencing factors as well as inhibiting factors. The main influencing factor is a political transition to adopt sustainable innovation, supported by the open agenda, regimes, and spatial aspects [
11]. Conversely, the factors that could either foster or inhibit (lock-in factors) this sustainable innovation transition are resources, technologies, and stakeholders [
12]. The path-dependence properties of innovation transition must also be considered. Therefore, the progressive policy transition as the lock-in factor is required to shape the well-established sustainable innovation system.
While innovation is deemed successful when the market accepts it [
13], having a perspective on the business ecosystem is considered beneficial. The investigation into the case of sharing mobility companies in Shanghai reveals that the transformation into a sustainable city is strongly co-evolved with the business ecosystem innovation itself. The co-evolution of the progressive policy transition with the market and technical niches will foster the nascence of sustainable technology emergence at the early stages [
14].
Sustainable transportation will create a novel system that will be different from the previous unsustainable transportation system strategy; in particular, for its technology, socio-economic aspects, and policy-making plan. This novelty requires a massive and synchronous network of related stakeholders, such as government, academia, and industry players, to keep innovating and catch up with sustainable transportation technology progression. However, the transportation sector is one of the most significant infrastructural projects with the consequences of high risk and uncertainty, which leads to a tendency towards innovation avoidance [
15]. The critical and strategic sector faces the great innovation dilemma due to its reluctance to undertake a high-risk project, while on the other side, it is required to continue innovation and conduct research to avoid sectoral collapse. Therefore, the innovation process must be undertaken by the whole, rather than individual actors in the network.
There are five prominent actors in the innovation ecosystem: entrepreneur, university/research center, risk capital, government, and corporate [
16]. The detail of the mechanisms in each layer, as well as the involved actors, are outlined in
Table 1.
2.2. Innovation Diffusion Theory
In a particular social system, individuals adopt innovation gradually, beginning with the utilization of the first idea of innovation. However, the investigation into time of adoption of the specific individuals is considered cumbersome, so the categorization of the adopter with a similar innovativeness degree would be more practical. This categorization also benefits the related stakeholders in deciding on the treatment for a particular adopter category to increase innovativeness. Referring to the objective, innovativeness is operationalized as the main dependent variable. This main variable could depict the behavioral change, which correlates with the innovation success rate.
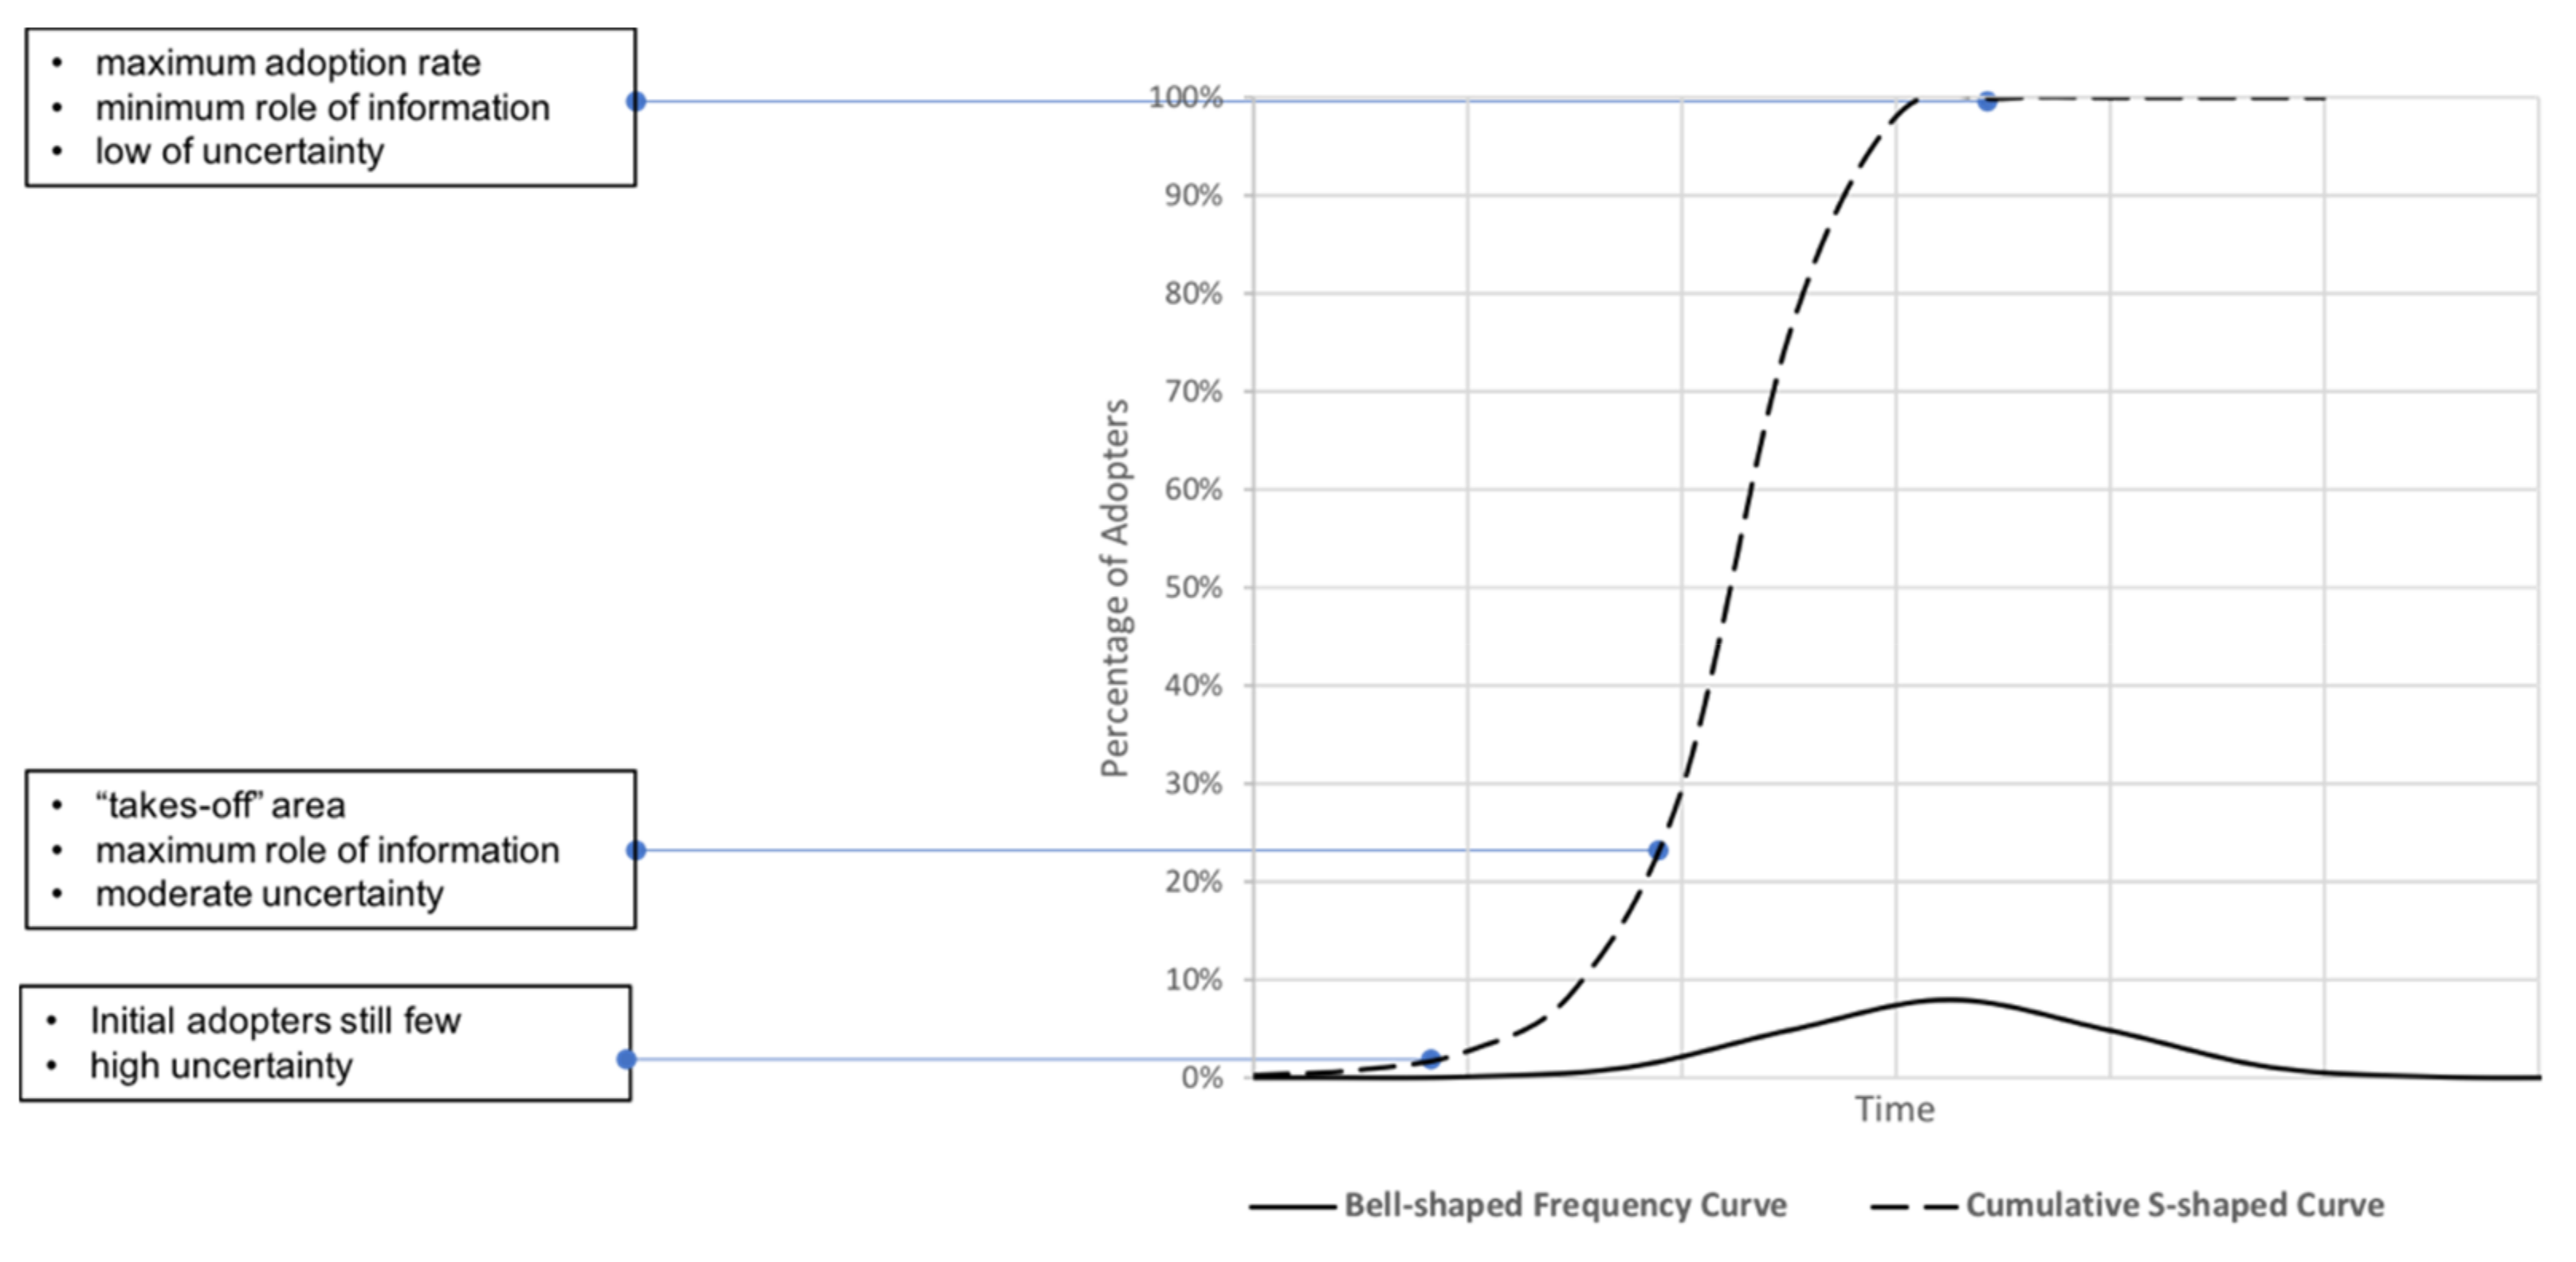
The adopter distribution over time could be plotted in two different representations: frequency curve and cumulative curve. Previous research has shown that the frequency plot will form the bell-shaped distribution (bell-shaped), while the cumulative plot will form the s-shaped curve (See
Figure 1). The “take-off” area is crucial since it marks the network activation time when the role of information reached its peak among members of a social system [
17].
The categorization of adopters is derived from the frequency curve, which complies with the three characteristics of categories: (1) exhaustive, meaning that all units of analysis are included in the category; (2) mutually exclusive, which means that a specific unit belongs only to one category; (3) all units of analysis are categorized according to the same principle or rule. There are five categories derived from the categorization principle of the normal distribution: innovators, early adopters, early majority, late majority, and laggards. Laggards could also be categorized into early and late laggards to ensure the categories are evenly distributed [
17]. However, unlike innovators and early adopters, those two laggards’ categories could be merged into a single category due to their similar properties. The properties of each category of adopters are presented in
Table 2:
2.3. Agent-Based Modeling
Agent-Based Modeling (ABM) has been widely used, especially in social science, due to its system complexity, particularly its ability to simulate the big picture based on the individual decision-making process [
18]. Resnick has created the metaphor for the system of a flock of geese collectively flying in a tight formation. The flock of geese looked like a single moving organism, while apparently, each bird inside the flock moves individually. However, these birds are moving harmoniously due to the reactions of their closest neighbors, which results in a dance-like movement. This flock is then modeled as an aggregation of local interaction at the relational level by Reynolds. The birds are depicted as agents which interact with each other and are influenced by the environment. This modeling is known as ABM [
19].
Macy and Willer imposed the four key assumptions of ABM as follows [
20]:
Each agent is autonomous. The system’s pattern does not centralize from the top, and rather it is caused by the local interaction of each agent decision. In other words, this process is called “self-organization”.
Agents are interdependent. This interdependency could act both directly and indirectly. The agents are influenced by the behavior change of some agents and by an environmental factor.
Agents follow simple rules. Simon found that global complexity consists of individuals who are governed by simple rules. ABM assumed that the simple behavioral assumption could lead to a global pattern [
21].
Agents are adaptive and backward-looking. It is assumed that agents are adapted to their environment by learning from the evolution or previous history of both individual and population levels.
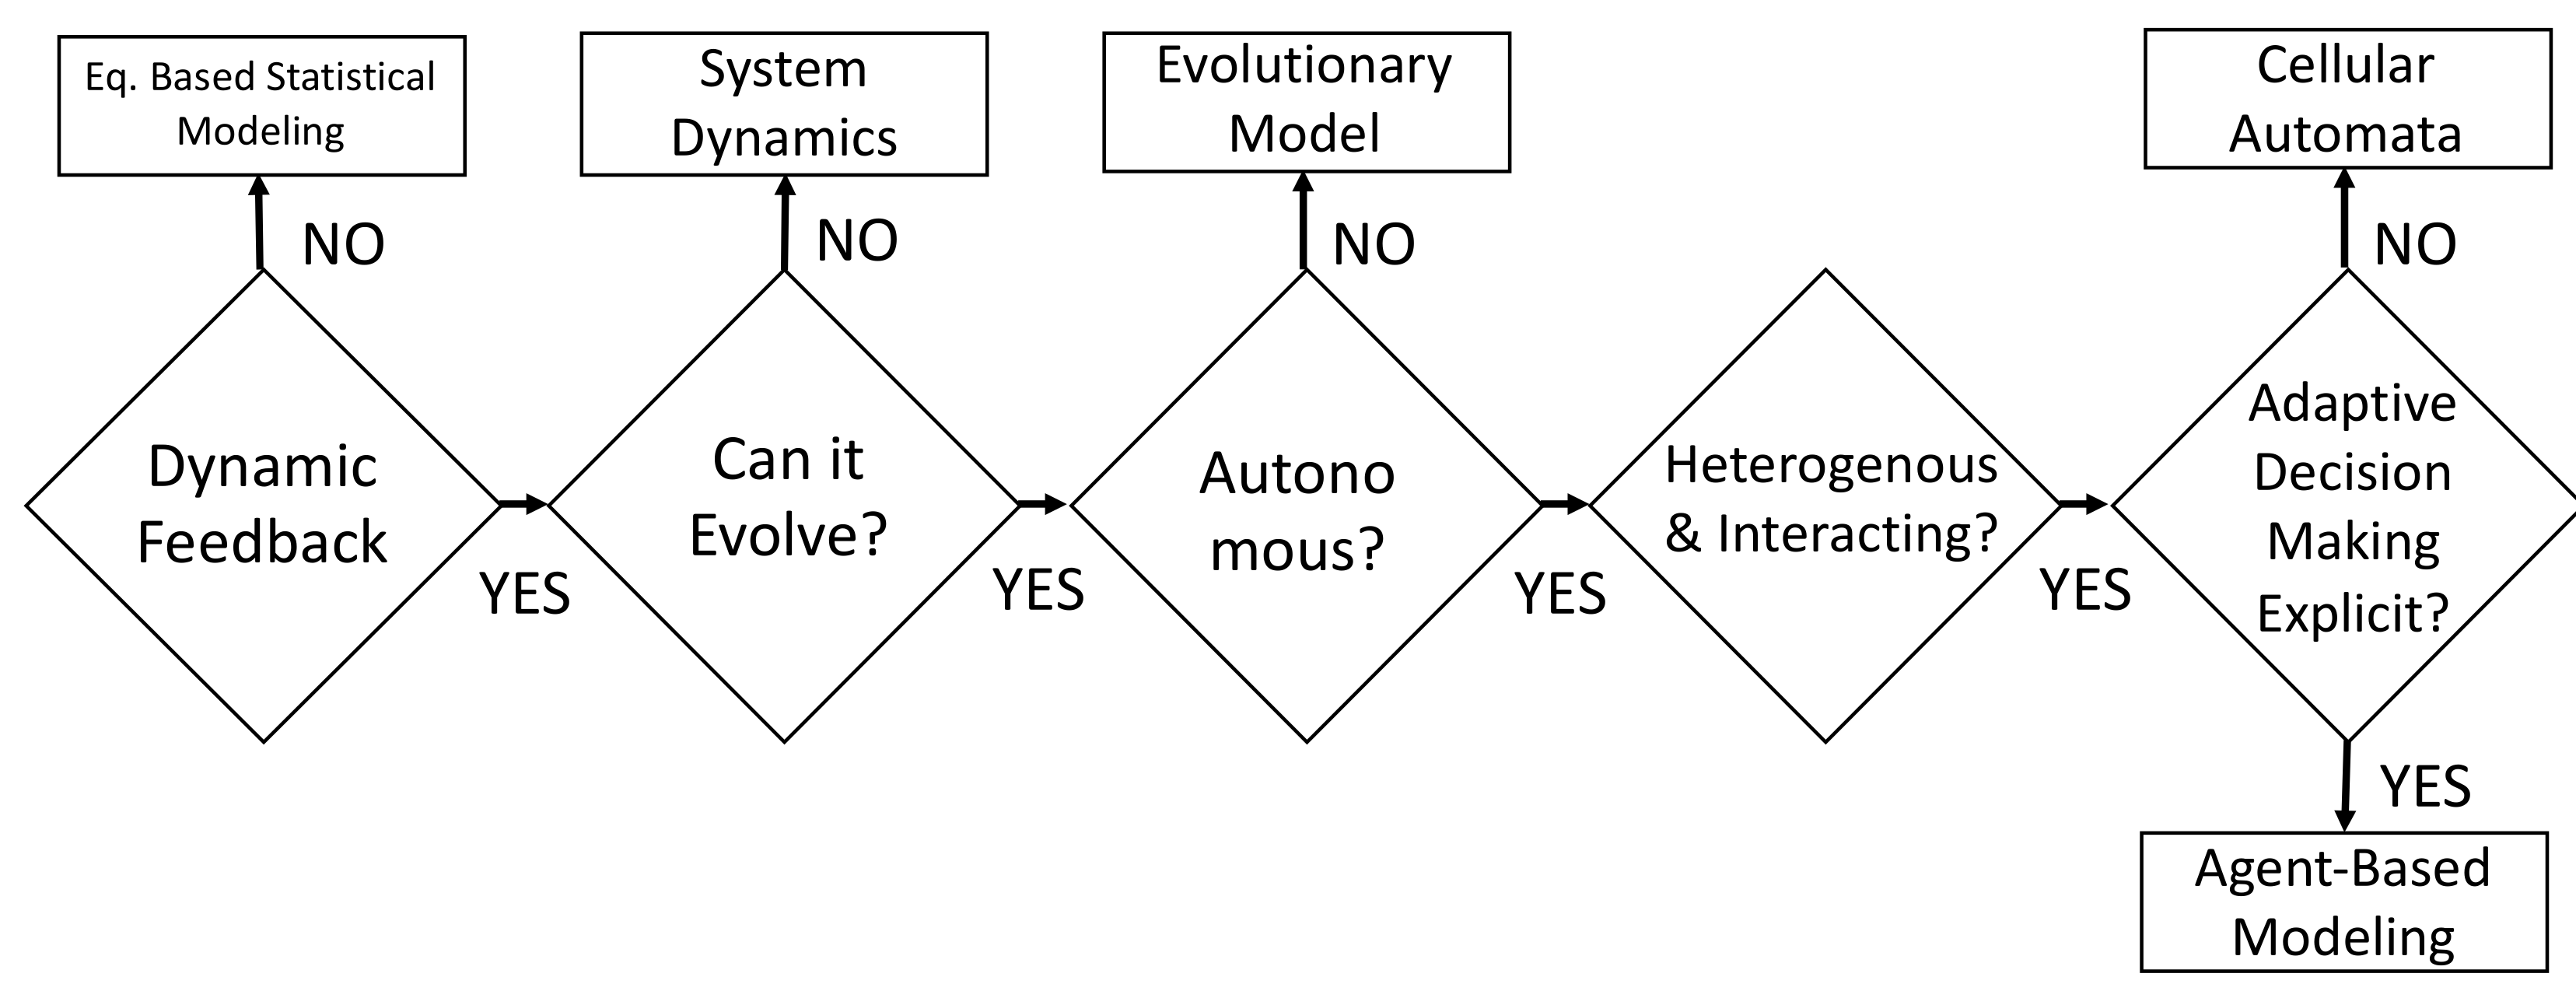
In the case of a business ecosystem study, especially the identification of how ecosystem stakeholders interact and influence the ecosystem’s pattern, ABM is the appropriate method.
Figure 2 presents the decision diagram [
22] regarding ABM as the appropriate model.
Previous studies on ABM application to investigate EV market penetration in several countries and regions have been established. In Switzerland, the agent-based model is based on the demographic data, mobility model, EV charging behavior, EV charging infrastructure model, and placement. The EV distribution is assigned randomly in the stochastic EV use model [
23]. In the U.S., the market penetration of various EVs (BEV, EREV, PHEV, HEV) and ICE are identified using ABM. There are four agents in the model: consumers, regions, governments, and vehicles. In this framework, the probability of the agent purchasing a particular vehicle type is determined by purchase price, word-of-mouth effect, environmental cost, charging, and total maintenance and refueling cost [
24]. In the case of San Francisco, the agent-based framework is based on an ecological modeling approach that considers agents’ individual properties and EV ecosystem properties. The agents’ individual properties consist of age, income, workdays, location, range, emission levels, social networks, and vehicle range. Moreover, the EV-related properties consist of cost of power (electricity or gas), existing rebates, public charging stations, vehicle type, trip duration, and discount rates. This framework puts more emphasis on agents’ daily trips located in a particular geographical location [
25].
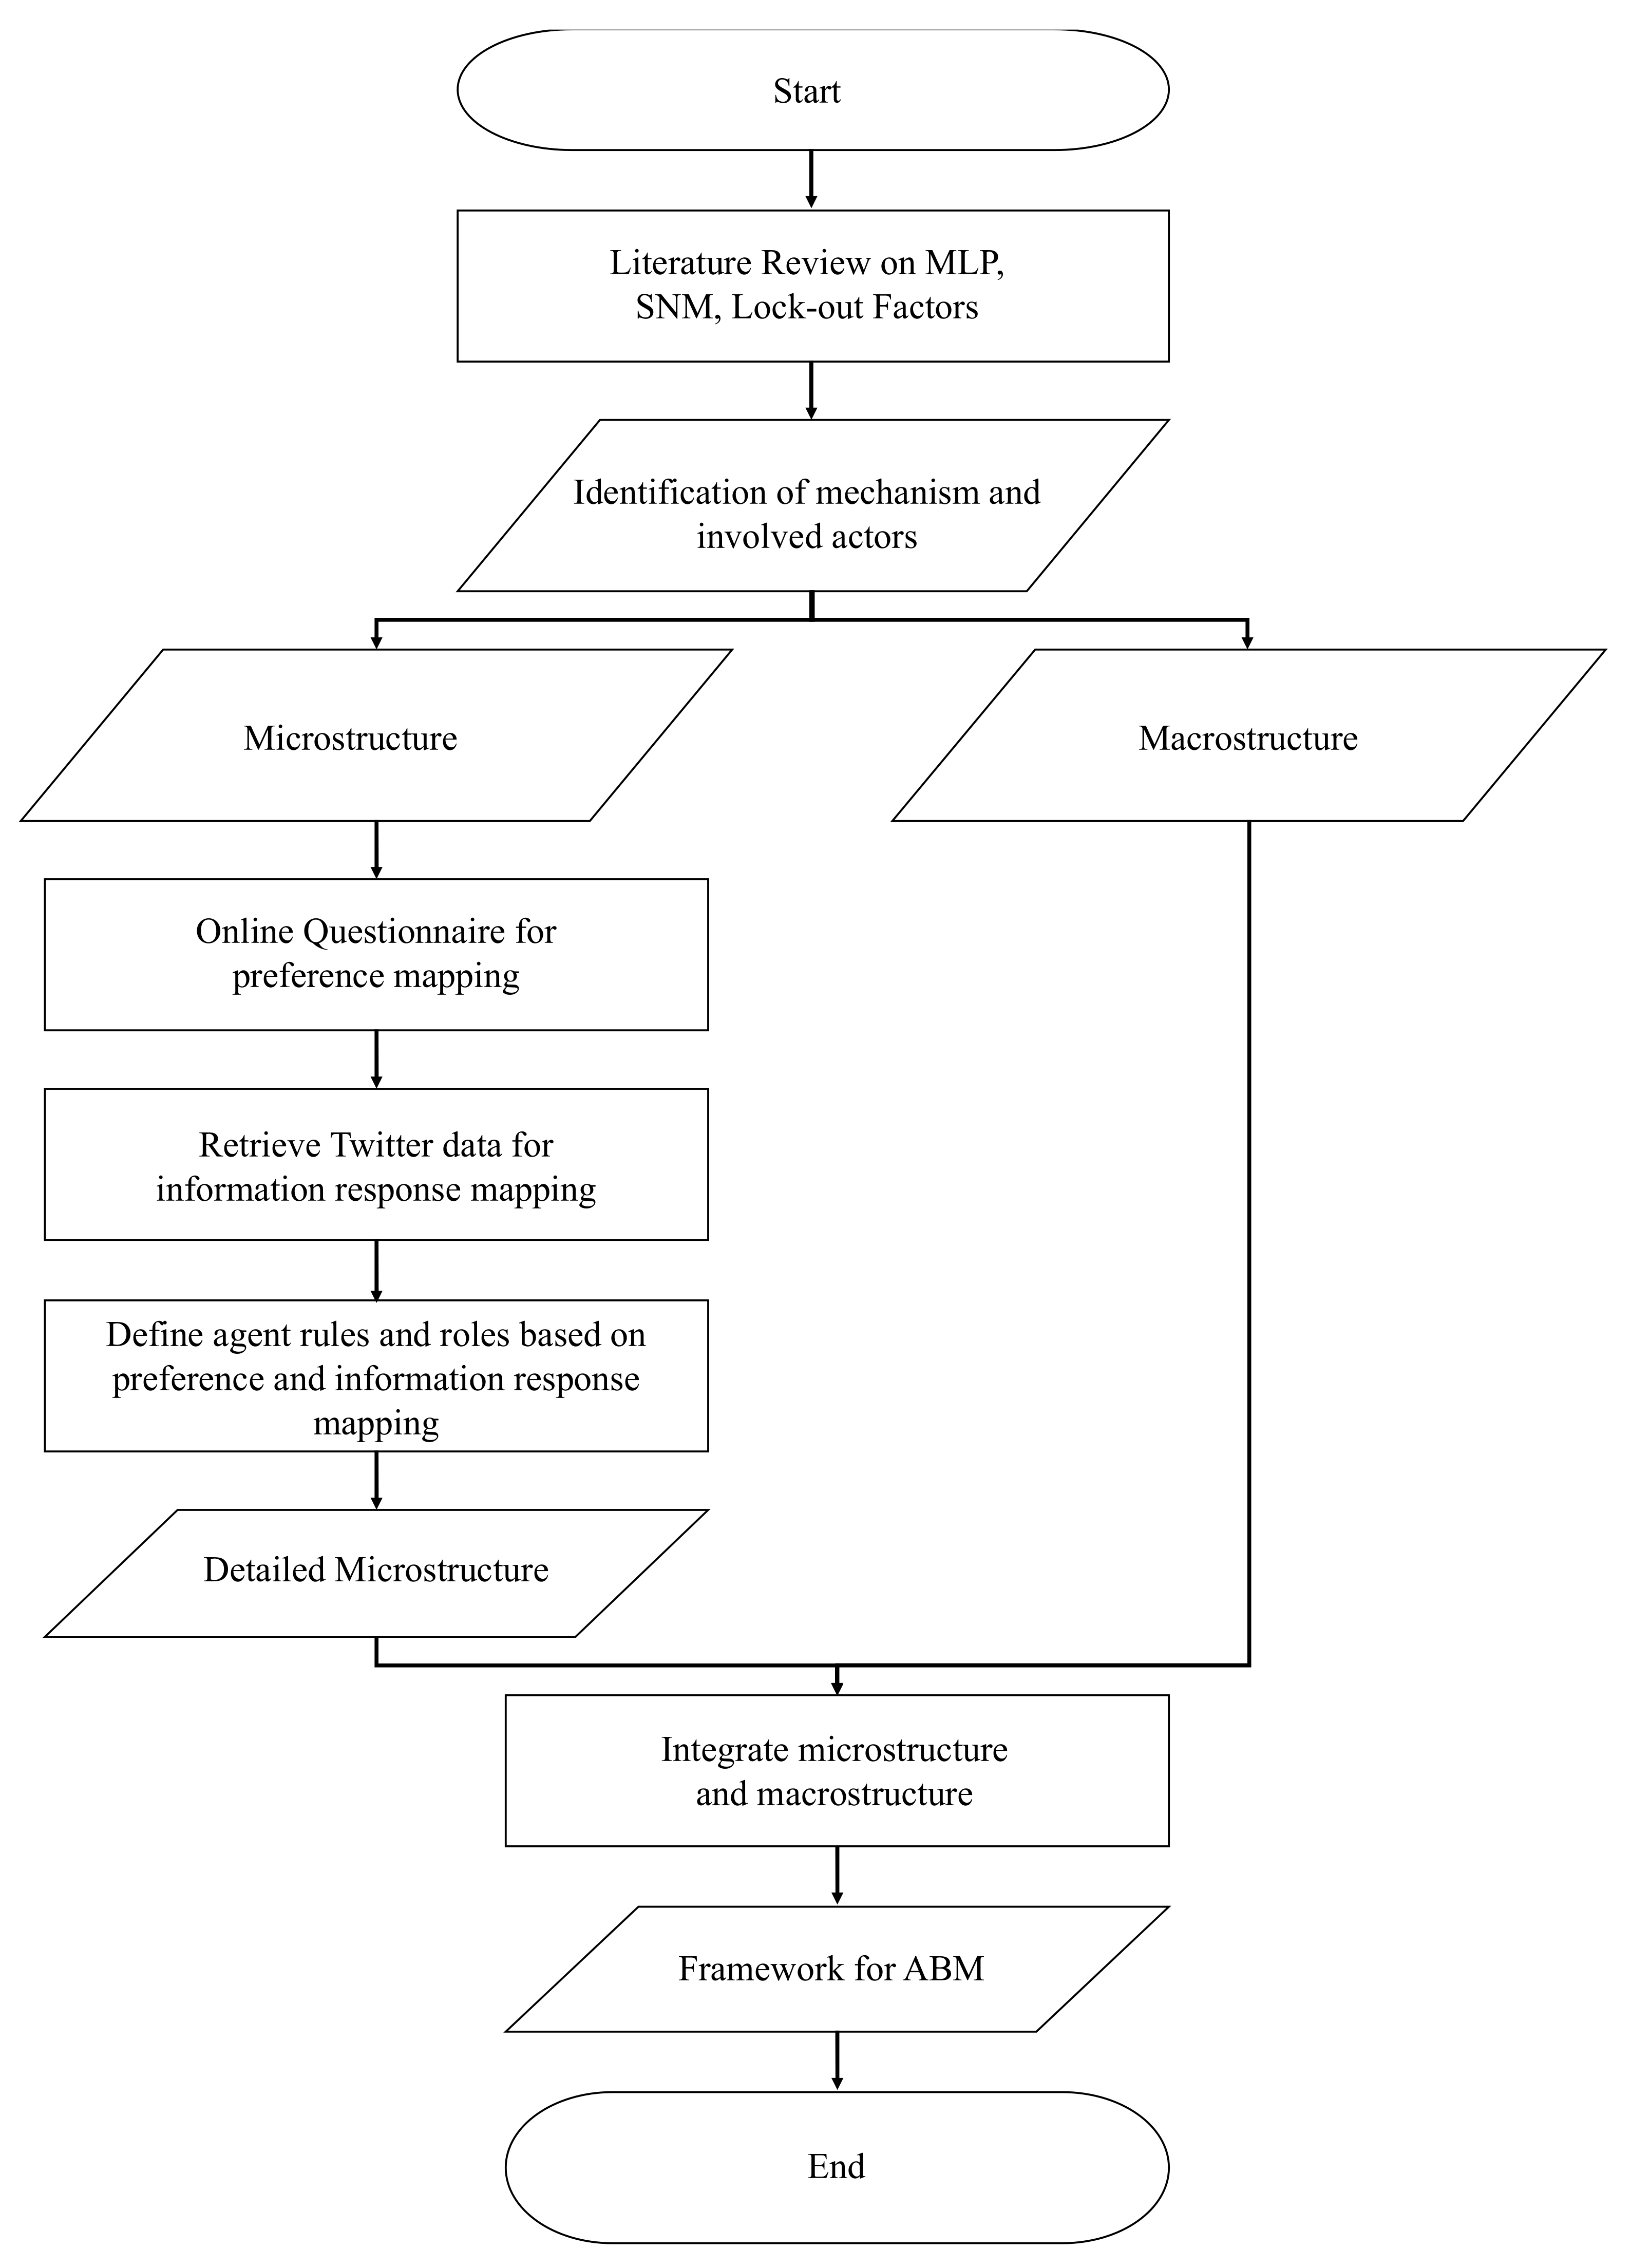
3. Methodology
The overall process of ABM framework creation can be divided into three main steps: identification of involved actors and mechanism of each layer through a literature review to define the microstructure and macrostructure; detailing of microstructure and its mechanism; integration with the macrostructure. The flowchart of the overall process is provided in
Figure 3.
The initial stage of designing the ABM framework is identifying the involved actors and the mechanism in each of the MLP layers through a literature review. This stage aims to decide the microstructure that yields the emerging properties in the macrostructure of the framework. The adopted MLP layers must be adjusted with the context of EV adoption in Indonesia. Therefore, enhancing the mechanism in MLP layers with other moderating factors of EV adoption will be beneficial.
Since the ABM requires a detail of the agent’s interaction mechanism inside the system, it is necessary to explore the factors that influence the agent to adopt EV. The online questionnaire was distributed to the general public in Jakarta City to gain preliminary data on the determining factors for adopting EV. Jakarta city was chosen because it is the capital city of Indonesia, and the first city to implement a regional policy for EV. The questions were divided into three sections: domicile, vehicle ownership, familiarity with EV, preference on technical properties of the vehicle, and preference on incentive for a particular vehicle. The last two factors are derived from the adopter’s category significant properties, which are divided primarily into those who consider economic factors (early majority, late majority, and laggards) and those who consider technical aspects (innovators, early adopters). There are 23 variables involved in the questionnaire presented in
Table 3. The respondents were required to choose 7 out of 23 of their most-prioritized factors.
This questionnaire’s results were analyzed using cluster analysis to put the respondents into the group based on their similar preferences [
26]. In this context, the respondents were clustered based on the adopter’s category group (See
Table 2). Since cluster analysis was utilized as the exploratory method, there are no particular rules for determining the sample size [
26]. However, ANOVA was used to validate the clustering result by choosing the significant variables.
Despite the factors arising from the questionnaire, the agent’s dynamics also include the mechanism of information exchange. To create these dynamics, two probability parameters are introduced: is the internal probability that depicts how agents communicate between each other or respond to specific information. This will depend on the location in which the agent lives. is the external probability that depicts the factor in the environment that will affect the agent’s decision to adopt EV. will depend on the agents’ preference from their cluster’s characteristics. The total probability of adopting EV is the summation of and .
The internal factor was calculated using Twitter data. Twitter data was chosen due to its ability to show unstated preferences and a personal statement regarding EV in a specific location. The Twitter data was retrieved from its Application Program-ming Interface (API), which resulted in the following data:
The overall process of
calculation is illustrated by the flowchart provided in
Figure 4. First, the raw Twitter data (Tweet) were retrieved in the JavaScript Object Notation (JSON) format and then parsed into Comma Separated Values (CSV) format to ease the data tabulation and analysis. Since these Twitter data were used to identify the engagement of EV-related information in a particular location, these data were filtered and grouped based on the location at the city level. This data filtering is necessary to omit the tweets with an unidentified location.
There are two out of six parameters retrieved from the API, which indicates the interaction level of the tweets: number of retweets and number of favorites. The “retweet” is Twitter’s feature that enables the user to repost or share the tweets of other Twitter accounts. Users can also retweet and add some comments on the particular tweet. Meanwhile, “favorite” is Twitter’s feature that enables the user to give appreciation to or to like a particular tweet. The favorited tweets can be accessed on the user’s profile page.
The interaction rate (
) in each region, coefficient of engagement (
), and
were calculated using the following formulas:
where
is the number of favorited tweets related to EV,
is the number of retweeted tweets related to EV, and
is the number of tweets related to EV.
Finally, the ABM framework is the integration of the detailed microstructure with its mechanism and the macrostructure. The macrostructure allows us to assess the big picture of a particular phenomena, in this case, the number of adopted EV.
4. Results
4.1. Cluster Analysis Result
The 161 observations from questionnaire result were analyzed using the k-means cluster analysis method. From the iteration of the result, it was found that k = 4 gives the best clustering result. The results can be seen in
Table 4, while the cluster solution can be seen in
Figure 5.
From the results outlined in
Table 4, there are 11 significant variables with sig. < 0.05. As observed from the F-value, the top three variables with great segregation among clusters are: (1) vehicle range; (2) vehicle price; (3) vehicle speed. Meanwhile, the three variables with the least segregation are: (1) vehicle emission; (2) spare part availability; (3) charging method. This result implies that most respondents still consider the factors which are not related to EV properties but are more related to daily vehicle utilities. The vehicle range, which is considered the most impactful factor, implied that most Indonesian people utilized private vehicles for long-distance trips. In the case of EV, this consideration might lead to a range-anxiety phenomenon which has to be anticipated by the vehicle manufacturer for the Indonesian market. Moreover, to increase the EV adoption rate in Indonesia, these significant factors could be applied as the reference for incentive or disincentive.
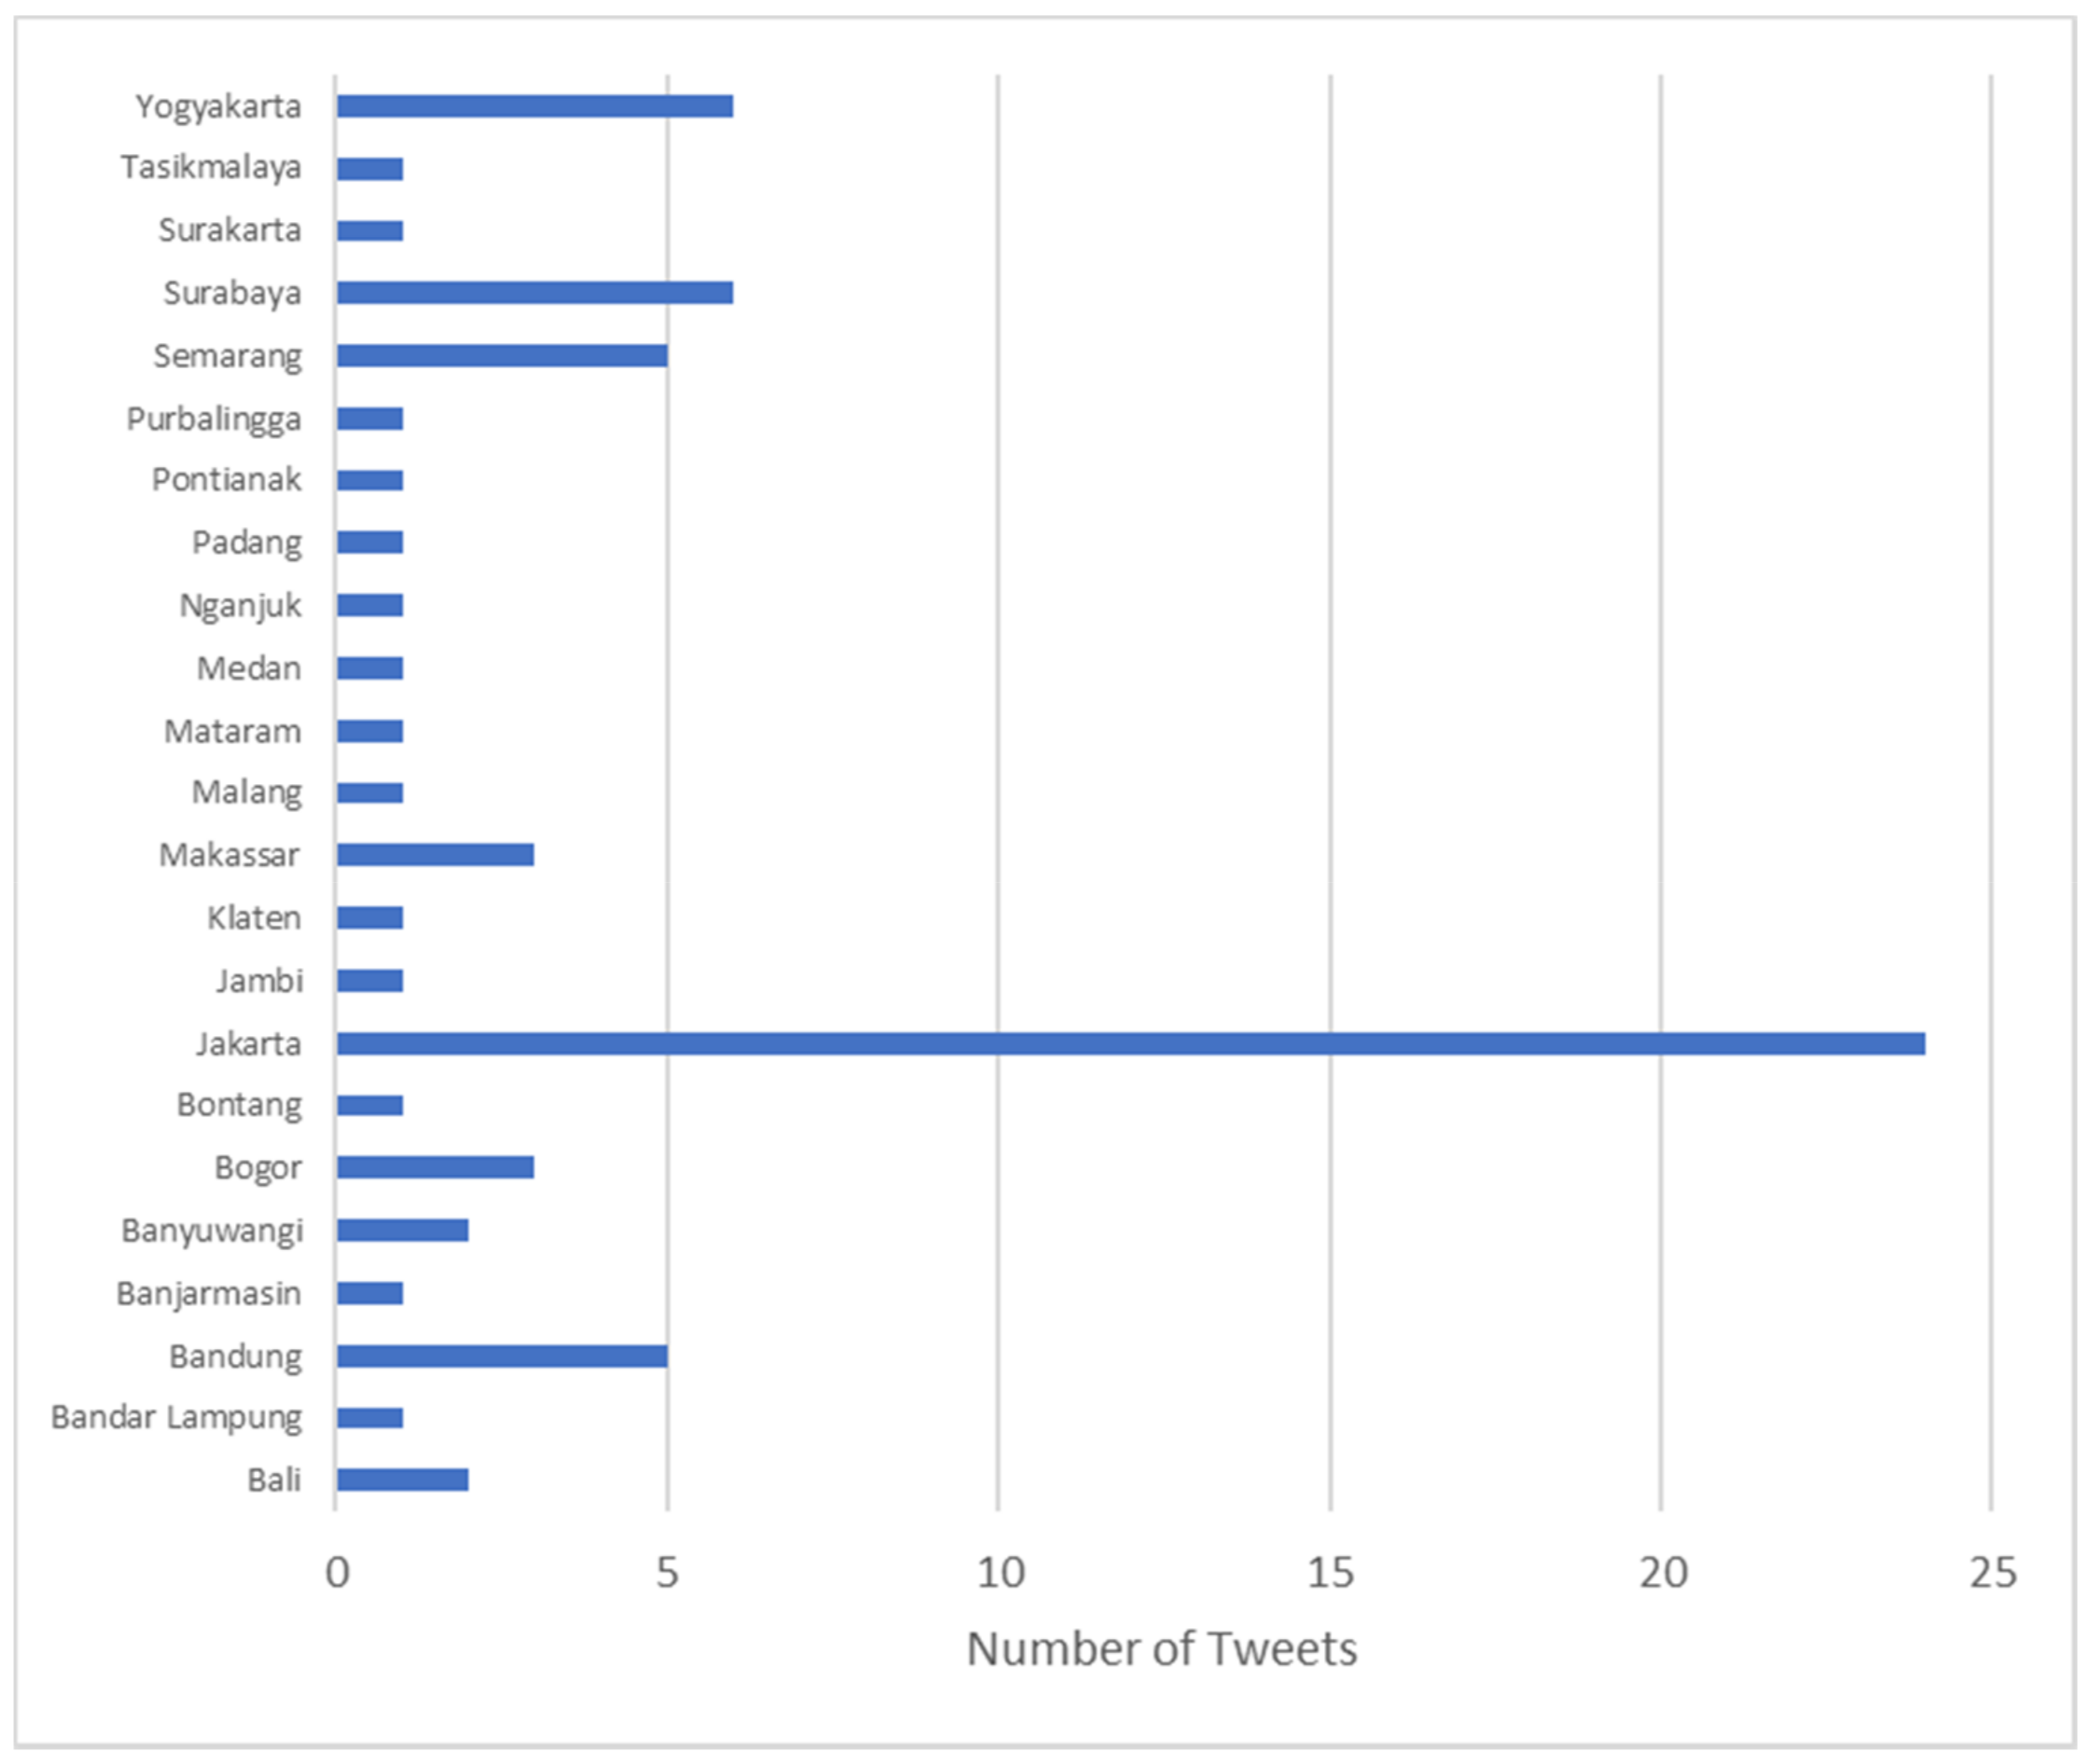
4.2. Engagement Coefficient Calculation
From 200 retrieved tweets from October 2020 to February 2021, there are 70 EV-related tweets with “Kendaraan Listrik” (Electric Vehicle) and “Mobil Listrik” (Electric Car) as the keywords. The results are presented in
Figure 6.
The cities with a minimum of five tweets were considered in the engagement coefficient calculation, as presented in
Table 5 below:
The value will depend on the amount of information introduced to the agent. In this context, information could take the form of vehicle property information and the number of EV brands introduced to the market in Indonesia, etc.
5. Discussion
5.1. Suggested Framework
Figure 7 depicts the framework of sustainable innovation that incorporates the MLP with the added factors and mechanisms. The layer of sustainable innovation is adopted from the MLP framework, which inferred that sustainable innovation occurs in three layers: technological niches, socio-technical regimes, and landscape or contextual consideration. This framework incorporates the MLP [
10] in one specific landscape that has undergone the sustainability transition. Within this landscape, the moderating factors are introduced that will successfully bring technological niches into a sustainable socio-technical landscape. One moderating factor is the lockout factor that incrementally detached the dependency on the currently unsustainable technology, namely Internal Combustion Engine (ICE) technology in terms of sustainable transportation technology. Secondly, the progressive political transition will foster this transition in terms of a strict top-down approach to enforce the sustainable technology implementation, thus contributing to an increase in the lockout phenomenon. Conversely, an open agenda on sustainable innovation research allows the sustainable technological niche to be strengthened. In order to shift the technological niche towards a socio-technological regime, those moderating factors must be increased over time until they reach the socio-technical disruption in which the current socio-technical landscape is transformed into a new sustainable socio-technical landscape.
While the disruptive innovation theory relies heavily on product performance [
27], this socio-technical disruption encompasses the interaction between the technological aspect with the social and political regime transformation. This makes the related actors and mechanisms even more complex, yet richer in terms of the underlying process. The interesting difference from the case studies of sustainable product/technology innovation, compared with conventional product/technology innovation, lies in the motivation of the adoption. The tendency of sustainable product/innovation adoption is relatively lower than the conventional technology/product. This is due to the relatively higher cost of sustainable product/innovation, lower availability, and lower perceived ease of use. Additional forces are required to ensure sustainable innovation is widely adopted in the defined period. This literature review found that the approach for consumers needed to be exerted both vertically and horizontally. The vertical approach is fostered by the regional policy. Thus, transforming the policy and ensuring the policy’s interoperability are essential, especially in the context in which social symbolic influence is minor.
Moreover, the horizontal approach must be acquired by ensuring business readiness. This is significant to keep both the innovation and production at the desired pace. Another factor to be considered is that the transformation towards sustainability also co-evolves with the innovation of the business ecosystem. Therefore, business actors must continuously reevaluate and redefined their business model to cope with the sustainability transformation, regardless of how incremental the innovation is.
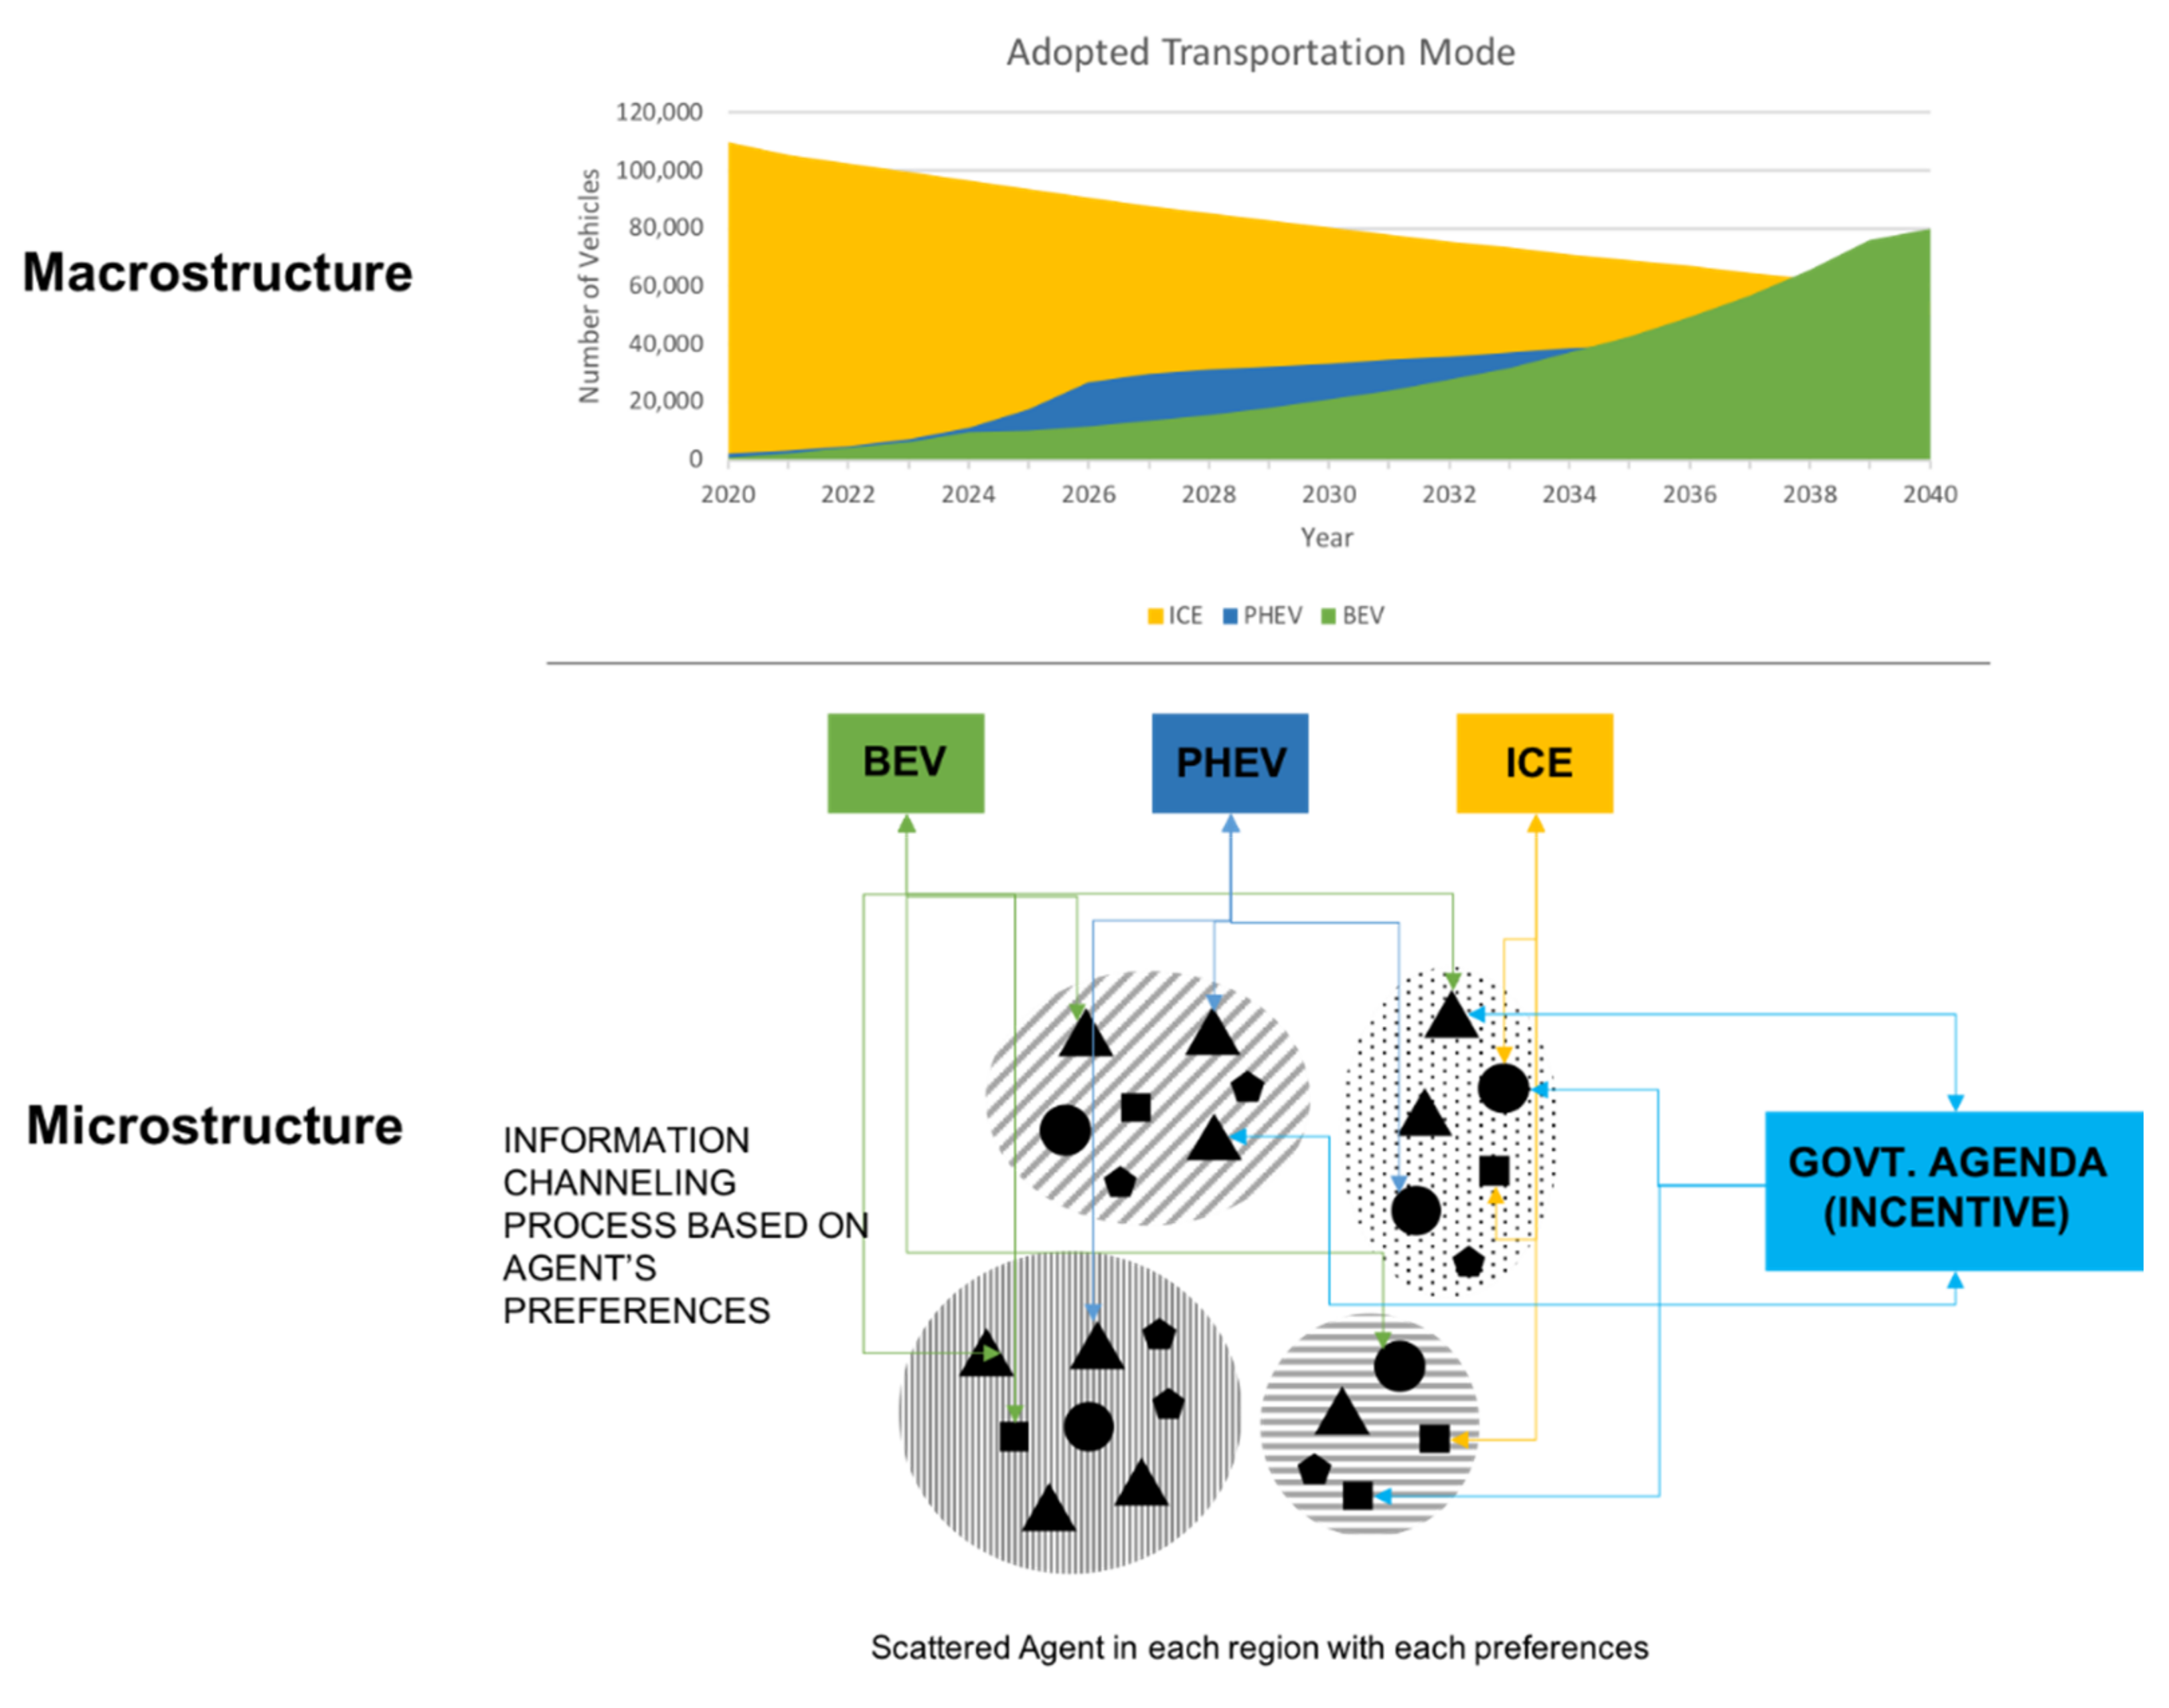
It can be concluded from the above framework that the microstructure will consist of a scattered agent, which is influenced by the results from a research institution, government agenda, or R&D of an automotive firm. This influential factor will result in the number of adopted vehicles each year.
5.2. EV Adopter Categorization in Indonesia
The agent’s decision-making process will be influenced by internal and external stimuli. In this framework, the external stimuli consisted of vehicle properties and a proposed incentive scheme.
Figure 5 illustrates that each cluster has different priorities, which gives them preference characteristics. The characteristics of each cluster and their innovation adopter’s category, presented in
Table 2, are as follows:
Cluster 1 (77 respondents, 48% of total respondents) demonstrates a strong preference for spare part availability. In the vehicle industry context, the spare part manufacturer or service provider will be widely available if there is a significant number of customers in certain places. This implied that this cluster has a strong preference to adopt EV when it is widely adopted by the majority of people. Thus, this cluster belongs to the late majority category.
Cluster 2 (9 respondents, 6% of total respondents) reveals a strong preference for style, vehicle capacity, charging method, maintenance facilities, autonomous features, and emission levels. This cluster shows adequate knowledge of advanced and EV-related vehicle technology, such as charging method, autonomous features, and emission levels. Moreover, this cluster does not consider the economic-related factors, which implies that they have control over their financial resources. Therefore, it can be concluded that this cluster belongs to the innovator category.
Cluster 3 (55 respondents, 34% of total respondents) shows a strong preference for vehicle price and vehicle range. These factors are highly correlated with the majority of Indonesian people’s considered factors when buying a vehicle [
28] regardless of its EV-related feature availability. This consideration fits the value and aspiration of the early majority category.
Cluster 4 (20 respondents, 20% of total respondents) reveals a strong preference for vehicle speed and title transfer incentive. These factors are not related to EV technology, meaning that this cluster does not consider the factor associated with EV as the innovation product. Thus, placing this cluster into the early adopter category would be doubtful since this category has a preference similarity with innovators on the technological factor. Another preference on title transfer incentive shows that this cluster is motivated by an economic factor when buying a vehicle. In Indonesia, title transfer tax is subjected to both new and secondhand vehicles with a maximum fee of 20% of vehicle price, which depends on the regional regulations. The incentive of that significant amount of tax will be strong for those who are motivated by an economic factor when buying a vehicle. The lack of financial resources is one of the laggards’ characteristics. However, their preference for vehicle speed related to technological factors, albeit a non-EV, contradicts the laggards’ attributes. Therefore, this cluster belongs to the non-innovator’s category, which is specifically motivated by vehicle speed and title transfer to buy a vehicle.
5.3. Agent-Based Modeling Framework
From the above framework, the suggested ABM framework is depicted in
Figure 8 below. The agents’ differences in their characteristic are divided into four clusters and symbolized with four different shapes. These individual agents are distributed into several regions which are symbolized into circles with various pattern fill. The combination of characteristic and region distribution of each agent contribute to the internal probability of the microstructure (
).
The dynamic of the microstructure is stimulated by the lockout factors in the form of incentives, such as the government agenda. Since the agents could be divided approximately into those who are concerned with the technological aspects and those who are concerned with economic aspects, these two stimuli will be the main factors that influence the agent’s external probability to decide on EV (). Moreover, the internal probability will be influenced by the nature of the agent in the form of chosen preferences based on their adopter’s category and their mechanism of information processing.
The dynamics in the microstructure will result in the macrostructure in the form of a cumulative number of preferred transportation modes each year. It is expected that the dynamic in microstructure could lead to the cumulative s-shaped curve of a particular transportation mode.
In the previous studies of ABM implementation to assess EV market share in other countries, the actual EV-related data are already available, such as charging behavior [
23], environmental cost [
24], and public charging station availability [
25]. However, in Indonesia, EV is a newly developed technology. Therefore, such EV-related data is limited to assess EV adoption in Indonesia. Considering EV, which is categorized as radical innovation [
29], the initial assessment on how the agents respond to the particular innovation is deemed necessary. This framework could assess the initial stage of EV adoption, particularly in Indonesia, where EV is newly developed, from the perspectives of innovation adopter category and social media effect.
6. Conclusions and Recommendations
This research provides the ABM framework by using the redefined version of MLP with additional factors and mechanisms from agents’ characteristics derived from the adopters’ innovation category. MLP is deemed suitable as the foundation to define the microstructure and macrostructure of the ABM framework due to their ability to explain the transition process from the scattered niches until they perform the learning process to form the new socio-technical regimes. In this context of EV adoption, the scattered niche is analogous to the scattered agent who is not exposed to the information of EV, and the new socio-technical regimes are the period when the new clean transportation mode overtakes the previous transportation mode.
The redefined MLP framework is equipped with the factors of transition to each layer. This redefined MLP framework is made contextual for electric vehicle adoption in Indonesia. It is concluded that the technical factors (as the result of innovation) and the government agenda in the form of incentive will be the main external stimuli for an agent adopting EV. This framework is enriched by the mechanism of information processing of agents by defining their internal stimulation for adopting EV. This internal stimulus is divided into two categories: preference-based stimulus and location-based stimulus. The preference-based stimulus is determined by the questionnaire regarding factors that influence agents to adopt EV. These agents are then clustered based on their preference by using the adopter’s category as the benchmark. Meanwhile, the location-based stimulus is defined by using Twitter data to map the exposure of information regarding EV in each area.
For the next stage, this framework could be used further for the modeling stage. It is expected that the dynamics of the microstructure, which is influenced by internal and external stimuli, will drive the agent to adopt the new cleaner transportation mode. The number of adopted clean transportation modes is depicted in the macrostructure in the form of the cumulative s-shaped curve. The setting of internal and external stimuli intensity will influence the formation of the s-shaped curve. Therefore, this ABM framework could be beneficial to assess the existing policy to accelerate the clean transportation mode adoption in a particular country that is still in the early stage of adoption, such as Indonesia. The added stimuli or policy could also be assessed to ensure its effectiveness.
In the context of Indonesia, where EV is a newly developed technology, the approach of innovation adopter categorization and social media effect enables a new perspective on assessing EV adoption. This is due to the limitation of existing EV-related parameters in Indonesia, such as charging behavior, public charging station availability, and environmental cost. Therefore, the utilization of this framework in the modeling stage would be beneficial for the policymaker to assess current policy to accelerate EV adoption in Indonesia. Besides, the EV manufacturer would also benefit from the modeling result of this framework, in terms of which factors attracting Indonesian people to purchase EV, so that the marketing strategy could be arranged effectively.
However, the generalizability of the internal and external probability formulation results is subject to certain limitations. For example, the number of Twitter data samples is limited so that only five cities are covered in the analysis. At a further date when other cities (especially capital cities) in Indonesia are developing a regional policy to increase the EV uptake, more Twitter data will be required regarding significant tweets pertaining to more cities. In addition, the number of questionnaire respondents is also limited so that only 11 variables are significant in the cluster analysis. Moreover, only 1 out of 10 incentive-related variables are significant in the analysis. Therefore, the result of this analysis could not be generalized, so that the other nine incentive-related variables were eliminated.
Considerably more work is required to collect more data to enrich the stimuli added to the model; for example, the preference for the word-of-mouth effect that will justify the opinion leadership position. Moreover, the external stimuli could also be divided based on the region if there are different regional policies regarding clean transportation technology. Furthermore, the engagement coefficient could be enriched by adding the sentiment analysis so that each piece of information could operate as the moderating variable according to its sentiment. Besides, the dynamics could be enhanced by adding other agents, such as industry, universities, or government, as the autonomous agents.
Author Contributions
Conceptualization, D.N., E.A.P., M.S., and S.P.S.; methodology, D.N., E.A.P., and M.S.; software, D.N. and M.S.; validation E.A.P., M.S., and S.P.S.; formal analysis, D.N., E.A.P., and M.S., and S.P.S.; investigation, D.N.; resources, S.P.S.; data curation, D.N.; writing—original draft preparation, D.N.; writing—review and editing, D.N., E.A.P., M.S., and S.P.S.; visualization, D.N.; supervision, E.A.P., M.S., and S.P.S.; project administration, D.N.; funding acquisition, D.N., E.A.P., and S.P.S. All authors have read and agreed to the published version of the manuscript.
Funding
This research is partially funded by the Institut Teknologi Bandung under the Multidisciplinary Research Program, Grant no. 7469/I1.B04.1/PL/2019. This research is also partially funded by Hyundai Motor Company under the service agreement no, HMC-YZCD-20-04-01.
Acknowledgments
This research is supported by Royal Academy of Engineering under the “Engineering Skills Where They are Most Needed” scheme awarded to the Institut Teknologi Bandung. This research is also supported by SBM—YU International Joint Laboratory of Technology Management in Developing Countries, School of Business Management, Institut Teknologi Bandung.
Conflicts of Interest
The authors declare no conflict of interest.
References
- Black, W.R. Sustainable Transport: Definitions and Responses. In Proceedings of the TRB/NRC Symposium on Sustainable Transportation, Baltimore, MD, USA, 12 July 2004. [Google Scholar]
- The ASEAN Secretariat. ASEAN Fuel Economy Roadmap for the Transport. Sector 2018–2025: With Focus on Light-Duty Vehicles; Jakarta, Indonesia. 2019. Available online: https://asean.org/storage/2019/03/ASEAN-Fuel-Economy-Roadmap-FINAL.pdf (accessed on 5 January 2021).
- Mardiasmo, D.; Barnes, P.H.; Sakurai, Y. Implementation of good governance by regional governments in Indonesia: The challenges. In Proceedings of the Contemporary Issues in Public Management: The Twelfth Annual Conference of the International Research Society for Public Management (IRSPM XII), Brisbane, Australia, 26–28 March 2008. [Google Scholar]
- Zhuge, C.; Shao, C. Investigating the factors influencing the uptake of electric vehicles in Beijing, China: Statistical and spatial perspectives. J. Clean. Prod. 2019, 213, 199–216. [Google Scholar] [CrossRef]
- Ajanovic, A.; Haas, R. Dissemination of electric vehicles in urban areas: Major factors for succes. Energy 2016, 115, 1451–1458. [Google Scholar] [CrossRef]
- Power, D.J.; Phillips-Wren, G. Impact of social media and Web 2.0 on decision-making. J. Decis. Syst. 2011, 20, 249–261. [Google Scholar] [CrossRef]
- Hazarika, N.; Zhang, X. Evolving theories of eco-innovation: A systematic review. Sustain. Prod. Consum. 2019, 19, 64–78. [Google Scholar] [CrossRef]
- Carlsson, B.; Stankiewicz, R. On the nature, function and composition of technological systems. J. Evol. Econ. 1991, 1, 93–118. [Google Scholar] [CrossRef]
- Meijer, I.S.M.; Hekkert, M.P.; Faber, J.; Smits, R.E.H.M. Perceived uncertainties regarding socio-technological transformations: Towards a framework. Int. J. Foresight Innov. Policy 2006, 2, 214–240. [Google Scholar] [CrossRef]
- Geels, F.W. Technological transitions as evolutionary reconfiguration processes: A multi-level perspective and a case-study. Res. Policy 2002, 31, 1257–1274. [Google Scholar] [CrossRef]
- Smith, A.; Voß, J.P.; Grin, J. Innovation studies and sustainability transitions: The allure of the multi-level perspective and its challenges. Res. Policy 2010, 39, 435–448. [Google Scholar] [CrossRef]
- Cecere, G.; Corrocher, N.; Gossart, C.; Ozman, M. Lock-in and path dependence: An evolutionary approach to eco-innovations. J. Evol. Econ. 2014, 24, 1037–1065. [Google Scholar] [CrossRef]
- Huber, D.; Kaufmann, H.; Steinmann, M. Bridging the Innovation Gap; Springer International Publishing: New York, NY, USA, 2017. [Google Scholar]
- Jin, J.; McKelvey, M. Building a sectoral innovation system for new energy vehicles in Hangzhou, China: Insights from evolutionary economics and strategic niche management. J. Clean. Prod. 2019, 224, 1–9. [Google Scholar] [CrossRef]
- van Marrewijk, A.; Clegg, S.R.; Pitsis, T.S.; Veenswijk, M. Managing public-private megaprojects: Paradoxes, complexity, and project design. Int. J. Proj. Manag. 2008, 26, 591–600. [Google Scholar] [CrossRef]
- Budden, P.; Murray, F. Innovation Ecosystems: Leveraging Their Power for Organizational Success and Strategic Change. 2018. Available online: https://exec.mit.edu/s/webinar-post/innovation-ecosystems-leveraging-their-power-for-organizational-success-and-stra-MCW25ACUNXJ5DITEZUHF3SIZBQ74 (accessed on 18 February 2021).
- Rogers, E.M. Diffusion of Innovations, 3rd ed.; Free Press: New York, NY, USA, 1983. [Google Scholar]
- Siallagan, M.; Martono, N.P.; Putro, U.S. Agent-Based Simulations of Smallholder Decision-Making in Land Use Change/Cover (LUCC) Problem. In Agent-Based Approaches in Economics and Social Complex Systems IX; Springer: Singapore, 2017; pp. 97–107. [Google Scholar]
- Reynolds, C.W. Flocks, herds, and schools: A distributed behavioral model. In Proceedings of the 14th Annual Conference on Computer Graphics and Interactive Techniques (SIGGRAPH 1987), Anaheim, CA, USA, 27–31 July 1987; pp. 25–34. [Google Scholar]
- Macy, M.W.; Willer, R. From factors to actors: Computational sociology and agent-based modeling. Annu. Rev. Sociol. 2002, 28, 143–166. [Google Scholar] [CrossRef]
- Simon, H.A. The Sciences of the Artificial; The MIT Press: Cambridge, MA, USA, 1998. [Google Scholar]
- Heckbert, S.; Baynes, T.; Reeson, A. Agent-based modeling in ecological economics. Ann. N. Y. Acad. Sci. 2010, 1185, 39–53. [Google Scholar] [CrossRef] [PubMed]
- Pagani, M.; Korosec, W.; Chokani, N.; Abhari, R.S. User behaviour and electric vehicle charging infrastructure: An agent-based model assessment. Appl. Energy 2019, 254, 113680. [Google Scholar] [CrossRef]
- Noori, M.; Tatari, O. Development of an agent-based model for regional market penetration projections of electric vehicles in the United States. Energy 2016, 96, 215–230. [Google Scholar] [CrossRef]
- Adepetu, A.; Keshav, S.; Arya, V. An agent-based electric vehicle ecosystem model: San Francisco case study. Transp. Policy 2016, 46, 109–122. [Google Scholar] [CrossRef]
- Hair, J.F., Jr.; Black, W.C.; Babin, B.J.; Anderson, R.E. Multivariate Data Analysis, 7th ed.; Essex: Pearson Education Limited: Harlow, UK, 2014. [Google Scholar]
- Christensen, C.M. The Innovator’s Dilemma When New Technologies Cause Great Firms to Fail. How Can. Great Firms Fail? Insights from the Hard Disk Drive Industry; Harvard Business School Press: Boston, MA, USA, 1997. [Google Scholar]
- Komaladewi, R.; Indika, D. A review of consumer purchase decision on low cost green car in West Java, Indonesia. Rev. Integr. Bus. Econ. Res. 2017, 6, 172–184. [Google Scholar]
- Wesseling, J.H.; Niesten, E.M.M.I.; Faber, J.; Hekkert, M.P. Business strategies of incumbents in the market for electric vehicles: Opportunities and incentives for sustainable innovation. Bus. Strateg. Environ. 2015, 24, 518–531. [Google Scholar] [CrossRef]
| Publisher’s Note: MDPI stays neutral with regard to jurisdictional claims in published maps and institutional affiliations. |
© 2021 by the authors. Licensee MDPI, Basel, Switzerland. This article is an open access article distributed under the terms and conditions of the Creative Commons Attribution (CC BY) license (https://creativecommons.org/licenses/by/4.0/).


