An Overview of Parameter and Cost for Battery Electric Vehicles

 ,
,  ,
,  ,
,  ,
,
Abstract
1. Introduction and Background
Cost Assessment Assumptions
- The exchange rate used to calculate the price in Euro is fixed and based on [6]. We apply the average exchange rate for the year 2019, which is $1.13 to €1.
- Inflation is taken into account in accordance with [7]. The year to which the price refers is taken from the publishing date of the source unless it is explicitly given.
- Component costs taken from the literature or other sources are assumed to apply to manufacturers.
2. Vehicle Parameters
2.1. Powertrain Components
- Traction battery
- Electric machine
- Gearbox
- Power electronics
2.1.1. Traction Battery
- Gravimetric energy density (in Wh/kg) at cell and pack level
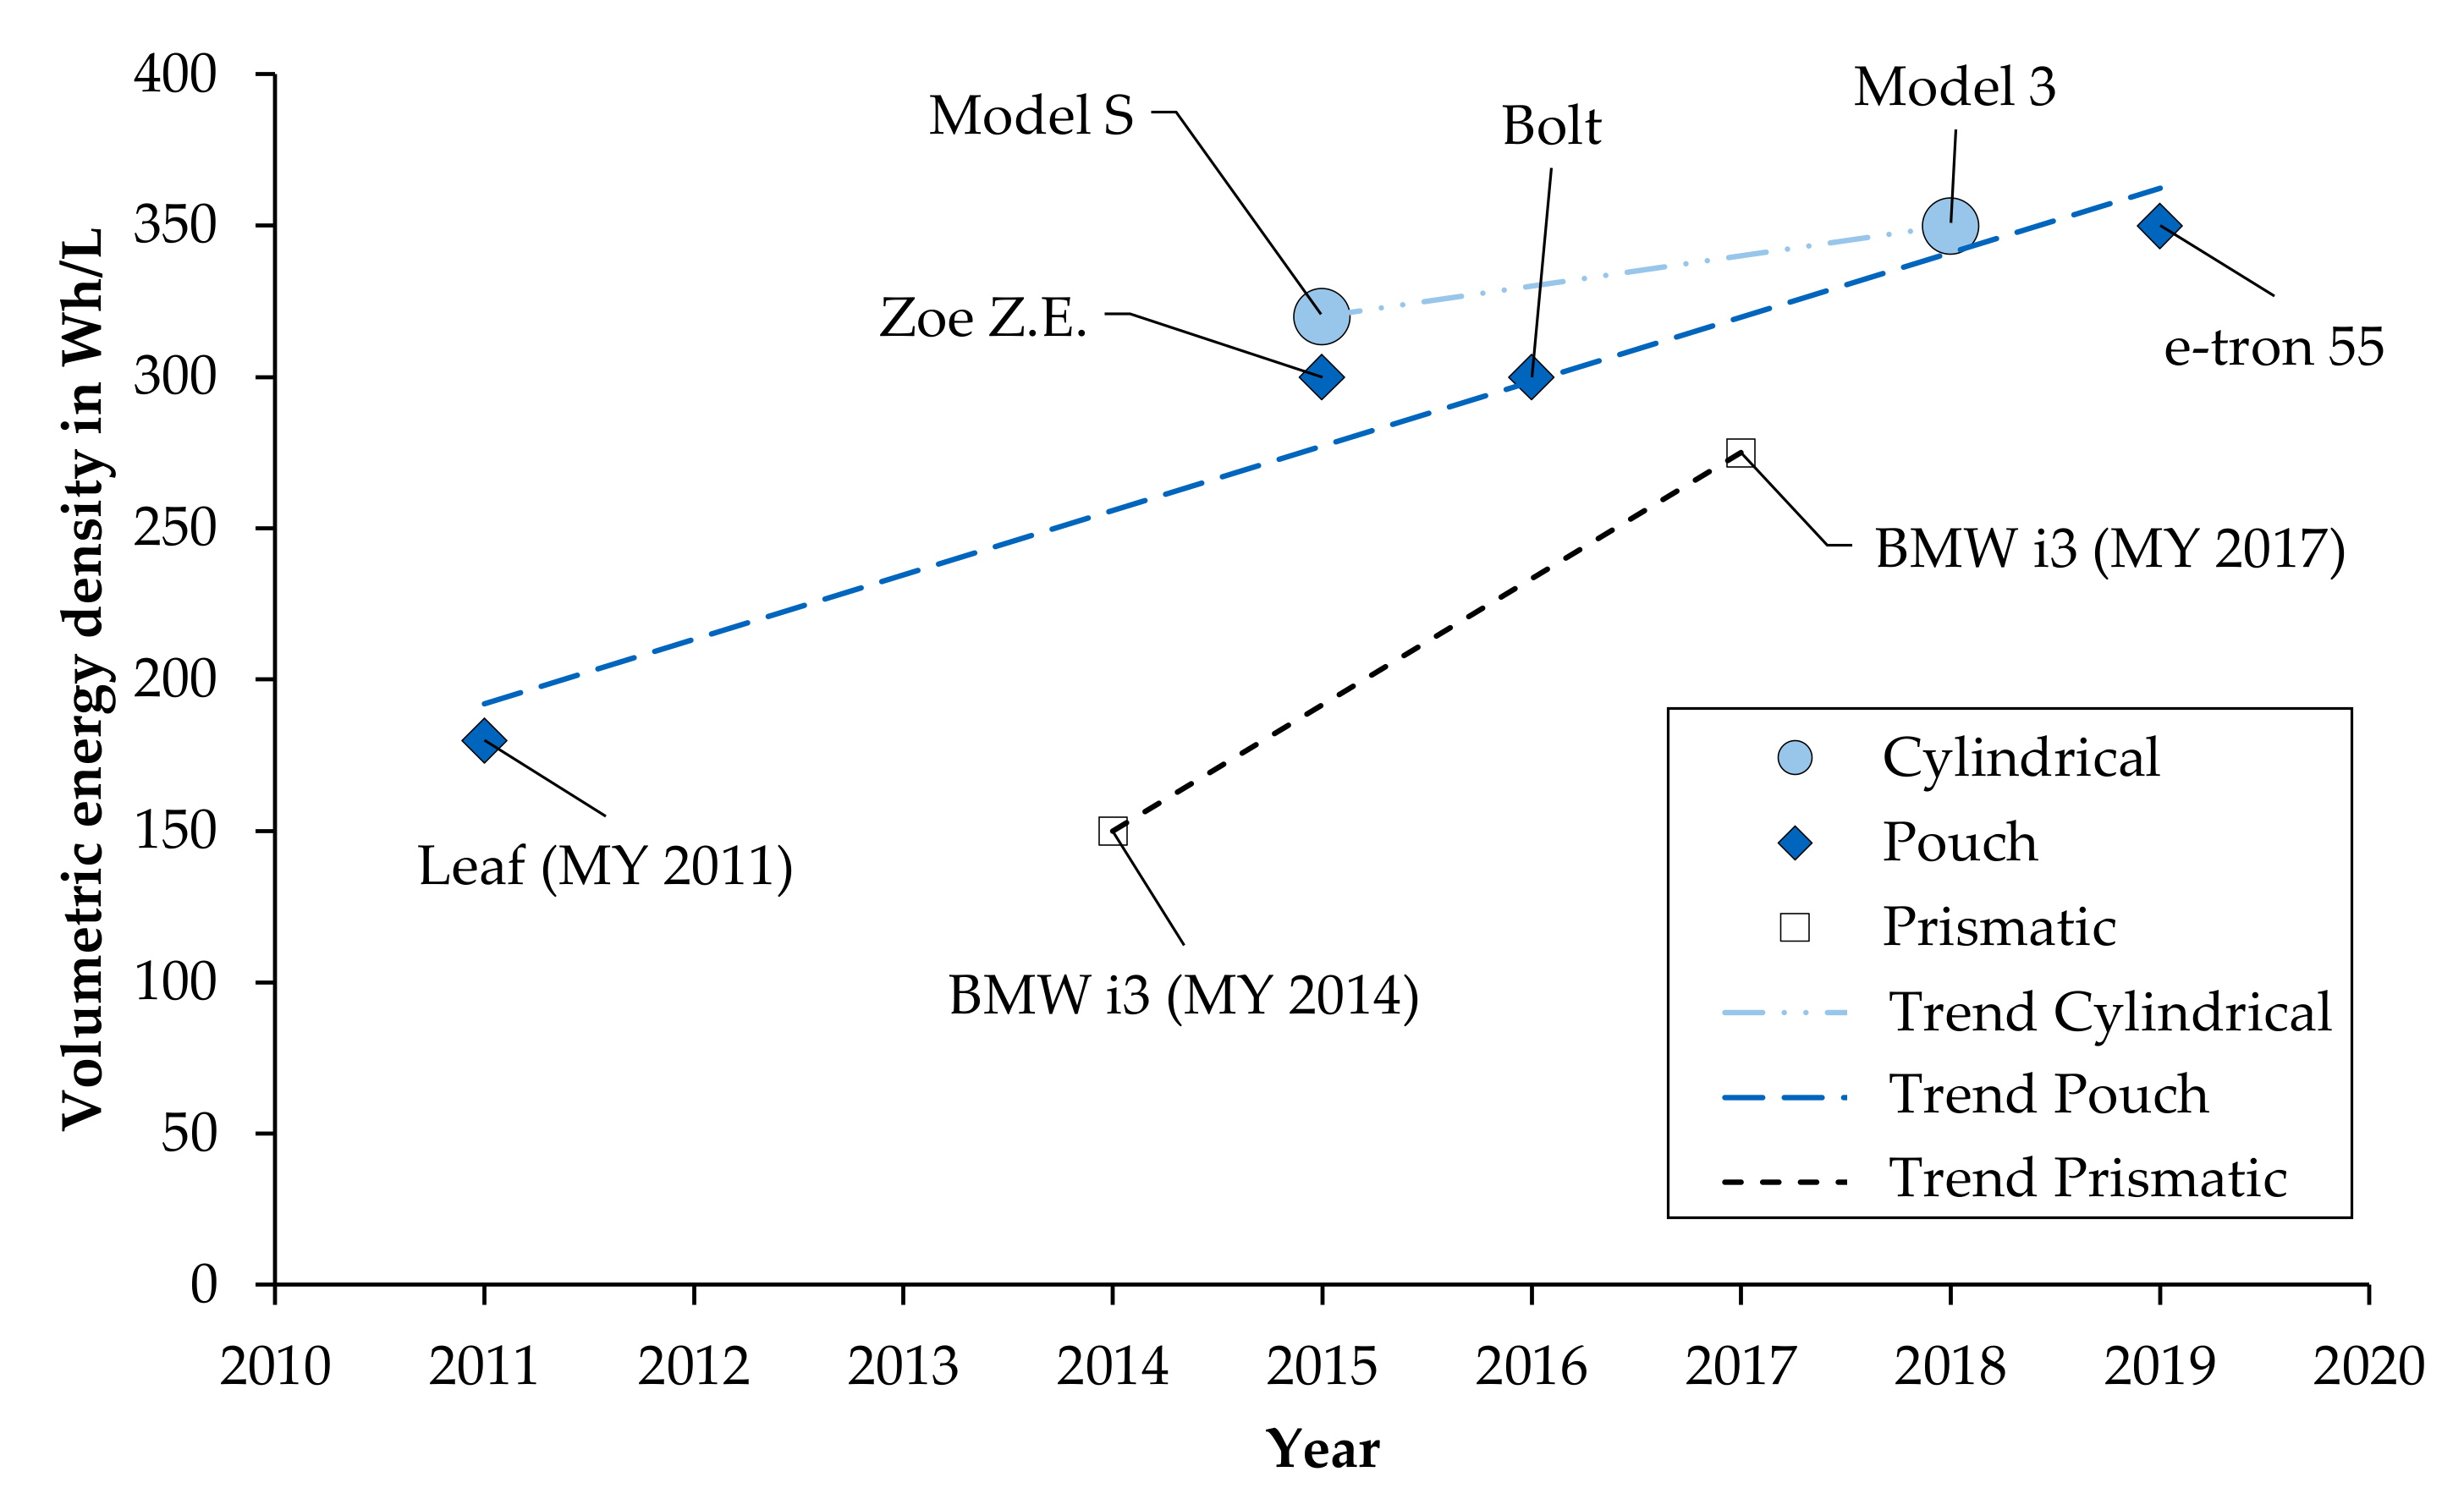
- Volumetric energy density (in Wh/L) at cell and pack level
- Battery C-rate
- Number of battery cycles
- Cost in €/kWh
2.1.2. Electric Machine
- Gravimetric power density in kW/kg
- Machine overload factor
- Maximum rotational speed in min−1
- Costs in €/kW
2.1.3. Gearbox
- Gears losses: friction losses (load dependent) and splash losses in the case of splash lubrication (load independent)
- Bearing losses: friction losses (load dependent) and lubrication losses (load independent)
- Losses due to sealing component
- Losses due to gearbox auxiliaries, such as the oil pumps
2.1.4. Power Electronics
2.2. Glider
2.3. Components for Autonomous Vehicles
3. Mobility
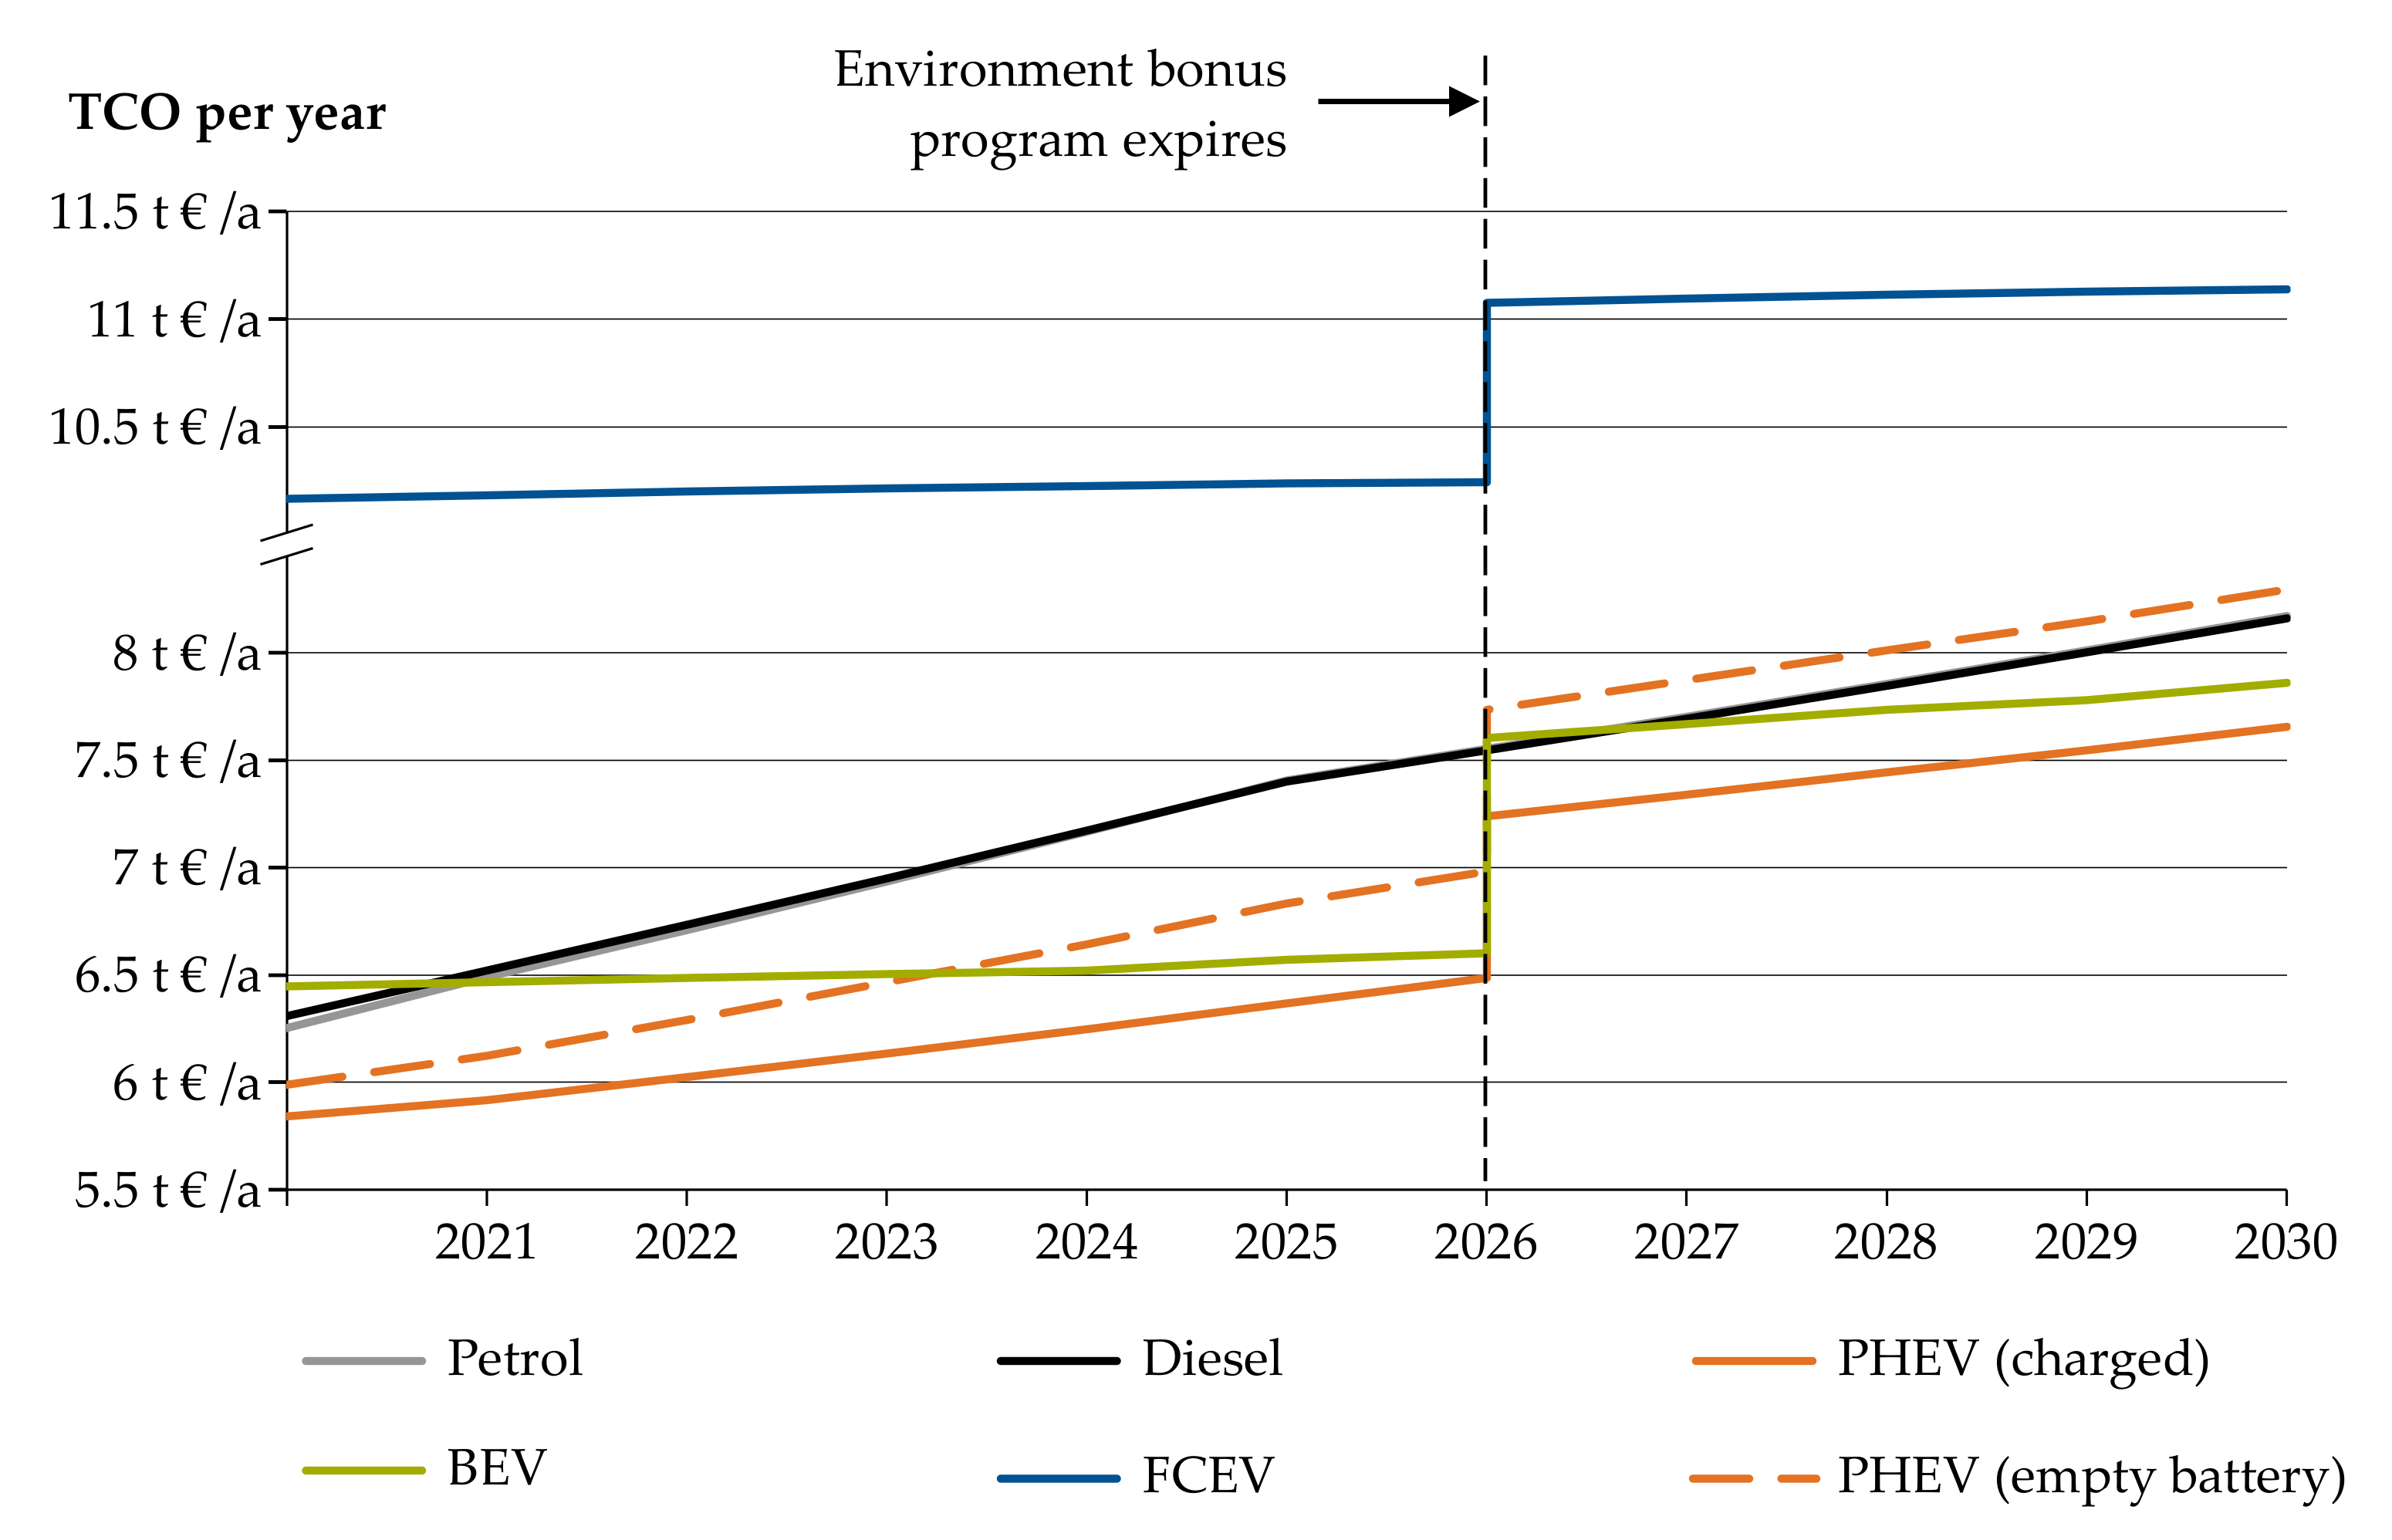
3.1. Vehicle Use and Total Cost of Ownership (TCO)
3.2. Mobility Services
External Costs
- Climate costs: Costs attributable to the emission of greenhouse gases and the resulting climate change (damage cost approach).
- Air pollution: Environmental costs resulting from the emission of air pollutants incurred in the form of health care costs, crop losses, damage to buildings and materials, and biodiversity loss.
- Up- and downstream processes: Follow-on costs due to the emission of greenhouse gases and air pollutants from the production, maintenance, and disposal of: energy sources (fuels, electricity), vehicles, and transport infrastructure.
- Accident costs: Traffic accidents (damage cost rate).
- Noise costs: Noise-related healthcare costs and costs attributable to noise pollution (damage costs).
- Nature and landscape: Habitat losses (through land consumption) and habitat fragmentation.
3.3. Mobility Behavior
4. Infrastructure
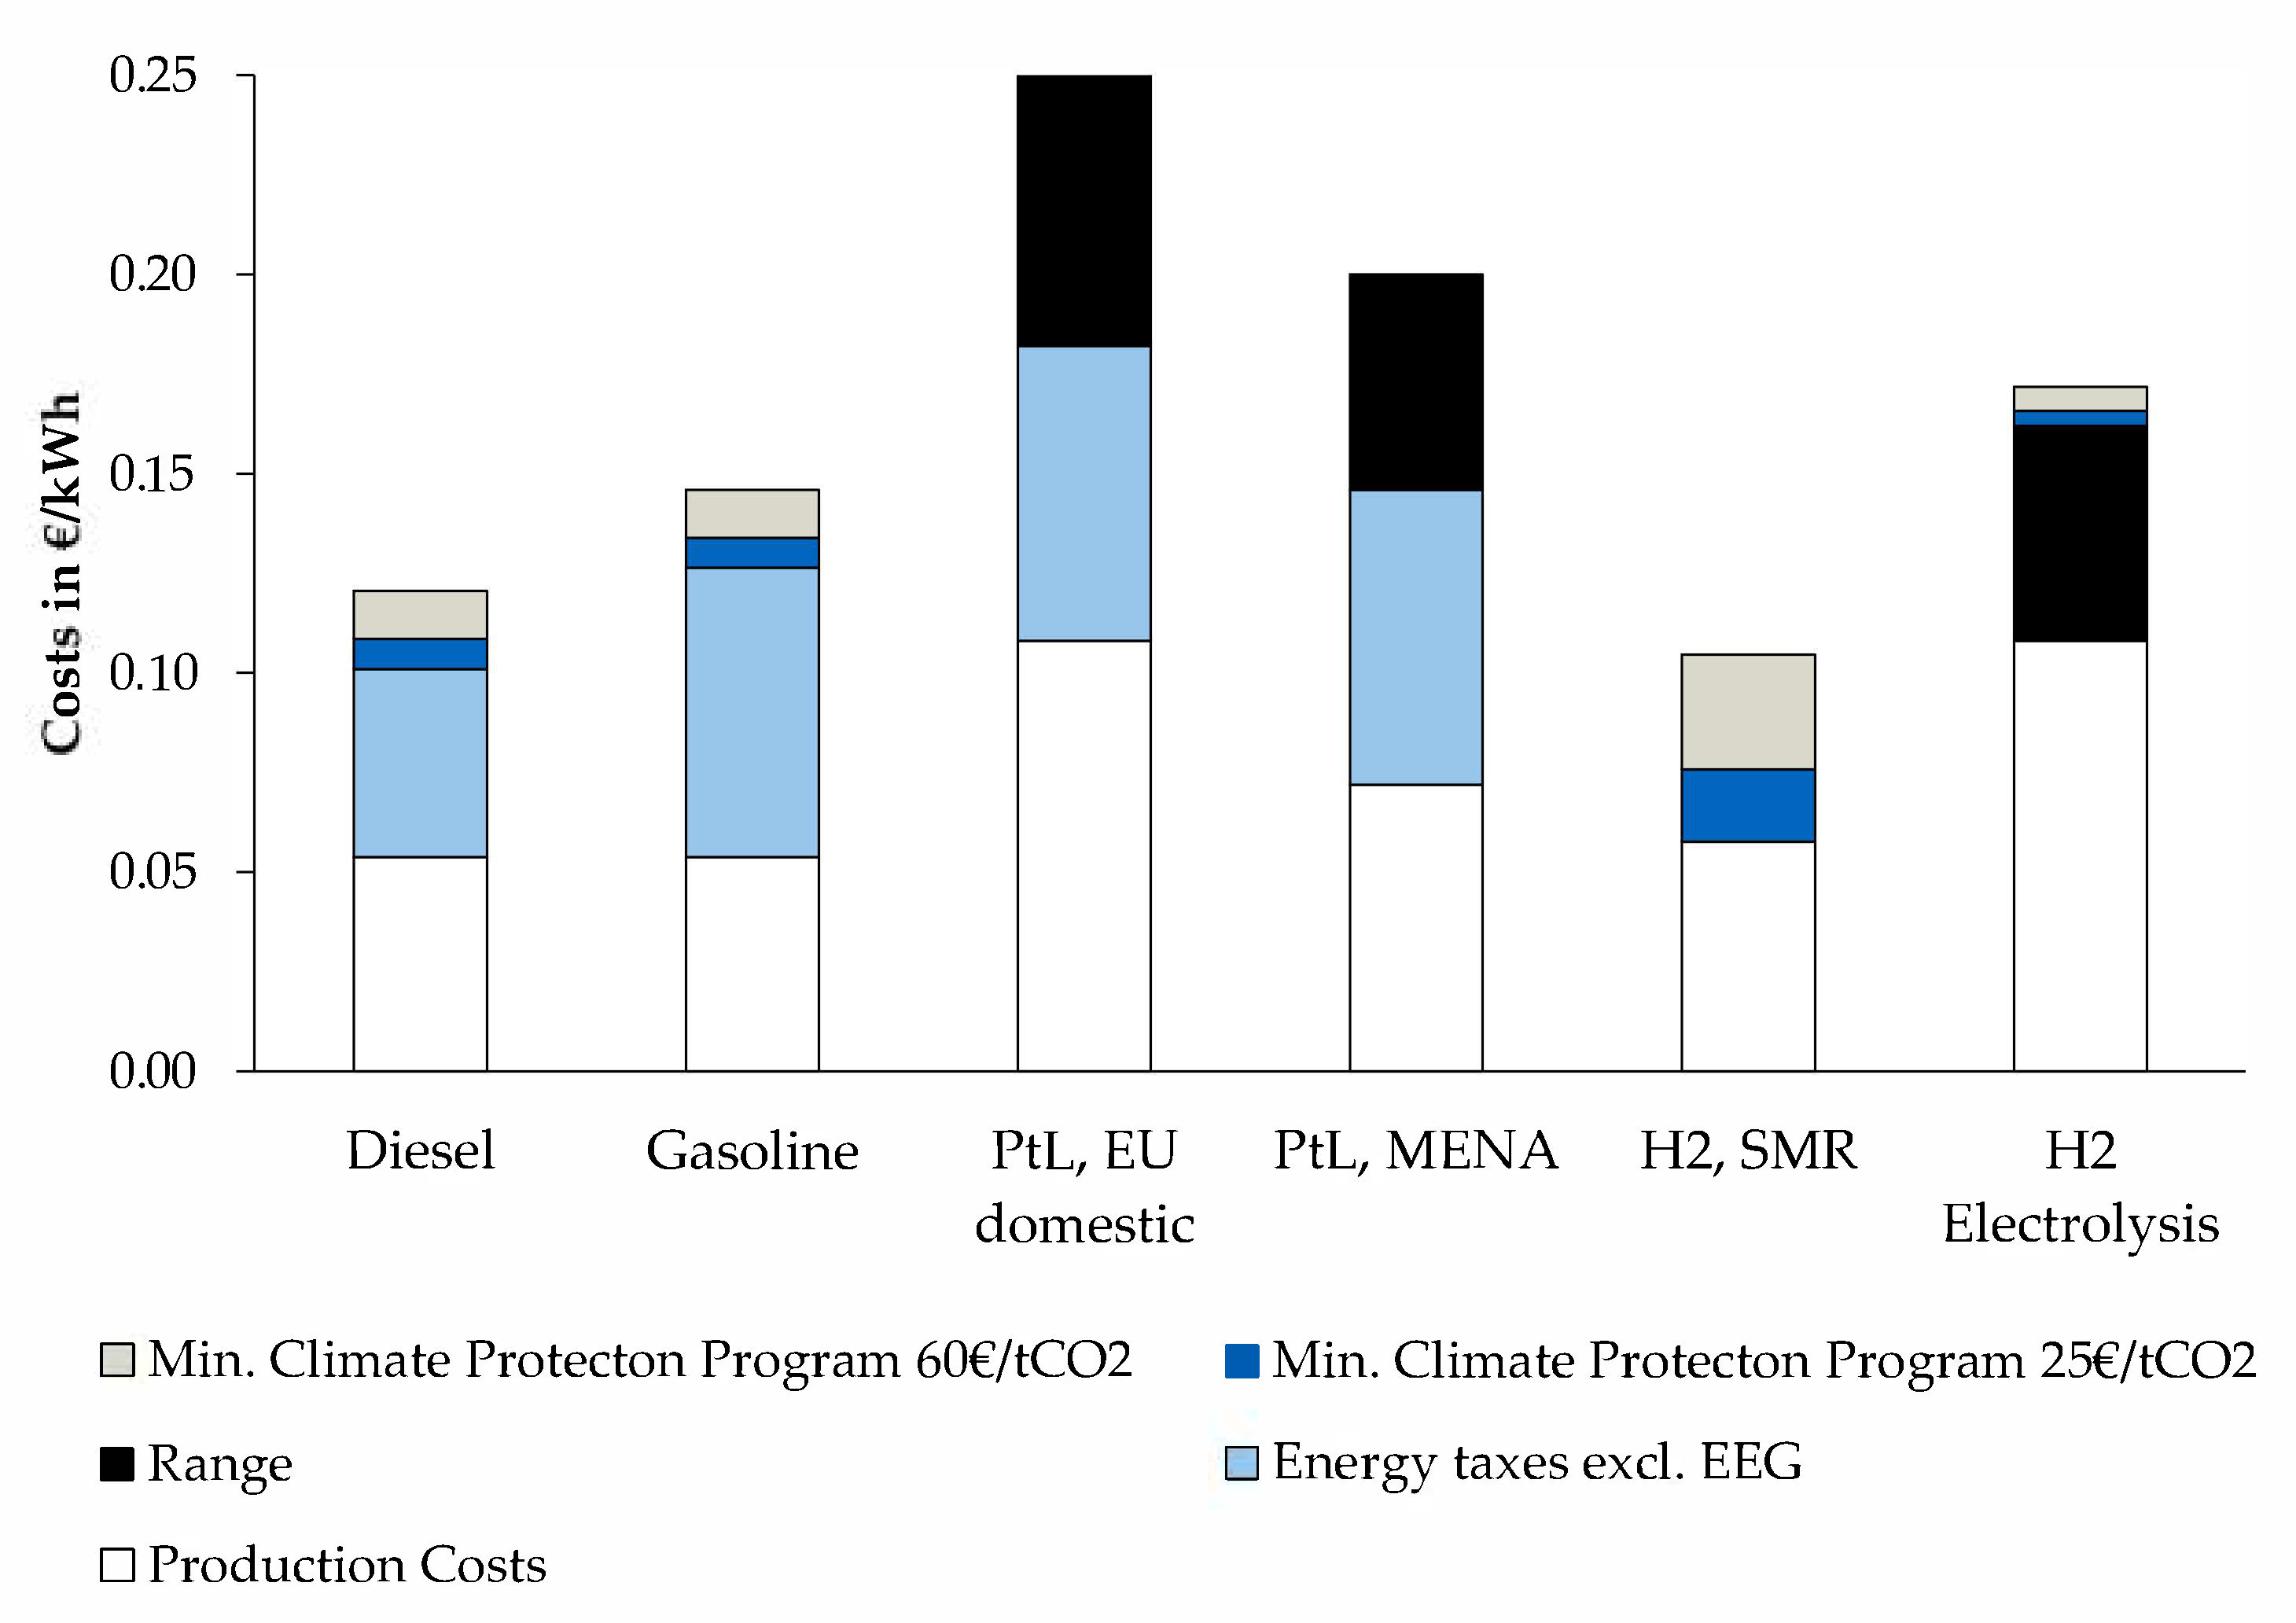
5. Energy Costs
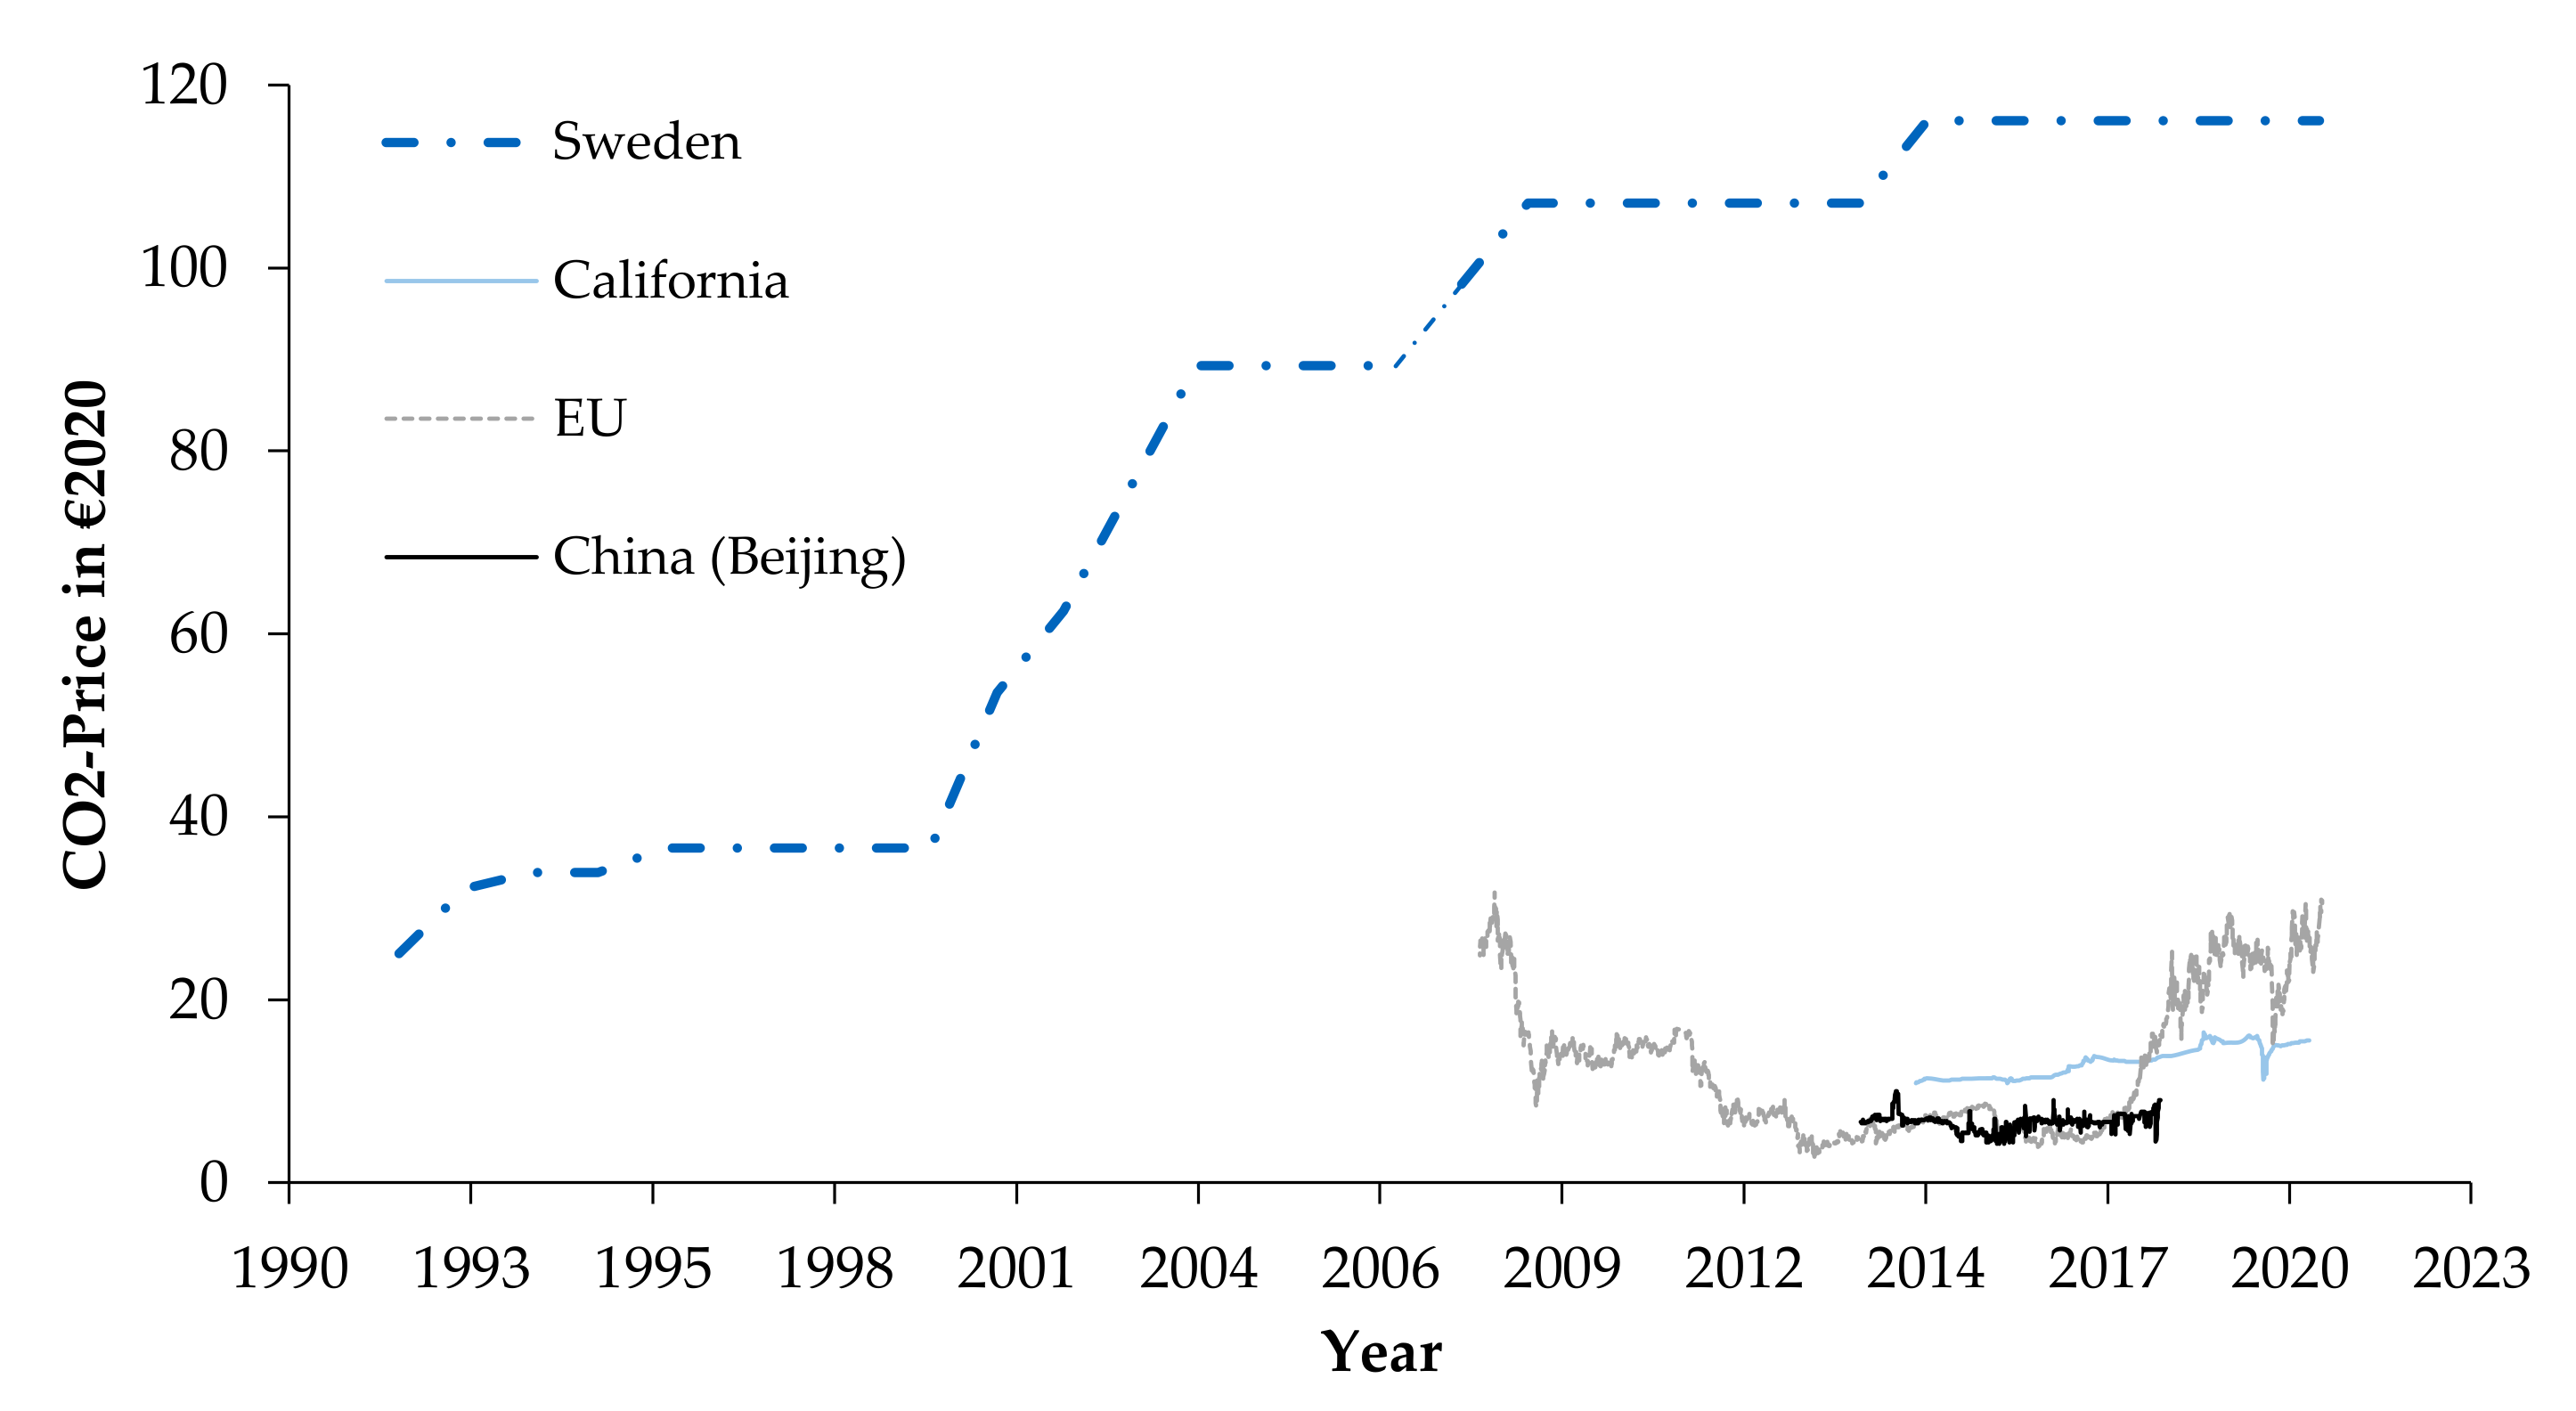
6. International Carbon-Dioxide Prices
7. Discussion and Outlook
Author Contributions
Funding
Acknowledgments
Conflicts of Interest
Appendix A

| Vehicle Segment 1,2 | Acquisition Bonus | Environment Bonus 3 | Depreciation 4 | Insurance | Tax | TÜV | Maintenance | Repair | Tires | Parking | Vehicle Care | Consumption per 100 km |
|---|---|---|---|---|---|---|---|---|---|---|---|---|
| Small Petrol | 15,090 € | 0 € | 1427 € | 437 € | 82 € | 44 € | 180 € | 252 € | 179 € | 805 € | 250 € | 5.9 l |
| Small BEV | 24,771 € | 9570 € | 1437 € | 415 € | 0 € | 44 € | 108 € | 204 € | 218 € | 805 € | 250 € | 14.3 kWh |
| Med. Petrol | 21,921 € | 0 € | 2073 € | 492 € | 87 € | 44 € | 180 € | 276 € | 176 € | 805 € | 250 € | 6.5 l |
| Med. Diesel | 22,944 € | 0 € | 2169 € | 517 € | 214 € | 44 € | 168 € | 288 € | 176 € | 805 € | 250 € | 5.2 l |
| Med. BEV | 36,241 € | 9570 € | 2522 € | 474 € | 0 € | 44 € | 96 € | 288 € | 259 € | 805 € | 250 € | 15.4 kWh |
| Large Petrol | 33,345 € | 0 € | 3153 € | 495 € | 178 € | 44 € | 180 € | 288 € | 246 € | 805 € | 250 € | 7.6 l |
| Large Diesel | 34,902 € | 0 € | 3300 € | 563 € | 263 € | 44 € | 156 € | 300 € | 246 € | 805 € | 250 € | 5.8 l |
| Large PHEV | 38,639 € | 5981 € | 3088 € | 545 € | 0 € | 44 € | 288 € | 300 € | 252 € | 805 € | 250 € | 3.8 l + 8.3 kWh 5 |
| Large BEV | 54,972 € | 7975 € | 4443 € | 895 € | 0 € | 44 € | 228 € | 252 € | 283 € | 805 € | 250 € | 18.5 kWh |
| Large FCEV | 75,889 € | 7975 € | 6421 € | 895 € | 0 € | 44 € | 228 € | 252 € | 283 € | 805 € | 250 € | 0.8 kg |
| SUV Petrol | 27,290 € | 0 € | 2580 € | 390 € | 140 € | 44 € | 180 € | 276 € | 223 € | 805 € | 250 € | 7.1 l |
| SUV Diesel | 28,564 € | 0 € | 2701 € | 549 € | 240 € | 44 € | 156 € | 288 € | 223 € | 805 € | 250 € | 6.2 l |
| SUV PHEV | 31,546 € | 7178 € | 2304 € | 721 € | 2 € | 44 € | 216 € | 264 € | 217 € | 805 € | 250 € | 3.8 l + 7.3 kWh 5 |
| SUV BEV | 44,949 € | 9570 € | 3345 € | 582 € | 0 € | 44 € | 120 € | 288 € | 235 € | 805 € | 250 € | 17.2 kWh |
| SUV FCEV | 76,139 € | 7975 € | 6445 € | 582 € | 144 € | 44 € | 120 € | 288 € | 235 € | 805 € | 250 € | 0.9 kg |
| M-cycle Pet. | 16,035 € | 0 € | 1525 € | 568 € | 88 € | 33 € | 725 € | 0 € | 0 € | 4.75 l | ||
| M-cycle BEV | 22,170 € | 0 € | 2108 € | 568 € | 0 € | 33 € | 725 € | 0 € | 0 € | 9.2 kWh | ||
| Vehicle Segment | Acquisition Bonus | Environment Bonus 1 | Depreciation 2 | Insurance | Tax | TÜV | Maintenance | Repair | Tires | Parking | Vehicle Care | Consumption Per 100 km |
|---|---|---|---|---|---|---|---|---|---|---|---|---|
| Bicycle | 420 € | 0 € | 47 € | 0 € | 0 € | 0 € | 45 € | 18 € | 0 € | 0 € | n/a | |
| Pedelec | 2100 € | 0 € | 236 € | 0 € | 0 € | 0 € | 55 € | 22 € | 0 € | 0 € | 0.73 kWh | |
| S-Pedelec | 4607 € | 0 € | 517 € | 21 € | 0 € | 0 € | 55 € | 22 € | 0 € | 0 € | 0.73 kWh | |
| Scooter Pet. | 3520 € | 0 € | 226 € | 21 € | 0 € | 0 € | n/a | n/a | n/a | n/a | n/a | 2.9 l |
| Scooter BEV | 6220 € | 0 € | 399 € | 21 € | 0 € | 0 € | n/a | n/a | n/a | n/a | n/a | 3.5 kWh |
| E-Scooter 3 | 799 € | 0 € | 145 € | 21 € | 0 € | 0 € | n/a | n/a | n/a | n/a | n/a | 1.2 kWh |
| Cost Considered | Description of Approach for Passenger Cars and Motorized Scooters/Motorcycles | Main Source (s) |
| Acquisition | Average sales prices from Statista are utilized as a baseline for each segment. Average MSRP listings from ADAC are utilized to calculate factors for the different propulsion types. | Statista [132], ADAC [133] |
| Depreciation | Market prices for an example vehicle are researched for on various vehicle ages between 0 and 10 years and mileages between 0 and 300,000 km. | AutoScout24 [134] |
| Energy consumption | Average fuel consumption values of vehicles sold in the respective segment are used for petrol and diesel ICEVs. Manufacturer specifications of example vehicles are utilized for PHEV and BEV fuel consumption. | KBA [135], BMWi [136], MWV, ADAC [133] |
| Insurance | Insurance costs are researched for each segment and propulsion type depending on annual mileage. | Check24.de [137] |
| Tax | Tax contributions are calculated on the basis of the “Kraftfahrzeugsteuergesetz” regulation in Germany and based on exemplary vehicle specifications of frequently-sold vehicles. | KraftStG 2002 [138,139] |
| TÜV | Standard TÜV charge is assumed. | TÜV [140] |
| Inspection and repair | Values for inspection and repair are retrieved from the ADAC online cost calculator for all segments and propulsion types. | ADAC [141] |
| Tires | Summer and winter tire market prices are retrieved for all segments and propulsion types. | Reifendirekt.de [142], DAT [143] |
| Vehicle care | Constant factor independent of assumed annual mileage assumed. | ADAC [144] |
| Parking | Constant factor independent of assumed annual mileage assumed. | INRIX [145] |
| Cost Considered | Description of Approach for Bicycles, Pedelecs, and e-Scooter | Main Source(s) |
| Bicycle, Pedelecs, E-pedelecs | TCO information for bicycles from different sources | Fahrrad.de [146], VSF [147], ZIV [148,149], Fahrradblog [150], Schwalbe [151], [86], GHOST [152] |
| E-scooter | TCO information for bicycles from different sources | BGBI [153,154], IEEE [155], Journals [156], BCG [157] |
| Transport Mode | Vehicle Type | Min. Price | Base Price | Price per Min | Price per Hour | Price per km |
| Car sharing (FF 1)) | Mini car | n/a | n/a | 0.19 €/min | n/a | n/a |
| Car sharing (FF 1)) | Small car | n/a | n/a | 0.28 €/min | n/a | n/a |
| Car sharing (FF 1)) | Medium car | n/a | n/a | 0.31 €/min | n/a | n/a |
| Car sharing (SB 2)) | Mini car | n/a | n/a | n/a | 2.30 €/h | 0.23 €/km |
| Car sharing (SB 2)) | Small car | n/a | n/a | n/a | 2.65 €/h | 0.27 €/km |
| Car sharing (SB 2)) | Medium car | n/a | n/a | n/a | 3.00 €/h | 0.3 €/km |
| Bike sharing | Bicycle | n/a | n/a | 0.08 €/min | n/a | n/a |
| E-Scooter sharing | E-Scooter | n/a | 1.00 € | 0.19 €/min | n/a | n/a |
| Scooter sharing | Motorized Scooter | n/a | n/a | 0.27 €/min | n/a | n/a |
| Ride-hailing | Medium/large car | 5.00 € | 2.00 € | 0.31 €/min | n/a | 0.90 €/km |
| Ride-hailing | Medium/large car | 5.00 € | 2.00 € | 0.31 €/min | n/a | 0.90 €/km |
| Ride-hailing | Executive car | 9.00 € | 6.00 € | 0.50 €/min | n/a | 1.50 €/km |
| Ride-hailing | Van | 9.00 € | 6.00 € | 0.50 €/min | n/a | 1.50 €/km |
| Taxi 3 | Executive car | n/a | 3.70 € | n/a | n/a | 1.70–2.00 €/km |
| Transport Mode | Ticket Type | Price per ride in € * | Price per year in € * | |||
| Subway/Streetcar/Bus | Single Ticket | 3.39 € | 2471.20 € | |||
| Subway/Streetcar/Bus | Daily Ticket | 4.01 € | 2920.50 € | |||
| Subway/Streetcar/Bus | Weekly Ticket | 1.31 € | 914.70 € | |||
| Subway/Streetcar/Bus | Monthly Ticket | 0.97 € | 681.40 € | |||
| Subway/Streetcar/Bus | Annual Ticket | 0.77 € | 536.90 € | |||
| Subway/Streetcar/Bus | Stripe Ticket | 1.65 € | 1153.20 € | |||
| Subway/Streetcar/Bus | Semester Ticket | 0.58 € | 402.60 € | |||
References
- Nicoletti, L.; Bronner, M.; Danquah, B.; Koch, A.; Konig, A.; Krapf, S.; Pathak, A.; Schockenhoff, F.; Sethuraman, G.; Wolff, S.; et al. Review of trends and potentials in the vehicle concept development process. In Proceedings of the 2020 Fifteenth International Conference on Ecological Vehicles and Renewable Energies (EVER), Monte-Carlo, Monaco, 10–12 September 2020; pp. 1–5, ISBN 978-1-7281-5641-5. [Google Scholar]
- Trommer, S.; Kolarova, V.; Fraedrich, E.; Kröger, L.; Kickhöfer, B.; Kuhnimhof, T.; Lenz, B.; Phleps, P. Autonomous Driving. The Impact of Vehicle Automation on Mobility Behavior; Institute for Mobility Research: Munich, Germany, 2016; Available online: https://www.researchgate.net/publication/312374304_Autonomous_Driving_-_The_Impact_of_Vehicle_Automation_on_Mobility_Behaviour (accessed on 20 December 2020).
- Nicoletti, L.; Romano, A.; König, A.; Schockenhoff, F.; Lienkamp, M. Parametric Modeling of Mass and Volume Effects for Battery Electric Vehicles, with Focus on the Wheel Components. WEVJ 2020, 11, 63. [Google Scholar] [CrossRef]
- Kochhan, R.; Fuchs, S.; Reuter, B.; Burda, P.; Matz, S.; Lienkamp, M. An Overview of Costs for Vehicle Components, Fuels and Greenhouse Gas Emissions. Available online: https://www.researchgate.net/publication/260339436_An_Overview_of_Costs_for_Vehicle_Components_Fuels_and_Greenhouse_Gas_Emissions (accessed on 15 December 2020).
- Fries, M.; Kerler, M.; Rohr, S.; Schickram, S. An Overview of Costs for Vehicle Components, Fuels, Greenhouse Gas Emissions and Total Cost of Ownership: Update 2017. Available online: https://www.researchgate.net/publication/319136996_An_Overview_of_Costs_for_Vehicle_Components_Fuels_Greenhouse_Gas_Emissions_and_Total_Cost_of_Ownership_-_Update_2017 (accessed on 28 October 2020).
- OFX. Yearly Average Rates. Available online: https://www.ofx.com/en-au/forex-news/historical-exchange-rates/yearly-average-rates/ (accessed on 28 October 2020).
- Triami Media BV. Historic Harmonised Inflation Europe–HICP Inflation. Available online: https://www.inflation.eu/en/inflation-rates/europe/historic-inflation/hicp-inflation-europe.aspx (accessed on 28 October 2020).
- Miller, J. Electric Car Costs to Remain Higher than Traditional Engines. Available online: https://www.ft.com/content/a7e58ce7-4fab-424a-b1fa-f833ce948cb7 (accessed on 8 December 2020).
- Ruffo, G. EVs Are Still 45% More Expensive to Make Than Combustion-Engined Cars. Available online: https://insideevs.com/news/444542/evs-45-percent-more-expensive-make-ice/ (accessed on 8 December 2020).
- Kampker, A.; Vallée, D.; Schnettler, A. Elektromobilität; Springer: Berlin/Heidelberg, Germany, 2018; ISBN 978-3-662-53136-5. [Google Scholar]
- Schmuch, R.; Wagner, R.; Hörpel, G.; Placke, T.; Winter, M. Performance and cost of materials for lithium-based rechargeable automotive batteries. Nat. Energy 2018, 3, 267–278. [Google Scholar] [CrossRef]
- Matz, S.; Fuchs, J.; Burda, P.; Horlbeck, L.; Eckl, R.; Lienkamp, M. Beschreibung der Modellierungsart Sowie der Modellierungsparameter von Elektrofahrzeugen in der Konzeptphase. Available online: https://www.researchgate.net/publication/261174335_Beschreibung_der_Modellierungsart_sowie_der_Modellierungsparameter_von_Elektrofahrzeugen_in_der_Konzeptphase (accessed on 28 October 2020).
- Scrosati, B.; Garche, J.; Tillmetz, V. (Eds.) Advances in Battery Technologies for Electric Vehicles, 1st ed.; Woodhead Publishing: Cambridge, UK, 2015; ISBN 9781782423980. [Google Scholar]
- Blomgren, G.E. The Development and Future of Lithium Ion Batteries. J. Electrochem. Soc. 2017, 164, A5019–A5025. [Google Scholar] [CrossRef]
- Anderman, M. Extract from the xEV Insider Report. April 2019 Edition. Available online: https://totalbatteryconsulting.com/industry-reports/xEV-report/Extract-from-the-xEV-Industry-Report.pdf (accessed on 8 October 2020).
- Fink, H. Li-ion batteries for automotive applications–Quo vadis. In Internationales Stuttgarter Symposium; Bargende, M., Reuss, H.-C., Wiedemann, J., Eds.; Springer Fachmedien: Wiesbaden, Germany, 2016; pp. 69–81. ISBN 978-3-658-13254-5. [Google Scholar]
- Fuchs, S. Verfahren zur Parameterbasierten Gewichtsabschätzung neuer Fahrzeugkonzepte. Ph.D. Thesis, Institute of Automotive Technology, Technical University of Munich, Munich, Germany, 2014. [Google Scholar]
- Placke, T.; Kloepsch, R.; Dühnen, S.; Winter, M. Lithium ion, lithium metal, and alternative rechargeable battery technologies: The odyssey for high energy density. J. Solid State Electrochem. 2017, 21, 1939–1964. [Google Scholar] [CrossRef]
- Thielmann, A.; Neef, C.; Hettesheimer, T.; Döscher, H.; Wietschel, M.; Tübke, J. Energiespeicher-Roadmap (Update 2017). Hochenergie-Batterien 2030+ und Perspektiven Zukünftiger Batterietechnologien. 2017. Available online: https://www.isi.fraunhofer.de/content/dam/isi/dokumente/cct/lib/Energiespeicher-Roadmap-Dezember-2017.pdf (accessed on 1 October 2020).
- Volkswagen AG. Powerful and Scalable: The New ID. Battery System. Available online: https://www.volkswagenag.com/en/news/stories/2018/10/powerful-and-scalable-the-new-id-battery-system.html (accessed on 29 June 2020).
- Hagen, M.; Hanselmann, D.; Ahlbrecht, K.; Maça, R.; Gerber, D.; Tübke, J. Lithium-Sulfur Cells: The Gap between the State-of-the-Art and the Requirements for High Energy Battery Cells. Adv. Energy Mater. 2015, 5, 1–11. [Google Scholar] [CrossRef]
- Frieske, B.; van der Adel, B.; Schwarz-Kocher, M.; Stieler, S.; Schnabel, A.; Tözün, R. Strukturstudie BWe Mobil 2019: Transformation durch Elektromobilität und Perspektiven der Digitalisierung. Available online: https://www.e-mobilbw.de/service/meldungen-detail/strukturstudie-bwe-mobil-2019 (accessed on 26 October 2020).
- Nicoletti, L.; Mirti, S.; Schockenhoff, F.; König, A.; Lienkamp, M. Derivation of Geometrical Interdependencies between the Passenger Compartment and the Traction Battery Using Dimensional Chains. WEVJ 2020, 11, 39. [Google Scholar] [CrossRef]
- Knecht, J.; Stegmaier, G.; Hebermehl, G. Tesla Battery Day 2020. Available online: https://www.auto-motor-und-sport.de/tech-zukunft/tesla-battery-day-neue-zellen-kosten-halbiert/ (accessed on 28 October 2020).
- Bos, C. Tesla’s New Structural Battery Pack—It’s Not Cell-to-Pack, It’s Cell-to-Body. CleanTechnica [Online]. 11 October 2020. Available online: https://cleantechnica.com/2020/10/10/teslas-new-structural-battery-pack-its-not-cell-to-pack-its-cell-to-body/ (accessed on 25 October 2020).
- Grunditz, E.A.; Thiringer, T. Performance Analysis of Current BEVs Based on a Comprehensive Review of Specifications. IEEE Trans. Transp. Electrific. 2016, 2, 270–289. [Google Scholar] [CrossRef]
- Fuchss, S.; Michaelides, A.; Stocks, O.; Devenport, R. Das Antriebssystem des neuen Jaguar I-Pace. MTZ Motortech. Z. 2019, 80, 20–27. [Google Scholar] [CrossRef]
- Grebe, U.D.; Nitz, L.T. Voltec–Das Antriebssystem für Chevrolet Volt und Opel Ampera. MTZ Motortech. Z. 2011, 72, 342–351. [Google Scholar] [CrossRef]
- ADAC. Autodatenbank. Available online: https://www.adac.de/infotestrat/autodatenbank/autokatalog/default.aspx (accessed on 26 November 2019).
- Busche, I. Ein Beitrag zur Optimierten Konzeptauslegung von Fahrzeugen im Bereich der Elektromobilität. Ph.D. Thesis, University of Magdeburg, Magdeburg, Germany, 2014. [Google Scholar]
- Zubi, G.; Dufo-López, R.; Carvalho, M.; Pasaoglu, G. The lithium-ion battery: State of the art and future perspectives. Renew. Sustain. Energy Rev. 2018, 89, 292–308. [Google Scholar] [CrossRef]
- Hoekstra, A. The Underestimated Potential of Battery Electric Vehicles to Reduce Emissions. Joule 2019, 3, 1412–1414. [Google Scholar] [CrossRef]
- Nykvist, B.; Nilsson, M. Rapidly falling costs of battery packs for electric vehicles. Nat. Clim. Chang. 2015, 5, 329–332. [Google Scholar] [CrossRef]
- Philippot, M.; Alvarez, G.; Ayerbe, E.; van Mierlo, J.; Messagie, M. Eco-Efficiency of a Lithium-Ion Battery for Electric Vehicles: Influence of Manufacturing Country and Commodity Prices on GHG Emissions and Costs. Batteries 2019, 5, 23. [Google Scholar] [CrossRef]
- Cano, Z.P.; Banham, D.; Ye, S.; Hintennach, A.; Lu, J.; Fowler, M.; Chen, Z. Batteries and fuel cells for emerging electric vehicle markets. Nat. Energy 2018, 3, 279–289. [Google Scholar] [CrossRef]
- Nationale Plattform Zukunft der Mobilität. 1. Kurzbericht der AG 2-Elektromobilität. Brennstoffzelle. Alternative Kraftstoffe-Einsatzmöglichkeiten aus Technologischer Sicht (1st Short Report of AG 2-Electromobility. Fuel Cell. Alternative Fuel Applications from a Technological Perspective.). 2019. Available online: https://www.plattform-zukunft-mobilitaet.de/wp-content/uploads/2019/11/NPM-AG-2-Elektromobilit%C3%A4t-Brennstoffzelle-Alternative-Kraftstoffe-Einsatzm%C3%B6glichkeiten-aus-technologischer-Sicht.pdf (accessed on 8 April 2020).
- Wentker, M.; Greenwood, M.; Leker, J. A Bottom-Up Approach to Lithium-Ion Battery Cost Modeling with a Focus on Cathode Active Materials. Energies 2019, 12, 504. [Google Scholar] [CrossRef]
- Hettesheimer, T.; Thielmann, A.; Neef, C.; Möller, K.-C.; Wolter, M.; Lorentz, V.; Gepp, M.; Wenger, M.; Prill, T.; Zausch, J.; et al. Entwicklungsperspektiven für Zellformate von Lithium-Ionen-Batterien in der Elektromobilität (Development Prospects for Cell Formats of Lithium-ion Batteries in Electromobility). 2017. Available online: https://www.batterien.fraunhofer.de/content/dam/batterien/de/documents/Allianz_Batterie_Zellformate_Studie.pdf (accessed on 15 December 2020).
- Kerler, M. Eine Methode zur Bestimmung der Optimalen Zellgröße für Elektrofahrzeuge. Ph.D. Thesis, Technische Universität München, München, Germany, 2018. [Google Scholar]
- Nelson, P.A.; Gallagher, K.G.; Bloom, I.; Dees, D.W. Modeling the Performance and Cost of Lithium-Ion Batteries for Electric-Drive Vehicles. 2011. Available online: https://publications.anl.gov/anlpubs/2011/10/71302.pdf (accessed on 5 November 2020).
- Romare, M.; Dahllöf, L. The Life Cycle Energy Consumption and Greenhouse Gas Emissions from Lithium-Ion Batteries. 2017. Available online: http://www.energimyndigheten.se/globalassets/forskning--innovation/transporter/c243-the-life-cycle-energy-consumption-and-co2-emissions-from-lithium-ion-batteries-.pdf (accessed on 15 December 2020).
- Emilsson, E.; Dahllöf, L. Lithium-Ion Vehicle Battery Production; IVL Swedish Environmental Research Institute: Stockholm, Sweden, 2019; ISBN 978-91-7883-112-8. [Google Scholar]
- Dai, Q.; Kelly, J.C.; Gaines, L.; Wang, M. Life Cycle Analysis of Lithium-Ion Batteries for Automotive Applications. Batteries 2019, 5, 48. [Google Scholar] [CrossRef]
- Kelly, J.C.; Dai, Q.; Wang, M. Globally regional life cycle analysis of automotive lithium-ion nickel manganese cobalt batteries. Mitig. Adapt. Strateg. Glob. Change 2020, 25, 371–396. [Google Scholar] [CrossRef]
- Schweigert, D.; Gerlach, M.E.; Hoffmann, A.; Morhard, B.; Tripps, A.; Lohner, T.; Otto, M.; Ponick, B.; Stahl, K. On the Impact of Maximum Speed on the Power Density of Electromechanical Powertrains. Vehicles 2020, 2, 365–397. [Google Scholar] [CrossRef]
- Nicoletti, L.; Mayer, S.; Brönner, M.; Schockenhoff, F.; Lienkamp, M. Design Parameters for the Early Development Phase of Battery Electric Vehicles. WEVJ 2020, 11, 47. [Google Scholar] [CrossRef]
- Angerer, C.R. Antriebskonzept-Optimierung für Batterieelektrische Allradfahrzeuge. Ph.D. Thesis, Institute of Automotive Technology, Technical University of Munich, Verlag Dr. Hut, Munich, Germany, 2020. [Google Scholar]
- Nemeth, T.; Bubert, A.; Becker, J.N.; de Doncker, R.W.; Sauer, D.U. A Simulation Platform for Optimization of Electric Vehicles with Modular Drivetrain Topologies. IEEE Trans. Transp. Electrific. 2018, 4, 888–900. [Google Scholar] [CrossRef]
- Kasper, R.; Schünemann, M. 5. Elektrische Fahrantriebe Topologien Und Wirkungsgrad. MTZ Motortech. Z. 2012, 73, 802–807. [Google Scholar] [CrossRef]
- Nicoletti, L.; Ostermann, F.; Heinrich, M.; Stauber, A.; Lin, X.; Lienkamp, M. Topology analysis of electric vehicles, with a focus on the traction battery. Forsch. Ing. 2020. [Google Scholar] [CrossRef]
- Rimac Automobili C_Two Hypercar. Rimac Automobili C_Two Hypercar—A Car Alive with Technology. Available online: https://www.rimac-automobili.com/en/hypercars/c_two/ (accessed on 26 October 2020).
- Porsche Newsroom. Der Antrieb: Performance pur. Available online: https://newsroom.porsche.com/de/produkte/taycan/antrieb-18543.html (accessed on 26 October 2020).
- Naunheimer, H.; Bertsche, B.; Ryborz, J.; Novak, W.; Fietkau, P. Fahrzeuggetriebe. Grundlagen, Auswahl, Auslegung und Konstruktion, 3rd ed.; Auflage 2019; Springer: Berlin/Heidelberg, Germany, 2019; ISBN 978-3-662-58883-3. [Google Scholar]
- Dominguez Olavarria, G.; Marquez-Fernandez, F.J.; Fyhr, P.; Reinap, A.; Andersson, M.; Alaküla, M. Scalable performance, efficiency and thermal models for electric drive components used in powertrain simulation and optimization. In Proceedings of the 2017 IEEE Transportation Electrification Conference and Expo (ITEC), Chicago, IL, USA, 22–24 June 2017; pp. 644–649, ISBN 978-1-5090-3953-1. [Google Scholar]
- Pesce, T. Ein Werkzeug zur Bestimmung von Individuell Optimalen Antriebssträngen für Elektrofahrzeuge. Ph.D. Thesis, Technische Universität München, München, Germany, 2014. [Google Scholar]
- Ried, M. Lösungsraumanalyse für Plug-In-Hybridfahrzeuge Hinsichtlich Wirtschaftlichkeit und Bauraumkonzept. Ph.D. Thesis, Universität Duisburg-Essen, Lehrstuhl für Mechatronik, Duisburg-Essen, Germany, 2016. [Google Scholar]
- Chang, F. Improving the Partial Load Efficiency of Electric Powertrains by Silicon MOSFET Multilevel Inverters. Ph.D. Thesis, Technical University of Munich, Munich, Germany, 2019. [Google Scholar]
- Wacker, P.; Wheldon, L.; Sperlich, M.; Adermann, J.; Lienkamp, M. Influence of active battery switching on the drivetrain efficiency of electric vehicles. In Proceedings of the 2017 IEEE Transportation Electrification Conference and Expo (ITEC), Chicago, IL, USA, 22–24 June 2017; pp. 33–38, ISBN 978-1-5090-3953-1. [Google Scholar]
- Chang, F.; Ilina, O.; Hegazi, O.; Voss, L.; Lienkamp, M. Adopting MOSFET multilevel inverters to improve the partial load efficiency of electric vehicles. In Proceedings of the 2017 19th European Conference on Power Electronics and Applications (EPE'17 ECCE Europe), Warsaw, Poland, 11–14 September 2017; pp. 1–13. [Google Scholar]
- Brooker, A.; Gonder, J.; Wang, L.; Wood, E.; Lopp, S.; Ramroth, L. FASTSim: A Model to Estimate Vehicle Efficiency, Cost and Performance. In Proceedings of the SAE 2015 World Congress & Exhibition, Detroit, MI, USA, 21–23 April 2015. [Google Scholar]
- Del Duce, A.; Gauch, M.; Althaus, H.-J. Electric passenger car transport and passenger car life cycle inventories in ecoinvent version 3. Int. J. Life Cycle Assess. 2016, 21, 1314–1326. [Google Scholar] [CrossRef]
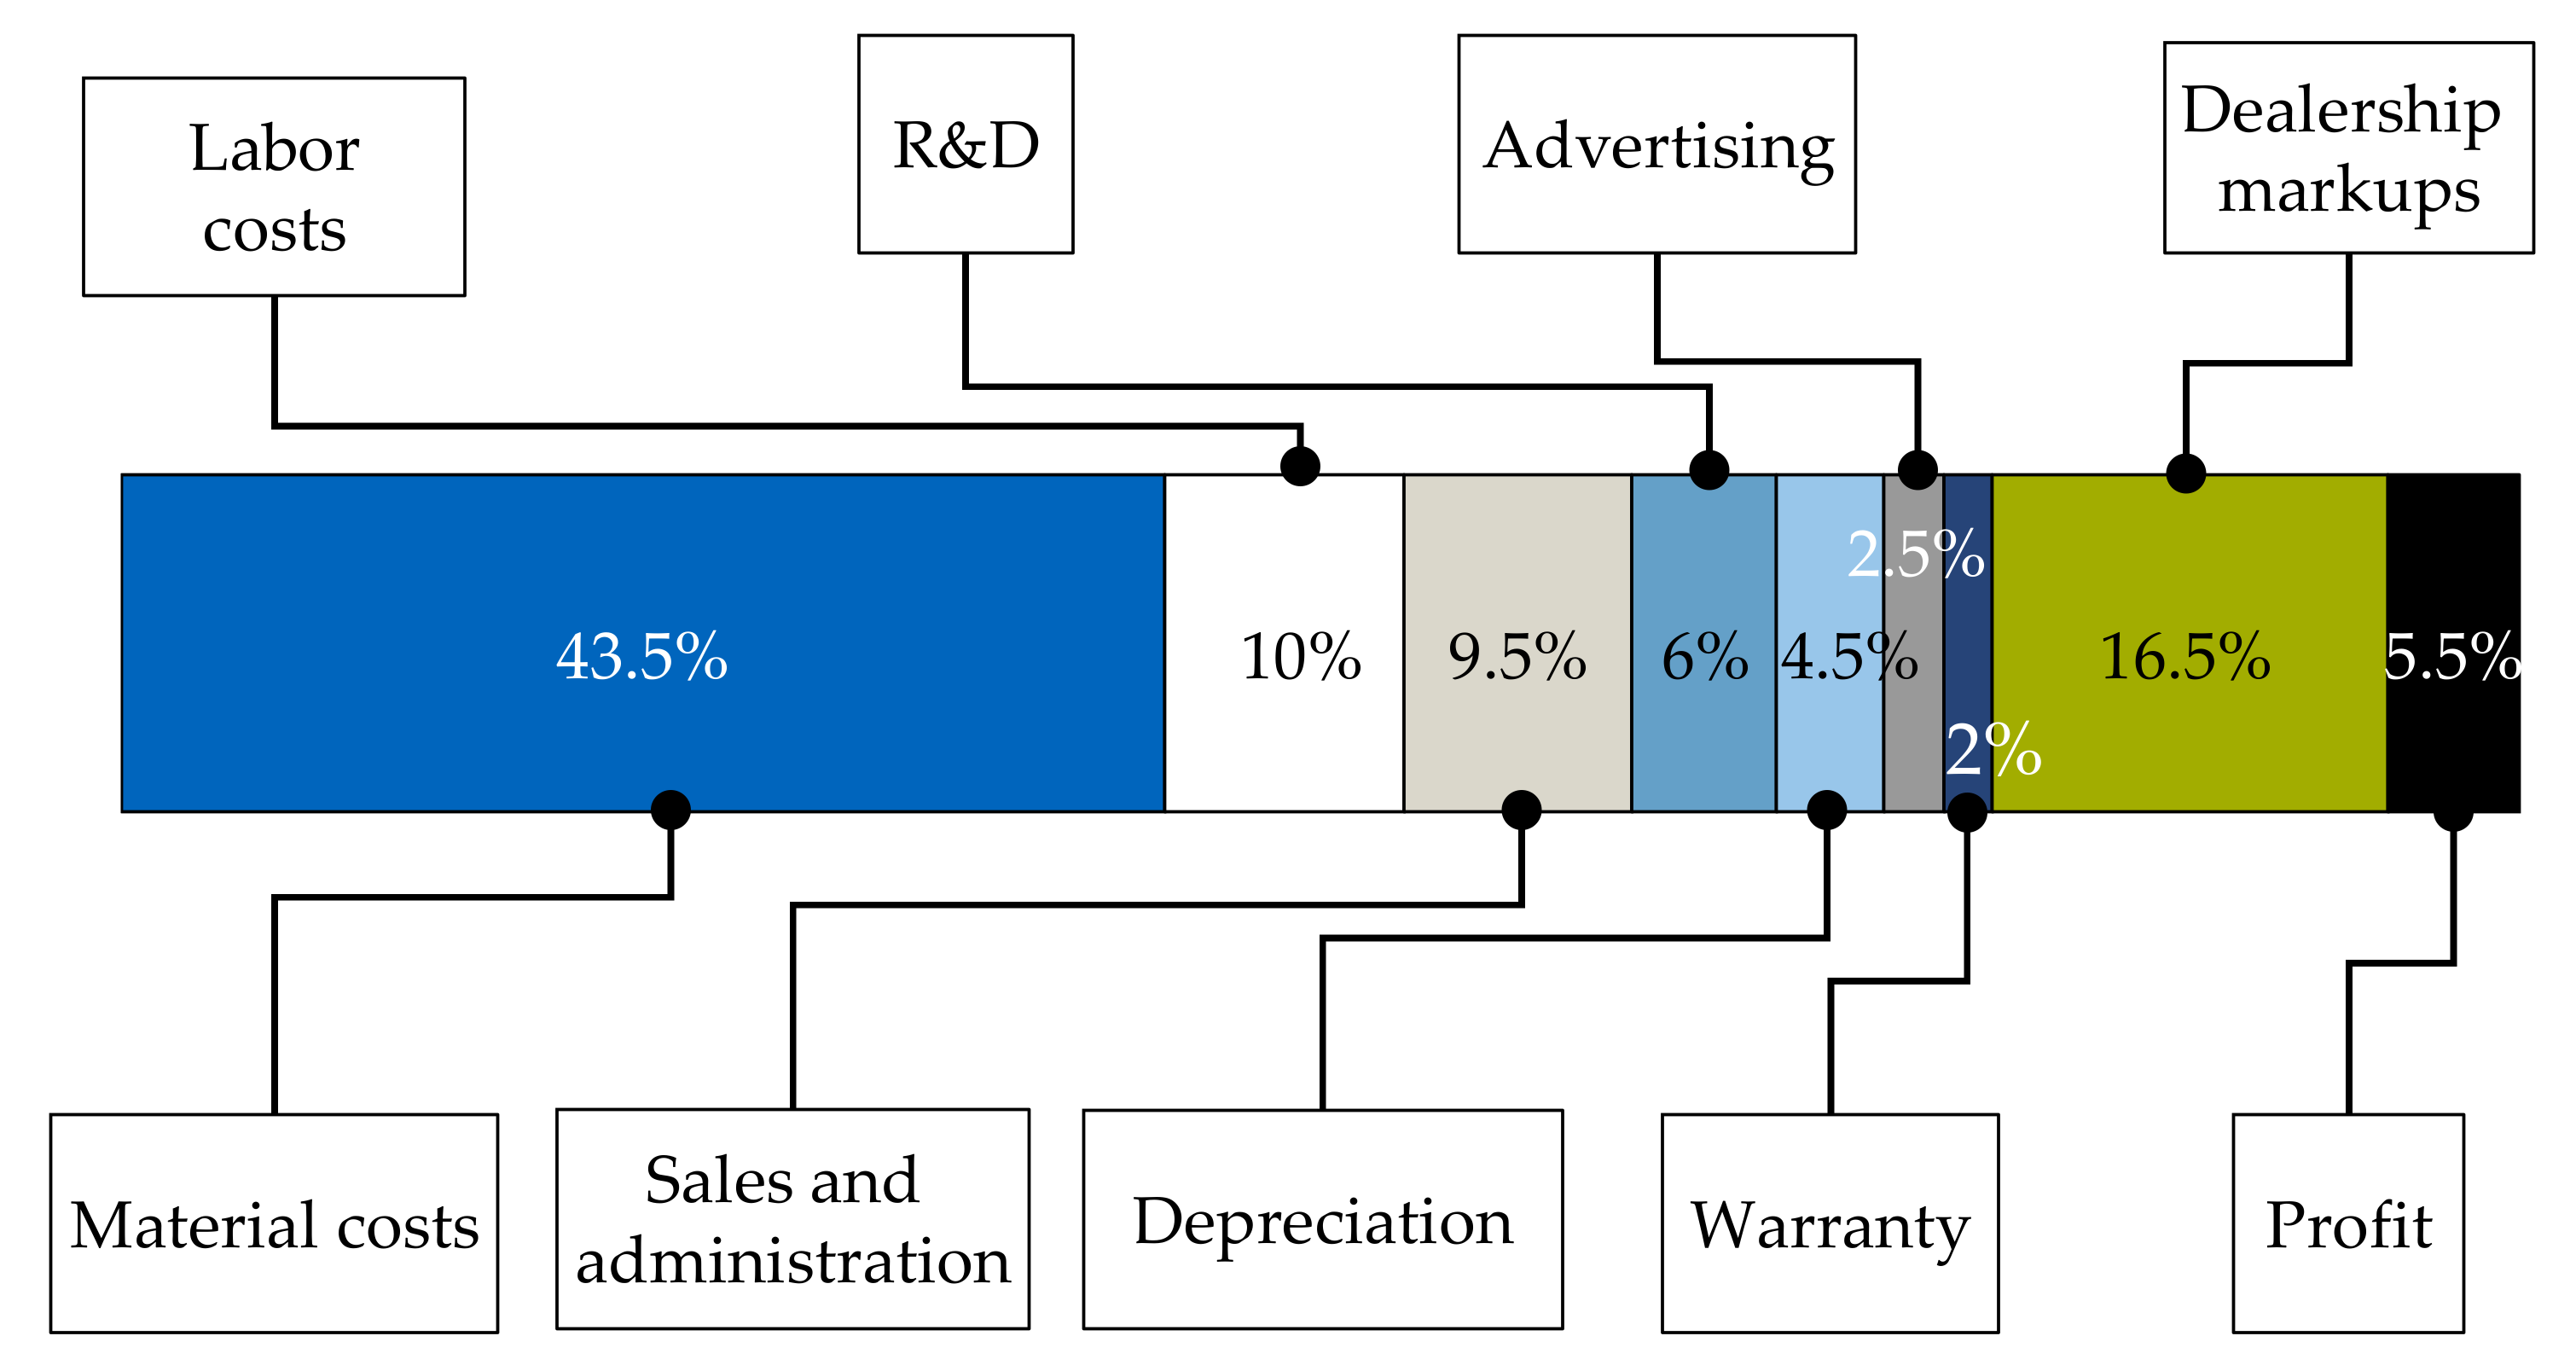
- WirtschaftsWoche. Zusammensetzung des Preises Eines Neuwagens in Deutschland. Available online: https://de.statista.com/statistik/daten/studie/387632/umfrage/zusammensetzung-des-neuwagenpreises-in-deutschland/ (accessed on 9 December 2020).
- Institute of Automotive Technology (FTM). Figures Based on Expert Discussions; Institute Automotive Technology (FTM): Technical University of Munich: Munich, Germany, 2020. [Google Scholar]
- Mosquet, X.; Dauner, T.; Lang, N.; Russmann, M.; Mei-Pochtler, A.; Agrawal, R.; Schmieg, F. Revolution in the Driver's Seat: The Road to Autonomous Vehicles; The Boston Consulting Group: Boston, MA, USA, 2015. [Google Scholar]
- Priddle, A.; Woodyard, C. Google Discloses Costs of Ist Driverless Car Tests. Available online: http://content.usatoday.com/communities/driveon/post/2012/06/google-discloses-costs-of-its-driverless-car-tests/1 (accessed on 27 October 2020).
- Krok, A. Velodyne Just Made Self-Driving Cars a Bit Less Expensive. Available online: https://www.cnet.com/roadshow/news/velodyne-just-made-self-driving-cars-a-bit-less-expensive-hopefully/ (accessed on 27 October 2020).
- Velodyne Lidar. Velodyne Slashes the Price in Half of Its Most Popular LiDAR Sensor. Available online: https://velodynelidar.com/press-release/velodyne-slashes-the-price-in-half-of-its-most-popular-lidar-sensor/ (accessed on 27 October 2020).
- Ouster, Inc. Ouster OS1 Mid-Range LiDAR Sensor. Available online: https://ouster.com/products/os1-lidar-sensor/ (accessed on 27 October 2020).
- Deyle, T. Velodyne HDL-32E: A New High-End Laser Rangefinder. Available online: http://www.hizook.com/blog/2010/08/24/velodyne-hdl-32e-new-high-end-laser-rangefinder (accessed on 27 October 2020).
- Pacala, A. The ES2: The First True Solid-State High-Performance Digital Lidar. Available online: https://ouster.com/blog/the-es2-the-first-true-solid-state-high-performance-digital-lidar/ (accessed on 27 October 2020).
- General Laser. Mid-Range Lidar Sensors-Ouster OS1. Available online: https://www.general-laser.at/shop-de/lidar-de/ouster-os1-de (accessed on 27 October 2020).
- Woodside Capital Partners WCP. The Automotive LiDAR Market. Available online: http://www.woodsidecap.com/wp-content/uploads/2018/04/Yole_WCP-LiDAR-Report_April-2018-FINAL.pdf (accessed on 10 November 2020).
- Nvidia. Jetson AGX Xavier. Available online: https://www.nvidia.com/de-de/autonomous-machines/embedded-systems/jetson-agx-xavier/ (accessed on 30 October 2020).
- SYSTEMPlus Consulting. A Tesla Model 3 Tear-Down after a Hardware Retrofit. Available online: https://www.eetimes.com/a-tesla-model-3-tear-down-after-a-hardware-retrofit/4/ (accessed on 30 October 2020).
- MVV. Der MVV in Zahlen. Available online: https://www.mvv-muenchen.de/mvv-und-service/der-verbund/mvv-in-zahlen/index.html (accessed on 15 June 2020).
- Bösch, P.M.; Becker, F.; Becker, H.; Axhausen, K.W. Cost-based analysis of autonomous vehicle services. Transp. Policy 2018. [Google Scholar] [CrossRef]
- Arellano, J.F.; Fang, K. Sunday Drivers, or Too Fast and Too Furious? Transp. Find. 2019. [Google Scholar] [CrossRef]
- BFS; ARE. Swiss Federal Statistical Office (BFS) and Swiss Federal Office for Spatial Development (ARE)-Mobilität in der Schweiz-Ergebnisse des Mikrozensus Mobilität und Verkehr 2010. Available online: https://www.bfs.admin.ch/bfs/en/home/statistics/catalogues-databases/publications.assetdetail.348719.html (accessed on 18 December 2020).
- Hardt, C.; Bogenberger, K. Usability of escooters in urban environments-a pilot study. In Proceedings of the 2017 IEEE Intelligent Vehicles Symposium (IV), Los Angeles, CA, USA, 11–17 June 2017. [Google Scholar] [CrossRef]
- INRIX. INRIX Global Traffic Scorecard. Available online: https://inrix.com/scorecard/ (accessed on 18 December 2020).
- INRIX. Manchester Revealed as UK City with the Most Potential for Shared Bikes and E-Scooters. Available online: https://inrix.com/press-releases/micromobility-study-uk-2019/ (accessed on 30 September 2020).
- Jäger, B.; Wittmann, M.; Lienkamp, M. Analyzing and modeling a City’s spatiotemporal taxi supply and demand: A case study for Munich. J. Traffic Logist. Eng. 2016, 4. [Google Scholar] [CrossRef]
- Jiao, J.; Bai, S. Understanding the Shared E-scooter Travels in Austin, TX. ISPRS Int. J. Geo-Inf. 2020, 9, 135. [Google Scholar] [CrossRef]
- Knoblauch, R.L.; Pietrucha, M.T.; Nitzburg, M. Field Studies of Pedestrian Walking Speed and Start-Up Time. Transp. Res. Rec. 1996, 1538, 27–38. [Google Scholar] [CrossRef]
- Schleinitz, K.; Petzoldt, T.; Franke-Bartholdt, L.; Krems, J.; Gehlert, T. The German Naturalistic Cycling Study–Comparing cycling speed of riders of different e-bikes and conventional bicycles. Saf. Sci. 2017, 92, 290–297. [Google Scholar] [CrossRef]
- Wachotsch, U.; Kolodziej, A.; Specht, B.; Kohlmeyer, R.; Petrikowski, F. E-Rad Macht Mobil: Potenziale von Pedelecs und Deren Umweltwirkung. Available online: https://www.umweltbundesamt.de/sites/default/files/medien/378/publikationen/hgp_e-rad_macht_mobil_-_pelelecs_4.pdf (accessed on 18 December 2020).
- Zou, Z.; Younes, H.; Erdoğan, S.; Wu, J. Exploratory Analysis of Real-Time E-Scooter Trip Data in Washington, DC. Transp. Res. Rec. 2020, 0361198120919760. [Google Scholar] [CrossRef]
- Sperling, D. Three Revolutions: Steering Automated, Shared, and Electric Vehicles to a Better Future; Island Press: Washington, DC, USA, 2018; ISBN 9781610919050. [Google Scholar]
- Compostella, J.; Fulton, L.M.; de Kleine, R.; Kim, H.C.; Wallington, T.J. Near-(2020) and long-term (2030–2035) costs of automated, electrified, and shared mobility in the United States. Transp. Policy 2020, 85, 54–66. [Google Scholar] [CrossRef]
- Ongel, A.; Loewer, E.; Roemer, F.; Sethuraman, G.; Chang, F.; Lienkamp, M. Economic assessment of autonomous electric microtransit vehicles. Sustainability 2019, 11, 648. [Google Scholar] [CrossRef]
- Lim, L.; Tawfik, A.M. Estimating future travel costs for autonomous vehicles (AVs) and shared autonomous vehicles (SAVs). In Proceedings of the 2018 21st International Conference on Intelligent Transportation Systems (ITSC), Maui, HI, USA, 4–7 November 2018; pp. 1702–1707, ISBN 978-1-7281-0321-1. [Google Scholar]
- Dandl, F.; Bogenberger, K. Comparing Future Autonomous Electric Taxis with an Existing Free-Floating Carsharing System. IEEE Trans. Intell. Transp. Syst. 2019, 20, 2037–2047. [Google Scholar] [CrossRef]
- European Comission. DG MOVE-Handbook on the External Costs of Transport; European Comission: Brussels, Belgium, 2019; ISBN 978-92-79-96917-1. [Google Scholar]
- Bieler, C.; Sutter, D. Externe Kosten des Verkehrs in Deutschland. Straßen-, Schienen-, Luft-und Binnenschiffverkehr. 2017. Available online: https://www.allianz-pro-schiene.de/wp-content/uploads/2019/08/190826-infras-studie-externe-kosten-verkehr.pdf (accessed on 20 December 2020).
- Gössling, S.; Choi, A.; Dekker, K.; Metzler, D. The Social Cost of Automobility, Cycling and Walking in the European Union. Ecol. Econ. 2019, 158. [Google Scholar] [CrossRef]
- Jochem, P.; Doll, C.; Fichtner, W. External costs of electric vehicles. Transp. Res. Part D Transp. Environ. 2016, 42, 60–76. [Google Scholar] [CrossRef]
- Weiss, C.; Mallig, N.; Heilig, M.; Schneidereit, T.; Franke, T.; Vortisch, P. How much range is required? A model based analysis of potential battery electric vehicle usage. In Proceedings of the Transportation Research Board 95th Annual Meeting, Washington DC, USA, 10–14 January 2016. [Google Scholar]
- Trantow, M.; Franke, T.; Günther, M.; Krems, J.F.; Rauh, N. Range comfort zone of electric vehicle users–concept and assessment. IET Intell. Transp. Syst. 2015, 9, 740–745. [Google Scholar] [CrossRef]
- Machiels, N.; Leemput, N.; Geth, F.; van Roy, J.; Buscher, J.; Driesen, J. Design Criteria for Electric Vehicle Fast Charge Infrastructure Based on Flemish Mobility Behavior. IEEE Trans. Smart Grid 2014, 5, 320–327. [Google Scholar] [CrossRef]
- Pfriem, M. Analyse der Realnutzung von Elektrofahrzeugen in Kommerziellen Flotten zur Definition Einer Bedarfsgerechten Fahrzeugauslegung. Ph.D. Thesis, Karlsruher Institut für Technologie, Karlsruhe, Germany, 2015. [Google Scholar]
- Corchero, C.; Gonzalez-Villafranca, S.; Sanmarti, M. European electric vehicle fleet: Driving and charging data analysis. In Proceedings of the 2014 IEEE International Electric Vehicle Conference (IEVC), Florence, Italy, 17–19 December 2014; pp. 1–6. [Google Scholar] [CrossRef]
- Krug, S.; Krey, O.; Ohm, B.; Weider, M.; Ziem-Milojevic, S.; Braune, O. Elektromobilität in der Praxis. Zweiter Ergebnisbericht des Zentralen Datenmonitorings des Förderprogramms Elektromobilität vor Ort. 2020. Available online: https://www.now-gmbh.de/wp-content/uploads/2020/09/now_elektromobilitaet-in-der-praxis-zdm.pdf (accessed on 15 November 2020).
- Schuster, A. Batterie- bzw. Wasserstoffspeicher bei elektrischen Fahrzeugen. Master’s Thesis, Technical University of Wien, Wien, Austria, 2008. [Google Scholar]
- Fieltsch, P.; Flämig, H.; Rosenberger, K. Analysis of charging behavior when using battery electric vehicles in commercial transport. Transp. Res. Procedia 2020, 46, 181–188. [Google Scholar] [CrossRef]
- Betz, J.; Hann, M.; Jäger, B.; Lienkamp, M. Evaluation of the potential of integrating battery electric vehicles into commercial companies on the basis of fleet test data. In Proceedings of the 2017 IEEE 85th Vehicular Technology Conference (VTC Spring), Sydney, NSW, Australia, 4–7 June 2017; IEEE: Piscataway, NJ, USA, 2017; pp. 1–7, ISBN 978-1-5090-5932-4. [Google Scholar]
- Waclaw, A.; Aloise, T.; Lienkamp, M. Charging infrastructure design for commercial company sites with battery electric vehicles: A case study of a Bavarian Bakery: Article submitted for publication. In Proceedings of the 2020 Fifteenth International Conference on Ecological Vehicles and Renewable Energies (EVER), Monte-Carlo, Monaco, 28–30 May 2020. [Google Scholar] [CrossRef]
- European Parliament. Directive (EU) 96/53/EC of 25 July 1996 Laying down fo Rcertain Road Vehicles Circulating within the Community the Maximum Authorized Dimensions in National and International Traffic and the Maximum Authorized Weights Ininternational Traffic; Directive (EU) 96/53/EC; European Parliament: Brussels, Belgium, 1996; Available online: https://eur-lex.europa.eu/legal-content/EN/TXT/?uri=CELEX%3A31996L0053 (accessed on 15 December 2020).
- Márquez-Fernández, F.J.; Domingues, G.; Lindgren, L.; Alaküla, M. Electric Roads: The importance of sharing the infrastructure among different vehicle types. In Proceedings of the IEEE Transportation Electrification Conference and Expo, Asia-Pacific (ITEC Asia-Pacific), Harbin, China, 7–10 August 2017. [Google Scholar] [CrossRef]
- Wolff, S.; Fries, M.; Lienkamp, M. Technoecological analysis of energy carriers for long-haul transportation. J. Ind. Ecol. 2019, 49, 6402. [Google Scholar] [CrossRef]
- Bateman, D.; Leal, D.; Reeves, S.; Emre, M.; Stark, L.; Ognissanto, F.; Myers, R.; Lamb, M. Electric Road Systems: A Solution for the Future? 2018. Available online: https://www.piarc.org/en/order-library/29690-en-Electric%20road%20systems:%20a%20solution%20for%20the%20future (accessed on 15 October 2020).
- Moultak, M.; Lutsey, N.; Hall, D. Transitioning to Zero-Emission Heavy-Duty Freight Vehicles. 2017. Available online: https://theicct.org/publications/transitioning-zero-emission-heavy-duty-freight-vehicles (accessed on 2 February 2021).
- Gesetz für den Ausbau Erneuerbarer Energien (Erneuerbare-Energien-Gesetz-EEG 2017) (Act for the Expansion of Renewable Energies [Renewable Energies Act-EEG 2017]). IdF d. Art. 1 Nr. 1 G v. 13.10.2016. 2014. Available online: https://www.gesetze-im-internet.de/eeg_2014/EEG_2017.pdf (accessed on 10 January 2021).
- Federal Minister for Environment, Nature Conservation and Nuclear Safety. Klimaschutzprogramm 2030 der Bundesregierung zur Umsetzung des Klimaschutzplans 2050 (Climate Protection Program 2030 of the Federal Government to implement the Climate Protection Plan 2050). 2019. Available online: https://www.bundesregierung.de/resource/blob/975226/1679914/e01d6bd855f09bf05cf7498e06d0a3ff/2019-10-09-klima-massnahmen-data.pdf (accessed on 15 December 2020).
- Schmidt, P.R.; Zittel, W.; Weindorf, W.; Raksha, T. Renewables in Transport 2050. Empowering a Sustainable Mobility Future with zero Emission Fuels from Renewable Electricity; Kraftstoffstudie II Final Report; Springer: Berlin/Heidelberg, Germany, 2016. [Google Scholar] [CrossRef]
- Agora Verkehrswende; Agora Energiewende; Frontier Economics. The Future Cost of Electricity-Based Synthetic Fuels. 2018. Available online: https://static.agora-verkehrswende.de/fileadmin/Projekte/2017/Die_Kosten_synthetischer_Brenn-_und_Kraftstoffe_bis_2050/Agora_SynKost_Study_EN_WEB.pdf (accessed on 2 May 2018).
- Dena. Dena-Leitstudie Integrierte Energiewende (dena Lead Study on Integrated Energy Transition) Impulse für die Gestaltung des Energiesystems bis 2050. 2018. Available online: https://www.dena.de/fileadmin/dena/Dokumente/Pdf/9261_dena-Leitstudie_Integrierte_Energiewende_lang.pdf (accessed on 15 December 2020).
- Kost, C.; Schlegl, T. Stromgestehungskosten erneuerbare Energien (Electricity Generation Costs Renewable Energies). 2018. Available online: https://www.ise.fraunhofer.de/content/dam/ise/de/documents/publications/studies/DE2018_ISE_Studie_Stromgestehungskosten_Erneuerbare_Energien.pdf (accessed on 15 December 2020).
- World Bank. State and Trends of Carbon Pricing 2020. 2020. Available online: https://openknowledge.worldbank.org/bitstream/handle/10986/33809/9781464815867.pdf?sequence=4&isAllowed=y (accessed on 16 December 2020).
- Manager Magazin. CO2-Steuern und Emissionshandel: Diese CO2-Preise Gibt es Schon Heute (CO2 Taxes and Emissions Trading: These CO2 Prices Already Exist Today). 2019. Available online: https://www.manager-magazin.de/fotostrecke/co2-steuer-diese-preise-gibt-es-schon-heute-fotostrecke-169692.html (accessed on 30 November 2020).
- The Regional Greenhouse Gas Initiative. Elements of RGGI. Available online: https://www.rggi.org/program-overview-and-design/elements (accessed on 30 November 2020).
- C40. C40: Shenzhen Carbon Emission Trading System. Available online: https://www.c40.org/case_studies/shenzhen-carbon-emission-trading-system (accessed on 30 November 2020).
- Center for Climate and Energy Solutions. California Cap and Trade. Available online: https://www.c2es.org/content/california-cap-and-trade/ (accessed on 30 November 2020).
- Åkerfeldt, S.; Waluszewski, D. Carbon Taxation in Sweden. 2020. Available online: https://www.government.se/492a01/contentassets/419eb2cafa93423c891c09cb9914801b/200224-carbon-tax-sweden---general-info.pdf (accessed on 16 December 2020).
- Quandl. ECX EUA Futures, Continuous Contract #1 (C1) (Front Month). Available online: https://www.quandl.com/data/CHRIS/ICE_C1-ECX-EUA-Futures-Continuous-Contract-1-C1-Front-Month (accessed on 16 December 2020).
- World Bank. State and Trends of Carbon Pricing 2018. 2018. Available online: https://openknowledge.worldbank.org/bitstream/handle/10986/29687/9781464812927.pdf?sequence=5&isAllowed=y (accessed on 16 December 2020).
- California Environmental Protection Agency. Overview of ARB Emissions Trading Program. 2015. Available online: https://ww2.arb.ca.gov/sites/default/files/classic//cc/capandtrade/guidance/cap_trade_overview.pdf (accessed on 16 December 2020).
- European Energy Exchange AG. China Beijing Environment Exchange (CBEEX). Available online: https://www.eex.com/en/markets/environmental-markets/chinese-carbon-market (accessed on 16 December 2020).
- California Air Ressource Board. California and Québec Carbon Allowance Prices. 2020. Available online: https://ww2.arb.ca.gov/sites/default/files/2020-09/carbonallowanceprices_0.pdf (accessed on 16 December 2020).
- Office Publications. Regulation (EC) No 595/2009 of the European Parliament and of the Council of 18 June 2009 on Type-Approval of Motor Vehicles and Engines with Respect to Emissions from Heavy Duty Vehicles (Euro VI) and on Access to Vehicle Repair and Maintenance Information and Amending Regulation (EC) No 715/2007 and Directive 2007/46/EC and Repealing Directives 80/1269/EEC, 2005/55/EC and 2005/78/EC. Regulation (EC) No 595/2009. 2019. Available online: https://eur-lex.europa.eu/legal-content/DE/TXT/?uri=CELEX%3A32009R0595 (accessed on 15 December 2020).
- Office Publications. Regulation (EU) 2019/1242 of the European Parliament and of the Council of of 20 Junel 2019 Setting CO2 Emission Performance Standards for New Heavy-Duty Vehicles and Amending Regulations (EC) No 595/2009 and (EU) 2018/956 of the European Parliament and of the Council and Council Directive 96/53/EC; 2019. Available online: https://eur-lex.europa.eu/legal-content/EN/LSU/?uri=CELEX%3A32019R1242 (accessed on 15 December 2020).
- Rexeis, M.; Quaritsch, M.; Hausberger, S.; Silberholz, G.; Kies, A.; Steven, H.; Goschütz, M.; Vermeulen, R. VECTO Tool Development: Completion of Methodology to Simulate Heavy Duty Vehicles' Fuel Consumption and CO2 Emissions. Upgrades to the Existing Version of VECTO and Completion of Certification Methodology to be Incorporated into a Commission Legislative Proposal. 2017. Available online: https://ec.europa.eu/clima/sites/clima/files/transport/vehicles/docs/sr7_lot4_final_report_en.pdf (accessed on 2 February 2021).
- Statista. Mobility Market Outlook. Available online: https://www.statista.com/outlook/mobility-markets (accessed on 23 September 2020).
- ADAC. Database for Vehicles. Available online: https://www.adac.de/rund-ums-fahrzeug/autokatalog/marken-modelle/ (accessed on 18 December 2020).
- AutoScout24. Fahrzeugbewertung. Available online: https://www.autoscout24.de/fahrzeugbewertung/ (accessed on 15 July 2020).
- KBA. Fahrzeugzulassungen (FZ): Neuzulassungen von Kraftfahrzeugen nach Umwelt-Merkmalen. Jahr 2019. Available online: https://www.kba.de/DE/Statistik/Produktkatalog/produkte/Fahrzeuge/fz14_n_uebersicht.html (accessed on 18 December 2020).
- BMWi. Bekanntmachung der Richtlinie zur Förderung des Absatzes von elektrisch betriebenen Fahrzeugen (Umweltbonus). Available online: https://www.bmwi.de/Redaktion/DE/Downloads/B/bekanntmachung-der-richtlinie-zur-foerderung-absatzes-von-elektrisch-betriebenen-fahrzeugen-umweltbonus.pdf?__blob=publicationFile&v=4 (accessed on 18 December 2020).
- check24.de. Vehicle Insurance Comparison Site. Available online: https://www.check24.de/kfz-versicherung/ (accessed on 25 July 2020).
- Bundesregierung. Entwurf eines Siebten Gesetzes zur Änderung des Kraftfahrzeugsteuergesetzes. Available online: https://www.bundesfinanzministerium.de/Content/DE/Gesetzestexte/Gesetze_Gesetzesvorhaben/Abteilungen/Abteilung_III/19_Legislaturperiode/2020-06-12-7-Aenderung-Kraftfahrzeugsteuergesetz/1-Regierungsentwurf.pdf?__blob=publicationFile&v=2 (accessed on 18 December 2020).
- Bundesregierung. Kraftfahrzeugsteuergesetz in der Fassung der Bekanntmachung vom 26. September 2002 (BGBl. I S. 3818). Available online: http://www.gesetze-im-internet.de/kraftstg/KraftStG_2002.pdf (accessed on 17 December 2020).
- TÜV. Hauptuntersuchung (HU) Gebühren. Available online: https://www.tuvsud.com/de-de/branchen/mobilitaet-und-automotive/hauptuntersuchung/gebuehren (accessed on 25 September 2020).
- ADAC. Autokosten-Rechner. Available online: https://www.adac.de/infotestrat/autodatenbank/autokosten/autokosten-rechner/default.aspx (accessed on 10 October 2020).
- Reifendirekt.de. Reifendirekt. Available online: https://www.reifendirekt.de (accessed on 10 October 2020).
- DAT. DAT Report 2018. 2018. Available online: https://www.dat.de/news/dat-report-2018-jetzt-erhaeltlich/ (accessed on 18 December 2020).
- ADAC. ADAC Autokosten Herbst/Winter 2019/2020-Kostenübersicht für über 1.600 aktuelle Neuwagen-Modelle. Available online: https://www.adac.de/_mmm/pdf/autokostenuebersicht_47085.pdf (accessed on 18 December 2020).
- INRIX. INRIX Studie zu den Kosten des Autofahrens: Parken Verursacht die Höchsten laufenden Ausgaben. Available online: https://inrix.com/press-releases/inrix-studie-zu-den-kosten-des-autofahrens-parken-verursacht-die-hochsten-laufenden-ausgaben/ (accessed on 11 August 2020).
- Fahrrad.de. Fahrrad.de-Studie zu Allgemeinen Fahrradnutzung in Deutschland 2015. Available online: https://www.fahrrad.de/on/demandware.static/-/Library-Sites-bikester/default/dw7f90cb9f/Blog/studie-fahrradnutzung-deutschland.pdf (accessed on 17 December 2020).
- VSF. VSF-Fachhandelsmitglieder zur Entwicklung des Jahres 2018 (Verbund Service und Fahrrad). Available online: https://nationaler-radverkehrsplan.de/de/aktuell/nachrichten/durchschnittspreis-aller-verkauften-fahrraeder-lag (accessed on 15 September 2020).
- Zweirad-Industrie-Verband. Zweirad-Industrie-Verband (ZIV)-Wirtschaftspressekonferenz am 11. März 2020 in Berlin: Zahlen–Daten–Fakten zum Fahrradmarkt in Deutschland 2019. 2019. Available online: https://www.ziv-zweirad.de/fileadmin/redakteure/Downloads/Marktdaten/PK-2020_11-03-2020_Praesentation.pdf (accessed on 18 December 2020).
- Zweirad-Industrie-Verband e.V. (ZIV). Average Cost of Bicycles; Interview with Head of Marketing and Communications: Bad Soden am Taunus, Germany, 2020. [Google Scholar]
- Fahrradblog.de. Fahrradblog-Fahrradinspektion–Wartung mit Checkliste. Available online: https://www.fahrradblog.de/sicherheit/fahrradinspektion-wartung-mit-checkliste/#Kosten_fuer_Fahrradinspektion (accessed on 3 October 2020).
- Schwalbe. Verschleiss Reifen. Available online: https://www.schwalbe.com/de/verschleiss (accessed on 3 August 2020).
- GHOST-BIKES. User Manual for Bicycles. Available online: https://www.ghost-bikes.com/fileadmin/user_upload/Downloads/Bedienungsanleitung/GHOST_bike_user_manual_german.pdf (accessed on 3 October 2020).
- Bundesregierung. Elektrokleinstfahrzeuge-Verordnung vom 6. Juni 2019 (BGBl. I S. 756). Available online: https://www.gesetze-im-internet.de/ekfv/BJNR075610019.html (accessed on 18 December 2020).
- Bundesregierung. Straßenverkehrs-Zulassungs-Ordnung vom 26. April 2012 (BGBl. I S. 679). Available online: https://www.gesetze-im-internet.de/stvzo_2012/BJNR067910012.html (accessed on 18 December 2020).
- Severengiz, S.; Finke, S.; Schelte, N.; Wendt, N. Life cycle assessment on the mobility service E-Scooter sharing. In Proceedings of the 2020 IEEE European Technology and Engineering Management Summit (E-TEMS), Dortmund, Germany, 5–7 March 2020; pp. 1–6, ISBN 978-1-7281-0903-9. [Google Scholar]
- Laa, B.; Leth, U. Survey of E-scooter users in Vienna: Who they are and how they ride. J. Transp. Geogr. 2020, 89, 102874. [Google Scholar] [CrossRef]
- Schellong, D.; Sadek, P.; Schaetzberger, C.; Barrack, T. The Promise and Pitfalls of E-Scooter Sharing. Available online: https://image-src.bcg.com/Images/BCG-The-Promise-and-Pitfalls-of-E-Scooter%20Sharing-May-2019_tcm81-220107.pdf (accessed on 18 December 2020).
- CarSharing.de. CarSharing-Städteranking 2019: Karlsruhe ist weiterhin Spitzenreiter. Available online: https://carsharing.de/presse/pressemitteilungen/carsharing-staedteranking-2019-karlsruhe-ist-weiterhin-spitzenreiter (accessed on 18 December 2020).
- Münzel, K.; Boon, W.; Frenken, K.; Vaskelainen, T. Carsharing business models in Germany: Characteristics, success and future prospects. Inf. Syst. Bus. Manag. 2018, 16, 271–291. [Google Scholar] [CrossRef]
- ShareNow. Preisüberblick. Available online: https://www.share-now.com/de/de/pricing/?cid=sn_ppc_de_all_none_performance_google_prsitelink_none_none_none_none_none_none_none_none&gclid=CjwKCAjww5r8BRB6EiwArcckC5R-gZb6mzlaAPSRDluq_OWgddb2W8a7nEk2sJR142NgSBfmgb-d3hoCj0MQAvD_BwE (accessed on 10 October 2020).
- STATTAUTO. Preise. Available online: https://www.stattauto-muenchen.de/standardtarif/ (accessed on 18 December 2020).
- MVG. MVG Rad. Available online: https://www.mvg.de/services/mobile-services/mvg-rad.html?pk_campaign=03_Generic_Standort&pk_kwd=%2Bleihräder%20%2Bmünchen&pk_source=GoogleAds&pk_medium=cpc (accessed on 18 December 2020).
- Heineke, K.; Kloss, B.; Scurtu, D.; Weig, F. Micromobility’s 15,000-Mile Checkup. Available online: https://www.mckinsey.com/industries/automotive-and-assembly/our-insights/micromobilitys-15000-mile-checkup (accessed on 18 December 2020).
- Tier. Tier App. Available online: https://mytier.app (accessed on 18 December 2020).
- Zagorskas, J.; Burinskienė, M. Challenges Caused by Increased Use of E-Powered Personal Mobility Vehicles in European Cities. Sustainability 2019, 12, 273. [Google Scholar] [CrossRef]
- Emmy. Emmy-Sharing: Preise. Available online: https://emmy-sharing.de (accessed on 2 November 2020).
- Ennen, D.; Heilker, T. Ride-Hailing Services in Germany: Potential Impacts on Public Transport, Motorized Traffic, and Social Welfare. Available online: https://ideas.repec.org/p/mut/wpaper/29.html (accessed on 18 December 2020).
- Uber. Uber. Available online: https://www.uber.com/de/en/ (accessed on 18 December 2020).
- München, L. TaxitarifO 410-Verordnung der Landeshauptstadt München über Beförderungsentgelte und Beförderungsbedingungen für den Verkehr mit Taxen (Taxitarifordnung). Available online: https://www.muenchen.de/rathaus/Stadtrecht/vorschrift/410.pdf (accessed on 18 December 2020).
- MVV. MVV-Pläne zum Download. Available online: https://www.mvv-muenchen.de/plaene-bahnhoefe/plaene/index.html (accessed on 31 October 2020).
- MVV. Pressemitteilungen. Available online: https://www.mvv-muenchen.de/mvv-und-service/presse/index.html (accessed on 20 August 2020).


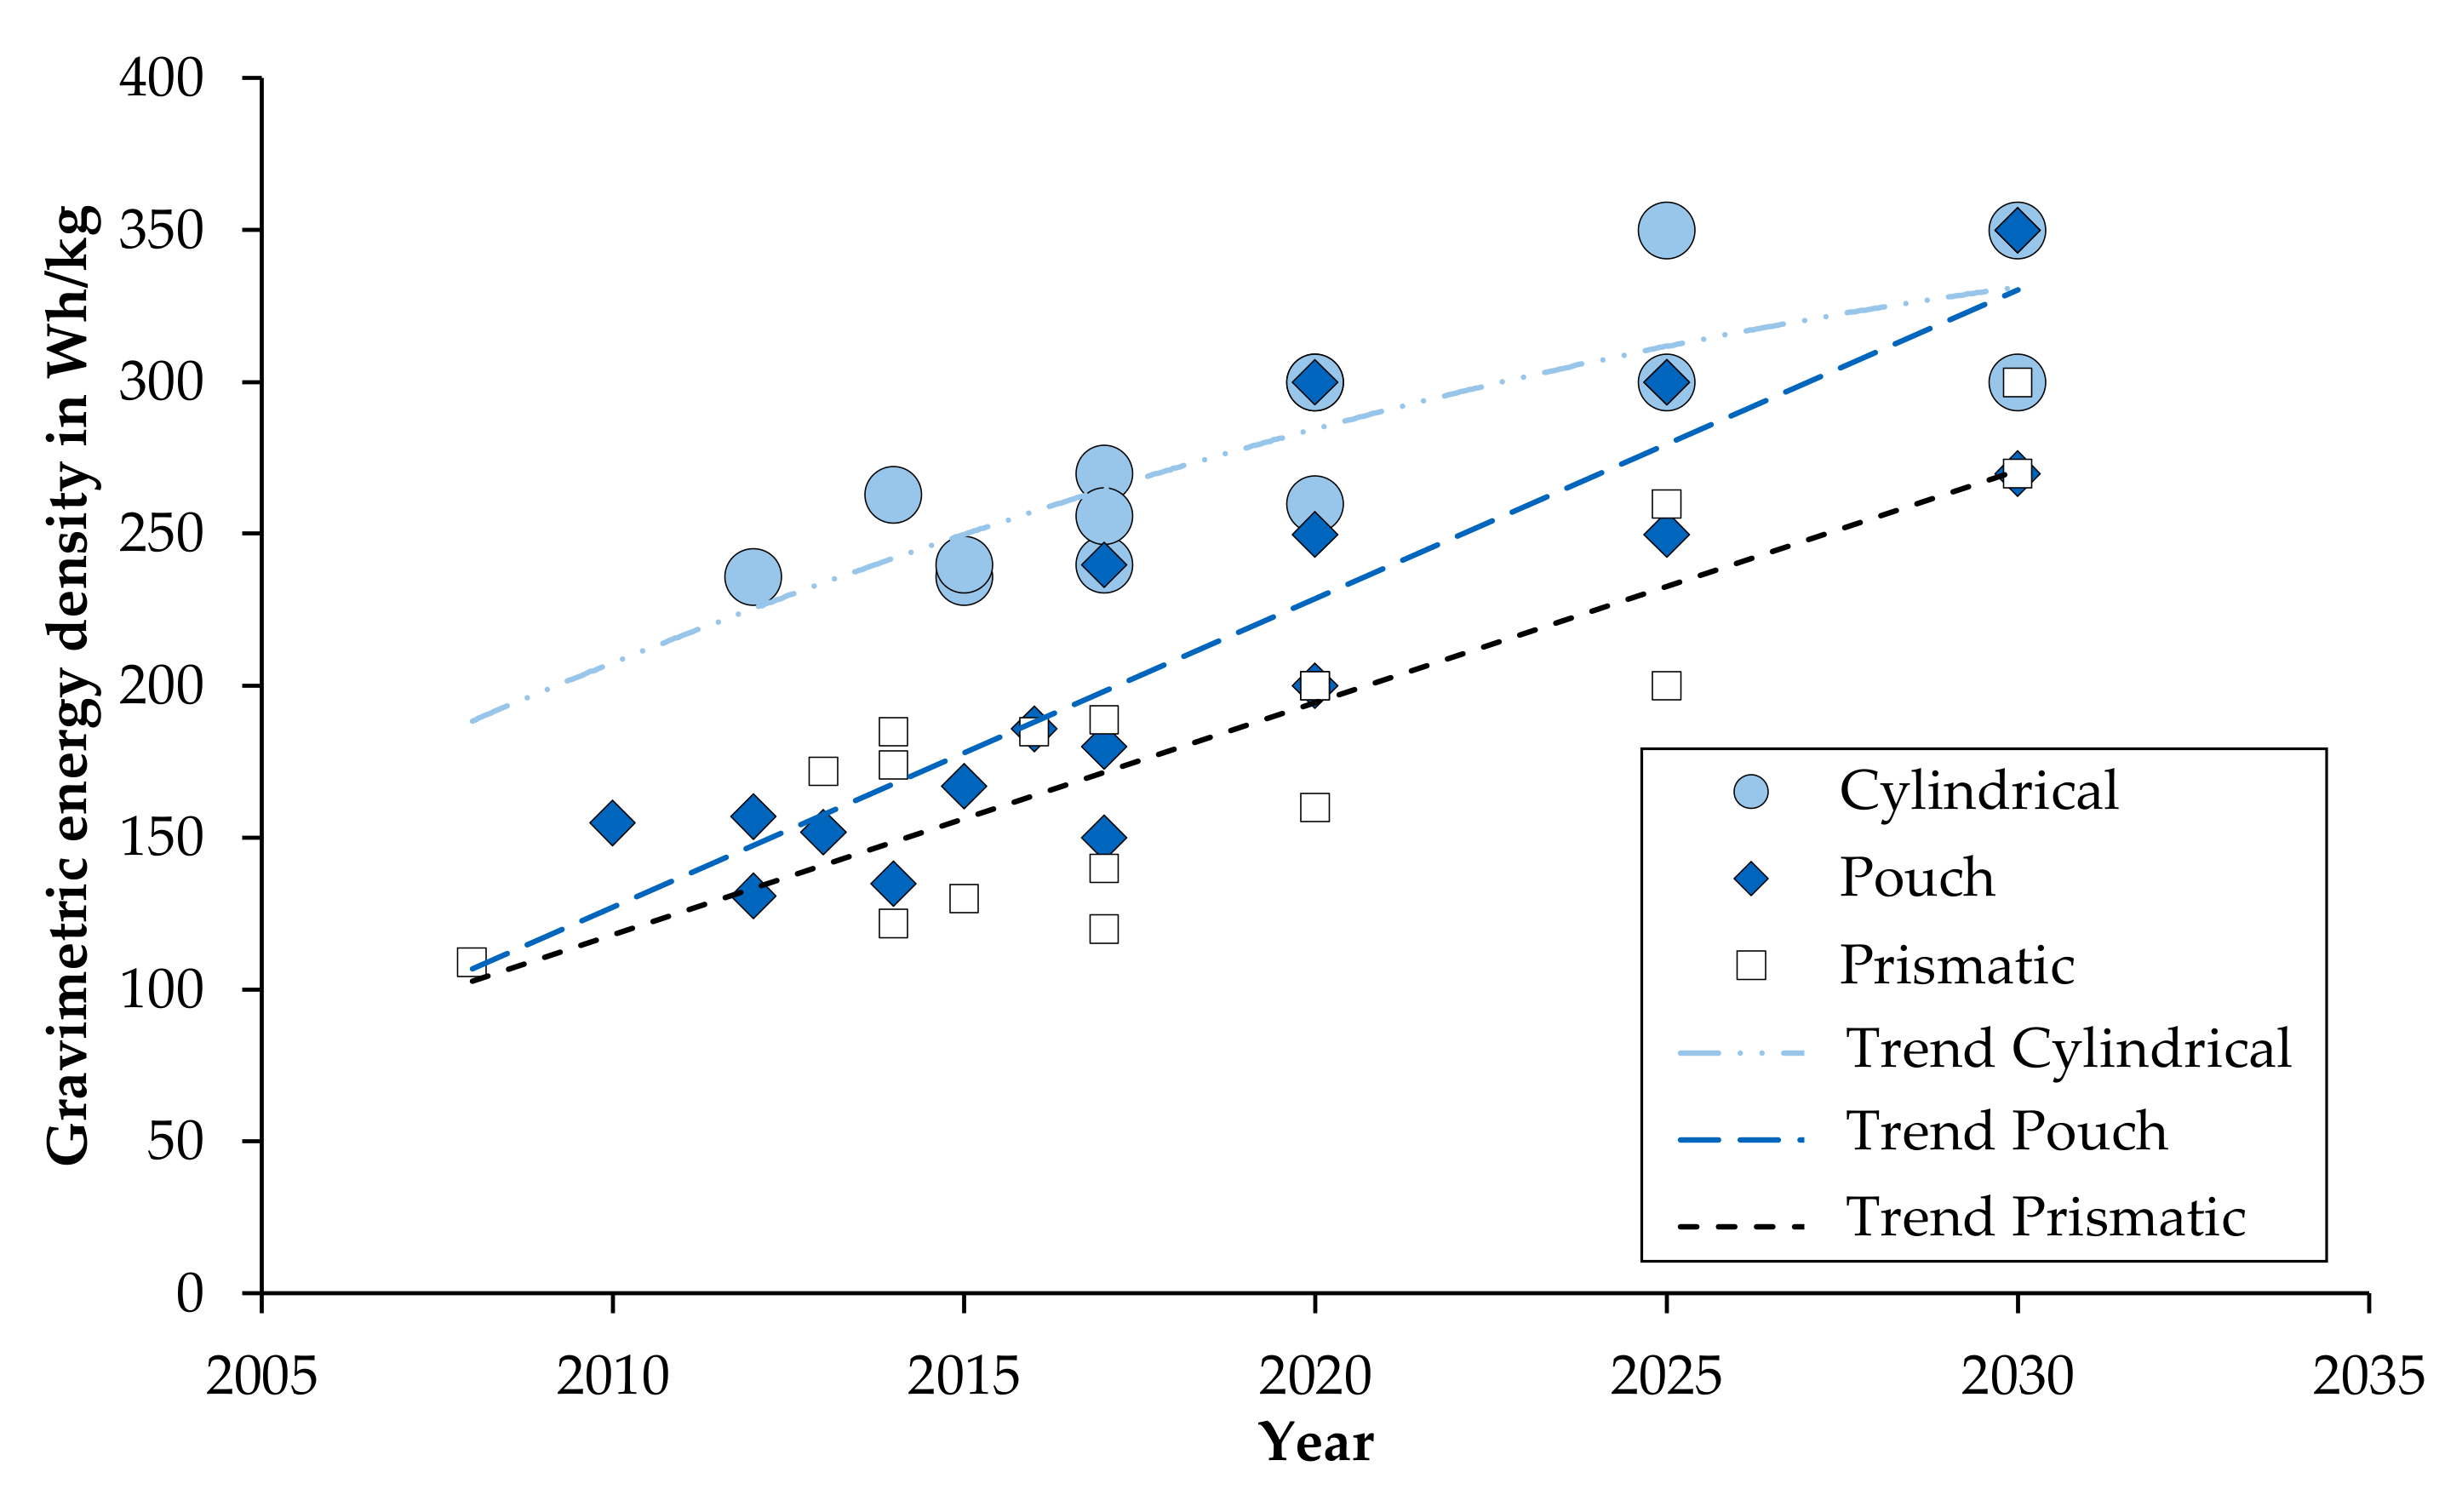
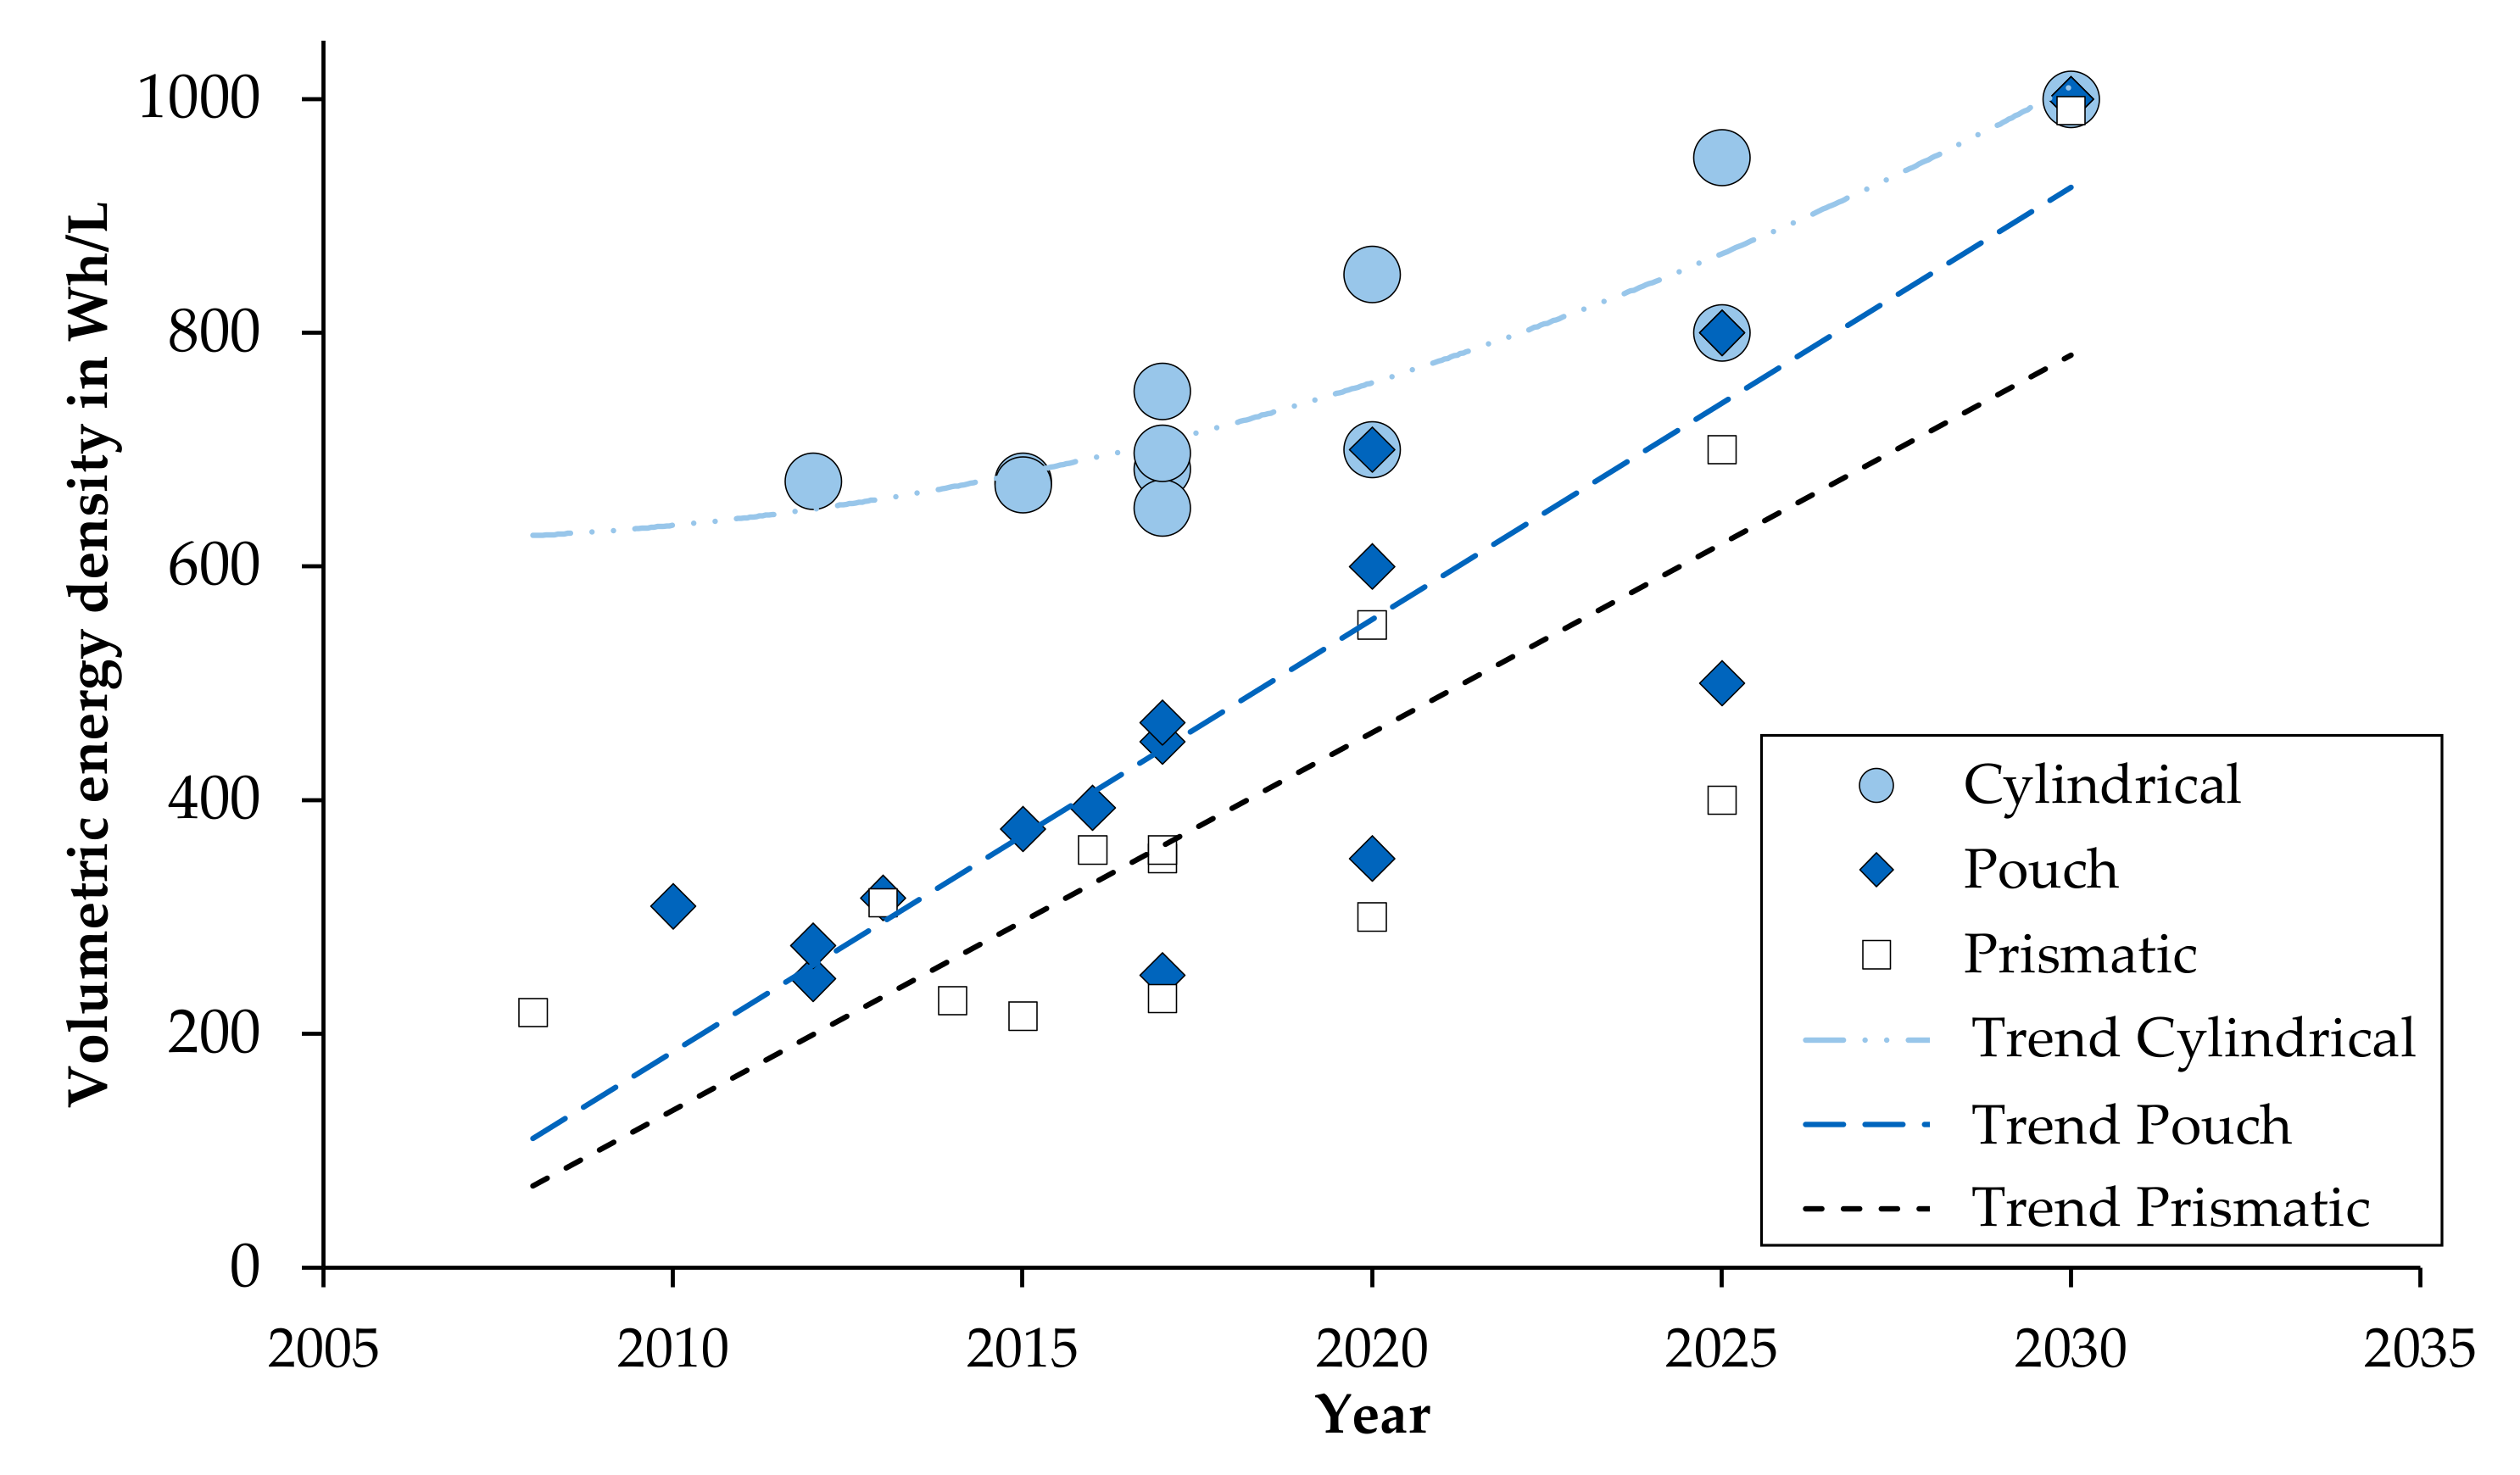
| Year | Cylindrical Cell | Prismatic Cell | Pouch Cell | |||
|---|---|---|---|---|---|---|
| Gravimetric | Volumetric | Gravimetric | Volumetric | Gravimetric | Volumetric | |
| 2020 | 287 Wh/kg | 775 Wh/L | 187 Wh/kg | 425 Wh/L | 250 Wh/kg | 550 Wh/L |
| 2025 | 325 Wh/kg | 875 Wh/L | 230 Wh/kg | 550 Wh/L | 283 Wh/kg | 700 Wh/L |
| 2030 | 325 Wh/kg | 1000 Wh/L | 285 Wh/kg | 990 Wh/L | 323 Wh/kg | 1000 Wh/L |
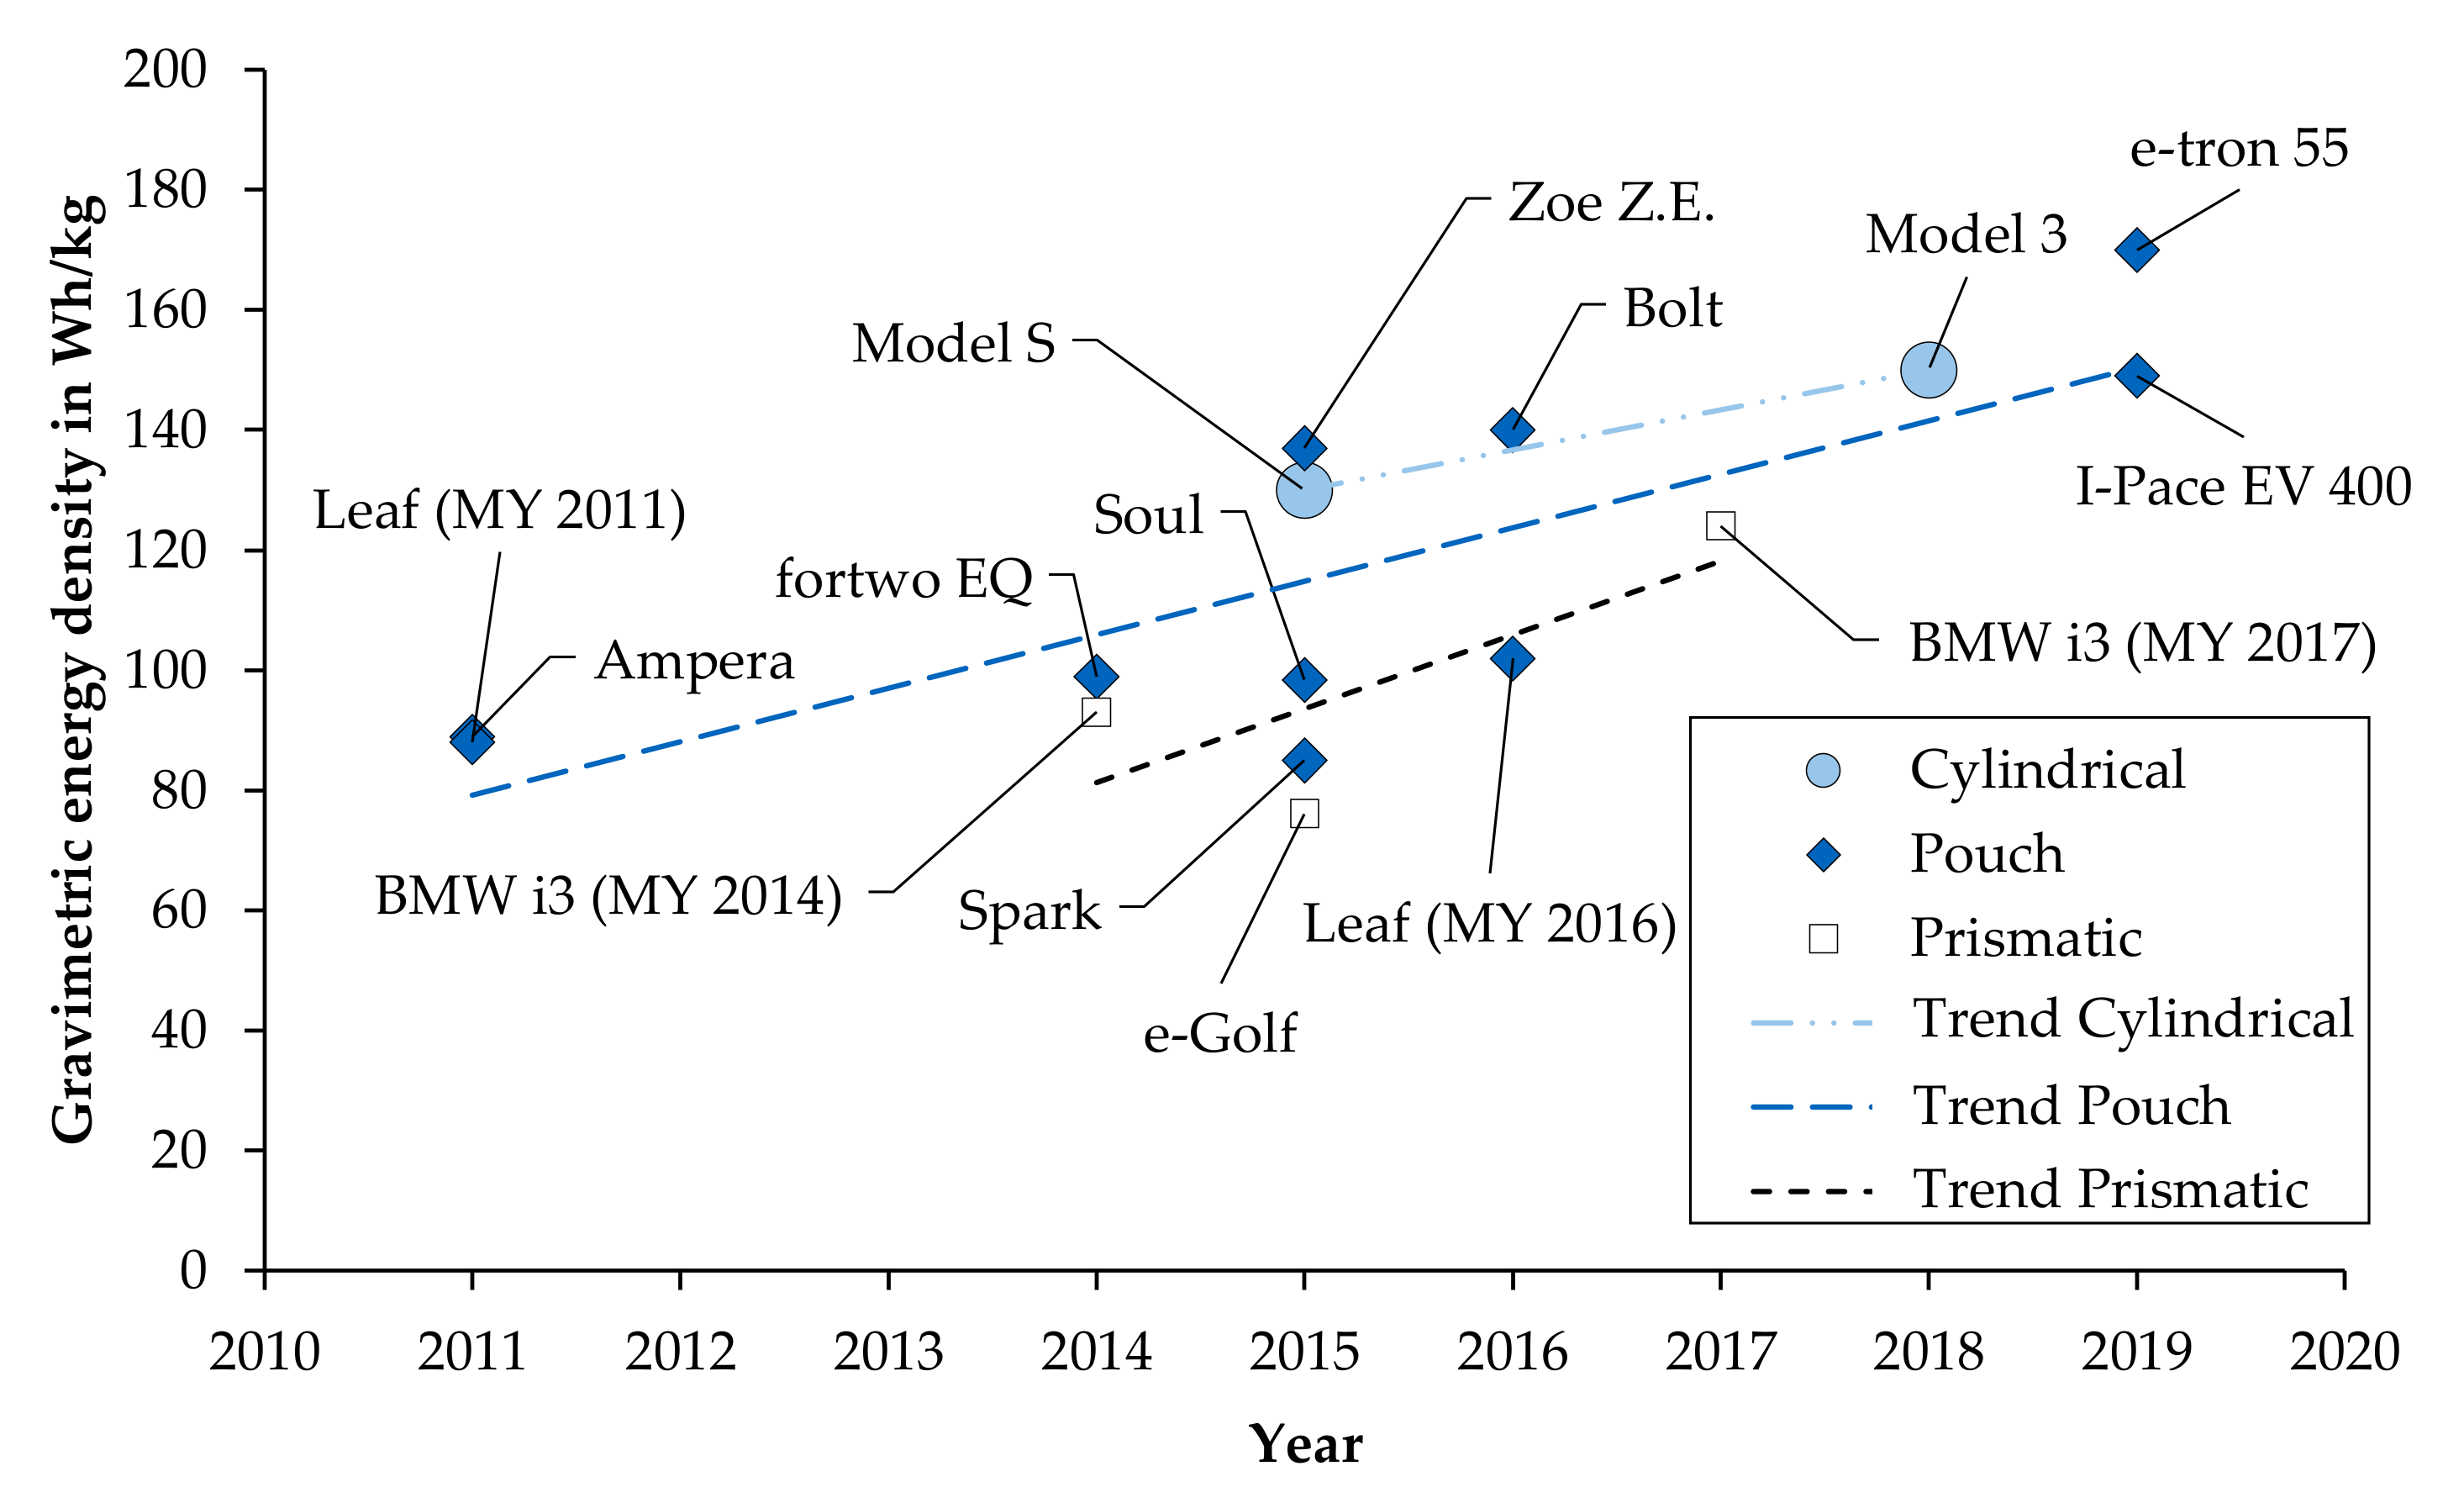
| Vehicle | Model Year | Assumed Units Per Year | Pack Costs |
|---|---|---|---|
| BMW i3 | 2014 | 15,000 | 396 €/kWh |
| GM Bolt | 2016 | 20,000 | 224 €/kWh |
| BMW i3 | 2017 | 25,000 | 254 €/kWh |
| Renault Zoe | 2017 | 40,000 | 208 €/kWh |
| Tesla Model 3 | 2018 | 100,000 | 164 €/kWh |
| Audi e-tron | 2019 | 100,000 | 157 €/kWh |
| Year | 2020 | 2025 | 2030 |
|---|---|---|---|
| Minimum value | 1.94 | 1.47 | 1.17 |
| Maximum value | 2.21 | 1.32 | 1.24 |
| Mean value | 2.07 | 1.40 | 1.20 |
| Component | Costs | Source |
| Windows | 75 € | [63] |
| Window lifter | 12 € | [63] |
| Exterior lights | 140 € | [63] |
| Low-voltage electronics (excluding wiring harness) | 520 € | [5] |
| Wiring harness | 210 € | [5] |
| ESP | 160 € | [5] |
| Airbag | 20 € | [63] |
| HVAC | 80 € | [63] |
| Seat warmer | 10 € | [63] |
| Windshield wiper | 30 € | [63] |
| Front seat | 100 € | [63] |
| Body in white and exterior (ICEV) | 1700 € | [9] |
| Body in white and exterior (BEV) | 2100 € | [9] |
| Material | Specific Costs | Source |
| Aluminum | 2,5–4 €/kg | [63] |
| High-strength steel | 0.6–1 €/kg | [63] |
| Plastic PP | 1.6–2 €/kg | [63] |
| Plastic ABS | 2.5–3.5 €/kg | [63] |
| Component | Costs | Source |
|---|---|---|
| Lidar Sensor | 540 € | [72] |
| Radar Sensor | 90 € | [63] |
| Camera | 25 € | [63] |
| Triple-Camera | 60 € | [74] |
| Ultrasonic Sensor | 5 € | [63] |
| Computer | 680 € | [73,74] |
| Vehicle Type | Year | Costs Per Vehicle Per km | Costs Per Person Per km | Mode | Source |
|---|---|---|---|---|---|
| Midsize (regional) | 2017 | 0.33 €/km | 0.29 €/km | Individual | [76] |
| Midsize (urban) | 2017 | 0.45 €/km | 0.37 €/km | Individual | [76] |
| Car—not specified | n/a | n/a | 0.14 €/km | Individual | [88] |
| Car—not specified | n/a | n/a | 0.11 €/km | Individual | [88] |
| Small SUV | 2030-2035 | 0.20 €/km | n/a | Individual | [89] |
| Large SUV | 2030-2035 | 0.22 €/km | n/a | Individual | [89] |
| Microtransit vehicle | 2030 | n/a | 0.07 €/km | Shared | [90] |
| Car—not specified | 2020-2030 | 0.11 €/km | n/a | Individual | [91] |
| Car—not specified | n/a | 0.25–0.27 €/km | n/a | Individual | [92] |
| Transport Mode | External Cost | Source |
|---|---|---|
| Cars | 0.12 €/km | EU (DG Move) [93] (p. 135) |
| Motorcycles | 0.25 €/km | EU (DG Move) [93] (p. 135) |
| Public transport | 0.04 €/km | Bieler and Sutter [94] |
| Bicycles | −0.18 €/km | Gössling et al. [95] |
| Walking | −0.37 €/km | Gössling et al. [95] |
| Parameter | Description | Value | Source |
|---|---|---|---|
| Lower SOC-limit | Defined by unease due to remaining range and end of comfort zone. | 15–25% or 50–100 km | [97,98,99,100,101,102] |
| Upper SOC-limit | Which SOC do users charge up to at charging stations? | 90–100% (private, corporate) 80% [99] (public, charging speed is reduced from 80% SOC [103]) | [100,102,104] |
| Catchment area of charging station | Maximum distance from charging station and actual location. Drivers must travel the distance by car separately and may have to walk back to the actual location. | 100–500 m | [105] |
| Minimal charging time | Parking time, from which a charging process is considered. | 5–15min | [101,102] |
| Component | Cost Category | 11 kW AC | 22 kW AC | 24 kW DC | 50 kW DC |
|---|---|---|---|---|---|
| Charging point (CP) | Acquisition costs per CP | 1250 € | 1500 € | 15,000 € | 30,000 € |
| Installation costs of base/per CP | 1000 € + 500 € per CP | ||||
| Charge management | Acquisition and installation costs | 2500 € | 2500 € | 3500 € | 3500 € |
| Installation costs per CP | 100 € | 100 € | 100 € | 100 € | |
| Cost Type | Investment Costs | Operational Costs | Additional Vehicle Costs ** | Source |
|---|---|---|---|---|
| Catenary | 2–2.5~M€/km * | 1–2~%capex/year | 20,000–47,500~€ | [109] |
| Conductive | 0.5–1.2 M€/km * | 1–2~%capex/year | 10,000 € † | [110] |
| Inductive | 2.6–3.6~M€/km * | 1–2.5~%capex/year | 10,000–10,800 € | [109,111] |
| Year | Gasoline and Diesel | Power to Liquid, Domestic | Power-to-Liquid, MENA | SMR Hydrogen | Electrolysis Hydrogen, Domestic | Electrolysis Hydrogen, MENA | Electricity mix | Renewable Electricity |
|---|---|---|---|---|---|---|---|---|
| 2020 | 0.046 | 0.855 | n/a | 0.26 | n/a | n/a | 0.105 | 0.061 |
| 2030 | 0.054 | 0.307 | 0.121 | 0.058 | 0.121 | 0.074 | 0.121 | 0.061 |
| Price in €/tCO2. | Introduction | Country |
|---|---|---|
| 10.5 | 2008 | China (Bejing) |
| 0.99 | 2015 | China (Shenzen) |
| 25–60 | 2003 | Germany |
| 44.6 | 2014 | France |
| 20 | 2013 | Great Britain |
| 2.4 | 2012 | Japan |
| 10.2 | 2019 | Canada |
| 0.07 | 1990 | Poland |
| 112 | 1991 | Sweden |
| 87 | 2018 | Switzerland |
| 7.7 | 2019 | South Africa |
| 20 | 2015 | South Korea |
| 15.5 | 2013 | USA (California) |
| 5 | 2009 | USA (RGGI *) |
Publisher’s Note: MDPI stays neutral with regard to jurisdictional claims in published maps and institutional affiliations. |
© 2021 by the authors. Licensee MDPI, Basel, Switzerland. This article is an open access article distributed under the terms and conditions of the Creative Commons Attribution (CC BY) license (http://creativecommons.org/licenses/by/4.0/).
Share and Cite
König, A.; Nicoletti, L.; Schröder, D.; Wolff, S.; Waclaw, A.; Lienkamp, M. An Overview of Parameter and Cost for Battery Electric Vehicles. World Electr. Veh. J. 2021, 12, 21. https://doi.org/10.3390/wevj12010021
König A, Nicoletti L, Schröder D, Wolff S, Waclaw A, Lienkamp M. An Overview of Parameter and Cost for Battery Electric Vehicles. World Electric Vehicle Journal. 2021; 12(1):21. https://doi.org/10.3390/wevj12010021
Chicago/Turabian StyleKönig, Adrian, Lorenzo Nicoletti, Daniel Schröder, Sebastian Wolff, Adam Waclaw, and Markus Lienkamp. 2021. "An Overview of Parameter and Cost for Battery Electric Vehicles" World Electric Vehicle Journal 12, no. 1: 21. https://doi.org/10.3390/wevj12010021
APA StyleKönig, A., Nicoletti, L., Schröder, D., Wolff, S., Waclaw, A., & Lienkamp, M. (2021). An Overview of Parameter and Cost for Battery Electric Vehicles. World Electric Vehicle Journal, 12(1), 21. https://doi.org/10.3390/wevj12010021