Article

Regenerative Braking Strategy of a Formula SAE Electric Race Car Using Energetic Macroscopic Representation

by
Andrés Camilo Henao-Muñoz
1,*,
Paulo Pereirinha
1,2 and
Alain Bouscayrol
3
1
Coimbra Polytechnic-ISEC, 3030-199 Coimbra, Portugal
2
INESC-Coimbra DEEC, 3030-790 Coimbra, Portugal
3
Univ. Lille, Centrale Lille, Arts et Métiers Paris Tech, HEI, EA 2697 – L2EP, F-59000 Lille, France
*
Author to whom correspondence should be addressed.
World Electr. Veh. J. 2020, 11(2), 45; https://doi.org/10.3390/wevj11020045
Submission received: 28 April 2020 / Revised: 1 June 2020 / Accepted: 2 June 2020 / Published: 11 June 2020
(This article belongs to the Special Issue Propulsion Systems of EVs)

Abstract

:
This paper presents a braking strategy analysis for a Formula SAE electric race car. The proposed braking strategy aims to increase the recovery energy by a relevant distribution of the braking forces between the rear and front wheels. A mathematical model of the car is presented, and a simulation is performed in Matlab-Simulink. The model is organized using the energetic macroscopic representation graphical formalism. A real racetrack driving cycle is considered. Three braking strategies are compared considering the energy recovery and the vehicle stability. The simulation results show that the proposed strategy enables higher energy recovery while avoiding locking on both rear and front wheels. As in such a race the driving range is fixed, the reduction in energy consumption can be used to reduce the battery size. The battery weight can thus be decreased to improve the vehicle performance during competition.

1. Introduction

Greenhouse gas (GHG) emissions and air pollution are major concerns related to the massive deployment of gasoline and diesel vehicles. The harmful effects of GHG and air pollution on human health should drastically change the trends in transportation evolution. Electric mobility could help in reducing air pollution in urban areas, where it is more critical. Furthermore, benefits such as low noise, high efficiency, and potentially smart interaction with the grid will increase the electric vehicle (EV) market. Following this tendency, the European Union has ambitious goals for low emission mobility aligned with the commitments acquired in the Paris agreement [1,2]. Furthermore, the path followed is similar around the world, even if statistics are different [3,4].
Regenerative braking systems (RBS) allow EVs to recover part of the kinetic energy usually dissipated in heat when traditional friction braking systems (FBS) are used. The main benefits of having an RBS are greater energetic efficiency, greater range, and reduced stress and heat dissipation requirements for FBS. However, usually, RBS alone cannot provide enough braking force to guarantee vehicle safety. So, RBS and FBS are used together in hybrid braking systems (HBS). The usage of HBS requires a more complex braking strategy to seize the most from each braking system and compensate for their weaknesses [5,6].
A braking strategy should define the braking force distribution and the coordination of the braking sources. The most common objectives of braking strategies are vehicle stability and energy recovery [5,6]. The integration of the anti-lock feature using RBS is a major concern when braking strategies are defined [7]. In this last regard, electric machines’ torque response facilitates the implementation of the active control of braking force, which could improve the anti-lock performance in EVs [5].
Regenerative braking strategies have been studied for hybrid EVs (HEVs) and EVs in general. Ruan et al. proposed a comparison of three braking strategies for passenger cars in [8]. An eco strategy to increase energy recovery, a safety strategy for wet and snow roads, and a sport strategy for more aggressive braking have been proposed. The economic benefit of each regenerative braking strategy was highlighted using different driving cycles, including one designed by the authors to make the test more authentic and reliable. A similar approach was used in the study of Xiao et al. [9]. The ideal braking force distribution curve was used to define rear and front wheels braking forces. Also, a racing strategy based on a fuzzy controller was proposed to improve the dynamic response of the braking systems during hard braking conditions. This strategy considers the state of charge (SoC) of the battery bank, the speed of the electric machine, and the braking strength requested to select the proportion of frictional and electric braking force. In the study of Itani et al. [10], two braking control methods were compared. First, a sliding mode controller was used to control the wheels’ slip ratio during unknown road conditions. The second method was based on ECE R13H constraints for an M1 passenger vehicle. The distribution of braking forces was as biased as possible to the front wheels to increase the energy recovered during braking. However, the regenerative braking was not used at very high speeds to avoid stability problems in low adhesion roads. Xu, et al. proposed a model predictive control (MPC) together with a holistic control strategy to optimize the braking torque in a four in-wheel motor electric vehicle in [11]. The results obtained with the MPC were compared to a rule-based controller for dry, wet, and snow road conditions. Other works such as [12,13,14,15] presented different braking strategies with similar objectives and applications in EVs. The works mentioned above used different strategies to define the distribution of braking forces and the participation of regenerative braking in passenger EVs. However, it is not common to find braking strategies for rear wheels traction EVs, such as formula race cars. Kumar et al. presented a braking strategy for a series hybrid electric vehicle with a rear wheel power train in [16]. The strategy is focused on modifying the conventional parallel braking system to achieve higher energy recovery. A combined braking algorithm is introduced, and the braking force is mainly commanded using RBS. The FBS is used as an emergency system. However, the regenerative braking torque was only limited by the maximal torque that the electric machine can provide, and the charging capabilities of the storage system were not considered. Furthermore, the algorithm was tested in a highway and urban driving cycles. Sangtarash et al. presented a comparison of series and parallel braking strategies in a hybrid electric bus with a rear power train in [17]. The study was performed in AVL/CRUISE software, and the results showed that braking distribution biased to the rear wheels increases the energy recovered. In the study of Le Soliec et al. [18], a regenerative braking study was done focusing on the estimation of the road adherence conditions of the road and wheel slip control. Simulations were conducted for high and low friction conditions, evaluating the longitudinal slip during braking.
Race cars have been a very interesting testbed for automotive industry development. Formula E and Formula SAE for electric cars have been used not only for entertainment and educational purposes, but also for research and development of EVs technologies such as regenerative braking and control strategies [7,19,20,21]. Some modeling and simulation works have been published within the framework of Formula SAE competition [22,23,24]. Furthermore, some other works have analyzed the energy recovery in HEV and EV race cars [7,21,25]. Other works presented for race cars included the EMR graphical formalism to organize the models. EMR is a powerful tool to represent power conversion systems and define their control structure [26]. In the study of Transi et al. [27], the study of a race car focused on a constant share strategy for regenerative braking was presented. The car model was described and then represented using EMR. An extension was presented in [28], where a hardware-in-the-loop (HIL) simulation was included and the simulation results were validated. Montesinos-Miracle et al., presented the simulation of a race car using EMR formalism in [29]. The car model included an electric differential, but regenerative braking was not considered. Lebel et al. studied the benefits of regenerative braking for an electric superbike using EMR graphical formalism in [30]. Their results suggested that energy recovery increases the range of the vehicle by up to 14%. Guo et al. proposed a method to find the optimal distribution ratio of the regenerative braking and the friction braking torque to maximize energy recovery in [31]. To do that, a genetic algorithm was used, and the requested braking torque was located as much as possible on the front wheels where the electric machines were located.
Most of the previous studies are focused on the range extension due to the recovery energy. In a race context, the distance is fixed, and the recovery energy during braking can be considered to reduce the size of the battery and the FBS. Such a reduction can have an impact on the velocity, acceleration, and thus the general performance of the car.
This paper aims to determine the energy recovery potential of an electric race car with RBS and electric differential. The car model is organized using the EMR formalism, and the braking strategy is presented. The proposed braking strategy is compared to other strategies found in the literature. The potential energy recovery and braking stability of each strategy are highlighted, and the potential mass reduction of the battery is quantified.
Section 2 presents the model of the car studied using the EMR formalism. The control structure is introduced in Section 3. Section 4 deals with the investigated braking strategy. The results are presented and discussed in Section 5.

2. Modeling and EMR of the Studied Car

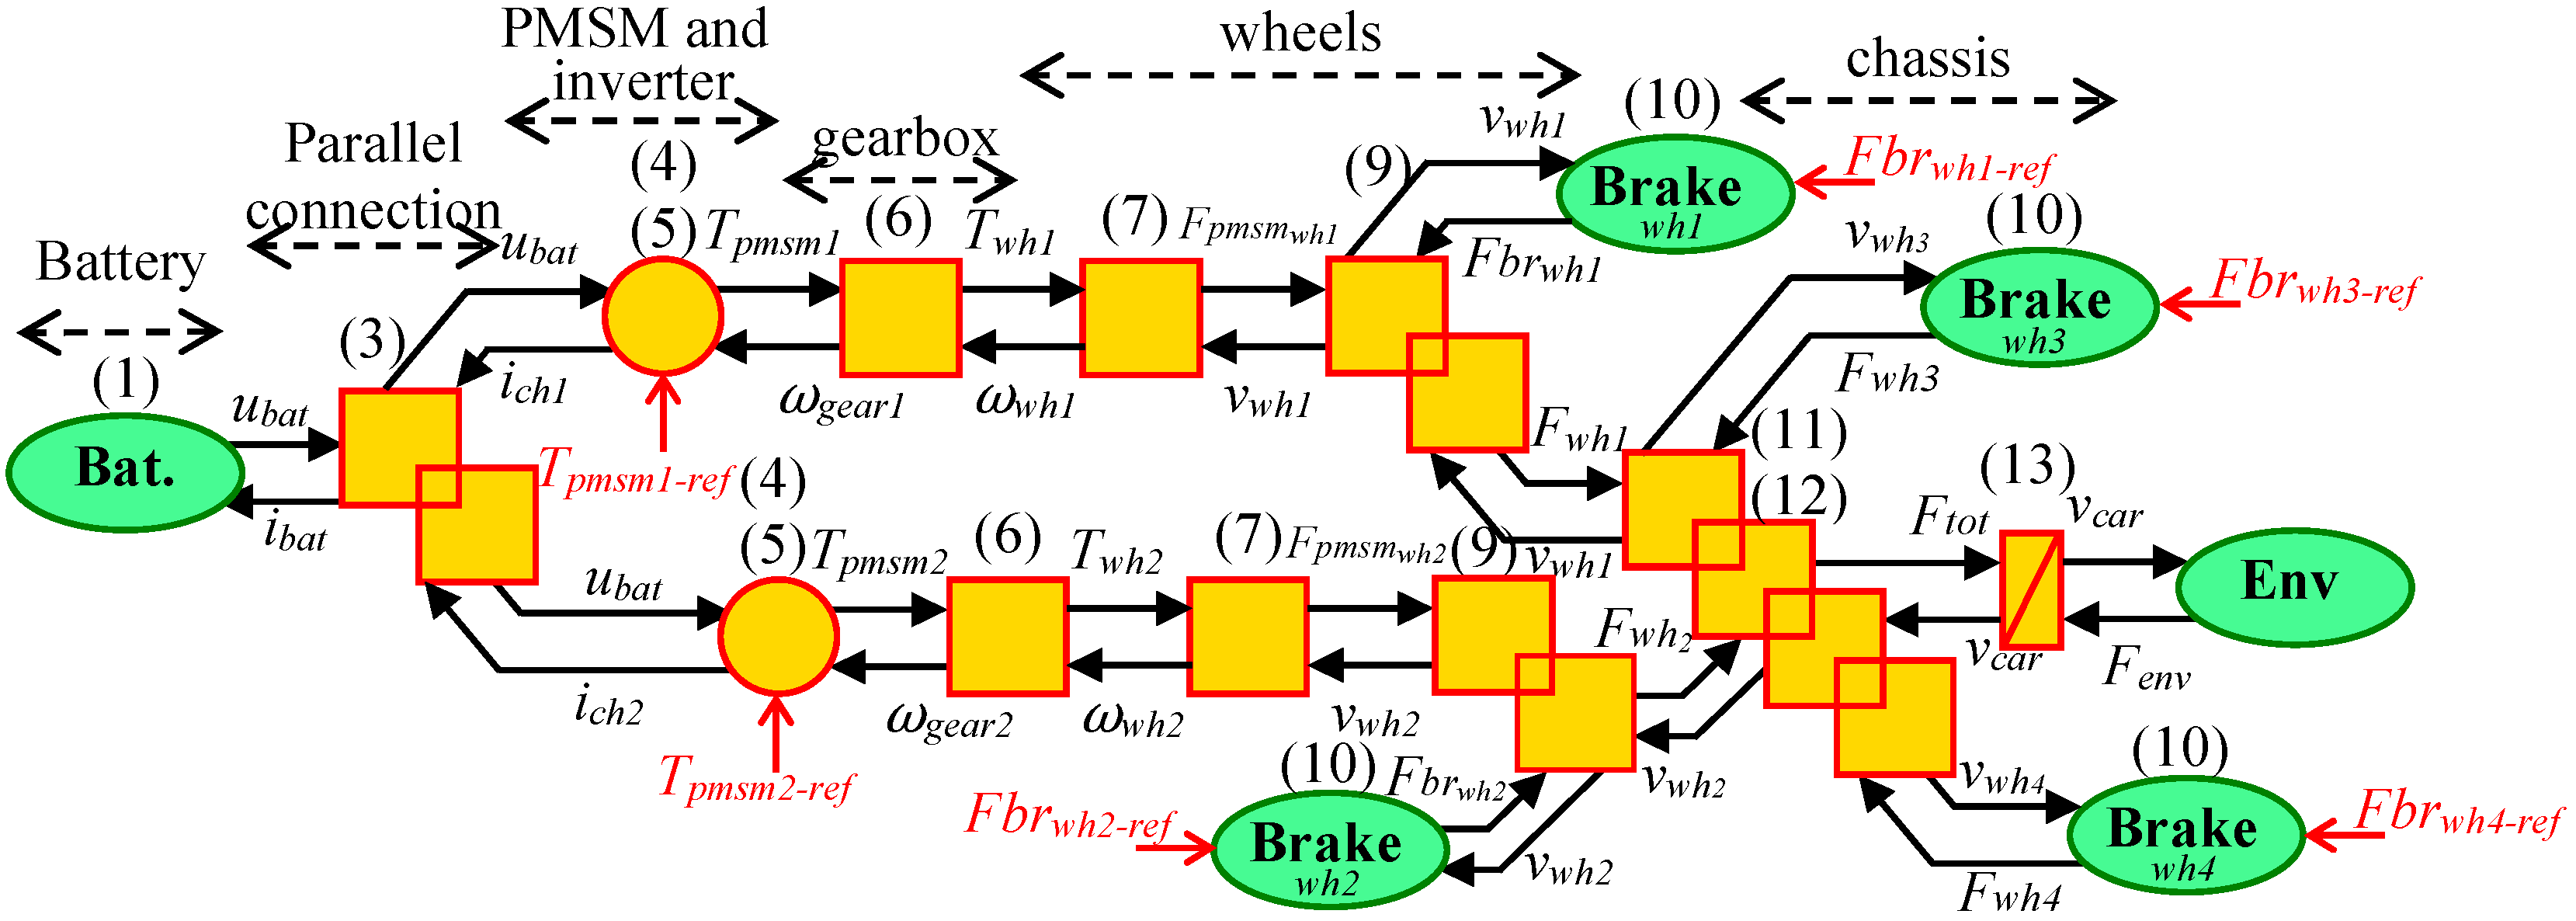
Figure 1 shows the structural description of the studied car. The power train includes two electric machines, one for each rear wheel. The electric machines are permanent magnet synchronous machines (PMSM) controlled independently by two inverters supplied by a unique battery pack. The shaft of the PMSM is connected to a fixed-ratio gearbox, connected to the rear wheels. With this power train configuration, a mechanical differential is not necessary, and an electrical differential strategy is included to guarantee stability during a curve. The environmental forces coming from the aerodynamic drag and rolling resistance are considered.
In an energetic system, there are two main control goals. First, the dynamic performance, which implies that the system complies with its functional task in the best way. Second, energy consumption, which guarantees that the energy flow through the subsystems is safe and efficient. EMR is a graphical formalism developed to represent a system in such a way that both energetic interactions and dynamic performance control are clearly identified. Furthermore, EMR builds the control structure based on a system inversion approach [26].
The graphical elements in EMR include different colors and blocks that represent differently the interactions in the subsystems. The causality principle is at the core of this description: the physical integral causality is exclusively used and is related to energy accumulation elements [26]. The four basic elements used in EMR are described in Figure 2. Moreover, EMR leads to a systematic organization of control schemes from a systematic inversion philosophy (elements in light blue). The conversion elements are directly inverted, the accumulation elements are inverted using closed-loop control, and the coupling elements are inverted using distribution inputs as a degree of freedom to decompose the energy flow.
The detailed models for each subsystem and the complete EMR of the race car are presented as follows.
A lithium-iron-phosphate battery pack is used in the race car. In this case, a simplified model of the battery is considered. An ideal voltage source in series with an equivalent internal resistance represents the voltage and state of charge of the battery during operation [32]. The battery is a source in EMR.
u b a t = u o c i b a t R e q
S o C ( t ) = S o C 0 t 0 t i b a t d t C a p 3600
where u b a t is the voltage estimation, u o c is the open circuit voltage, i b a t is the current, R e q is the internal resistance, C a p is the nominal capacity, S o C is the state of charge of the battery, and S o C 0 is the initial value of S o C .
To supply both PMSM with one battery pack, a parallel connection is used. The current is split depending on the demand of each electrical machine (coupling element in EMR):
i b a t = i c h 1 + i c h 2
where i c h 1 and i c h 1 are the currents requested by each converter of machine 1 and 2.
An equivalent static model of the PMSM and its inverter is considered for simplicity in an energetic study [33]. This model assumes that the torque produced by the machine ( T p m s m ) is equal to the torque reference ( T p m s m r e f ). The achievable torque in each PMSM is a function of the angular speed of the machine [34]. The current requested from the battery by each machine is estimated using the mechanical power and the efficiency of the PMSM and its inverter. The PMSM is represented by a multi-physical conversion element in EMR.
T p m s m = T p m s m r e f
i c h = T p m s m ω g e a r u b a t η p m s m q η i n v q ,   where   q = { 1 P p m s m ( t ) < 0 1 P p m s m ( t ) 0
where η p m s m q and η i n v are the efficiencies of the PMSM and its inverter respectively, q indicates the power flow direction, and ω g e a r is the angular velocity of the PMSM. P p m s m is the instantaneous power of the PMSM, which is positive when the PMSM operates as a motor and negative when the PMSM operates as a generator (regenerative braking).
A ratio k g e a r defines the conversion of the mechanical power coming from the PMSM that then supplies the wheel (mono-physical conversion element in EMR).
{ T w h = k g e a r T p m s m η g e a r q ω g e a r = k g e a r ω w h ,   where   q = { 1 P p m s m ( t ) < 0 1 P p m s m ( t ) 0
where T w h is the resulting torque applied to the wheels, η g e a r is the gearbox efficiency, and ω w h is the angular speed of the wheel. Gearboxes are described by mono-domain conversion elements.
The torque and angular speed in the transmission are converted to longitudinal force and car velocity through the wheels as follows (mono-physical conversion element in EMR).
{ T w h = F p m s m w h R w h v w h = ω w h R w h
where F p m s m w h is the force applied to the wheel coming from the PMSM, R w h is the radius of the wheel, and v w h is the velocity of the wheel.
Furthermore, the force applied to each rear wheel (subscripts 1 and 2) is the result of the sum of the forces coming from the PMSM and the FBS (coupling element). On the other hand, the front wheels (subscripts 3 and 4) do not have an electric machine. So, they only have frictional braking forces associated. These forces applied by the FBS are assumed to be equal to their references (source element in EMR).
F b r w h   = F b r w h r e f
F w h 1 , 2 = F p m s m w h + F b r w h  
F w h 3 , 4 = F b r w h  
where F b r w h is the frictional braking force applied to the wheel and F w h is the total force applied to the wheel.
After the forces applied in each wheel are determined, the total force applied to the car and the velocity achieved by each wheel can be calculated as a function of the radius of the curvature. The radius of the curvature depends on the steering angle and should be included to guarantee stability during a curve [35]. This is represented as a coupling element in EMR.
F t o t = ( F w h 1 + F w h 3 ) ( R c u r v e l 2 R c u r v e ) + ( F w h 2 + F w h 4 ) ( R c u r v e + l 2 R c u r v e )
{ v w h 1 = v w h 3 = v c a r ( R c u r v e l 2 R c u r v e ) v w h 2 = v w h 4 = v c a r ( R c u r v e + l 2 R c u r v e )
where F t o t is the total force applied to the wheels of the car (wheels 1 and 3 are in the left, and 2 and 4 are the right), R c u r v e is the radius of the curvature, v c a r is the velocity of the car, and l is the width of the car.
Then, the total force applied to the wheels interacts with the forces imposed by the environment, F e n v . The last is defined by the road conditions (slope, road, and tires material), car aerodynamics and velocity, see Equation (14). In this case, the slope is neglected. This interaction defines the evolution of the velocity of the car (accumulation element in EMR).
F t o t F e n v = M d v c a r d t
F e n v = 1 2 ρ C x A v c a r 2 + M g C r r
where F e n v is the environment force, M is the mass of the car, ρ is the air density, C x is the drag coefficient, A is the frontal area of the car, g is the gravity, and C r r is the rolling resistance coefficient.
After having the mathematical equations, the EMR rules are used to build the graphical representation starting from the battery pack to the environment forces [26]. Figure 3 presents the complete EMR of the race car. It should be mentioned that the inertias of the transmission shafts are neglected compared to the mass of the car.

3. Inversion-Based Control of the Studied Car

The EMR formalism is used to define the tuning path (Figure 4) to control the car operation. The controlled variable is the car velocity v c a r . Following the causality principle, the force applied to each wheel should be controlled during traction and braking to control v c a r . The traction mode is controlled using only the rear wheels, while the braking mode is controlled using all the wheels. Therefore, the tuning variables are the torque references for each machine T p m s m r e f . Furthermore, the references for the frictional braking forces in each wheel F b r w h r e f are also tuning variables during braking.
For the inversion-based control, the starting point is the controlled variable. From here, the model is followed backwards inverting each block found in the tuning path until each tuning variable is defined [26]. Therefore, the chassis is the first element to invert.
The chassis is inverted through a closed-loop controller described in Equation (15). An IP controller can be used. F e n v is assumed to be measurable and is used as a feedforward signal.
F t o t   r e f = C v c a r ( v c a r r e f v c a r m e a s ) + F e n v m e a s
where F t o t   r e f is the reference of the total force applied to the car, C v c a r is the velocity controller, v c a r m e a s is the measured velocity of the car, v c a r r e f is the reference velocity, and F e n v m e a s is the measured resistive force estimated using Equation (14).
Then, F t o t   r e f is distributed into the reference forces of each wheel. First, the distribution between rear and front wheels is defined by k α , which is zero during traction and determined by the braking strategy during braking. Furthermore, the operation of the differential defines the forces applied to the left and right wheels during straight line motion. This is described by the differential coefficient k d , which is usually defined as 0.5 for most of the traction applications [35]. If the car is moving in a curved line, the electrical differential acts on the force distribution depending on the radius curvature to guarantee stability. This is represented by a coupling inversion in EMR.
{ F w h 1 r e f = F t o t r e f ( R c u r v e l 2 R c u r v e ) ( 1 k α ) k d F w h 2 r e f = F t o t r e f ( R c u r v e + l 2 R c u r v e ) ( 1 k α ) ( 1 k d ) F w h 3 r e f = F t o t r e f ( R c u r v e l 2 R c u r v e ) k α k d F w h 4 r e f = F t o t r e f ( R c u r v e + l 2 R c u r v e ) k α ( 1 k d ) k α = { k α ,     braking 0 ,       traction k d = 0.5
where F w h r e f is the reference for the force applied to each wheel.
The contribution of the FBS and the PMSM to the braking force applied in the rear wheels is defined by k b r (coupling inversion in EMR). k b r value will be defined in Section 4.2.
{ F b r w h r e f = k b r F w h r e f F p m s m w h r e f = ( 1 k b r ) F w h r e f ,   where   0 < k b r < 1
where F b r w h r e f is the reference for the frictional braking forces applied by the FBS, and F p m s m w h r e f is the reference for the electrical braking forces applied by the PMSM.
The wheels’ inversion is simply an equation that calculates the reference torque in the rear wheels using the radius of the wheels. This is done only for rear wheels. The gearbox Equation (6) is then inverted using k g e a r . Both are represented by mono-physical conversion inversion in EMR.
T w h r e f = R w h F p m s m w h r e f
T p m s m r e f = T w h r e f k g e a r  
where T w h r e f is the reference of the torque applied to each rear wheel, T p m s m r e f is the reference of the torque produced by each PMSM.
Figure 5 presents the EMR of the maximal control structure for the race car. Moreover, the strategy block defines the distribution inputs ( k α , k d , and k b r ) as explained in the next section.

4. Braking Strategy

In the control strategy, the distribution inputs have to be defined in order to define the energy distribution between the wheels for both modes, tractions and braking. k α distributes the forces between the front and the rear part, k d distributes the forces between the left and right wheels (differential), and k b r distributes the forces between the electric and mechanical brakes of the rear wheels.

4.1. Distribution of Braking Forces Between Front and Rear Wheels

The braking strategy must guarantee that the car stops as quickly as the driver requests while the stability of the car is ensured. To guarantee this, the reference of the total braking force should be well distributed into the rear and front wheels. This distribution is defined by the variable k α (see Equation (20)), which can be fixed or variable, depending on the braking strategy [36].
{ F f r o n t = F t o t r e f k α   F r e a r = F t o t r e f ( 1 k α )
where F f r o n t and F r e a r are the braking forces applied to the front and rear wheels, respectively.
Regardless of the objective of the braking strategy, k α value must ensure the stability of the car during braking, i.e., wheels locking should be avoided. If the rear wheels are locked, the car will easily enter in oversteering condition, leading to instability of the car. On the other hand, if the front wheels are locked, the car will enter in understeering and its maneuverability is reduced [6]. The ideal braking distribution curve delimits a safe braking distribution ratio for any road condition. Its derivation is summarized below. For more detailed information refer to [6].
In general, the maximal braking force is defined by the tires to road adhesive coefficient and the normal force, which is usually determined by the weight of the car, see (21). Moreover, the weight distribution in each axle changes during acceleration and braking due to load transfer. The weight distributed in each axle can be estimated as a function of the deceleration j ( j = d v c a r / d t ), using the equilibrium of moments in the front and rear wheels, as shown in Equation (22).
F b r m a x = μ W = μ M g
{ W f r o n t = M g L ( L b + H g j g )   W r e a r = M g L ( L a H g j g )
where F b r m a x is the maximal braking force, μ is the adhesive coefficient, W f r o n t and W r e a r are the weights in front and rear axles respectively, L is the wheel base, L a and L b are the distances to the center of gravity (COG) from the front and rear axles respectively, H g is the COG height, and j is the deceleration.
Now, the ratio of the front and rear wheels braking forces can be derived from Equation (20). Similarly, the same ratio can be obtained from the weight distribution defined in Equation (22) and the relation described in Equation (21).
F f r o n t F r e a r = k α ( 1 k α )
F f r o n t F r e a r = W f r o n t W r e a r = ( L b + H g j g ) ( L a H g j g )
Then, solving Equations (23) and (24) for k α , the braking force distribution ratio can be determined for any deceleration value. Some examples are presented in Figure 6 (solid color lines).
k α = L b + H g j g L
Next, it is important to define the maximal deceleration value j m a x in terms of the road adhesive coefficient. This can be done using the second Newton’s law, as shown in Equation (26).
{ | d v c a r d t | m a x = | j m a x | μ = F b r m a x M = g μ F b r m a x = F f r o n t m a x + F r e a r m a x
where F f r o n t m a x and F r e a r m a x are the maximal forces that can be applied to the front and rear wheels before locking.
Then, from Equation (26), the normalized maximal braking force in the rear can be defined in terms of the adhesive coefficient μ and the normalized maximal braking forces in the front. The dotted lines in Figure 6 describe this distribution of braking forces considering maximal braking forces for different adhesive coefficients.
F r e a r m a x M g = μ F f r o n t m a x M g
In Figure 6, the intersection of the color lines (black dots) defines the distribution ratio where the maximal deceleration is achieved for different adhesive coefficient. If the black dots are joined, the ideal braking distribution curve is drawn. The shadowed area represents the braking distribution ratios where the front wheels will lock first. The area above the ideal braking distribution curve describes the distribution ratios where the rear wheels will lock first.
Although the ideal braking distribution curve can be used as safe distribution criteria, it could place much lower braking force in the rear wheels than its maximal value when a good tire to road adhesion is achieved. Considering a racing context, a constant adhesive coefficient can be assumed as 0.9 (peak value for dry asphalt [6]). Furthermore, the normal force has an aerodynamic contribution known as aerodynamic downforce, which is defined in Equation (28) and can be assumed to be equally distributed in the rear and front axles. These conditions increase the maximal braking force that can be applied in a race car. Bearing this in mind, the braking strategy proposed aims to recover as much energy as possible by placing as much braking force in the rear wheels.
D F = 1 2 C z A v c a r 2    
{ F r e a r m a x = μ ( W r e a r + D F r e a r ) F f r o n t m a x = μ ( W f r o n t + D F f r o n t )
where D F r e a r and D F f r o n t are the downforce located in the rear and front axle, and C z is the downforce coefficient.
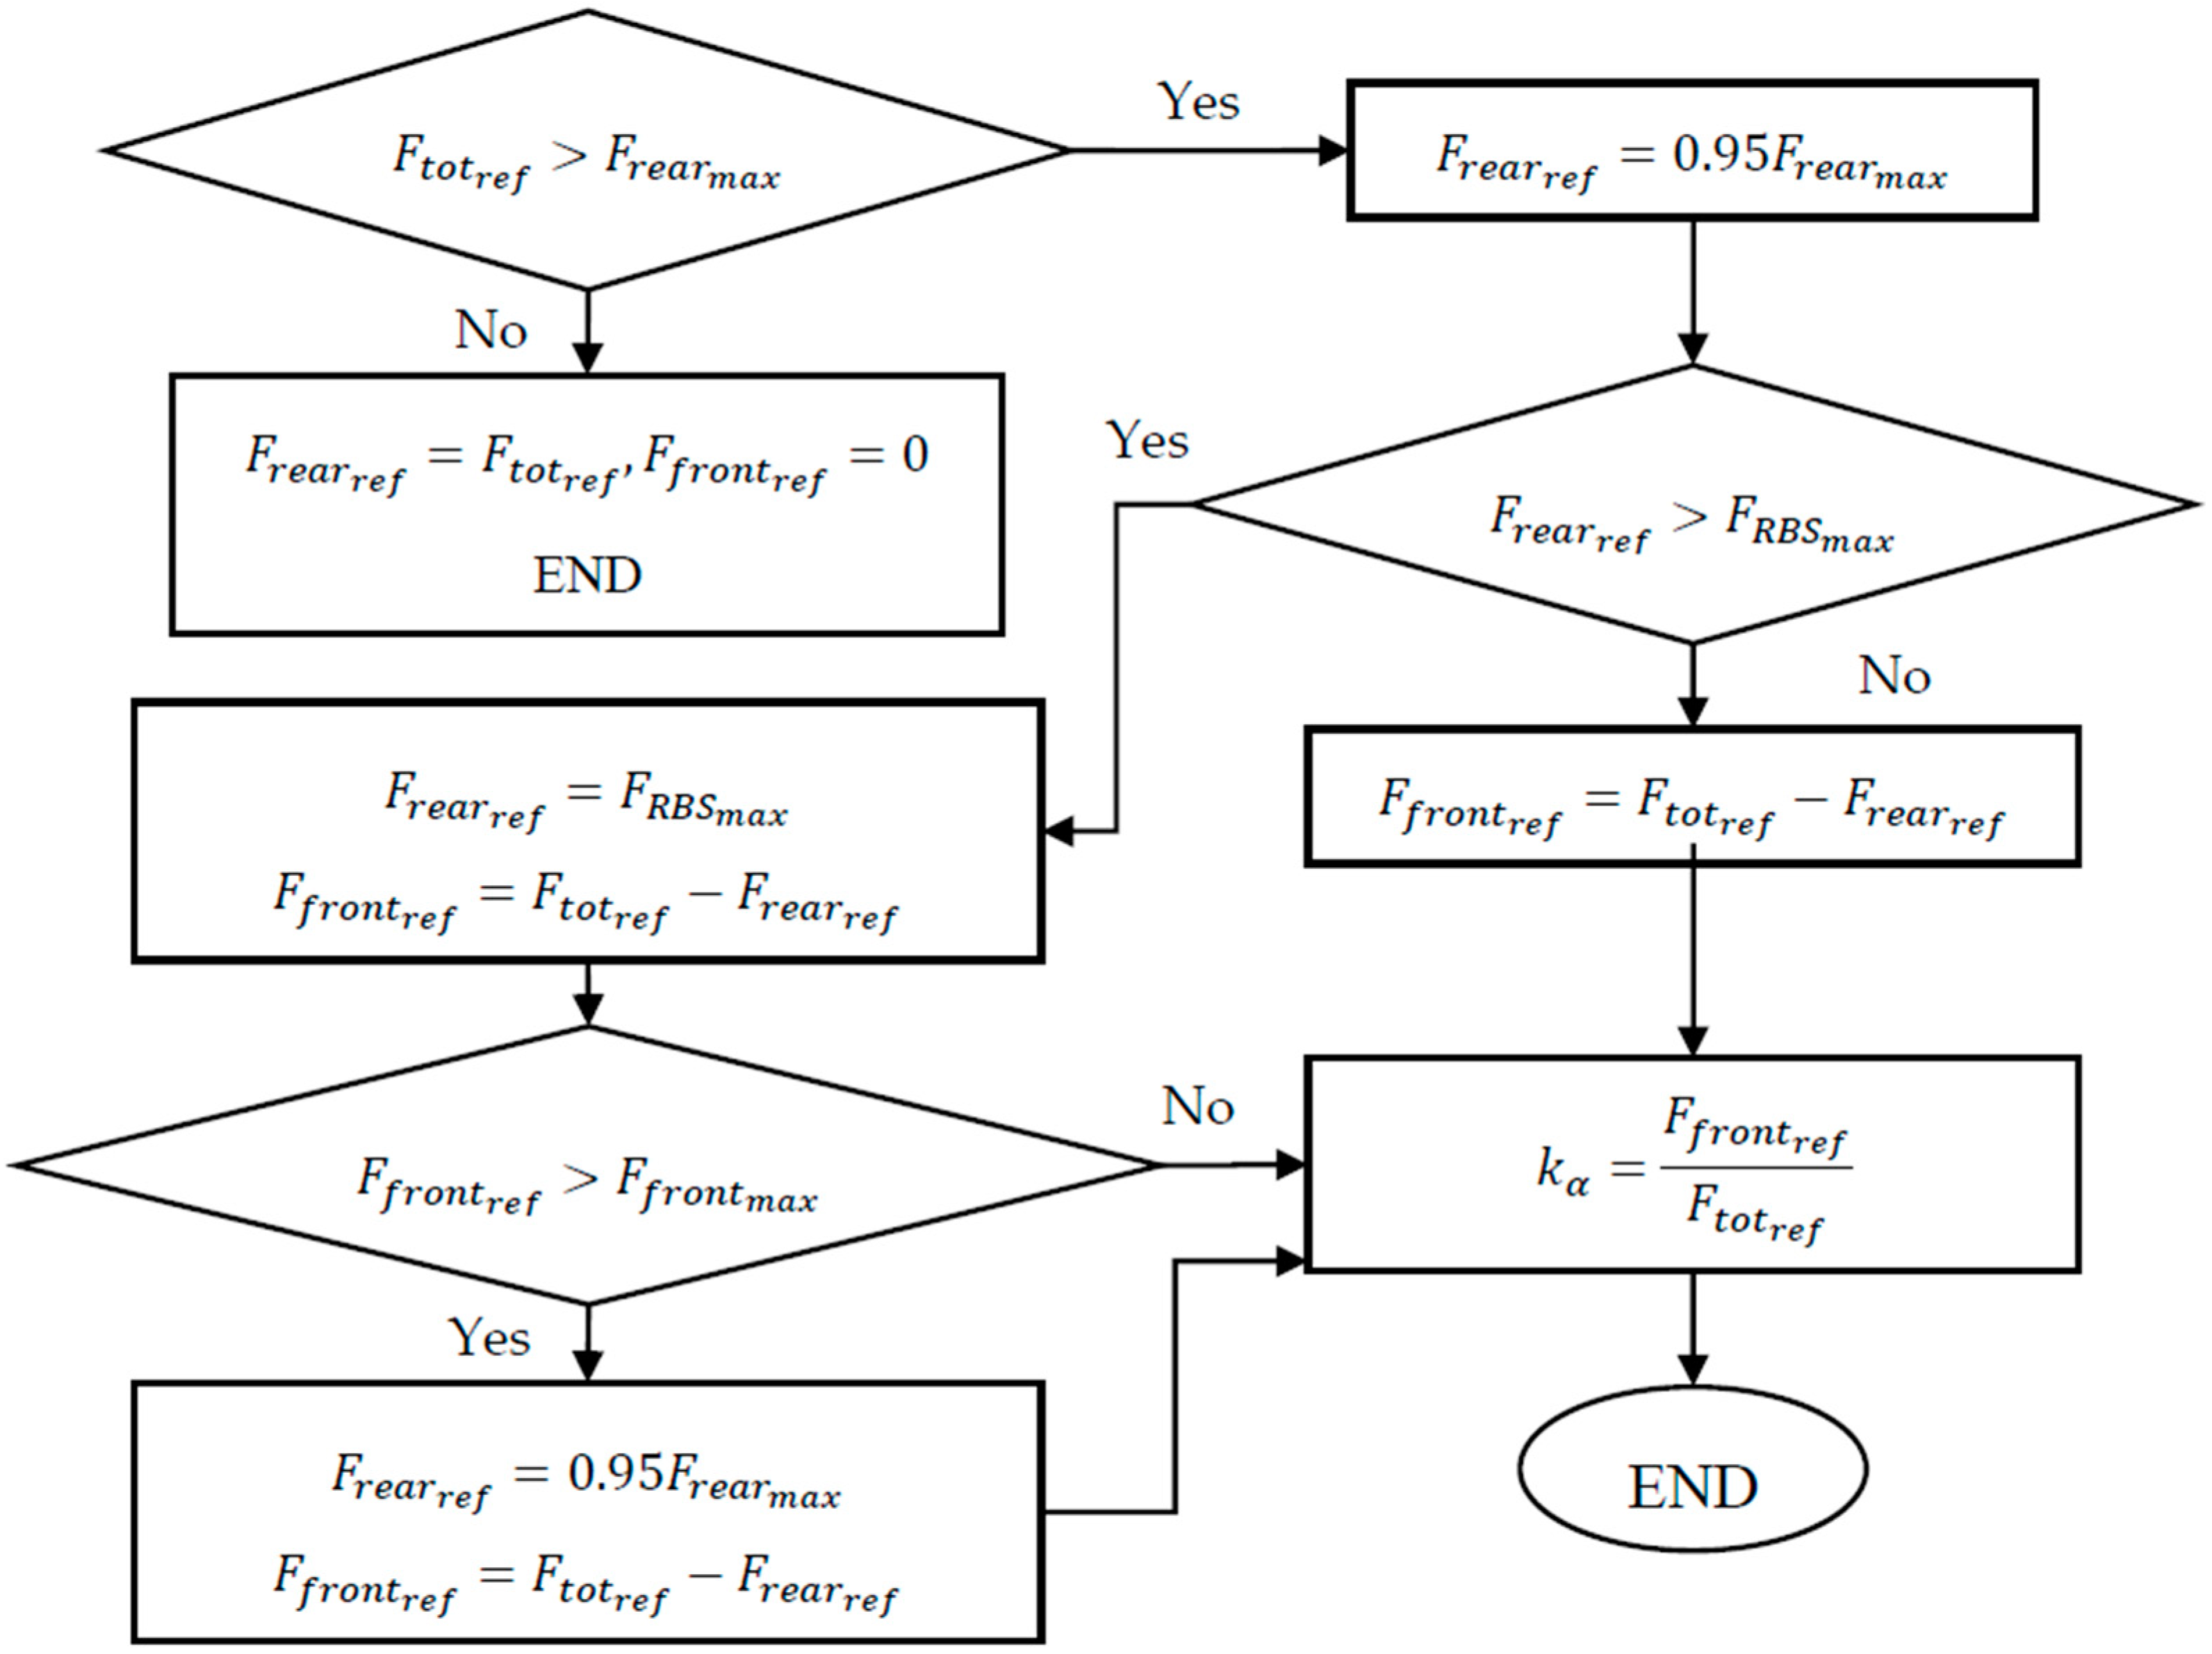
The strategy described in Figure 7 establishes the distribution coefficient k α and the references for the rear and front braking forces. First, the strategy considers if F t o t r e f can be supplied by the rear wheels. Then, if the total force must be distributed, the reference for the rear wheels ( F r e a r r e f ) is 95% of its maximal value to avoid locking the wheels ( F r e a r m a x ). After this, F r e a r r e f is compared to the maximal braking force that could be produced by the RBS ( F R B S m a x ). If F r e a r r e f can be produced by the RBS, the strategy can decide the distribution of braking forces; if not, F r e a r r e f is F R B S m a x , and the remaining braking force has to be provided by the front wheels ( F f r o n t r e f ). Finally, if this F f r o n t r e f is lower than F f r o n t m a x , the strategy can decide the distribution of braking forces. Otherwise, if F f r o n t r e f is greater or equal to F f r o n t m a x , the distribution of braking forces will be defined by the maximal forces in the front and rear wheels.

4.2. RBS and FBS Contribution in the Rear Wheels

The strategy must consider the maximal regenerative braking force ( F R B S m a x ), which is calculated based on the SoC and charging capabilities of the battery, and the torque limitations of the PMSM. This is used to decide the amount of braking force produced by the RBS and the FBS in the rear wheels, expressed by k b r . k b r is calculated based on the flowchart presented in Figure 8. The maximal braking force that can be produced by the PMSM is limited by the maximal torque that the PMSM can produce ( F p m s m m a x ( ω m e a s ) ), and the maximal charging current that the battery can receive. F p m s m m a x ( ω m e a s ) is estimated based on the torque vs speed characteristic of the PMSM [33]. On the other hand, F b a t m a x ( ω m e a s ) is estimated based on the maximal charging current of the battery, as shown in Equation (30).
F b a t m a x ( ω g e a r ,   i b a t m a x ) = v b a t i b a t m a x ω g e a r k g e a r η g e a r R w h
Once F R B S m a x is estimated, K b r is selected and used in Equation (17) to define the contribution of the RBS and the FBS to the braking force.

5. Results

The results of the model simulation are presented. First, the car model is implemented in Matlab-Simulink. Furthermore, different braking strategies are studied and compared.

5.1. Studied Race Car and Driving Cycle

The study case of this work is a race car designed and built by a team of students at Coimbra Polytechnic - ISEC, Portugal. The aerodynamic parameters are presented in Table 1. Furthermore, the powertrain and battery parameters are presented in Table 2 and Table 3.
The software Optimum Lap is used to obtain the velocity profile that the car can follow in a real competition [27,28,30,37]. In this case, a car is created based on the parameters of ISEC’s car. Furthermore, the racetrack selected is a real circuit used in SAE competition 2012, which was available in the software database. The driving cycle and the racetrack map taken from Optimum Lap are presented in Figure 9.

5.2. Simulation Using the Proposed Braking Strategy

In Figure 10a, the velocity of the car’s response is presented. The car can follow the overall behavior of the driving cycle. Figure 10b shows the velocity of the rear wheels (left and right), with differences when there is a curve. A zoom in the driving cycle is done for clarity.
The forces applied to the rear wheels are presented in Figure 11a. The left and right forces are equal when the car is moving in a straight line. Moreover, during curves, these forces applied are different, showing the operation of the differential. Figure 11b shows the distribution of the braking forces in the front and rear wheels. The braking force in the rear wheels has a low variability in most braking events, showing that the strategy always tries to get the most of the rear braking forces. On the other hand, the variability of the forces of the front wheel is higher. The contribution of the front wheels is greater during hard braking but can be very low in light braking events.
Figure 12 shows the estimation of the maximal braking force that avoids locking in each axle and compares it with the braking force applied in the rear and front wheels. This demonstrates that the braking force distribution of the proposed strategy guarantees that the rear and front wheels are not locked during braking, ensuring the stability of the car in the whole racetrack while following the velocity profile.
As it was mentioned in Section 4.2, the braking strategy defines the contribution of the RBS based on the SoC, charging capabilities of the battery bank and the braking torque limitation of the PMSM. In this case, the RBS can handle the total rear braking force, and the FBS is used only in the front wheels. This is possible due to the considerable reduction in the normal force in the rear axle, which limits the braking force that can be applied in the rear wheels. However, since the braking force applied in the rear is lower compared to the one applied in the front, the potential for energy recovery is lower compared to cars with front wheels’ traction.
Since RBS is used, the battery of the car is charged during a braking operation. Figure 13a shows the current and SoC of the battery. The current is positive during traction and negative during braking. In the same way, the SoC decreases during traction and increases during braking. In Figure 13b, a zoom is presented to better appreciate the effect of the negative current in the SoC.

5.3. Comparison of Different Braking Strategies

The proposed strategy is compared to three different braking strategies. Two fixed braking distribution strategies are found in [36], with distribution variables k α = 0.75 and k α = 0.55 . A third variable that considers the ideal braking distribution curve summarized in Section 4.1 is used to compare the results.
Now, energy recovery and car stability are studied to highlight the importance of the braking strategy. Figure 14 shows the energy consumed by the car studied during an endurance test of the Formula SAE, which has 22 km length. The car performance is studied without RBS as a reference to compare the energy recovery potential of the different braking strategies.
Assuming constant road conditions and an adhesive coefficient of 0.9, the braking strategy proposed has the lowest energy consumption. Of the other three, the strategy that uses the ideal braking distribution curve guarantees safety for all road conditions but has the highest energy consumption. Furthermore, the strategies that use fixed braking distribution have higher energy consumption than the strategy proposed in this work. Moreover, these strategies might have stability issues. This will be shown later.
The energy recovered during the endurance test simulation is estimated using Equation (31) and presented in Table 4. The mass-saving potential is calculated as shown in Equation (32), assuming that the specific energy of LiFPO4 batteries is 100 Wh/kg [38]. The results are presented in Table 5.
E r e c = E n o R B S E s t r
M r e d = E r e c e b a t
where E r e c is the energy recovered, E n o R B S and E s t r are the energy consumed by the car with no regeneration and using each braking strategy, respectively, M r e d is the mass reduction, and e b a t is the specific energy of the battery.
A reduction of 3.37% of the car mass could be achieved. The mass reduction could be higher considering that the FBS is used only in the front wheels. Therefore, the size of the calipers and rotors of the FBS in the rear could be greatly reduced, making the car even lighter. Reduced mass of the car can improve its performance in the different Formula SAE competitions. In fact, assuming that the car mass is reduced by 12.64 kg, the car should complete each lap 0.2s earlier, and the endurance test approximately 3.8 s earlier, according to Optimum Lap results.
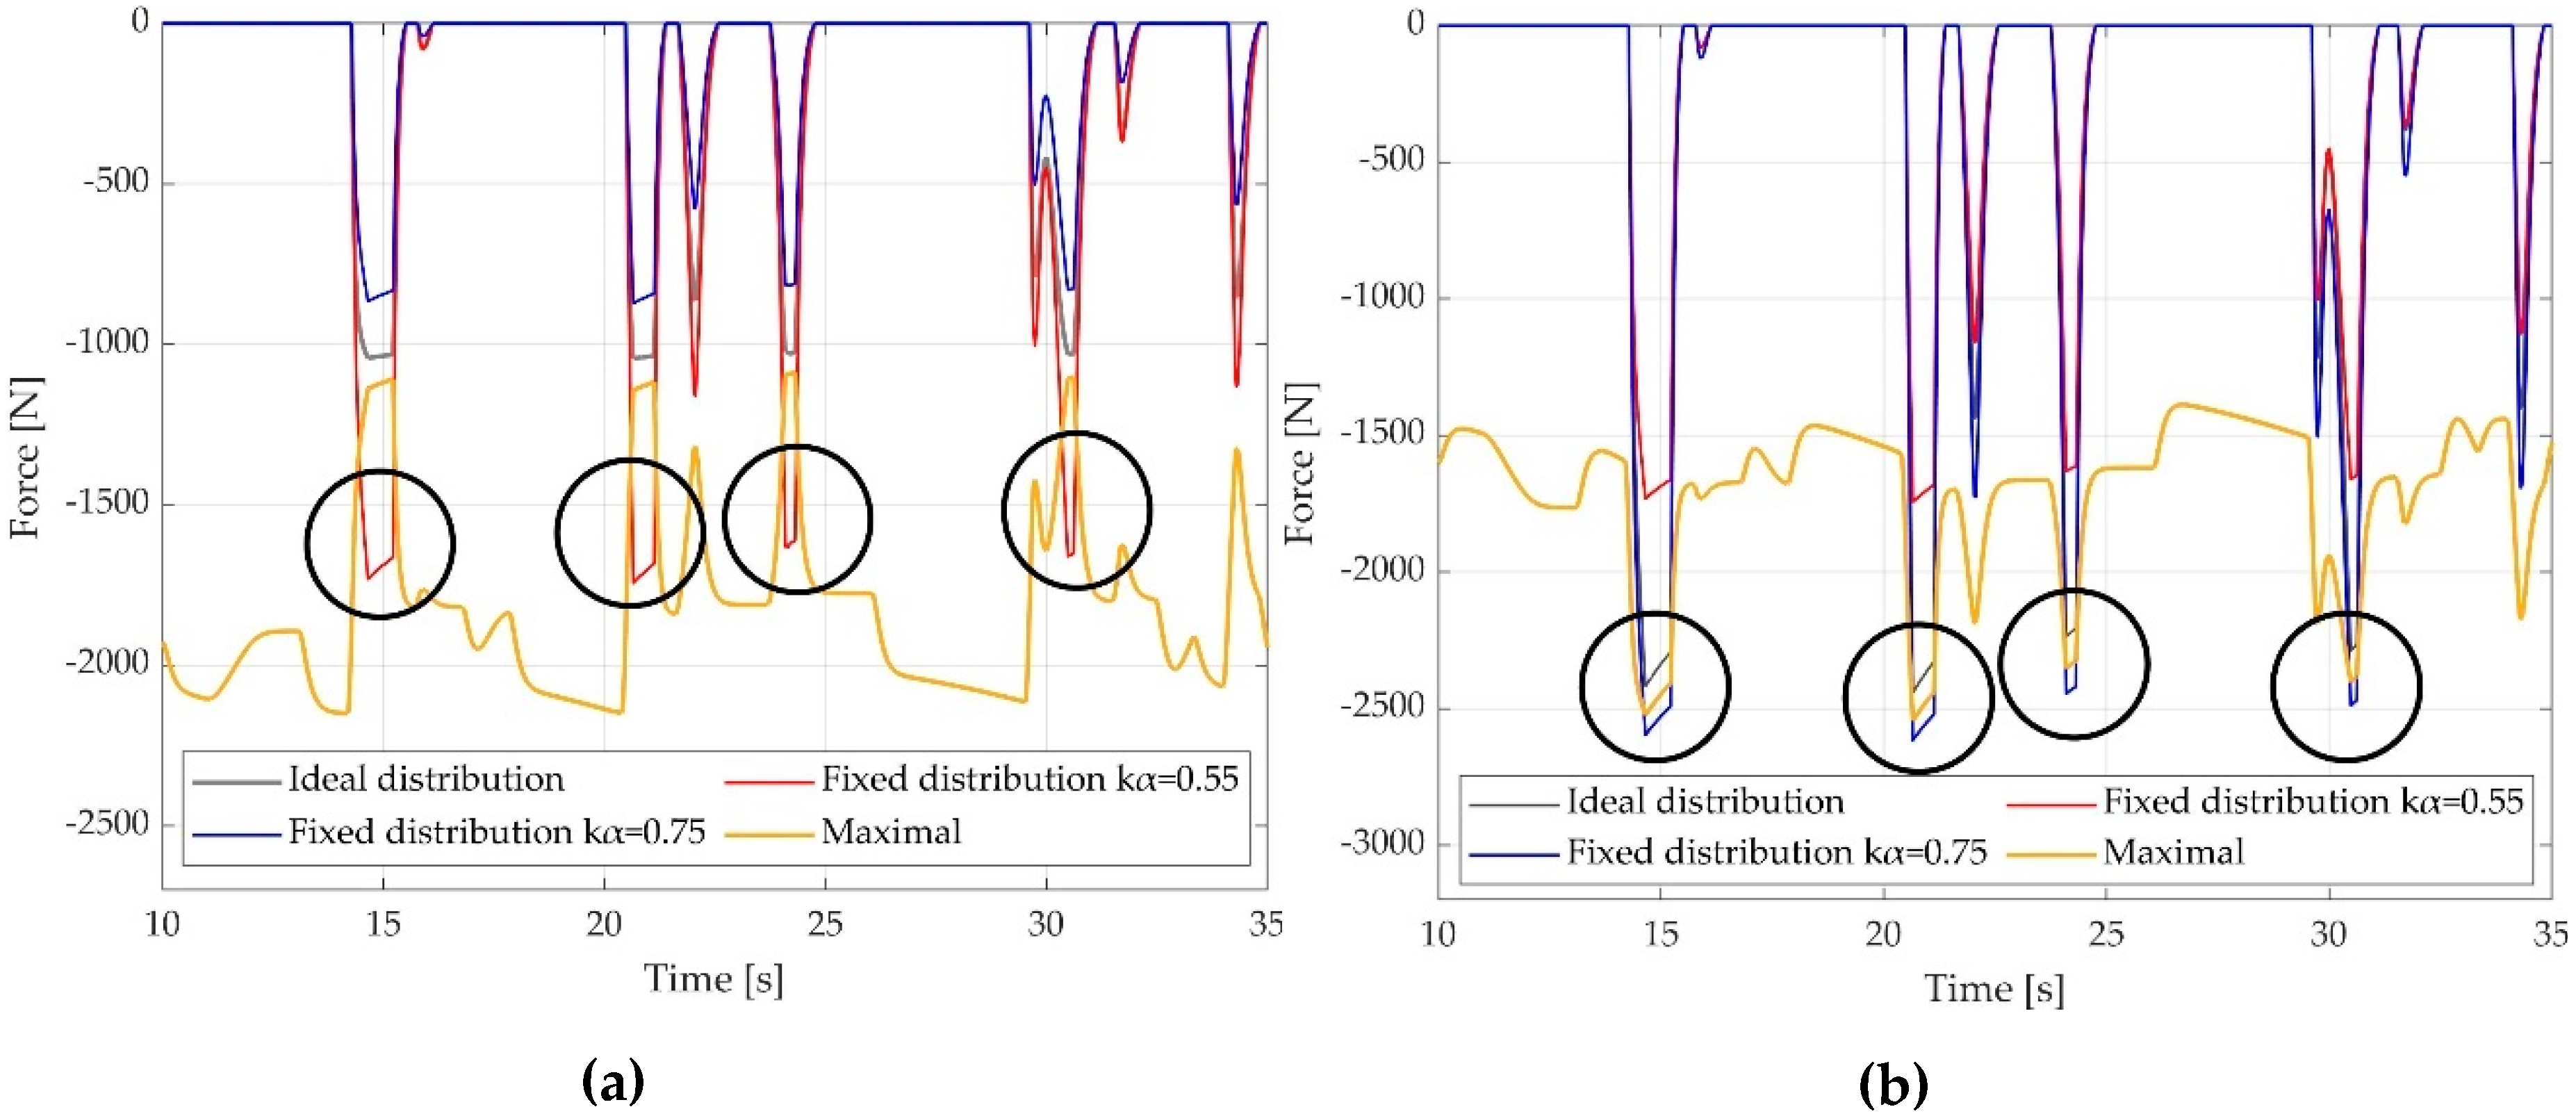
The stability of the car is now analyzed for each strategy studied. Figure 12 showed that the braking strategy proposed avoids wheels locking. The same characteristic is studied for the rest of the braking strategies. Figure 15 shows the evolution of the braking forces in the rear and front wheels. A section of the racetrack is selected to display better the possible stability issues during hard braking events. The black circumferences highlight the hard braking events where the force applied in the wheels exceeds the maximal braking force, which results in wheels locking. This happens to the strategies that use a fixed braking distribution ratio. The rear wheels are locked when the braking distribution ratio k α = 0.55 is used. For this strategy, instability issues might appear during hard braking events, and the car might be unsafe to drive. Furthermore, the potential to recover energy is reduced to zero when the rear wheels are locked, and the speed of the PMSM is zero. On the other hand, the front wheels are locked when k α = 0.75 is used. For this strategy, the maneuverability of the car is reduced during hard braking, but the stability of the car can be ensured. Furthermore, this strategy has the lowest energy recovery potential since it always locates lower braking force in the rear wheels. In both cases, the velocity of the car might not be reduced as it is expected since the longitudinal grip is highly reduced after locking the wheels. However, this is not studied here. Moreover, the strategy where the ideal braking distribution curve is followed ensures that the wheels are not locked, but the energy recovered is lower compared to the proposed strategy.

6. Conclusions

ISEC’s race car designed to participate in the Formula SAE competition has been modeled and organized using the EMR formalism. The main objective of the model is to analyze braking strategies for a Formula SAE race car. Also, the electric differential operation is considered. The braking strategy operation has been investigated focusing on the braking force distribution between front and rear wheels. The key points of the braking strategy are the energy recovery and stability issues that could appear. Four approaches defining the braking distribution factor have been studied. The strategy proposed has a rear-biased braking force distribution defined by the maximal braking forces, which are proportional to the adhesive coefficient and normal forces. Other strategies used to analyze the results consider the ideal braking distribution curve and fixed braking distribution between the front and rear wheels. The results obtained showed that the energy recovered using the proposed strategy is higher when is compared to the other strategies. On the other hand, the proposed strategy and the one that considers the ideal braking distribution curve guarantee stability during driving. Moreover, the strategies that considered a fixed braking distribution ratio showed that instability issues might appear. Furthermore, the potential for energy recovery during braking will be reduced if rear wheels are locked.
Energy recovery during braking has been presented for the braking strategies studied and the impact of this feature in race cars was highlighted. A good braking strategy will allow for a better tradeoff between car stability and efficiency. Regenerative braking allows for the use of less energy, which could help to increase the car’s autonomy. Additionally, RBS usage enables a mass reduction of the car, which is an important parameter in competitions such as Formula SAE.

Author Contributions

Conceptualization, A.C.H.-M., P.P. and A.B.; methodology, A.C.H.-M., P.P. and A.B.; software, A.C.H.-M., and A.B.; validation, A.C.H.-M., P.P. and A.B.; formal analysis, A.C.H.-M. and A.B.; investigation, A.C.H.-M.; resources, P.P. and A.B.; data curation, A.C.H.-M.; writing—original draft preparation, A.C.H.-M.; writing—review and editing, P.P. and A.B.; visualization, A.C.H.-M., P.P. and A.B.; supervision, P.P. and A.B.; project administration, P.P. and A.B.; funding acquisition, P.P. All authors have read and agreed to the published version of the manuscript.

Funding

This research was funded by Erasmus Mundus scholarship for the program Sustainable Transportation and Electrical Power Systems (STEPS). The APC was funded by FCT – Portuguese Foundation for Science and Technology under INESC Coimbra (DEEC Coimbra, Portugal) project UIDB/00308/2020 and by the European Regional Development Fund through the COMPETE 2020 Program and FCT – Portuguese Foundation for Science and Technology within project ESGRIDS (POCI-01-0145-FEDER-016434).

Acknowledgments

This research is the continuation of the master thesis of A.C.H.-M. (STEPS Erasmus Mundus Joint Master Degree). The master thesis was developed in the Polytechnic of Coimbra and a short stay in University of Lille where the EMR summer school 2019 took part. This research was partially supported by project UIDB/Multi/00308/2020 and project ESGRIDS (POCI-01-0145-FEDER-016434).

Conflicts of Interest

The authors declare no conflict of interest. The funders had no role in the design of the study; in the collection, analyses, or interpretation of data; in the writing of the manuscript, or in the decision to publish the results.

References

  1. European Commission. A European Strategy for Low-Emission Mobility; European Commission: Brussels, Belgium, 2016. [Google Scholar]
  2. Niestadt, M.; Bjørnåvold, A. Electric Road Vehicles in the European Union—Trends, Impacts and Policies; European Parliamentary Research Service (EPRS): Brussels, Belgium, 2019. [Google Scholar]
  3. IEA. Tracking Transport; IEA: Paris, France, 2019. [Google Scholar]
  4. IEA. Global EV Outlook 2018. Towards Cross-modal Electrification; IEA Publications: Paris, France, 2018. [Google Scholar]
  5. Guo, J. Development of regenerative braking for electric vehicles in China: A review. Int. J. Electr. Hybrid Veh. 2015, 7, 120–138. [Google Scholar] [CrossRef]
  6. Ehsani, M.; Gao, Y.; Longo, S.; Ebrahimi, K.M. Modern Electric, Hybrid Electric, and Fuel Cell Vehicles, 3rd ed.; Taylor & Francis Group: Abingdon, UK, 2018; pp. 38–50, 377–394. [Google Scholar]
  7. Benson, K.W.; Fraser, D.A.; Hatridge, S.L.; Monaco, C.A.; Ring, R.J.; Sullivan, C.R.; Taber, P.C. The Hybridization of a Formula Race Car. In Proceedings of the IEEE Vehicle Power and Propulsion Conference, Chicago, IL, USA, 7 September 2005. [Google Scholar]
  8. Ruan, J.; Walker, P.D.; Watterson, P.A.; Zhang, N. The dynamic performance and economic benefit of a blended braking system in a multi-speed battery electric vehicle. Appl. Energy 2016, 183, 1240–1258. [Google Scholar] [CrossRef]
  9. Xiao, B.; Lu, H.; Wang, H.; Ruan, J.; Zhang, N. Enhanced Regenerative Braking Strategies for Electric Vehicles: Dynamic Performance and Potential Analysis. Energies 2017, 10, 1875. [Google Scholar] [CrossRef] [Green Version]
  10. Itani, K.; Bernardinis, A.D.; Khatir, Z.; Jammal, A. Comparison between two braking control methods integrating energy recovery for a two-wheel front driven electric vehicle. Energy Convers. Manag. 2016, 122, 330–343. [Google Scholar] [CrossRef]
  11. Xu, W.; Chen, H.; Zhao, H.; Ren, B. Torque optimization control for electric vehicles with four in-wheel motors equipped with regenerative braking system. Mechatronics 2019, 57, 95–108. [Google Scholar] [CrossRef]
  12. Wu, J.; Wang, X.; Li, L.; Qin, C.; Du, Y. Hierarchical control strategy with battery aging consideration for hybrid electric vehicle regenerative braking control. Energy 2018, 145, 301–312. [Google Scholar] [CrossRef]
  13. Qiu, C.; Wang, G. New evaluation methodology of regenerative braking contribution to energy efficiency improvement of electric vehicles. Energy Convers. Manag. 2016, 119, 389–398. [Google Scholar] [CrossRef]
  14. Qiu, C.; Wang, G.; Meng, M.; Shen, Y. A novel control strategy of regenerative braking system for electric vehicles under safety critical driving situations. Energy 2018, 149, 329–340. [Google Scholar] [CrossRef]
  15. Chen, J.; Yu, J.; Zhang, K.; Ma, Y. Control of regenerative braking systems for four-wheel-independently-actuated electric vehicles. Mechatronics 2018, 50, 394–401. [Google Scholar] [CrossRef]
  16. Kumar, C.N.; Subramanian, S.C. Cooperative control of regenerative braking and friction braking for a hybrid electric vehicle. Proc. Inst. Mech. Eng. Part D J. Automob. Eng. 2016, 230, 103–116. [Google Scholar] [CrossRef]
  17. Sangtarash, F.; Esfahanian, V.; Nehzati, H.; Haddadi, S.; Bavanpour, M.A.; Haghpanah, B. Effect of Different Regenerative Braking Strategies on Braking Performance and Fuel Economy in a Hybrid Electric Bus Employing CRUISE Vehicle Simulation. SAE Int. J. Fuels Lubr. 2009, 1, 828–837. [Google Scholar] [CrossRef]
  18. Le Solliec, G.; Chasse, A.; Geamanu, M. Regenerative braking optimization and wheel slip control for a vehicle with in-wheel motors. In Proceedings of the 7th IFAC Symposium on Advances in Automotive Control, Tokyo, Japan, 4–7 September 2013. [Google Scholar]
  19. Mathijsen, D. Formula student electric: Checking out the future of automotive engineering. Reinf. Plast. 2016, 60, 167. [Google Scholar] [CrossRef]
  20. SAE International. About Formula SAE®® Series. Available online: https://www.sae.org/attend/student-events/formula-sae-electric/about (accessed on 30 August 2019).
  21. Hall, T.J. An Analysis of Braking Behavior in Formula-E Racing; SAE International: Warrendale, PA, USA, 2017. [Google Scholar]
  22. Antunes, J.; Antunes, A.; Outeiro, P.; Cardeira, C.; Oliveira, P. Testing of a torque vectoring controller for a Formula Student prototype. Robot. Auton. Syst. 2019, 113, 56–62. [Google Scholar] [CrossRef]
  23. Saurabh, Y.S.; Kumar, S.; Jain, K.K.; Behera, S.K.; Gandhi, D.; Raghavendra, S.; Kalita, K. Design of Suspension System for Formula Student Race Car. In Proceedings of the International Conference on Vibration Problems, ICOVP, Guwahati, India, 14–17 December 2015. [Google Scholar]
  24. Chepkasov, S.; Markin, G.; Akulova, A. Suspension Kinematics Study of the “Formula SAE” Sports Car. In Proceedings of the International Conference on Industrial Engineering, ICIE, Yekaterinburg, Russia, 19–20 May 2016. [Google Scholar]
  25. Boretti, A. Kinetic Energy Recovery Systems for Racing Cars; SAE International: Warrendale, PA, USA, 2013. [Google Scholar]
  26. Bouscayrol, A.; Hautier, J.-P.; Lemaire-Semail, B. Graphic Formalisms for the Control of Multi-Physical Energetic Systems: COG and EMR. In Systemic Design Methodologies for Electrical Energy Systems; ISTE Willey Editions: London, UK, 2012. [Google Scholar]
  27. Transi, T.; Pereirinha, P.G.; Bouscayrol, A.; Degano, M. Study of Regenerative Braking Effects in a Small Electric Race Car using Energetic Macroscopic Representation. In Proceedings of the International Young Engineers Forum (YEF-ECE), Costa da Caparica, Portugal, 10 May 2019. [Google Scholar]
  28. Transi, T.; Pereirinha, P.G.; Bouscayrol, A.; Degano, M.; Henao-Muñoz, A.C. Hardware-In-the-Loop Emulation of a Small Electric Race Car Using Energetic Macroscopic Representation. In Proceedings of the IEEE Vehicle Power and Propulsion Conference (VPPC), Hanoi, Vietnam, 14–17 October 2019. [Google Scholar]
  29. Montesinos-Miracle, D.; Fontan-Tebar, C.; Vidal-Salvia, H. Simulation of an Electric Racing Car Using Energetic Macroscopic Representation. In Proceedings of the IEEE Vehicle Power and Propulsion Conference (VPPC), Coimbra, Portugal, 27–30 October 2014. [Google Scholar]
  30. LeBel, F.-A.; Messier, P.; Pelletier, L.; Trovao, J.P. Benefits of Regenerative Braking for an Electric Superbike using Energetic Macroscopic Representation. In Proceedings of the IEEE Vehicle Power and Propulsion Conference (VPPC), Belfort, France, 11–14 December 2017. [Google Scholar]
  31. Guo, J.; Wang, J.; Cao, B. Study on Braking Force Distribution of Electric Vehicles. In Proceedings of the Asia-Pacific Power and Energy Engineering Conference, Wuhan, China, 28–31 March 2009. [Google Scholar]
  32. Sparacino, A.R.; Reed, G.F.; Kerestes, R.J.; Grainger, B.M.; Smith, Z.T. Survey of Battery Energy Storage Systems and Modeling Techniques. In Proceedings of the 2012 IEEE Power and Energy Society General Meeting, San Diego, CA, USA, 22–26 July 2012. [Google Scholar]
  33. Mayet, C.; Horrein, L.; Bouscayrol, A.; Delarue, P.; Verhille, J.-N.; Chattot, E.; Lemaire-Semail, B. Comparison of Different Models and Simulation Approaches for the Energetic Study of a Subway. IEEE Trans. Veh. Technol. 2014, 63, 556–565. [Google Scholar] [CrossRef]
  34. Anatole, D.; Alain, B.; Rochdi, T.; Elodie, C.; John, K. Impact of the Velocity Profile on Energy Consumption of Electric Vehicles. IEEE Trans. Veh. Technol. 2019, 68, 11420–11426. [Google Scholar]
  35. Chen, K.; Bouscayrol, A.; Lhomme, W. Energetic Macroscopic Representation and Inversion-based Control: Application to an Electric Vehicle with an Electrical Differential. J. Asian Electr. Veh. 2008, 6, 1097–1102. [Google Scholar] [CrossRef]
  36. Xu, J.; Zhang, X. Optimization Algorithm for Vehicle Braking Force Distribution of Front and Rear Axles Based on Brake Strength. In Proceedings of the World Congress on Intelligent Control and Automation (WCICA), Guilin, China, 12–15 June 2016. [Google Scholar]
  37. OptimumG Vehicle Dynamics Solutions, “OptimumLap”. 2019. Available online: http://www.optimumg.com/software/optimumlap/ (accessed on 26 July 2019).
  38. Sergi, F.; Arista, A.; Agnello, G.; Ferraro, M.; Andaloro, L.; Antonucci, V. Characterization and comparison between lithium iron p hosphate and lithium-polymers batteries. J. Energy Storage 2016, 8, 235–243. [Google Scholar] [CrossRef]
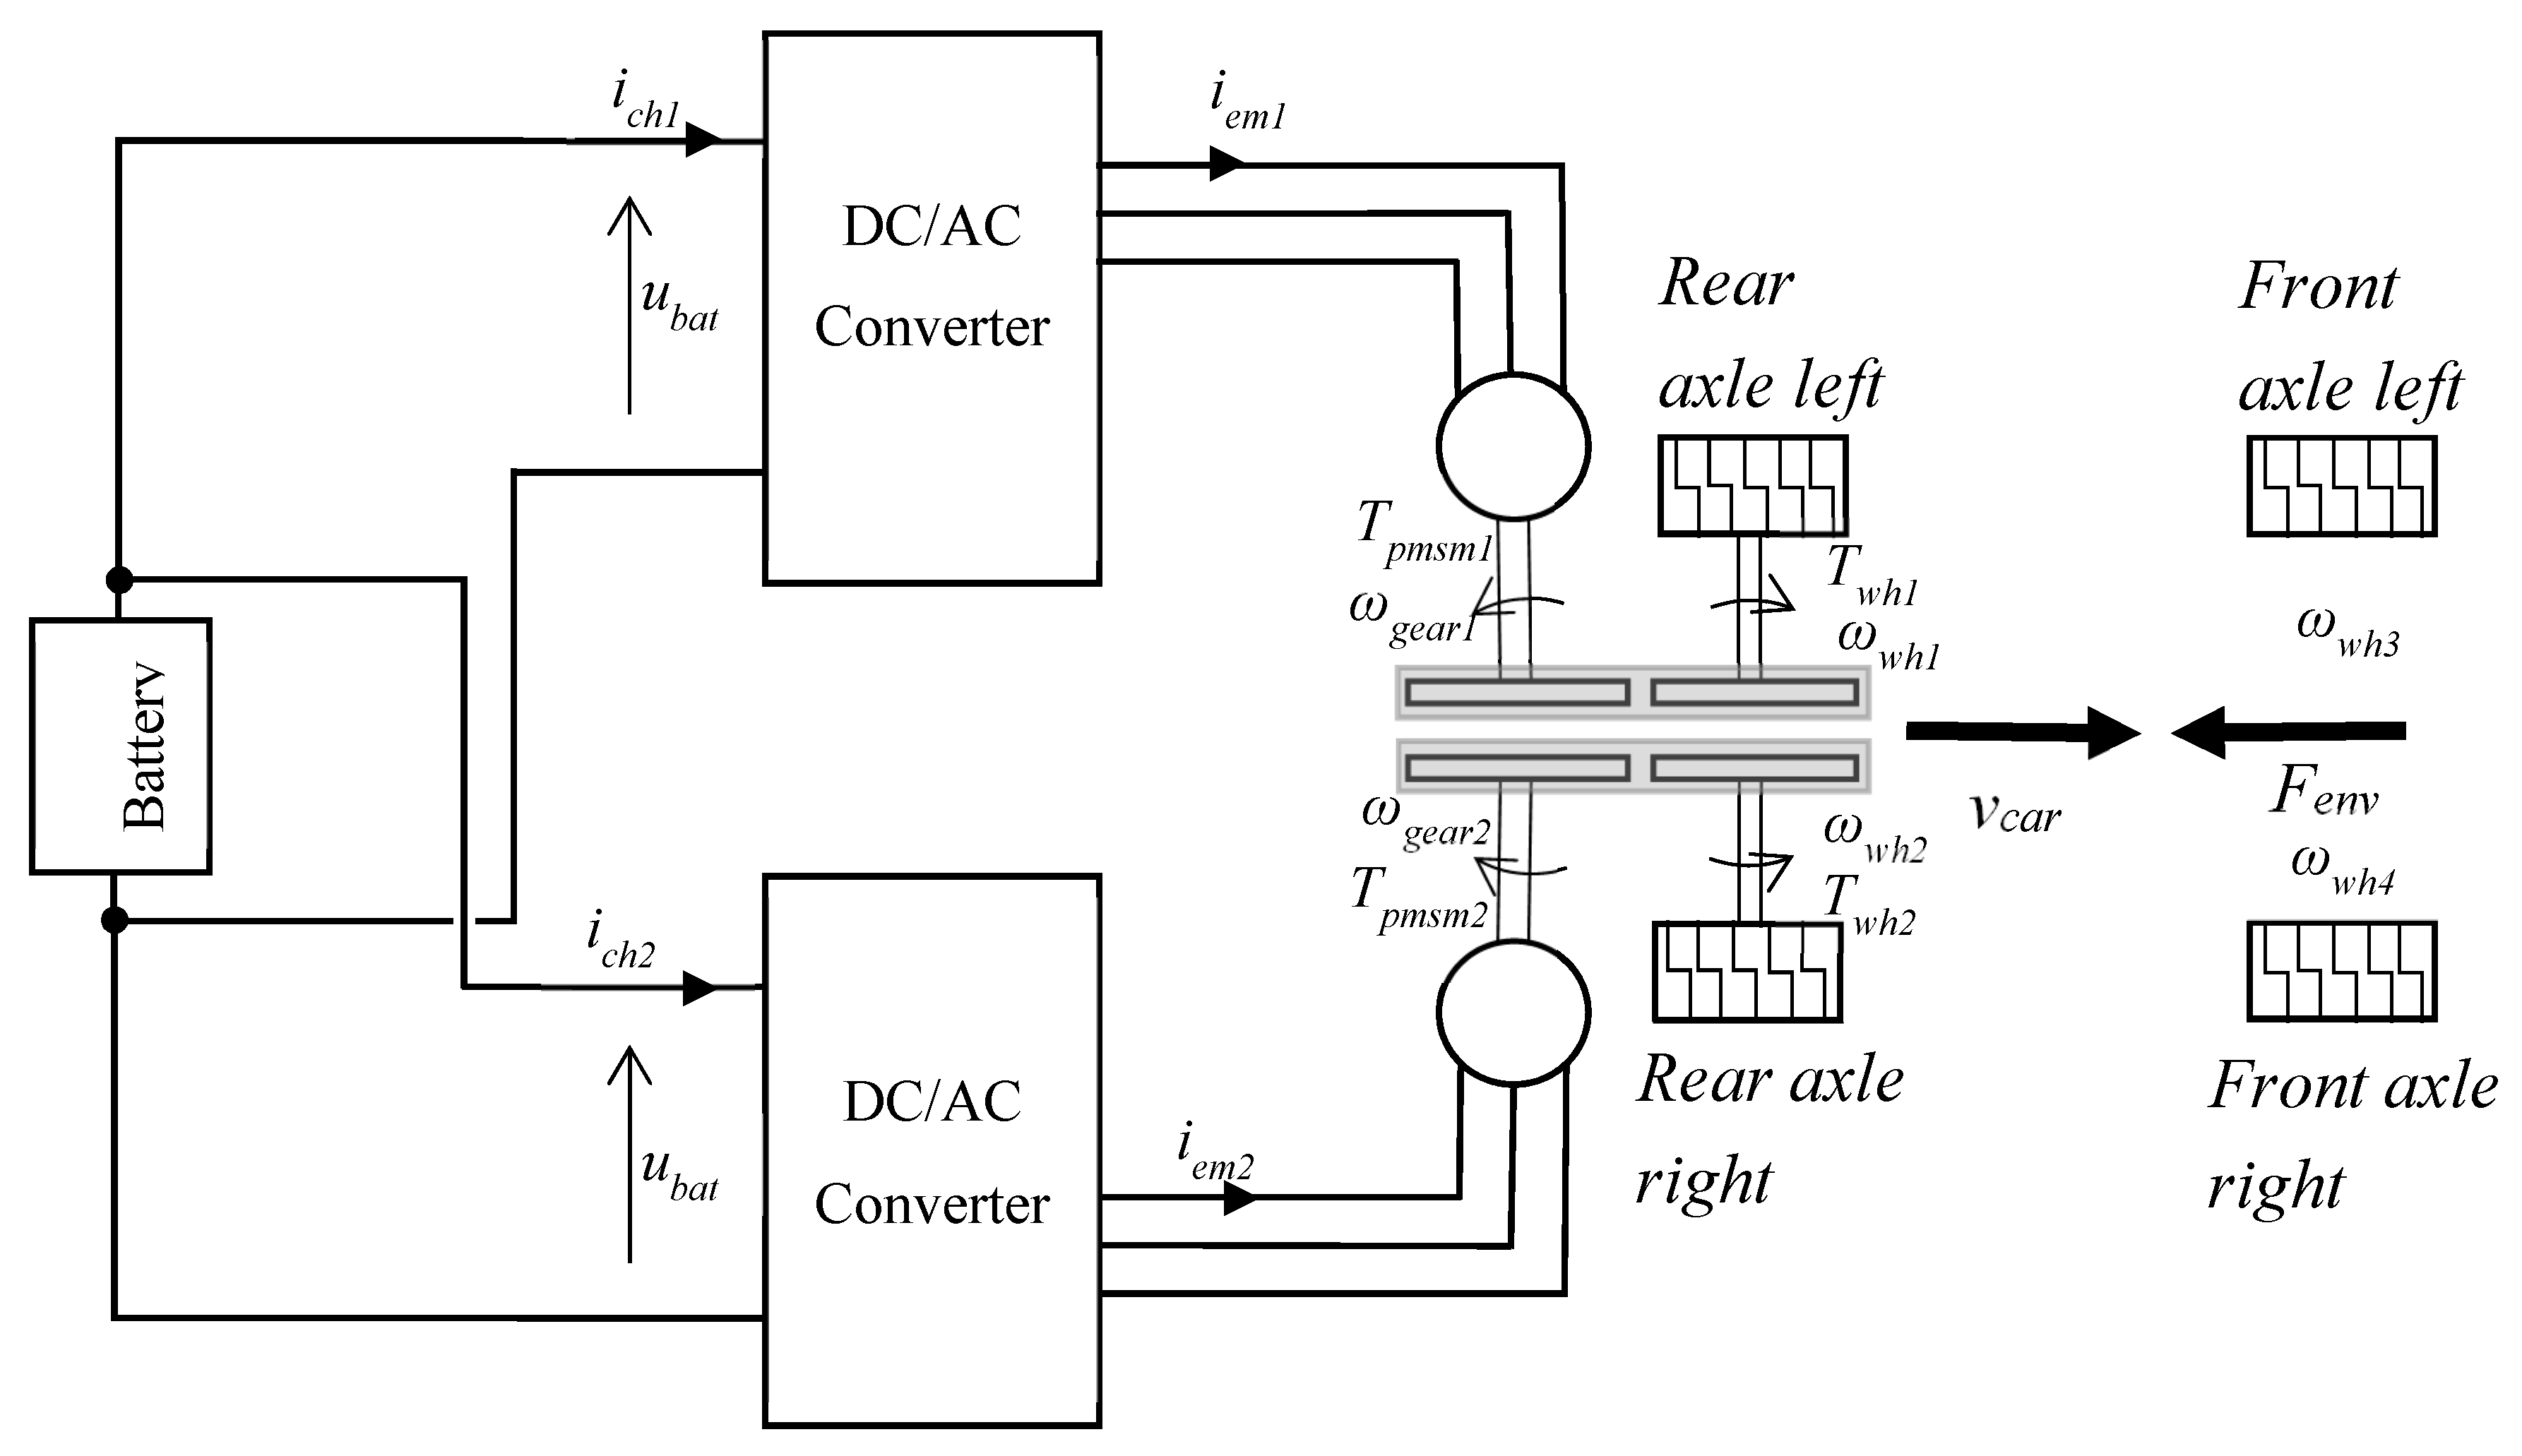
Figure 1. Structural representation of the race car.
Wevj 11 00045 g001
Figure 2. EMR elements. (a) Source element; (b) Conversion element; (c) Accumulation element; (d) Coupling element.
Wevj 11 00045 g002
Figure 3. Complete EMR representation of studied car.
Wevj 11 00045 g003
Figure 4. Tuning path of the studied car.
Wevj 11 00045 g004
Figure 5. Maximum control structure for studied car model.
Wevj 11 00045 g005
Figure 6. Ideal braking distribution curve.
Wevj 11 00045 g006
Figure 7. Braking strategy proposed.
Wevj 11 00045 g007
Figure 8. Decision of RBS and FBS contribution coefficient K b r .
Wevj 11 00045 g008
Figure 9. (a) velocity profile for one lap (b) racetrack map [37].
Wevj 11 00045 g009
Figure 10. (a) Car velocity output; (b) Wheels velocity (electric differential effect).
Wevj 11 00045 g010
Figure 11. Braking forces distribution (a) Electric differential effect on left and right wheels; (b) Braking strategy effect in front and rear wheels.
Wevj 11 00045 g011
Figure 12. Braking forces and maximal forces (a) rear wheels; (b) front wheels.
Wevj 11 00045 g012
Figure 13. State of charge and battery current, (a) full racetrack; (b) zoom in t = 14–17 s.
Wevj 11 00045 g013
Figure 14. Energy consumption comparison.
Wevj 11 00045 g014
Figure 15. Comparison of braking forces and maximal forces (a) rear wheels; (b) front wheels.
Wevj 11 00045 g015
Table 1. Aerodynamic parameters of ISEC’s race car.
ParameterValue
Mass [kg]375.00
Width [m]1.35
Drag coefficient ( C x )0.29
Downforce coefficient ( C z )1.20
Front area [m2]0.84
Wheel diameter [m]0.49
Rolling resistance coefficient ( C r r )0.03
Wheelbase [m]1.46
La [m]0.7
Lb [m]0.76
Hg [m]0.34
Table 2. Powertrain parameters of ISEC’s race car.
ParameterValue
Rated torque [Nm]47.70
Rated power [kW]17.02
Number of electric machines2
Total rated torque [Nm]94.50
Total rated power [kW]34.05
Rated angular speed (rpm)3000
Max. angular speed (rpm)6000
Gearbox ratio50/14
Traction modeRear wheel drive
Table 3. Battery pack parameters of ISEC’s race car.
ParameterValue
Rated cell voltage [V]3.20
Max. cell voltage [V]4.25
Min. cell voltage [V]2.50
Cells in series30.0
Parallel arrays1.0
Maximal charging current [A]80
Rated Capacity [Ah]90
Internal resistance [Ω]0.006
Table 4. Energy consumption results for endurance test.
TestEnergy Recovered [Wh]
No RBS0.00
Proposed strategy1264.3
Ideal braking distribution922.34
Fixed distribution k α = 0.55 1129.6
Fixed distribution k α = 0.75 647.19
Table 5. Mass saving results.
TestMass Reduction [kg]Percentage of the Total Mass
No RBS00
Proposed strategy12.643.37
Ideal braking distribution9.222.46
Fixed distribution k α = 0.55 11.293.01
Fixed distribution k α = 0.75 6.471.72