Abstract
The aging of lithium-ion batteries (LIBs) is a crucial issue and must be investigated. The aging rate of LIBs depends not only on the material and electrochemical performance but also on the working conditions. In order to assess the impact of vehicle driving conditions, including the driving cycle, ambient temperature, charging mode, and trip distance on the battery life cycle, this paper first establishes an electric vehicle (EV) energy flow model to solve the operating parameters of the battery pack while working. Then, a powertrain test is carried out to verify the simulation model. Based on the simulated data under different conditions, the battery capacity fade process is estimated by using a semi-empirical aging model. The mileage (Ф) traveled by the vehicle before the end of life (EOL) of the battery pack is then calculated and taken as the evaluation index. The results indicate that the Ф is higher when the vehicle drives the Japanese chassis dynamometer test cycle JC08 than in the New European Driving Cycle (NEDC) and the Federal Test Procedure (FTP-75). The Ф will be dramatically reduced at both low and high ambient temperatures. Fast charging can increase the Ф at low ambient temperatures, whereas long trip driving can always increase Ф to varying degrees.
1. Introduction
As an energy storage system, power batteries play a vital role in the electrification of automobiles [1]. However, current mainstream lithium-ion batteries (LIBs) have a significant aging [2] problem characterized by capacity fade and resistance increase [3] compared to the traditional fuel-powered system. This leads to a series of problems when applying LIBs in electric vehicles (EVs) or hybrid electric vehicles (HEVs). First, the capacity fade during the aging process decreases the range of EVs and exacerbates the so-called range anxiety problem caused by the low energy density of LIBs [4]. Second, the increase in internal resistance causes a decrease in the output power [3], an increase in heat generation [5], or even internal short circuiting of the battery cell [6], which affects the dynamic performance and the safety of the vehicle. Third, the price of LIBs is high [7], and replacing the batteries will greatly increase the life cycle cost of EVs/HEVs. In addition, the recycling of LIBs has no ideal solution yet [8], and premature failure will lead to a large number of used LIBs that cannot be properly handled. The above problems greatly limit the promotion of EVs/HEVs. Usually, the lifecycle of a vehicle is 10–15 years [9], and extending the life of the LIBs to match the life of the vehicle is an urgent problem to be solved.
There are many ways to extend the life of LIBs. The most basic way is to design the battery itself to be reliable, such as improving the positive and negative electrode materials [10,11] and electrolytes [12] of the battery. On the other hand, the operating parameters, including the current, temperature, state of charge (SOC), and depth of discharge (DOD), when LIBs are being used also have a significant impact on their aging rates [13,14]. Therefore, it can be an effective way to extend the battery life cycle by keeping the battery operating parameters related to aging mechanisms under appropriate ranges when the battery is working. Usually, the battery’s charge and discharge current and DOD are limited by the battery management system (BMS) [15], and the battery temperature is controlled by the battery thermal management system (BTMS) [16]. Even so, different working conditions will still lead to different life cycles of the battery pack. During utilization, battery working conditions directly depend on the driving conditions of the vehicle.
Jeremy of the National Renewable Energy Laboratory (NREL) broadly studied the impacts of range anxiety and home, workplace, and public charging infrastructure, driver aggression, climate, cabin thermal management, and battery thermal management on EV battery lifetimes [17,18]. The impacts of vehicle-grid and grid-vehicle strategies [19,20], dynamic driving loads and regenerative braking [21], and battery thermal management strategies [22] were also investigated. This paper is aimed at studying the impacts of vehicle driving conditions of driving cycle, ambient environment, charging rate, and trip distance on the life cycle of the LIB pack, thereby providing guidance for the state of health (SOH) estimation of the LIBs as well as battery health-conscious energy management and thermal management for EV/HEV.
By taking a medium-sized electric sedan as the research object, this paper first establishes the energy flow model of the whole vehicle. The model takes driving cycles as the input and can solve the operating parameters, such as voltage, current, temperature, and SOC of the battery pack during driving. An EV powertrain test bench is built to test the abovementioned parameters of the battery pack in different working conditions, which is used to verify the accuracy of the simulation model. Based on the model, the changes in the key parameters, such as temperature and current of the battery pack under different ambient temperatures, driving cycles, charging rates, and trip distances, are calculated. On this basis, the capacity fade process of the battery pack under different working conditions can be predicted by using a semi-empirical battery life cycle model.
2. Electric Vehicle (EV) Energy Flow Model and Battery Aging Model
2.1. EV Energy Flow Model
The main purpose of this paper is to evaluate the life of battery packs under different working conditions. Since parameters such as temperature and current related to battery aging depend on the structure and performance parameters of the vehicle, it is necessary to first establish an energy flow model for the electric vehicle. The model established in this paper is based on a medium-sized electric sedan, the main parameters of which are shown in Table 1. In this paper, we used AMEsim as the simulation platform.
Table 1.
Main parameters of the selected electric vehicle (EV).
The EV energy flow model includes three modules: a vehicle control module, a powertrain module, and a cooling system module, as shown in Figure 1.
Figure 1.
EV energy flow model.
The vehicle control module includes the driver model, vehicle controller, and vehicle dynamic model. The vehicle dynamic model solves the demanded driving force under a given velocity and acceleration profile of the vehicle according to the vehicle parameters, such as weight, frontal area, aerodynamic drag, rolling resistance, wheel radius, etc. The driver model is developed based on a proportion integration differentiation (PID) controller to simulate the operations of the driver and output the accelerating, braking, and gear shifting signals, which are further translated into motor and braking system control signals by the vehicle controller.
As the key component of the model, the powertrain module consists of a battery pack, a motor, an inverter, and a transmission box. The motor and the two-speed transmission are mechanically linked, and the mechanical work is transferred to the wheels by the shaft. A 132 Ah capacity LIB pack with Nickel cobalt manganese (NCM) cathode chemistries is adopted to power the motor. In this study, the equivalent circuit model of the battery pack was developed to calculate the states of the battery, including the voltage and SOC. The heat generation rate of the battery pack was calculated by the well-known Bernadi equation [23]. The main input parameters of the powertrain module are shown in Table 2, Table 3 and Table 4.
Table 2.
The main parameters of the battery pack. State of charge (SOC).
Table 3.
Main parameters of the motor.
Table 4.
The main parameters of the inverter.
The liquid cooling system consisting of radiators, fans, pumps, temperature sensors, and expansion water tanks is adopted to cool the battery, motor, and inverter of the vehicle. The battery is cooled by a separate cooling circuit, the coolant is antifreeze, and it is re-cooled by the refrigerant in the air conditioning system. The motor and inverter use the same cooling circuit, and the coolant first cools the inverter and then cools the motor. Since the heat generation and heat dissipation processes within the powertrain are rather complicated, the cooling system module is modeled by taking the following simplifications:
- The lumped parameter method is used to model the battery pack, motor, and inverter;
- We neglect the heat dissipation in the cooling circuit (e.g., the heat dissipation on the surface of the pipe).
In the model, the temperatures of the battery pack, motor, and inverter are detected during the simulation, and the cooling system will be turned on or off according to the rule-based BTMS control strategy of the vehicle. The BTMS control strategy is presented in Table 5.
Table 5.
The battery thermal management system (BTMS) control strategy of the vehicle.
2.2. Battery Capacity Fade Model
The aging of battery pack is mainly reflected by capacity fade and internal resistance increase and is caused by a series of side reactions [2], such as the forming and growing of a solid electrolyte interface (SEI), lithium plating, etc. The rates of theses side reactions are greatly influenced by the operation conditions of the battery, such as the temperature and charge/discharge current, and are time-varying when the battery EV runs on the road. There are various aging estimation models for LIBs, such as physics-based (electrochemical) models [9,24], semi-empirical models [13,25], and equivalent circuit based models (mainly for online estimation) [26].
In this study, we assume that the battery operation parameters, like temperature and current, are maintained in a very short period of time, so that the battery aging rate in this time step is approximately a constant. Then the aging process is divided into numerous such steady-state processes (time steps). Based on this, linear fatigue damage accumulation theory is introduced, and we consider each time step as the damaging cycle defined in linear cumulative damage theory (though there is no alternating stress but instead side reactions at constant rates) and the accumulated degradation is the summation of the degradation of each time step [22,27,28]. This method helps to assess the aging of the battery operating at varying conditions by semi-empirical models, which is obtained by fitting the aging data of specific cycling conditions and takes advantage of fast simulation. However, this method may cause some errors in the assessment.
As a 20% reduction in capacity is usually regarded as the criterion for failure, this paper only evaluated the fading capacity of the battery pack. The research object was equipped with a NCM cathode LIB, so we used the semi-empirical life cycle model reported in the literature as follows [25]:
where Qloss is the percentage of capacity loss; T is the battery temperature; Crate is the battery charge and discharge rates, which is the measurement of the charge and discharge currents with respect to its nominal capacity; a, b, c, d, and e are constants, the values of which are shown in Table 6; and Ahthroughput is the amount of electricity output by the battery during the cycle. We assume that the aging rule of the charging process and the discharging process are both subject to formula (1), then the total charge and discharge of the battery is Ah = 2·Ahthroughput [22].
Table 6.
Main parameters of the motor.
Based on the above method, the amount of capacity degradation caused by cycle aging from time τ to τ + Δτ can be calculated by the following formulas:
In this study, the battery temperature and current profiles when the vehicle drives in a specific condition (including the charging process) are calculated by the EV energy flow model and then used as the input parameters of the abovementioned battery capacity fade model, by which the capacity loss of the battery pack after the vehicle travels a certain mileage can be solved. Then, by taking a 20% capacity loss as the end-of-life (EOL) criterion, the total mileage traveled by the vehicle before the EOL of the battery pack (denoted as Ф) can be obtained.
3. EV Powertrain Test and Model Verification
As described above, the battery current and temperature are taken as the input parameters of the battery capacity fade model. However, when the vehicle is running under a certain driving cycle, the current and temperature of the battery pack are not only determined by the characteristics of the battery pack itself, but also by the parameters of the other components or systems of the powertrain, such as the motor, inverter, BTMS, etc. In order to obtain accurate simulated current and temperature results, the EV energy flow model should be fully verified. Therefore, a test bench containing the whole powertrain of the EV, similar to the simulation model, is established. Tests are carried out to provide the experimental data to verify the simulation model. Note that replicating the aging process of the battery pack in the test bench would take a long time, so it is not conducted.
3.1. Test Bench Development
The EV powertrain test bench consists of the following four modules: a powertrain module, cooling system module, bench control module, and data acquisition system module. A graphical illustration and picture of the bench are shown in Figure 2 and Figure 3.
Figure 2.
Diagrams of the electric vehicle powertrain test bench.
Figure 3.
The electric vehicle powertrain test bench.
The powertrain module is the test object, including the battery pack, the motor, and the inverter. The cooling module is used to cool the EV powertrain, which contains two independent liquid-cooled circuits—one is used to cool the battery pack, and the other is to cool the motor and inverter—and the coolant flows through the motor and inverter in sequence. The bench control module includes the BMS, controller, host computer, and dynamometer controller to regulate the battery charge/discharge, data acquisition, and dynamometer loading. The data acquisition module is composed of temperature sensors (a thermocouple), flow sensors, a power analyzer, a dynamometer, etc., and is used for measuring key parameters of the system, such as the temperature and current of the battery pack. The dynamometer is needed to load the EV powertrain. The data acquisition scheme is shown in Figure 4. The main measured parameters, used instruments/sensors, and the experimental uncertainties are summarized in Table 7.
Figure 4.
The data acquisition scheme test bench.
Table 7.
The used testing instruments/sensors and experimental uncertainties.
3.2. Experimental Method
Before the test, the battery pack was fully charged using the on-board slow charging system of the vehicle. According to the charging protocol specified by the manufacturer, the battery was charged at a constant current of 8 A up to the upper cut-off voltage (4.15 V for the cell), followed by charging at a constant voltage until the current reduced to 2 A (constant-current constant-voltage mode (CCCV)). Assuming that the battery capacity will not decrease over several stable test cycles, the actual capacity of the battery pack was considered to be 132 Ah. Based on this, the SOC was estimated by the ampere-hour integral method.
In a vehicle, the vehicle control unit (VCU) sends control signals through the controller area network (CAN) communication bus to the BMS and the motor control unit (MCU) to control the battery pack discharge and the running of the motor, respectively. In this study, the VCU was replaced by the controller in the bench control module, in which a cRIO-9023 system and a high-speed CAN module (NI 9853) manufactured by National Instruments were used to send control signals to the BMS and MCU. In addition, a 12 V output module was used to provide the 12 V wake-up signal needed by the powertrain. The test was terminated when the SOC of the battery pack reached 0.2.
Tests were performed under an ambient temperature of 15 ± 5 °C. As the temperature greatly affects the performance of the powertrain, it is important for it to be well controlled during the test. Before the start of the test, the powertrain was pre-heated to a proper temperature using the cooling system module of the test bench. For the battery pack, the temperature of the coolant was maintained at 30 °C by the thermostatic water tank before the start of discharge process. Similarly, the temperature of the coolant in the motor and inverter cooling circuit was also heated to the required temperature (45 °C) through the thermostatic water tank. In order to achieve full thermal equilibrium between the powertrain and coolant, the pre-heating process lasted for more than 30 mins after the coolant temperature reached the required value. During the discharging process, the temperature of the coolant at the outlet of the thermostatic water tank was kept constant, and the coolant flow rates of both cooling circuits were set to 14 L/min.
Before the test, the operating conditions of the motor (including the speeds and output torques) when the vehicle was driving under constant speed conditions were estimated according to the actual vehicle speed, rolling radius, drag coefficient, transmission ratio, and other parameters. In detail, when the vehicle was driving at 65 km/h constant speed, the motor had a speed of 4000 r/min and an output torque of 50 N·m, which was made one of the test conditions. On this basis, four other conditions were determined by keeping the motor speed at 4000 r/min and changing its output torque. The test conditions are summarized in Table 8.
Table 8.
The test cases.
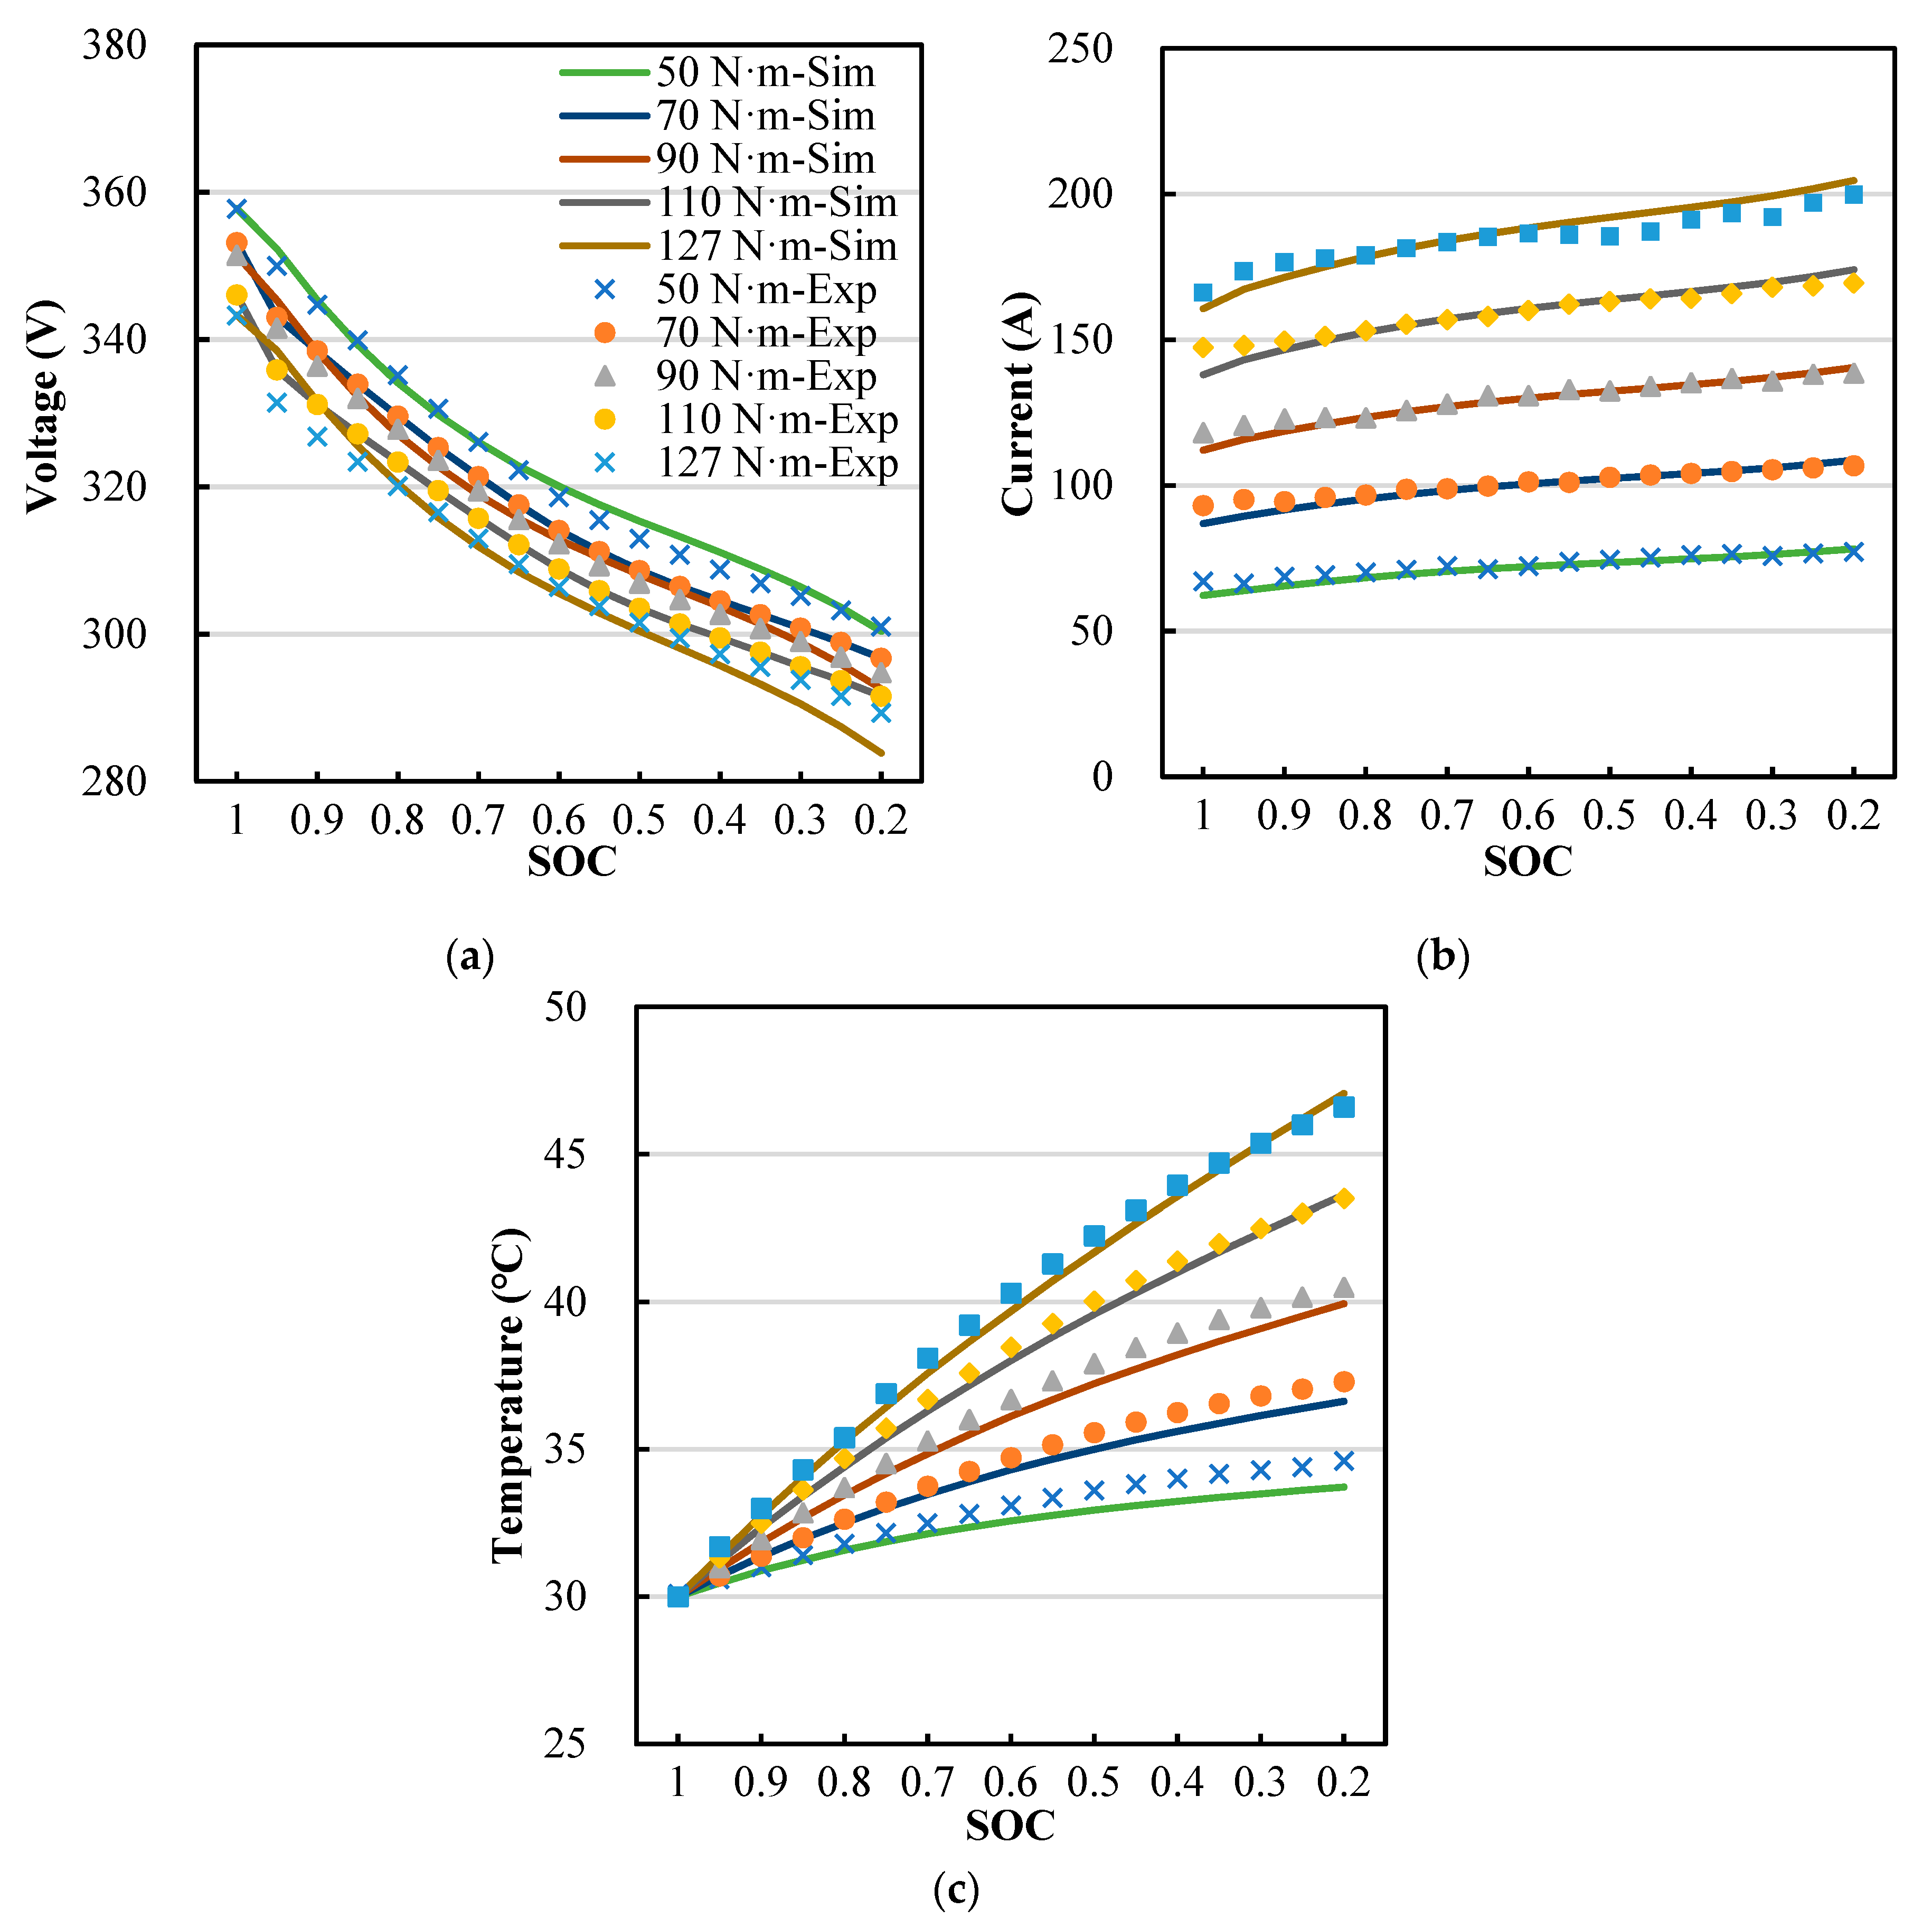
3.3. Model Verification
The initial and operating conditions in the EV energy flow model were set to be same with the test cases, and then the simulations were carried out. The simulated results, such as battery current, voltage, and temperature, were compared with the experimental data and are shown in Figure 5. During the charging process, the battery current was a constant (8 A) for most of the time (except the constant voltage period) and the temperature had little change, so the charging data are not plotted. It can be seen that the simulated results were close to the experimental results, and the deviations indicated that the simulation model was reliable and could be used for further calculation.
Figure 5.
Comparison of simulated results and test results of battery pack under different conditions: (a) current; (b) voltage; (c) temperature.
3.4. Simulation Settings
This paper mainly studies the impact of the vehicle driving conditions on battery life. The factors considered in this paper and their ranges/levels are shown in Table 9.
Table 9.
The simulation settings.
4. Results and Discussion
4.1. Effect of Driving Cycles on Battery Life Cycle
In order to study the impact of driving cycles on battery life, this paper adopted three typical driving cycles of New European Driving Cycle (NEDC), Federal Test Procedure (FTP-75) and Japanese chassis dynamometer test cycle (JC08) [29]. In the study, the ambient temperature was set to 20 °C, and the condition of daily commute to work (short trip driving) was simulated, i.e., a short trip containing a single driving cycle in the morning followed by a long period rest until the next short trip in the afternoon. When the SOC dropped to 0.2, the battery was charged at night with a slow charging strategy in CCCV mode. The changes to the current, voltage, temperature, and SOC of the battery pack during the use of the vehicle under three cycle conditions are shown in Figure 6, Figure 7 and Figure 8. It can be seen from the figure that when the vehicle started to run, the temperature of the battery pack rose from the ambient temperature. After finishing a short trip, the battery temperature decreased to the ambient temperature while the battery voltage and SOC were unchanged during the rest period. As the battery was not charged or discharged and cycle aging did not happen in the rest period, the profiles of the time-varying parameters of this period were not plotted, and those of the adjacent short trips are directly connected end-to-end in Figure 6, Figure 7 and Figure 8. When the next trip started, the temperature of the battery pack began to rise again.
Figure 6.
(a) The current and voltage and (b) temperature and SOC profiles of the battery pack under continuous NEDC cycles.
Figure 7.
(a) The current and voltage and (b) temperature and SOC profiles of the battery pack under continuous FTP-75 cycles.
Figure 8.
(a) The current and voltage and (b) temperature and SOC profiles of the battery pack under continuous JC08 cycles.
Based on the simulated results of the battery pack operating parameters shown above, the capacity fade process of the battery pack can be calculated by using the aging model of expression (1). As the capacity fade of the battery in the aging model is proportional to the battery’s total ampere-hour throughput, and a 20% capacity fade was considered as the failure criterion, the total number of the charge and discharge cycles before the EOL, N, of the battery pack can be calculated by the following expression:
where θ′ is the capacity fade of a single charge and discharge cycle. Then, the mileage traveled by the vehicle before the EOL of the battery pack (Ф) is the product of N and the mileage traveled by the vehicle in each charge and discharge cycle of the battery.
In this paper, Ф was taken as the evaluation index, and the calculation results of the NEDC, FTP-75, and JC08 cases are plotted in Figure 9. It can be clearly seen from Figure 9 that there were significant differences in Ф under different driving cycles, among which Ф in JC08 was the longest and was 18.7% higher than the lowest NEDC condition. This is because the maximum speed was lower under the JC08 cycle, which led to a lower discharge rate than that of the other two cycles. It is worth noting that the battery pack temperature did not reach 24.4 °C under all three driving cycles, at which the battery had the lowest capacity fade rate. Therefore, the higher temperatures under the NEDC and FTP-75 cycles may lead to a higher capacity fade rate. However, Ф in the JC08 cycle was actually the longest, which indicated that the higher discharge rate under the NEDC and FTP-75 cycles outweighed the impact of the temperature.
Figure 9.
Ф under different driving cycles.
4.2. Effect of Ambient Temperature on Battery Life Cycle
The ambient temperature directly affects the electrochemical performance and aging rate of the battery pack. Due to the local climate and changing seasons, EVs may run under a wide range of ambient temperatures. Therefore, this section studies the aging characteristics of the battery pack when the EV is driving at different ambient temperatures. Here, on the basis of the 20 °C condition in the previous section, the low-temperature condition of 0 °C and the high-temperature condition of 40 °C were added.
It can be seen from Figure 10 that when the ambient temperature was 20 °C, the values of Ф in NEDC, FTP-75, and JC08 were much higher than those at the ambient temperatures of 0 °C and 40 °C. The average value of Ф of three driving cycles at 20 °C was 8.6 times that at 0 °C and 2.7 times that at 40 °C, which shows that the BTMS in high and low ambient temperature environments played an important role in prolonging the battery life. From the perspective of battery aging, heating in a low-temperature environment is more important than cooling in a high-temperature environment.
Figure 10.
Ф under different ambient temperatures.
4.3. Effect of Charging Mode on Battery Life Cycle
EVs are usually charged in two ways: fast charging and slow charging. The battery current and heat generation are largely different between the two charging modes. This section studies the impact of the long-term use of two different charging modes on the battery life. The charging current in the slow charging mode was 8 A while that of the fast charging mode was based on the vehicle charging setting, in which different charging currents were used when the battery temperature was different, and the maximum Crate was 1 C.
From the simulated results in Figure 11, it is found that when the ambient temperatures were 20 °C and 40 °C, using the fast charging mode all the time will reduce Ф by 17.2–32.8%, compared to slow charging, and the reduction was the most obvious when the ambient temperature was 20 °C. However, when the ambient temperature was 0 °C, the fast charging mode will increase the battery life by 27.6–30.1%. The reason is that a low temperature will also accelerate the capacity fade of the battery. When the fast charging mode was adopted, the battery temperature quickly rose due to the large heat generation rate under the high charging rate and heating by using the PTC heater. As shown in Figure 12a, the higher average temperature and shorter charging time not only offset the negative impact of high charging rate to battery aging, but also further extended the battery life.
Figure 11.
The difference of Ф between fast charging and slow changing (Ф under slow charging is taken as the baseline).

Figure 12.
The battery temperature during fast charging and slow charging at different ambient temperatures: (a) Tamb = 0 °C; (b) Tamb = 20 °C; (c) Tamb = 40 °C.
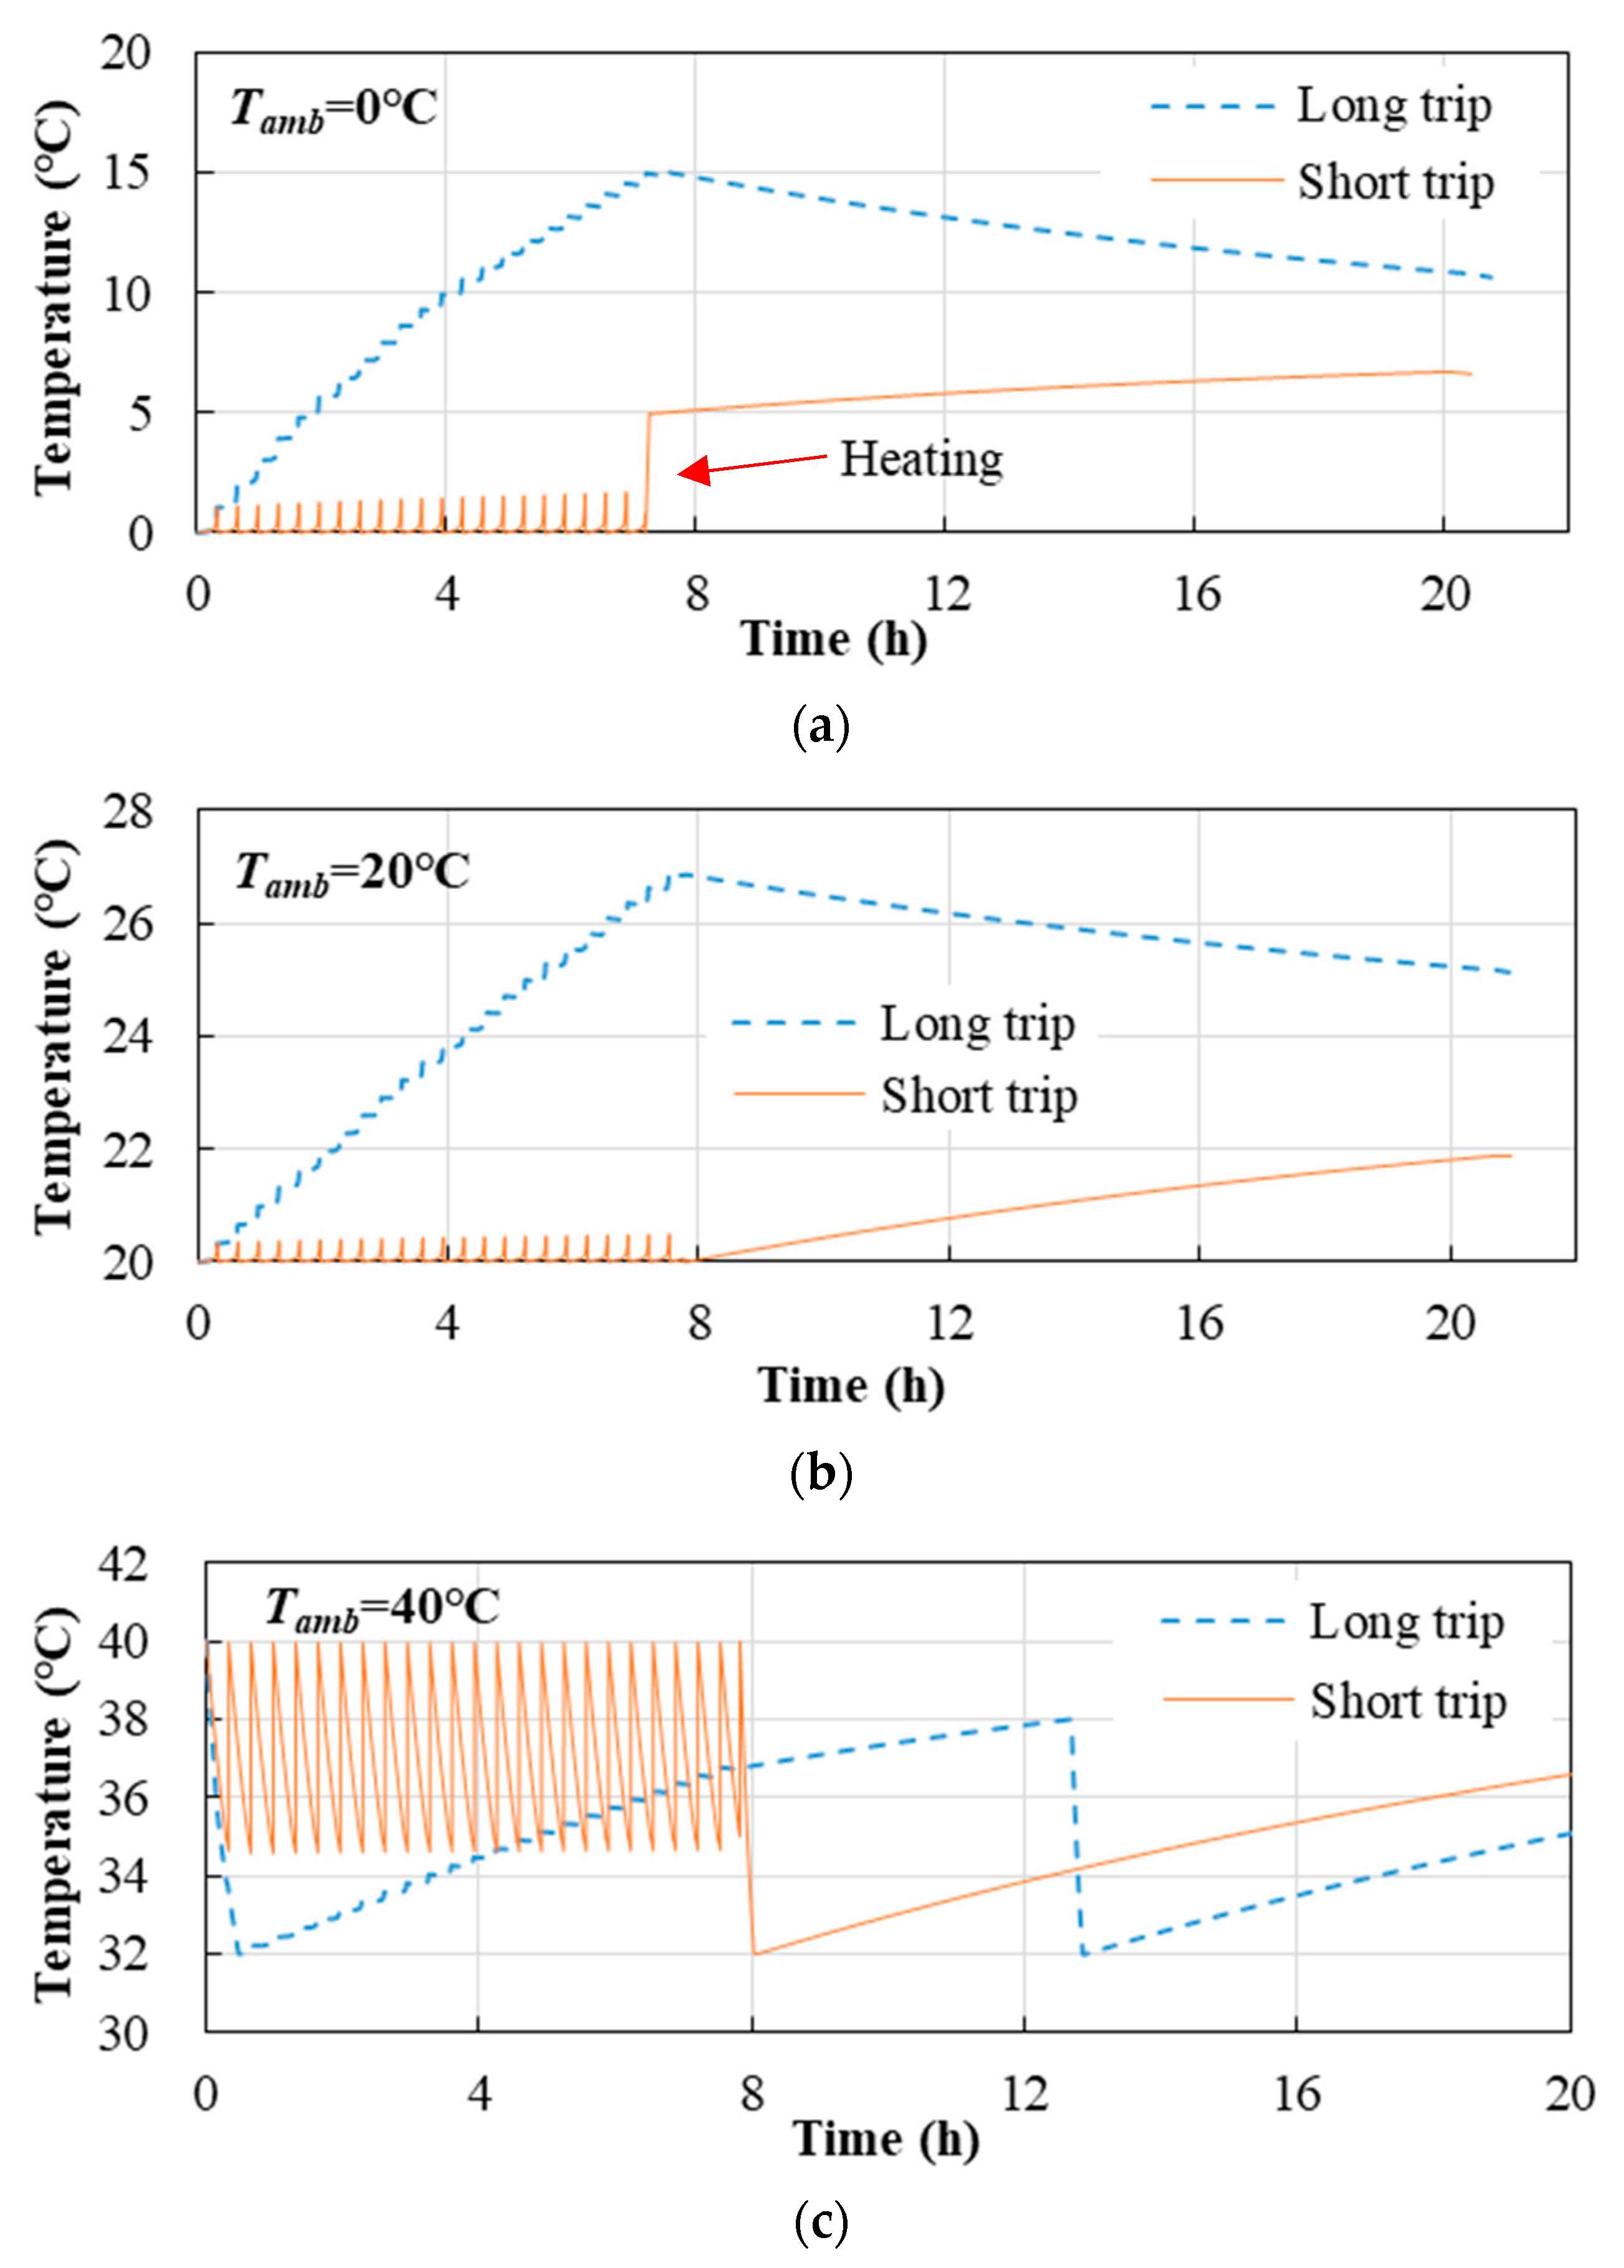
4.4. Effect of Trip Distance on Battery Life Cycle
In addition to the daily commute to work (short trip driving), there are also long trip driving situations, which in this study was defined as the vehicle driving under repeated driving cycles without rest until the battery reduced to SOC = 0.2, then the battery was charged to SOC = 1. The main difference between the two cases was the battery temperature. The battery temperature in the short trip driving was described in detail in 4.1, whereas the battery pack temperature will continue to rise during long trip driving. The NEDC driving cycle was selected, and the ambient temperatures were set as 0 °C, 20 °C, and 40 °C in this part of the study. By assuming that the vehicle ran with the same trip distance (short or long) and driving cycle (NEDC) all the time, a series of simulations were carried out, and the battery capacity fade and Ф were estimated. The battery temperature profiles and Ф under these cases are shown in Figure 13 and Figure 14, respectively.
Figure 13.
The battery temperature during short trip driving and long trip driving at different ambient temperatures: (a) Tamb = 0 °C; (b) Tamb = 20 °C; (c) Tamb = 40 °C.
Figure 14.
The impact of trip distance on Ф.
At the ambient temperatures of 0 °C and 20 °C, as there was no rest period and the battery pack released heat all the time in long trip driving conditions, the battery temperature continued to rise and was higher than in the short trip driving condition, as shown in Figure 13a,b. In the charging period of long trip cases, because the natural convection heat transfer rate is higher than the battery heat generation rate due to the large temperature difference between the battery pack and the ambient air, the battery temperature had a decreasing trend. However, in short trip cases, the natural convection heat transfer rate was lower, the battery heat generation rate was higher (internal resistance of LIBs increases with the decrease of temperature), and the battery temperature continued to rise.
As long trips can increase the temperature of the battery pack to a higher level with a slower aging rate, Ф was enlarged, as shown in Figure 14. In the low-temperature environment (corresponding to the ambient temperature of 0 °C in this study), Ф for the long trip condition was 2.2 times that of the short trip condition. In the 20 °C cases, long trip driving can also enlarge Ф by 22.8%. At the ambient temperature of 40 °C, it can be seen in Figure 13c that the battery temperature started to decrease right after the start of driving. In the charging period, the battery temperature remained within the range of 32–38 °C, which was attributed to the BTMS and its control strategy (presented in Table 5). A lower average temperature of the battery pack was achieved by continuously working the BTMS in long trip driving, and the Ф in long trip driving was extended by 5.7%, as shown in Figure 14.
5. Conclusions
In this paper, the impacts of driving conditions on battery pack life cycle were studied. The results showed that the driving cycle, ambient temperature, charging mode, and trip distance all had a great impact on the mileage traveled by the vehicle before the EOL of the battery pack (Ф): driving at low speed and low acceleration can extend Ф, while low temperature and high temperature environments will significantly reduce Ф. When the EV is running at an ambient temperature of 20 °C, the average values of Ф in NEDC, FTP-75, and JC08 were 8.6 times that of 0 °C and 2.7 times that of 40 °C. The impacts of the charging mode and trip distance on Ф are strongly related to the battery temperature profile in specific cases. When the ambient temperature was 0 °C, using fast charging can extend Ф by 27.6–30.1% compared with slow charging. However, it can reduce Ф by 17.2–32.8% in normal and high-temperature ambient conditions. Compared with short trip driving (a daily commute to work), long trip driving can achieve a higher Ф. In the ambient temperatures of 0 °C, 20 °C, and 40 °C, the Ф in long trip driving was extended by 120%, 22.8%, and 5.7%, respectively.
Author Contributions
Conceptualization, H.L. and F.C.; methodology, H.L.; software, Y.T.; validation, Y.T. and R.H.; formal analysis, F.C.; investigation, H.L. and R.H.; writing—original draft preparation, H.L. and Z.W.; writing—review and editing, H.L. and F.C.; supervision, X.Y.; project administration, R.H.; funding acquisition, R.H.; and all authors discussed the results and contributed to the final manuscript. All authors have read and agreed to the published version of the manuscript.
Funding
This research was funded by the Science and Technology Planned Project of Zhejiang Province, grant number 2018C01057, and the Science Foundation of Zhejiang Province, grant number LQ20E060008.
Acknowledgments
The authors gratefully acknowledge the financial support provided by the Zhejiang province under research grants 2018C01057 and LQ20E060008.
Conflicts of Interest
The authors declare no conflict of interest.
Nomenclature
| Greek Symbols | |
| θ′ | Capacity fade of a single charge and discharge process |
| τ | Time |
| Ф | Mileage traveled by the vehicle before the EOL of the battery pack |
| Δ | Change |
| Symbols | |
| Ah | Ampere-hour |
| Ahthroughput | Amount of electricity output by the battery during the cycle |
| Crate | Battery charge and discharge rate |
| N | Total number of the charge and discharge cycles before EOL of battery |
| Qloss | Percentage of capacity loss |
| T | Battery temperature |
| Abbreviations | |
| BMS | Battery management system |
| BTMS | Battery thermal management system |
| CAN | Controller Area Network |
| CCCV | Constant current constant voltage |
| DOD | Depth of discharge |
| EV | Electric vehicle |
| EOL | End of life |
| FTP | Federal Test Procedure |
| HEV | Hybrid electric vehicle |
| JC08 | A Japanese chassis dynamometer emission test cycle |
| LIB | Lithium-ion battery |
| MCU | Motor control unit |
| NCM | Nickel cobalt manganese |
| NEDC | New European Driving Cycle |
| PID | Proportion Integration Differentiation |
| PTC | Positive Temperature Coefficient |
| SOC | State of charge |
| SOH | State of health |
| SEI | Solid electrolyte interface |
| VCU | Vehicle control unit |
References
- Cano, Z.P.; Banham, D.; Ye, S.; Hintennach, A.; Lu, J.; Fowler, M.; Chen, Z. Batteries and fuel cells for emerging electric vehicle markets. Nat. Energy 2018, 3, 279–289. [Google Scholar] [CrossRef]
- Birkl, C.R.; Roberts, M.R.; McTurk, E.; Bruce, P.G.; Howey, D.A. Degradation diagnostics for lithium ion cells. J. Power Sources 2017, 341, 373–386. [Google Scholar] [CrossRef]
- Barré, A.; Deguilhem, B.; Grolleau, S.; Gérard, M.; Suard, F.; Riu, D. A review on lithium-ion battery ageing mechanisms and estimations for automotive applications. J. Power Sources 2013, 241, 680–689. [Google Scholar] [CrossRef]
- Thackeray, M.M.; Wolverton, C.; Isaacs, E.D. Electrical energy storage for transportation-Approaching the limits of, and going beyond, lithium-ion batteries. Energy Environ. Sci. 2012, 5, 7854–7863. [Google Scholar] [CrossRef]
- Shi, W.; Hu, X.; Wang, J.; Jiang, J.; Zhang, Y.; Yip, T. Analysis of Thermal Aging Paths for Large-Format LiFePO4/Graphite Battery. Electrochim. Acta 2016, 196, 13–23. [Google Scholar] [CrossRef]
- Li, Z.; Huang, J.; Liaw, B.Y.; Metzler, V.; Zhang, J. A review of lithium deposition in lithium-ion and lithium metal secondary batteries. J. Power Sources 2014, 254, 168–182. [Google Scholar] [CrossRef]
- Zubi, G.; López, R.D.; Carvalho, M.; Pasaoglu, G. The lithium-ion battery: State of the art and future perspectives. Renew. Sustain. Energy Rev. 2018, 89, 292–308. [Google Scholar] [CrossRef]
- Lv, W.; Wang, Z.; Cao, H.; Sun, Y.; Zhang, Y.; Sun, Z. A Critical Review and Analysis on the Recycling of Spent Lithium-Ion Batteries. Acs Sustain. Chem. Eng. 2018, 6, 1504–1521. [Google Scholar] [CrossRef]
- Yang, X.G.; Leng, Y.; Zhang, G.; Ge, S.; Wang, C.Y. Modeling of lithium plating induced aging of lithium-ion batteries: Transition from linear to nonlinear aging. J. Power Sources 2017, 360, 28–40. [Google Scholar] [CrossRef]
- Zhao, K.; Zhang, L.; Xia, R.; Dong, Y.; Xu, W.; Niu, C.; He, L.; Yan, M.; Qu, L.; Mai, L. SnO2 Quantum Dots@Graphene Oxide as a High-Rate and Long-Life Anode Material for Lithium-Ion Batteries. Small 2016, 12, 588–594. [Google Scholar] [CrossRef]
- Liu, W.; Li, X.; Xiong, D.; Hao, Y.; Li, J.; Kou, H.; Yan, B.; Li, D.; Lu, S.; Koo, A.; et al. Significantly improving cycling performance of cathodes in lithium ion batteries: The effect of Al2O3 and LiAlO2 coatings on LiNi0.6Co0.2Mn0.2O2. Nano Energy 2018, 44, 111–120. [Google Scholar] [CrossRef]
- Elia, G.A.; Ulissi, U.; Mueller, F.; Reiter, J.; Tsiouvaras, N.; Sun, Y.K.; Scrosati, B.; Passerini, S.; Hassoun, J. A Long-Life Lithium Ion Battery with Enhanced Electrode/Electrolyte Interface by Using an Ionic Liquid Solution. Chem. Eur. J. 2016, 22, 6808–6814. [Google Scholar] [CrossRef] [PubMed]
- Maheshwari, A.; Heck, M.; Santarelli, M. Cycle aging studies of lithium nickel manganese cobalt oxide-based batteries using electrochemical impedance spectroscopy. Electrochim. Acta 2018, 273, 335–348. [Google Scholar] [CrossRef]
- de Hoog, J.; Timmermans, J.M.; Stroe, D.I.; Swierczynski, M.; Jaguemont, J.; Goutam, S.; Omar, N.; Van Mierlo, J.; Van Den Bossche, P. Combined cycling and calendar capacity fade modeling of a Nickel-Manganese-Cobalt Oxide Cell with real-life profile validation. Appl. Energy 2017, 200, 47–61. [Google Scholar] [CrossRef]
- Liu, K.; Li, K.; Peng, Q.; Zhang, C. A brief review on key technologies in the battery management system of electric vehicles. Front. Mech. Eng. 2019, 14, 47–64. [Google Scholar] [CrossRef]
- Kim, J.; Oh, J.; Lee, H. Review on battery thermal management system for electric vehicles. Appl. Therm. Eng. 2019, 149, 192–212. [Google Scholar] [CrossRef]
- Neubauer, J.; Wood, E. The impact of range anxiety and home, workplace, and public charging infrastructure on simulated battery electric vehicle lifetime utility. J. Power Sources 2014, 257, 12–20. [Google Scholar] [CrossRef]
- Neubauer, J.; Wood, E. Thru-life impacts of driver aggression, climate, cabin thermal management, and battery thermal management on battery electric vehicle utility. J. Power Sources 2014, 259, 262–275. [Google Scholar] [CrossRef]
- Wang, D.; Coignard, J.; Zeng, T.; Zhang, C.; Saxena, S. Quantifying electric vehicle battery degradation from driving vs. vehicle-to-grid services. J. Power Sources 2016, 332, 193–203. [Google Scholar] [CrossRef]
- Dubarry, M.; Devie, A.; McKenzie, K. Durability and reliability of electric vehicle batteries under electric utility grid operations: Bidirectional charging impact analysis. J. Power Sources 2017, 358, 39–49. [Google Scholar] [CrossRef]
- Keil, P.; Jossen, A. Impact of Dynamic Driving Loads and Regenerative Braking on the Aging of Lithium-Ion Batteries in Electric Vehicles. J. Electrochem. Soc. 2017, 164, A3081–A3092. [Google Scholar] [CrossRef]
- Yuksel, T.; Litster, S.; Viswanathan, V.; Michalek, J.J. Plug-in hybrid electric vehicle LiFePO4 battery life implications of thermal management, driving conditions, and regional climate. J. Power Sources 2017, 338, 49–64. [Google Scholar] [CrossRef]
- Bernardi, D.; Pawlikowski, E.; Newman, J. A General Energy Balance for Battery Systems. J. Electrochem. Soc. 1985, 132, 5–12. [Google Scholar] [CrossRef]
- Reniers, J.M.; Mulder, G.; Howey, D.A. Review and Performance Comparison of Mechanical-Chemical Degradation Models for Lithium-Ion Batteries. J. Electrochem. Soc. 2019, 166, A3189–A3200. [Google Scholar] [CrossRef]
- Wang, J.; Purewal, J.; Liu, P.; Garner, J.H.; Soukazian, S.; Sherman, E.; Sorenson, A.; Vu, L.; Tataria, H.; Verbrugge, M.W. Degradation of lithium ion batteries employing graphite negatives and nickel-cobalt-manganese oxide + spinel manganese oxide positives: Part 1, aging mechanisms and life estimation. J. Power Sources 2014, 269, 937–948. [Google Scholar] [CrossRef]
- Ma, Z.; Wang, Z.; Xiong, R.; Jiang, J. A mechanism identification model based state-of-health diagnosis of lithium-ion batteries for energy storage applications. J. Clean. Prod. 2018, 193, 379–390. [Google Scholar] [CrossRef]
- Safari, M.; Morcrette, M.; Teyssot, A.; Delacourt, C. Life-Prediction Methods for Lithium-Ion Batteries Derived from a Fatigue Approach, I. Introduction: Capacity-Loss Prediction Based on Damage Accumulation. J. Electrochem. Soc. 2010, 157, A713–A720. [Google Scholar] [CrossRef]
- Safari, M.; Morcrette, M.; Teyssot, A.; Delacourt, C. Life Prediction Methods for Lithium-Ion Batteries Derived from a Fatigue Approach II. Capacity-Loss Prediction of Batteries Subjected to Complex Current Profiles. J. Electrochem. Soc. 2010, 157, A892–A898. [Google Scholar] [CrossRef]
- Giakoumis, E.G. Driving and Engine Cycles; Springer Nature: Gewerbestrasse, Switzerland, 2016; pp. 65–166. [Google Scholar]
© 2020 by the authors. Licensee MDPI, Basel, Switzerland. This article is an open access article distributed under the terms and conditions of the Creative Commons Attribution (CC BY) license (http://creativecommons.org/licenses/by/4.0/).