Article

V2B/V2G on Energy Cost and Battery Degradation under Different Driving Scenarios, Peak Shaving, and Frequency Regulations

1
Digital Technologies Research Centre, National Research Council Canada, 1200 Montréal Road, M-50, Ottawa, ON K1A 0R6, Canada
2
Energy, Mining and Environment Research Centre, National Research Council Canada, 1200 Montréal Road, M-2, Ottawa, ON K1A 0R6, Canada
*
Author to whom correspondence should be addressed.
World Electr. Veh. J. 2020, 11(1), 14; https://doi.org/10.3390/wevj11010014
Submission received: 11 October 2019 / Revised: 18 January 2020 / Accepted: 20 January 2020 / Published: 26 January 2020

Abstract

:
The energy stored in electric vehicles (EVs) would be made available to commercial buildings to actively manage energy consumption and costs in the near future. These concepts known as vehicle-to-building (V2B) and vehicle-to-grid (V2G) technologies have the potential to provide storage capacity to benefit both EV and building owners respectively, by reducing some of the high cost of EVs, buildings’ energy cost, and providing reliable emergency backup services. In this study, we considered a vehicle-to-buildings/grid (V2B/V2G) system simultaneously for peak shaving and frequency regulation via a combined multi-objective optimization strategy which captures battery state of charge (SoC), EV battery degradation, EV driving scenarios, and operational constraints. Under these assumptions, we showed that the electricity usage/bill can be reduced by a difference of 0.1 on a scale of 0 to 1 (with 1 the normalized original electricity cost), and that EV batteries can also achieve superior economic benefits under controlled SoC limits (e.g., when kept between the SoC range of SoCmin > 30% and SoCmax < 90%) and subjected to very restricted charge-discharge battery cycling.

1. Introduction

The energy stored in electric vehicles (EVs) would be made available to commercial buildings to actively manage energy consumption and costs in the near future. These concepts known as vehicle-to-X (V2X) (where X = home (H), building (B), or grid (G)) technologies have the potential to provide storage capacity to benefit EVs owners, grid companies, and buildings owners by reducing some of the high cost of EVs, reducing buildings’ energy cost, and providing reliable emergency backup services [1,2]. For example, Tesla S70 has 90 kWh battery capacity, and its daily consumption for trips is about 12.5% of this capacity (average daily distance for light vehicles is 53 km [3]). Hence of, 60 kWh can be used as an energy storage system after reduction of 20% depletion ratio.
More often than usual, when these EVs are not in used for driving purposes, they are sitting in the garage of the owners or in public parking lots, and the energies stored in the batteries would not be beneficial. The goal of this study is to use these energies for peak shaving and frequency regulation in vehicle-to-building/grid (V2B/V2G) technology. Studies in this direction have already been done and published in the literature. The studies presented in [4] and [5] show the economic benefit of using stationary batteries and plug-in electric vehicles batteries, respectively for energy arbitrage and frequency regulation. These early works showed that using batteries for peak shaving and frequency regulation simultaneously yields beneficial results in comparison to single application. However, their approaches did not account for the stochastic nature of the problem. In order to deal with potential uncertainties from energy and ancillary service markets such as price and frequency regulation signals, the studies published in [6,7,8] formulate the battery usage for peak shaving and frequency regulation as a stochastic problem. Most of these prior works are based on stationary batteries and thus do not account for power train in the degradation of the batteries.
The current study focuses on EV batteries which are mobile and can be used for driving purposes. Furthermore, in comparison to the previous works related to stationary energy storage system, the current study contributes in significantly different ways. A multi-objective optimization framework for EV batteries to perform load management (building load and driving), peak shaving, and frequency regulation services is proposed and simulated. This framework accounts for EV battery degradation, operational constraints, driving profiles, and regulation signals. Since EV batteries cycle multiple times when used for frequency regulation, peak shaving, and load management, the battery degradation plays an important role in determining their operations. The simulation in this study was conducted based on the assumption of five EV users working at the same building with different driving profiles and state of charge (SoC) limits, EV1 = [10–90%], EV2 = [20–90%], EV3 = [30–90%], EV4 = [40–90%], and EV5 = [50–90%] = [SoCmin–SoCmax] providing the same ancillary services. The main difference of SoC usage ranges among the EV users results from the different driving profiles. The SoC limits are correlated to the driving distance to and from work for each EV user. One major observation in this study is that under these restricted scenarios, EV batteries can achieve much larger economic benefits if they jointly provide multiple services under controlled SoC limits and very restricted charge-discharge battery cycling.
The rest of this paper is organized as follows. In Section 2, a detail description of the Materials and Methods used in this study is performed and the problem formulated. The Results are presented in Section 3, followed by Discussions in Section 4 and Conclusions in Section 5.

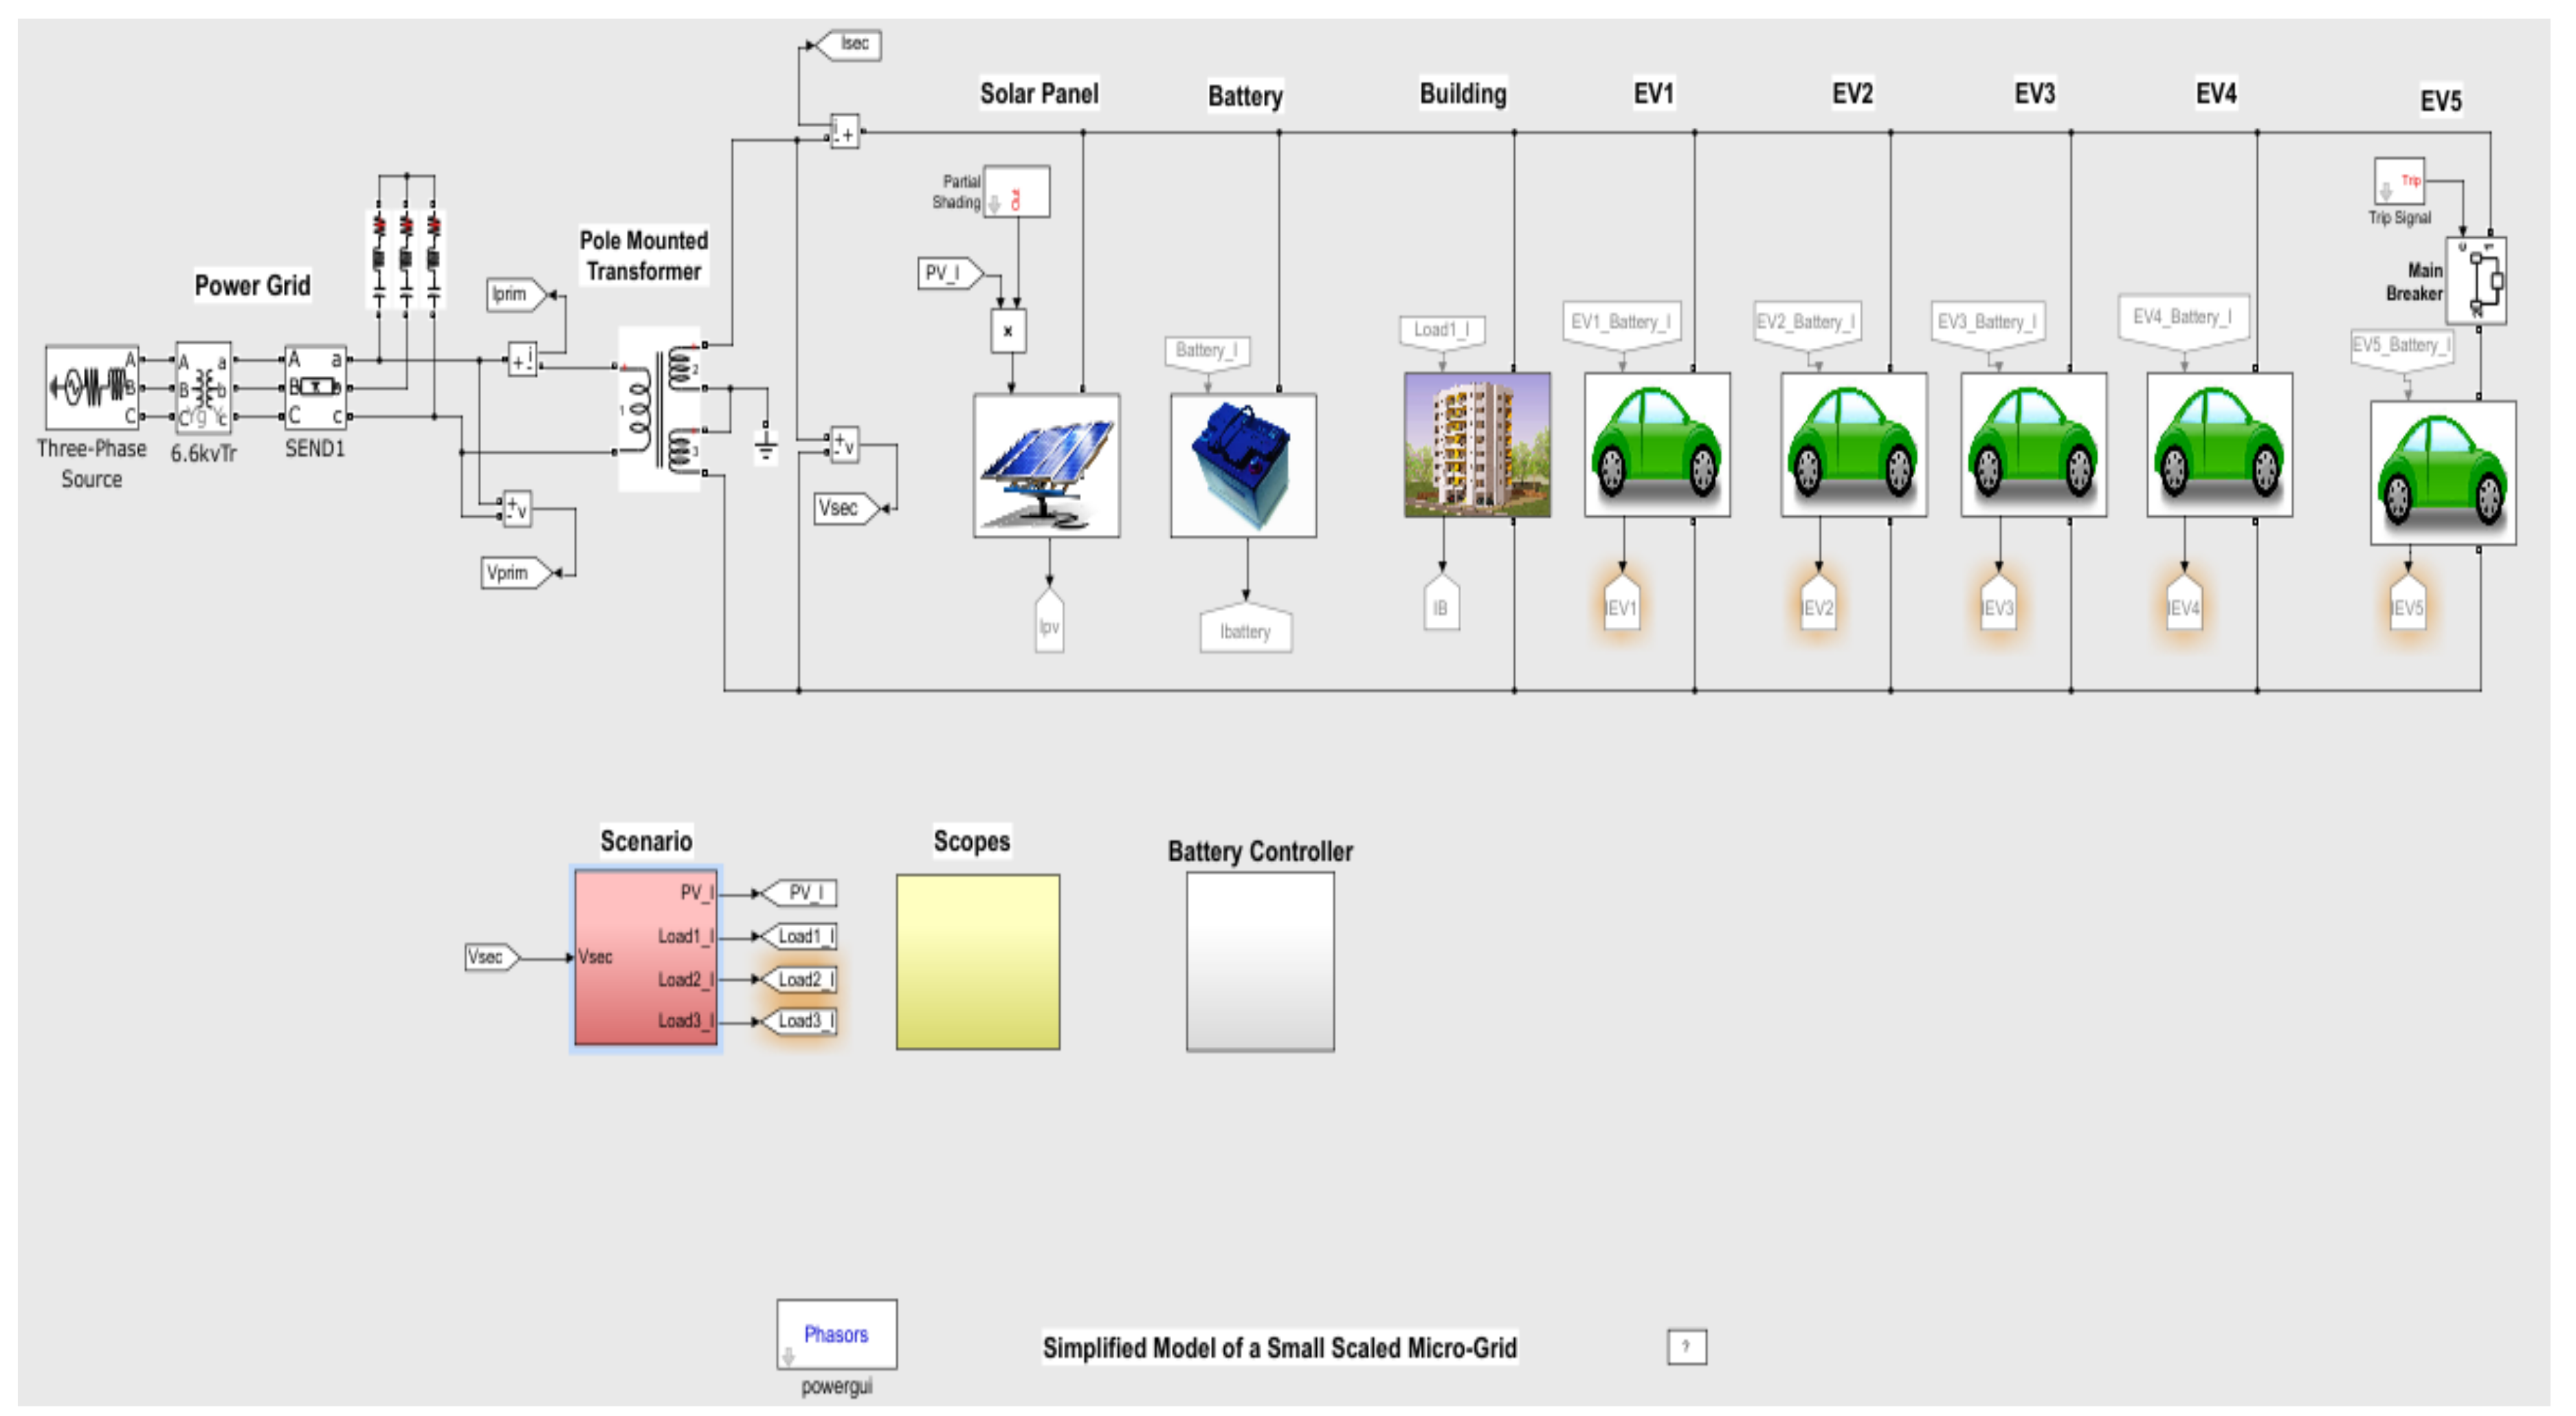
2. Materials and Methods

Our starting point is the calculation of the electricity bill, with the goal to use the energy stored in EVs batteries to reduce the energy cost not only from the EV owner (i.e., V2H) perspective, but also from the building owner (i.e., V2B) and grid company perspectives (i.e., V2G). Table 1 shows the list of variables used in this study and their definitions.

2.1. Electricity Bill Calculation

An industrial building or a commercial unit, whose daily electricity bill H is the summation of energy charge off peak and on peak demand charge is considered.
H = H e l e c + H p e a k = α e l e c T 0 T r t d t + α p e a k m a x t = T 0 T r t = α e l e c T 0 T r t d t + α p e a k r p e a k
where αelec = energy price in $/MWh, r(t) power consume at time t, αpeak = peak demand price in $/MW. The peak demand charge rpeak is based on the maximum power consumption, and it is calculated from a running average of power consumption over 15 or 30 min [8,9].

2.2. Problem Formulation

The goals of this study are:
  • To find the optimal policy and strategies for using the energy stored in EV batteries to reduce the total energy cost H of the building owner.
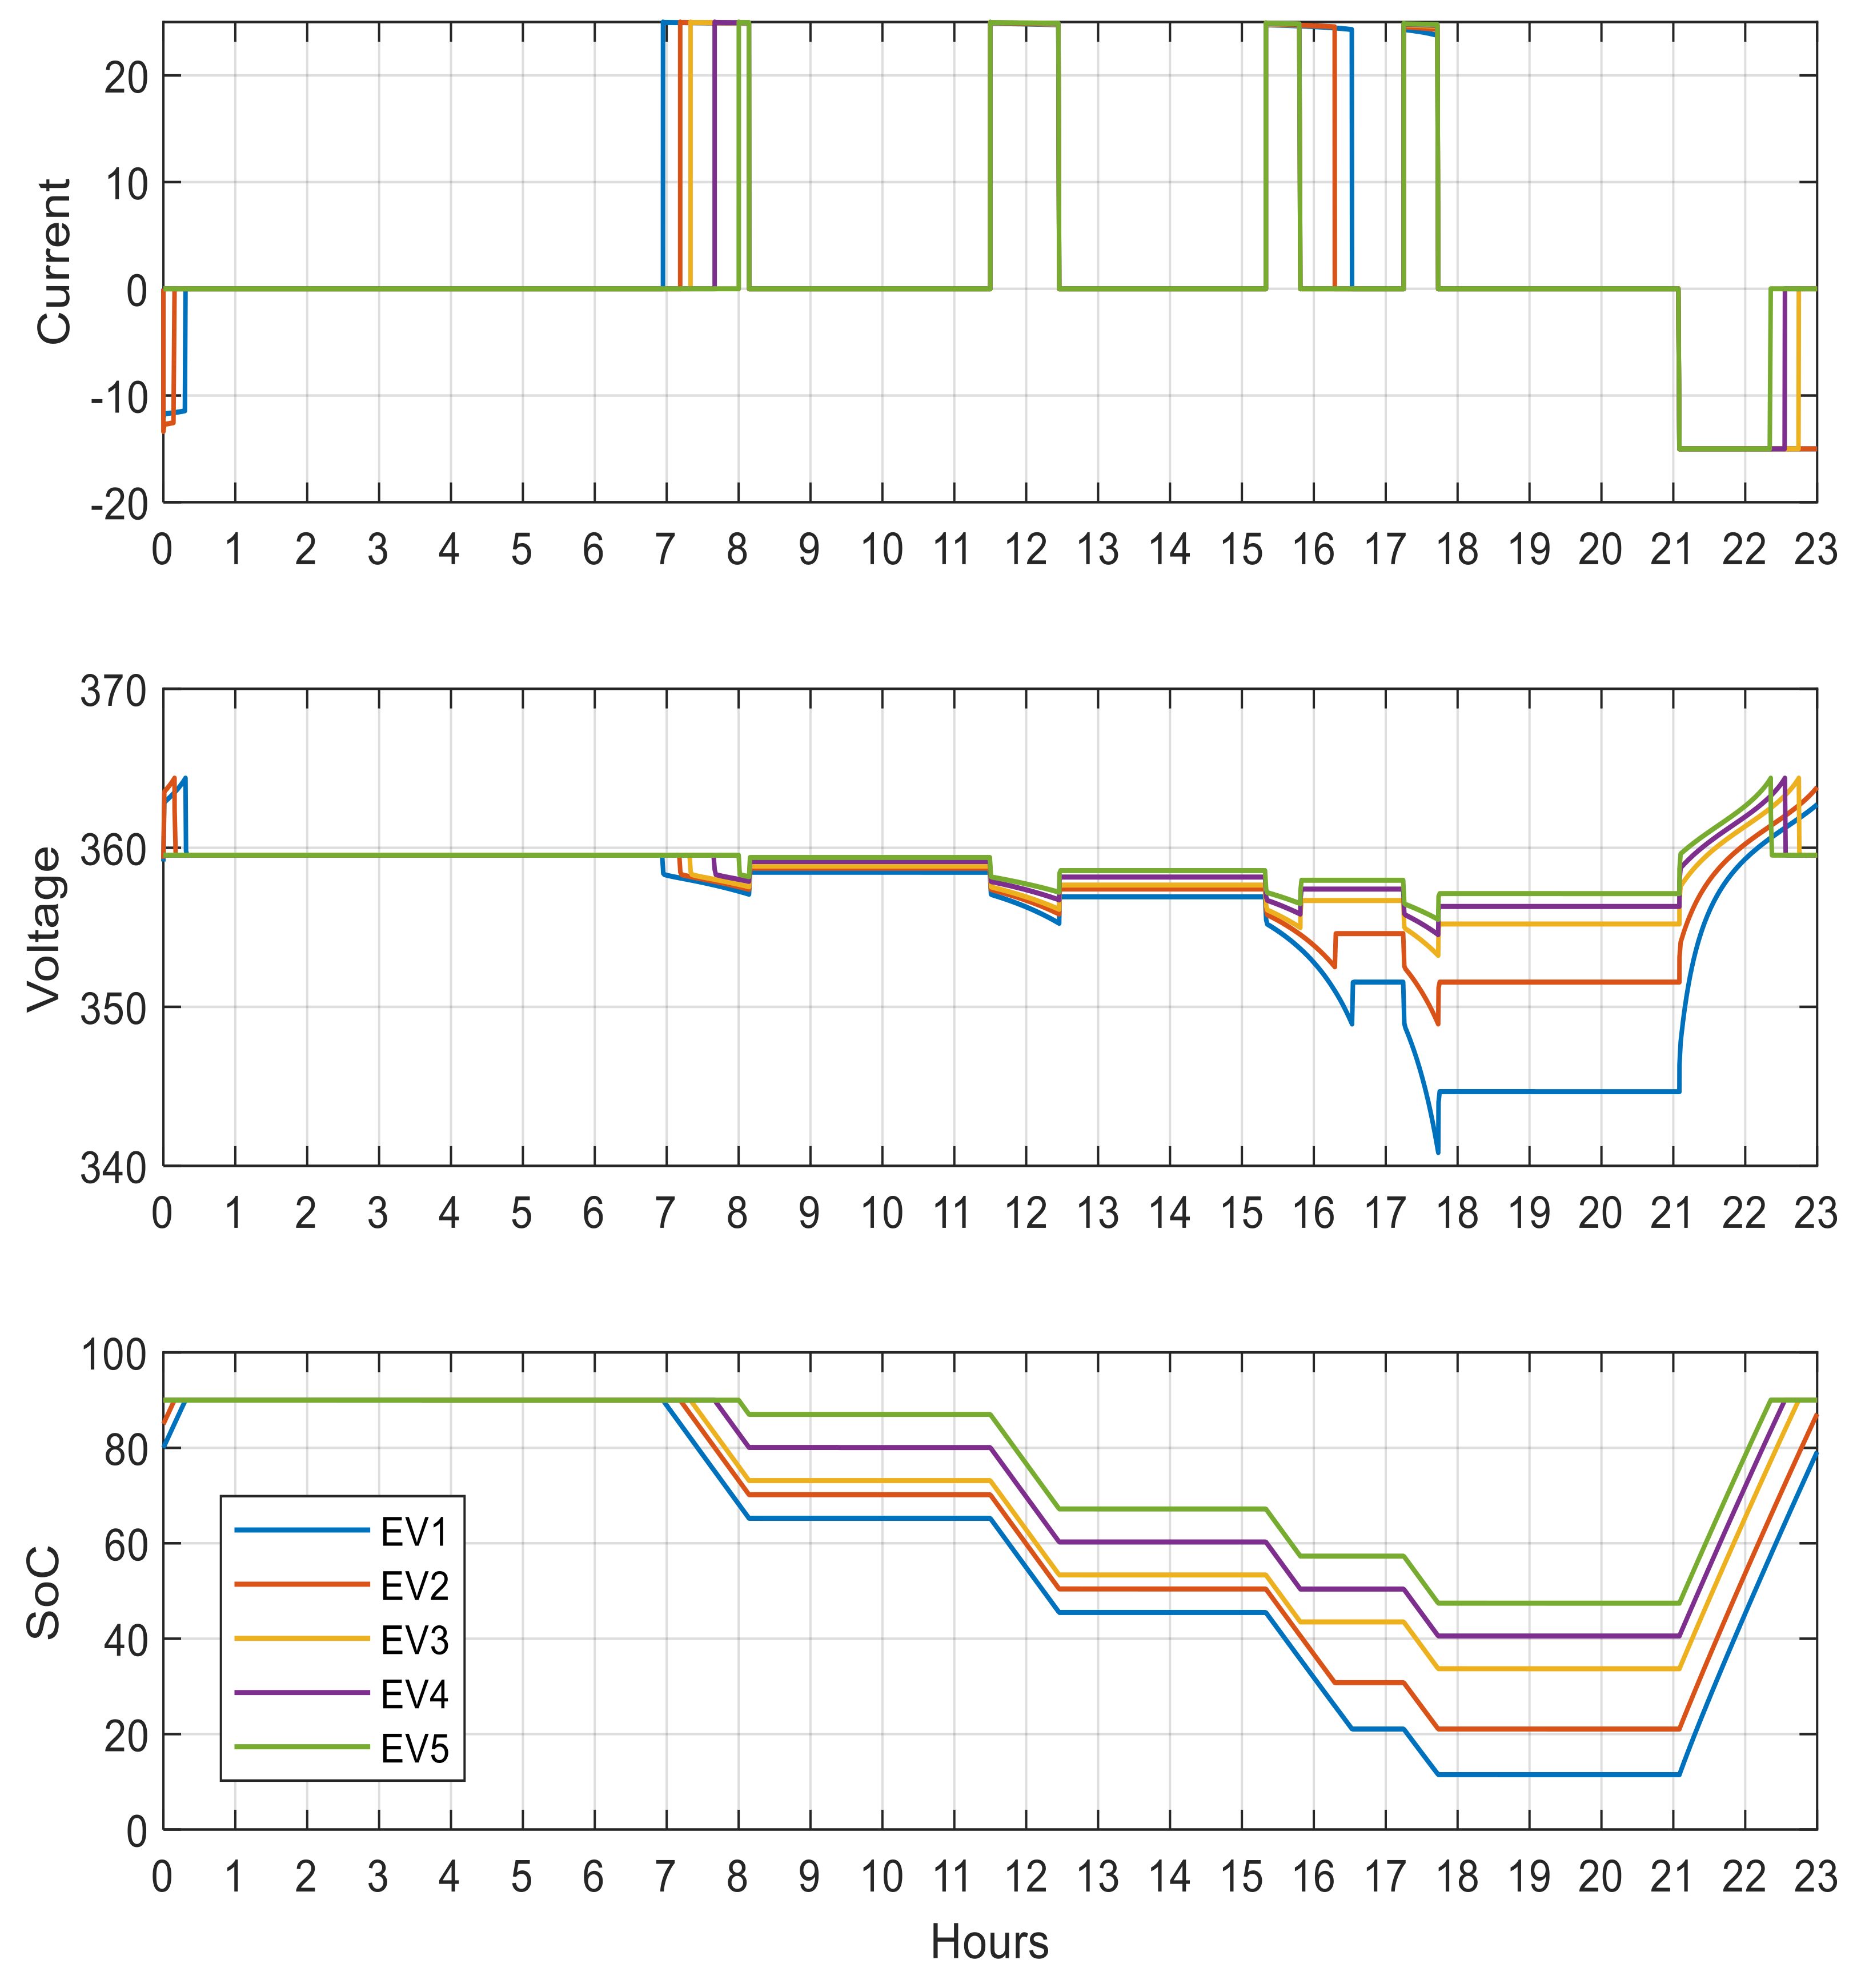
  • To find the SoC optimal range of EV batteries with slow battery degradation, while providing building load supply when necessary, powertrain for the EV, peak shaving and frequency regulation simultaneously.
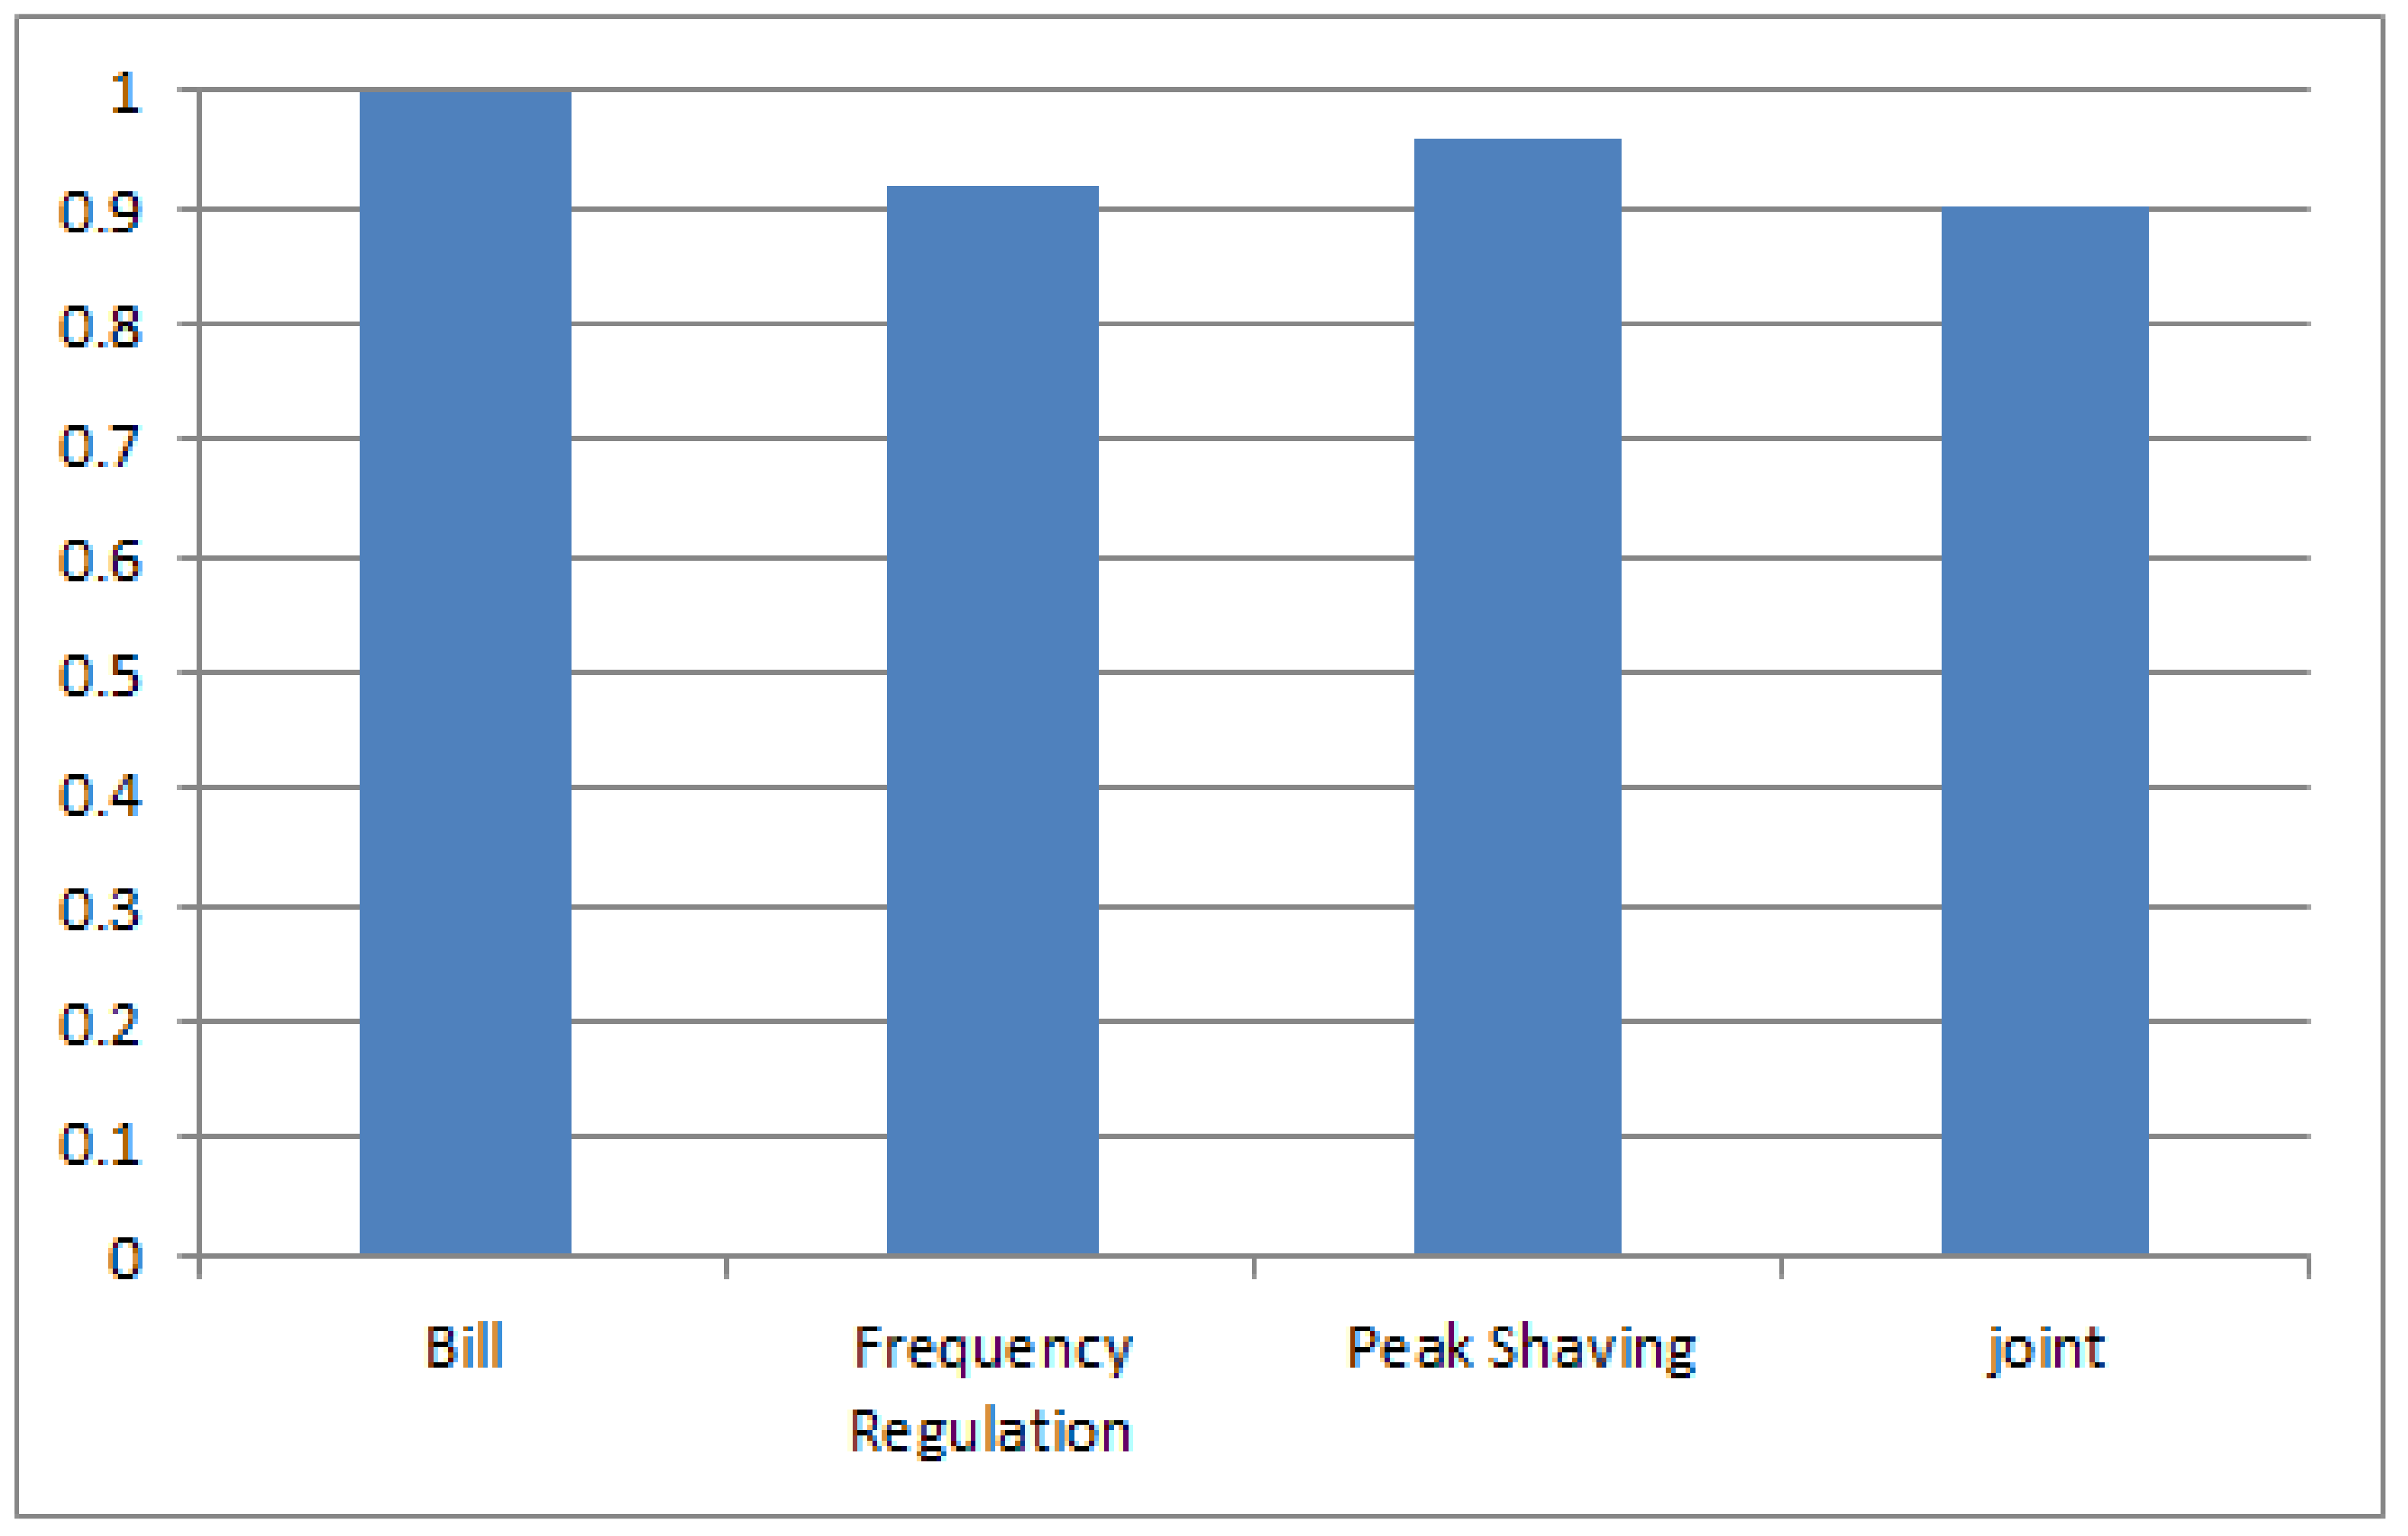
2.3. Peak Shaving

Peak demand charges can significantly increase the electricity bill. Smoothing these peak demands represents one of the best ways for reducing electricity cost. Several techniques have been developed and proposed in the literature for peak shaving: using energy storage [10], load shifting and balancing [11]. In this study, a set of N EVs, each having one mobile battery energy storage system (MBESS), which can be connected to the grid via fast bidirectional chargers installed in the parking lot of a commercial building is considered. The MBESS can discharge energy to the grid when it is connected and electrical demand is high and charge in other times to smooth building’s energy consumption profiles.
Let us define bn(t) the power that the nth MBESS can inject in the grid at a given time t. Note that bn(t) > 0 for discharging, bn(t) < 0 for charging. The total adjusted electricity bill Ha is now given by Equation (2).
H a = α e l e c T 0 T r t n = 1 N b n t d t + α p e a k m a x t = T 0 T r t n = 1 N b ¯ n t ] + n = 1 N f ( b n )
In Equation (2), r(t) is the power meter reading at time t, b ¯ n(t) is the average power injection of the nth battery, r a t = r t n = 1 N b n t is the actual power meter reading when the N EVs are connected to the grid, and f(bn) is the operating cost of the nth battery.

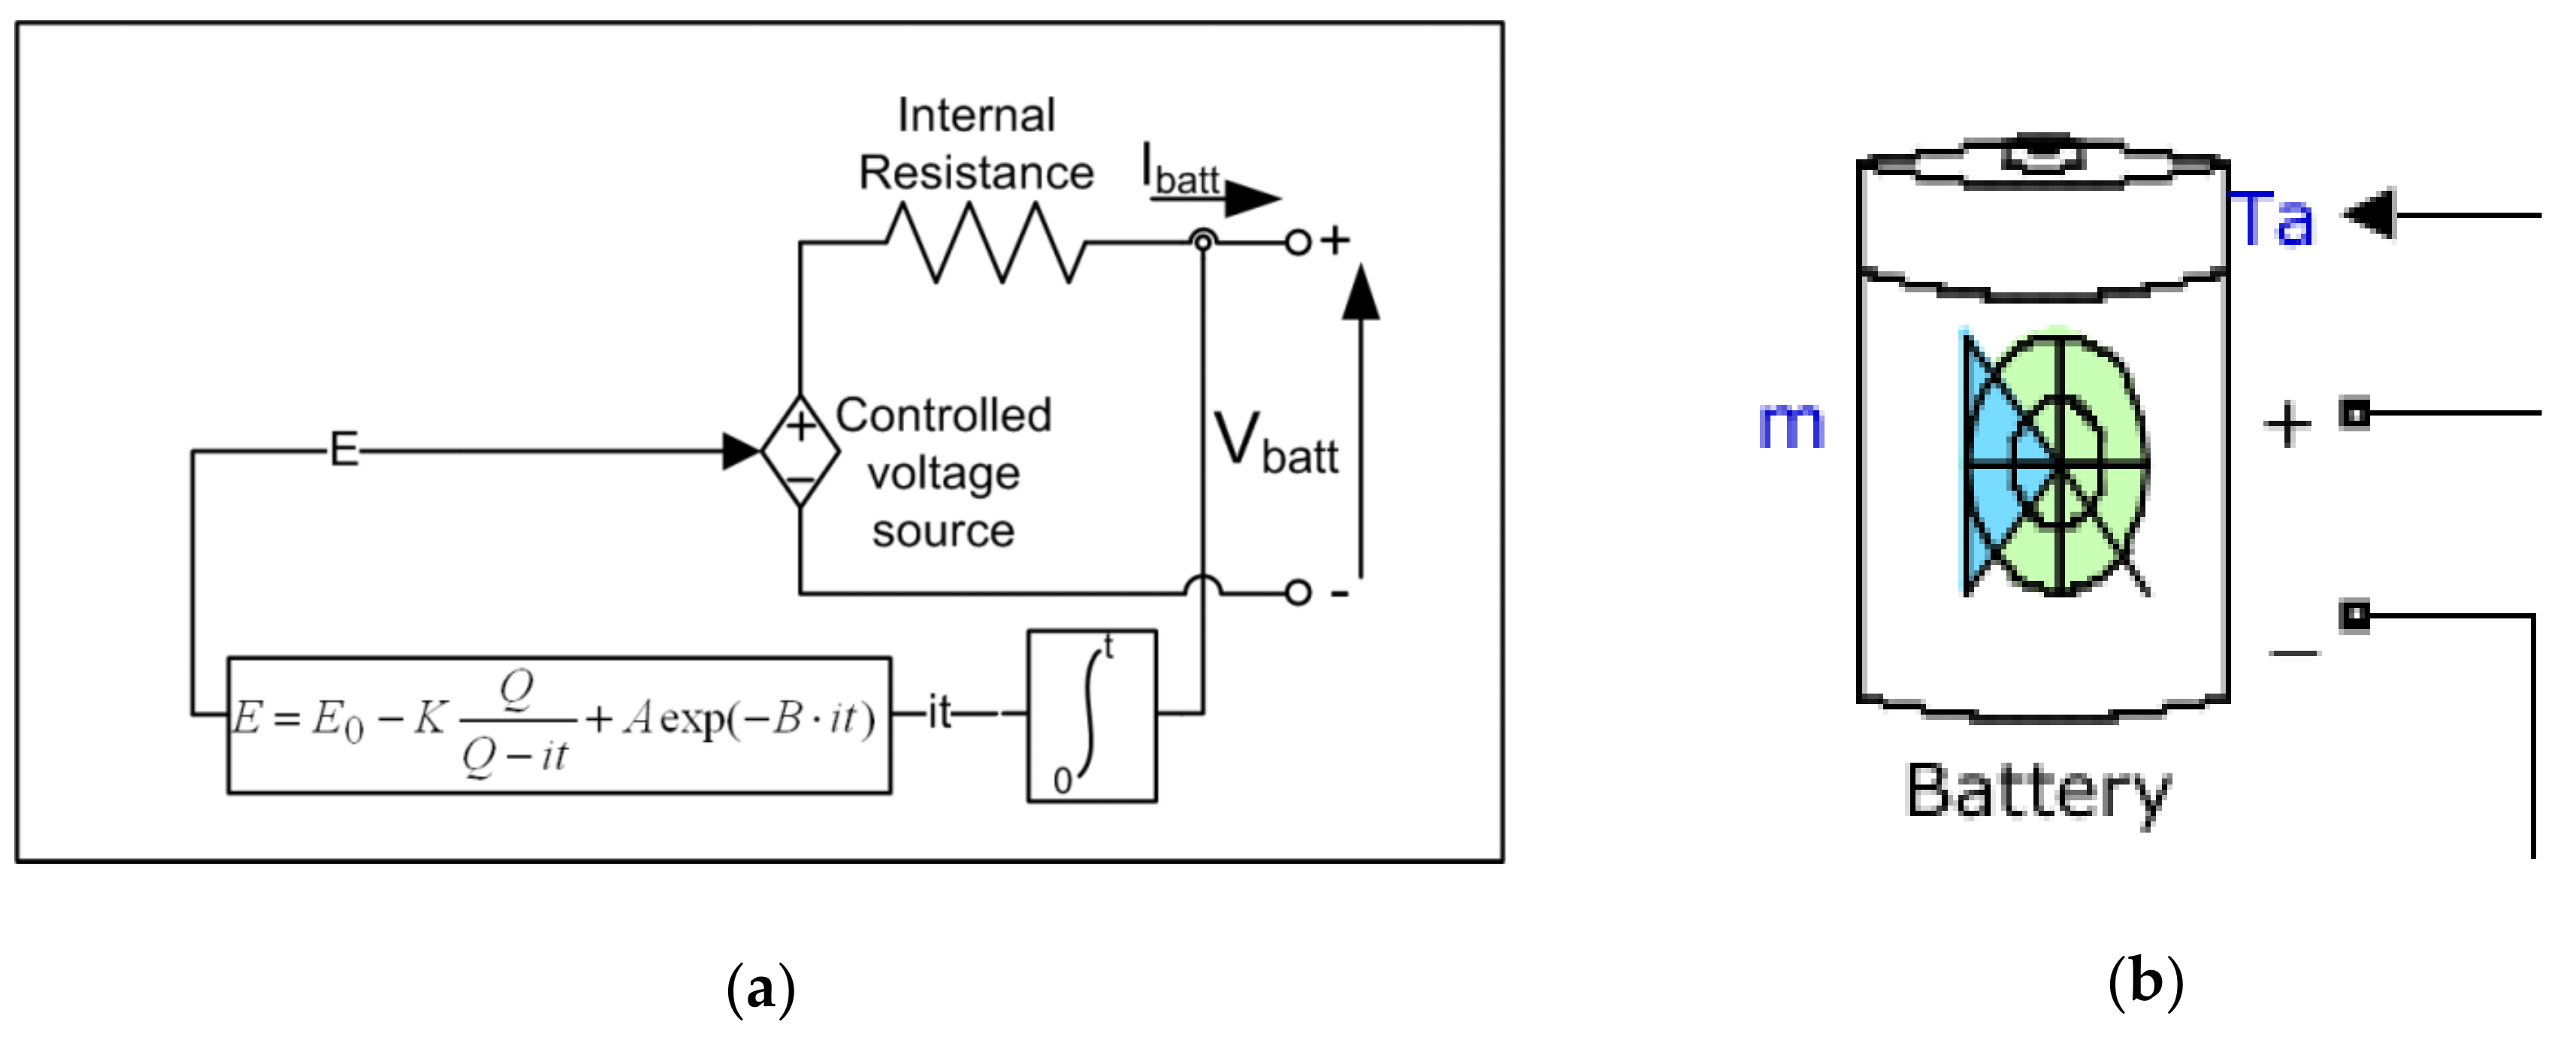
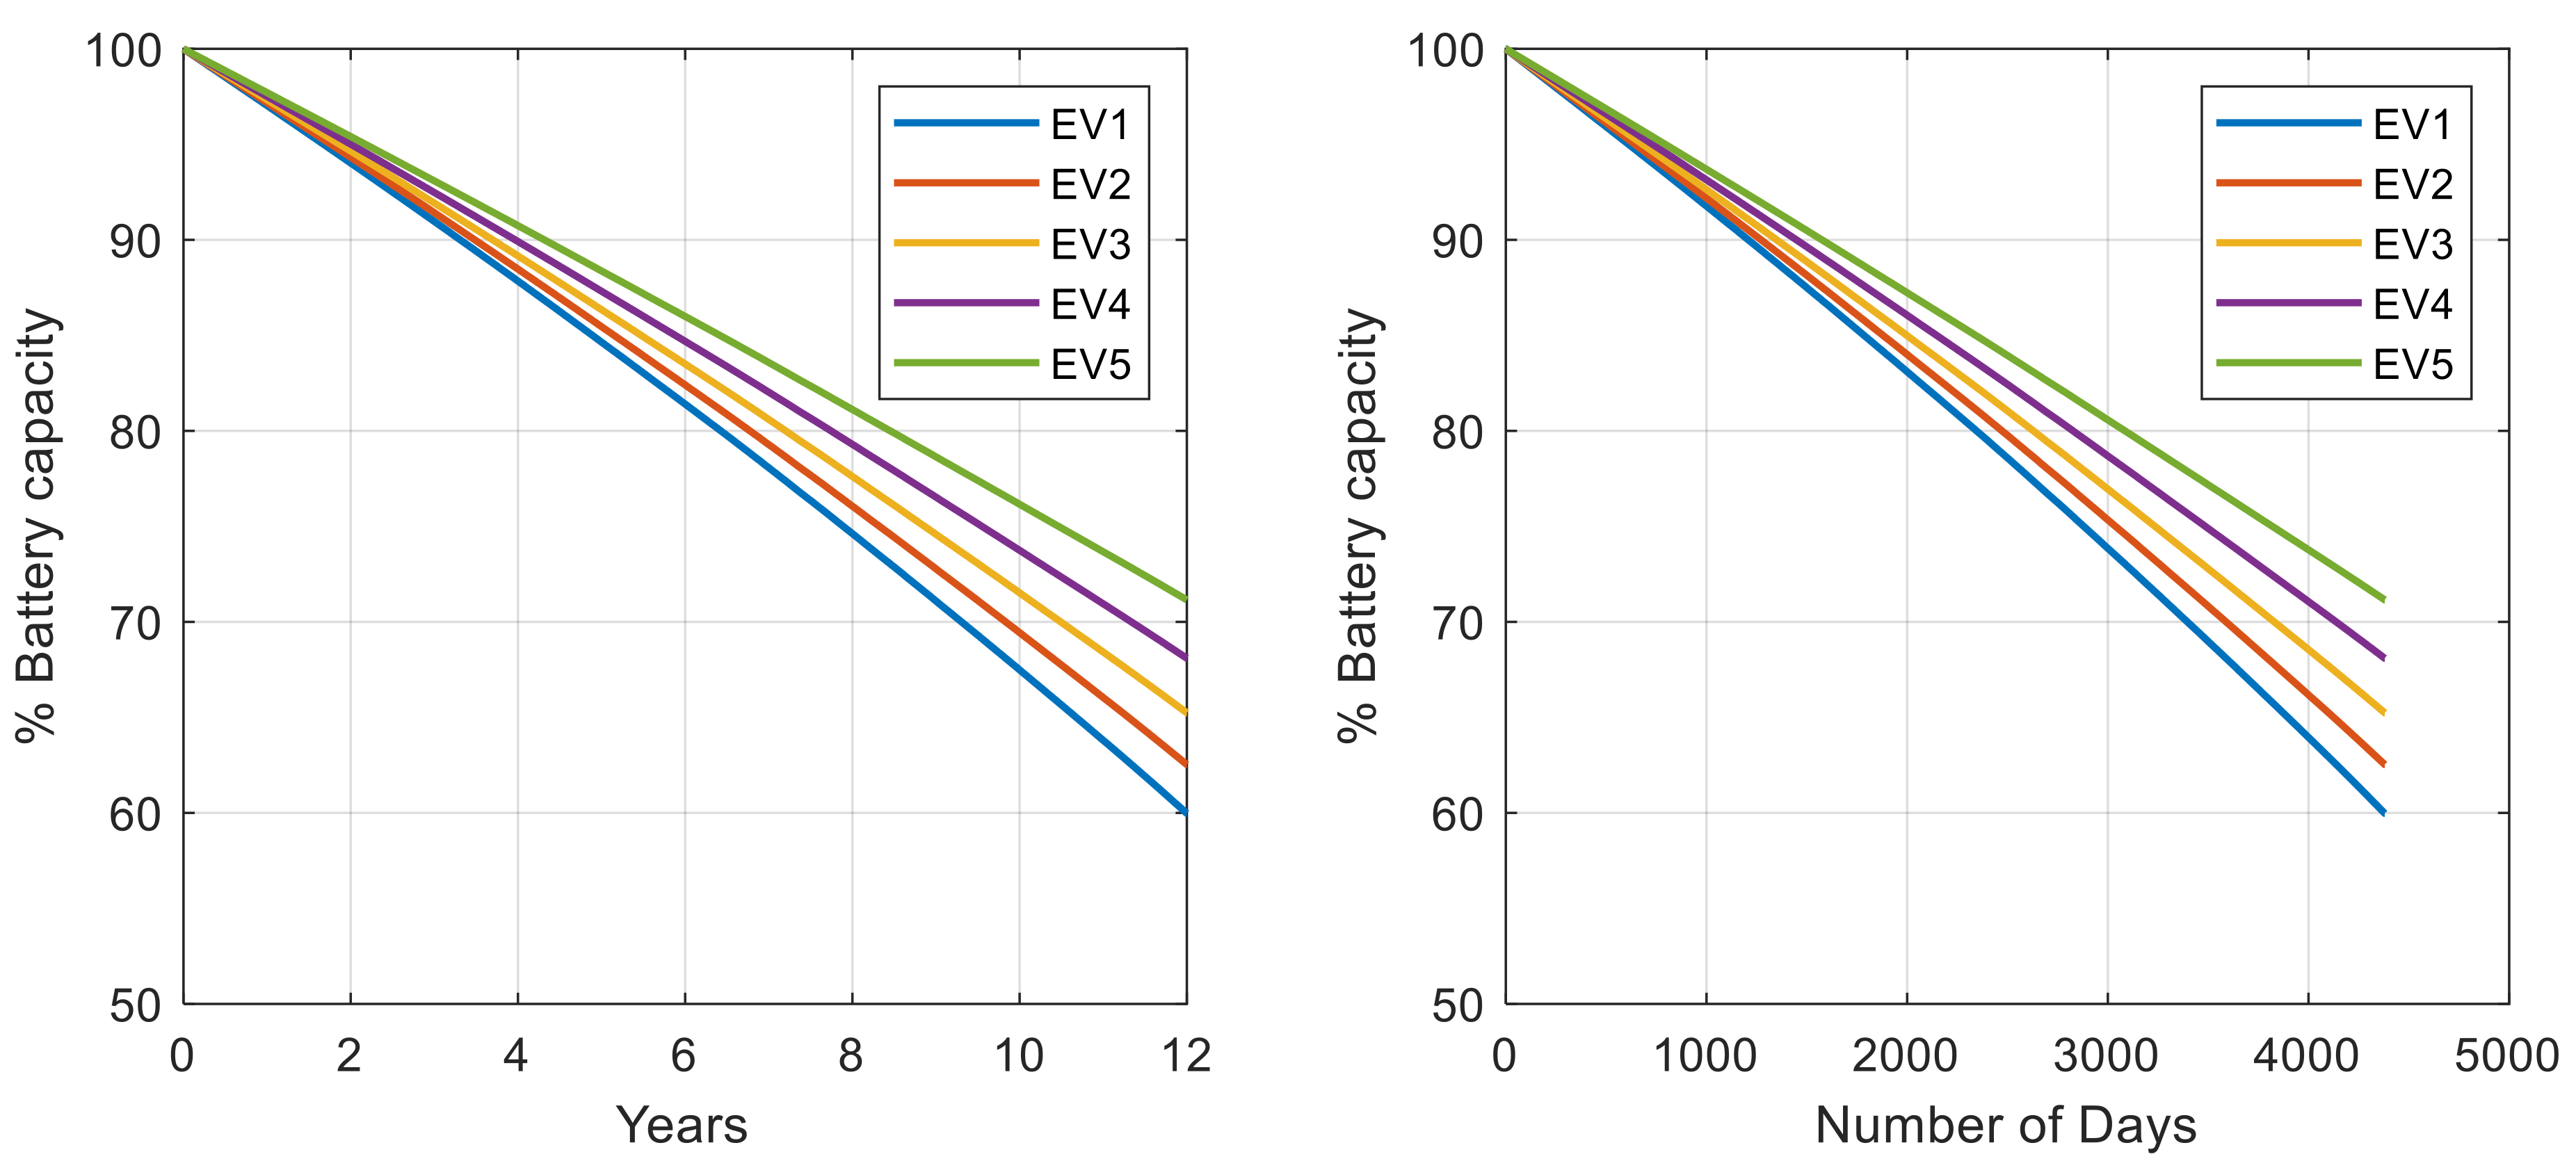
2.4. EV Battery Model and Degradation Cost

A vital element in the operational planning of MBESS is their operating cost, a majority of which comes from the degradation of MBESS cells subjected to repeated charge and discharge cycles, aging, and temperature effects. In this study, the generic model battery (Figure 1a) developed and verified within the Matlab/Simulink software environment [12,13,14] (Figure 1b) is used.
The controlled voltage source is described using Equation (3) below, and Vbatt = E − Ri.
E = E 0 K Q Q i d t + A e B i d t
E = no-load voltage in volts, E0 = battery constant voltage in volts, K = polarization voltage in volts, Q = battery capacity in Ah, i d t = actual battery charge in Ah, A = exponential zone amplitude in volts, B = exponential zone time constant inverse in (Ah)−1, Vbatt = battery voltage in volts, R = internal resistance in Ohms, and i = battery current in (amps). The model can accurately represent the behavior of many battery types, provided the parameters are well determined. The main feature of this battery model is that the parameters can be easily deduced from a manufacturer’s discharge curve and can be set to account for temperature and aging effects [12,13,14].
The degradation cost of the nth MBESS is then modeled using Equation (4) [8,15].
f b n = λ c e l l n × 10 6 2 K n S o C m a x n S o C m i n n b n t
In this equation λ c e l l n is the nth MBESS cell price ($/Wh). Kn is the number of cycles that the nth MBESS could be operated within.

2.5. Frequency Regulations

In addition to peak shaving, the MBESS is also used for frequency regulation market. A simplified version of the Pennsylvania, New Jersey, and Maryland (PJM) frequency regulation market [16] is used in this study. The revenue for providing frequency regulation service over time T is then defined by:
S = α c C T α mis T 0 T n = 1 N b n t C s t d t n = 1 N f ( b n )
In Equation (5), f(bn) is the operating cost of the MBESS and s(t) is the normalized frequency regulation signal. Compared with traditional frequency regulation signals, it has a much faster ramping rate and is designed to have a zero-mean within a certain time interval, which is well aligned with the characteristics of MBESS. Note that, for providing frequency regulation service, the grid operator pays a per-MW option fee αc to a resource withstand-by power capacity C for each hour. While during the frequency regulation procurement period, the resource is subjected to a per-MWh regulation mismatch penalty (αmis) for the absolute error between the instructed dispatch and the resource’s actual response [16].

2.6. Multi-objective Optimization

The EV batteries are used for load management (house load, building load, and powertrain) but also to provide frequency regulation (building grid side) service and peak shaving. These put several constrains on the EV owner which can be summarized as follows.
-
Minimize EV’s owner electricity bill
-
Such that
The gain from selling EV energy to building owner is maximized.
Minimize battery degradation thus minimize battery cost.
Keep SoC within SoCmin < SoC < SoCmax.
The objective on the building owner side is to reduce its electricity bill at any cost. Unfortunately, this can only be accomplished while taking into consideration EV owners and grid company requirements. Mathematically, this is described by Equation (6) and can be viewed as a multi-objective optimization problem with the goal of finding a middle ground where all the parties involved agree.
H m u l t i = m i n c n , b n c h t ,   b n d c t , y t , N H a α c T n = 1 N c n α m i n t = T 0 T | r t + n = 1 N b n t + y t n = 1 N C n s t | d t
Such   that :   b n t = b n d c t b n c h t n = 1 N c n 0 S o C m i n n S o C i n i n + τ t [ b τ η c b n d c η d ] d τ E S o C m a x n 0 b n c h t P m a x n 0 b n d c t P m a x n
Most of the constraints are on the EV owner side. On the building owner side, as in [8], the multi-objective optimization model should capture both the uncertainties of future demand r(t) and future frequency regulation signals s(t). The objective function in Equation (6) minimizes the total electricity cost of a commercial user for the next day, including the energy cost, peak demand charge, and EV battery degradation cost and frequency regulation service revenue. Unlike [8], optimization variables are considered at the EV level and are frequency regulation capacity cn of each EV, battery charging/discharging power b t n d c ,   b t n c h , of each EV, number of EVs connected at a given time t, and frequency regulation load baseline y(t). Participants in frequency regulation market should report a baseline y(t) to the grid operator ahead of their service time [16]. For a commercial user, the baseline y(t) is its load forecasting including the projected driving patterns of the EV owners. [T0 T] = time interval considered, αc = frequency regulation revenue, and αmin = frequency cost mismatch penalty.

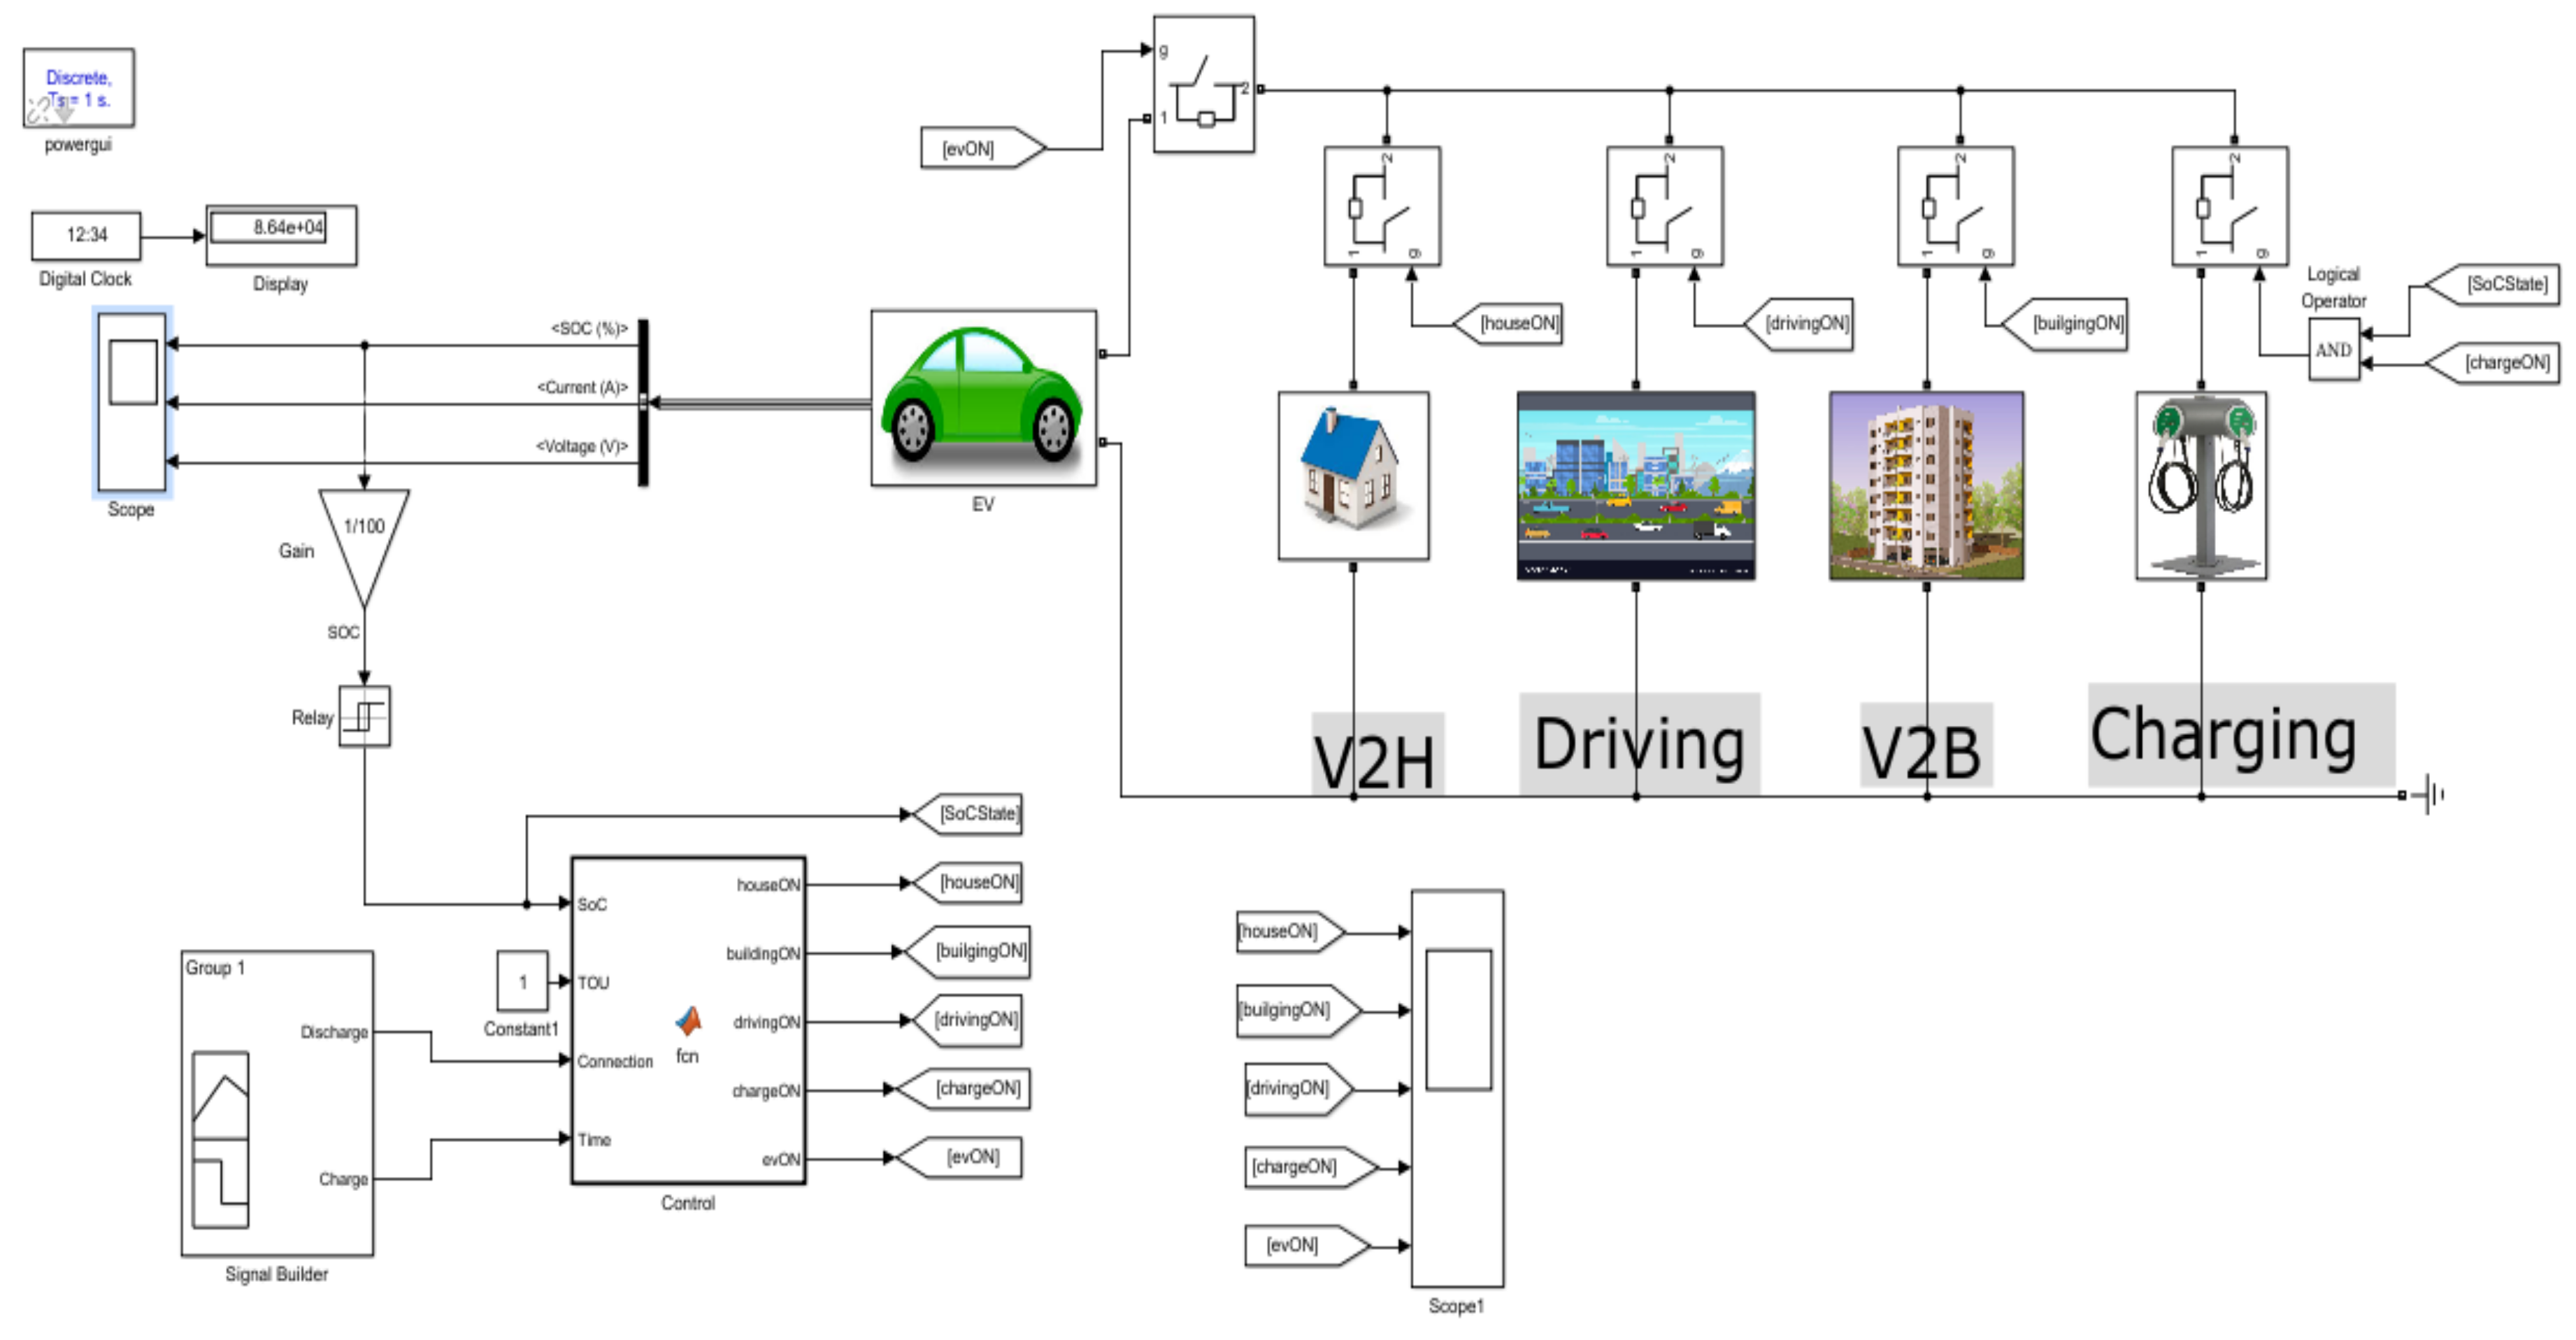
2.7. Simulation Strategy

For simulation purposes, several scenarios/hypotheses are considered: EV connection to the grid, EV driver’s behavior, and SoC operation limits. When the EV is used as stationary, the EV is at a parking lot and connected to the grid for peak shaving and frequency regulation, and the multi-objective optimization framework is applied. When the EV is used as mobile, it is not connected to the grid and it is being driven by its owner to go to work, to come back home, or to run some errands. When the EV is at home, it can be used for house load management, and the batteries get charged overnight every day during off-peak period, and leave every morning fully charged to the maximum defined SoC. The simulation in this study is based on the assumption of five EV users working at the same building with different driving profiles and SoC limits, EV1 = [10–90%], EV2 = [20–90%], EV3 = [30–90%], EV4 = [40–90%], and EV5 = [50–90%] = [SoCmin–SoCmax] providing the same ancillary services. The main difference of SoC usage ranges among the EV users results from the different driving profiles. The SoC limits are correlated to the driving distance to and from work for each EV user.

3. Results

In order to verify the proposed scenarios, a small residential building with an electricity consumption of 26 kWh/day, a commercial unit with an electricity consumption of 70 kWh/day and 5 EVs having a battery storage capacity of 24 kWh per EV has been utilized for simulation on battery degradation and electricity bill estimation. The results are obtained using Matlab/Simulink and can be applicable to any larger buildings with a fleet of EVs by multiplication and additional detailed adjustment. In this simulation work, it is assumed that a data centre or commercial building has 70 kWh power consumption with 10 kW peak power between 7:00 and 18:00 in a day.
The volatility of renewable energy poses uncontrollable fluctuations to the power generation in the electric grid; therefore, it is required to find and connect resources for providing ancillary services such as frequency and voltage regulations. A fleet of electric vehicles in the parking lot of a building during working hours can be connected to the electric grid for ancillary services. This simulation utilizes 5 EVs with different levels of SoC usage for the combination of frequency regulation and peak shaving as V2B/V2G application between 11:30 and 12:30 in a day.

3.1. EV Owner and Household Bill

For each EV user, a fixed driving profile over a period of 10+ years is hypothesized. The MBESS of the nth user can be used for household load, building load, and driving purposes. Figure 2 shows the Simulink schema.
Figure 3 shows the daily profile simulation of EV1, EV2, EV3, EV4, and EV5, respectively. As shown in Figure 3, every day from 11:30 to 12:30, all the EVs have the same depth of discharge (DoD) with 20% for selling the same amount of energy to the building owner (V2B) for ancillary services on the grid side. The rest of the day, EV discharging and charging profiles are different and correspond to the EV owner’s driving and charging patterns.
In each profile, at the first current spike, the daily battery cycling starts with a discharge current of 25 A (driving to work), at ambient temperature of 25 degrees C. The initial SoC (SoCmax = 90%) is same for each EV and its battery pack is discharged until the SoC reaches 65% (DoD of 35%), 70% (DoD of 30%), 75% (DoD of 25%), 80% (DoD of 20%), 85% (DoD of 15%), for EV1, EV2, EV3, EV4, and EV5, respectively.
The second current spike is related to the V2B application after each EV arrives at work and is connected to the DC fast charger of the parking lot of the building for ancillary services. For this period, the discharge current is 25 A and the SoC decreases down to 45% (DoD of 55%), 50% (DoD of 50%), 55% (DoD of 45%), 60% (DoD of 40%), 65% (DoD of 35%), for EV1, EV2, EV3, EV4, and EV5, respectively.
The third current spike is related to driving back home. The discharge current is 25A and the SoC decreases down to 20% (DoD of 80%), 30% (DoD of 70%), 40% (DoD of 60%), 50% (DoD of 50%), 60% (DoD of 40%), for EV1, EV2, EV3, EV4, and EV5, respectively.
The fourth current spike describes the V2H application after each EV arrives at home and is connected to the EV charger of the house for V2H applications. For this period, the discharge current is 25 A and the SoC decreases down to minimum SoCmin for each EV. That is: 10% (DoD of 90%), 20% (DoD of 80%), 30% (DoD of 70%), 40% (DoD of 60%), 50% (DoD of 50%), for EV1, EV2, EV3, EV4, and EV5, respectively.
Afterwards, the EV battery pack is charged back overnight to 90% SoC with a charge current of 15 A. As this cycle is repeated every day up to 12 years (12 × 365 = 4380 days), the battery age increases whereas its capacity decreases. Simulation of the battery degradation on ancillary services and driving over this period is shown in Figure 4. The deeper the depth of battery discharge is used, the more the battery degradation is pronounced. Short commute driving habit, EV5 with SoC within [50–90%] shows the lowest battery degradation.
Figure 5 shows the comparison of the original bill normalized to 1 with simulated bills after frequency regulation only, peak shaving only and combined peak shaving and frequency regulation, for each of the SoC operation range considered above.
Bill corresponds to the original bill normalized to 1. That is the home owner’s bill without ancillary services. Frequency regulation, peak shaving, and joint correspond to normalized bill when participating in frequency regulation, peak shaving, and both services respectively.

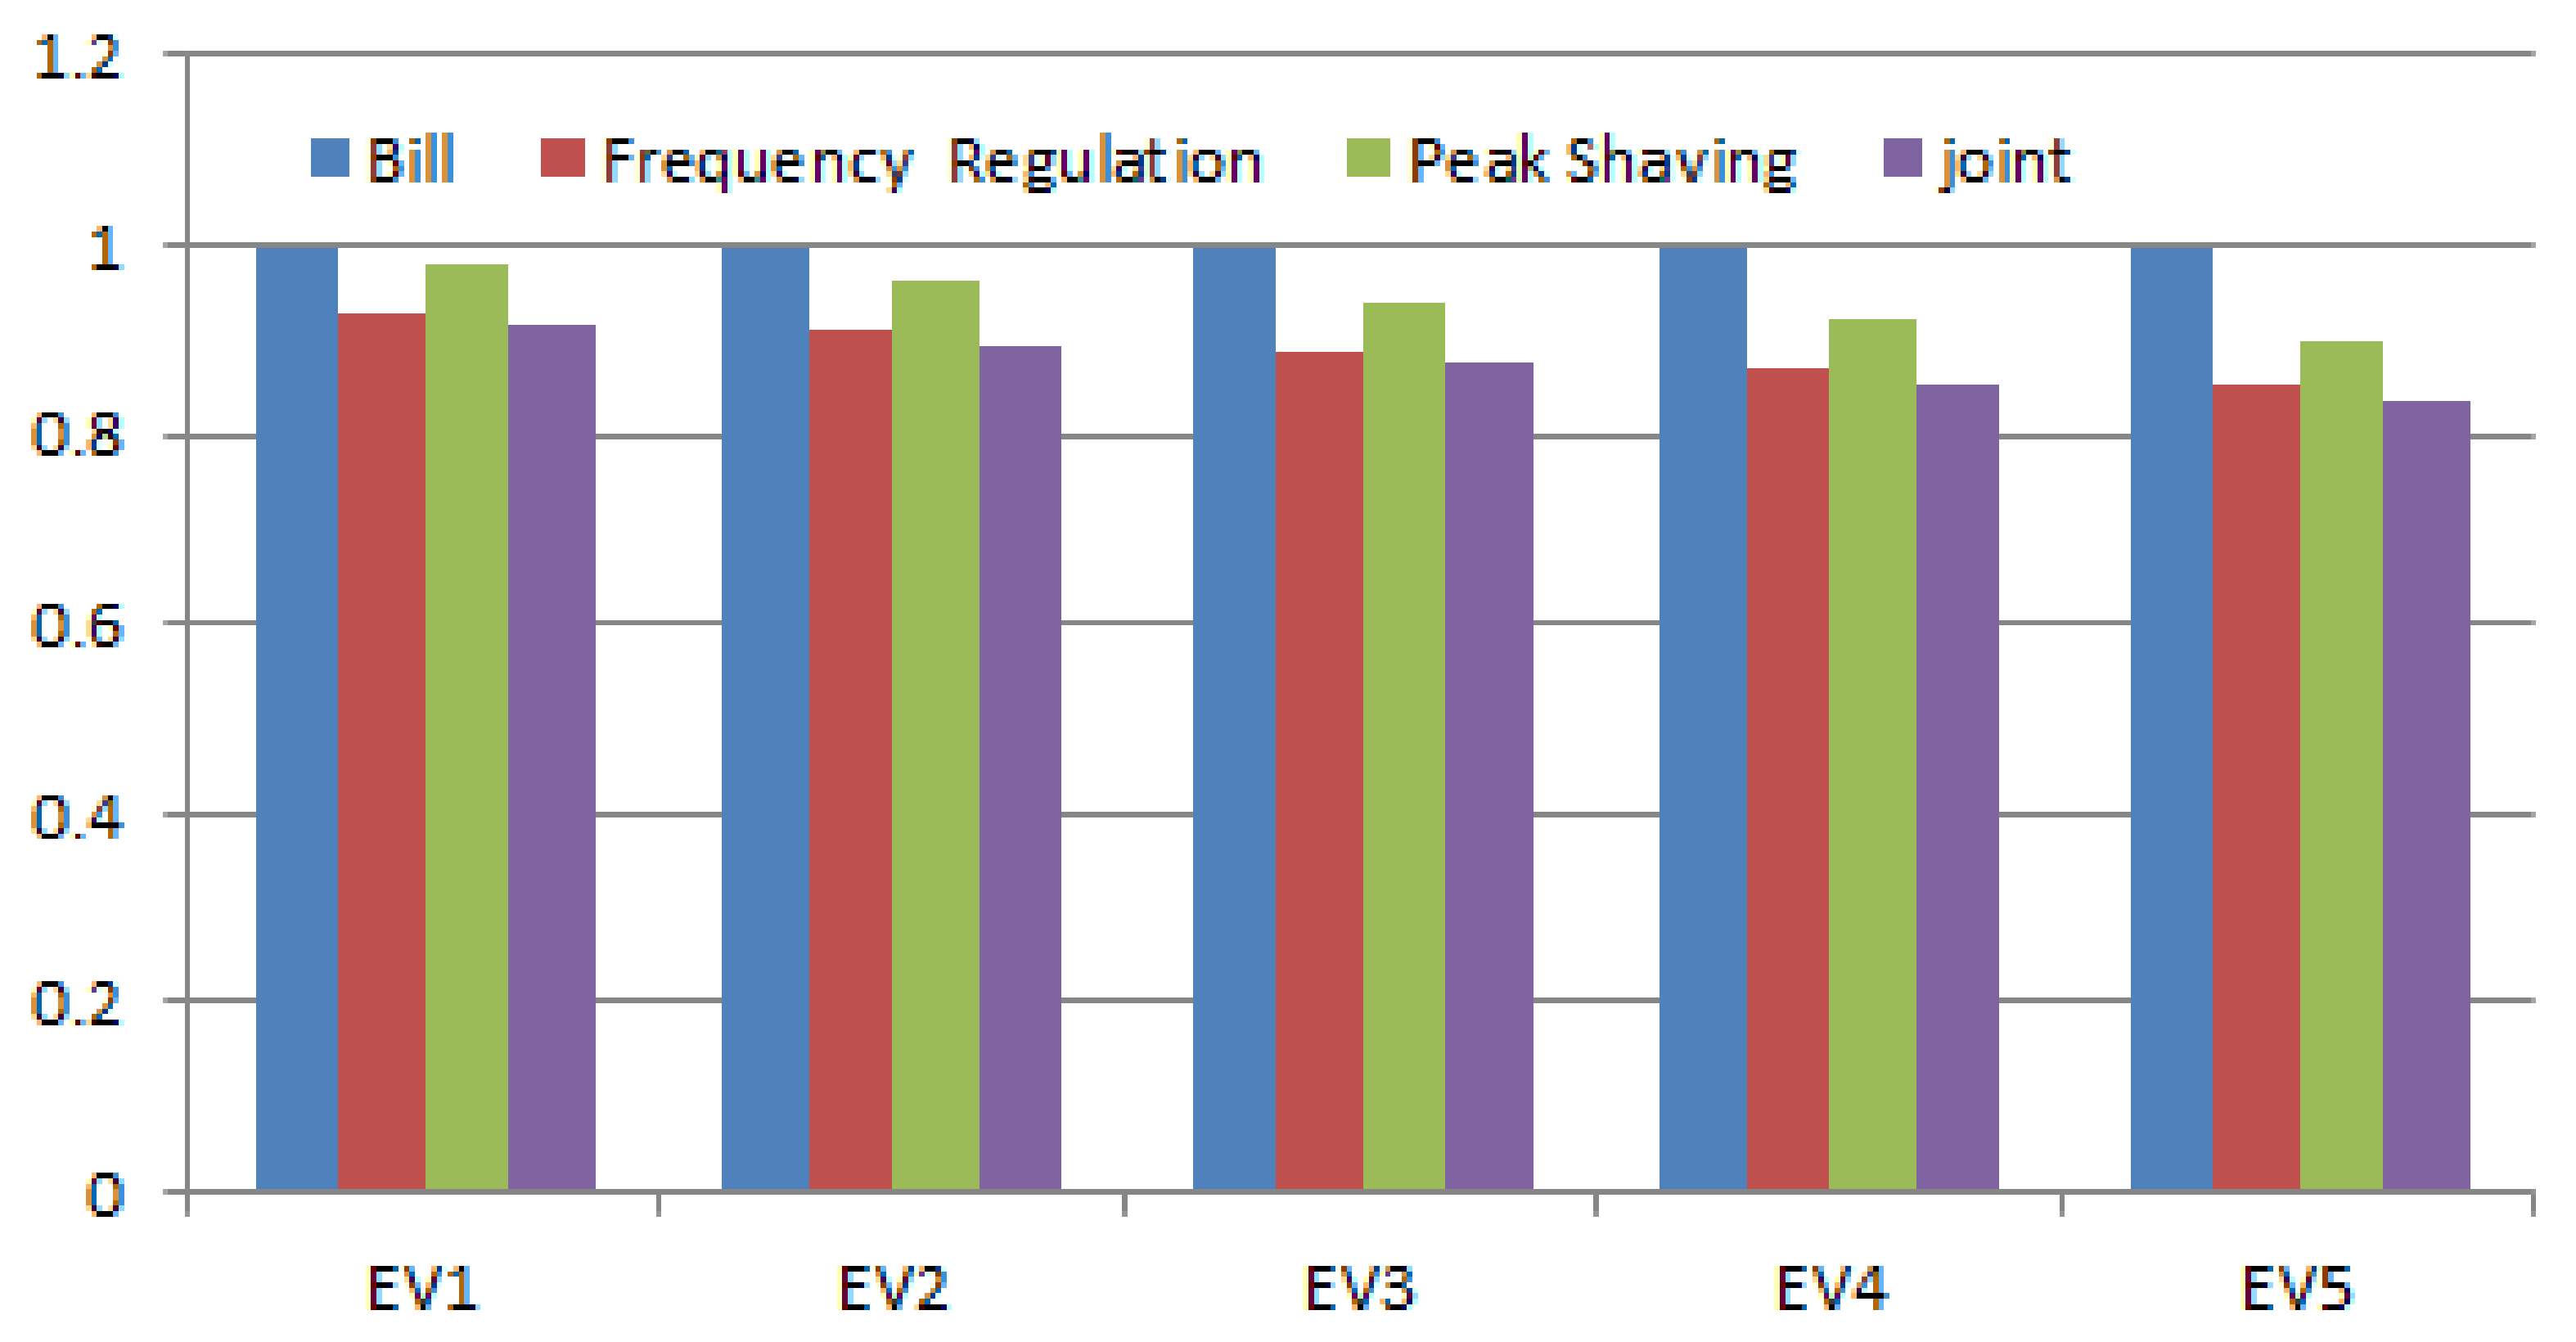
3.2. Electricity Bill for Building Owner

On the Building owner side, we assumed that the 5 EVs are connected during working hours, and provide a fix amount of power or battery capacity each day to the building owner for peak shaving and frequency regulations as shown in Figure 3. Figure 6 shows the Simulink schema and Figure 7 the simulation of bill saving under different scenarios.
Bill corresponds to the original bill normalized to 1. That is the building owner’s bill without ancillary services. Frequency regulation, peak shaving and joint correspond to normalized bill when participating in frequency regulation, peak shaving and both services, respectively.

4. Discussion

In this study the energy stored in EVs is used for peak shaving and frequency regulation in a vehicle-to-building/grid (V2B/V2G) application, but also for driving purpose at the same time, with the goal to study the effect of the different mentioned tasks on EV battery degradation and EV owner’s electricity bill. Although several studies have been carried out in this direction, mostly using stationary batteries [8], this study focuses on EV mobile batteries and contributes in significantly different ways. A multi-objective optimization framework for EV batteries to perform load management (building load and driving), peak shaving and frequency regulation services is proposed. This framework accounts for EV battery degradation, operational constraints, driving profiles, and regulation signals. Since the depth of discharge of EV battery pack increases when used for frequency regulation, peak shaving, and load management, the battery degradation plays an important role in determining their operations.
Here it is also shown that the V2B/V2G application of EVs can be beneficial when used for ancillary services and driving purpose, these results were obtained under certain strict conditions such as fixed driving patterns for EV owners, fixed battery cycling, fixed depth of discharge, and fixed SoC limits, which are not always the case in real life. In our future work, we would relax all these conditions, add more stochasticity in the EV owner’s driving behavior and also consider a fleet of vehicles more than five EVs.

5. Conclusions

In this study, the energy stored in EV batteries is used for V2B/V2G application. This energy was simultaneously used for power train, peak shaving, and frequency regulation. Simulation of these tasks on energy bill calculation and battery degradation via a combined multi-objective optimization strategy which captures battery state of charge, EV battery degradation, EV driving scenarios, and operational constraints. Under these constraints, the electricity usage/bill can be reduced and EV batteries can also achieve superior economic benefits under controlled state of charge limits and charge-discharge battery cycling. Under these assumptions, we showed that the electricity usage/bill can be reduced by a difference of 0.1 on a scale of 0 to 1 (with 1 the normalized original electricity cost), and that EV batteries can also achieve superior economic benefits under controlled SoC limits (e.g., when kept between the SoC range of SoCmin > 30% and SoCmax < 90%) and subjected to very restricted charge-discharge battery cycling.

Author Contributions

conceptualization, A.T. and Y.Y.; methodology, A.T. and Y.Y.; software, A.T. and Y.Y.; validation, A.T. and Y.Y.; formal analysis, A.T. and Y.Y.; investigation, A.T. and Y.Y.; writing—original draft preparation, A.T.; writing—review and editing, Y.Y.; project administration, Y.Y.; funding acquisition, Y.Y. All authors have read and agreed to the published version of the manuscript.

Funding

This work was financially supported by the NRC’s Vehicle Propulsion Technology (VPT) Program and by Natural Resources Canada (NRCan) through the Program of Energy Research and Development (PERD).

Acknowledgments

The authors acknowledge financial support from the NRC’s Vehicle Propulsion Technology (VPT) Program and Natural Resources Canada (NRCan) through the Program of Energy Research and Development (PERD).

Conflicts of Interest

The authors declare no conflict of interest.

References

  1. Electric Vehicle Outlook 2017; Bloomberg New Energy Finance: New York, NY, USA, 2017.
  2. Pike Research Report on Vehicle to Building Technologies; Pike Research: Pikes Peak, CL, USA, 2012.
  3. Motors, T. Tesla Model S Specifications. Available online: https://www.teslamotors.com/en_CA/support/model-s-specifications (accessed on 30 September 2015).
  4. Walawalkar, R.; Apt, J.; Mancini, R. Economics of electric energy storage for energy arbitrage and regulation in New York. Energy Policy 2007, 35, 2558–2568. [Google Scholar] [CrossRef]
  5. White, C.D.; Zhang, K.M. Using vehicle-to-grid technology for frequency regulation and peak-load reduction. J. Power Sources 2011, 196, 3972–3980. [Google Scholar] [CrossRef]
  6. Xi, X.; Sioshansi, R.; Marano, V. A stochastic dynamic programming model for co-optimization of distributed energy storage. Energy Syst. 2014, 5, 475–505. [Google Scholar] [CrossRef]
  7. Cheng, B.; Powell, W. Co-optimizing battery storage for the frequency regulation and energy arbitrage using multi-scale dynamic programming. IEEE Trans. Smart Grid 2018, 9, 1997–2005. [Google Scholar] [CrossRef]
  8. Shi, Y.; Xu, B.; Wang, D. Zhang, B. Using battery storage for peak shaving and frequency regulation: Joint optimization for superlinear gains. arXiv 2017, arXiv:1702.08065v3. [Google Scholar]
  9. Intro to Demand Charge Management. Available online: https://www.civicsolar.com (accessed on 12 March 2019).
  10. Sigrist, L.; Lobato, E.; Rouco, L. Energy storage systems providing primary reserve and peak shaving in small isolated power systems: An economic assessment. Int. J. Electr. Power Energy Syst. 2013, 53, 675–683. [Google Scholar] [CrossRef]
  11. Caprino, D.; Della Vedova, M.L.; Facchinetti, T. Peak shaving through real-time scheduling of household appliances. Energy Build. 2014, 75, 133–148. [Google Scholar] [CrossRef]
  12. Matlab Generic Battery Model. Available online: https://www.mathworks.com/help/physmod/sps/powersys/ref/battery.html (accessed on 11 October 2019).
  13. Tremblay, O.; Dessaint, L.-A.; Dekkiche, A.-I. A Generic Battery Model for the Dynamic Simulation of Hybrid Electric Vehicles. In Proceedings of the 2007 IEEE Vehicle Power and Propulsion Conference, Arlington, TX, USA, 9–13 September 2007. [Google Scholar]
  14. Omar, N.; Monem, M.A.; Firouz, Y.; Salminen, J.; Smekens, J.; Hegazy, O.; Gaulous, H.; Mulder, G.; Bossche, P.V.D.; Coosemans, T.; et al. Lithium iron phosphate based battery—Assessment of the aging parameters and development of cycle life model. Appl. Energy 2014, 113, 1575–1585. [Google Scholar] [CrossRef]
  15. Guo, Y.; Fang, Y. Electricity Cost Saving Strategy in Data Centers by Using Energy Storage. IEEE Trans. Parallel Distrib. Syst. 2012, 24, 1149–1160. [Google Scholar] [CrossRef]
  16. Xu, B.; Dvorkin, Y.; Kirschen, D.S.; Silva-Monroy, C.A.; Watson, J.-P. A comparison of policies on the participation of storage in US. frequency regulation markets. In Proceedings of the Power and Energy Society General Meeting (PESGM), Boston, MA, USA, 17–21 July 2016. [Google Scholar]
Figure 1. Generic Matlab/Simulink battery model with temperature and aging (equivalent full cycle) effects.
Wevj 11 00014 g001
Figure 2. Vehicle-to-X (V2X) Simulink model in a 24 h period.
Wevj 11 00014 g002
Figure 3. Daily 24 h profile of electric vehicles (EVs) with state of charge (SoC) limits: EV1 = [10–90%], EV2 = [20–90%], EV3 = [30–90%], EV4 = [40–90%], and EV5 = [50–90%].
Wevj 11 00014 g003
Figure 4. Battery degradation for various driving patterns and SoC limits: EV1 = [10–90%], EV2 = [20–90%], EV3 = [30–90%], EV4 = [40–90%], and EV5 = [50–90%].
Wevj 11 00014 g004
Figure 5. Comparative analysis of the original bill normalized to 1 corresponding to bill without ancillary services and others with bills after peak shaving, frequency regulation, combination of peak shaving and frequency regulation, under different SoC limits: Electricity bills to be paid by EV owners after reflecting reimbursement for ancillary services.
Wevj 11 00014 g005
Figure 6. Simulink model for building owner.
Wevj 11 00014 g006
Figure 7. Comparative analysis of the original bill normalized to 1 corresponding to bill without ancillary services and others with bills after peak shaving, frequency regulation, combination of peak shaving and frequency regulation, under different SoC limits: Electricity bill for building owner.
Wevj 11 00014 g007
Table 1. List of variables used in this study and their definitions.
NotationsDefinitions
HDaily electricity bill in $
HelectDaily off-peak electricity bill in $
HpeakDaily on-peak electricity bill in $
HaAdjusted electricity bill after peak shaving
αelecenergy price in $/MWh
αpeakpeak demand price in $/MW
r(t)power consume at time t
rpeakpower consume during peak hours
bn(t)Energy store in the nth battery
b ¯ n(t)The average power injection of the nth battery
NNumber of EVs
λ c e l l n is the nth MBESS cell price $/Wh
KnNumber of cycles that the nth MBESS could be operated within
s(t)The normalized frequency regulation signal
αcFrequency regulation revenue
αmisFrequency cost mismatch penalty
CPower capacity
SoCminMin State of Charge
SoCtCurrent State of Charge
SoCmaxMax State of Charge
cnFrequency regulation capacity of each EV
b t n c h Battery charging of the nth EV
b t n d c Discharging power of the nth EV
y(t)Frequency regulation load baseline
P m a x n Battery capacity power of the nth EV

