Abstract
When the pure electric mining dump truck is working, it mainly ascends the slope at full load and descends the slope at no load. The loading state of the vehicle and the slope of the road will directly affect its axle load distribution and braking force distribution. In this paper, the slope dynamics analysis of the pure electric double-axle four-wheel drive mining dump truck was carried out. Based on the regenerative braking priority strategy, four regenerative braking control methods were developed based on the Matlab/Simulink platform and ADVISOR 2002 vehicle simulation software to study the ability of regenerative braking energy recovery and its impact on vehicle economic performance. The simulation results show that the regenerative braking priority control strategy used can maximize the regenerative braking force of the vehicle; the regenerative energy recovery capability of pure electric mining dump truck is proportional to the regenerative braking force that can be provided during braking; the two-axis braking strategy based on the I curve and the β line can make full use of the front and rear axle regenerative braking force when the braking intensity is large, and recover more braking energy; under road drive cycle, the single-axis braking force required to the braking strategy based on the maximized front axle braking force is the largest among all strategies, the motor braking efficiency is the highest, and the recovered braking energy is the most. For the studied drive cycle, the regenerative braking technology can reduce the vehicle energy consumption by 1.06%–1.56%. If appropriate measures are taken to improve the road surface condition and reduce the rolling resistance coefficient from f = 0.04 to f = 0.02, the regenerative braking technology can further reduce the vehicle energy consumption to 4.76%–5.73%. The economic performance of the vehicle is improved compared to no regenerative braking. In addition, the vehicle loading state and the driving motor working efficiency also directly affect the regenerative braking energy recovery capability of the pure electric mining truck.
1. Introduction
Pure electric mining dump truck (pure electric mining truck) is fully driven by electricity which is supplied by on-board batteries or power wiring. It does not need to burn diesel oil, and can recover regenerative braking energy when braking with high efficiency and no pollution. The traditional electric wheel mining dump truck adopts diesel-electric drive technology. When driving, the chemical energy is converted into mechanical energy by the diesel engine to drive the generator to generate electric energy to be transmitted to the motor to drive the wheels to rotate. When braking, the vehicle kinetic energy is transmitted from the wheel to the motor. The electric motor acts as a generator to convert the braking energy into electrical energy and then it is converted to heat by the braking resistor [1]. Regenerative braking is an important feature of pure electric mining trucks that distinguish traditional mining trucks. When braking, the drive motor is switched to the power generation state to generate the braking torque. The vehicle kinetic energy is recovered and stored in the vehicle energy system, which has a significant effect on improving the driving range and economic performance of the vehicle [2].
There are many studies on regenerative braking of pure electric vehicles [3,4,5,6,7,8,9,10,11,12,13], hybrid vehicles [14,15], electric buses [16,17] or electric light trucks [18]. However, there are few studies on regenerative braking of pure electric mining dump trucks. The existing literatures basically take a single-axis driven vehicle as the research object [3,4,5,6,7,8,9,10,14,15], and analyzes it based on the horizontal road driving mechanics model [3,5,6,7], ignoring the vehicle wind resistance, rolling resistance and slope resistance during driving. These resistances, especially the rolling resistance and slope resistance, are often not negligible for large-load mining dump trucks. In this paper, a self-weight 45 t with full load 100 t pure electric double-axle four-wheel drive mining dump truck is taken as the research object. Through the vehicle slope dynamics analysis, the front and rear axle load and braking force distribution models are established. The regenerative braking priority control strategy is adopted to establish four regenerative braking strategies: Based on vehicle speed, I-curve, β-line and front axle braking force maximization. The characteristics of regenerative energy recovery storage control are studied on the Matlab/Simulink platform combined with the vehicle simulation software ADVISOR 2002.
2. Principle Analysis of Regenerative Braking Control System
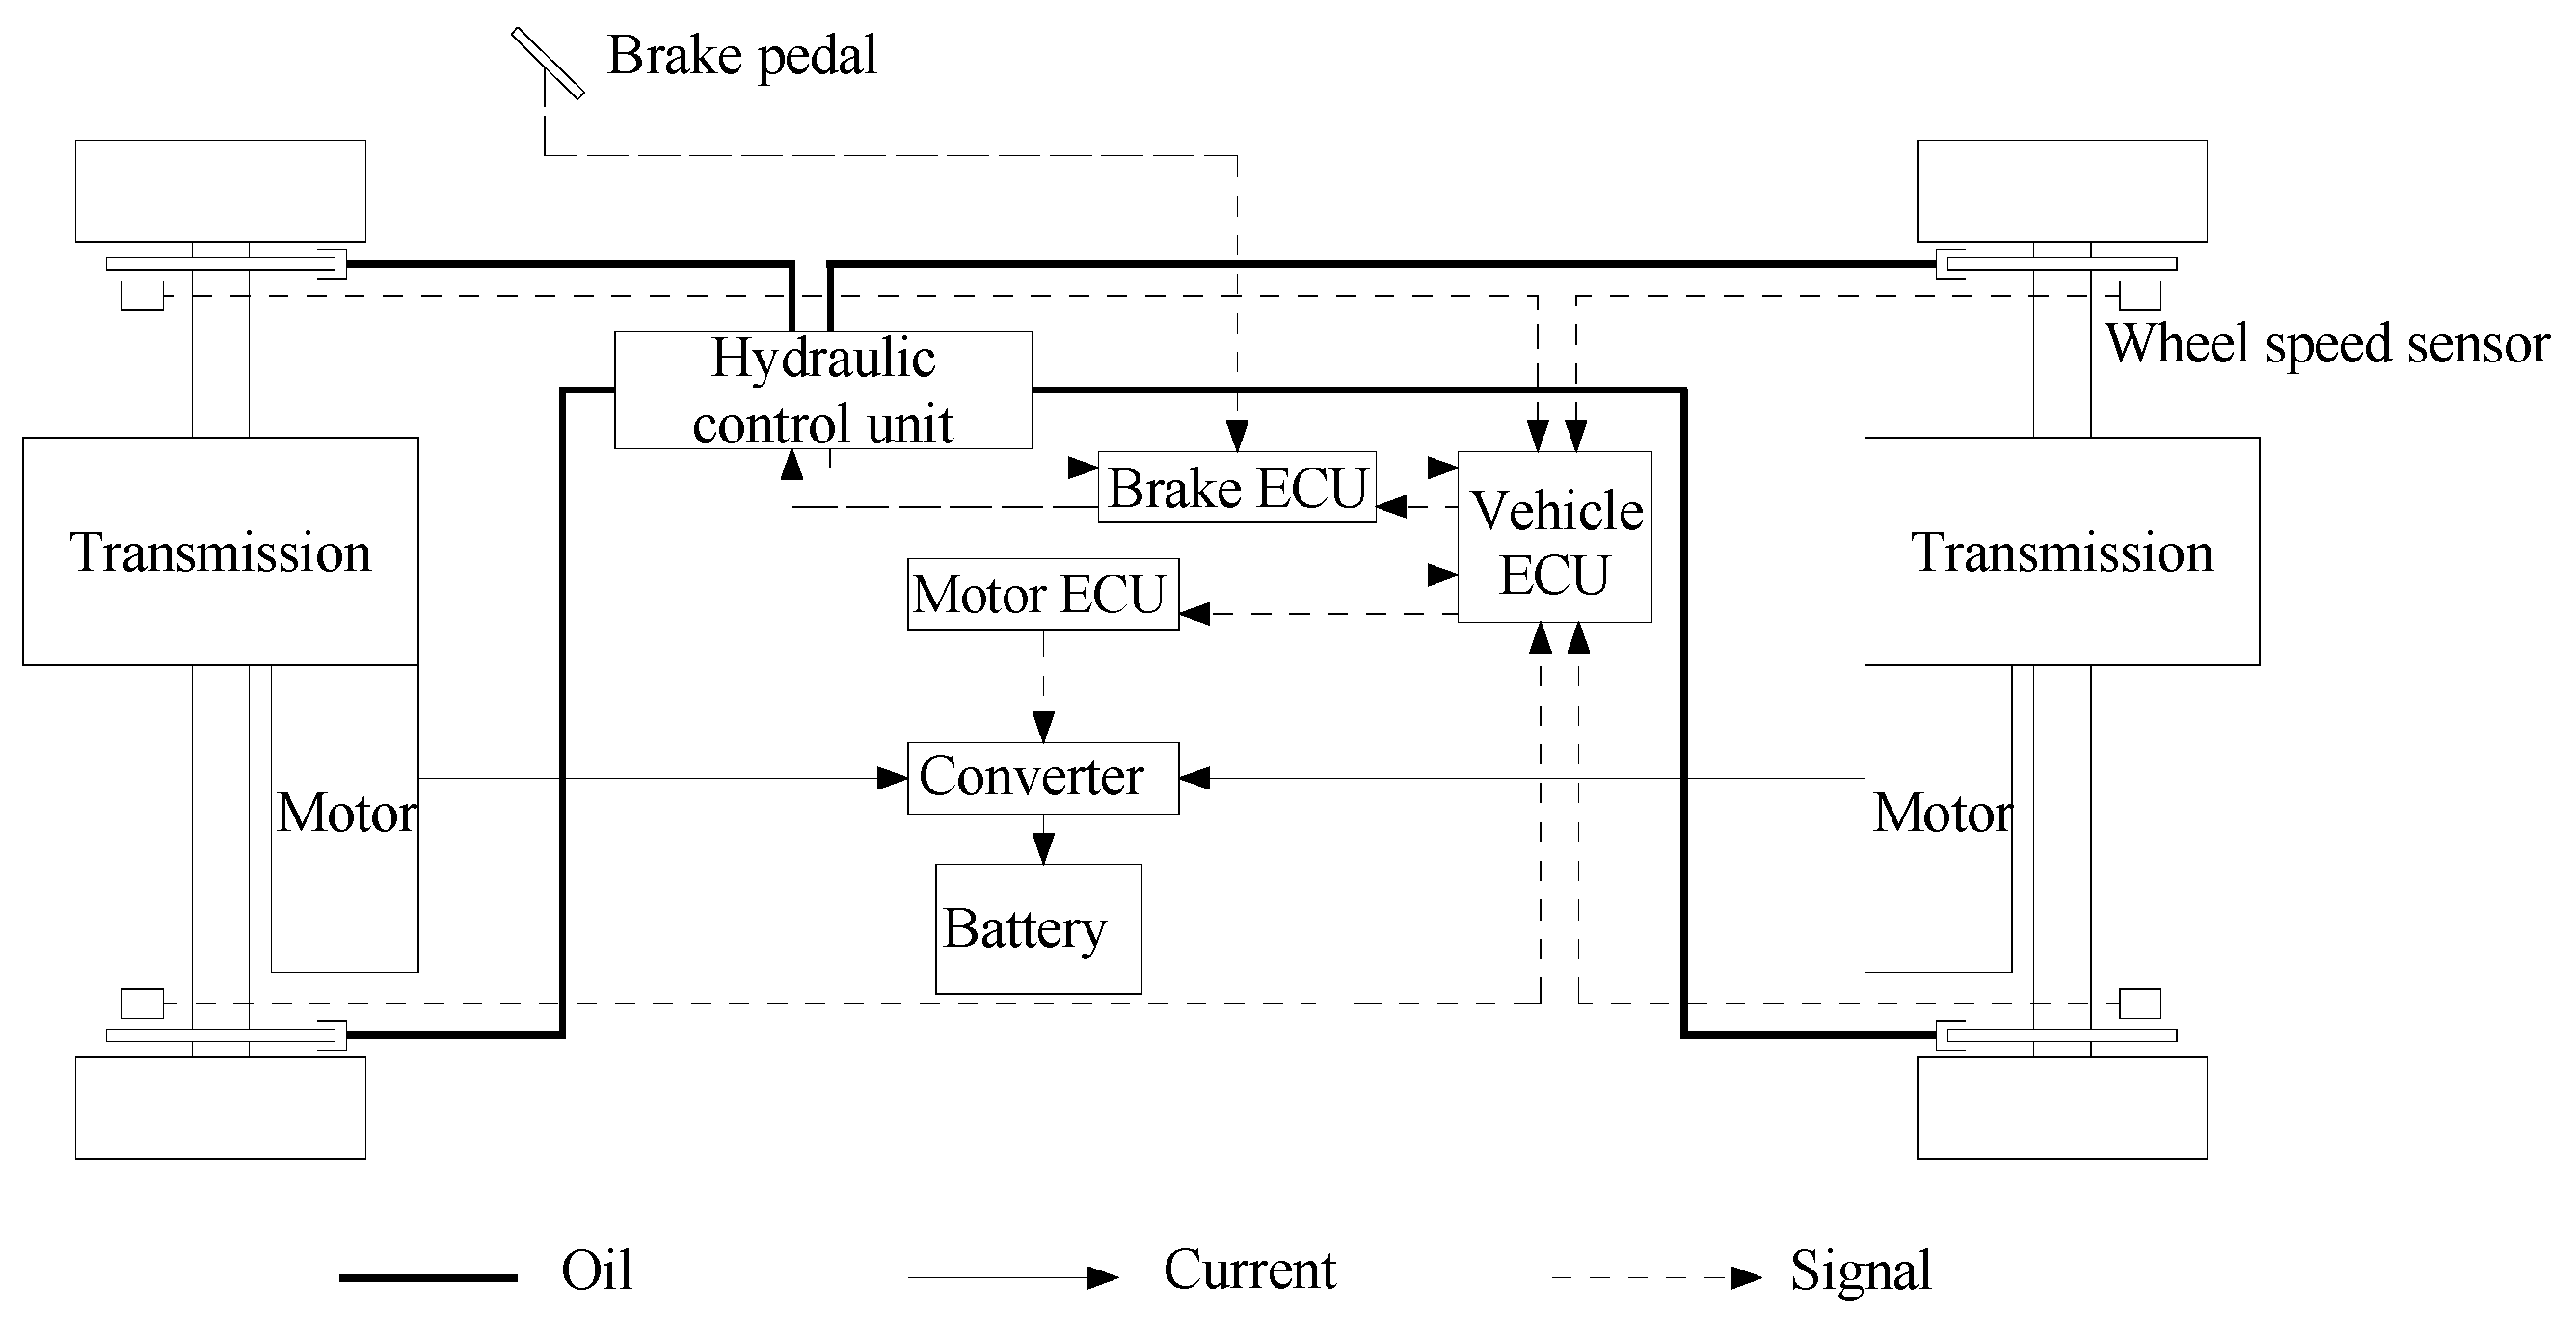
In order to ensure the stability and safety of the brake, the pure electric mining truck brake control system studied in this paper keeps the mechanical brake system [19] and adds the regenerative brake system on the front and rear axles, as shown in Figure 1. During braking, the brake ECU calculates the braking force demand according to the brake pedal signal and transmits it to the vehicle ECU. The vehicle ECU performs regenerative brake through the motor ECU, and feedbacks the regenerative braking force to the brake ECU. The brake ECU compares the required braking force with the regenerative braking force, determines the magnitude of the friction braking force, and adjusts the hydraulic pressure to achieve compound braking of regenerative braking and friction braking.

Figure 1.
Regenerative braking control system.
3. System Model and Control Strategy
3.1. Drive Motor, Battery and Regenerative Braking Force Model
The drive motor and battery parameters directly determine the vehicle’s regenerative braking force and regenerative energy recovery and storage capacity [20].
3.1.1. Drive Motor Mechanics Model
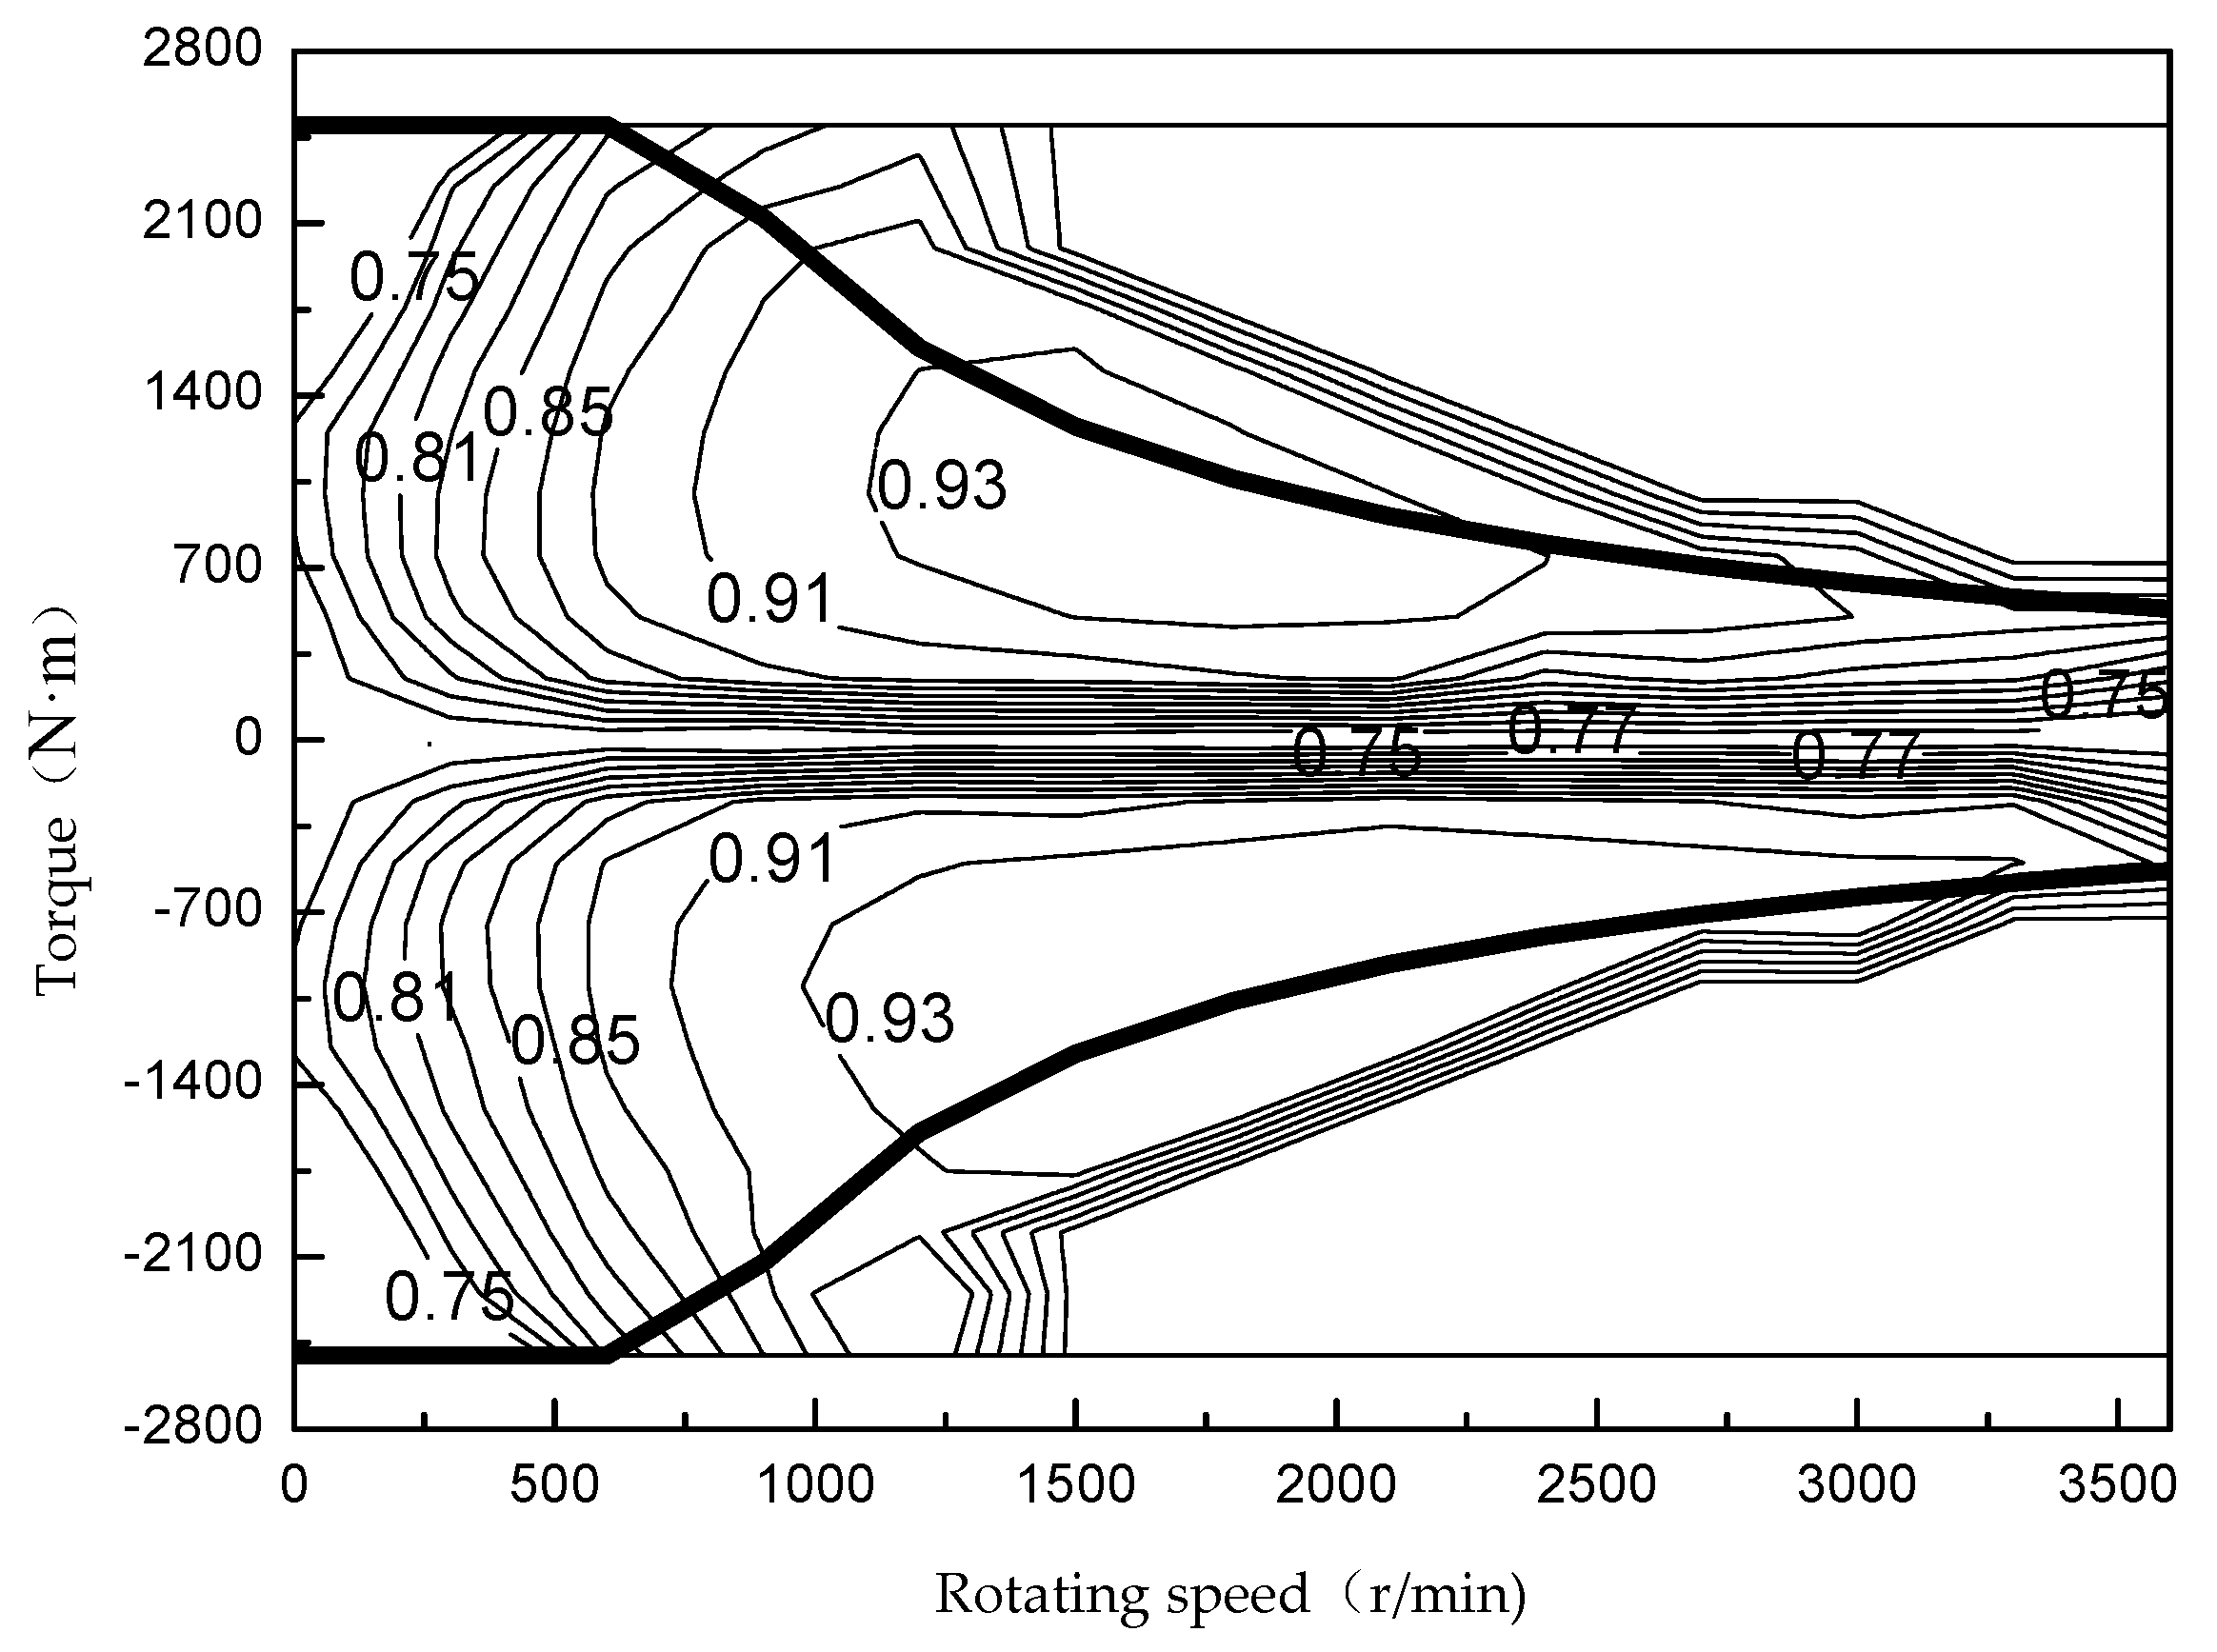
The maximum torque that the motor can provide at a certain speed is determined by the external characteristics of the motor. The rated power of the motor and the base speed of the motor determine the power characteristics of the motor. In this paper, the permanent magnet synchronous motor is used, the maximum speed is 3600 r/min, and the torque-speed relationship curve is shown in Figure 2. The positive part of the torque indicates the drive, and the negative part indicates the brake.

Figure 2.
Motor characteristic curve.
When the motor is working, whether it is in driving or braking operation, there will be power loss due to iron loss, copper loss and friction loss. This loss can be measured on the motor test bench. The specific method is to let the motor run stably at a certain angular velocity and torque, and measure the power of the motor, so that the relationship between the motor efficiency and the angular velocity and torque of the motor can be obtained, as shown in Figure 2.
When the motor speed is lower than the base speed , the constant torque is maintained, and the power is proportional to the speed; when the motor speed is above the base speed, the constant power is maintained, and the output torque decreases as the speed increases:
where is the maximum torque that the motor can provide; is the rated torque of the motor; is the rated power of the motor; is the angular velocity.
From Figure 2, we can clearly see that when the motor rotates at a certain speed, whether it is the driving state or the braking state, when the motor torque is too small, and the motor operating point will fall in the low efficiency region of the figure. At this time, the motor efficiency is low.
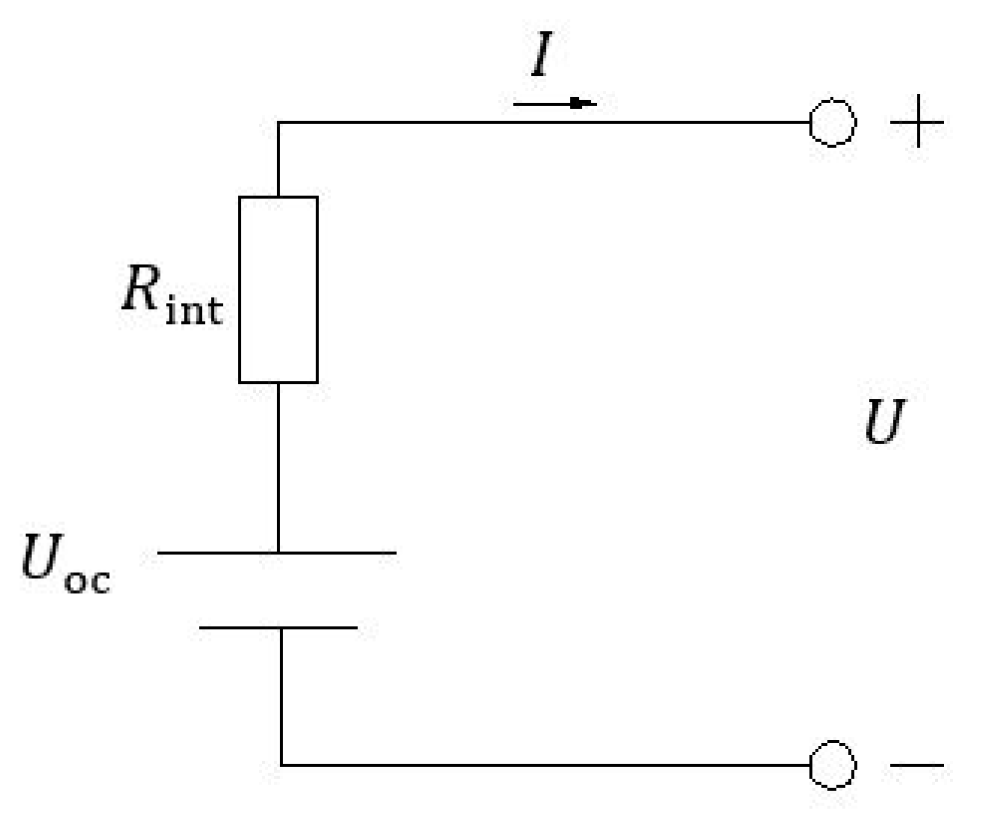
3.1.2. Battery Model
Lithium batteries are currently the most mature energy devices available for pure electric vehicles. The truck uses a large-capacity lithium iron phosphate battery (LiFePO4), rated voltage 2.7 V, AC internal resistance ≤ 0.7 mΩ, capacity 100 Ah, weight 3.15 ± 0.1 Kg. Figure 3 shows its internal resistance model.

Figure 3.
Battery internal resistance model.
During regenerative braking, the relationship between battery charging power , motor charging power , battery charging current , battery resistance , and vehicle accessory power is:
In the above formula, the power generated by the motor should be less than the sum of the allowable charging power of the battery and the power loss of all accessories and circuit lines. When the battery is fully charged, if the output power is negative (charging), limit the battery charging power to zero, do not charge the battery. The vehicle brake is realized by mechanical braking or energy consumption braking.
3.1.3. Regenerative Braking Force Model
When the vehicle brake speed is low or the wheel is locked, the motor has a small electromotive force due to the low motor speed, which is insufficient to charge the battery. In order to prevent the back electromotive force from being too small at low speeds to provide sufficient regenerative braking force, mechanical friction braking should be used. Therefore, for reliable braking, the speed influence factor [21] is introduced. At the same time, in order to prevent overcharging of the battery, it is necessary to consider the influence of the battery SOC. This paper assumes that the maximum allowable charging power and charging current of the battery can meet the actual generating current and generating power of the motor. The regenerative braking torque that the motor can generate during regenerative braking is:
where is the braking torque that the motor can provide, the regenerative braking force that the motor can provide at the axle is:
where is the axle braking force that the motor can provide; is the main reducer ratio; is the transmission ratio; is the transmission system efficiency; is the wheel radius.
3.2. Vehicle Dynamics Model
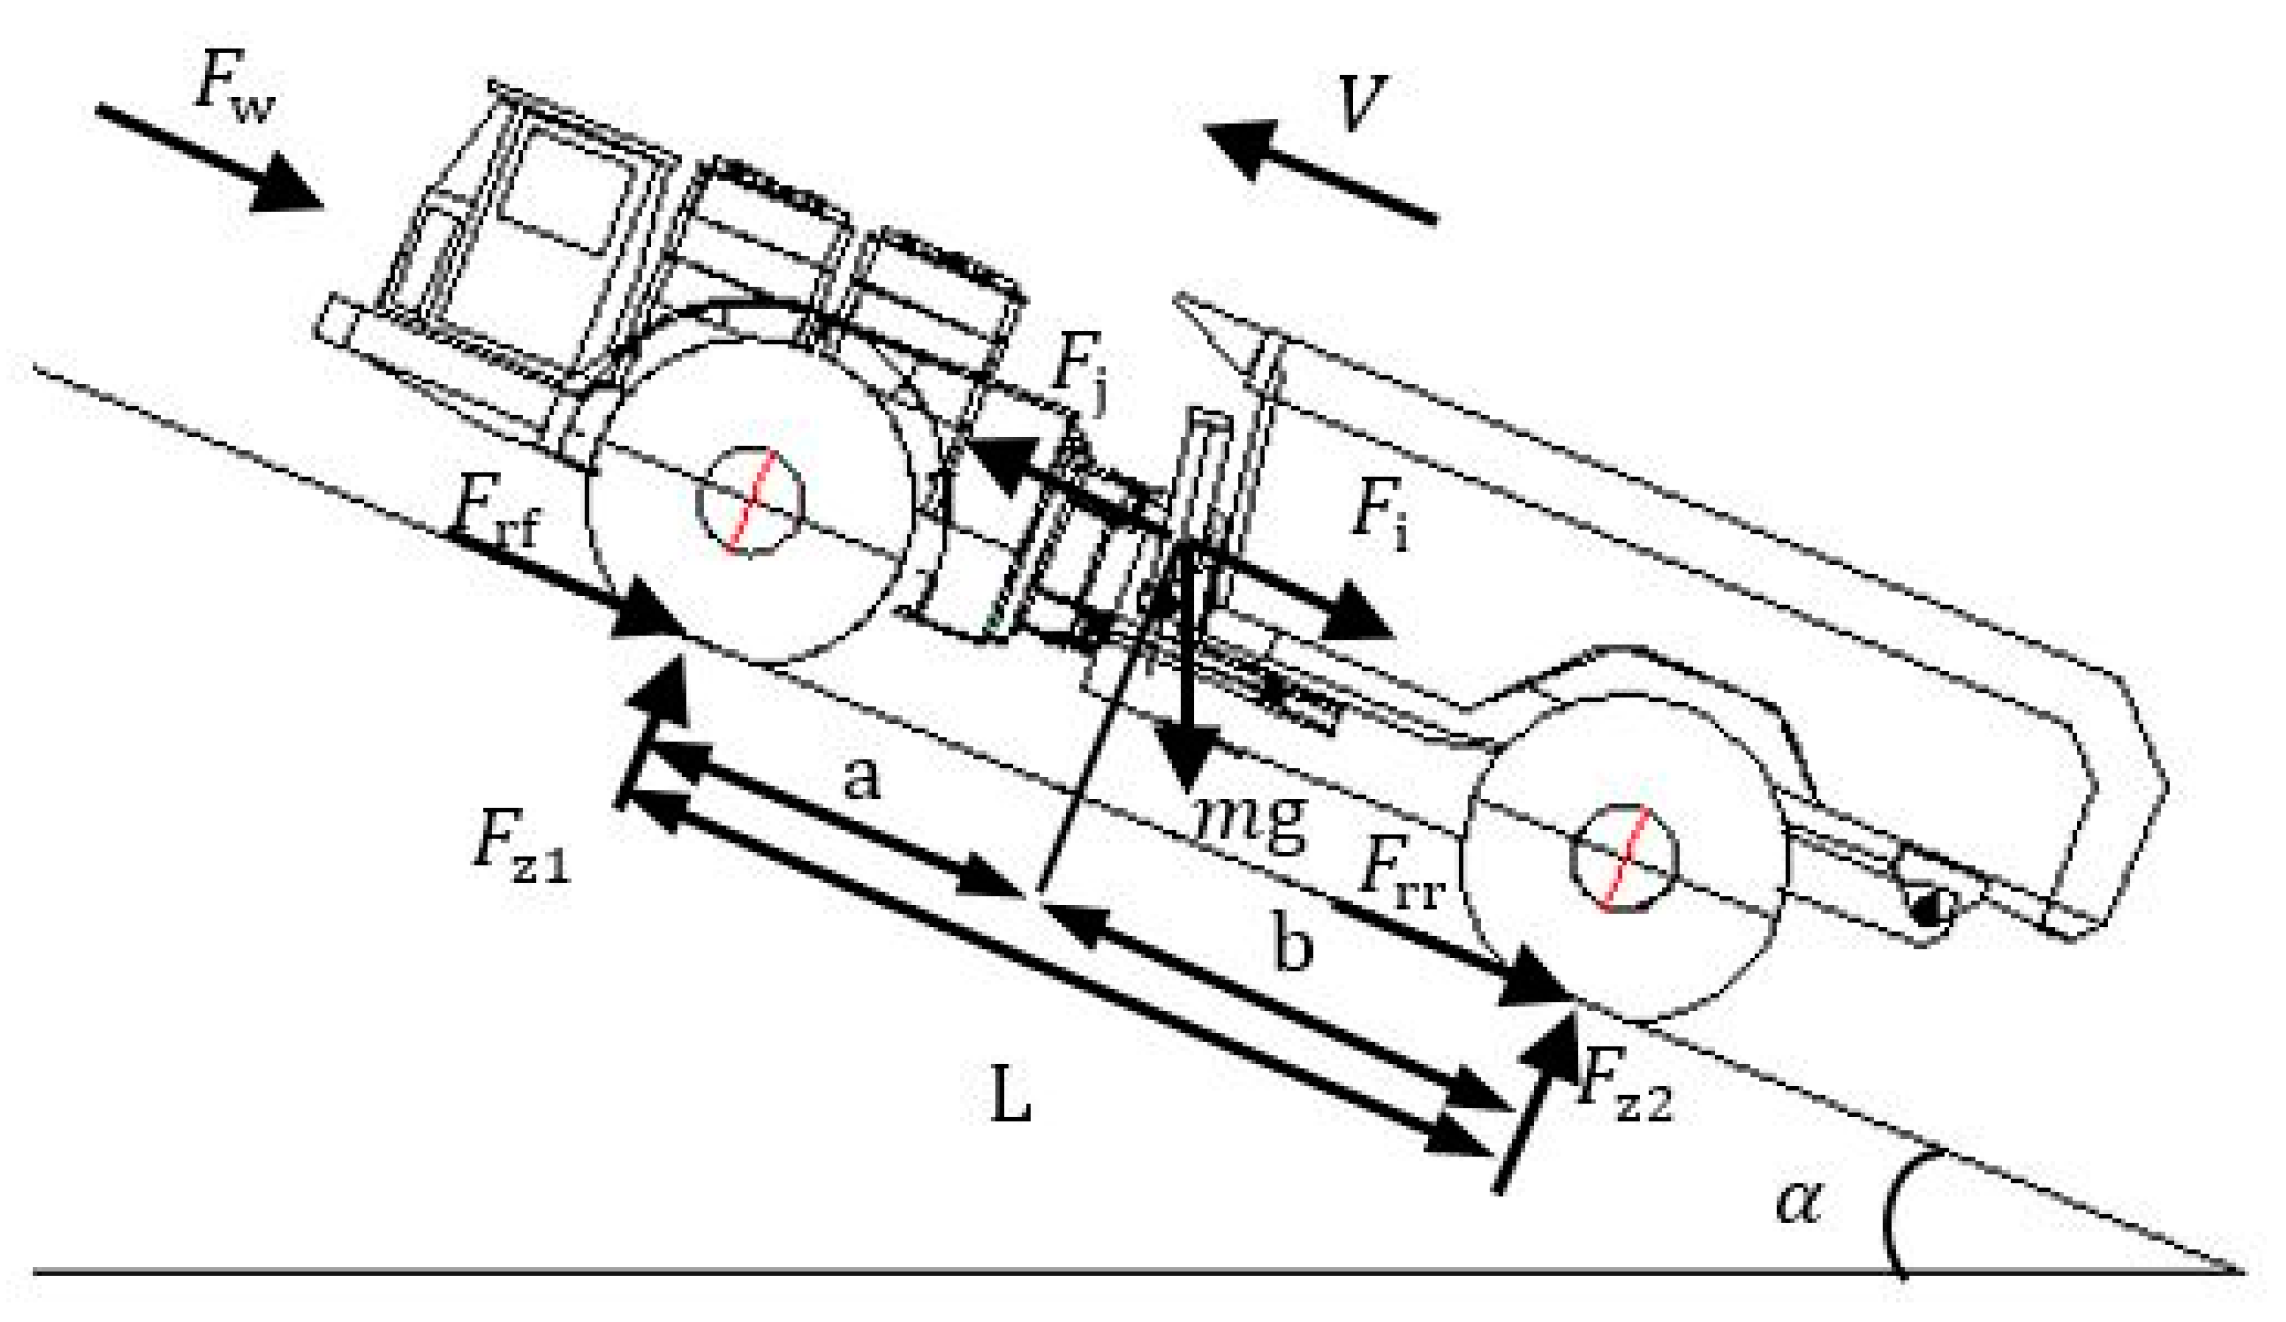
3.2.1. Normal Reaction Force on the Front and Rear Wheels of the Vehicle when Braking
Figure 4 shows the distribution of braking force during braking. According to the balance condition, the torque is obtained for the grounding points of the front and rear wheels respectively:
where is the front axle ground normal force; is the rear axle ground normal force; is the vehicle gravity, is the vehicle mass, is the gravity acceleration; is the wheelbase; is the distance between the truck center of mass to the front axle center; is the distance from the center of mass of the truck to the rear axle center; is the height of the truck’s center of mass; is the braking strength.
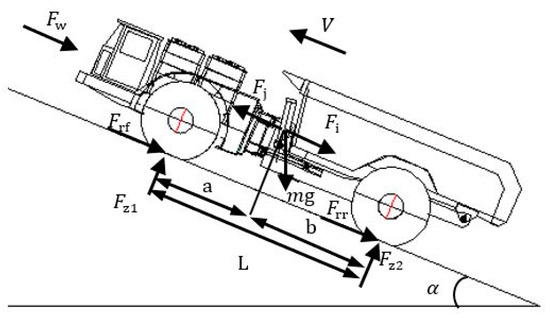
Figure 4.
Vehicle force diagram.
It can be seen from Equations (6) and (7) that as the braking strength increases, the normal reaction force acting on the front axle by the inertial force increases, and the normal reaction force acting on the rear axle decreases. In order to make full use of the ground adhesion, the front axle braking force demand will increase, and the rear axle braking force demand will decrease. Studies have shown that on horizontal roads, for single-shaft driven pure electric vehicles, using the front axle to drive can recover more regenerative braking energy than using the rear axle to drive [22].
3.2.2. Front and Rear Axle Braking Force Distribution
When the brake system braking force is sufficient, the braking process may occur in the following three situations:
- (1)
- The front and rear wheels are both locked and dragged.
- (2)
- The front wheels are locked and dragged first, and then the rear wheels are locked and dragged.
- (3)
- The rear wheels are locked and dragged first, and then the front wheels are locked and dragged.
Situation 1: The ground adhesion utilization is the best, it is the ideal braking situation; situation 2: It is a stable situation, but the steering ability is lost, and its ground adhesion utilization is not as good as situation 1; situation 3: The rear axle may have a side slip, which is unstable and should be avoided [23].
1. I curve (ideal braking force distribution curve)
The braking force distribution curve that satisfies situation 1 is called the ideal braking force distribution curve (I curve), as shown in Figure 5. The I curve is expressed as:
where is the front axle braking force; is the rear axle braking force, and is the adhesion coefficient.
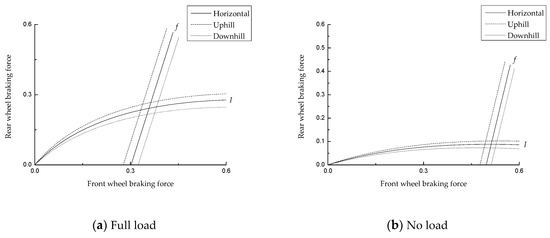
Figure 5.
Vehicle front and rear axle braking force. (a) Full load; (b) no load.
The solid line in Figure 5 is the horizontal road surface I curve with . It can be known from Equations (8) and (9) that compared with the horizontal road, the slope sliding force will lead to the front and rear axle load transfer. When the slope is uphill, the front axle load is reduced and the rear axle load is increased. The I curve is offset upwards around the coordinate origin, and the downhill is just the opposite. When the front and rear axle braking force distribution points are above the I curve, it will cause dangerous conditions in which the rear axle is first locked and dragged.
2. f-line
The braking force distribution curve that satisfies situation 2, called the f-line, is expressed as:
As shown in Figure 5, like the I curve, compared with the horizontal road f curve, the braking force that causes the front axle lock becomes small due to the slope sliding force. The f-line will shift to the left as a whole when the vehicle is uphill, and to the right when downhill.
The UNECE brake regulations (developed by the United Nations Economic Commission for Europe) do not cover vehicles with design speed <25 km/h. The maximum speed of the vehicle studied in this paper is 15 km/h, so this paper does not discuss the UNECE curve.
Assume that the maximum gradient of the pure electric mining vehicle road drive cycle is 10%. According to (8)–(11), the I curve and f line of the vehicle on the horizontal, uphill and downhill roads can be drawn, as shown in Figure 5. In the figure, the braking force is the ratio of the front and rear axle braking force to the vehicle load, which has no unit. So do Figure 6 and Figure 7.

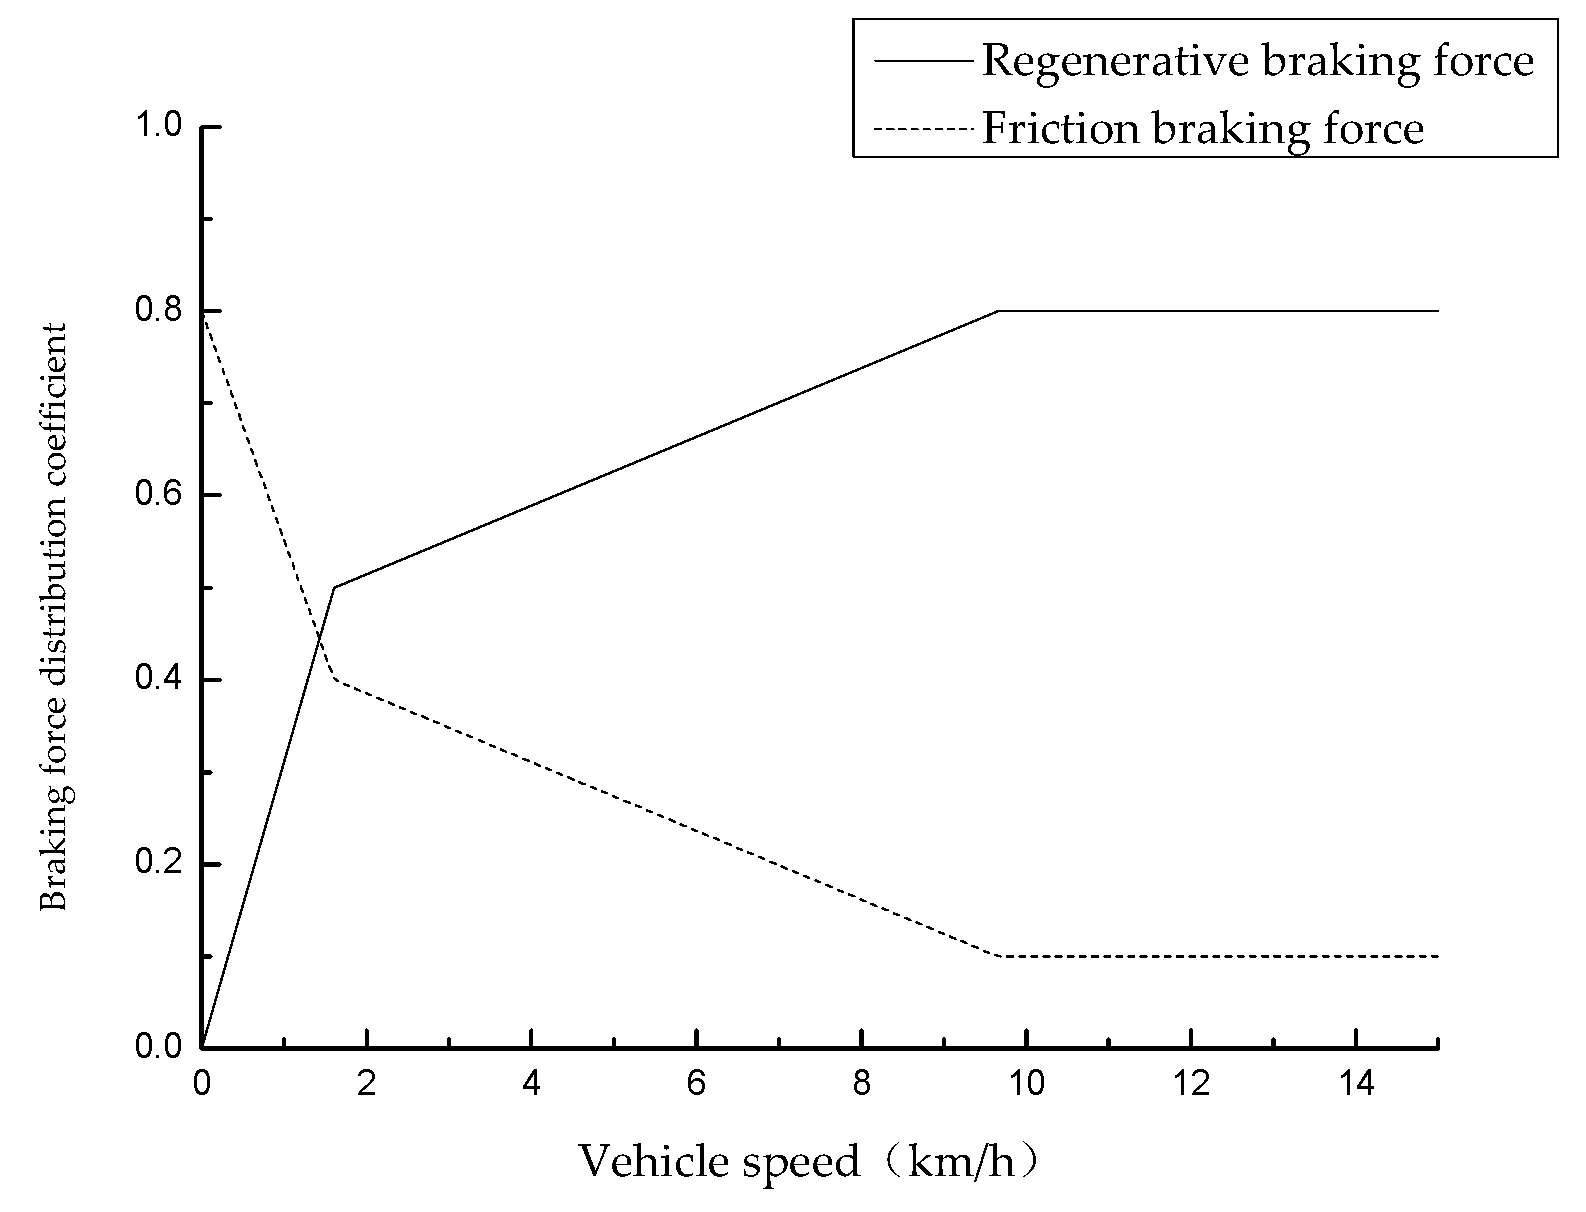
Figure 6.
Brake force distribution map based on vehicle speed.

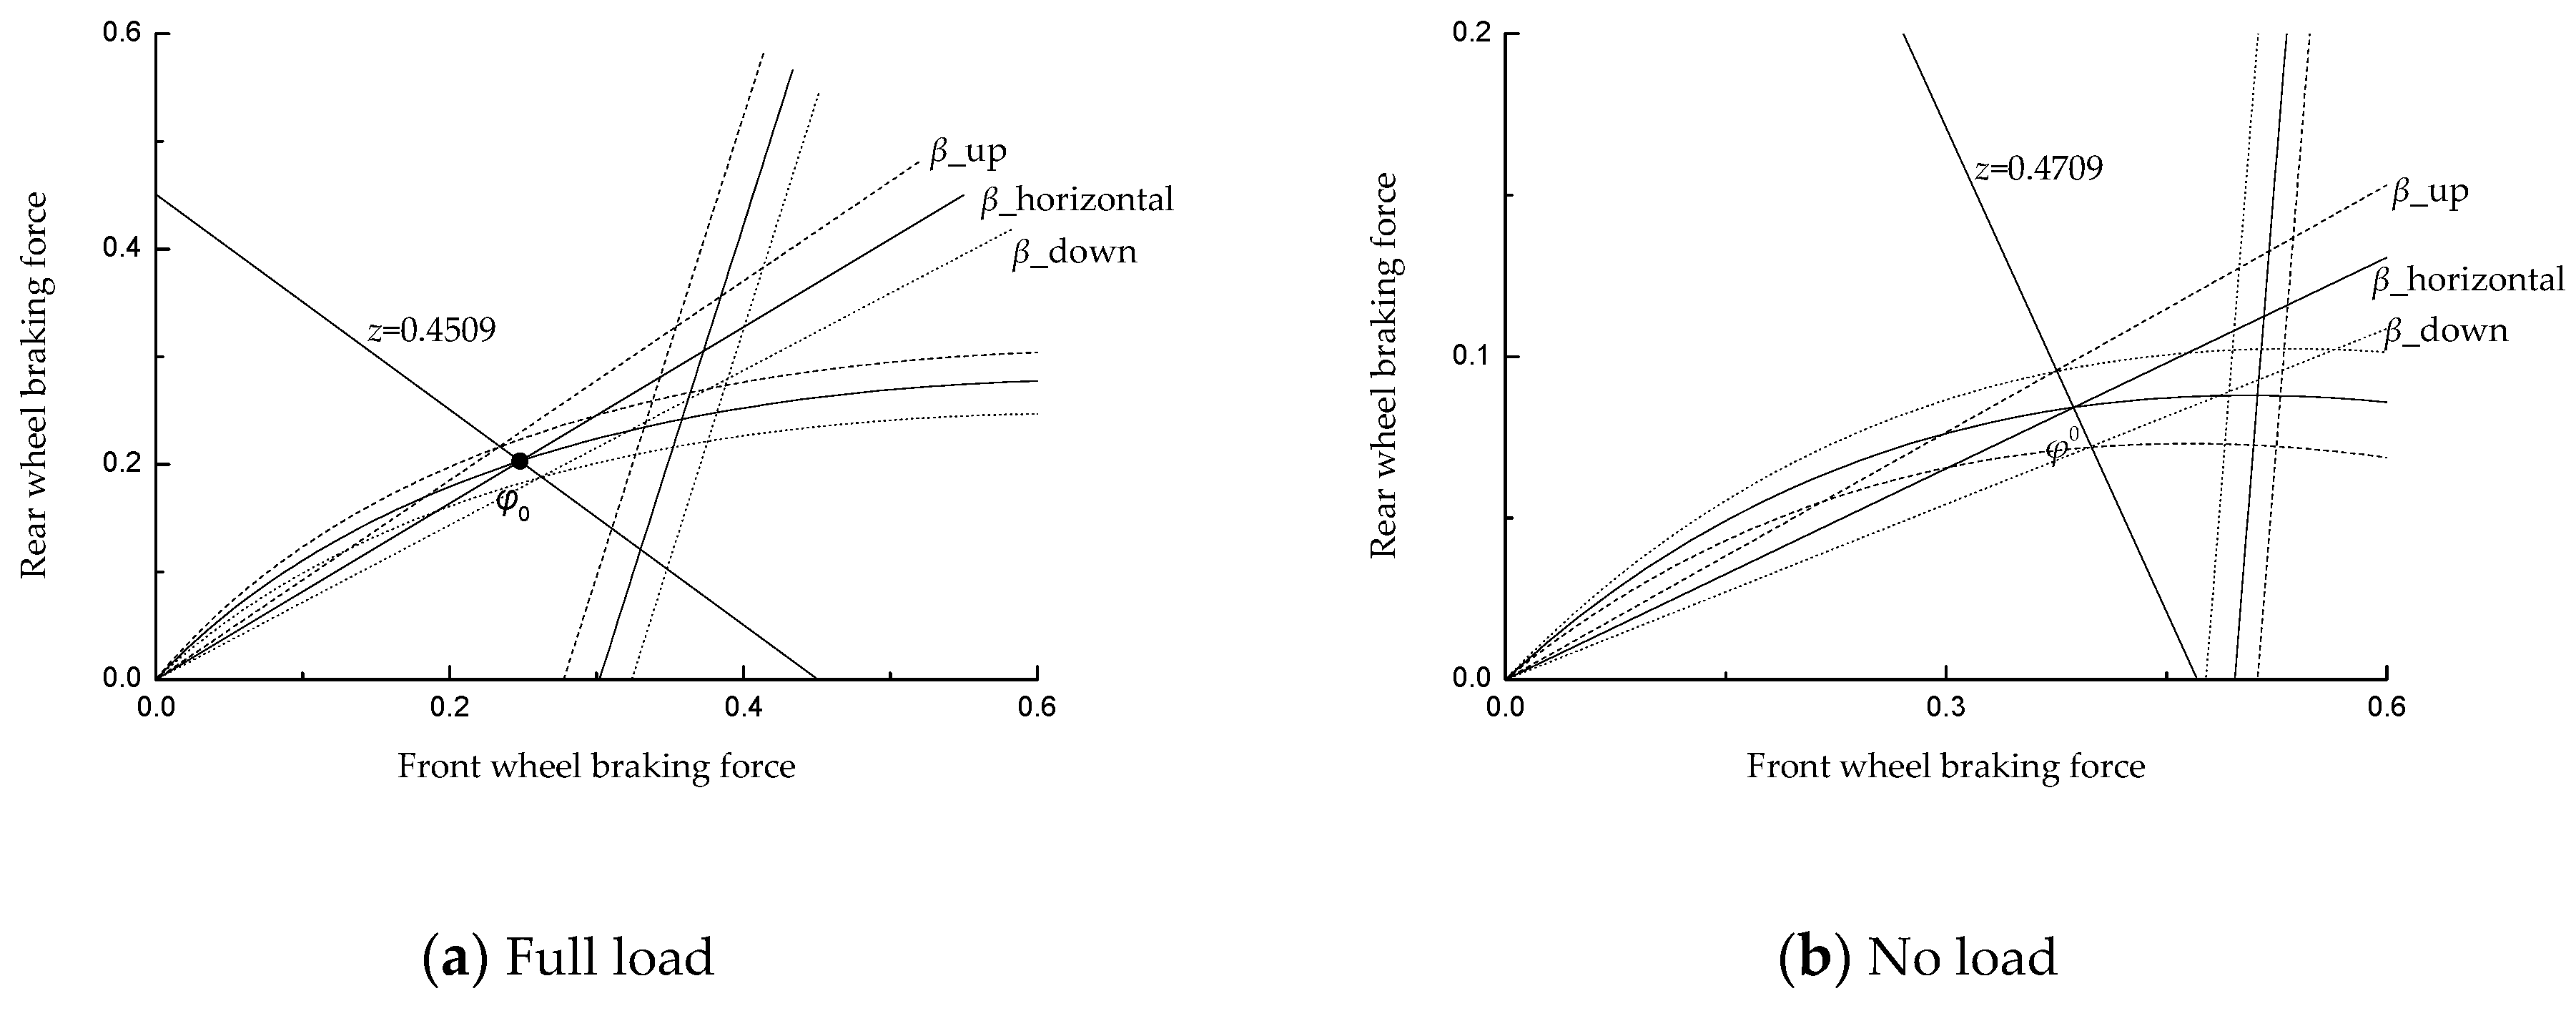
Figure 7.
β line and I curve & f line. (a) Full load; (b) no load.
3.3. Regenerative Braking Strategy
This paper adopts the regenerative braking priority strategy, that is: Under a certain braking intensity, regardless of how the front and rear axle braking forces are distributed, each axle is given priority to use the regenerative braking force: Comparing the axle demands braking force with the regenerative braking force that the motor can provide, if the braking force provided by the motor is greater than or equal to the braking force required for the shaft, the regenerative braking is completely used, and the friction braking force is 0; if the braking force provided by the motor is less than the required braking force of the shaft, the electromechanical composite braking is adopted, the electric braking force takes the braking force that the motor can provide, and the insufficient part is supplemented by the friction braking force; when the vehicle speed is slow or the emergency braking is performed, in order to ensure the reliable braking, the regenerative braking is turned off, and the mechanical braking is completely adopted.
Based on the above principles, this paper develops the following four regenerative braking priority braking strategies.
3.3.1. Vehicle Speed based Braking Strategy
The vehicle speed based braking strategy is a parallel braking control strategy based on vehicle speed, using regenerative braking and mechanical braking combined braking. The higher the vehicle speed, the more regenerative braking force is assigned, as shown in Figure 6. The axle regenerative braking force distribution coefficient and friction braking force distribution coefficient are determined by the vehicle speed.
3.3.2. I Curve based Braking Strategy
Compared with the single-shaft drive electric vehicle, the two-axis four-wheel drive pure electric mining dump truck studied in this paper can fully utilize the fast response characteristics of the motor and freely distribute the front and rear axle braking forces [24], and easily distribute the braking force according to the I curve [25]. As shown in Figure 5, when the vehicle is going uphill, if the horizontal road I curve is used for braking, the curve is below the actual I curve, which makes the front axle use the adhesion coefficient to be large, and the rear axle uses the adhesion coefficient to be small, this situation does not make good use of ground adhesion; when the vehicle is going downhill, the curve is above the actual I curve, when the ground adhesion coefficient is small, there will be unstable conditions in which the rear axle is locked and dragged first. Therefore, the I curve regenerative braking strategy is developed in this paper, the front and rear axle load transfer caused by the slope slip force is introduced, and the front and rear axle braking force distribution is performed according to the actual I curve.
3.3.3. Regeneration Braking Strategy based on β Line
In this strategy, the ratio of the front and rear braking force of the strategy is a fixed value, which is usually expressed as the ratio β of the front axle brake braking force to the total brake force of the vehicle, and is called the front axle brake braking force distribution coefficient:
The β line is a straight line passing through the coordinate origin on the braking force distribution map, the slope is , and the intersection point of the β line and the I curve is the synchronous adhesion coefficient as shown in Figure 7.
β of the studied vehicle is 0.55 when fully loaded on horizontal road, and the corresponding synchronous adhesion coefficient = 0.45. It can be seen from Figure 7 that if the vehicle is braked according to the β line of the horizontal road, the synchronous adhesion coefficient is bigger when the vehicle is going uphill, the β line is far away from the actual I curve, the vehicle braking efficiency is low; when going downhill, the synchronous adhesion coefficient is smaller, and the β line will be closer to the actual I curve, however, if the ground adhesion coefficient of the road is low, the rear axle will always be locked first when braking, and it is easy to skid. Here, the variable β line is used, and the synchronous adhesion coefficient remains unchanged regardless of the slope during the running of the vehicle, = 0.45 at full load and = 0.47 at no load.
3.3.4. Maximizing Front Axle Braking Force Strategy
For the mining truck under study, when the front wheel is independently braking without being locked, the braking strength z is greater than 0.2, which satisfies the braking demand of the vehicle road drive cycle (Figure 8). Therefore, when the braking strength is less than 0.2, the front axle braking force is used only, and the rear axle braking force is zero. When the braking strength is greater than 0.2, the front and rear axles are used for common braking.

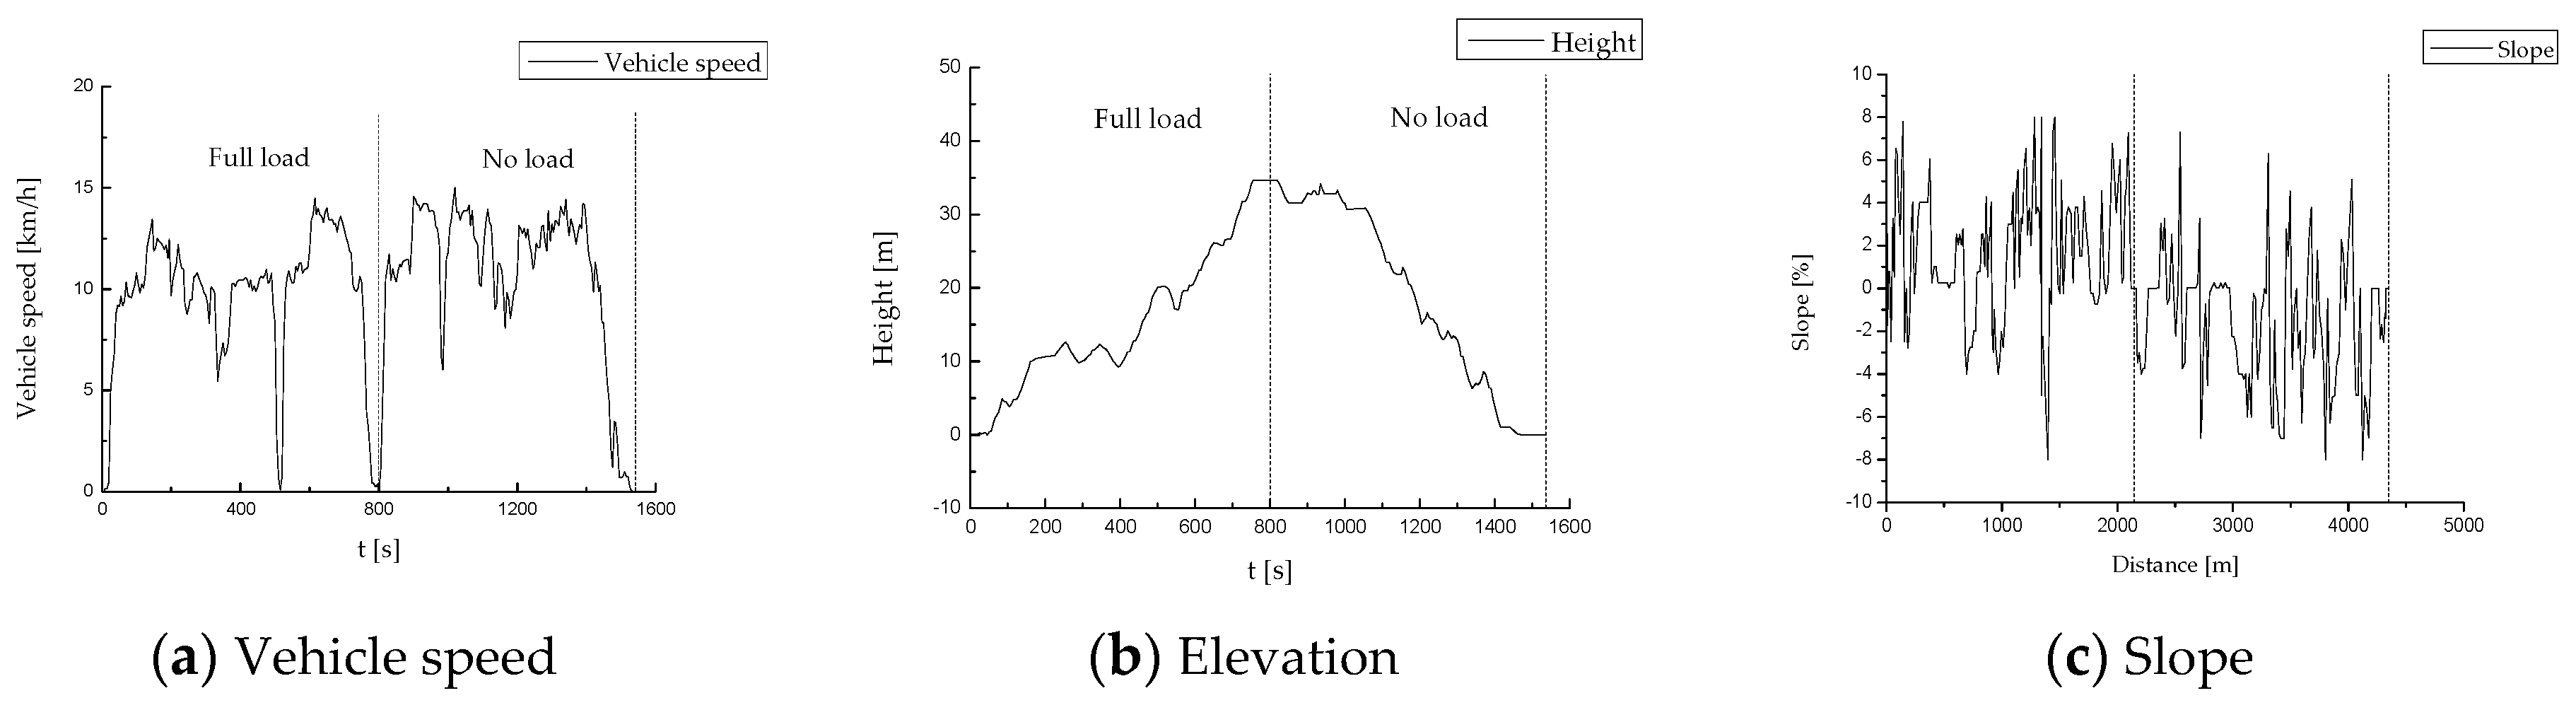
Figure 8.
Road drive cycle. (a) Vehicle speed; (b) elevation; (c) slope.
4. Simulation Analysis
The above different control strategies are established on the Matlab/Simulink platform and embedded in the vehicle model of the pure electric double-axis four-wheel drive mining dump truck established in the vehicle simulation software ADVISOR 2002. The main parameters of the vehicle are shown in Table 1. The maximum vehicle speed is 15 km/h and the maximum climbing ability is 15% (3.5 km/h).

Table 1.
Main parameters of mining truck.
In addition to the influence of vehicle parameters, the vehicle’s potential regenerative energy recovery capability is also affected by road drive cycles [26]. Figure 8 shows the road drive cycle during operation. When going uphill, the mining truck is fully loaded and away from the loading location, after 799 s, it climbs to an unloading location with a relative altitude of 34.6 m, the average speed is 9.64 km/h, and the maximum speed is 14.48 km/h, the maximum slope is 8%, the driving distance is 2.14 km. When going downhill, it takes 735 s to return to the loading location after unloading, the average speed is 10.79 km/h, the maximum speed is 14.99 km/h, the maximum slope is 8%, and the driving distance is 2.21 km.
4.1. Simulation of Different Braking Strength on Horizontal Road at Maximum Vehicle Speed
Assume that the vehicle is running at maximum speed v0 = 15 km/h at full load and no load, braking with braking strength z = 0.05, z = 0.1 and z = 0.15 (Because the vehicle speed is low, the braking strength of the road drive cycle is smaller than 0.15, the vehicle reserves the mechanical brake, during emergency braking, pure mechanical braking is adopted and the brake is safe and reliable. Therefore, the case which the braking strength z > 0.15 is not discussed).
4.1.1. Comparison of Braking Energy Recovery
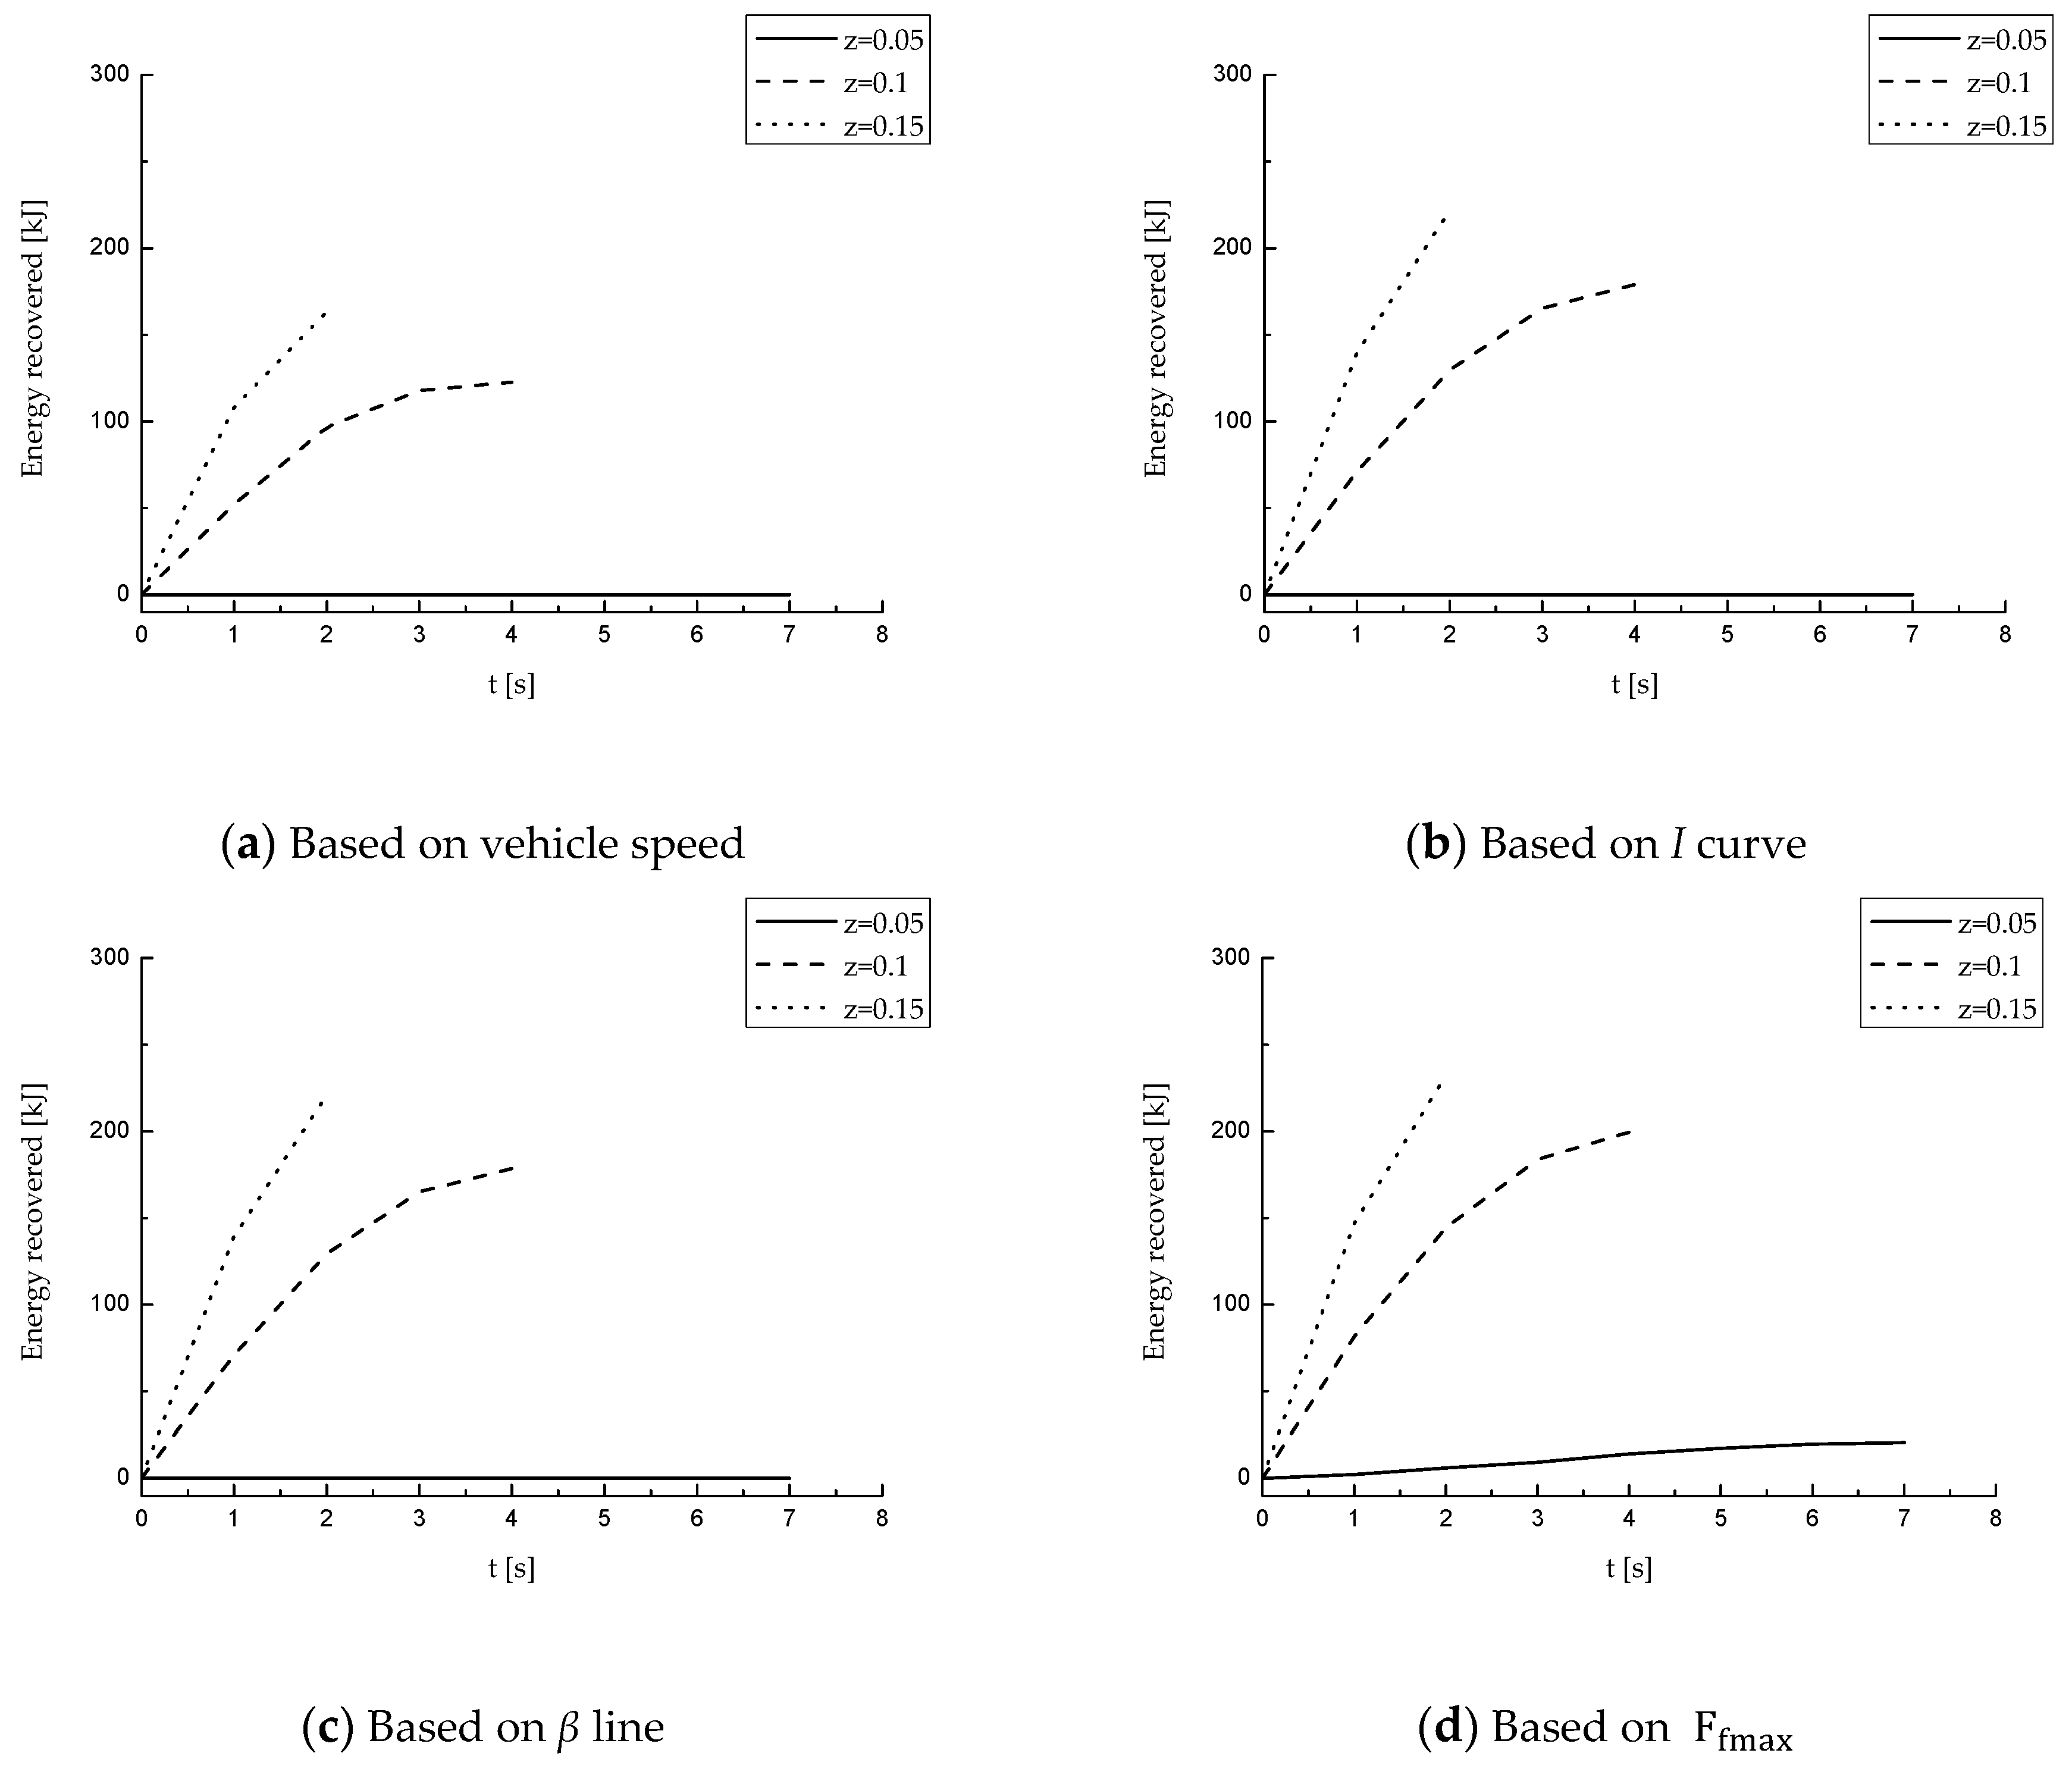
It can be seen from Figure 9 that when the vehicle is fully loaded, when the braking intensity is z = 0.05, z = 0.1, the braking strategy based on recovers the most energy, and the second is the I curve based and the β-line based braking strategy; when z = 0.15, the energy recovered by braking strategies based on the I curve and the β line is the most, followed by the braking strategy based on the vehicle speed, the strategy recovers the least energy.
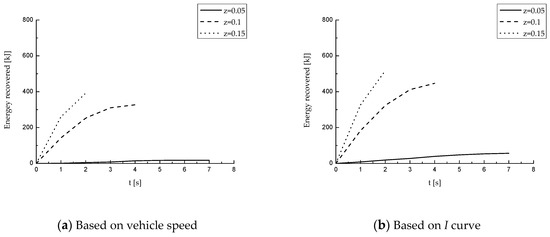

Figure 9.
Different strategies recover energy at full load. (a) Based on vehicle speed; (b) based on I curve; (c) based on β line; (d) based on .
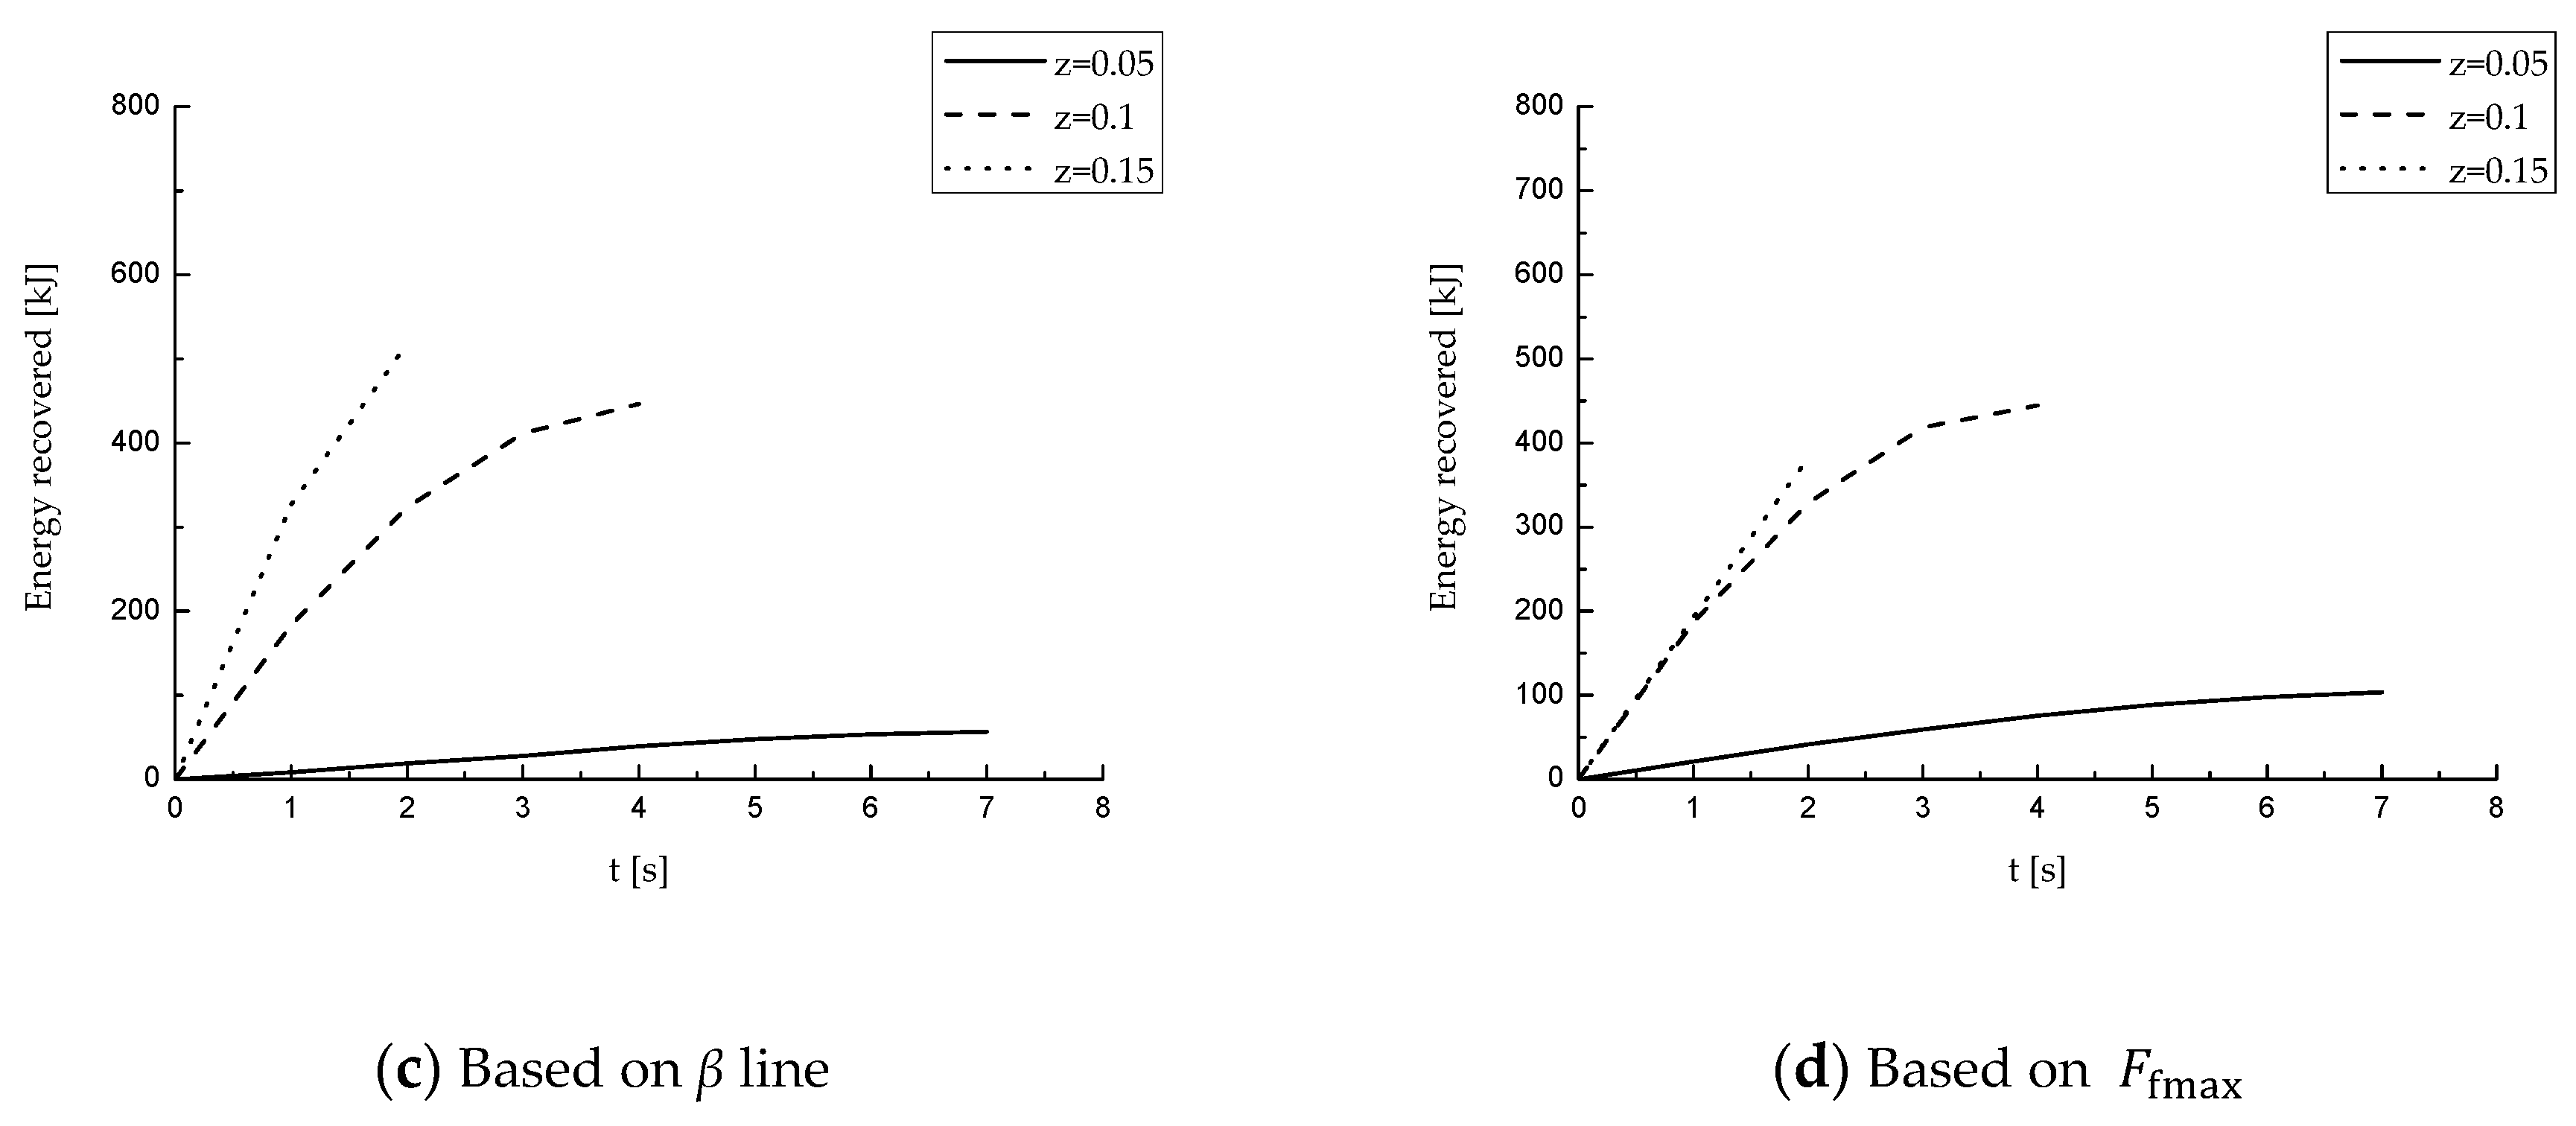
It can be seen from Figure 10 that when the vehicle is under no load, the braking strategy based on recovers the most energy under the three braking intensities, then it is the strategy based on the I curve and β line, the strategy based on vehicle speed recovers the least energy recovery.
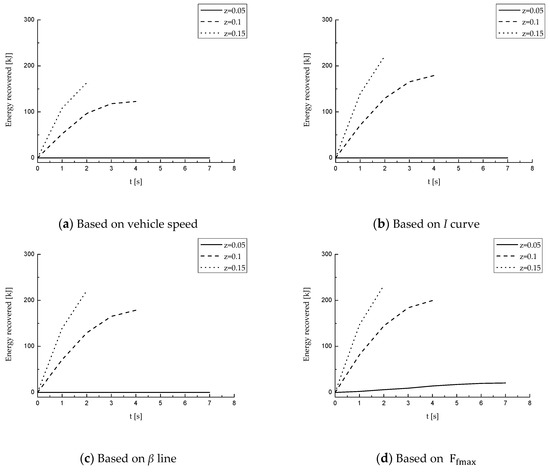
Figure 10.
Different strategies recover energy at no load. (a) Based on vehicle speed; (b) based on I curve; (c) based on β line; (d) based on .
Regardless of the braking strategy used, the braking energy recovered by the vehicle increases with the increase of the braking strength. This is mainly due to the large rolling resistance of the mining vehicle. When the braking intensity is small, the required braking force is small, the braking time and the braking distance are long, and the vehicle needs more energy to overcome the rolling resistance, so that less regenerative braking energy can be recovered.
Table 2 shows the energy recovered of the same braking strategy under different braking strengths. It can be seen that, except for the strategy, the vehicle’s braking energy recovery efficiency increases with the increase of braking intensity, regardless of the full load or no load. The energy recovery rate can reach up to 59.6%. For the strategy, when the braking strength is large (z = 0.15), the regenerative braking force cannot meet the full load braking force requirement, and the energy recovery efficiency decreases. However, at no load, its regenerative braking force can meet the braking demand, and the energy recovery efficiency is still the highest.
Table 2.
Energy recovery under different braking strengths [kJ].
4.1.2. Comparison of Braking Force Distribution
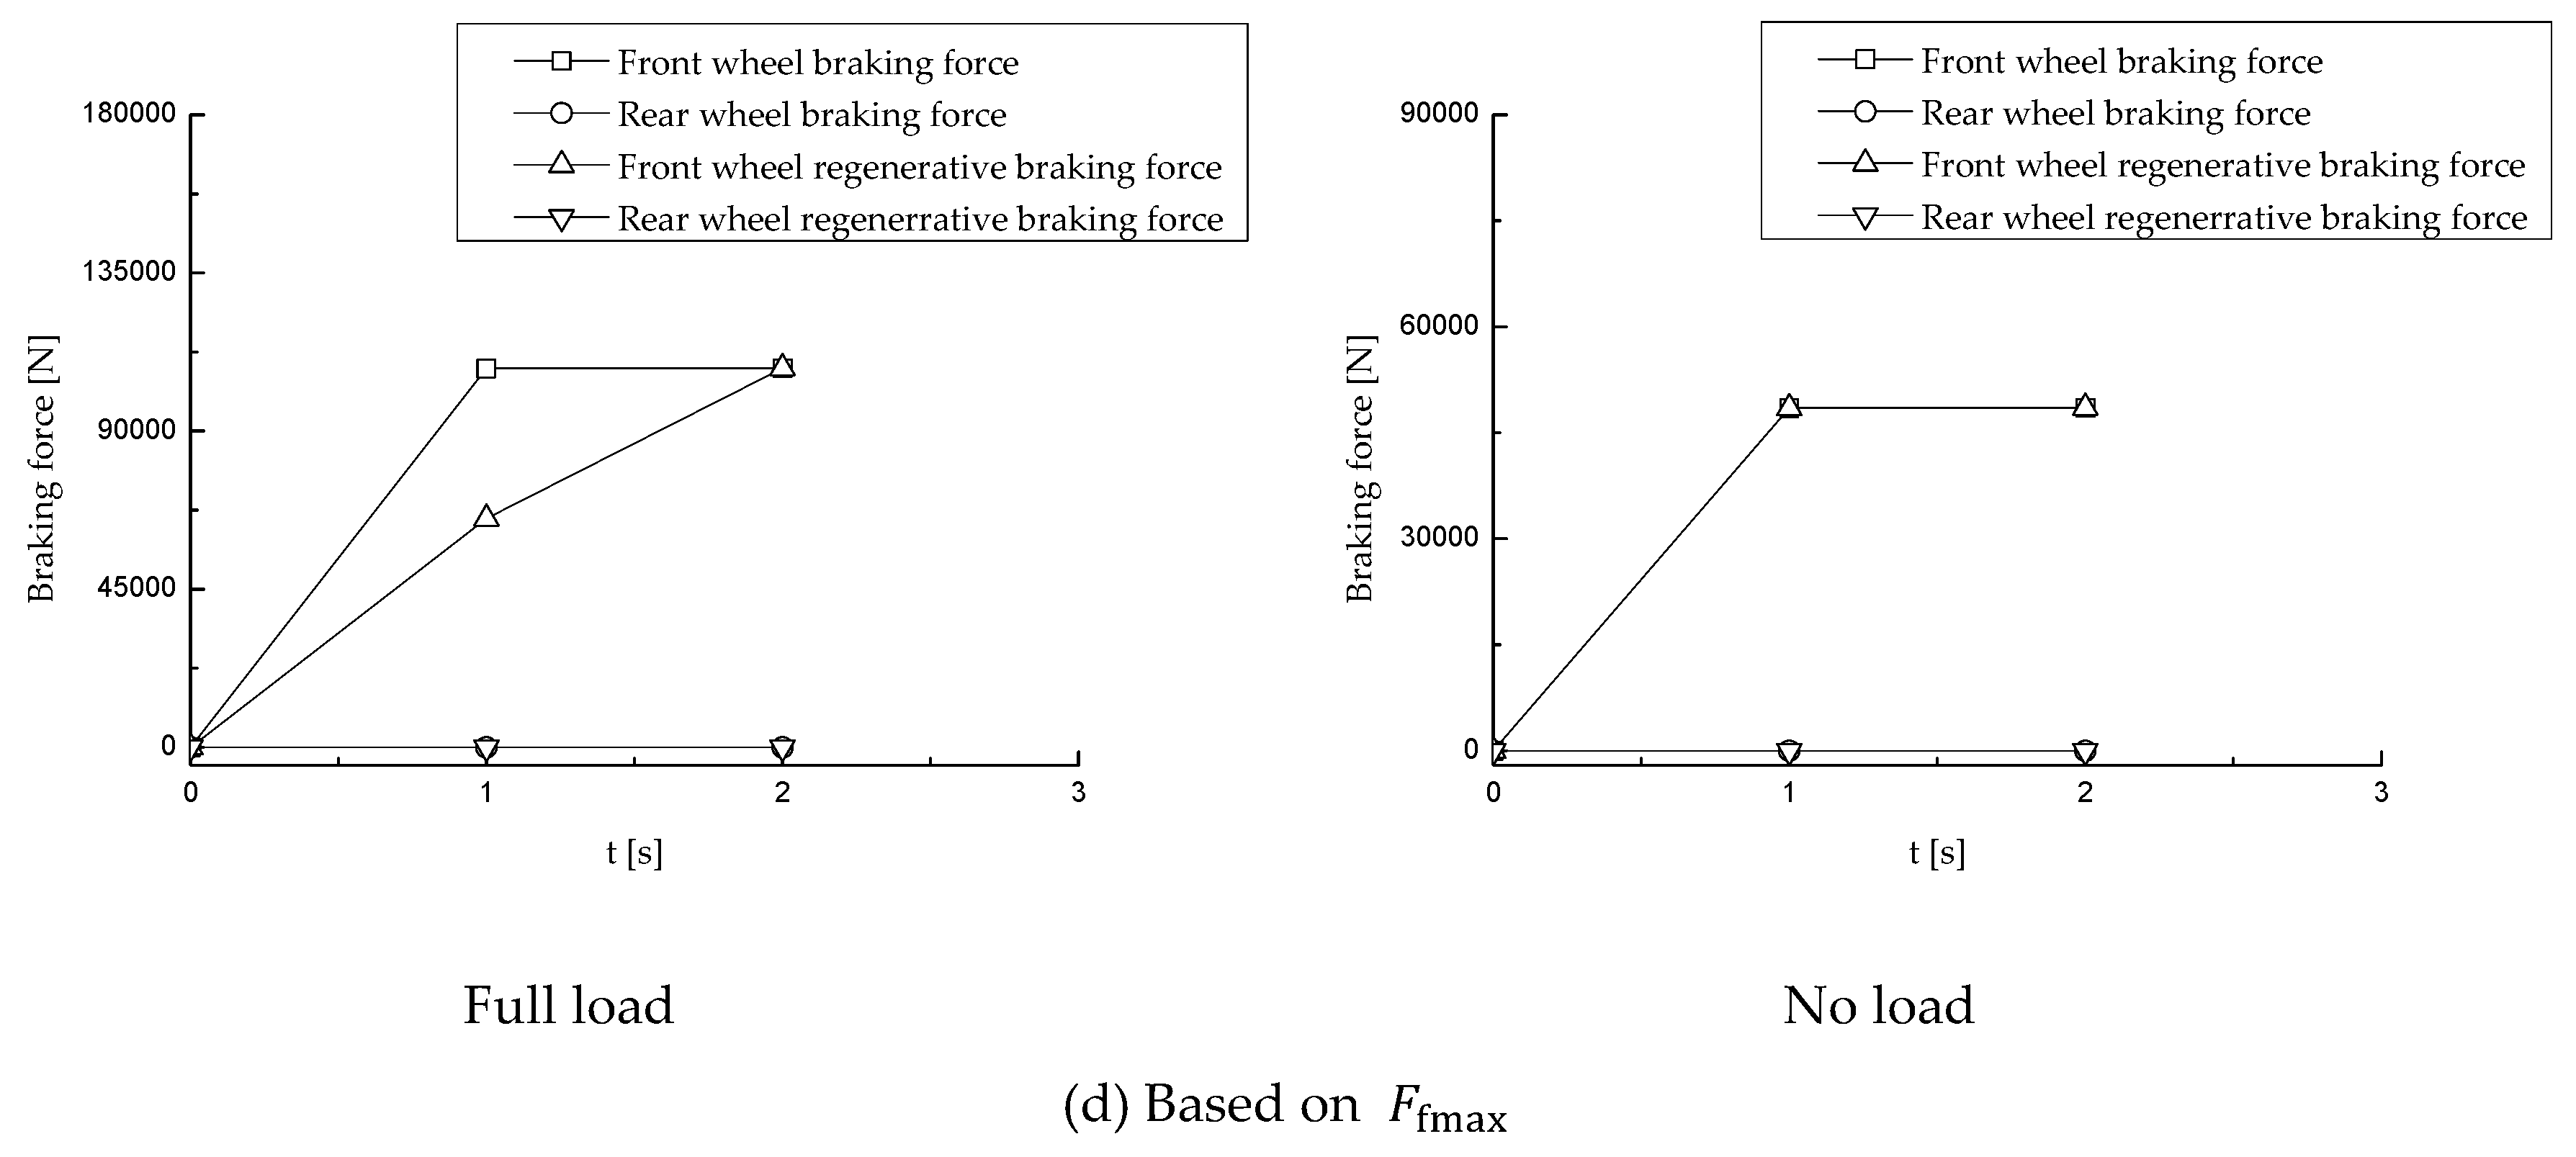
Taking the braking strength of z = 0.15 as an example, the braking force and regenerative braking force of the front and rear axles of different braking strategies are studied when the vehicle is full and no load, as shown in Figure 11.
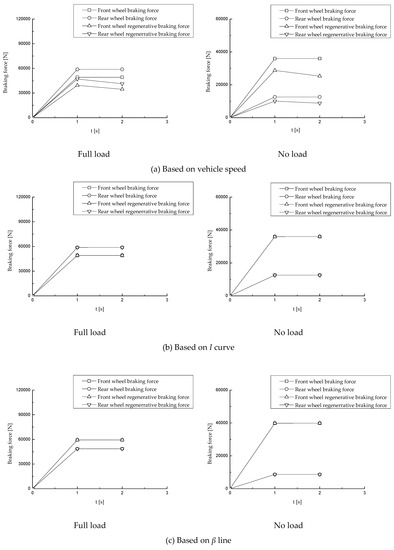

Figure 11.
Different strategy braking force distribution at full load and no load. (a) Based on vehicle speed; (b) based on I curve; (c) based on β line; (d) based on .
For I curve and β line based braking strategy, the braking force is simultaneously provided by the front and rear axles, the braking force can be provided by the regenerative braking force totally regardless of the loading conditions.
For the strategy, the braking force is all provided by the front axle. When braking starts, the motor speed is high, it can be known from Equation (2) that the motor is in the constant power operation phase, the torque that the motor can provide is small. When the vehicle is fully loaded, the required braking force is large, the motor torque is not enough to provide the required braking force (Figure 11d full load); when the vehicle is in no load, the braking force required is small, and the regenerative braking force can meet the front axle braking force requirement (Figure 11d no load).
The braking force required for the vehicle speed based strategy is always provided by the front and rear axle regenerative braking force and mechanical braking force simultaneously. When the vehicle speed decreases, the distributed and provided regenerative braking force decreases.
It can be seen that the more the regenerative braking force distributed during braking and the regenerative braking force that the regenerative braking system can provide, the more regenerative braking energy the vehicle can recover.
4.2. Simulation of Road Drive Cycle
4.2.1. Comparison of Braking Energy Recovery
Table 3 shows the recovery of braking energy when the vehicle is fully loaded and unloaded under road drive cycle with different braking strategies. For the road drive cycle, the braking strategy based on recovers the most energy and has the highest energy recovery efficiency. The strategies based I curve and β line are the second, and the parallel braking strategy based on the vehicle speed is the worst. Table 3 also shows that for the same braking strategy, the braking energy recovery rate at full load is greater than that at no load. This is mainly due to the fact that under the same braking intensity, the required braking force is small when the vehicle is under no load, and the required motor regenerative torque is also small. At this time, the motor works at a low efficiency (Figure 2), resulting in a decrease in energy recovery efficiency.
Table 3.
Braking energy recovered of different braking strategies [kJ].
Table 4 shows the braking efficiency of the front and rear wheel drive motors for different braking strategies. It can be seen that the braking strategy uses the front axle to brake independently, compared with the two-axis braking, its motor efficiency is higher. When under road drive cycle, the vehicle speed is low, the braking strength is also small, and the front axle regenerative braking force can fully meet the braking force demand. Therefore, the strategy can recover the most braking energy and has the highest energy recovery efficiency. Table 4 also shows that for the same braking strategy, the motor regenerative braking efficiency at full load is greater than that at no load.
Table 4.
Front and rear motor braking efficiency.
4.2.2. Vehicle Energy Consumption and Battery SOC Changes
Table 5 shows the energy consumption of the vehicle when the vehicle is fully loaded and unloaded at road drive cycle. It can be seen that if the vehicle uses regenerative braking, compared with no regenerative braking, the energy consumption of a complete drive cycle is reduced by 1.06%–1.56%. Compared to passenger cars, the vehicles studied have lower speeds and lower braking strength, as well as greater rolling resistance. However, the use of regenerative braking can still reduce the energy consumption of the vehicle and improve the economic performance of the vehicle.
Table 5.
Energy consumption of vehicle road drive cycle (f = 0.04) [kJ].
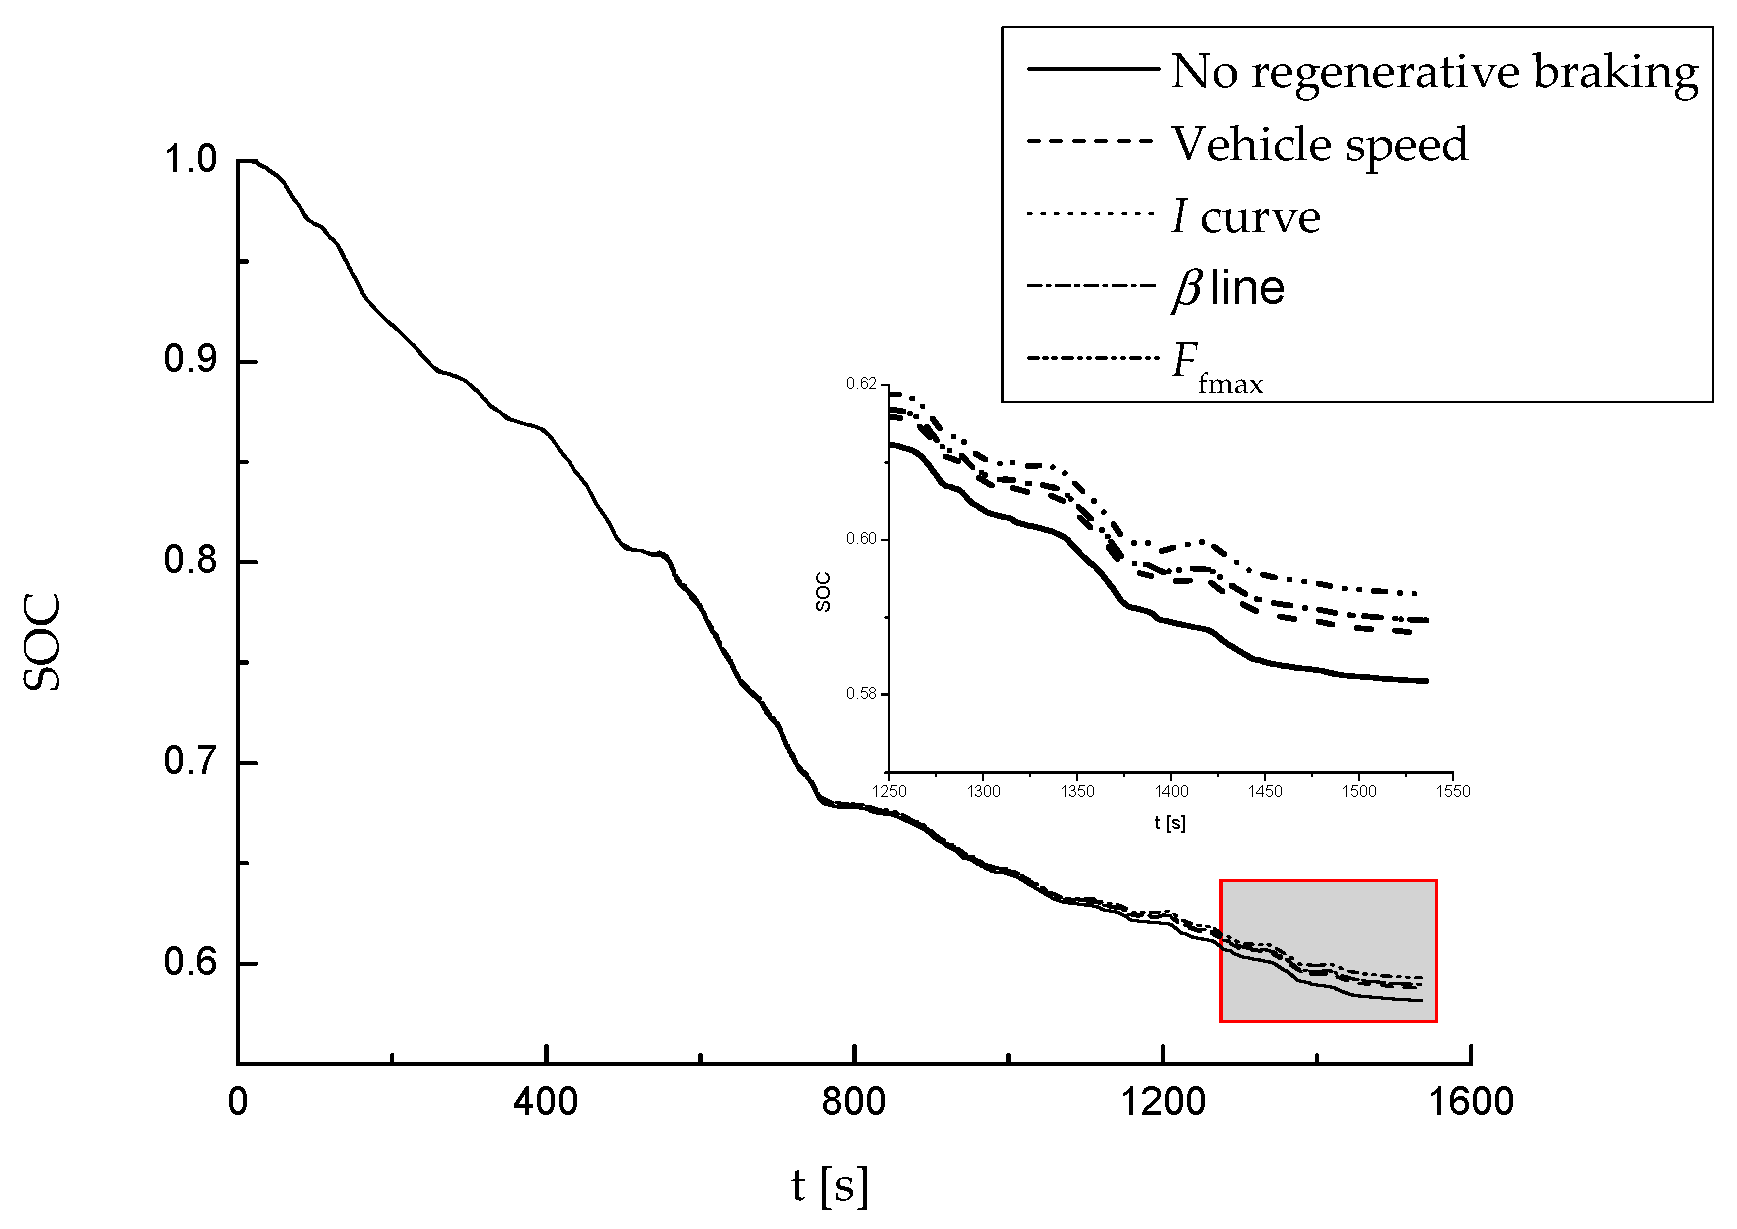
Figure 12 shows the changes of the battery SOC when the vehicle is traveling once under the road drive cycle. It can be seen that when there is no regenerative braking, the battery SOC drops the fastest, followed by the braking strategy based on the vehicle speed, strategy based on the drops the slowest and the energy saving effect is the best.
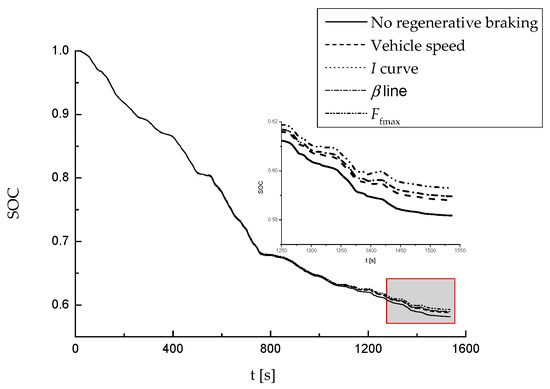
Figure 12.
Comparison of SOC changes at road drive cycle.
If appropriate measures are taken on the road surface for improvement and maintenance, it is assumed that the rolling resistance coefficient of the road surface is reduced to f = 0.02. Table 6 shows the energy consumption of the pure electric mining truck under study in this road drive cycle. Obviously, compared with the road rolling resistance coefficient f = 0.04, the maximum vehicle energy consumption decreased from 188,645 kJ to 129,142 kJ, a decrease of 31.54%; the minimum value decreased from 185,708 kJ to 121,743 kJ, a decrease of 34.44%. After the road surface is improved, the regenerative braking technology can reduce the energy consumption of the whole vehicle by 4.76%–5.73%.
Table 6.
Energy consumption of vehicle road drive cycle (f = 0.02) [kJ].
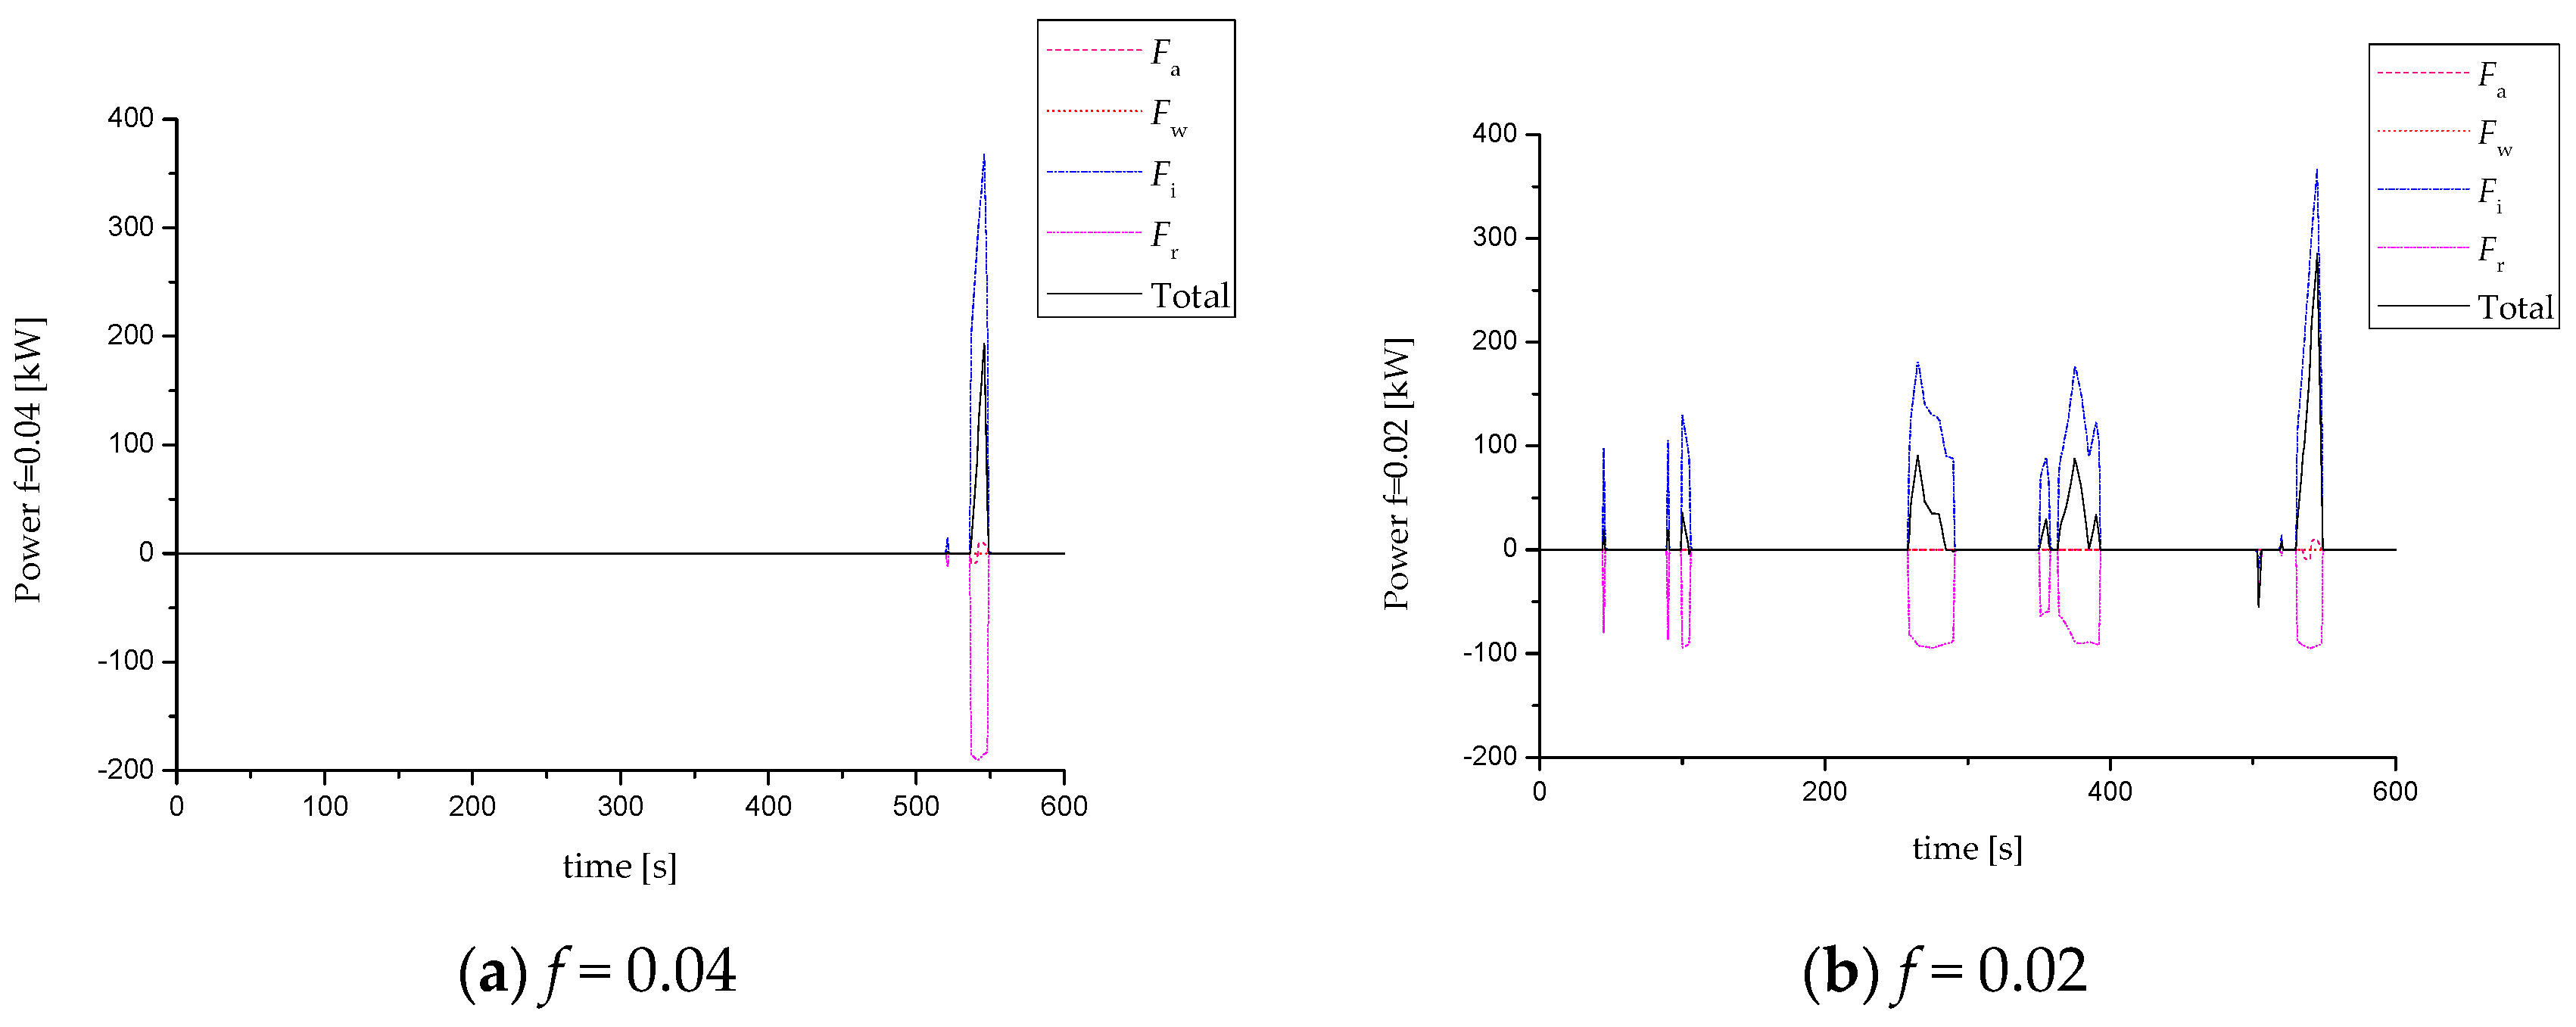
In fact, when the road rolling resistance coefficient is large, the power used by the vehicle to overcome the road rolling resistance (Fr) is large. Figure 13 shows the braking power demand when the vehicle is fully loaded on roads with different rolling resistance coefficients. It can be seen that when the rolling resistance coefficient is large, the vehicle kinetic energy (Fa) and potential energy (Fi) are mainly used to overcome the road rolling resistance (Fr) when braking or downhill. At this time, the recoverable energy is limited, as shown in Figure 13a. When the road surface is improved and the rolling resistance coefficient is reduced, more vehicle kinetic energy and potential energy can be recovered. See Figure 13b. Wind resistance (Fw) is negligible compared to rolling resistance.

Figure 13.
Power requirements for braking with different rolling resistance coefficients (full load, uphill) (a) f = 0.04; (b) f = 0.02.
Improving the road surface can not only reduce the energy consumption of the whole vehicle, but also protect the vehicle tires, extend the use of the tires, and reduce the maintenance and use cost of the vehicles. Therefore, it is necessary for the mine to improve and maintain the haul roads.
In addition, the vehicle loading state and the driving motor working efficiency also directly affect the regenerative braking energy recovery capability of the pure electric mining truck. Table 3 and Table 4 show that when the vehicle is fully loaded, the motor efficiency is higher than that at no load, and the regenerative energy recovery rate is also high. It can be seen that the vehicle full load downhill can recover more regenerative braking energy than the no-load downhill.
5. Conclusions
This paper adopts the regenerative braking priority strategy to develop four braking strategies based on the Matlab/Simulink platform, embeds them in the simulation model of pure electric double-axis four-wheel drive mining dump truck developed by ADVISOR 2002 to study the characteristics of regenerative braking energy recovery of the pure electric mining dump truck.
The simulation results show that the regenerative braking priority strategy adopted can make full use of the regenerative braking force that the vehicle can provide and recover more braking energy. The regenerative braking energy that the vehicle can recover is proportional to the regenerative braking force it is assigned to and can provide. For the pure electric double-shaft four-wheel drive mining dump truck studied in this paper, the working speed is low, the braking strength is not so big, the required braking force is small (especially when the truck is empty and downhill), which leads to low regeneration efficiency of the motor. Adopting the strategy based on the front axle braking force maximizing, compared with the I curve and the β-line braking strategy which front and rear axle are braking simultaneously, the braking efficiency of the motor can be improved and more braking energy can be recovered. For the low-speed pure electric mining truck, the rolling resistance is much bigger than passenger cars and it will consume more vehicle kinetic energy and potential energy during the small braking intensity of the vehicle and the long downhill process, so, the recoverable braking energy is reduced. In this case, adopting regenerative braking strategy, the vehicle can still reduce the energy consumption by 1.06%–1.56% (when the rolling resistance f = 0.04) or 4.76%–5.73% (when the rolling resistance f = 0.02), which makes the economic performance of the vehicle improve. Of course, if the vehicle is fully loaded downhill, the regenerative braking energy recovered will be more.
Author Contributions
Conceptualization, W.Z. (Wenming Zhang); Methodology, W.Z. (Wenming Zhang) and J.Y.; Software, W.Z. (Wei Zhang); Validation, W.Z. (Wenming Zhang), J.Y. and W.Z. (Wei Zhang); Formal analysis, W.Z. (Wenming Zhang); Investigation, W.Z. (Wei Zhang); Resources, J.Y.; Data curation, W.Z. (Wei Zhang); Writing—original draft preparation, W.Z. (Wei Zhang); Writing—review and editing, W.Z. (Wei Zhang) and J.Y.; Visualization, W.Z. (Wei Zhang); Supervision, W.Z. (Wenming Zhang); Project administration, F.M.
Funding
This paper is supported by the China Mobile Multi-functional Emergency Rescue Vehicle Key Technology Research and Application Demonstration Project (Project No. 2016YFC0802905).
Conflicts of Interest
The authors declare no conflict of interest.
References
- Feng, Y. Performance Cost-Benefit Analysis of a Series Hybrid. Electric Mining Truck; University of Science and Technology: Beijing, China, 2017. [Google Scholar]
- Zhou, M.; Gao, Z.; Zhang, H. Research on regenerative braking control strategy of hybrid electric vehicle. In Proceedings of the 6th International Forum on Strategic Technology, Harbin, China, 22–24 August 2011; pp. 300–303. [Google Scholar]
- Guo, J.; Wang, J.; Cao, B. Brake-force distribution strategy for electric vehicle based on maximum energy recovery. J. Xi’an Jiaotong Univ. 2008, 5, 607–611. [Google Scholar]
- Wei, Z.; Xu, J.; Halim, D. Braking force control strategy for electric vehicles with load variation and wheel slip considerations. IET Electr. Syst. Transp. 2017, 7, 41–47. [Google Scholar] [CrossRef]
- Liu, L.; Ji, F.; Yang, S.; Xu, B. Control strategy for electro-mechanical braking based on curves of ECE regulations and ideal braking force. J. Beijing Univ. Aeronaut. Astronaut. 2013, 39, 138–142. [Google Scholar]
- Liu, Z.; Guo, X. Electronic-hydraulic-compound regenerative braking control for electric vehicles. J. Cent. South. Univ. (Sci. Technol.) 2011, 42, 2687–2691. [Google Scholar]
- Lv, C.; Zhang, J.; Li, Y.; Yuan, Y. Mechanism analysis and evaluation methodology of regenerative braking contribution to energy efficiency improvement of electrified vehicles. Energy Convers. Manag. 2015, 92, 469–482. [Google Scholar] [CrossRef]
- Zhang, J.; Li, Y.; Chen, L.; Ye, Y. New regenerative braking control strategy for rear-driven electrified minivans. Energy Convers. Manag. 2014, 92, 469–482. [Google Scholar]
- Qiu, C.; Wang, G.; Meng, M.; Shen, Y. A novel control strategy of regenerative braking system for electric vehicles under safety critical driving situations. Energy 2018, 149, 329–340. [Google Scholar] [CrossRef]
- Guo, Z.J.; Yue, D.D.; Wu, J.B. Optimization of Regenerative Braking Control Strategy for Pure Electric Vehicle. Appl. Mech. Mater. 2017, 872. [Google Scholar] [CrossRef]
- Zhang, X.; Göhlich, D.; Li, J. Energy-Efficient Toque Allocation Design of Traction and Regenerative Braking for Distributed Drive Electric Vehicles. IEEE Trans. Veh. Technol. 2017, 99, 1. [Google Scholar] [CrossRef]
- Yu, H.; Wood, A.S.; Huang, M.; Qi, H. Optimal Braking Control for an Independent four Wheel-Motor-Driven Electric Vehicle. In Proceedings of the Hybrid & Electric Vehicles Conference, Prague, Czech Republic, 23–24 March 2017. [Google Scholar]
- Zhang, J.; Song, B.; Niu, X. Optimization of Parallel Regenerative Braking Control Strategy. In Proceedings of the IEEE Vehicle Power & Propulsion Conference, Harbin, China, 3–5 September 2008; pp. 1–4. [Google Scholar]
- Chu, L.; Shang, M.; Fang, Y.; Guo, J.; Zhou, F. Braking Force Distribution Strategy for HEV Based on Braking Strength. In Proceedings of the International Conference on Measuring Technology and Mechatronics Automation, Changsha, China, 13–14 March 2010. [Google Scholar]
- Li, P. Regenerative braking control strategy for a mild HEV. Automot. Eng. 2005, 5, 67–103. [Google Scholar]
- Zhao, X.; Ma, J.; Wang, G.P. Composite braking control strategy of pure electric bus based on brake driving intention recognition. J. Traffic Transp. Eng. 2014, 4, 64–75. [Google Scholar]
- Cai, J.W.; Chu, L.; Fu, Z.C.; Ren, L.P. Regenerative Braking System for a Pure Electric Bus. Appl. Mech. Mater. 2014, 543, 1405–1408. [Google Scholar] [CrossRef]
- Song, B.L.; Zhou, X.S.; Li, J.; Wang, X.; Chen, C.; Sun, S.L. Modeling and simulation of regenerative braking system for pure electric light truck. J. Automot. Saf. Energy 2015, 6, 85–89. [Google Scholar]
- Sun, F.; Liu, W.; He, H.; Guo, H. An integrated control strategy for the composite braking system of an electric vehicle with independently driven axles. Veh. Syst. Dyn. 2016, 54, 22. [Google Scholar] [CrossRef]
- Wang, M.; Sun, Z.; Zhuo, G.; Cheng, P. Maximum braking energy recovery of electric vehicles and its influencing factors. J. Tongji Univ. (Nat. Sci.) 2012, 40, 583–588. [Google Scholar]
- Guo, J.; Wang, J.; Cao, B. Regenerative Braking Strategy for Electric Vehicles. In Proceedings of the 2009 IEEE Intelligent Vehicles Symposium, Xi’an, China, 3–5 June 2009. [Google Scholar]
- Zhang, W. Automotive Theory, 2nd ed.; China Machine Press: Beijing, China, 2010. [Google Scholar]
- Yu, Z. Automotive Theory, 5th ed.; China Machine Press: Beijing, China, 2009. [Google Scholar]
- Philipp, S.; Tim, B.; Constantinos, S. Comparison of Electric Vehicles with Single Drive and Four Wheel Drive System Concerning Regenerative Braking. In Proceedings of the Twelfth International Conference on Ecological Vehicles & Renewable Energies, Monte-Carlo, Monaco, 11–13 April 2017. [Google Scholar]
- Sun, D.; Lan, F.; Chen, J. A study on the braking energy recovery strategy for a 4WD battery electric vehicle based on ideal braking force distribution (Curve I). Automot. Eng. 2013, 35, 1057–1061. [Google Scholar]
- Yao, L.; Chu, L.; Zhou, F.K.; Liu, M.H.; Zhang, Y.S.; Wei, W.R. Simulation and analysis of potential of energy-saving from braking energy recovery of electric vehicle. J. Jilin Univ. (Eng. Technol. Ed.) 2013, 43, 6–11. [Google Scholar]


© 2019 by the authors. Licensee MDPI, Basel, Switzerland. This article is an open access article distributed under the terms and conditions of the Creative Commons Attribution (CC BY) license (http://creativecommons.org/licenses/by/4.0/).