Article

Low-Frequency Road Noise of Electric Vehicles Based on Measured Road Surface Morphology

1
School of Mechatronics Engineering, Nanchang University, Nanchang 330031, China
2
Product Development & Technical Center, Jiangling Motors Co., Ltd, Nanchang 330001, China
*
Author to whom correspondence should be addressed.
World Electr. Veh. J. 2019, 10(2), 33; https://doi.org/10.3390/wevj10020033
Submission received: 27 March 2019 / Revised: 8 May 2019 / Accepted: 11 May 2019 / Published: 30 May 2019

Abstract

:
In this paper, the noise vibration harshness (NVH) road surface morphology of a test site is scanned to establish a data processing system for the road surface, which can be used to transform the road surface morphology into the road surface excitation required for the road noise simulation analysis. The road surface morphology of the test site is used as the excitation input of the simulation analysis. The results obtained from the simulation analysis are equivalent to the experimental results. Using the actual scanning road surface morphology to simulate the excitation of a vehicle, the noise, as well as the vibration response of the vehicle under the actual road excitation of NVH in the early stage of vehicle development, can be accurately predicted. In the physical prototype stage, the rectification of vehicle road noise and the optimization to provide the needed excitation for the simulation analysis can be done, which will reduce the labor costs of the relevant experiment. Therefore, this method of road noise research has important engineering significance.

1. Introduction

The noise, vibration, and comfort of the vehicle are important indicators for measuring automobile quality [1]. The engine, road, and wind will all induce noise. These are the three major sources of noise in automobiles [2], but for electric vehicles, engine noise is non-existent. Tire-road noise is the main source of noise produced by a car and is a remarkably complex phenomenon resulting from the combination of airborne and structure-borne phenomena, where the source is provided by the contact between tire and road surface [3]. Airborne noise is related to the compression of the air trapped within the tread of the rolling tire [4]. Studies regarding optimal road texture and mixture design for noise abatement are widely available [5,6,7].
When a vehicle travels on a rough road, the road excitation passes through the tire to the suspension system and then spreads to the body, which will cause noise and vibration inside the vehicle, and its handling will directly affect the subjective feelings of the driver in the vehicle [8]. At present, domestic and foreign scholars have done a lot of research on the mechanisms of road noise generation and the control of the road noise transfer path. In the process of vehicle development, the research on road noise can be divided into two categories. One is to rectify the road noise problem in the pre-production or post-sale phase of the product. For example, based on the transfer path analysis (TPA) method, it is possible to identify the components that contribute to road noise and then optimize the design accordingly. For example, Zhang [9] optimized the interior noise based on the experimental TPA method and added dampers to the left and right rear suspensions to effectively reduce the interior noise caused by the road surface. Tan et al. [10] used the TPA method to combine the test and the simulation to optimize the analysis. By reducing the stiffness of the bushing, the road surface excitation noise of an SUV (Sports Utility Vehicle) was effectively reduced. Shivle et al. [11] optimized the road noise of a certain model based on modal analysis. The other category is to predict and control road noise problems during the product design stage. Li [12] cited modal tire modelling technology based on the random response analysis method and analyzed and calculated the vehicle road vibration and noise conditions under various vehicle speed conditions. Chen [13] used multi-body system dynamics theory, finite element theory, and boundary element theory to simulate the low-frequency noise characteristics of the car caused by uneven road excitations. Cha [14] used the multi-body dynamics model to obtain the excitation force at the connection point between the suspension and the vehicle body under the road surface excitation. The excitation force was used to analyze and optimize the noise inside the vehicle caused by the road surface.
At present, domestic and foreign scholars have done a lot of simulation analysis and research on road noise in the stage of product design. However, most of the road excitations [15] used by domestic and foreign scholars for studying road noise problems are based on national standard road surfaces [16]. The road test results, using benchmark cars, are used to collect road excitations, and then the incentives collected by the benchmark vehicles are used for the simulation analysis of the incentive input of developed models. It is difficult to simulate all types of complex road surface excitations by using the national standard road surface excitation, and it is impossible to predict the road noise and vibration of vehicles under various actual road surface conditions. However, there is a difference between the road excitation collected by the bench-marking vehicle and the actual vehicle model, which makes it difficult to accurately simulate the road noise and vibration caused by the actual road surface excitation. In this paper, a data processing system for the road surface morphology is established on the basis of the actual geometric morphology of the test site. The actual geometric morphology of the test site is transformed into the actual random excitation of the vehicle driving on the road, and the noise and vibration inside the vehicle are simulated and analyzed. The simulation results are then compared with the experimental results in order to verify the effectiveness of the data processing system of the road surface morphology of the scanning test ground. This also verifies the reliability of the road noise simulation analysis based on the road morphology excitation. The road surface morphology of the scanning test ground can be converted into the road surface excitation needed for the simulation analysis, which can be used for various vehicle speeds in the early stages of the product design. The speed can be determined at this stage. The accurate simulation and analysis of both the noise and vibration in the vehicle under the random excitation condition of the road surface have great engineering significance, and they can be utilized to predict road noise control and improve the competitiveness of the product.

2. Establishment of Digital Road Spectrum

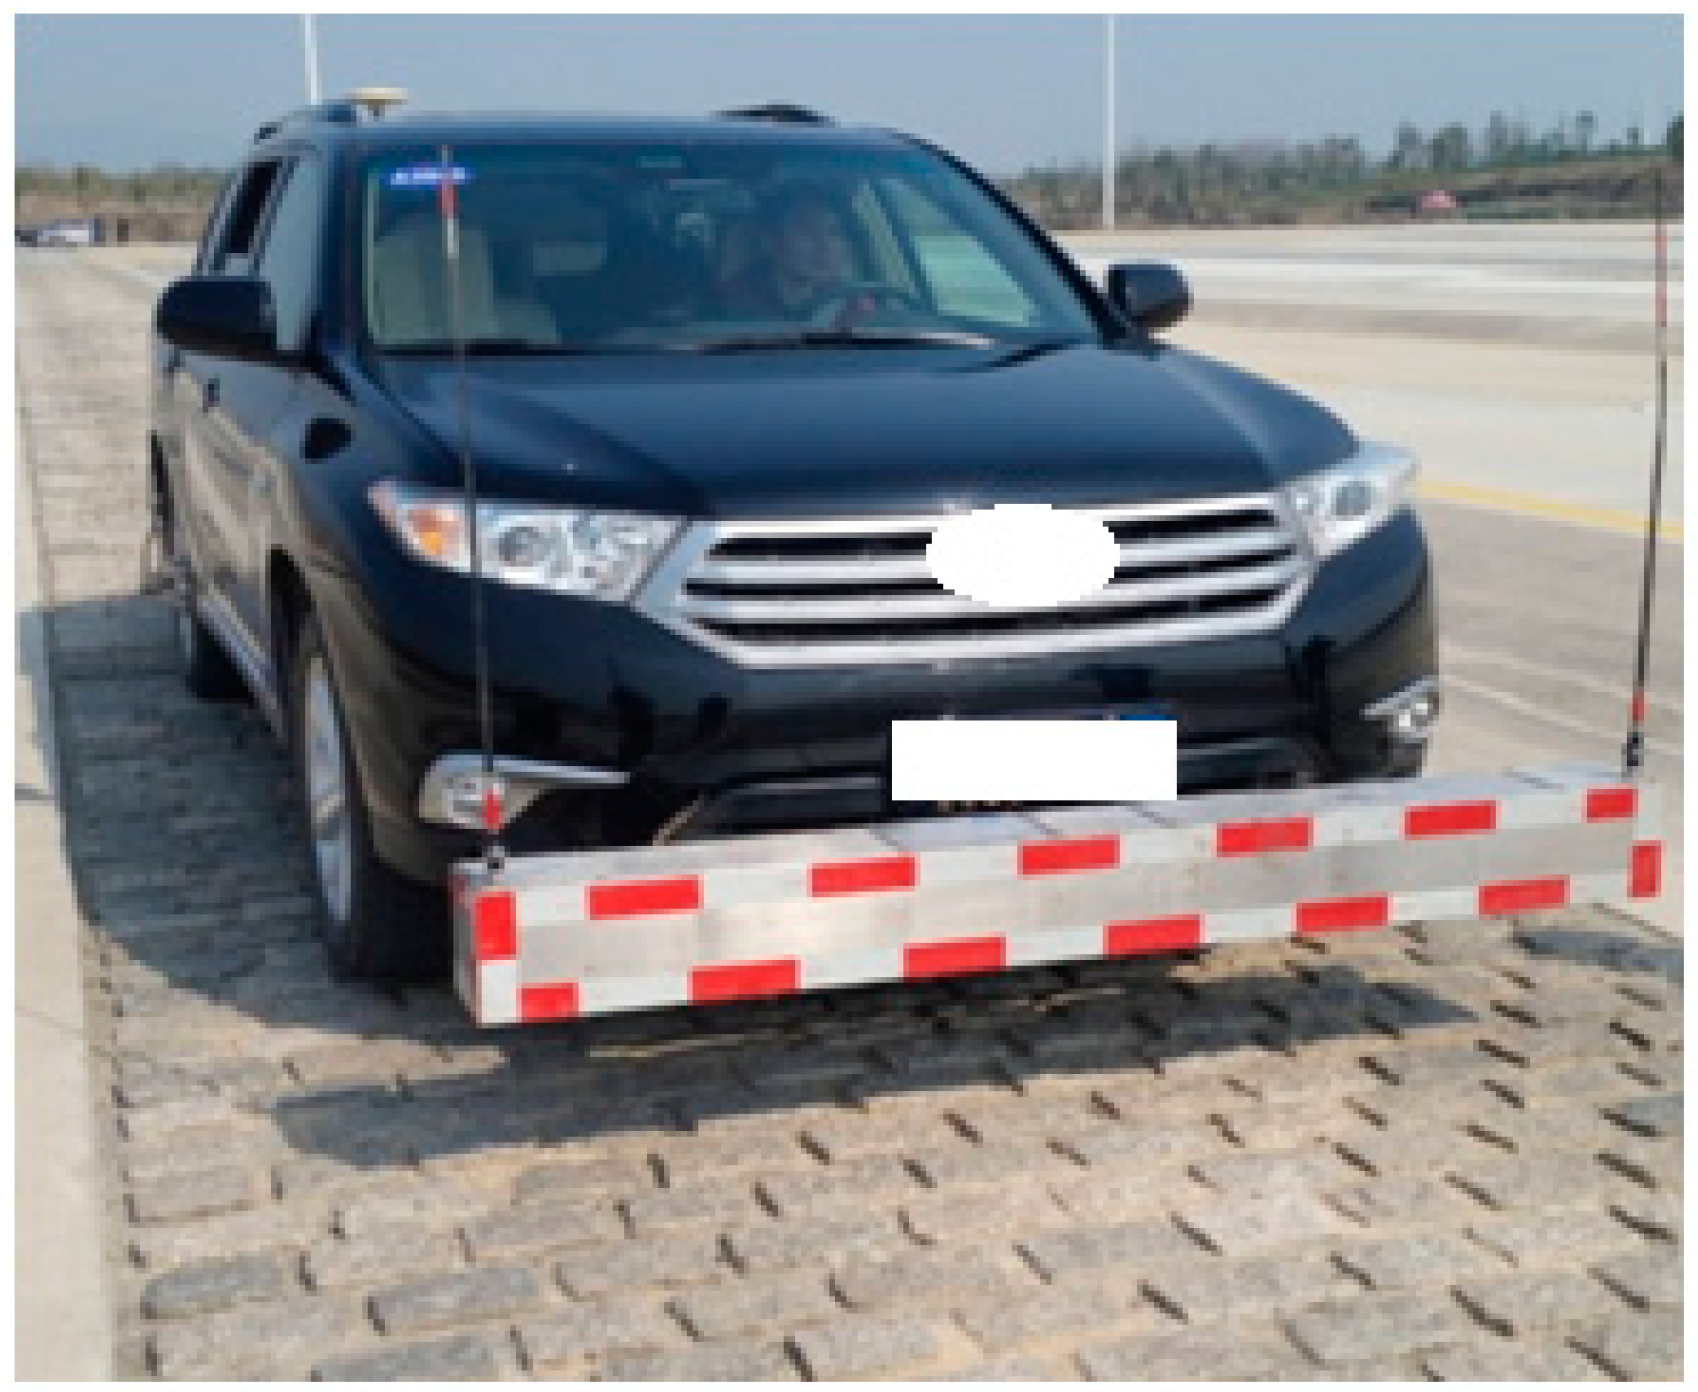
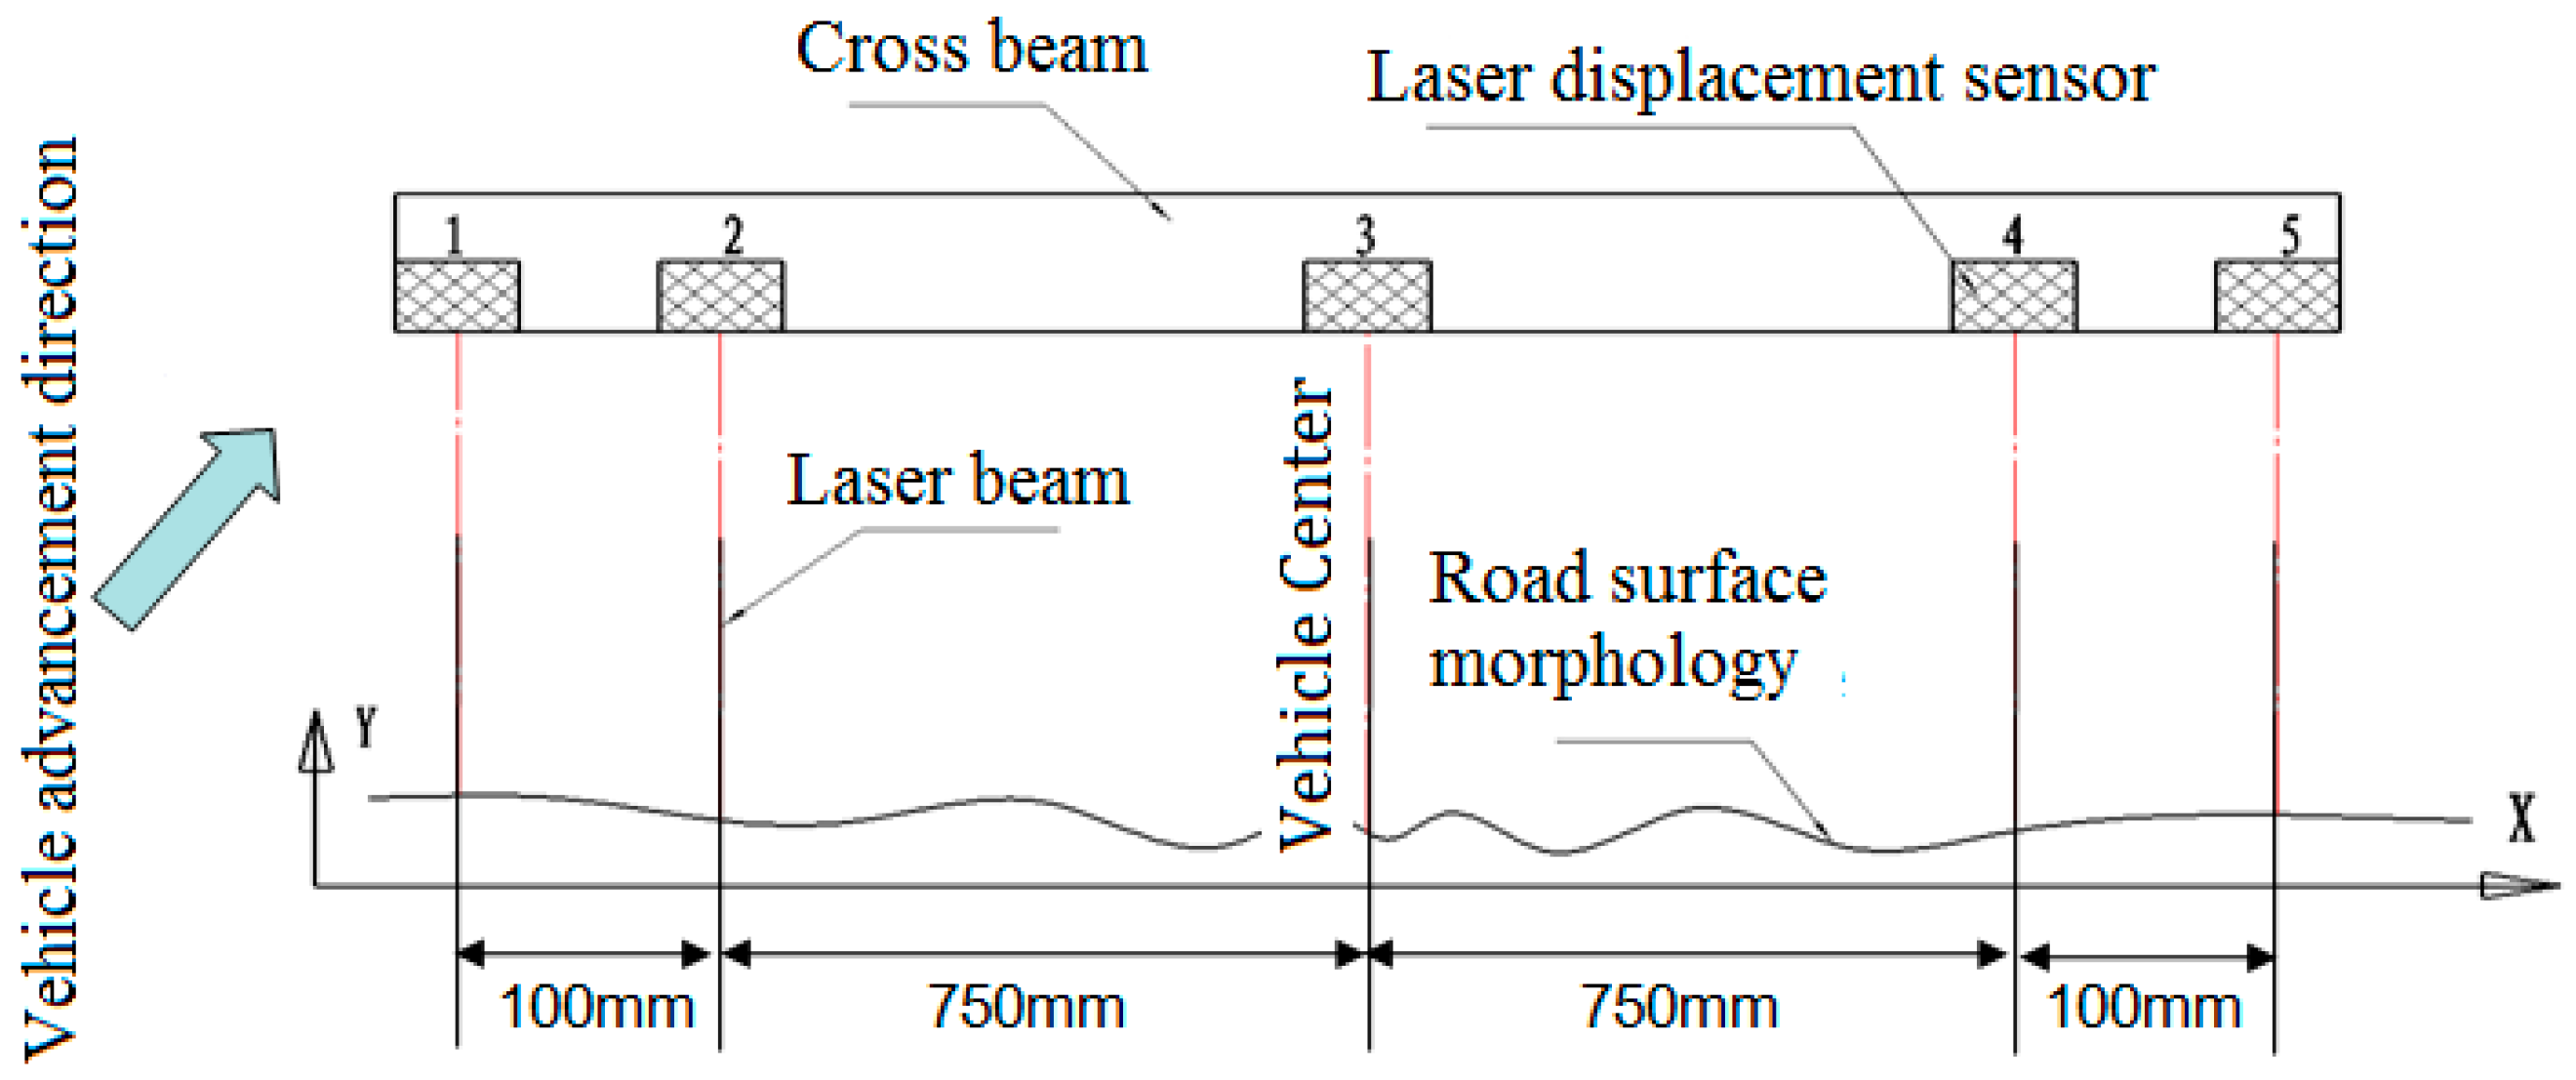
2.1. Typical Noise Vibration Harshness Road Surface Morphology Scanning Acquisition in the Test Field

The road vertical section inspection system for scanning the road surface morphology of the test field is shown in Figure 1. Both the laser displacement sensor and acceleration sensor are attached to the front end of the vehicle. According to the principles of triangulation, the surface features of the pavement can be detected. Five laser displacement sensors are used to sense the change in the geometric shape of the pavement. The altitude data of the pavement is reconstructed by measuring the distance between the crossbeam and the ground. The arrangement of the laser displacement sensor is shown in Figure 2. The acceleration sensors (six routes in all) are mainly used to measure the vibration of the vehicle itself in order to eliminate the influence of the vibration of the car body on the characteristics of the scanned road surface [17]. The sampling frequency of the system is set to a sufficient height. The vehicle travels at a uniform speed along the test road. The sampling interval of the road surface is small enough to get adequate altitude data. The typical noise vibration harshness (NVH) road surface morphology of the test site is repeatedly collected to ensure the accuracy and effectiveness of the data in each road section.

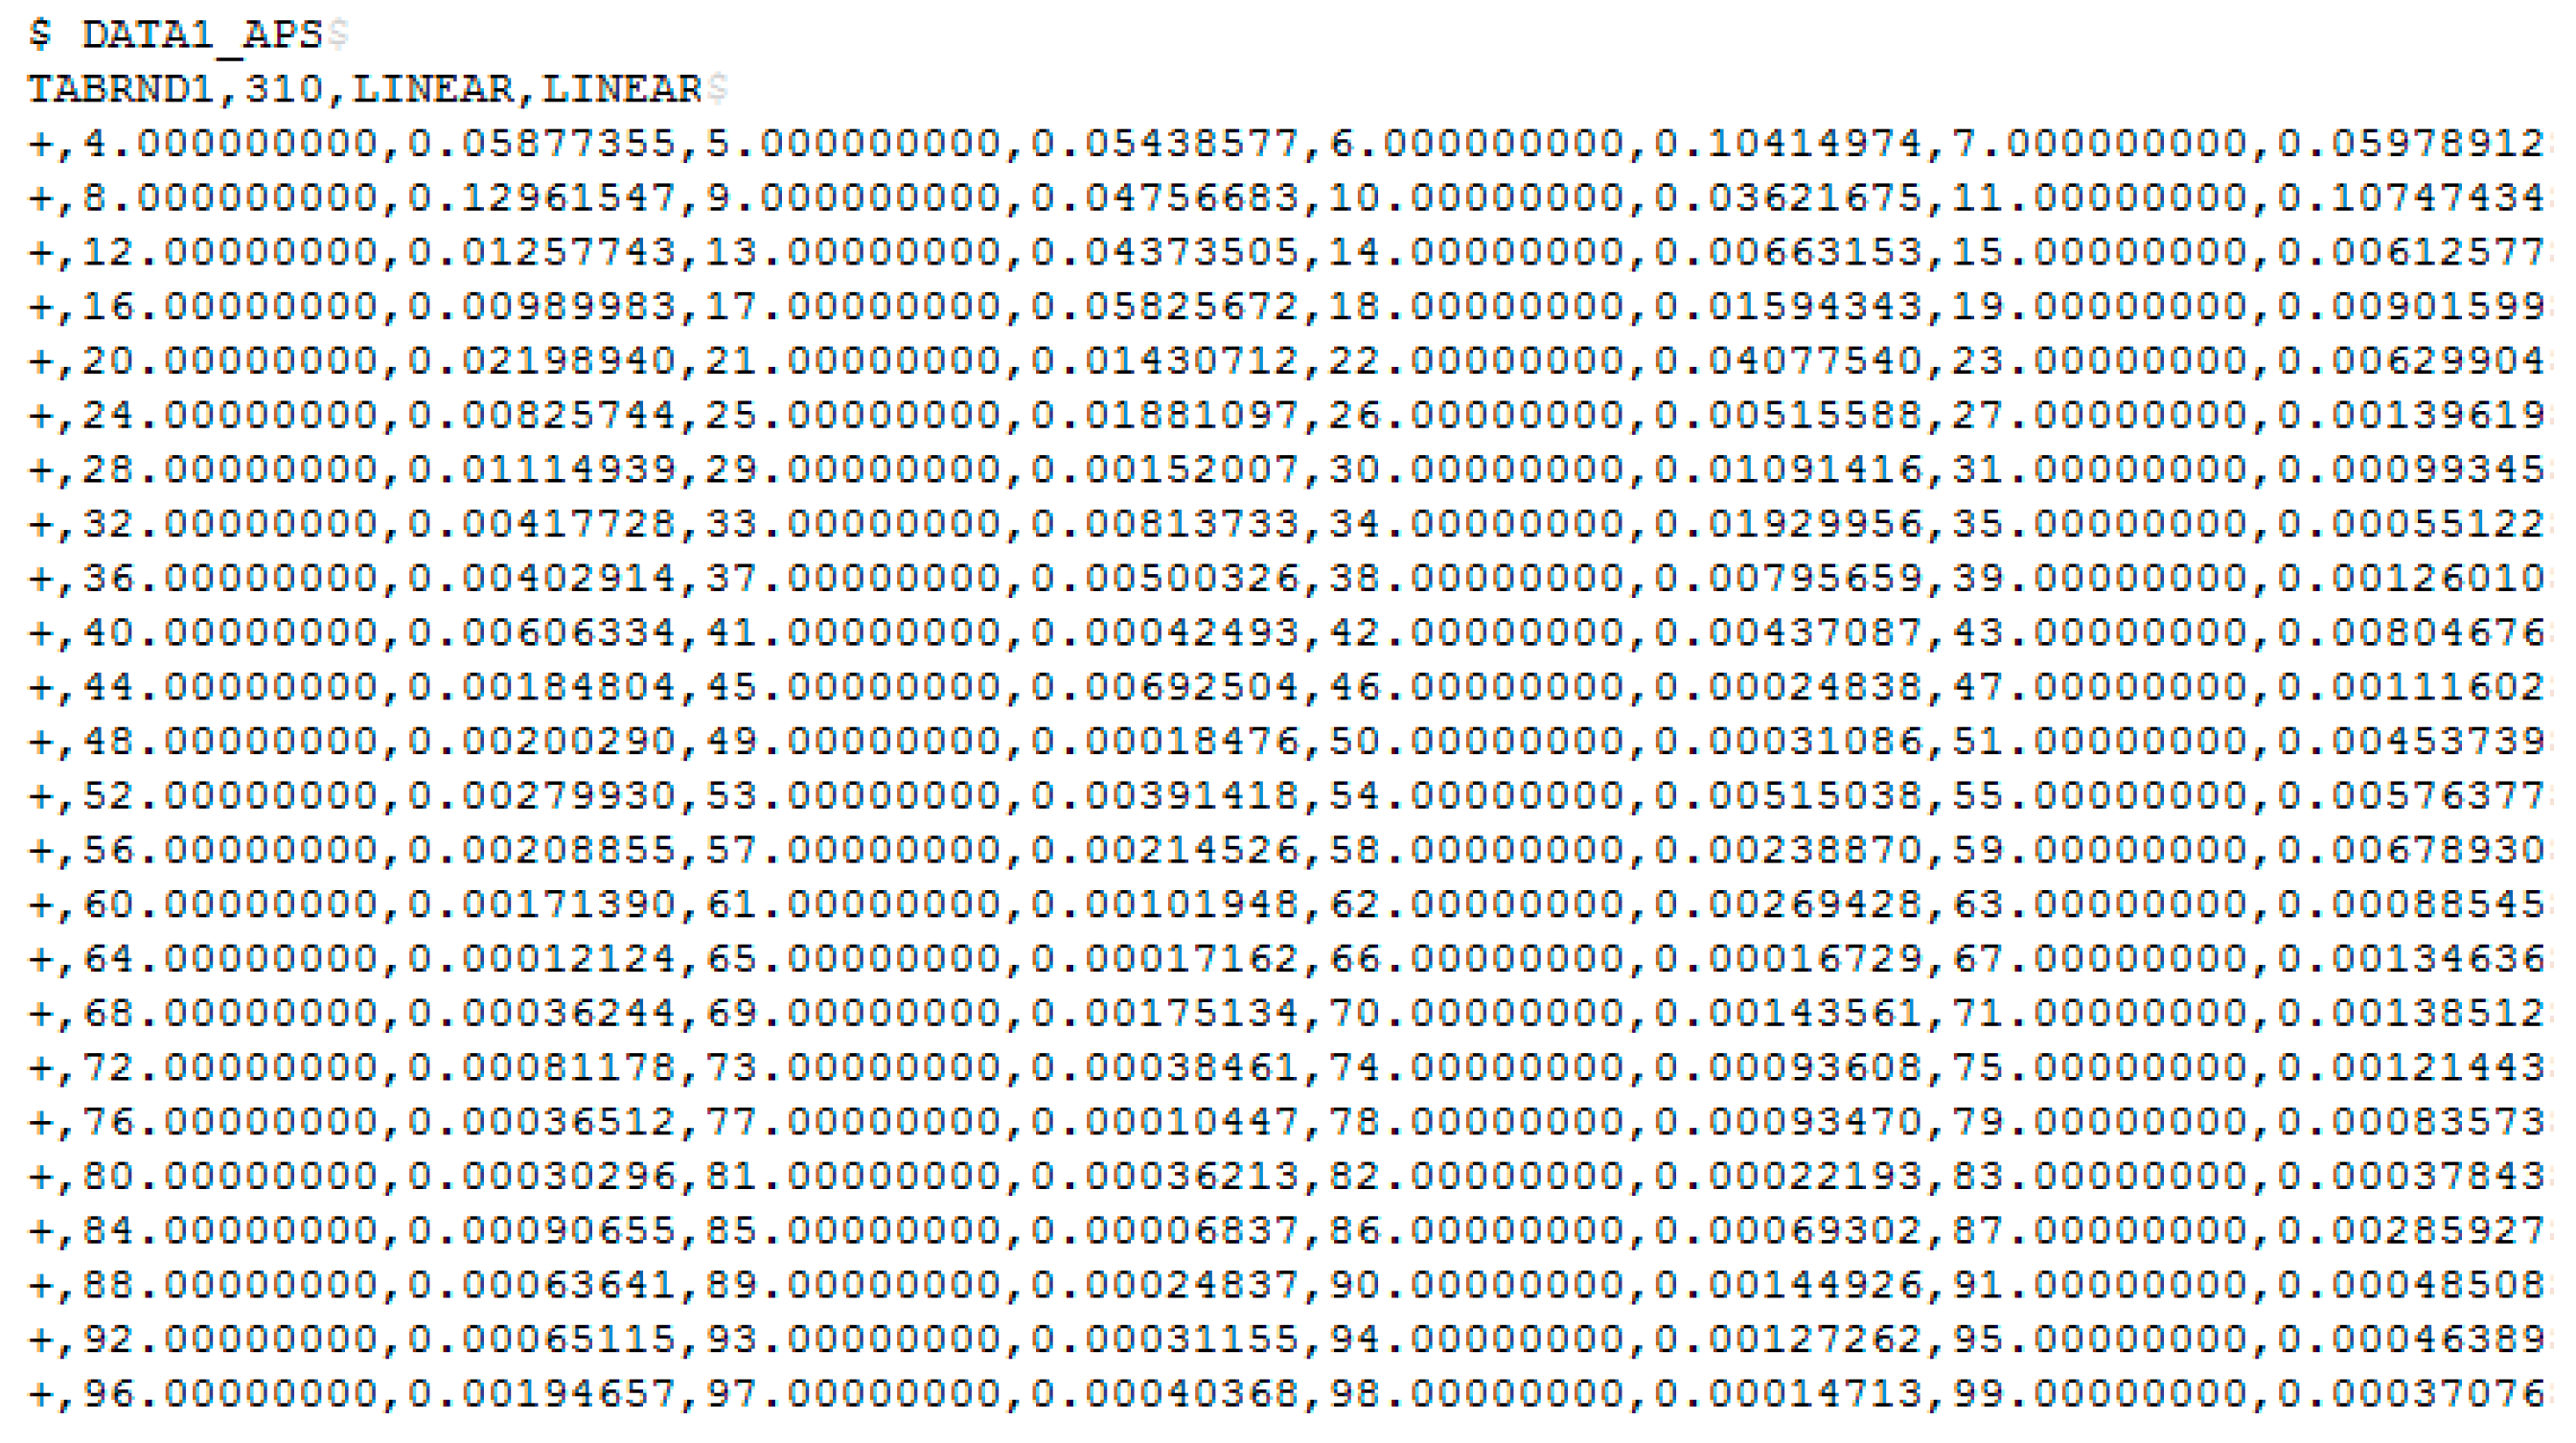
2.2. Data Processing of Road Surface Morphology

When the vehicle travels along a rough road, the tire is excited by the random uneven road surface, which causes a vibration and noise response inside the vehicle. The analysis of the noise and vibration response in the road is essentially a random analysis process. In the vehicle random response simulation analysis, the power spectral density is generally used to express the road excitation.
According to the “GB/T 7031-2005 Mechanical vibration—Road surface reporting of measured data”, the power spectral density of the vertical displacement of the road corresponding to each laser is analyzed. The spatial power spectral density Gq(n) of the actual road surface is expressed in the following Equation [18]:
G q ( n ) = G q ( n 0 ) ( n n 0 ) w
where, G q ( n ) is the road power spectral density, and the unit is m 2 / m 1 ; n is the spatial frequency that is the reciprocal of the wavelength λ , indicating that several wavelengths are included per meter length, and the unit is m 1 ; and n 0 is the reference spatial frequency, n 0 = 0.1 m 1 . The road surface spectral value under n 0 of the reference space frequency G q ( n 0 ) is known as the road roughness coefficient, the unit is m 2 / m 1 . The frequency index is expressed with w , which will determine the frequency structure of road power spectral density.
In the random vibration analysis, the frequency domain method is used to study the random vibration characteristics of the vehicle, and the spatial frequency spectral density G q ( n ) can be converted into time frequency spectral density G q ( f ) according to the following formula:
G q ( f ) = G q ( n 0 ) ( ω 2 π n 0 ) w v w 1 = C s p v w 1 f w , C s p = G q ( n 0 ) n 0 w
where C s p is the surface shape of the collected road.

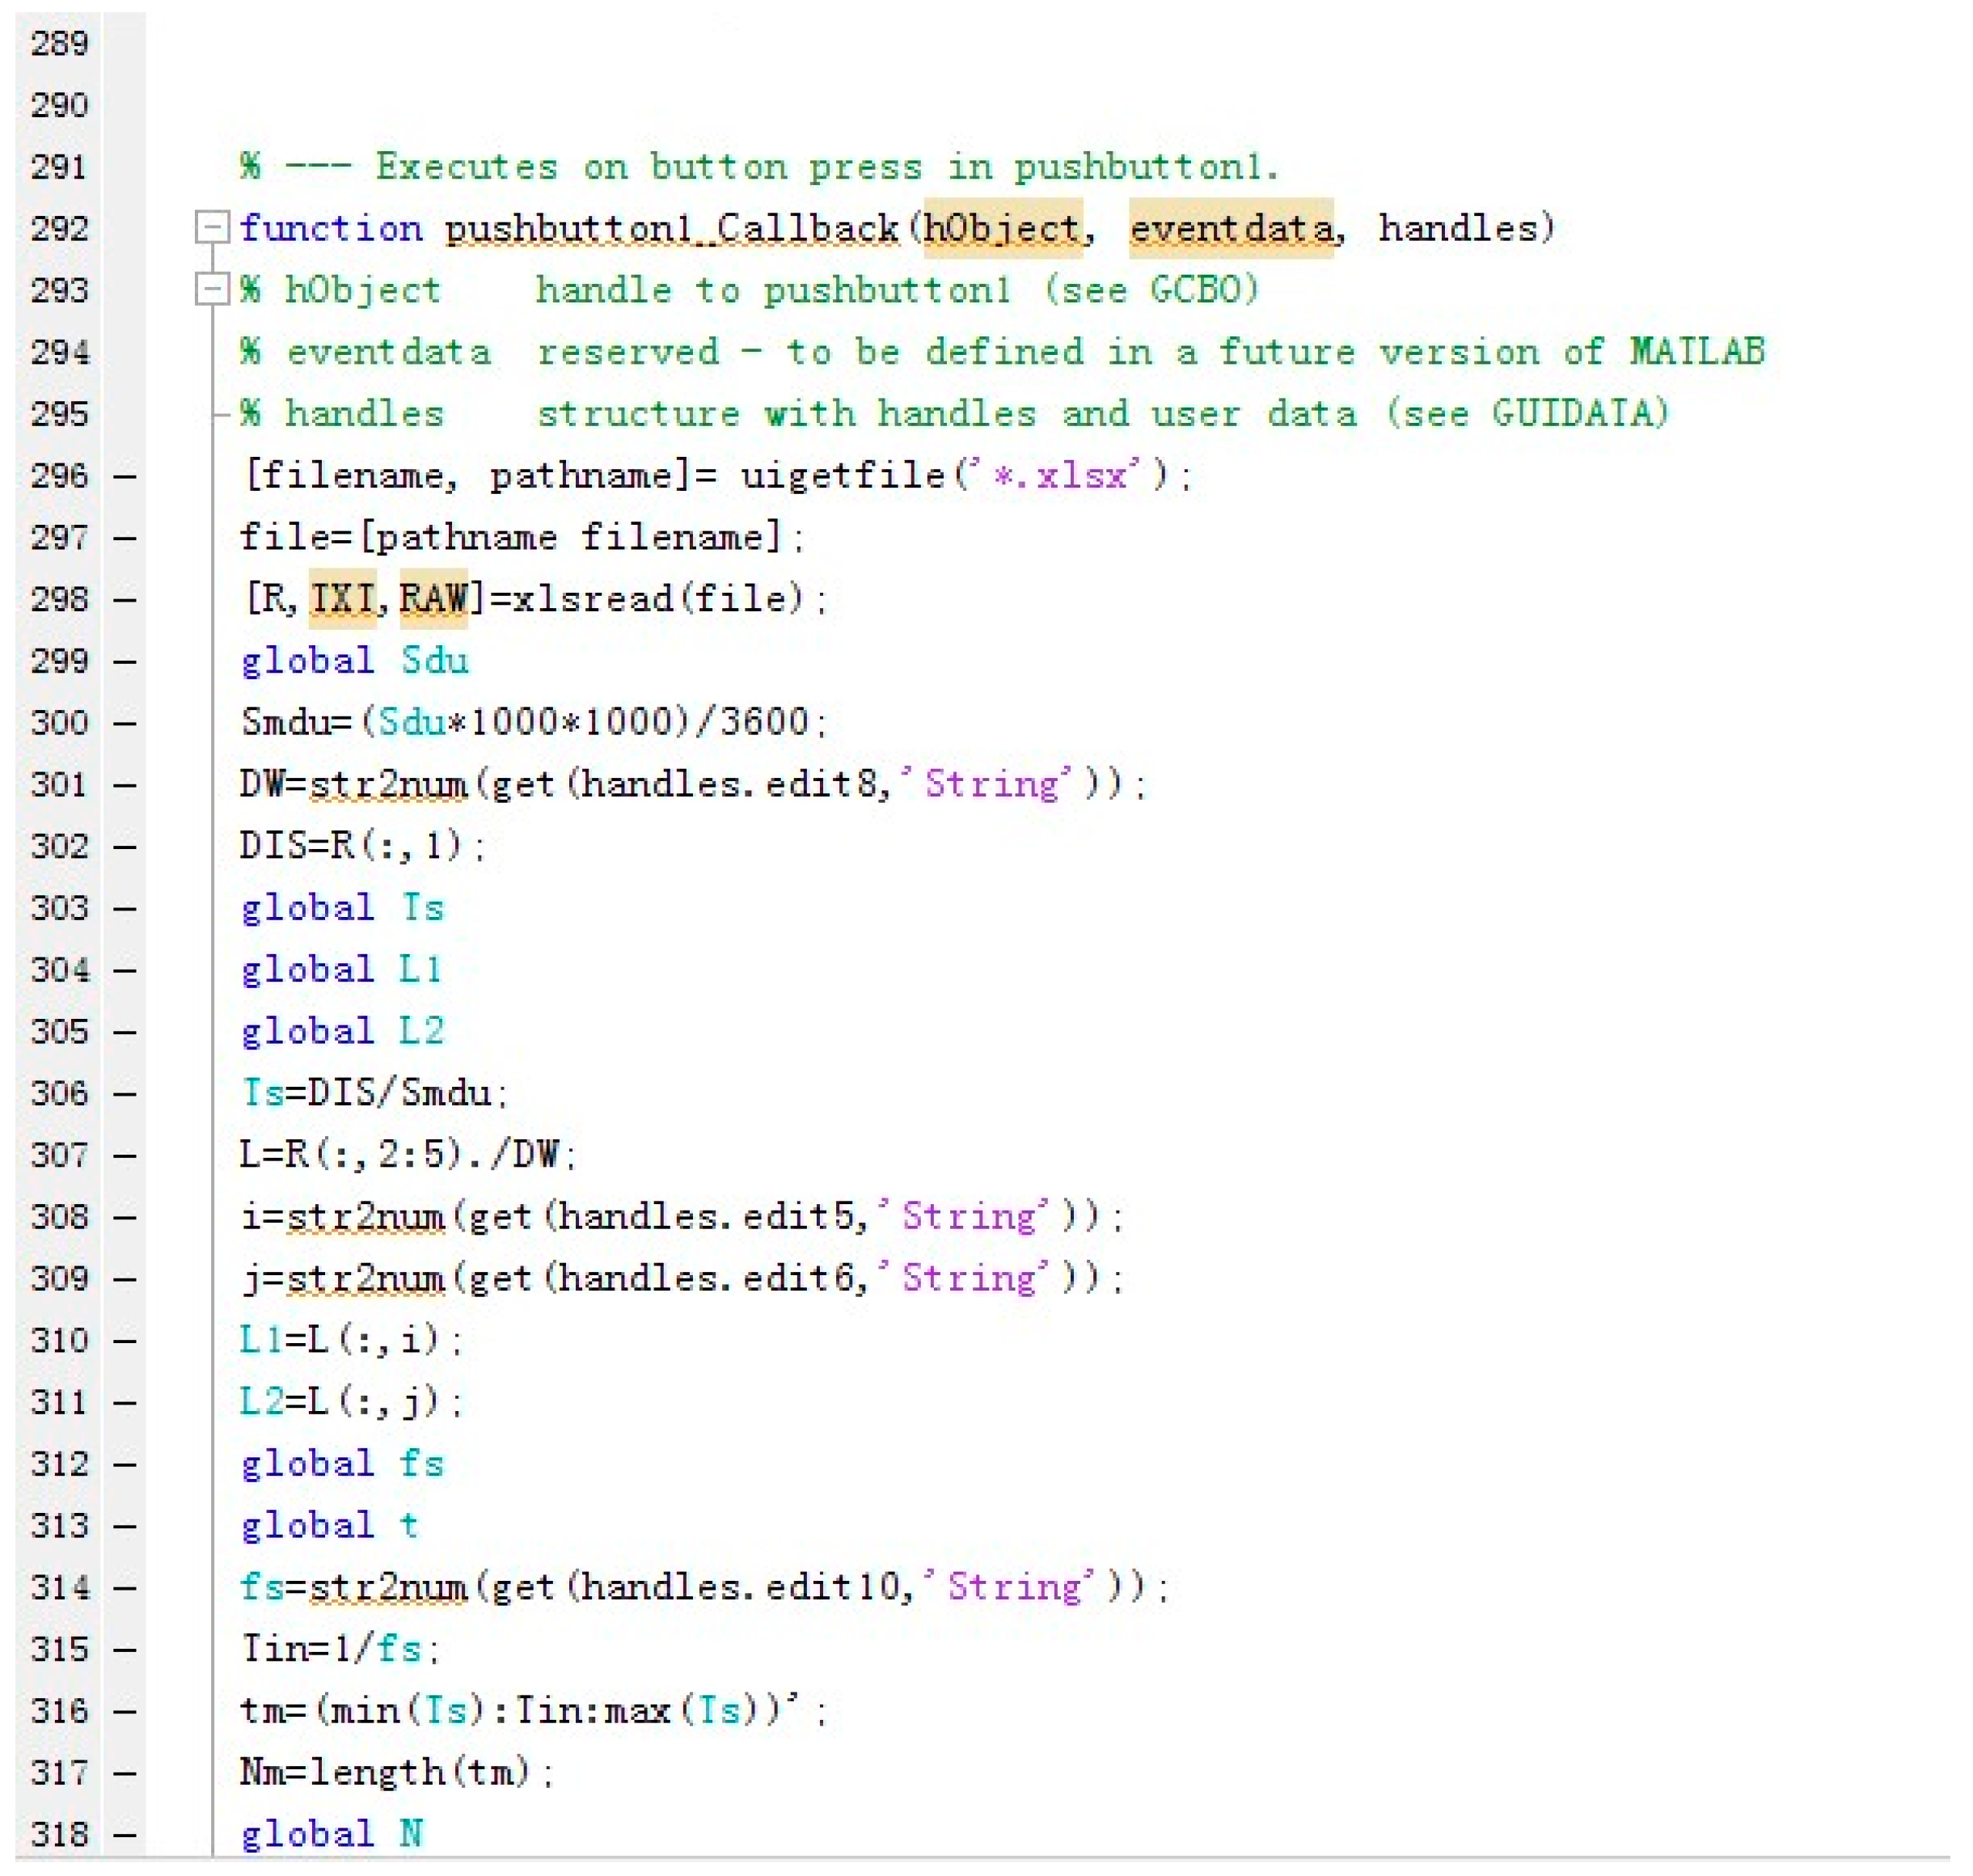
2.3. Road Surface Morphology Data Processing System

The Matlab programming data processing system is constructed using Matlab programming. Some of the code is shown in Figure 3 [19,20,21,22,23,24]. Using the written system, the collected road altitude data is converted into the actual excitation of the tire under various vehicle speeds. The working interface of the road surface data processing system is shown in Figure 4. First, the speed of the vehicle on the road is input, then the road altitude data of the left and right wheels of the vehicle and the altitude data are imported according to the needs of the actual simulation analysis. The relevant frequency and resolution are input as the starting frequency, the termination frequency, and the frequency interval. The self-power spectral density of the left and right wheels in the relevant frequency domain can be calculated quickly, as can the cross-power spectral density under the excitation of the road surface. The output results are shown in Figure 5. In the later stage of road noise simulation, the self-power spectrum density and cross-power spectrum density of the left and right wheels calculated by the system are applied, which can quickly calculate the noise and vibration response of the vehicle on the road according to the relevant speed.

3. Calculation of Simulated Road Noise

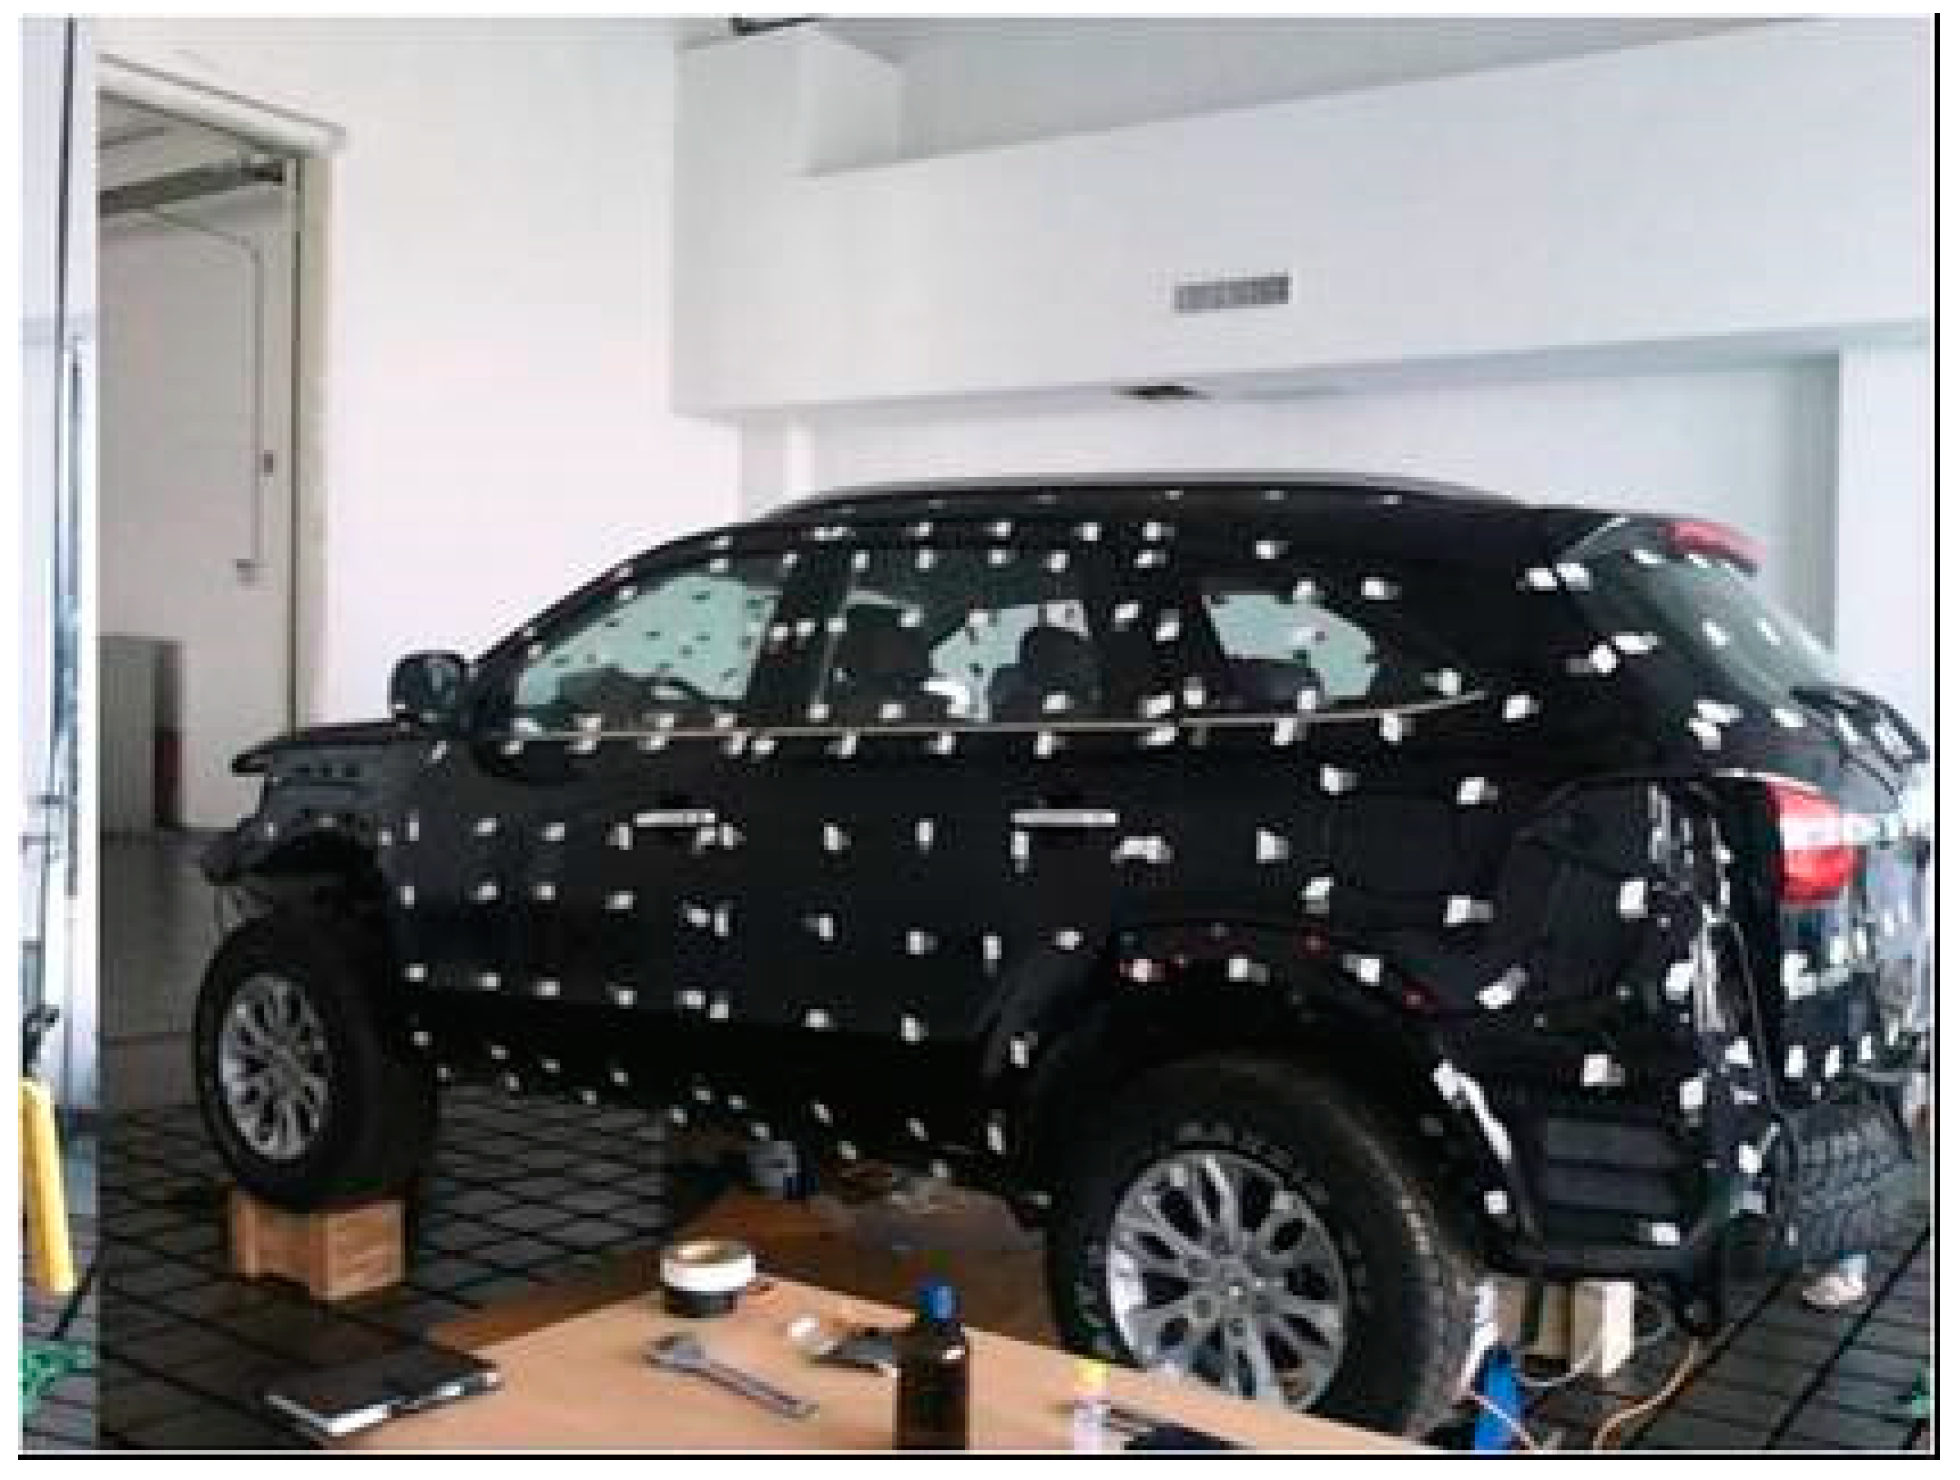
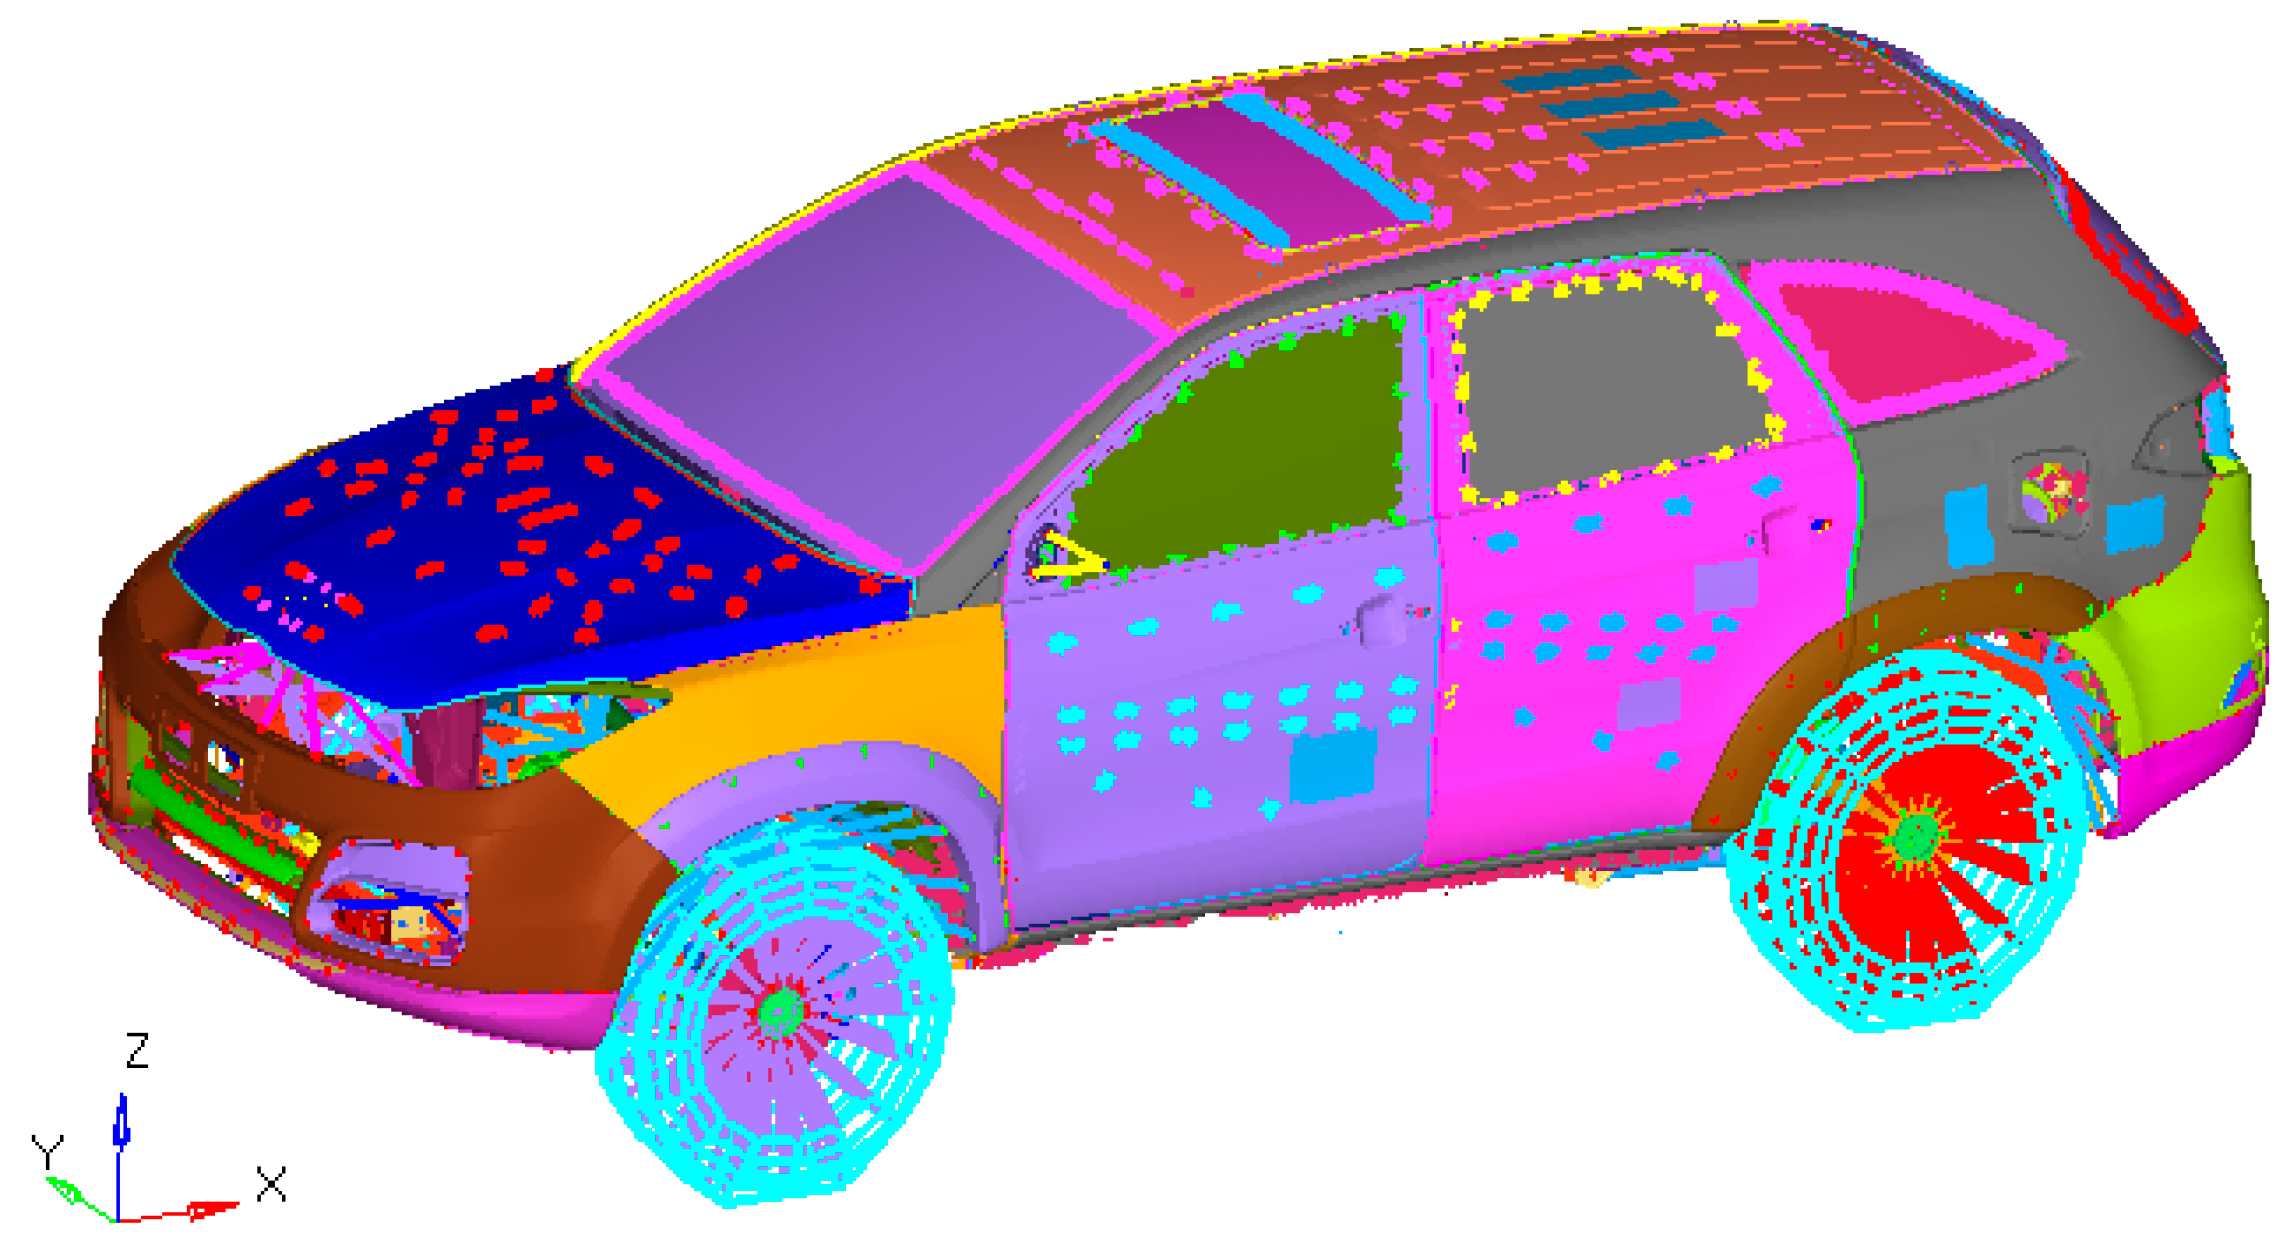
3.1. Establishment of the Finite Element Model for the Electric Vehicle

According to the altitude data collected through the road surface topography of the typical NVH test field scanned, the system for simulating data on road surface noise can be used to simulate the road noise of the vehicle with the finite element method. The finite element model of a vehicle includes the trimmed body, suspension system, exhaust system, power transmission system, steering system and wheel. For sheet metal and pipeline, the shell element is used, with quadrilateral and triangle as the auxiliary method of modelling. The triangle has a low precision and a proportion of less than 10%. The ACM (Area Contact Model) unit is used to simulate the spot welding, and the welding seam are node-aligned and simulated using the shell elements. For the interior, the non-structural quality form weight is used for simulation, and some structural parts are simulated by means of concentrated mass and rigid unit connection. The stiffness parameters of the rubber parts such as the bushing and the rubber hoist in the finite element model of the electric vehicle are measured and the damping parameters of the shock absorber are obtained through the measurement. Through tire modelling, the modelling method of modal tires is adopted while being integrated with the experimental results of tire parameters, modal properties and mechanical properties. The corresponding modal tire model is established before being corrected, and finally the tire model is reduced to spring and mass unit representation. The vehicle model is shown in Figure 6 below.
In order to verify the accuracy of the model and facilitate the calibration of the simulation analysis of road noise in the later stage, after the vehicle model is established, the finite element model of the electric vehicle is used for free modal analysis. The simulation results are compared with the experiment results. The experiment photos of the electric vehicle are shown in Figure 7. As there are numerous modal modes of the electric vehicle, the simulation and experimental results of some typical modal modes of the vehicle are listed in Table 1. It can be seen in Table 1 that the deviation of the simulation results from the experimental results is small, showing that the finite element model of the electric vehicle is accurate and effective. Figure 8 shows a diagram of the simulation results specified in Table 1.

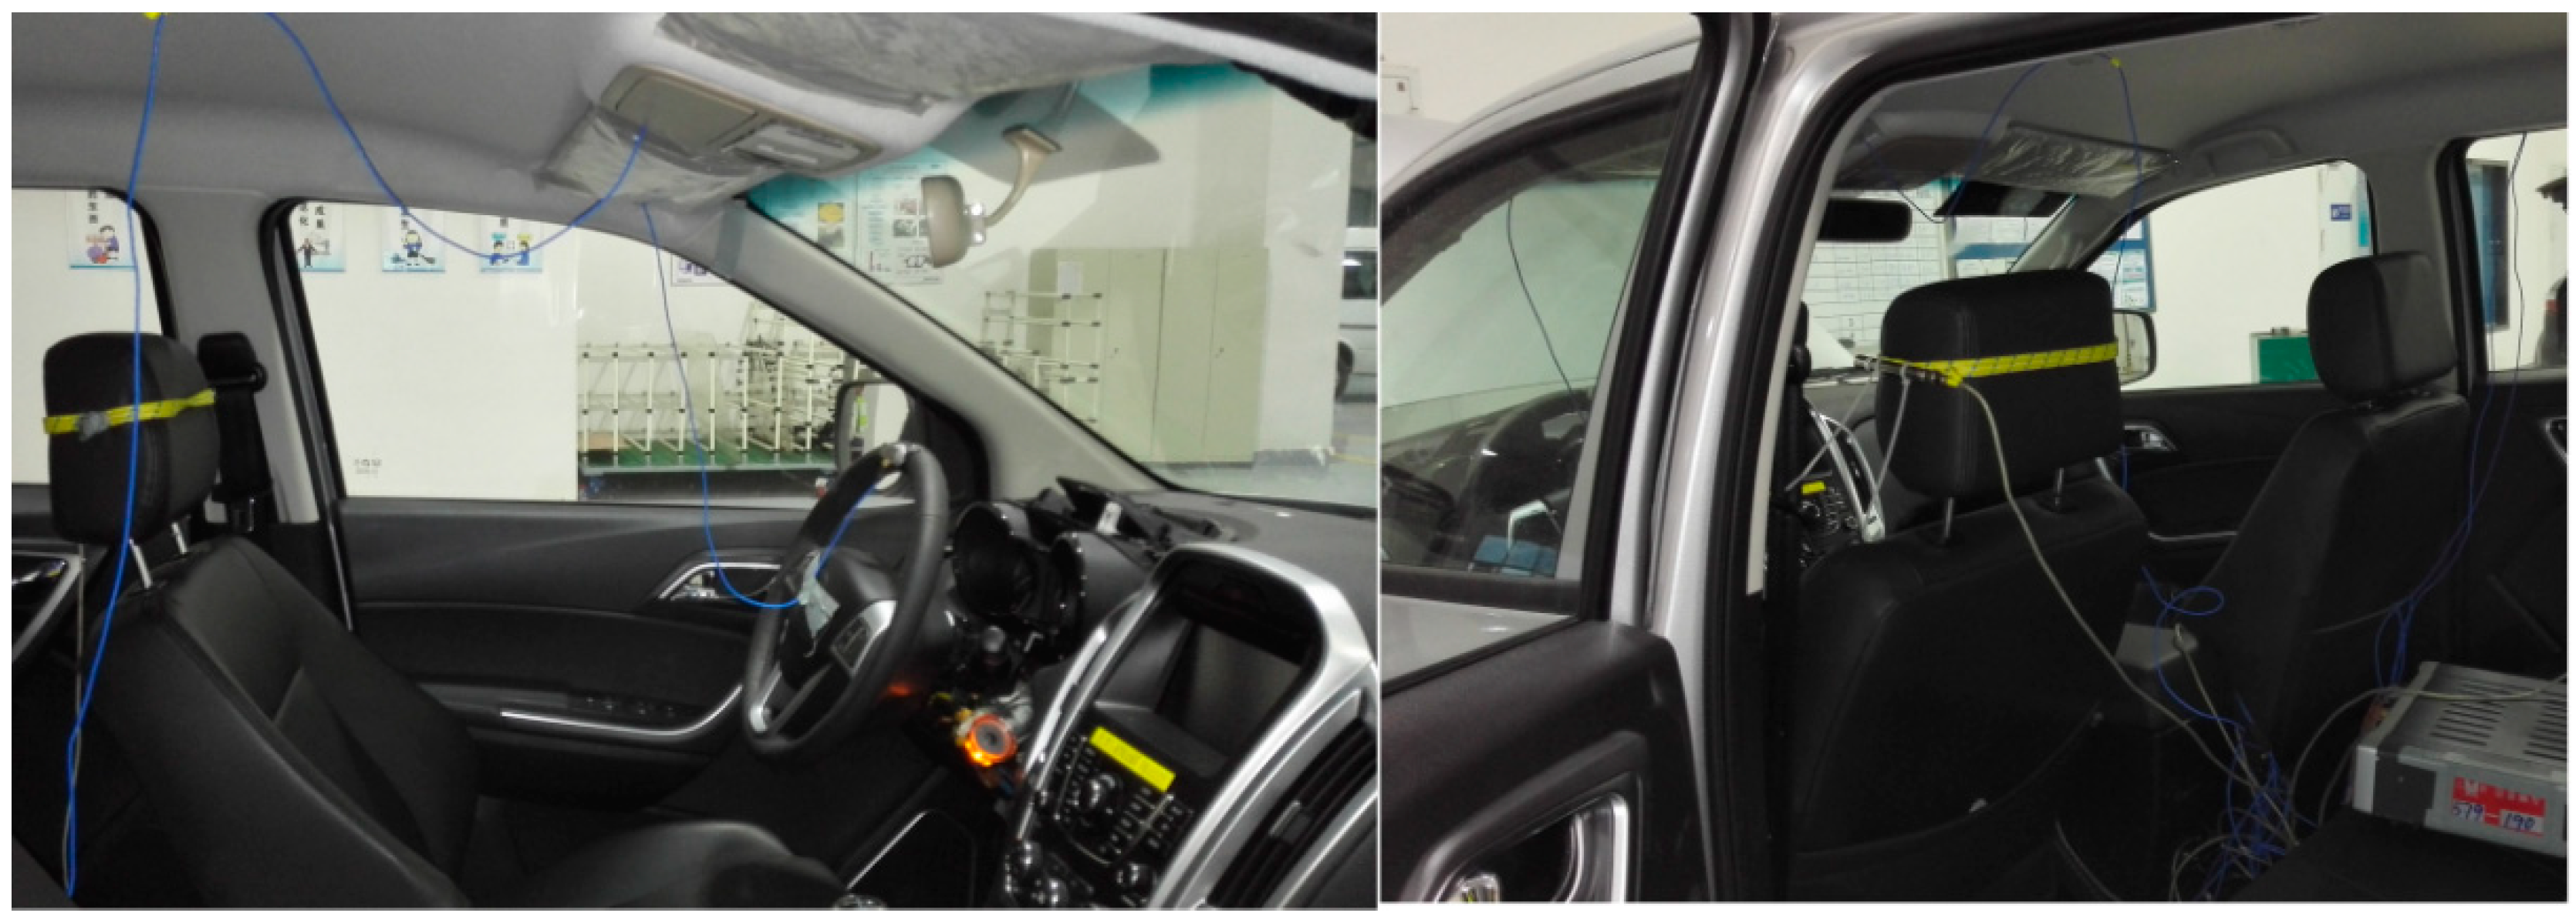
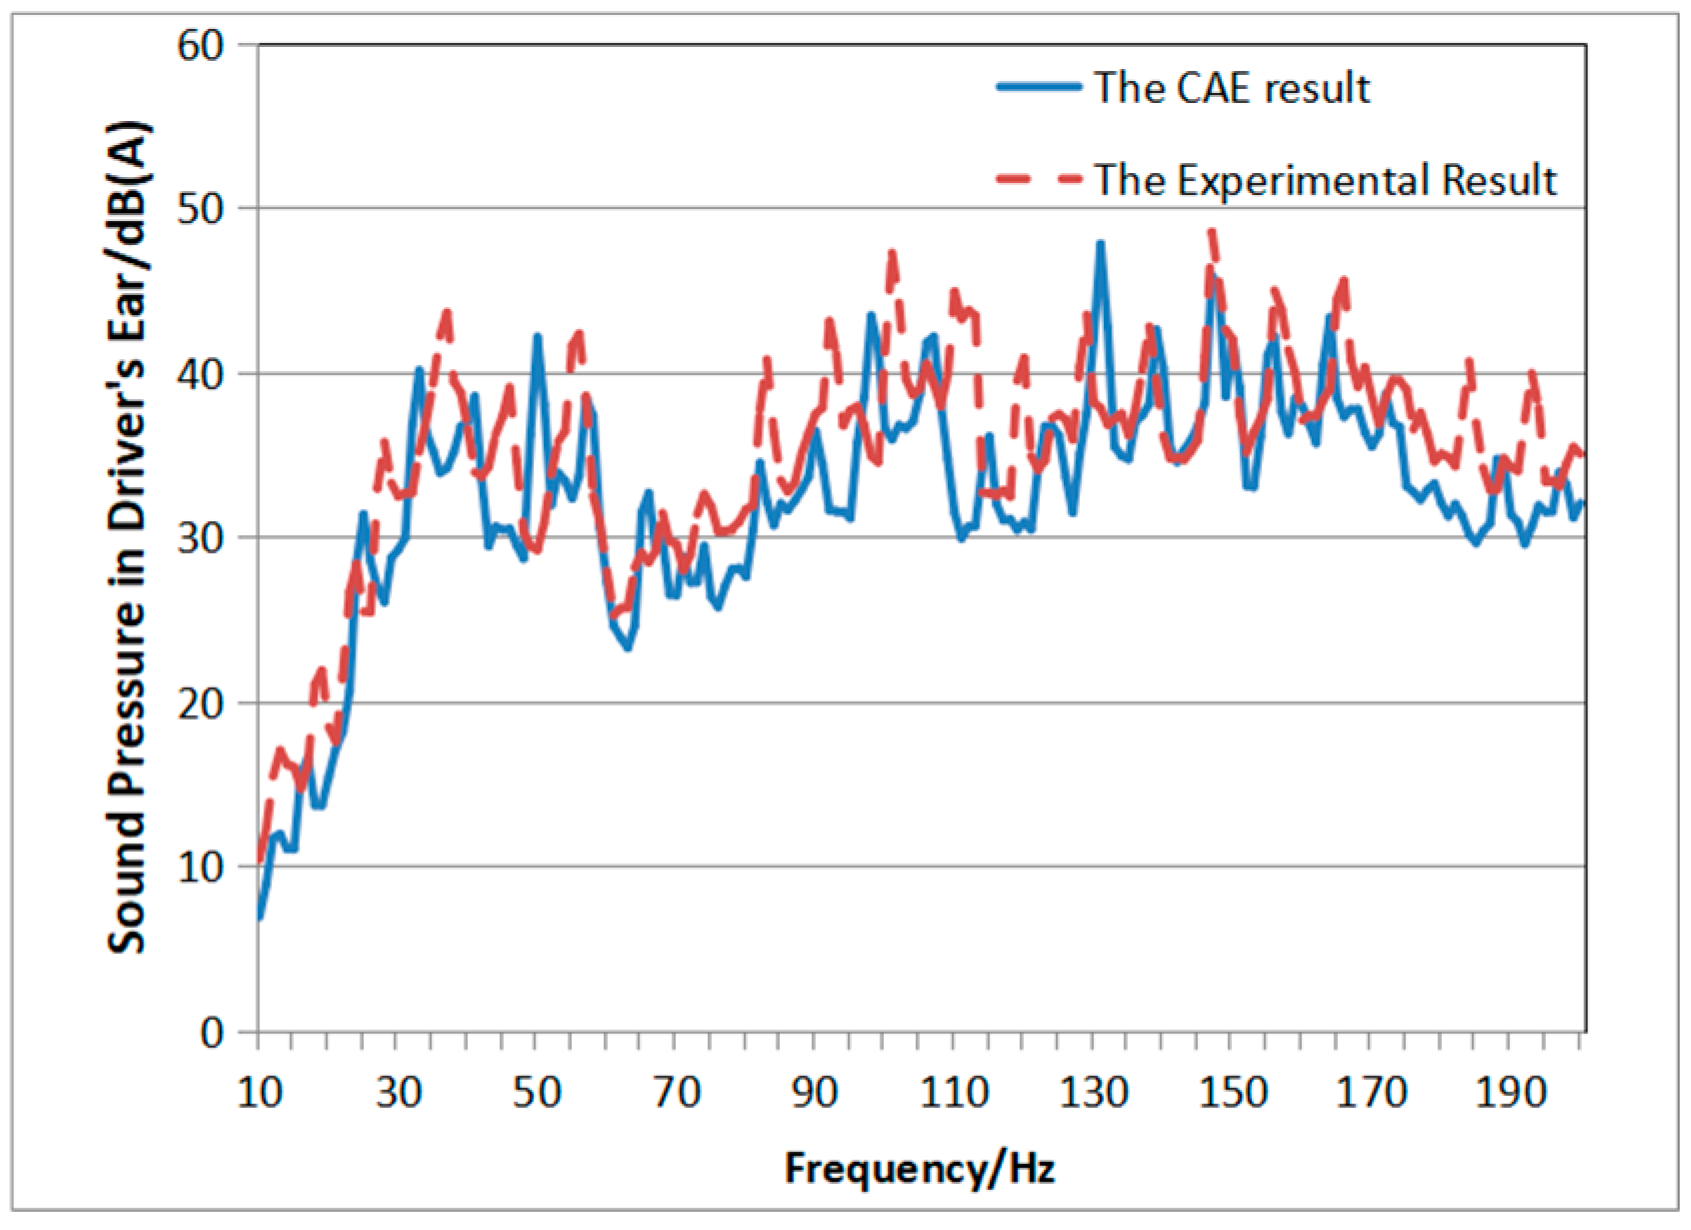
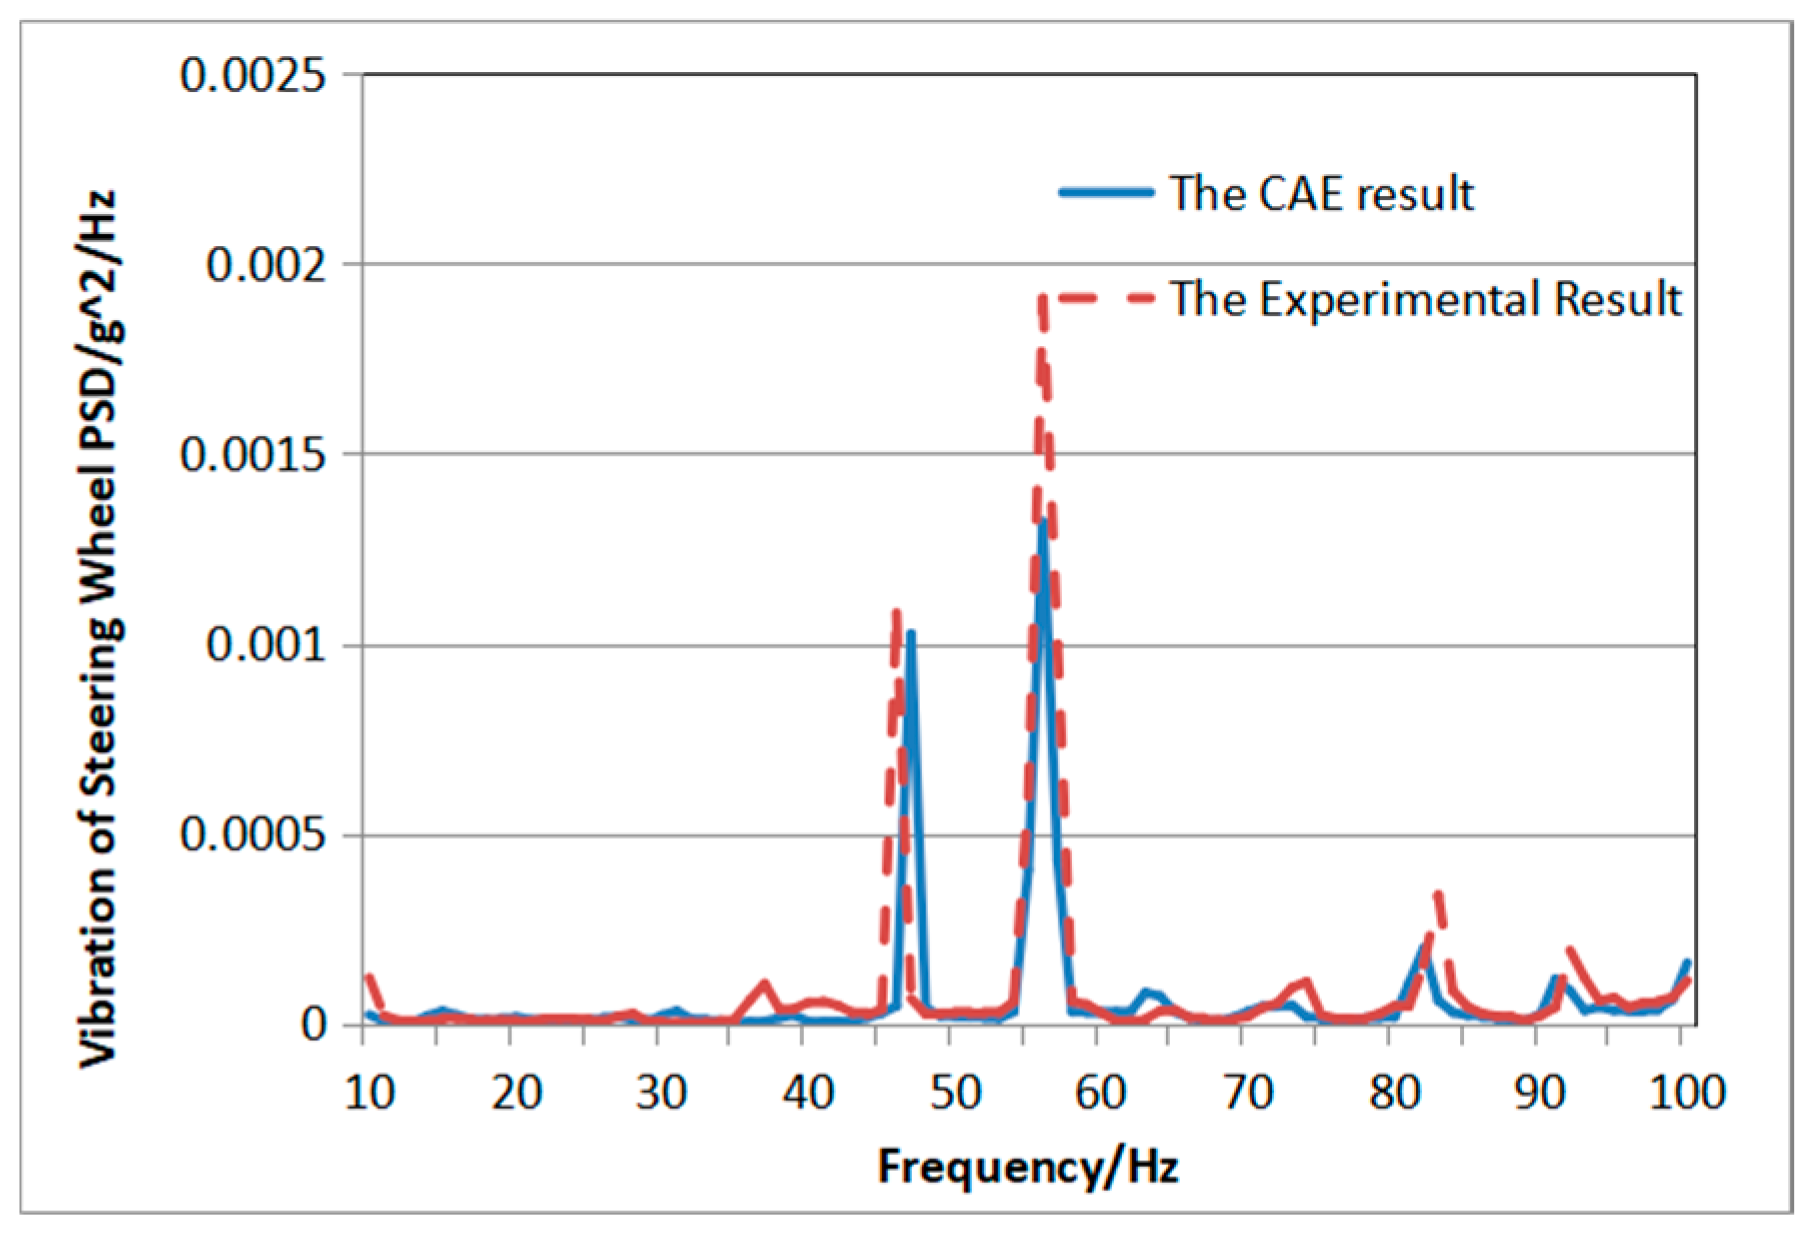
3.2. Simulation Analysis and Experimental Bench-marking of Low-Frequency Road Noise of the Electric Vehicle

Due to the random roughness of the actual road surface, the study of low-frequency road noise of the electric vehicle based on the pavement morphology of the measured experimental ground involves the use of the simulation analysis software to analyze the random vibration response of the electric vehicle based on the excitation of random road surface. For such an analysis, the first step is to calculate the transfer function from the excitation point to the response point in the vehicle, such as the transfer function from the tire grounding point to the inner ear, seat and steering wheel. According to Equation (3) shown below, the second step involves the use of the excitation obtained by the previous data processing system for the road surface, and in the meantime, the corresponding self-power spectral density and mutual power spectral density are respectively applied to the left and right tires. In this way, the interior response of the vehicle can be quickly calculated [25].
[ G Z ] n × n = [ H * ] n × m [ G q ] m × m [ H ] m × n T
were [ G z ] n × n refers to the output power spectral density; [ G q ] m × m refers to the input power spectral density; [ H * ] n × m refers to the conjugate of frequency response function; and [ H ] m × n T refers to the transposition of frequency response function.
The speed for the simulation analysis is set at 60 km/h so as to verify the accuracy of the simulation results in accordance with the road surface of the test site used in the simulation analysis. The actual vehicle runs at a three-speed 60 km/h uniform speed, and the microphone is arranged in the driver’s ear. The sensor is arranged in the direction of 12 o’clock on the steering wheel, as shown in Figure 9 below.
For comparison, Figure 10 shows both the simulation results and experimental results of the driver’s acoustic pressure response. Judging from the analysis, the noise response of the driver’s ear is slightly smaller than that of the experiment, which is due to the fact that the motor noise cannot be isolated from the ear during the experiment. At the same time, the effect of wind noise excitation on the noise response of the driver’s ear is smaller than that of the experiment, but the peak frequency of the simulation results is similar to the experimental results. Figure 11 shows the vertical vibration response of the steering wheel in the direction of 12 o’clock. Judging from the analysis, the simulation results are slightly smaller than the experimental results, but in the frequency domain, the overall trend between the simulation results and the experimental results is more consistent, and the peak error of the vibration response is acceptable.

4. Conclusions

First, based on the NVH pavement of a certain test site, the researchers scanned the NVH pavement morphology of the experimental field during the experiment and established a set of pavement shape data processing systems using the Matlab software. Second, the finite element model of the electric vehicle is established, and the reliability of the finite element model is verified through comparison of the modal simulation results with the experimental results. Through the use of the road surface excitation obtained from the pavement topography data processing system, the simulation results are compared with the experimental results. The effectiveness of the road surface excitation, which is obtained from the pavement topography data processing system, is also verified. Third, through the use of the real road surface shape of the test site as the excitation of the simulation model, we can accurately predict the noise and vibration response of the vehicle under the actual road excitation during the early stage of vehicle development, which is of great significance for improving the NVH quality of the product. During the stage of developing the product prototype, the road surface morphology is collected as the excitation input, which is beneficial to improving and optimizing the solution to issues of road noise.

Author Contributions

Methodology, D.C.; Writing—original draft, Z.Y.; Writing—review and editing, X.H.

Funding

This research received no external funding.

Conflicts of Interest

The authors declare no conflict of interest.

References

  1. Yue, M.Y.; Zhou, Y.D. Research Progress on Vehicle NVH Technology. Appl. Mech. Mater. 2014, 654, 400–403. [Google Scholar] [CrossRef]
  2. Azadi, S.; Azadi, M.; Zahedi, F. NVH analysis and improvement of a vehicle body structure using DOE method. J. Mech. Sci. Technol. 2010, 23, 2980–2989. [Google Scholar] [CrossRef]
  3. Sandberg, U.; Ejsmont, J. Tire/road noise-a subject of international concern. In Proceedings-International Conference on Noise Control Engineering; Institute of Noise Control Engineering: San Diego, CA, USA, 1988; p. 1309. [Google Scholar]
  4. Guo, R.; Yu, Z.; Zuo, S.; Zhou, H. Control and path analysis of airborne noise of fuel cell vehicle. J. Jiangsu Univ. (Nat. Sci. Ed.) 2011, 32, 394–399. [Google Scholar]
  5. Bérengier, M.C.; Hamet, J.F. Acoustic classification of road pavements: Ranking differences due to distance from the road. Heavy Veh. Syst. 1999, 6, 13–27. [Google Scholar] [CrossRef]
  6. Licitra, G.; Moro, A.; Teti, L.; Del Pizzo, A.; Bianco, F. Modelling of acoustic ageing of rubberized pavements. Appl. Acoust. 2019, 146, 237–245. [Google Scholar] [CrossRef]
  7. Losa, M.; Leandri, P.; Licitra, G. Mixture design optimization of low-noise pavements. Transp. Res. Rec. 2013, 2372, 25–33. [Google Scholar] [CrossRef]
  8. Kindt, P.; Berckmans, D.; De Coninck, F.; Sas, P.; Desmet, W. Experimental analysis of the structure-borne tyre/road noise due to road discontinuities. Mech. Syst. Signal Process. 2009, 23, 2557–2574. [Google Scholar] [CrossRef]
  9. Zhang, M. Application of Transfer Path Analysis Method in Vehicle NVH Development. In The 3rd National Conference of Local Mechanical Engineering Society and the Cross-Strait Machinery Technology Forum Proceedings; China First Automobile Group Corporation: Sanya, China, 2013; pp. 272–276. [Google Scholar]
  10. Tan, J.; Du, J.; Li, H. Optimization Control of Passenger Car Pavement Noise Based on Transmission Path Analysis. Automob. Technol. 2017, 3, 19–23. [Google Scholar]
  11. Shivle, S.; Arora, G. Methodology of Road Noise Analysis and Improvement Strategy for Passenger Cars; SAE Paper 2006-01-1094; SAE International: Warrendale, PA, USA, 2006. [Google Scholar]
  12. Li, L.; Wang, Z. Research on simulation method of low-frequency road noise based on modal tires. In Proceedings of the Annual Meeting of China Automotive Engineering Society, Shanghai, China, 5–7 June 2014; pp. 1328–1331. [Google Scholar]
  13. Chen, C.; Sun, W. Study on Simulation Analysis of Vehicle Interior Noise Caused by Pavement Excitation. J. Vib. Shock 2008, 08, 102–105. [Google Scholar]
  14. Cha, M.; Su, X.; Wang, D. Prediction and Analysis of Low Frequency Noise in Vehicles under Road Excitation. Manuf. Autom. 2015, 37, 78–81. [Google Scholar]
  15. Lu, F.; Chen, S. Time Domain Modeling and Simulation of Vehicle Pavement Excitation. Automot. Eng. 2015, 37, 549–553. [Google Scholar]
  16. Mucka, P. Simulated Road Profiles According to ISO 8608 in Vibration Analysis. J. Test. Eval. 2018, 46, 405–418. [Google Scholar]
  17. Zhang, H. Automotive System Dynamics; Tongji University Press: Shanghai, China, 1996. [Google Scholar]
  18. Frosina, E.; Senatore, A.; Andreozzi, A.; Fortunato, F.; Giliberti, P. Experimental and Numerical Analyses of the Sloshing in a Fuel Tank. Energies 2018, 11, 682. [Google Scholar] [CrossRef]
  19. Zhang, S.; Meng, X.; Feng, T.; Zhang, T. Dynamics Analysis and Numerical Simulations of a Stochastic Non-Autonomous Predator-Prey System with Impulsive Effects. Nonlinear Anal.-Hybrid Syst. 2017, 26, 19–37. [Google Scholar] [CrossRef]
  20. Kandala, A.; Mezzacapo, A.; Temme, K.; Takita, M.; Brink, M.; Chow, J.M.; Gambetta, J.M. Hardware-Efficient Variational Quantum Eigensolver for Small Molecules and Quantum Magnets. Nature 2017, 549, 242–246. [Google Scholar] [CrossRef] [PubMed]
  21. Ding, D.; Wang, Z.; Ho, D.W.C.; Wei, G. Distributed Recursive Filtering for Stochastic Systems Under Uniform Quantizations and Deception Attacks through Sensor Networks. Automatica 2017, 78, 231–240. [Google Scholar] [CrossRef]
  22. Lu, L.; Jia, Y.; Liu, W.; Yang, L. Mixed Stimulus-Induced Mode Selection in Neural Activity Driven by High and Low Frequency Current Under Electromagnetic Radiation. Complexity 2017, 7628537. [Google Scholar] [CrossRef]
  23. Yu, D.; Liu, H.; Bresser, C. Peak Load Management Based On Hybrid Power Generation and Demand Response. Energy 2018, 163, 969–985. [Google Scholar] [CrossRef]
  24. Peng, W.; Maleki, A.; Rosen, M.A.; Azarikhah, P. Optimization of a Hybrid System for Solar-Wind-Based Water Desalination by Reverse Osmosis: Comparison of Approaches. Desalination 2018, 442, 16–31. [Google Scholar] [CrossRef]
  25. Rong, B.; Xiao, P.; Zhou, J. Reconstruction and Contrast Analysis of 3D Virtual Pavement of Strengthened Road in a Test Site. Automot. Eng. 2017, 39, 214–219. [Google Scholar]
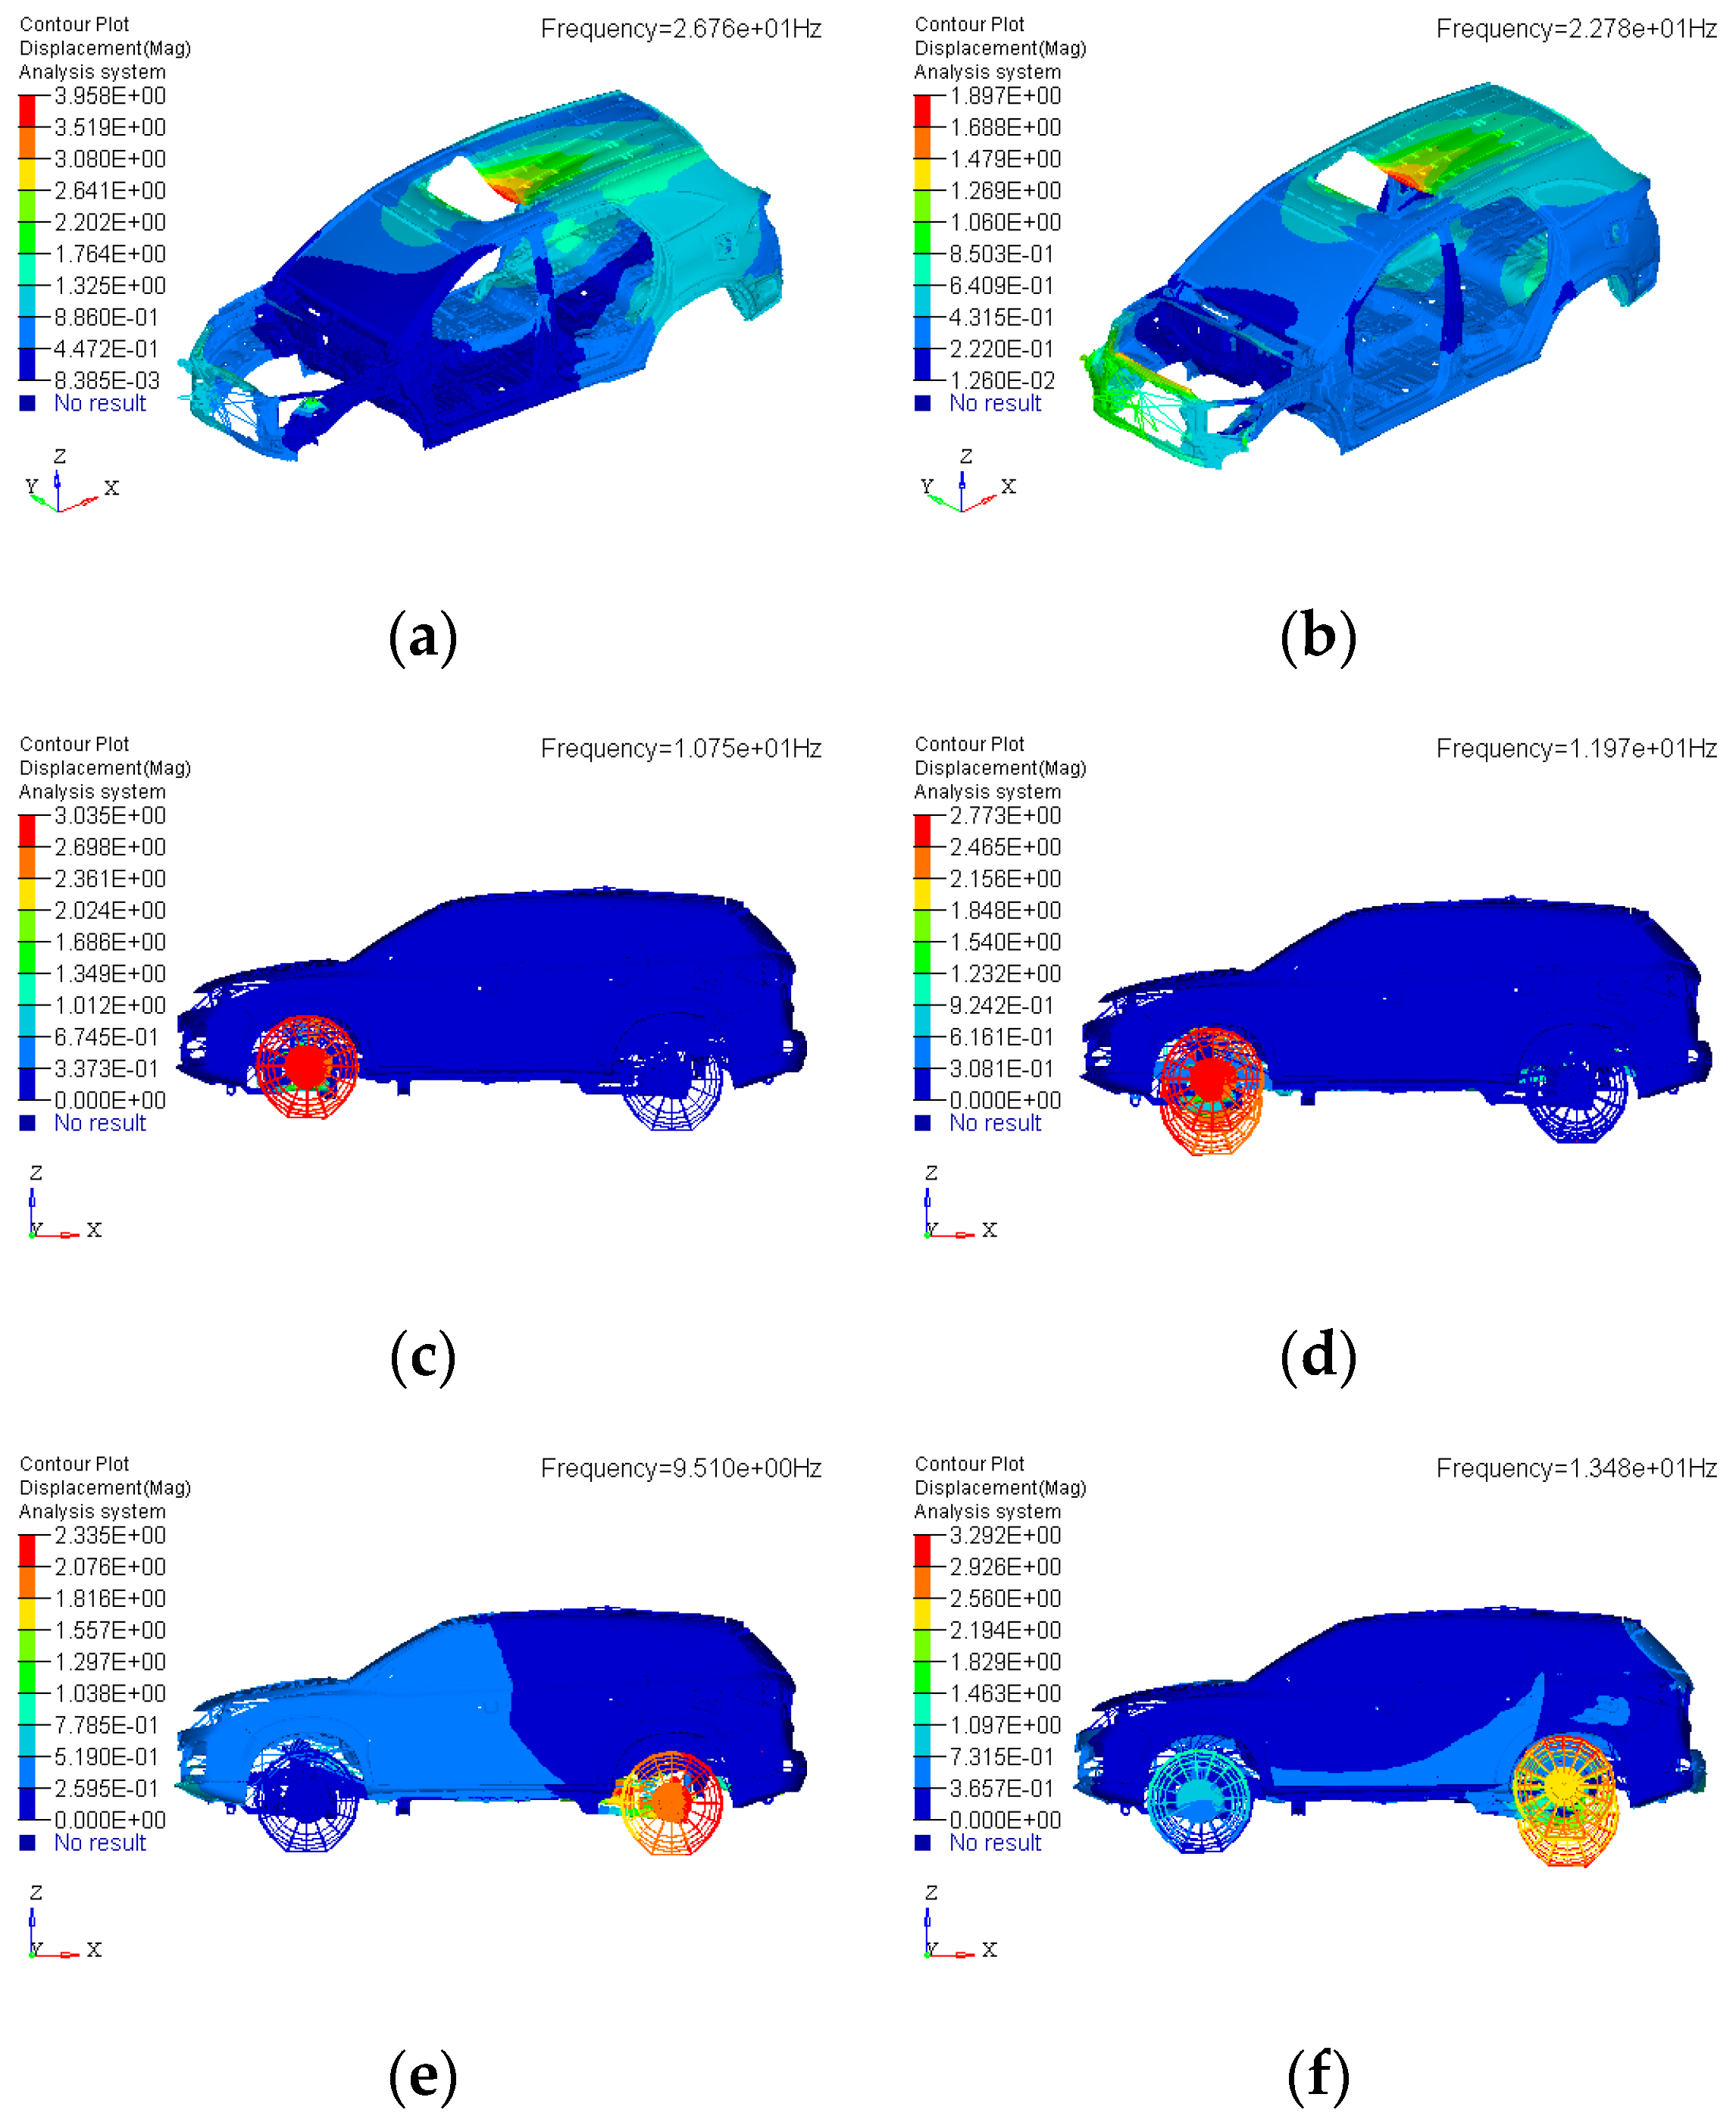
Figure 1. Road vertical section inspection system.
Wevj 10 00033 g001
Figure 2. Laser sensor layout.
Wevj 10 00033 g002
Figure 3. Some of the code used in Matlab programming.
Wevj 10 00033 g003
Figure 4. The interface of road surface morphology data processing system.
Wevj 10 00033 g004
Figure 5. The output results of self-power spectral.
Wevj 10 00033 g005
Figure 6. Schematic diagram of the finite element model of an electric vehicle.
Wevj 10 00033 g006
Figure 7. Diagram on the vehicle modal experiment.
Wevj 10 00033 g007
Figure 8. Result diagram of modal simulation analysis of an electric vehicle. (a) Body torsion (b) body bending (c) co-directional jump of the front suspension (d) reverse jump of the front suspension (e) co-directional jump of the rear suspension (f) reverse jump of the rear suspension (g) steering wheel first order vertical (h) steering wheel first order transverse.
Wevj 10 00033 g008aWevj 10 00033 g008b
Figure 9. Schematic diagram of the vibration sensor and microphone layout for electric vehicle route test.
Wevj 10 00033 g009
Figure 10. The response of sound pressure in the driver’s ear.
Wevj 10 00033 g010
Figure 11. Vibration response of steering wheel.
Wevj 10 00033 g011
Table 1. Vehicle modal analysis simulation and test results (partial).
Modal ModeSimulation Analysis Results/HzTest Result/HzError (Simulation-Test)/Test
BodyBody torsion26.7627.03−1.00%
Body bending22.7823.69−3.84%
Front suspensionCodirectional jump of the front suspension10.7510.452.87%
Reverse jump of the front suspension11.9712.21−1.97%
Rear suspensionCodirectional jump of the rear suspension9.519.351.71%
Reverse jump of the rear suspension13.4814.48−6.91%
Steering systemSteering wheel first order vertical29.9331.32−4.44%
Steering wheel first order transverse37.1238.1−2.57%

