Effect of Ambient Temperature on Electric Vehicles’ Energy Consumption and Range: Model Definition and Sensitivity Analysis Based on Nissan Leaf Data


Abstract
1. Introduction
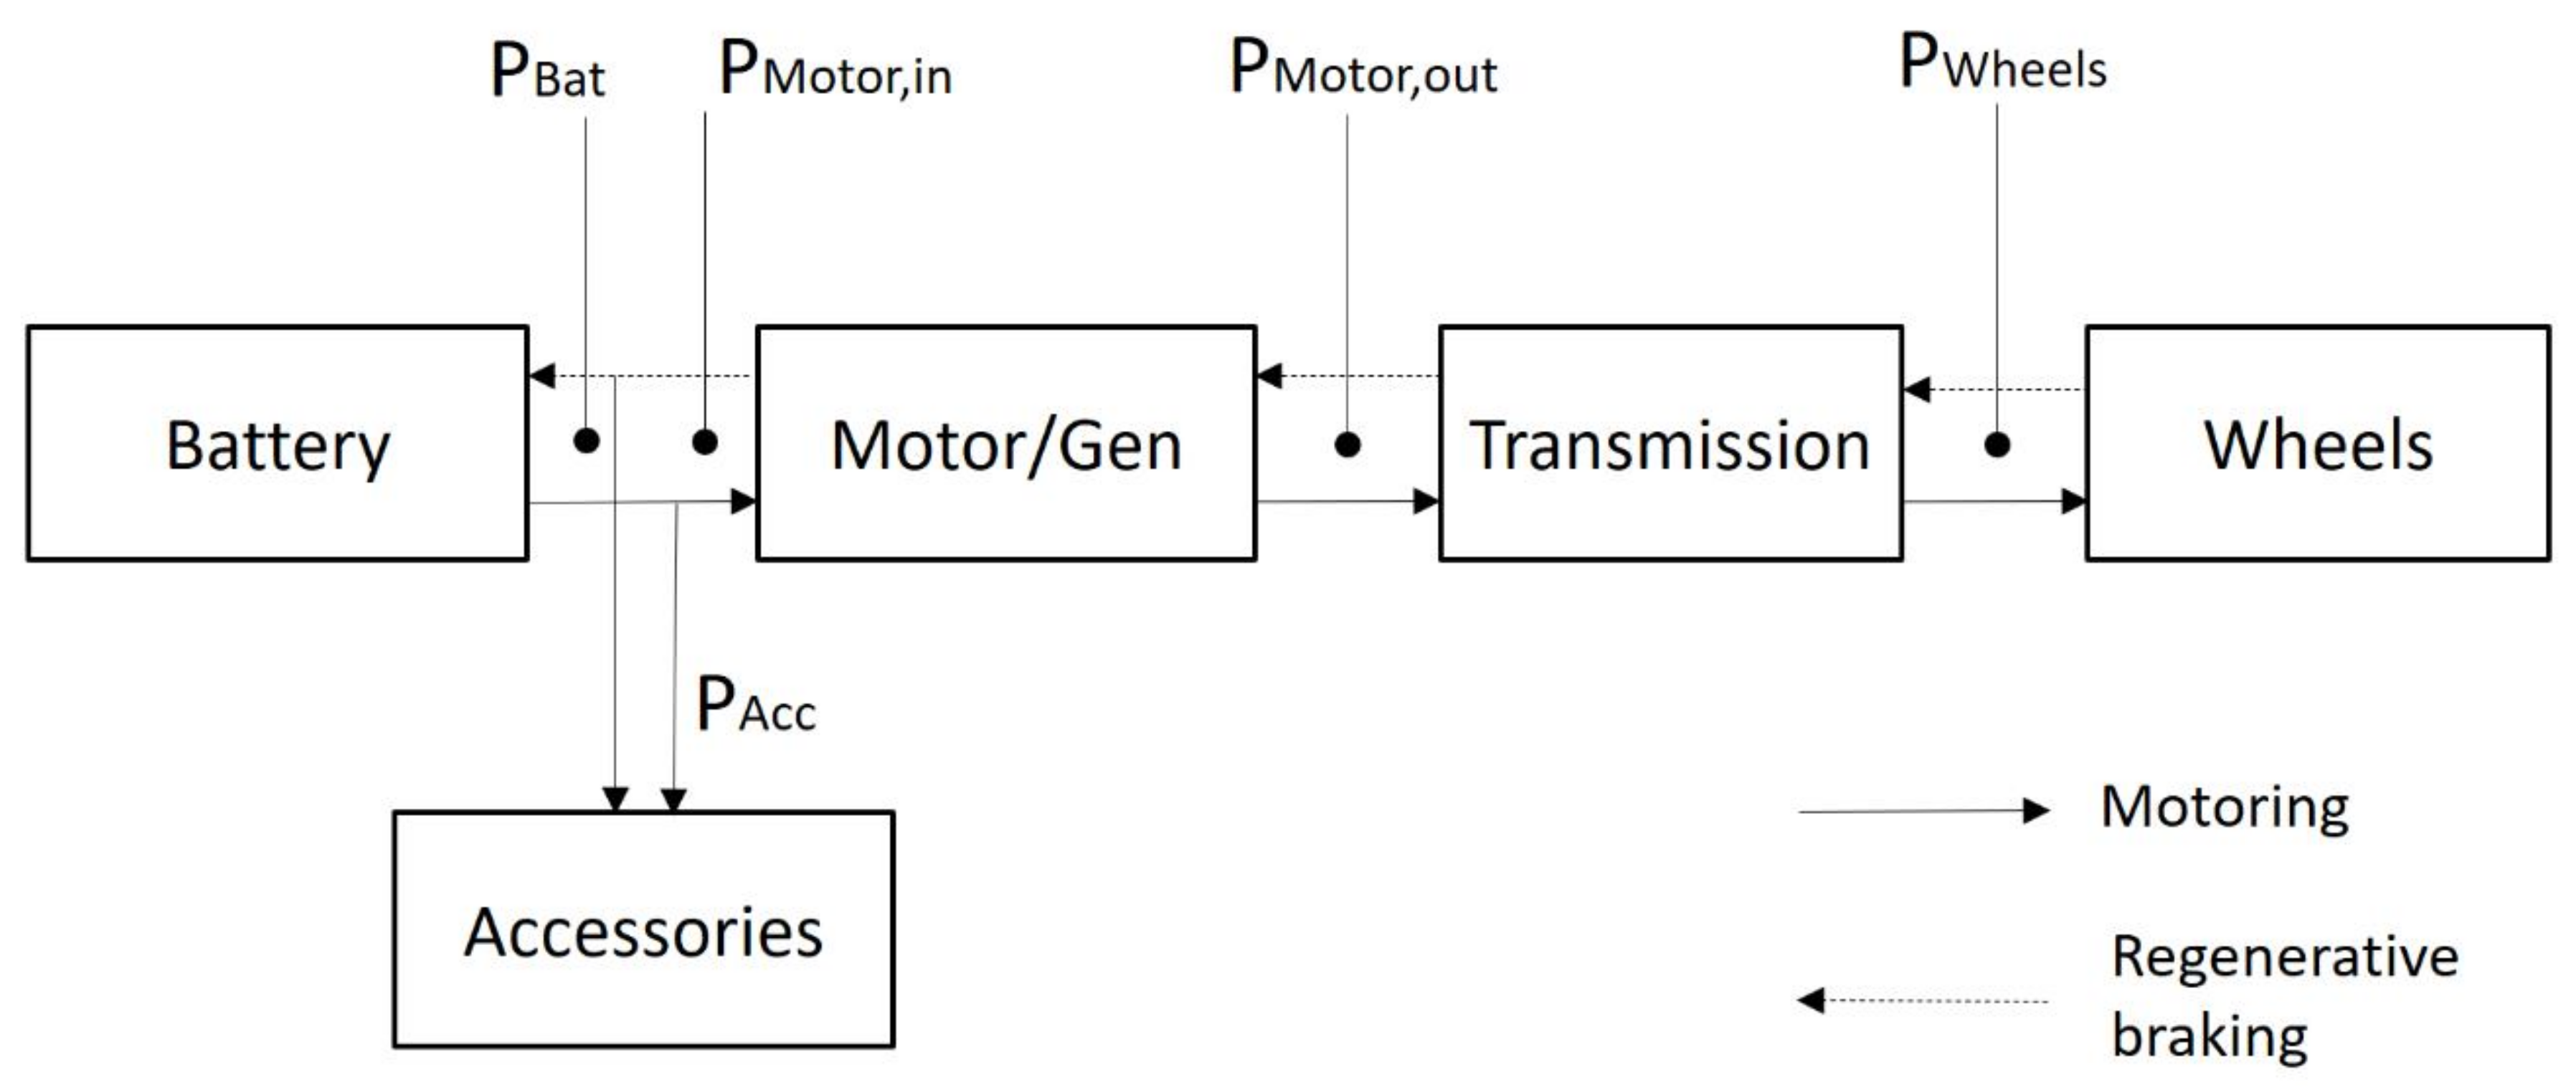
2. Model Description
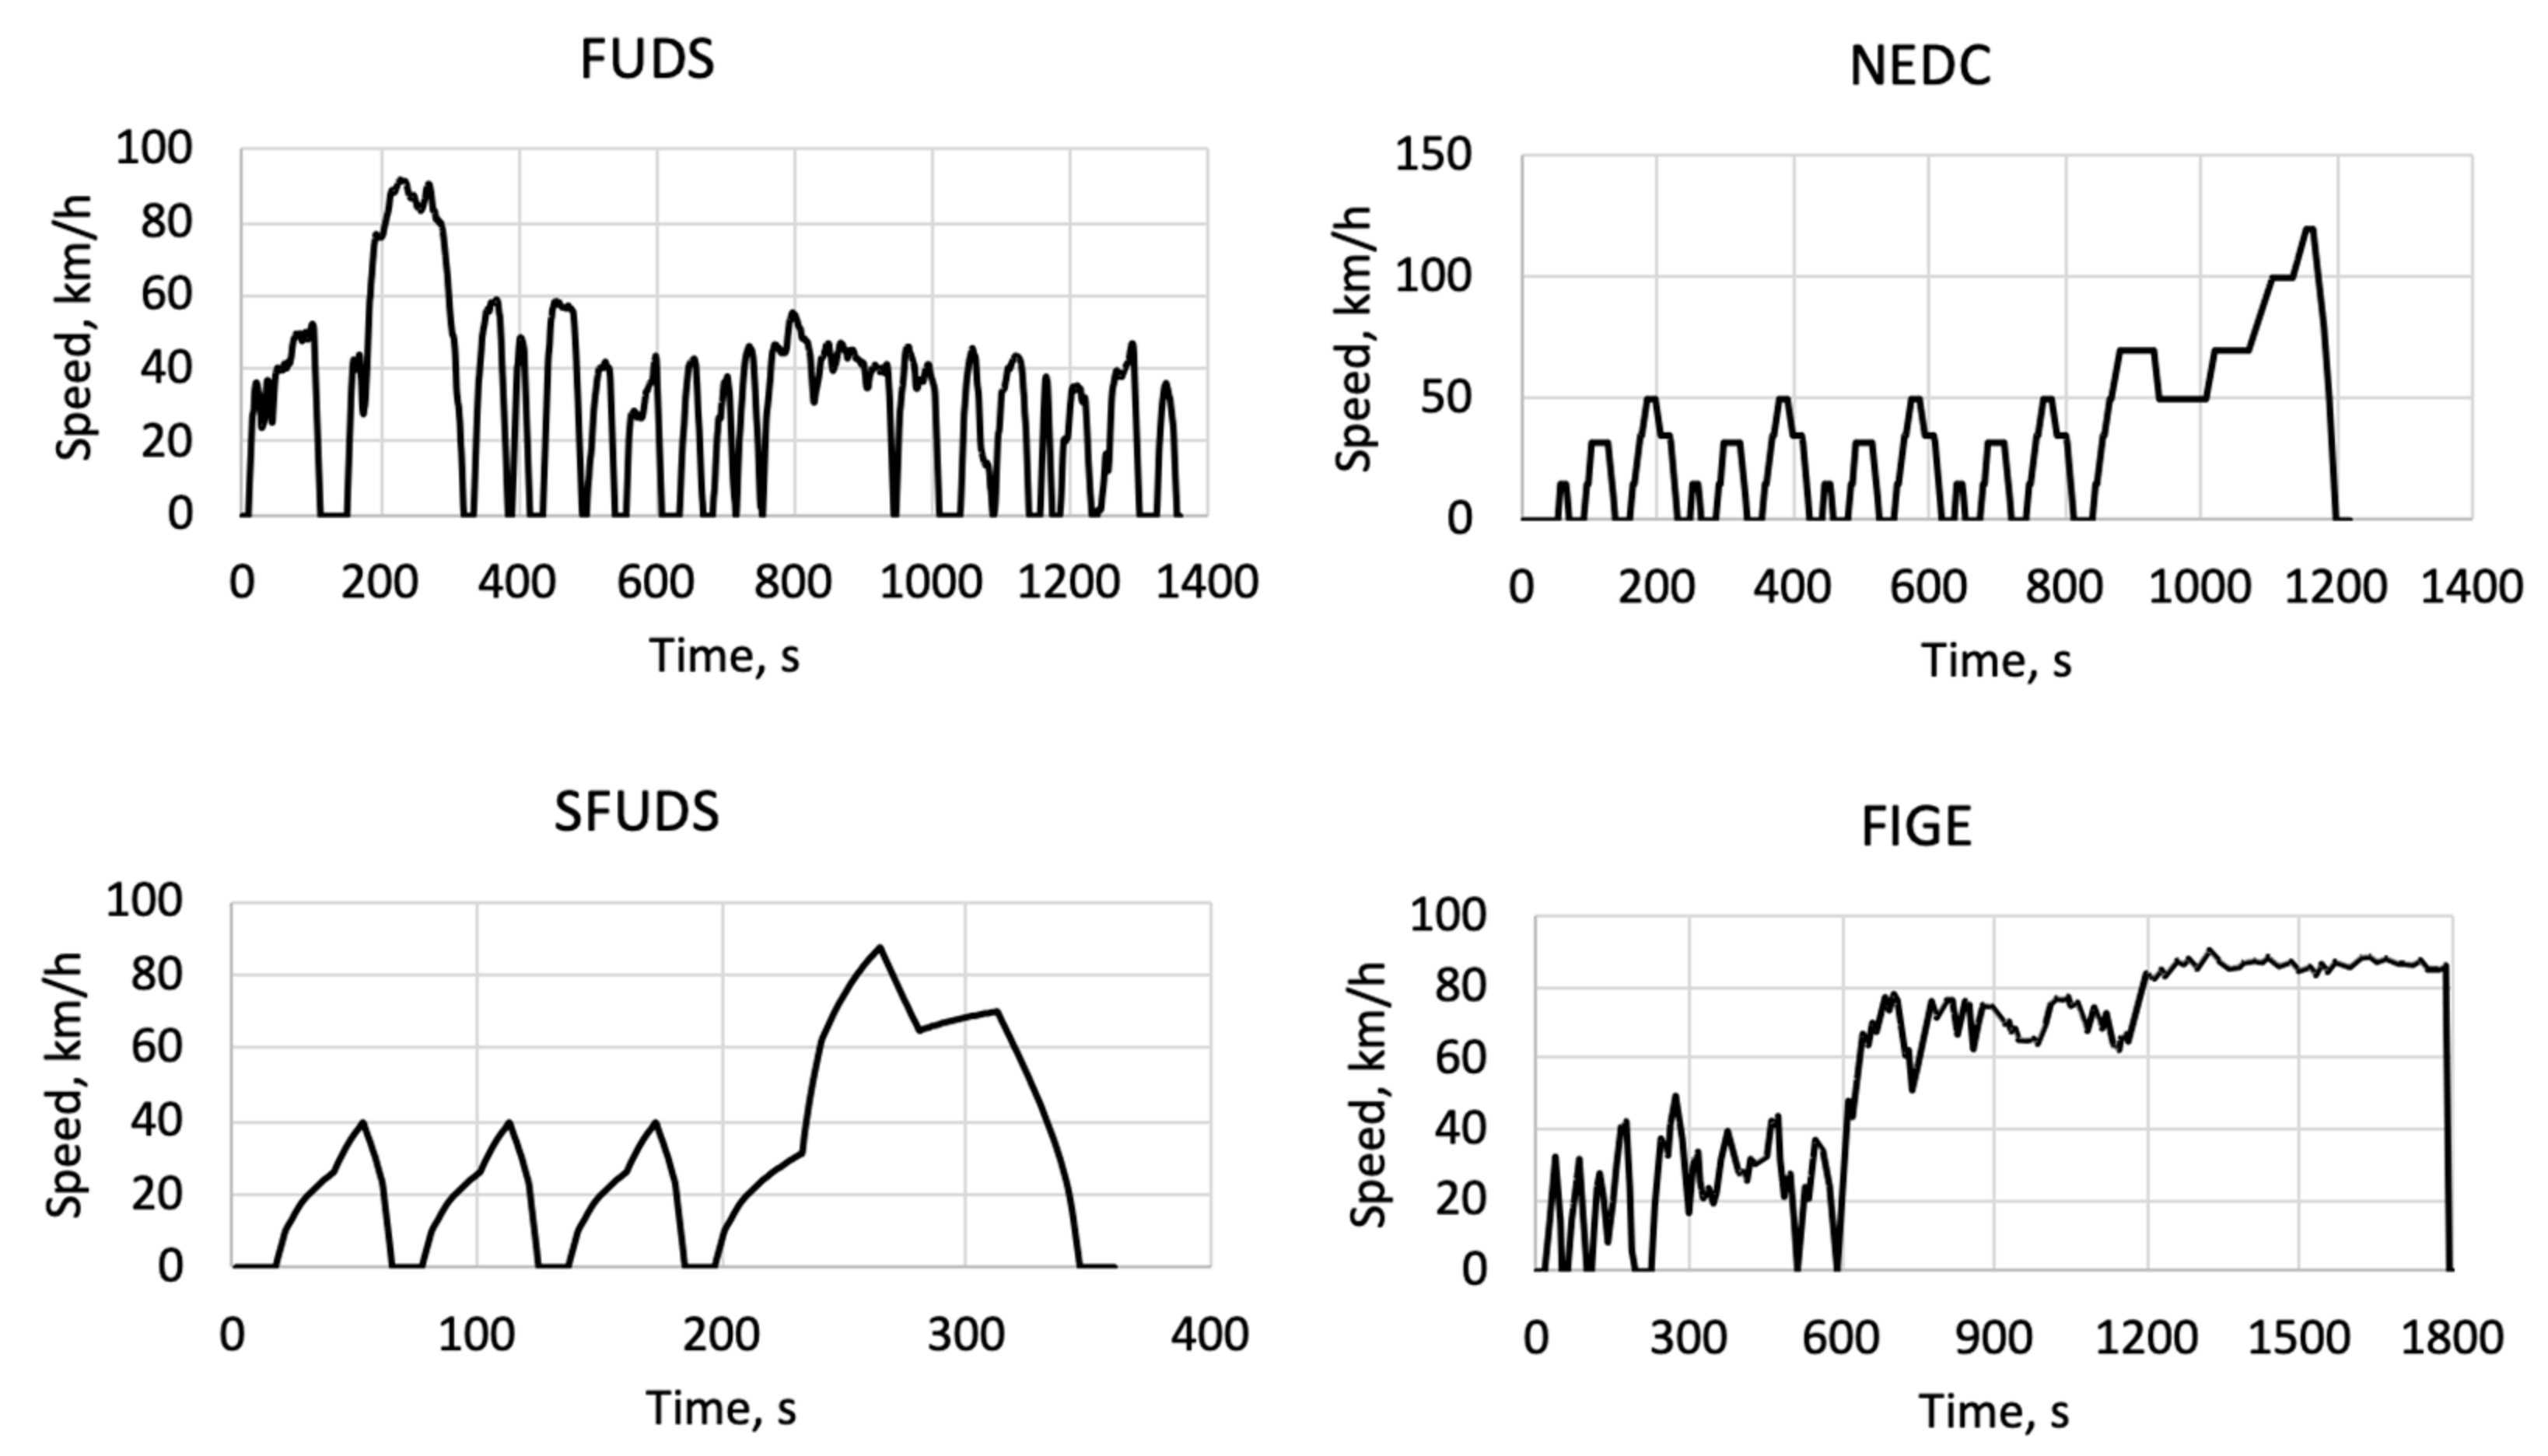
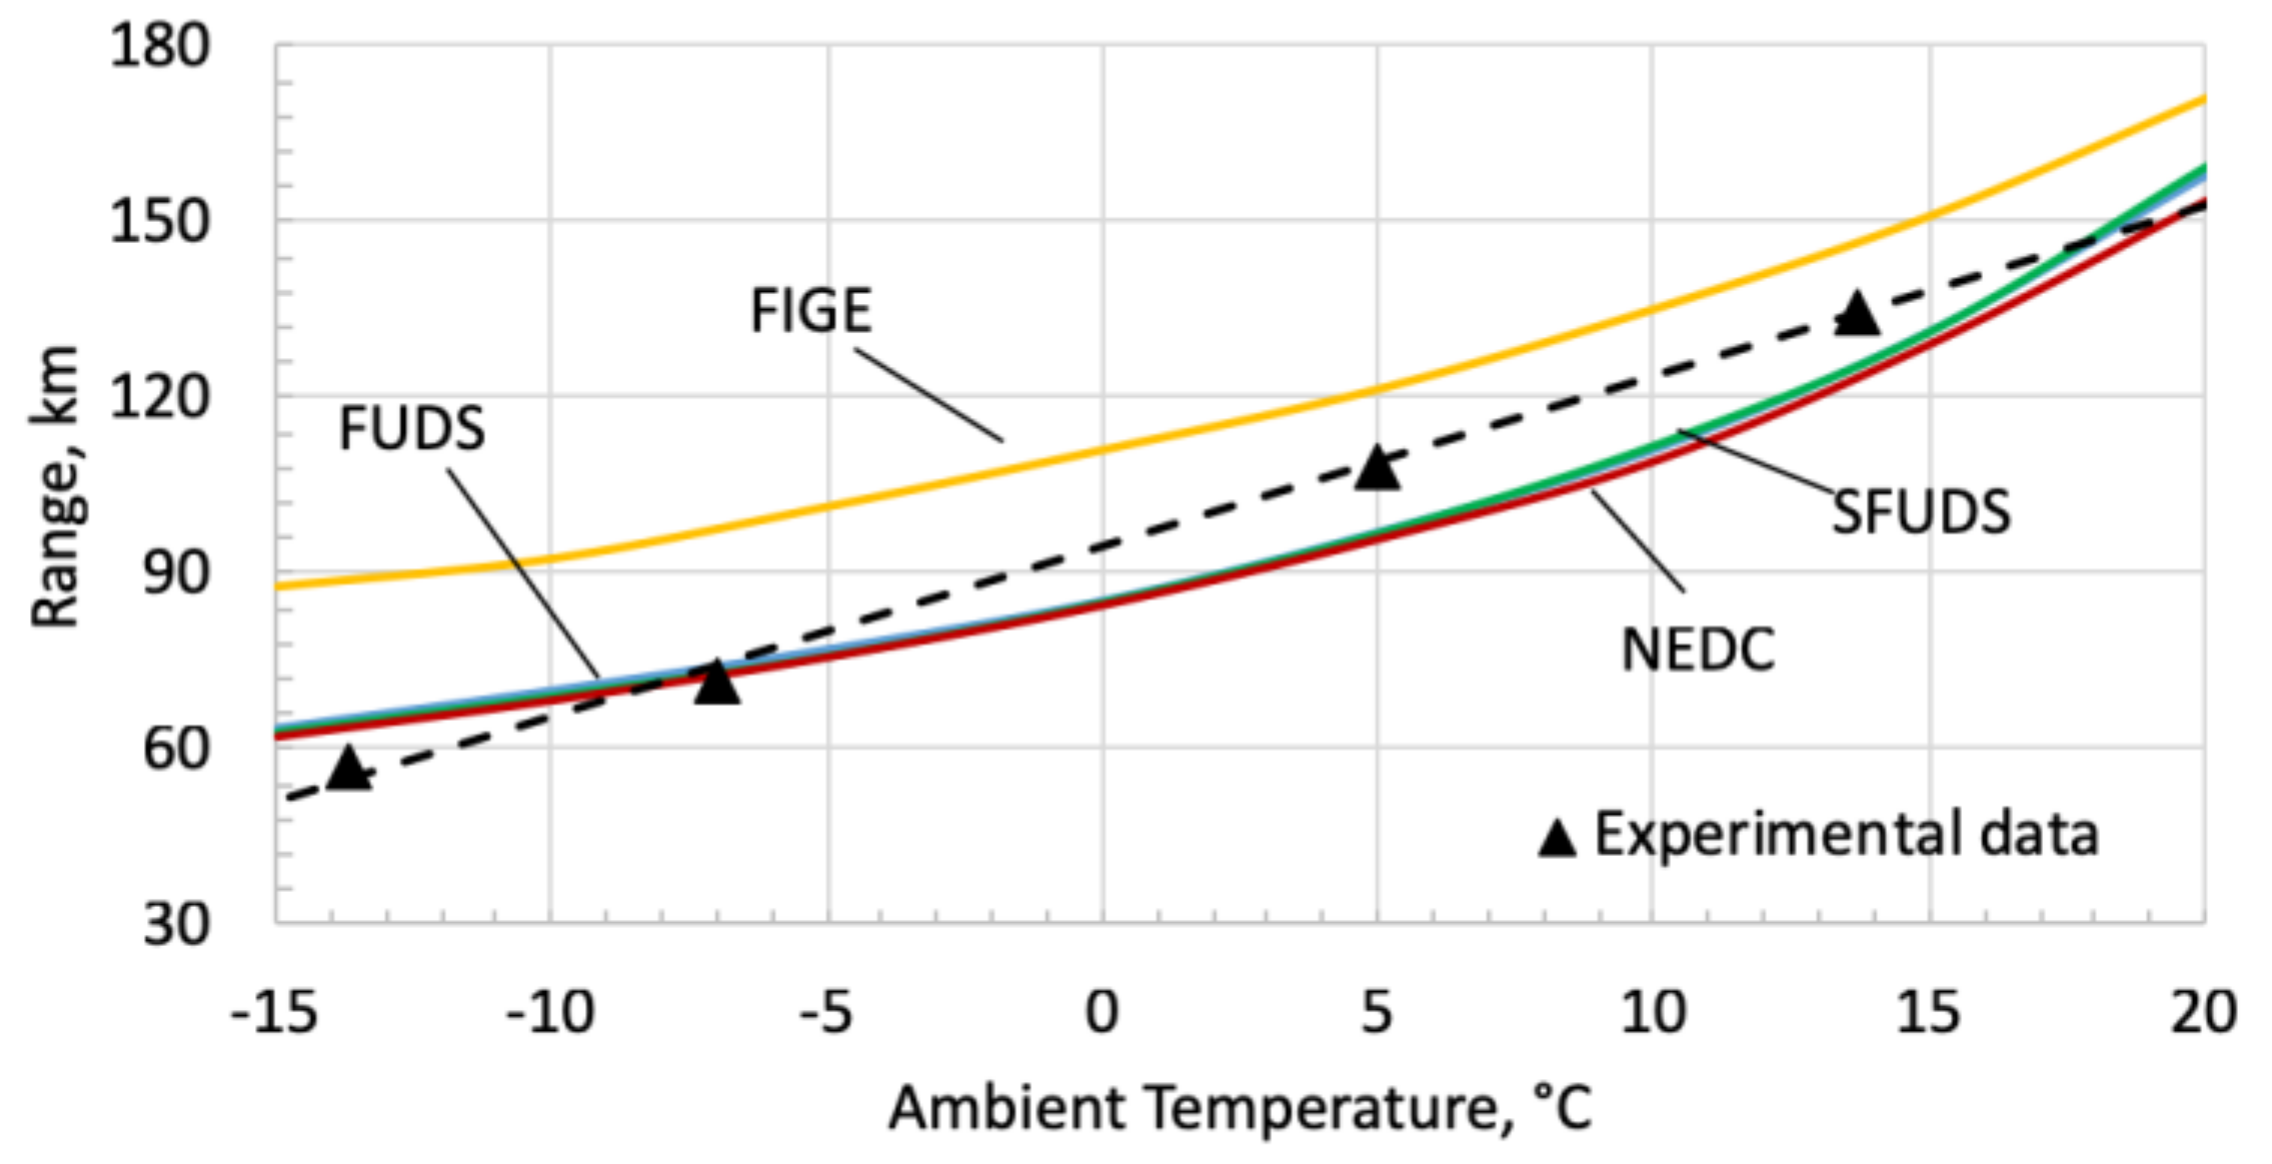
3. Model Validation
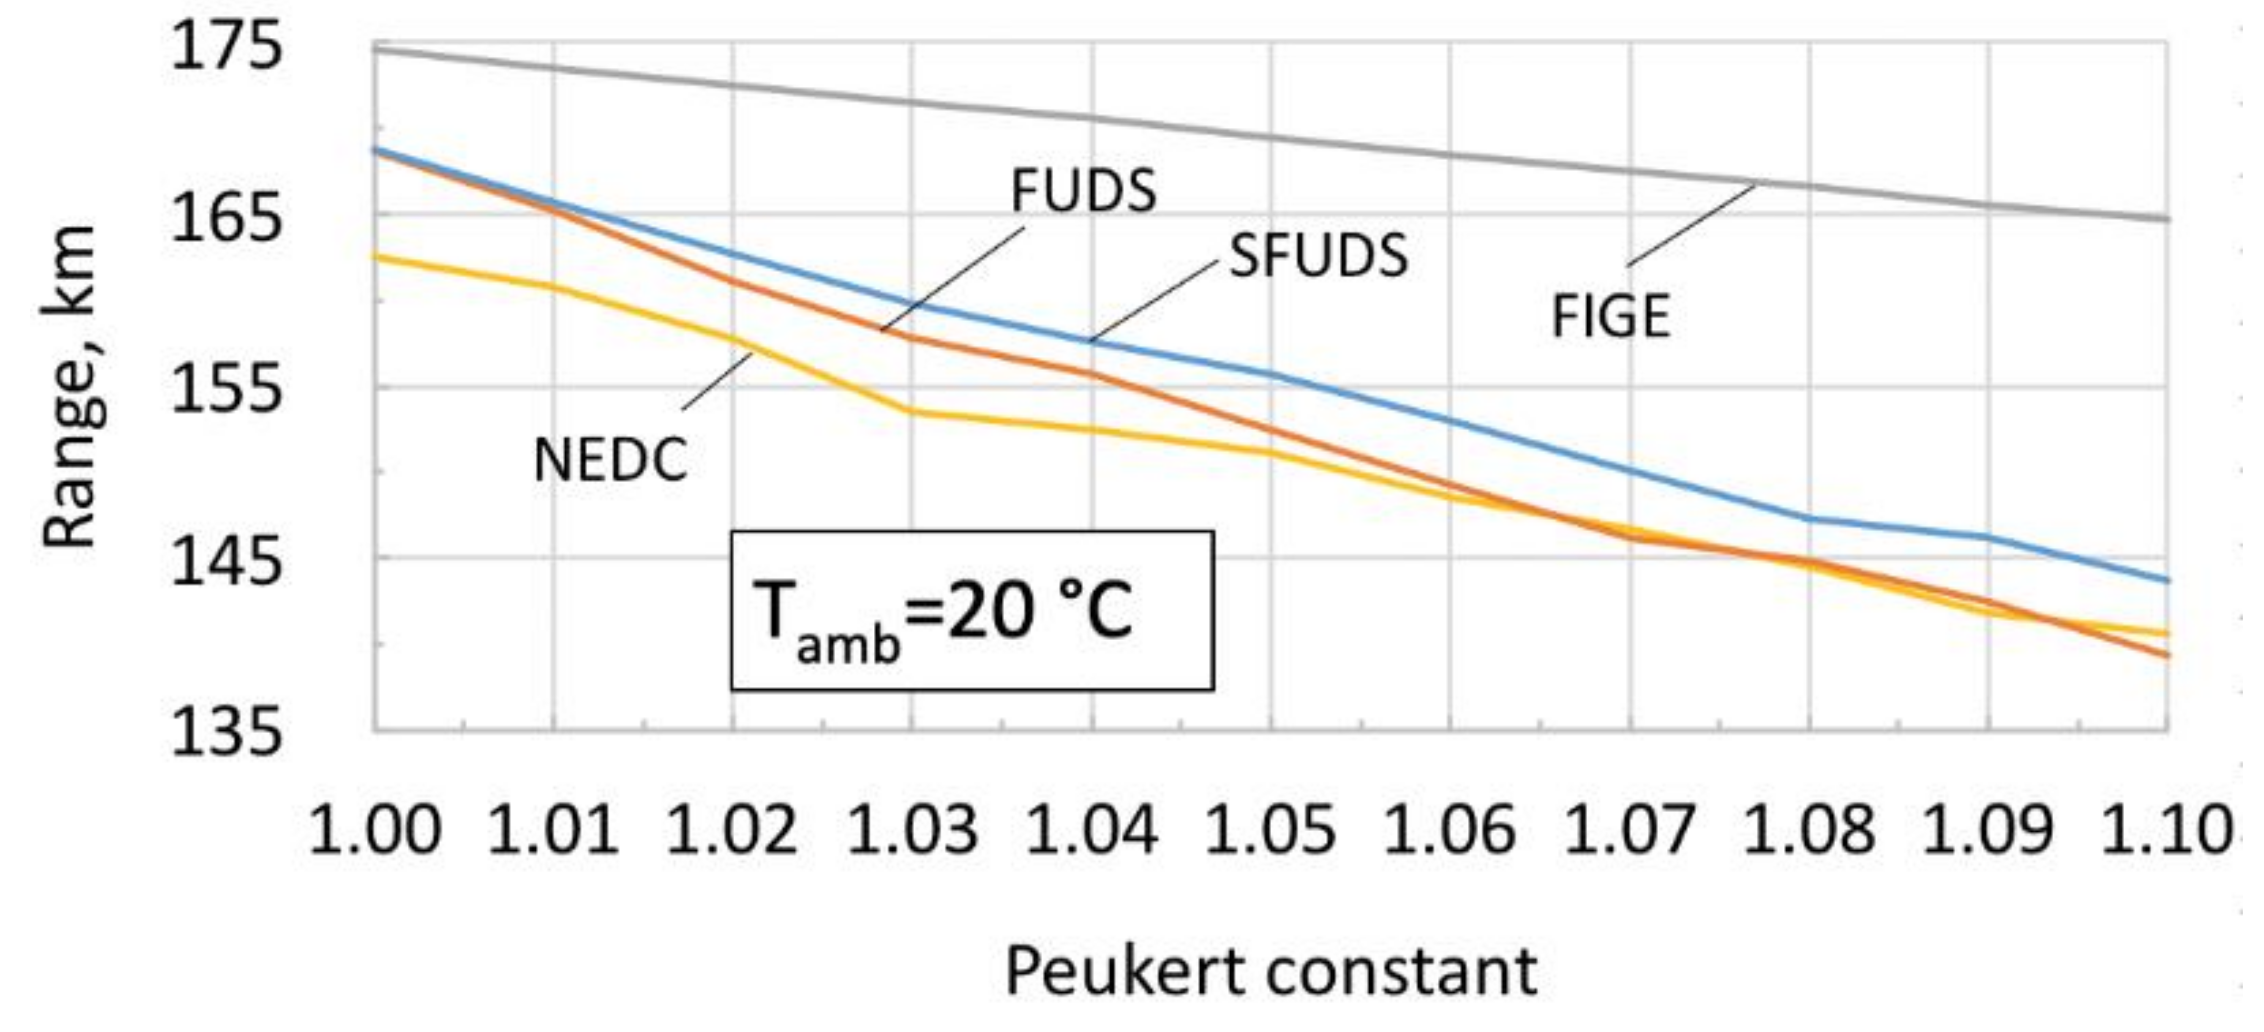
4. Sensitivity Analysis
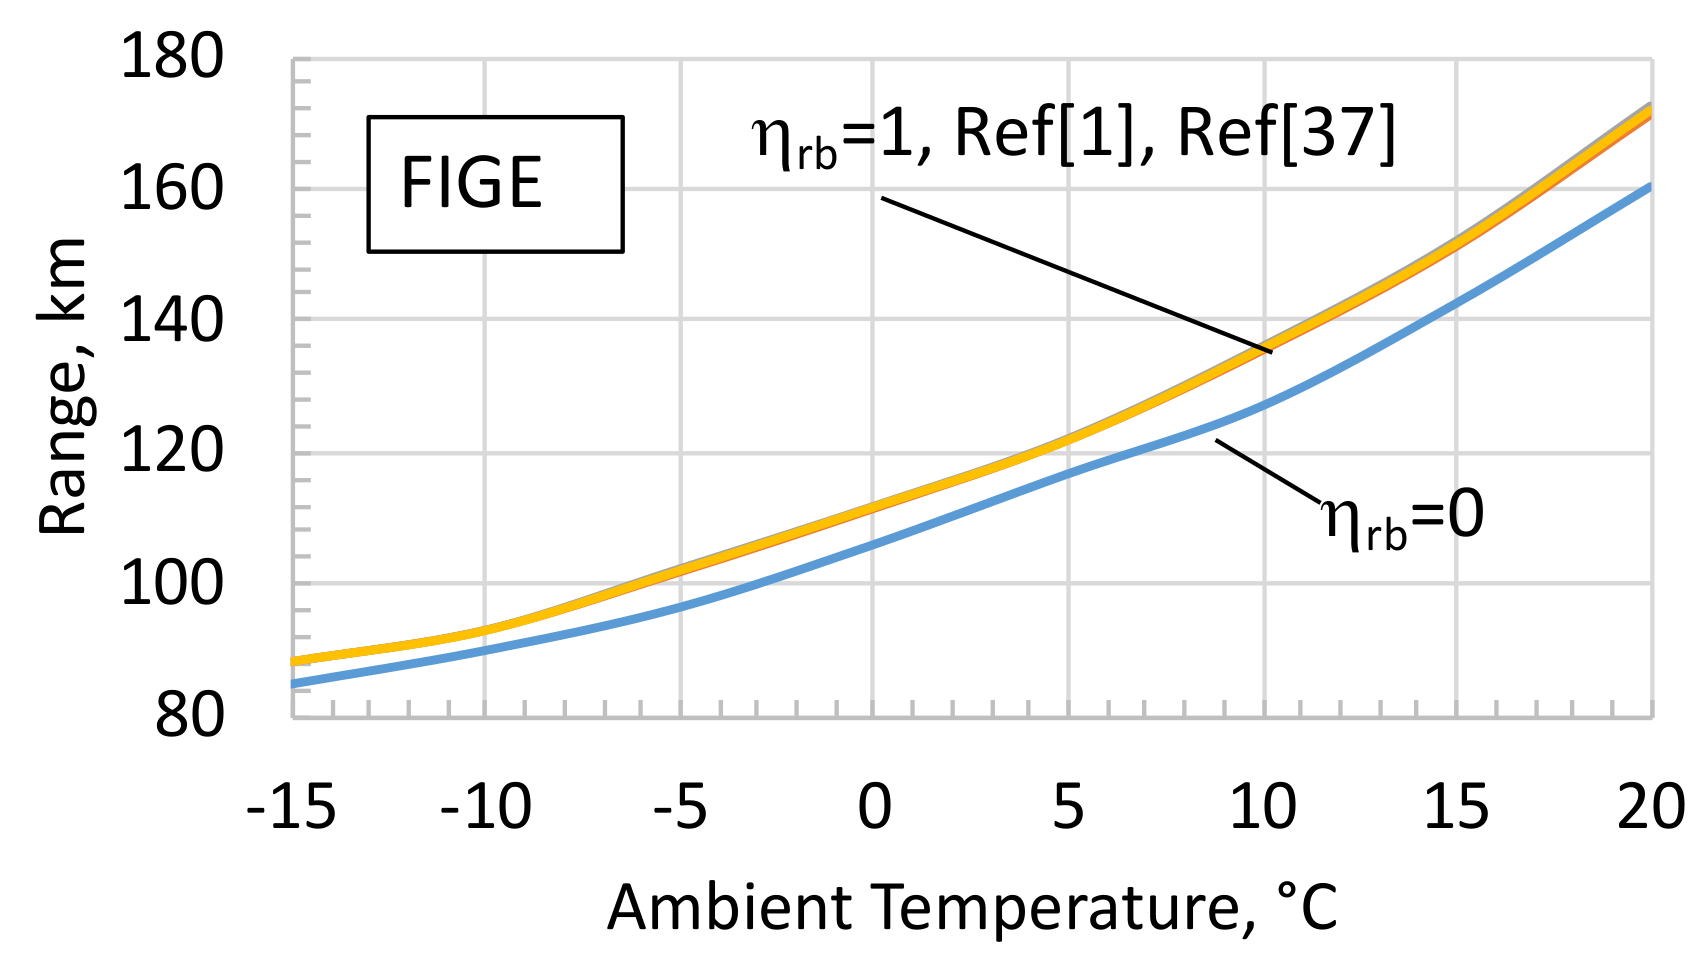
- (a)
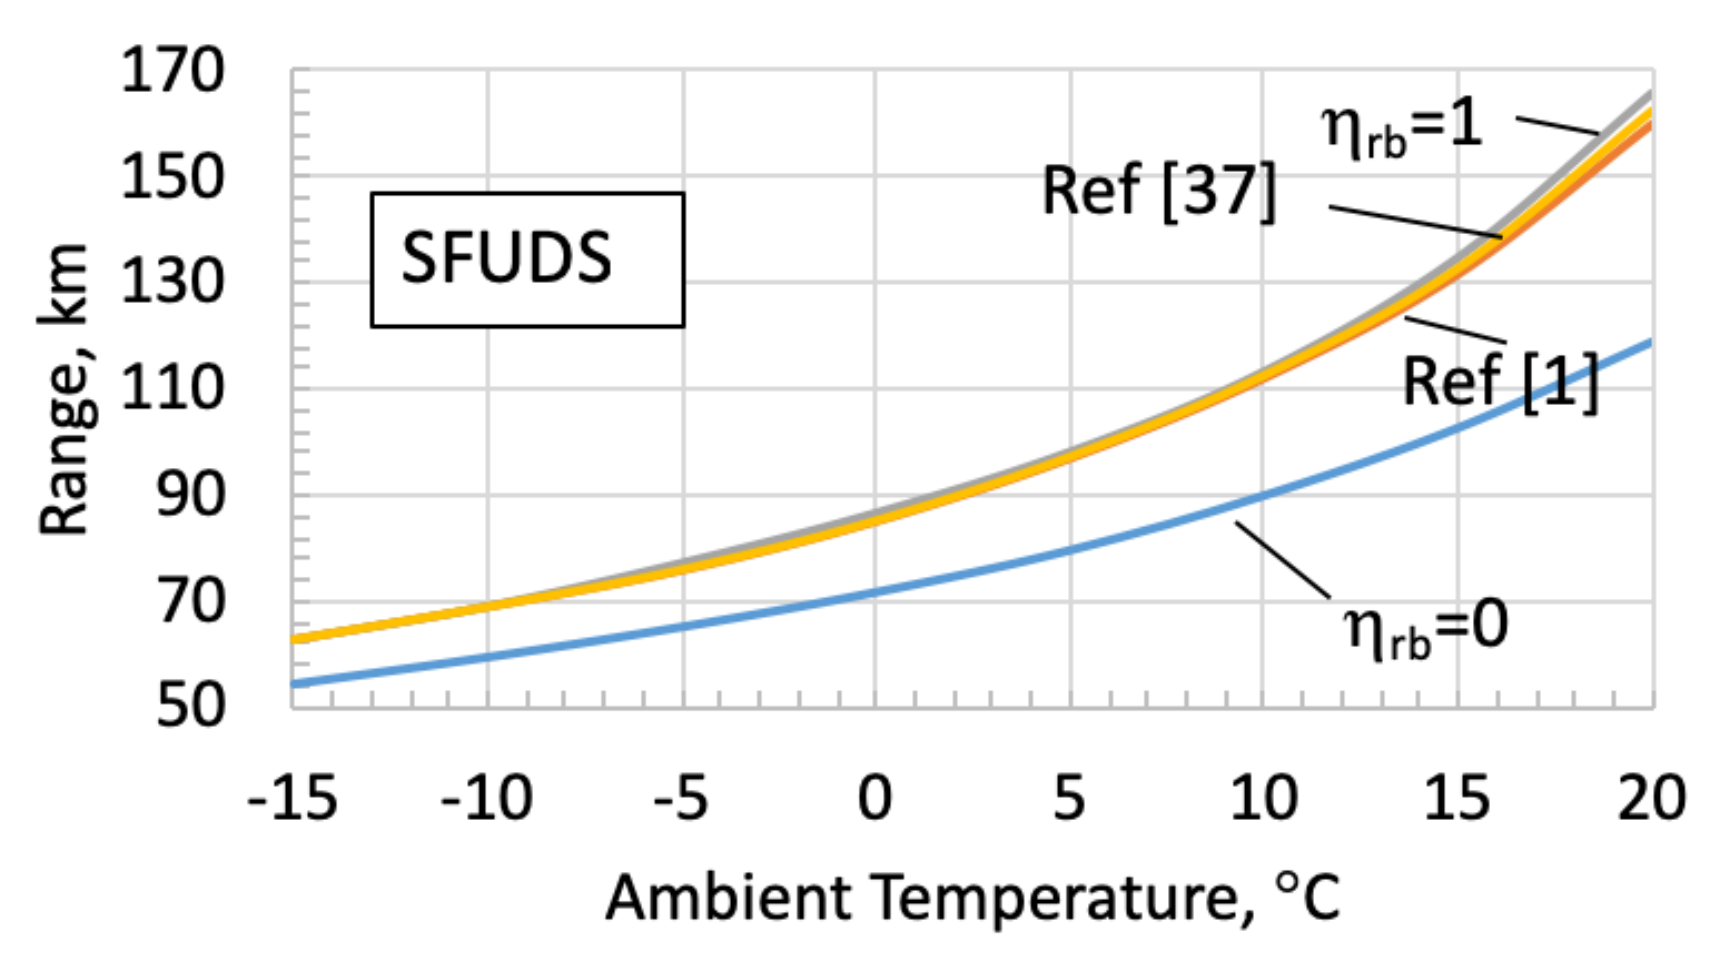
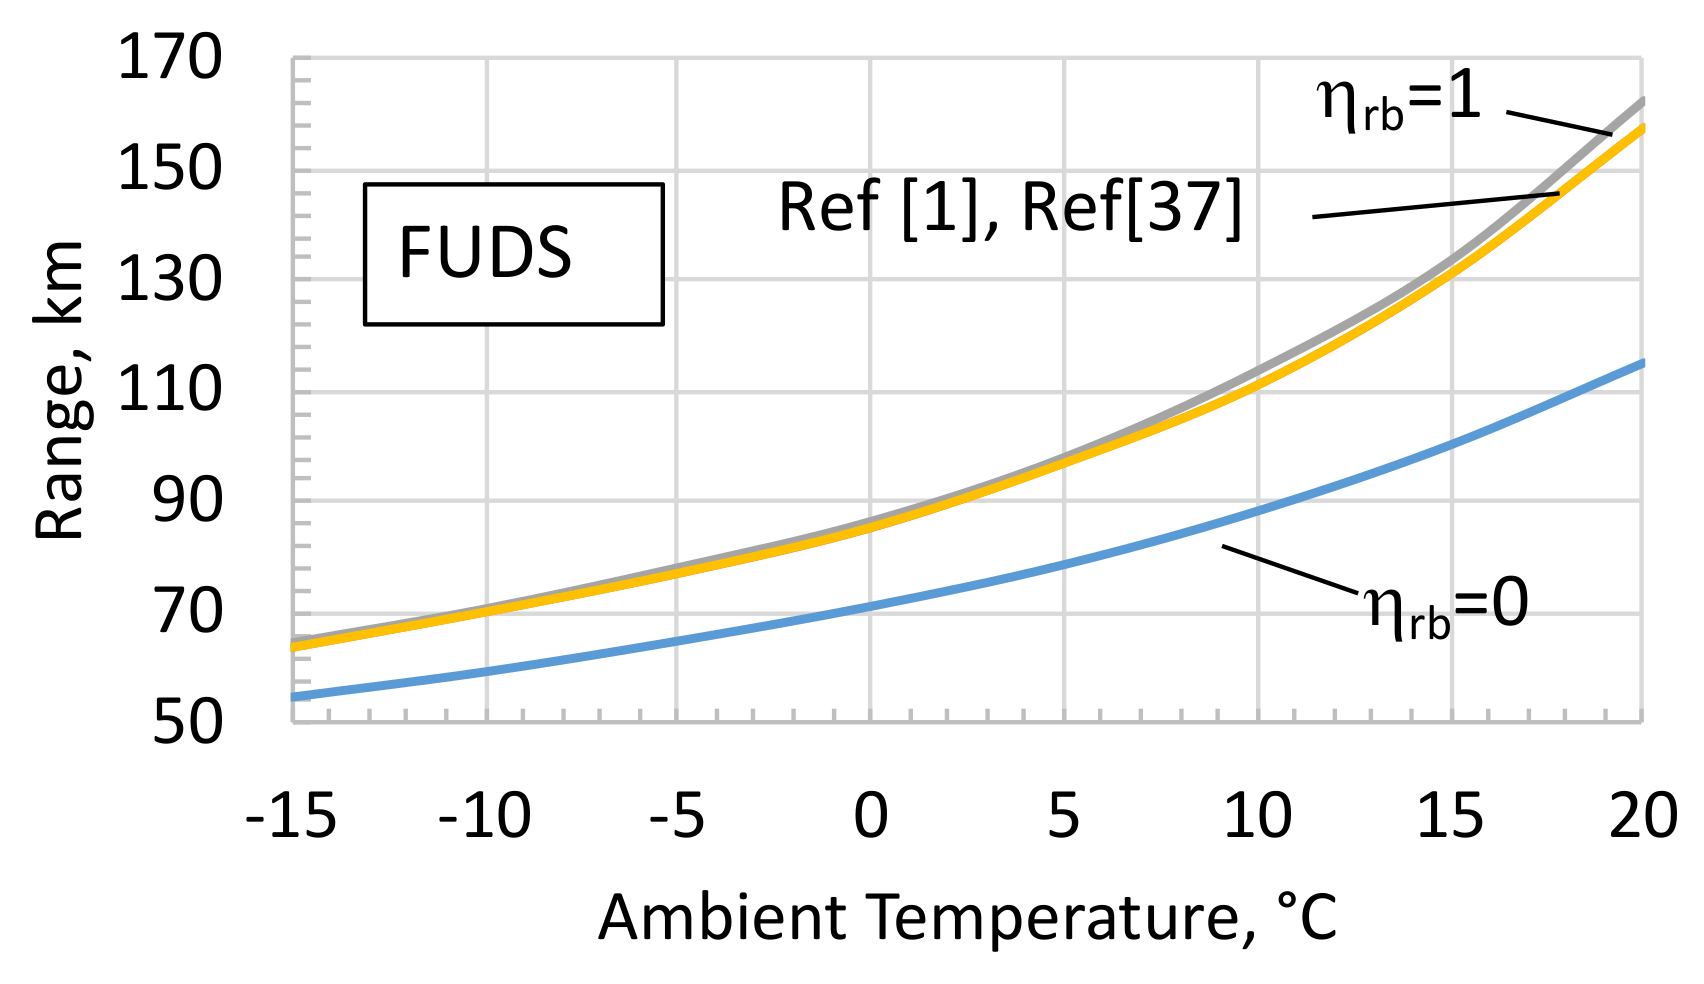
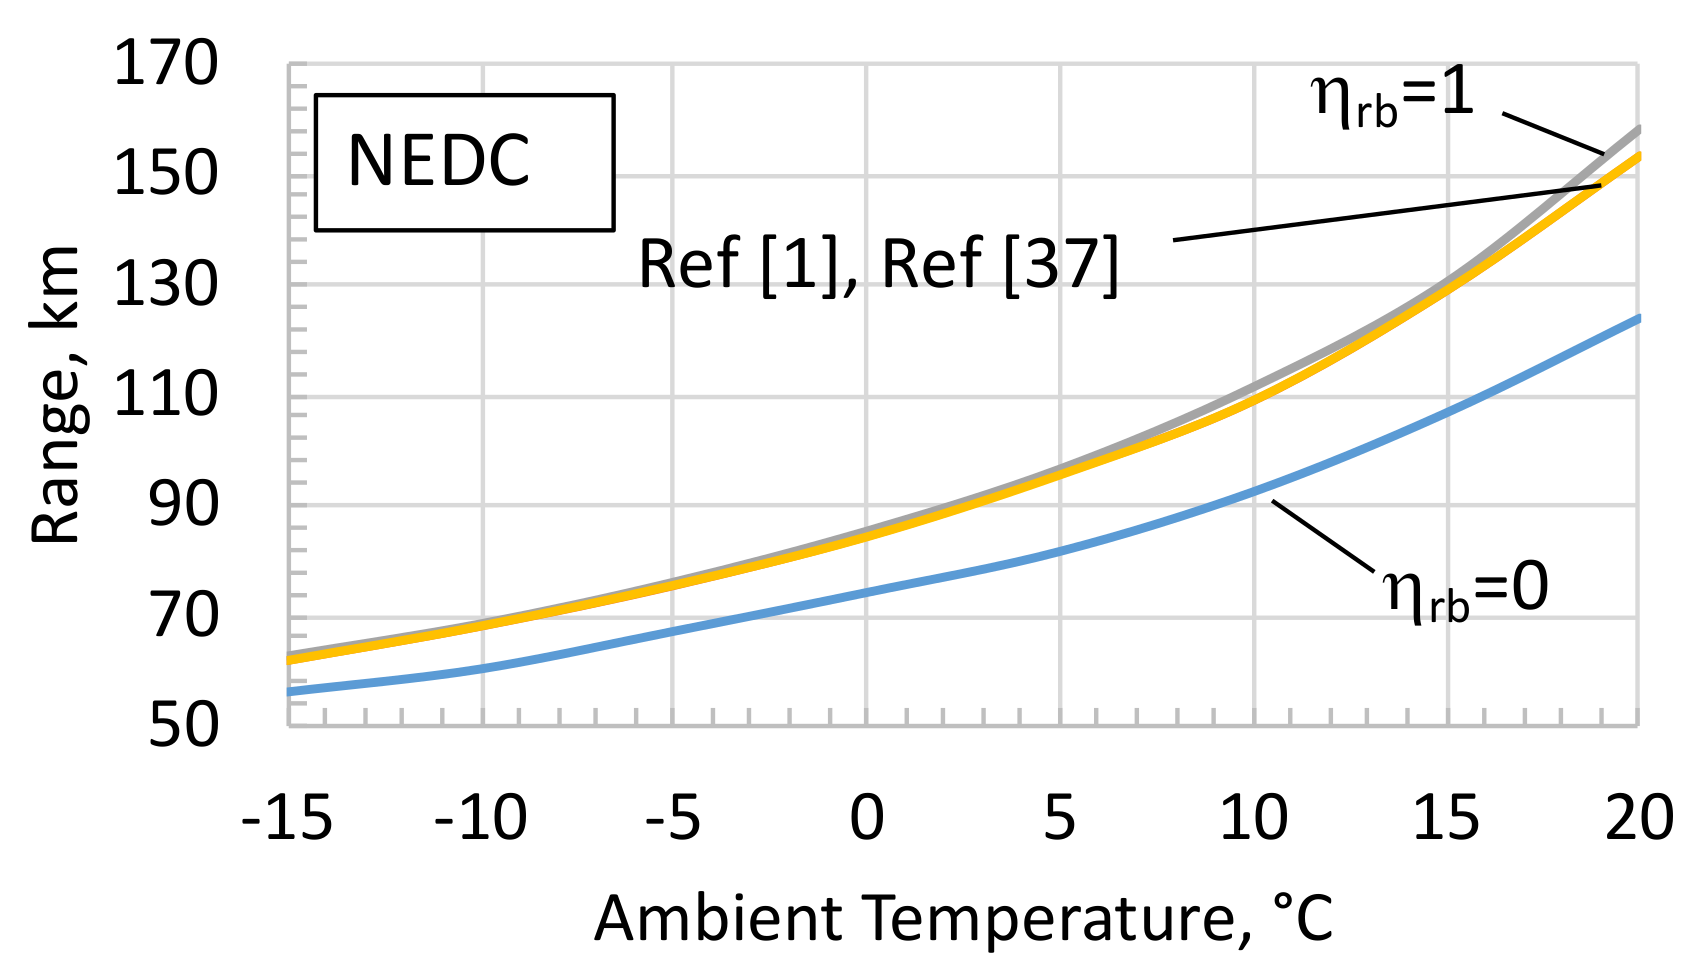
- ηrb = 0: no braking power recovered, that is, the entire braking power is wasted by mechanical brakes.
- (b)
- ηrb = 1: the whole braking power available at the wheels is converted into electricity according to the generator operating efficiency.
- (c)
- according to the authors of [1]; this case has been also assumed as the reference case in the present model.
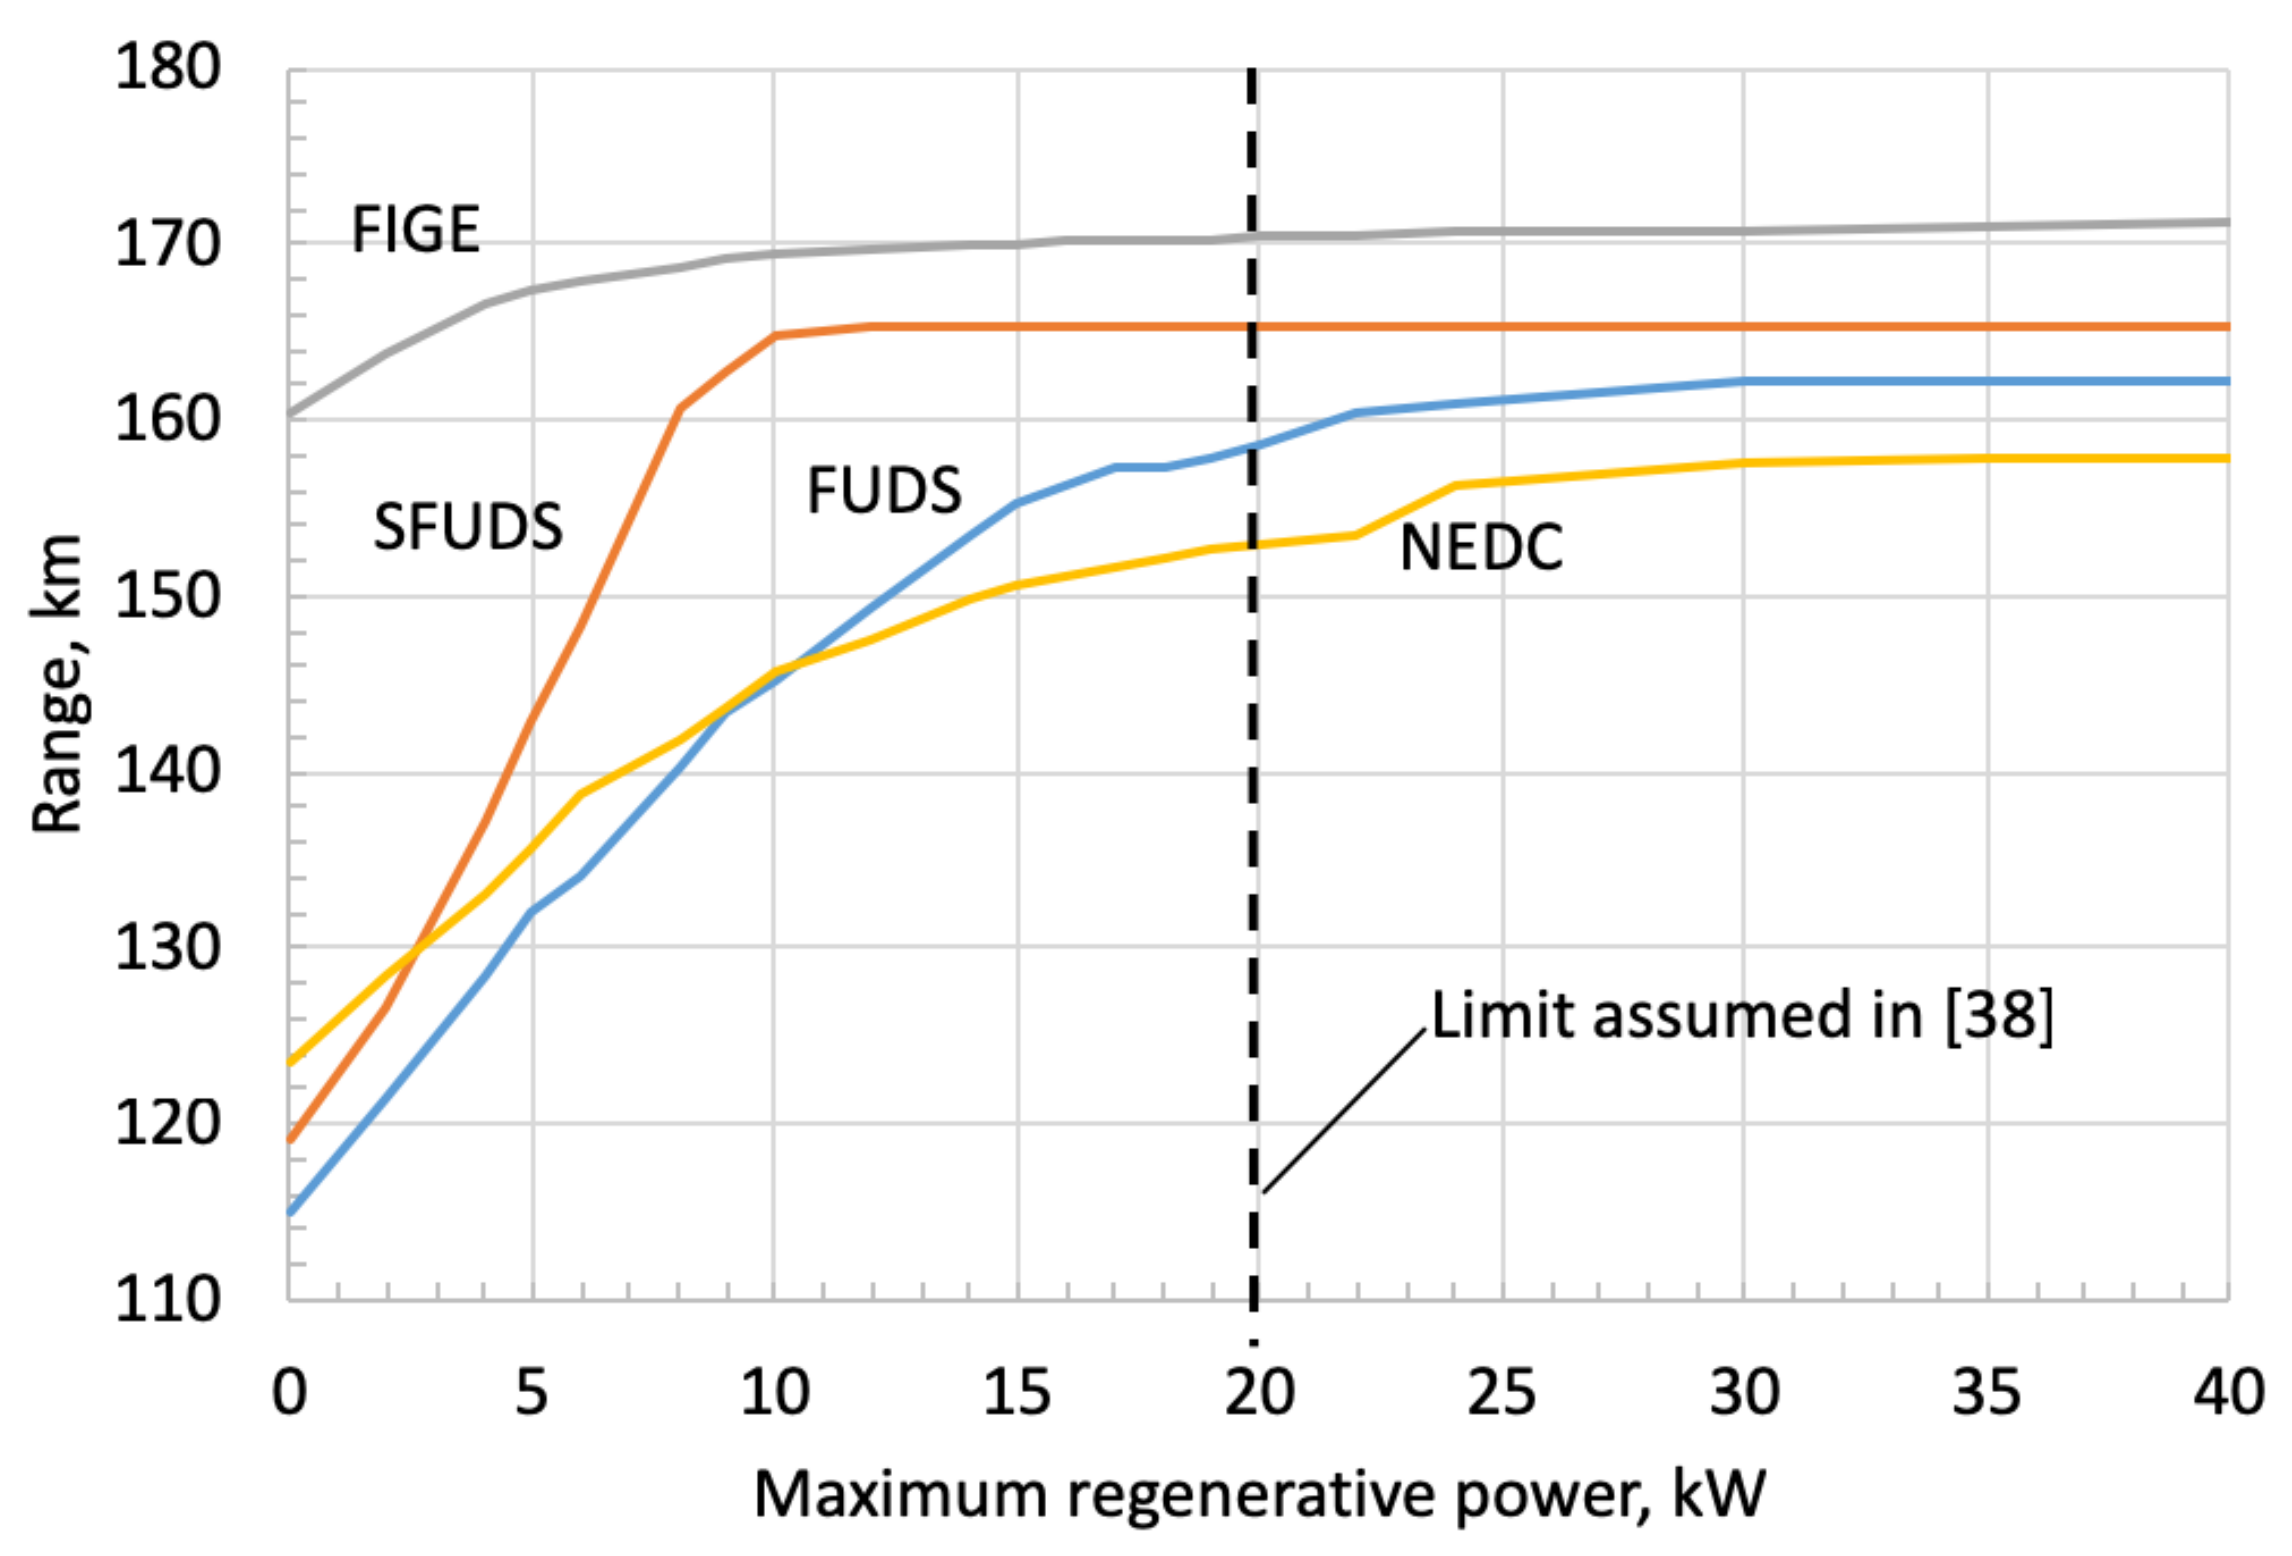
- (d)
- ηrb as a function of the vehicle speed according to the model proposed in the work of [37] and given by the following:In addition, the maximum recoverable braking power is subject to the driving/braking torque limitation of the electric motor/generator.
- (e)
- Maximum regenerative power limited to 20 kW according to the authors of [38], that is, all the available regenerative power PWheels is fed into the electric generator as long as its value does not exceed 20 kW.
5. Conclusions
Author Contributions
Funding
Conflicts of Interest
Abbreviations
| Notations | |
| A | Frontal area, m2 |
| a | Acceleration, m/s2 |
| BEV | Battery electric vehicle |
| C | Battery capacity, Ah |
| Cd | Drag coefficient |
| Cp | Peukert capacity, Ah |
| Removed/added charge, Ah | |
| E | Open circuit voltage, V |
| FIGE | FIGE (Forschungsinstitut Geräusche und Erschütterungen) Institute, Aachen, Germany |
| FUDS | Federal Urban Driving Schedule |
| G | Gear ratio |
| g | Gravity acceleration, m/s2 |
| HVAC | Heating, ventilation, and air-conditioning |
| I | Current, A |
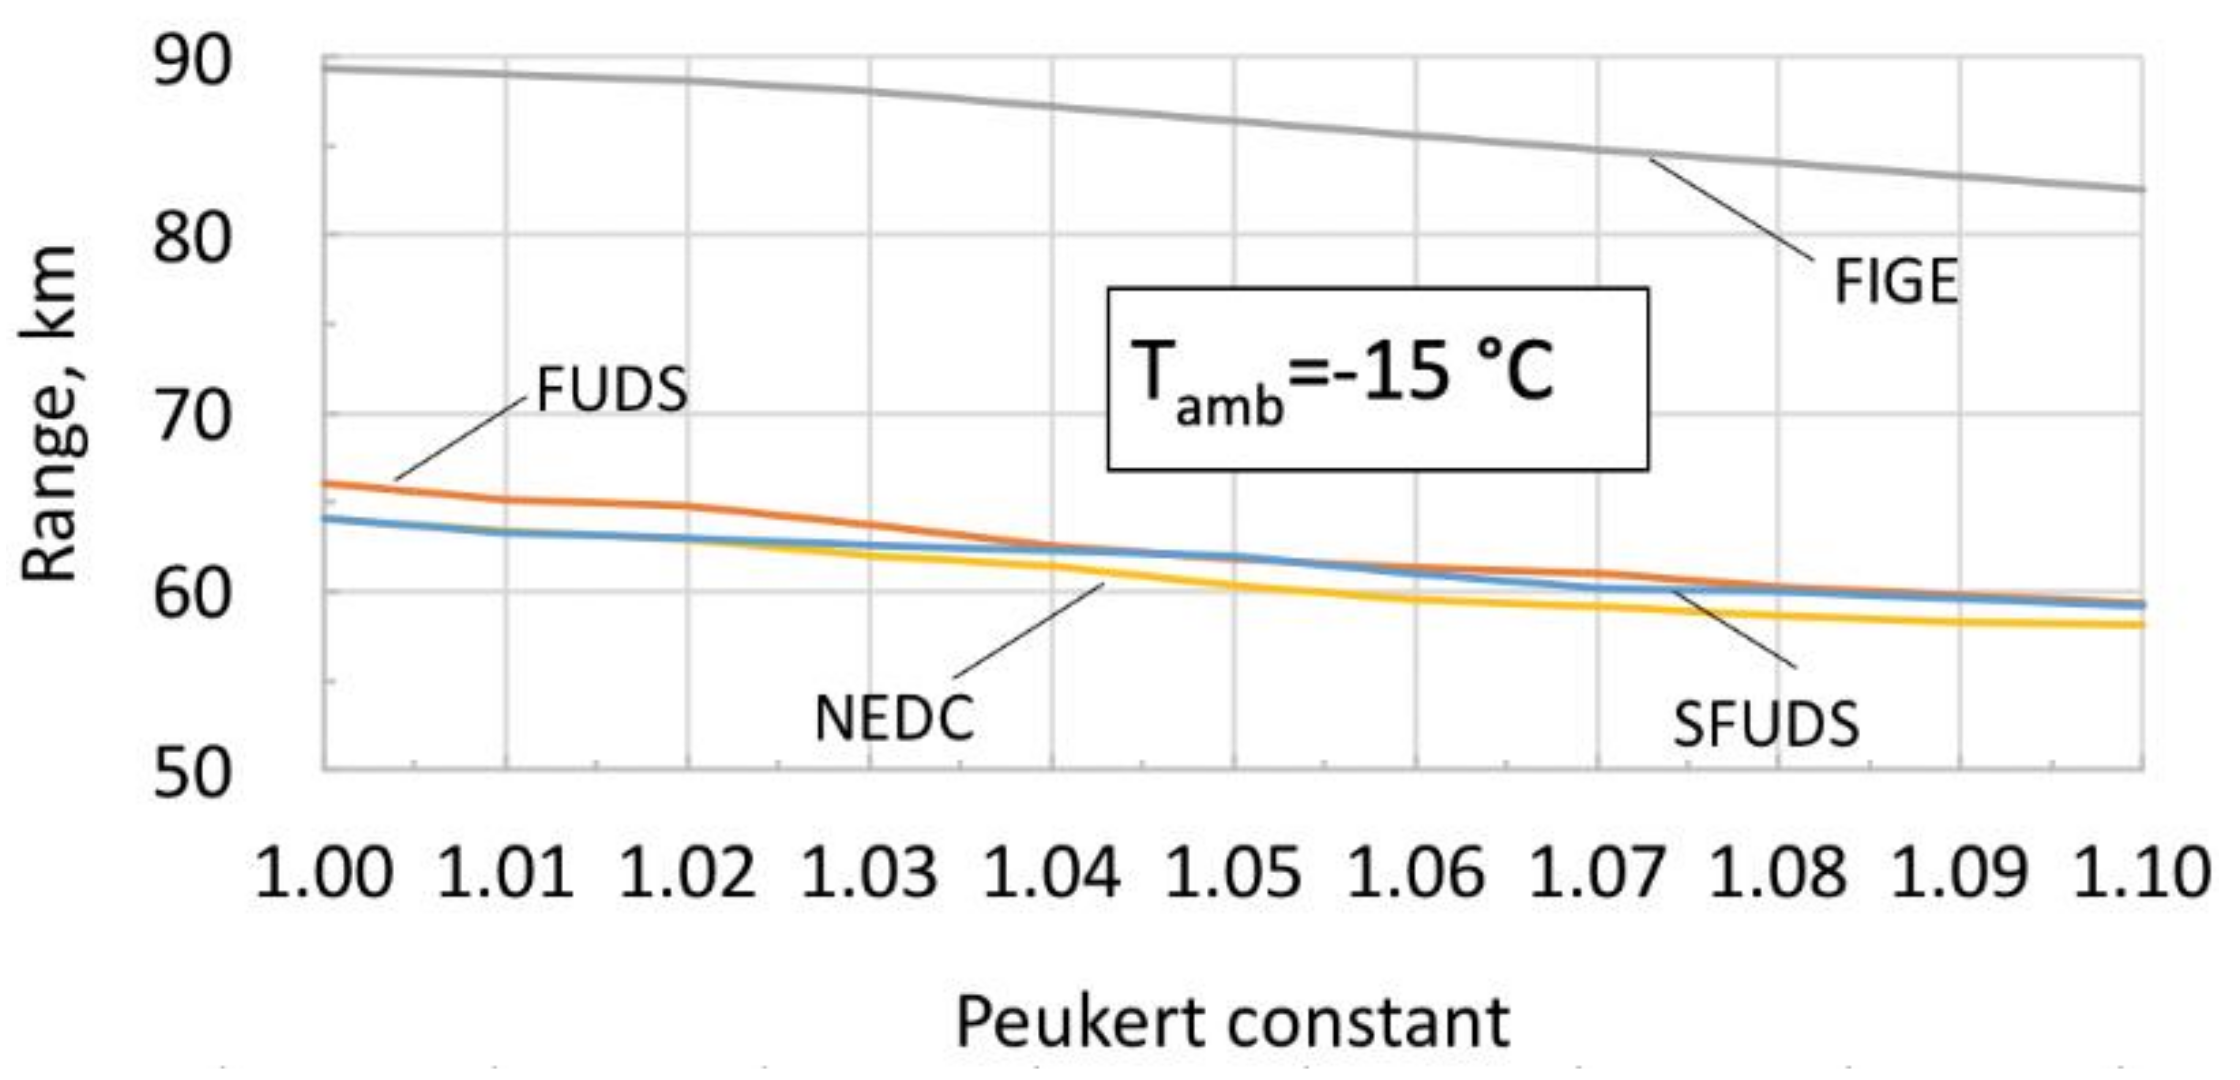
| k | Peukert constant |
| mc | Vehicle mass with battery pack (curb weight), kg |
| mI | Vehicle equivalent mass increase due to the angular moments of the rotating components |
| mv | Total vehicle mass including occupants (gross weight), kg |
| NEDC | New Eu |
| P | Power, W |
| Rint | Battery internal resistance, Ω |
| SFUDS | Simplified Federal Urban Driving Schedule |
| SOC | State of charge |
| t | Time, t |
| v | Velocity, m/s |
| Subscripts | |
| Acc | Accessories |
| Bat | Battery |
| av | Average |
| max | Maximum |
| i | i-th time step |
| Greek symbols | |
| α | Slope angle of the road |
| ρ | Air density, kg/m3 |
| ηm | Electric motor/generator efficiency |
| ηrb | Regenerative braking efficiency |
| ηtr | Transmission and gear efficiency |
| µrr | Rolling resistance coefficient |
References
- Fiori, C.; Ahn, K.; Rakha, H.A. Power-based electric vehicle energy consumption model: Model development and validation. Appl. Energy 2016, 168, 257–268. [Google Scholar] [CrossRef]
- Ehsani, M.; Gao, Y.; Emadi, A. Modern electric, hybrid electric, and fuel cell vehicles: Fundamentals, theory, and design. In Power Electronics and Applications Series, 2nd ed.; CRC Press: Boca Raton, FL, USA, 2010. [Google Scholar]
- Tribioli, L.; Cozzolino, R.; Chiappini, D.; Iora, P. Influence of Fuel Type on the Performance of a Plug-In Fuel Cell/Battery Hybrid Vehicle with On-Board Fuel Processing. In SAE Technical Paper, Proceedings of SAE 13th International Conference on Engines and Vehicles, ICE 2017, Capri, Napoli, Italy, 10–14 September 2017.
- Tribioli, L.; Cozzolino, R.; Chiappini, D.; Iora, P. Energy management of a plug-in fuel cell/battery hybrid vehicle with on-board fuel processing. Appl. Energy 2016, 184, 140–154. [Google Scholar] [CrossRef]
- Wang, Z.; Ma, J.; Zhang, L. State-of-Health Estimation for Lithium-Ion Batteries Based on the Multi-Island Genetic Algorithm and the Gaussian Process Regression. IEEE Access 2017, 5, 21286–21295. [Google Scholar] [CrossRef]
- Zhang, J.; Zhang, L.; Sun, F.; Wang, Z. An Overview on Thermal Safety Issues of Lithium-ion Batteries for Electric Vehicle Application. IEEE Access 2018, 6, 23848–23863. [Google Scholar] [CrossRef]
- Chan, C.C. The state of the art of electric and hybrid vehicles. Proc. IEEE 2002, 90, 247–275. [Google Scholar] [CrossRef]
- Lin, Z. Measuring Range Anxiety: The Substitution-Emergency-Detour (SED) Method. World Electr. Veh. J. 2012, 5, 8–13. [Google Scholar] [CrossRef]
- Shareef, H.; Islam, M.M.; Mohamed, A. A review of the stage-of-the-art charging technologies, placement methodologies, and impacts of electric vehicles. Renew. Sustain. Energy Rev. 2016, 64, 403–420. [Google Scholar] [CrossRef]
- Hidrue, M.K.; Parsons, G.R.; Kempton, W.; Gardner, M.P. Willingness to pay for electric vehicles and their attributes. Resour. Energy Econ. 2011, 33, 686–705. [Google Scholar] [CrossRef]
- Baptista, P.; Pina, A.; Duarte, G.; Rolim, C.; Pereira, G.; Silva, C.; Farias, T. From on-road trial evaluation of electric and conventional bicycles to comparison with other urban transport modes: Case study in the city of Lisbon, Portugal. Energy Convers. Manag. 2015, 92, 10–18. [Google Scholar] [CrossRef]
- Yagcitekin, B.; Uzunoglu, M.; Karakas, A.; Erdinc, O. Assessment of electrically-driven vehicles in terms of emission impacts and energy requirements: A case study for Istanbul, Turkey. J. Clean. Prod. 2015, 96, 486–492. [Google Scholar] [CrossRef]
- Lv, C.; Zhang, J.; Li, Y.; Yuan, Y. Mechanism analysis and evaluation methodology of regenerative braking contribution to energy efficiency improvement of electrified vehicles. Energy Convers. Manag. 2015, 92, 469–482. [Google Scholar] [CrossRef]
- Pina, A.; Baptista, P.; Silva, C.; Ferrão, P. Energy reduction potential from the shift to electric vehicles: The Flores island case study. Energy Policy 2014, 67, 37–47. [Google Scholar] [CrossRef]
- Baptista, P.; Silva, C.; Lopes, J.P.; Soares, F.; Almeida, P. Evaluation of the benefits of the introduction of electricity powered vehicles in an island. Energy Convers. Manag. 2013, 76, 541–553. [Google Scholar] [CrossRef]
- Laurikko, J.; Granström, R.; Haakana, A. Realistic estimates of EV range based on extensive laboratory and field tests in Nordic climate conditions. World Electr. Veh. J. 2013, 6, 192–203. [Google Scholar] [CrossRef]
- Lombardi, L.; Tribioli, L.; Cozzolino, R.; Bella, G. Comparative environmental assessment of conventional, electric, hybrid, and fuel cell powertrains based on LCA. Int. J. Life Cycle Assess. 2017, 22, 1989–2006. [Google Scholar] [CrossRef]
- Qi, Z.; Yang, J.; Jia, R.; Wang, F. Investigating Real-World Energy Consumption of Electric Vehicles: A Case Study of Shanghai. Procedia Comput. Sci. 2018, 131, 367–376. [Google Scholar] [CrossRef]
- Yao, E.; Yang, Z.; Song, Y.; Zuo, T. Comparison of Electric Vehicle’s Energy Consumption Factors for Different Road Types. Discret. Dyn. Nat. Soc. 2013, 2013, 328757. [Google Scholar] [CrossRef]
- Fiori, C.; Ahn, K.; Rakha, H.A. Optimum routing of battery electric vehicles: Insights using empirical data and microsimulation. Transp. Res. Part D Transp. Environ. 2018, 64, 262–272. [Google Scholar] [CrossRef]
- Maia, R.; Silva, M.; Araújo, R.; Nunes, U. Electric vehicle simulator for energy consumption studies in electric mobility systems. In Proceedings of the 2011 IEEE forum on integrated and sustainable transportation system (FISTS), Vienna, Austria, 29 June–1 July 2011; pp. 227–232. [Google Scholar]
- Wu, X.; Freese, D.; Cabrera, A.; Kitch, W.A. Electric vehicles’ energy consumption measurement and estimation. Transp. Res. Part D Transp. Environ. 2015, 34, 52–67. [Google Scholar] [CrossRef]
- Shankar, R.; Marco, J. Method for estimating the energy consumption of electric vehicles and plug-in hybrid electric vehicles under real-world driving conditions. IET Intell. Transp. Syst. 2013, 7, 138–150. [Google Scholar] [CrossRef]
- Bellocchi, S.; Guizzi, G.L.; Manno, M.; Salvatori, M.; Zaccagnini, A. Reversible heat pump HVAC system with regenerative heat exchanger for electric vehicles: Analysis of its impact on driving range. Appl. Therm. Eng. 2018, 129, 290–305. [Google Scholar] [CrossRef]
- Zhou, G.; Li, H.; Liu, E.; Li, B.; Yan, Y.; Chen, T.; Chen, X. Experimental study on combined defrosting performance of heat pump air conditioning system for pure electric vehicle in low temperature. Appl. Therm. Eng. 2017, 116, 677–684. [Google Scholar] [CrossRef]
- Kohei, U.; Noyama, H. Air-conditioning system for electric vehicles (i-MiEV). In Proceedings of the SAE Automotive Refrigerant & System Efficiency Symposium, Scottsdale, AZ, USA, 13–15 July 2010; Volume 1. [Google Scholar]
- Rizalino, J.; Reyes, M.D.; Parsons, R.V.; Hoemsen, R. Winter Happens: The Effect of Ambient Temperature on the Travel Range of Electric Vehicles. IEEE Trans. Veh. Technol. 2016, 65, 4016–4022. [Google Scholar]
- Lowse-Busch, H.; Duoba, M.; Rask, E.; Meyer, M. Advanced Powertrain Research Facility AVTA Nissan Leaf Testing and Analysis; Argonne National Laboratory: Lemont, IL, USA, 2012.
- Wongwises, S.; Kamboon, A.; Orachon, B. Experimental investigation of hydrocarbon mixtures to replace HFC-134a in an automotive air conditioning system. Energy Convers. Manag. 2006, 47, 1644–1659. [Google Scholar] [CrossRef]
- Alves, J.; Baptista, P.C.; Gonçalves, G.A.; Duarte, G.O. Indirect methodologies to estimate energy use in vehicles: Application to battery electric vehicles. Energy Convers. Manag. 2016, 124, 116–129. [Google Scholar] [CrossRef]
- Tian, Z.; Qian, C.; Gu, B.; Yang, L.; Liu, F. Electric vehicle air conditioning system performance prediction based on artificial neural network. Appl. Therm. Eng. 2015, 89, 101–114. [Google Scholar] [CrossRef]
- Kambly, K.; Bradley, T.H. Geographical and temporal differences in electric vehicle range due to cabin conditioning energy consumption. J. Power Sources 2015, 275, 468–475. [Google Scholar] [CrossRef]
- Hendricks, J.T. Vehicle Transient Air Conditioning Analysis: Model Development & System Optimization Investigations; National Renewable Energy Laboratory: Golden, CO, USA, 2001.
- Farrington, R.; Rugh, P.J. Impact of Vehicle Air Conditioning on Fuel Economy, Tailpipe Emissions, and Electric Vehicle Range; NREL/CP-540e28960; National Renewable Energy Laboratory: Golden, CO, USA, 2000.
- Sarrafan, K.; Sutanto, D.; Muttaqi, K.M.; Town, G. Accurate range estimation for an electric vehicle including changing environmental conditions and traction system efficiency. IET Electr. Syst. Transp. 2017, 7, 117–124. [Google Scholar] [CrossRef]
- Larminie, J.; Lowry, J. Electric Vehicle Technology Explained; John Wiley & Sons Ltd.: Chichester, UK, 2012. [Google Scholar]
- Genikomsakis, K.N.; Mitrentsis, G. A computationally efficient simulation model for estimating energy consumption of electric vehicles in the context of route planning applications. Transp. Res. Part D Transp. Environ. 2017, 50, 98–118. [Google Scholar] [CrossRef]
- Davis, K.; Hayes, J.G. Simplified Electric Vehicle Powertrain Model for Range and Energy Consumption based on EPA Coast-down Parameters and Test Validation by Argonne National Lab Data on the Nissan Leaf. In Proceedings of the 2014 IEEE Transportation Electrification Conference and Expo: Components, Systems, and Power Electronics—From Technology to Business and Public Policy (ITEC 2014), Dearborn, MI, USA, 15–18 June 2014. [Google Scholar]
- Davis, K.; Hayes, J.G. Analysis of Electric Vehicle Powertrain Simulators for Fuel Consumption Calculations. In Proceedings of the 2016 International Conference on Electrical Systems for Aircraft, Railway, Ship Propulsion and Road Vehicles and International Transportation Electrification Conference (ESARS-ITEC 2016), Railway, Toulouse, France, 2–4 November 2016. [Google Scholar]
- Maia, R.; Silva, M.; Araújo, R.; Nunes, U. Electrical vehicle modeling: A fuzzy logic model for regenerative braking. Expert Syst. Appl. 2015, 42, 8504–8519. [Google Scholar] [CrossRef]
- Omar, N.; Daowd, M.; van den Bossche, P.; Hegazy, O.; Smekens, J.; Coosemans, T.; van Mierlo, J. Rechargeable Energy Storage Systems for Plug-in Hybrid Electric Vehicles—Assessment of Electrical Characteristics. Energies 2012, 5, 2952–2988. [Google Scholar] [CrossRef]
- Cell Module, and Pack for EV Application. Available online: http://www.eco-aesc-lb.com/en/product/liion_ev/ (accessed on 25 October 2018).
- Brandt, D.D. Driving cycle testing of electric vehicle batteries and systems. J. Power Sources 1992, 40, 73–79. [Google Scholar] [CrossRef]


| Reference | [37] | [38] | [39] | [40] | [1] | [19] | Assumed Here |
|---|---|---|---|---|---|---|---|
| Nominal battery energy | 24 kWh | 24 kWh | 24 kWh | Capacity of 65 Ah times open circuit voltage as by Equation (9) with SOC at nominal conditions | - | 24 kWh | Capacity of 65 Ah times open circuit voltage as by Equation (9) with SOC at nominal conditions [40] |
| Battery efficiency | 95% | Based on charge efficiency of 85% and Rint = 0.11 Ω | Based on round trip efficiency of 85% and Rint = 0.1 Ω | Based on round trip efficiency of 97% and Rint = as by Table 3 | 90% | - | Based on internal resistance as by Table 3 [40] and Peukert battery model with k = 1.03 [41] |
| Rolling coefficient | 0.008 | Vehicle load forces expressed as function of vehicle speed | 0.008 | 0.007 | 1.75 × 10⁻³ (0.0328v + 4.575) | 0.012 | 1.75 × 10⁻³ (0.0328v + 4.575) [1] |
| Drag coefficient | 0.29 | 0.28/0.29 | 0.28 | 0.28 | 0.29 | 0.28 | |
| Frontal area, m2 | 2.19 | 2.19 | 2.29 | 2.3316 | 2.27 | 2.3 | |
| Air density, kg/m3 | 1.25 | - | 1.25 | 1.2256 | 1.2 | Function of temperature | |
| Transmission efficiency | 0.97 | 0.97 | 0.97 | 0.83 | 0.92 | Included in overall power train efficiency of 80% | 0.97 |
| Gear ratio, G | 8.2 | 7.9377 | 7.94/8.19 | 7.937 | - | - | 7.94 |
| Tire radius, m | 0.316 | 0.315 | 0.316 | 0.309 | - | 0.31 | |
| Maximum motor power, kW | 80 | 80 | 80 | 80 | - | - | 80 |
| Motor /generator efficiency | Function of load | Based on a per-phase equivalent circuit electric model | 89%–96% (Motor + controller efficiency) | Varying between 85% and 95% as function motor torque and speed | 91% | Included in overall power train efficiency of 80% | Function of load, according to authors of [37] |
| Power consumption of accessories (cabin air conditioning excluded), W | 300 | 180 | 200 | 269 | 700 | 400 | 200 |
| Vehicle mass (curb weight), kg | - | 1521 | 1498/1691 | 1521 | 1521 | 1521 | 1521 |
| Vehicle mass including occupants (gross weight), kg | 1663 | 1701 | - | 1761 | 1595/1640 | 1601 /1731 | 1600 |
| Fictitious vehicle mass increase due to the inertia of rotating components, kg | 0.05∙mc | - | - | - | 0.03∙mc | [40] | |
| Regenerative braking model | Speed-dependent regeneration efficiency; limit on maximum generator torque | Limited to maximum braking power of 20 kW | 100% regenerative braking at all vehicle speeds | Regenerative coefficient based on a fuzzy logic model | Not considered | [1] |
| Part Load Fraction | ηm, % | |
|---|---|---|
| Motor | Generator | |
| 0.01 | 58.72 | 56.62 |
| 0.02 | 72.24 | 70.63 |
| 0.05 | 83.89 | 83.02 |
| 0.1 | 88.67 | 88.20 |
| 0.2 | 91.28 | 91.04 |
| 0.3 | 92.12 | 91.98 |
| 0.4 | 92.71 | 92.56 |
| 0.5 | 93.31 | 93.14 |
| 0.6 | 93.91 | 93.71 |
| 0.7 | 94.51 | 94.29 |
| 0.8 | 94.43 | 94.74 |
| 0.9 | 93.67 | 94.07 |
| 1 | 92.91 | 93.41 |
| SOC | 0.1 | 0.2 | 0.3 | 0.4 | 0.5 | 0.6 | 0.7 | 0.8 | 0.9 | 1.0 |
|---|---|---|---|---|---|---|---|---|---|---|
| Rint—charging, Ω | 0.0830 | 0.0830 | 0.0892 | 0.0997 | 0.1051 | 0.0894 | 0.0919 | 0.1135 | 0.1026 | 0.0997 |
| Rint—discharging, Ω | 0.0620 | 0.0620 | 0.0587 | 0.0691 | 0.0593 | 0.0928 | 0.0906 | 0.0664 | 0.0892 | 0.0250 |
© 2019 by the authors. Licensee MDPI, Basel, Switzerland. This article is an open access article distributed under the terms and conditions of the Creative Commons Attribution (CC BY) license (http://creativecommons.org/licenses/by/4.0/).
Share and Cite
Iora, P.; Tribioli, L. Effect of Ambient Temperature on Electric Vehicles’ Energy Consumption and Range: Model Definition and Sensitivity Analysis Based on Nissan Leaf Data. World Electr. Veh. J. 2019, 10, 2. https://doi.org/10.3390/wevj10010002
Iora P, Tribioli L. Effect of Ambient Temperature on Electric Vehicles’ Energy Consumption and Range: Model Definition and Sensitivity Analysis Based on Nissan Leaf Data. World Electric Vehicle Journal. 2019; 10(1):2. https://doi.org/10.3390/wevj10010002
Chicago/Turabian StyleIora, Paolo, and Laura Tribioli. 2019. "Effect of Ambient Temperature on Electric Vehicles’ Energy Consumption and Range: Model Definition and Sensitivity Analysis Based on Nissan Leaf Data" World Electric Vehicle Journal 10, no. 1: 2. https://doi.org/10.3390/wevj10010002
APA StyleIora, P., & Tribioli, L. (2019). Effect of Ambient Temperature on Electric Vehicles’ Energy Consumption and Range: Model Definition and Sensitivity Analysis Based on Nissan Leaf Data. World Electric Vehicle Journal, 10(1), 2. https://doi.org/10.3390/wevj10010002