
GIS Fault Prediction Approach Based on IPSO-LSSVM Algorithm

1
State Grid Anhui Electric Power Company Limited, Hefei 230022, China
2
Electric Power Research Institute, State Grid Anhui Electric Power Co., Ltd., Hefei 230601, China
3
School of Electrical Engineering and Automation, Hefei University of Technology, Hefei 230009, China
*
Author to whom correspondence should be addressed.
Sustainability 2023, 15(1), 235; https://doi.org/10.3390/su15010235
Submission received: 27 November 2022
/
Revised: 12 December 2022
/
Accepted: 15 December 2022
/
Published: 23 December 2022
(This article belongs to the Special Issue Emerging Technologies towards Energy Cooperation between Smart Grid and Microgrids)
Abstract
:With the improvement of industrialization, the importance of equipment failure prediction is increasing day by day. Accurate failure prediction of gas-insulated switchgear (GIS) in advance can reduce the economic loss caused by the failure of the power system to operate normally. Therefore, a GIS fault prediction approach based on Improved Particle Swarm Optimization Algorithm (IPSO)-least squares support vector machine (LSSVM) is proposed in this paper. Firstly, the future gas conditions of the GIS to determine the characteristic data of SF6 decomposition gas are analyzed; Secondly, a GIS fault prediction model based on LSSVM is established, and the IPSO algorithm is used to normalize the parameters LSSVM. The parameters of c and radial basis kernel function are optimized, which can meet the needs of later search accuracy while ensuring the global search capability in the early stage. Finally, the effectiveness of the proposed method is verified by the fault data of gas-insulated switch. Simulation results shows that, compared with the prediction methods based on IGA-LSSVM and PSO-LSSVM, the prediction accuracy rate of the proposed method reached 92.1%, which has the smallest prediction absolute error, higher accuracy and stronger prediction ability.
1. Introduction
Gas-insulated switchgear (GIS) has the advantages of a small footprint, high operational reliability, and a long maintenance cycle [1,2,3]. So, it has been widely used in power systems, especially in high-voltage power grids [4,5]. Although GIS equipment has the advantage of high operational reliability, insulation and mechanical defects and failures still occur from time to time during its operation [6,7,8]. In order to meet the high efficiency and reliability of equipment operation, fault prediction can process the information measured by each sensor through certain theories and algorithms to infer the trend of fault development, so as to check the equipment to reduce the loss caused by the fault [9]. Therefore, to propose a GIS fault prediction method for accurate fault prediction in advance is of great significance to ensure the stable operation of the power system [10].
Because the fault prediction is carried out before the fault occurs, it often has the characteristics of small fault amplitude, inconspicuous fault characteristics, and easy to be covered by noise. Therefore, the signal processing and analysis before the fault occurs are the focus of fault prediction technology research [11,12,13]. The authors in [14] used the combination of deep neural network (DNN) and principal component analysis (PCA) to realize the early diagnosis and life prediction of small and slowly changing faults. In [15], in order to realize the active early warning of familial defect faults of power grid equipment, a familial defect fault database is established, and a probability prediction model between a single influencing factor and the defect decision data is established by the Copula function. In order to solve the problem of large error and low accuracy in predicting equipment failure rate with a single model, a method for equipment failure rate prediction based on Autoregressive Moving Average Model-Back Propagation (ARMA-BP) combined model was proposed in [16]. The prediction results show that compared with the single prediction model, the equipment failure rate prediction result of the ARMA-BP combined model is more accurate. Reference [17] predicts the next batch of statistic values in GIS by establishing an autoregressive model, and compares the calculated value with the control limit, thereby realizing the prediction of S fault, but this method assumes that the trend of the fault is linear, and prediction results of the quantity are independent, so it is difficult to predict the nonlinear and multi-coupling data.
SF6 gas-insulated metal-enclosed combined electrical appliances have become the main component of modern power systems because of their small footprint and high reliability [18]. Reference [19] proposed a fault detection method for gas-insulated switchgear based on a support vector machine and nuclear principal component analysis, and verified the reliability and accuracy of the algorithm through the actual sample test. Reference [20] established a GIS internal insulation electric field degradation calculation model, and used the central limit theorem to estimate the failure probability of the most harmful metal tip. In the literature [21], the online monitoring of the content of SO2, SOF2, H2S, CO and other components in the SF6 gas decomposition products can quickly find the location of the gas chamber where the fault point is located, but no research has been conducted on the types of faults that cause gas composition changes. Reference [22] proposes a GIS state assessment method combining the subjective weighting method and the objective weighting method to judge the operating status of GIS equipment. This method can systematically and comprehensively evaluate the health status of GIS, but it cannot provide a reference for more detailed troubleshooting, which is difficult to apply in practical engineering. The applicability of the model to the data characteristics is not highly consistent, and the prediction accuracy cannot meet the requirements.
In summary, how to accurately diagnose GIS faults according to operating parameters has become a key technology that needs to be overcome. For this reason, a GIS fault prediction approach based on IPSO-LSSVM is proposed in this paper. The contributions are as follows:
- (1)
- A GIS fault prediction model based on IPSO-LSSVM is established.
- (2)
- The PSO algorithm is improved through weight nonlinear adjustment and iterative speed optimization, so as to improve the optimization ability and convergence speed of the algorithm.
- (3)
- The normalization parameter c of LSSVM and the parameter of radial basis kernel function are optimized by the improved PSO algorithm, so as to improve the accuracy of the prediction model.
The organization of this paper is as follows: Section 2 analyzes the GIS fault characteristics; Section 3 introduces the GIS fault prediction model based on the improved PSO-LSSVM; Section 4 introduces the improvement strategy of the PSO algorithm; the Section 4 is the simulation verification; Section 5 is the conclusion.
2. GIS Fault Feature Analysis
The main faults of SF6 electrical equipment are discharge and overheating. The discharge mainly includes three types: arc discharge, spark discharge and corona discharge [23]. Both discharge and overheating will generate energy to promote the decomposition of SF6 gas. The main components decomposed under the action of discharge are SF6 and metal oxides of electrodes or containers. In the presence of water vapor and oxygen, SF4 reacts with them and finally generates SO2, HF, SO2F2 and SOF2 and other compounds.
In the discharge state, the energy generated by different discharge types is different, which promotes the decomposition of SF6 gas into different stable substances under different energy conditions. Studies have found that the ratio of SO2F2/SO2 has certain regularity [24]. During corona discharge, its ratio is often in the range of 4.0~6.0 or even higher, and spark discharges are mostly concentrated in 2.0~3.5. During arc discharge, the ratio is the smallest, mostly 0.1~0.3, which decreases with the increase in intensity of discharge. SO2 and SO2F2 are substances that are produced in large quantities during discharge faults. Considering that they have good stability at the same time, monitoring will be more convenient and accurate. Based on the observation data of 220 kV voltage level GIS in a substation, some data of SF6 decomposition gas characteristics are shown in Table 1.
When predicting the future failure condition of GIS, it is necessary to analyze the future gas condition of GIS. In this paper, based on the historical data of decomposed gas content in GIS gas chamber, the GIS fault prediction method based on IPSO-LSSVM is used to predict the decomposition gas of GIS gas chamber in the future.
3. GIS Fault Prediction Approach Based on Improved PSO-LSSVM
3.1. Least Squares Support Vector Machine
The least squares support vector machine is a new type of support vector machine developed on the basis of the standard support vector machine. It replaces the inequality constraints of the traditional support vector machine (SVM) with equality constraints, and uses the sum of squares of errors as the empirical loss of the training set [25]. By transforming the quadratic programming problem into a system of linear equations, the solution speed and convergence accuracy are improved.
For the training sample set . The sample is mapped from the input space to the feature space, the nonlinear mapping is , namely:
construct an optimal decision function in the mapped feature space as follows:
The decision function parameters w and b are determined based on the principle of structural risk minimization, and the solution process can be equivalent to solving the following optimization problems:
The solution using the Lagrange method can be written as:
where is the Lagrange multiplier.
According to the optimization conditions , we can get:
Substituting Equations (5) and (7) into Equation (8), we can get:
Assuming that the kernel function is defined, then
Combining Equations (6) and (10) into a system of linear equations is as follows:
Based on the previously set training sample set , the model parameters can be obtained by solving the linear equation system (11). Then the decision function can be determined:
In the coefficient of the support vector machine, if the element is not equal to zero, the so-called support vector is the corresponding sample .
On the basis of LSSVM binary classification, a one-to-many classification algorithm is used to establish a multi-class classifier. For the k (k > 2) class classification problem, take all the training samples of y = i and , and construct k training subsets . When constructing the m-th classifier among the k classifiers (), the m-class training samples are used as the first class, the class number is , and the other m-1 classes are used as one class, the class number is .
When classifying the test sample, the test sample is first input to the classifier 1. If the output of the discriminant function is 1, the judgment category is the first type of fault; otherwise, it is automatically input to the next classifier 2, and so on, until the classifier k. If the output of the judgment function is 1, the judgment category is the k-th fault; if the output is −1, the test sample is not in the k categories and belongs to other categories.
3.2. Kernel Function and Parameter Selection
LSSVM transforms the optimization problem into solving a system of linear equations, which makes its model have better generalization ability, and the parameters in LSSVM have a great influence on the performance of the algorithm. In this paper, the Gaussian radial basis kernel function is selected as the kernel function. The normalization parameter c and the parameters of the radial basis kernel function play a key role in the learning ability, generalization ability and training calculation amount of the algorithm [26]. The size of is closely related to the sparsity of the coefficient matrix in formula (11). Another thing that needs to be determined is the regularization parameter c (also called penalty factor) of the model. Based on the principle of minimizing structural risk, its size determines the proportion of empirical risk in structural risk. The smaller c is the weaker the proportion of empirical risk will be, so the model will be simpler, but the accuracy will be reduced. If c is larger, the proportion of empirical risk will be larger, which can improve the accuracy of the model, but the cost is the model will be more complicated. Therefore, in practical applications, an optimal choice should be made between the accuracy and complexity of the model. Take a section of c and , and form a two-dimensional plane with the two sections, and perform continuous search based on the accuracy rate. It can be determined that the only one (c, ) has the highest accuracy rate. It should be noted that this (c, ) may be not the optimal solution of above, but it is also an acceptable satisfactory solution. Therefore, finding the most parameters and applying them to the state estimation model of LSSVM will improve the accuracy of state estimation.
This paper has utilized the improved particle swarm optimization algorithm to find the optimal parameters of LSSVM.
4. Improved LSSVM Parameter Optimization for PSO
In the prediction method proposed in this paper, the parameters c and of the LSSVM are determined by the improved particle swarm optimization algorithm, and the behavior of a group of particles with randomly selected initial values is modeled by the particle swarm optimization algorithm. The position and velocity of each particle over k iterations in the search space are described by and , respectively, and each particle records its best local position . Then, at (k + 1) iterations, the velocity of particle i is obtained by the following equation:
where R1 and R2 are random functions that generate random numbers between 0 and 1; C1 and C2 are training coefficients; is inertia weight factors, which linearly decrease from 0.9 to 0.4, and it can be obtained by the following formula:
where is the maximum number of iteration. At the end of each iteration, the new position of each particle is obtained by the sum of its old position and new velocity:
In addition to improving the accuracy of the GIS fault prediction, the training time and convergence speed are also particularly important. Therefore, we use the particle swarm algorithm to optimize the parameters of the LSSVM model in this section, the particle swarm algorithm is mainly improved in terms of optimization effect and calculation time.
4.1. PSO Weight Nonlinear Adjustment
The inertia weight factor has a great influence on the position update of the PSO algorithm. When the inertia weight factor is relatively large, the particle can quickly converge to the optimal position, but the volatility is large; when the inertia weight factor is relatively small, the particle convergence speed is slow, and it is easy to fall into the local optimum when faced with uncertain bionic optimization. Equation (14) is only processed by linearly decreasing the weight, and there is still room for improvement in the actual optimization process. Therefore, in this paper, the formula (14) is improved, and the weight is decreased by a nonlinear method. The improved inertia weight factor is:
The nonlinear decreasing change of the inertia weight factor can be realized through the above formula, which not only ensures the global search ability in the early stage, but also meets the needs of the later search accuracy.
4.2. PSO Iteration Speed Optimization
After each iteration, the new position of each particle will also change, so the search state will also be different. To adapt to this situation, this chapter optimizes and improves the iteration speed of Equation (15), namely:
where is the speed coefficient.
The parameter optimization process is shown in the Figure 1.
5. Simulation Results
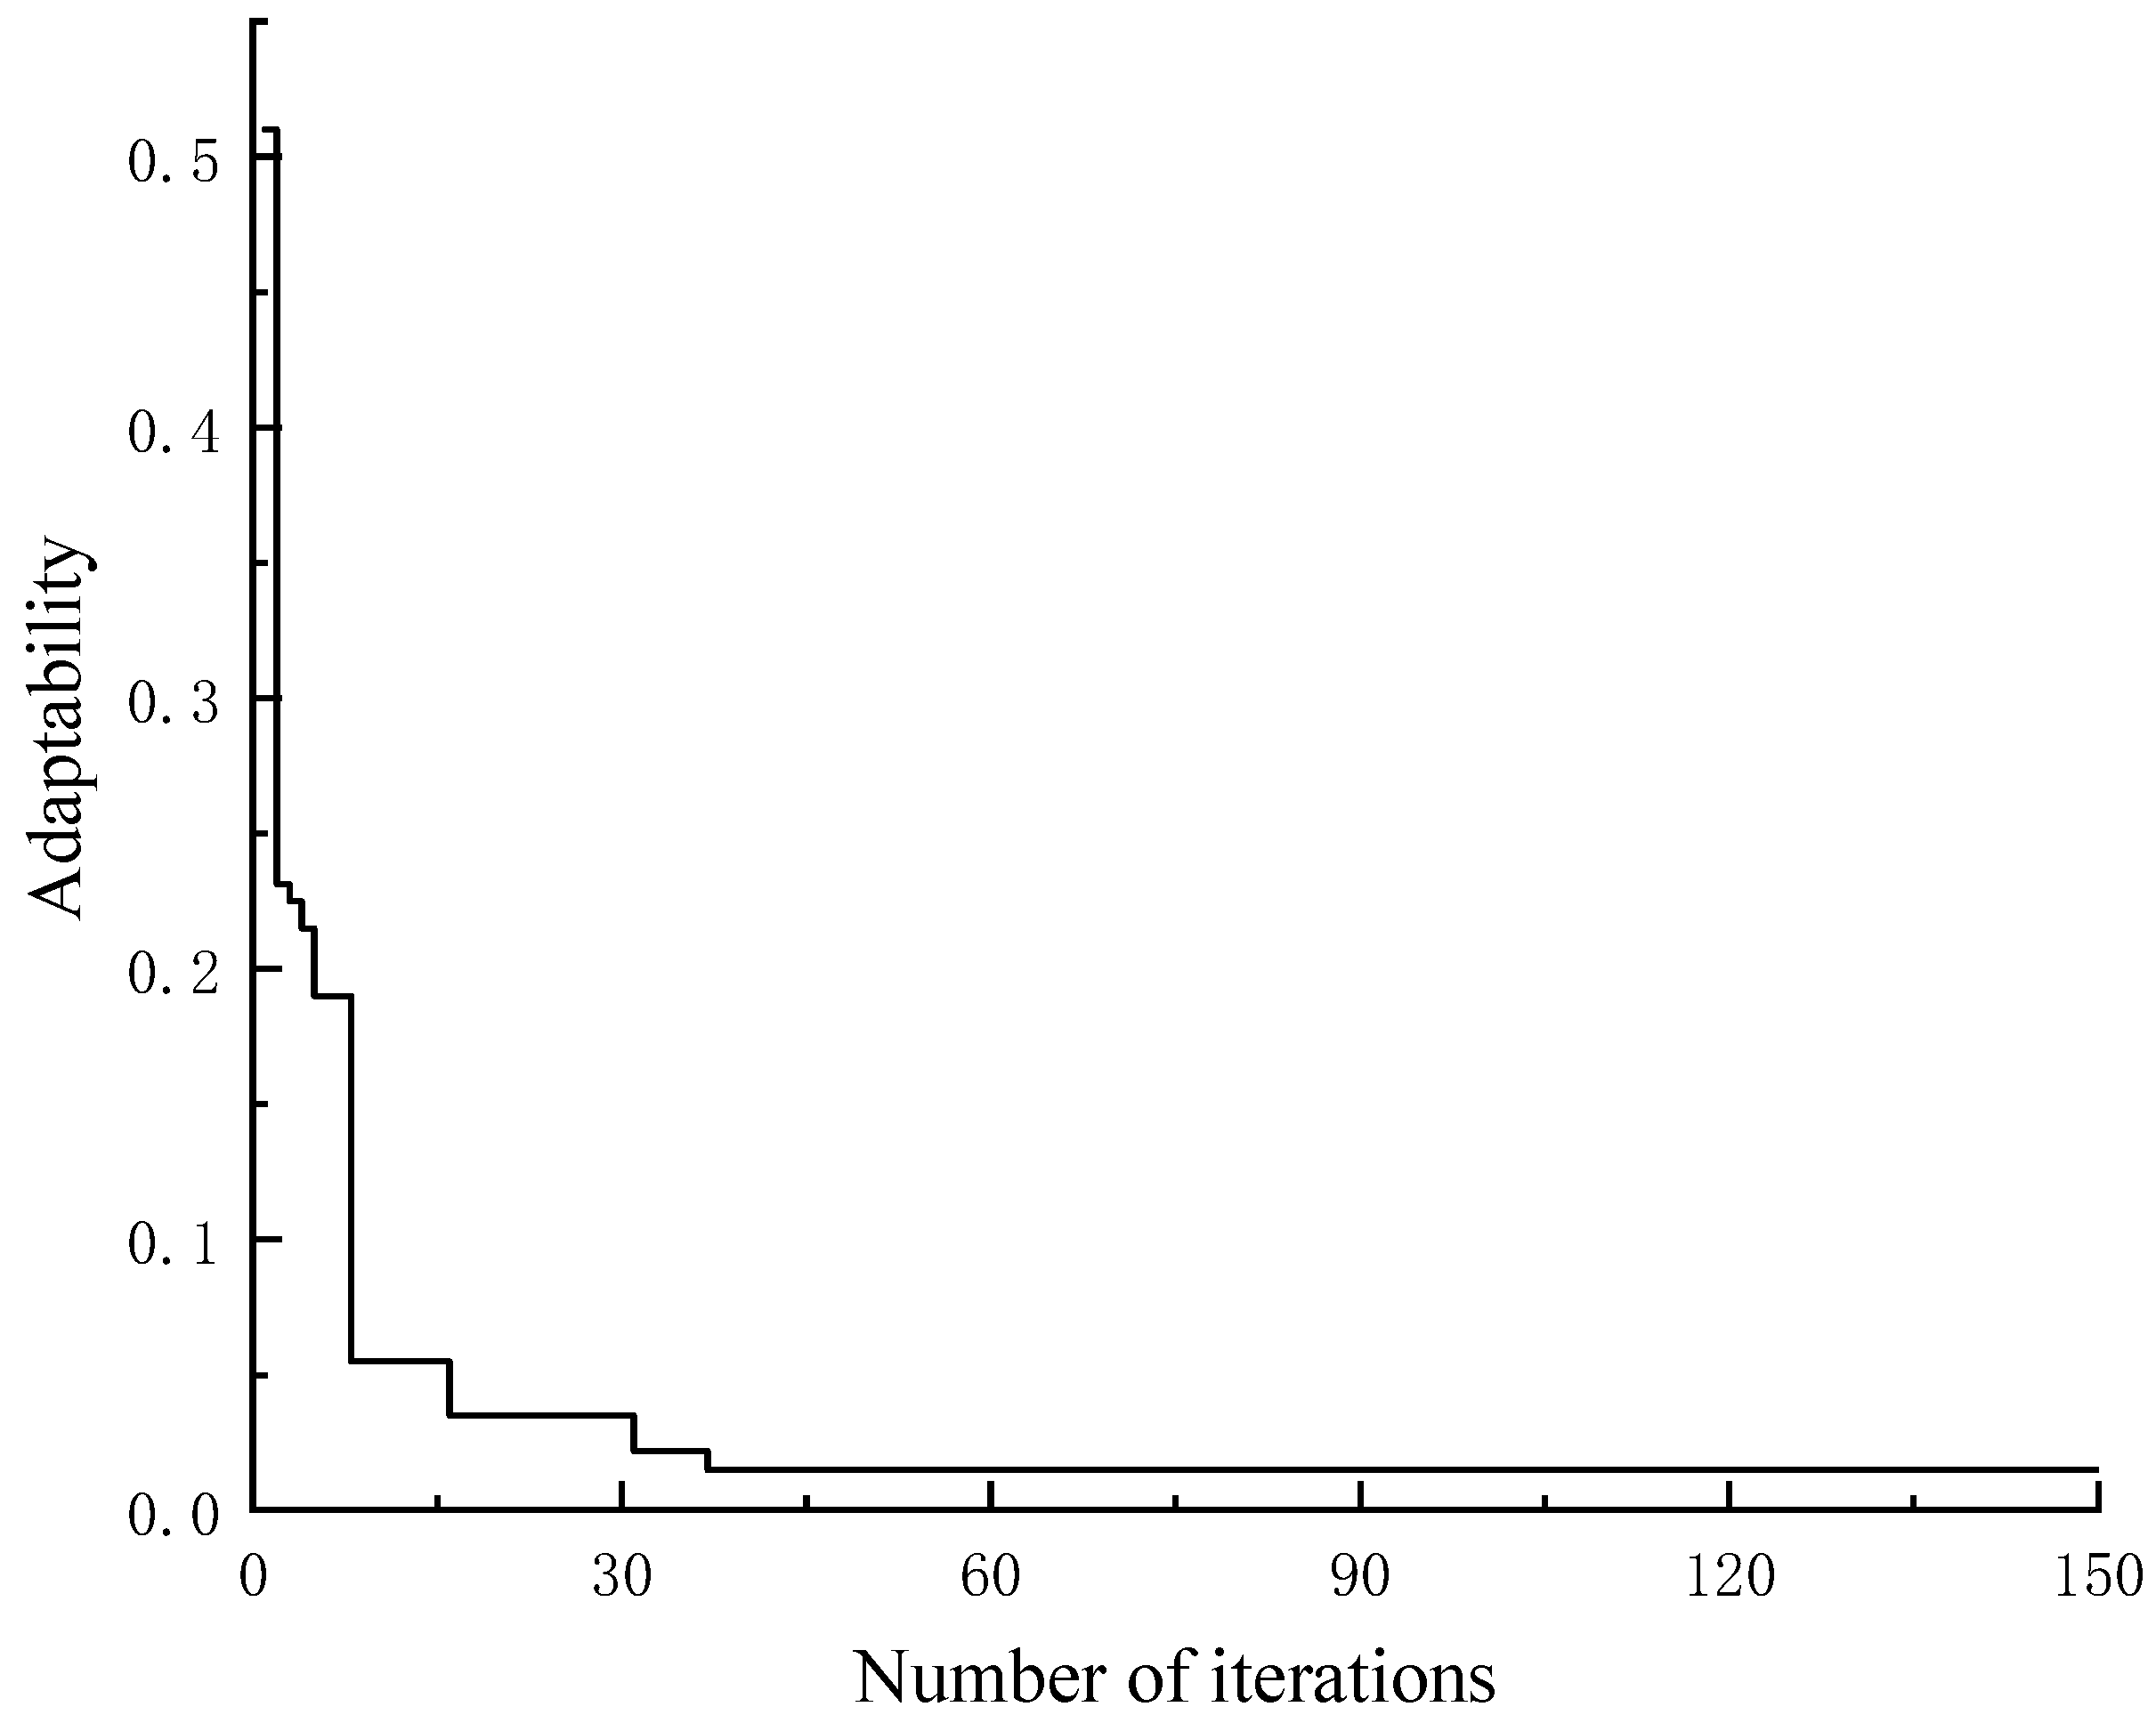
Taking the data collected by the SF6 online monitoring device of GIS in a distribution network as an example. A total of 400 sets of data from 1 March to 5 December 2021 are selected as the training set, and a total of 50 sets of samples of fault type data are selected as the test set. Code c and according to the real number coding mode, and the optimization interval is (0, 200), (0, 15), respectively. The basic parameters of the PSO algorithm are shown in Table 2. The IPSO iteration curve is shown in Figure 2.
It can be seen from Figure 2 that IPSO reaches the minimum fitness value after 37 iterations, and after that the value no longer changed. In addition, the corresponding optimal solutions c and are 64.35 and 2.47, respectively. In order to compare the optimization effect of IPSO, PSO and IGA are used to optimize c and , respectively, and the maximum number of iterations is set to 300. The calculation results of the three optimization algorithms are shown in Table 3.
It can be seen from Table 3 that IPSO is better than PSO and IGA in terms of the number of iterations, optimal value and convergence time. It can be seen that the improvement strategy of the improved PSO algorithm proposed in this paper is successful. IPSO can effectively reduce the number of iterations and accelerate the convergence of the algorithm.
The ratio of SO2F2/SO2 was calculated to find the PD fault types, in which the number of samples of arc discharge fault types was 14, the classification error was 2 times, and the model prediction accuracy was 85.7%. There are 10 spark discharge fault type samples, one classification error, and the prediction accuracy rate is 90.3%. There are 18 normal samples, one prediction error, and the prediction accuracy rate is 94.4%. The overall accuracy of the model reached 92.1%. Prediction results and accuracy comparisons of different algorithms are shown in Table 4 and Table 5.
6. Conclusions
A GIS fault prediction approach based on IPSO-LSSVM is proposed in this paper. The PSO algorithm is improved by nonlinear weight adjustment and iterative speed optimization, so as to optimize the normalization parameters of LSSVM. Simulation results show that: on the one hand, the improved PSO algorithm is superior to PSO and IGA in terms of the number of iterations, optimal value and convergence time, which can effectively reduce the number of iterations and speed up the algorithm convergence; on the other hand, compared with the traditional algorithm, prediction results of the proposed method are more accurate, so that the failure trend can be detected before the failure occurs, which can provide reference for the relevant staff.
In the aspect of power transformer fault diagnosis, with the development of electronic technology and sensor technology, the means of monitoring power transformers are increasing day by day. How to make full use of multi-dimensional information to comprehensively diagnose power transformers is a problem that needs further research in the field of power transformer fault diagnosis.
Author Contributions
All authors contributed equal. All authors have read and agreed to the published version of the manuscript.
Funding
This research received no external funding.
Institutional Review Board Statement
Not applicable.
Informed Consent Statement
Not applicable.
Data Availability Statement
Not applicable.
Conflicts of Interest
The authors declare no conflict of interest.
References
- Liu, L.; Wang, B.; Ma, F.; Zheng, Q.; Yao, L.; Zhang, C.; Mohamed, M.A. A concurrent fault diagnosis method of transformer based on graph convolutional network and knowledge graph. Front. Energy Res. 2022, 10, 127. [Google Scholar] [CrossRef]
- Zhuang, Y.; Hu, X.; Tang, B.; Wang, S.; Cui, A.; Hou, K.; He, Y.; Zhu, L.; Li, W.; Chu, J. Effects of SF6 decomposition components and concentrations on the discharge faults and insulation defects in GIS equipment. Sci. Rep. 2020, 10, 15039–15048. [Google Scholar] [CrossRef] [PubMed]
- Orrù, P.F.; Zoccheddu, A.; Sassu, L.; Mattia, C.; Cozza, R.; Arena, S. Machine learning approach using MLP and SVM algorithms for the fault prediction of a centrifugal pump in the oil and gas industry. Sustainability 2020, 12, 4776. [Google Scholar] [CrossRef]
- Wang, Q.; Xiao, Y.; Dampage, U.; Alkuhayli, A.; Alhelou, H.H.; Annuk, A. An effective fault section location method based three-line defense scheme considering distribution systems resilience. Energy Rep. 2022, 8, 10937–10949. [Google Scholar] [CrossRef]
- Wang, Q.; Jin, T.; Mohamed, M.A. An innovative minimum hitting set algorithm for model-based fault diagnosis in power distribution network. IEEE Access 2019, 7, 30683–30692. [Google Scholar] [CrossRef]
- Faraz, B.; Alesheikh, A.A.; Sharif, M.; Farnaghi, M. FLCSS: A fuzzy-based longest common subsequence method for uncertainty management in trajectory similarity measures. Trans. GIS 2022, 26, 2244–2262. [Google Scholar]
- Wen, T.; Zhang, Q.; Ma, J.; Wu, Z.; Shimomura, N.; Chen, W. A new method to evaluate the effectiveness of impulse voltage for detecting insulation defects in GIS equipment. IEEE Trans. Dielectr. Electr. Insul. 2019, 26, 1301–1307. [Google Scholar] [CrossRef]
- Thacker, H.; Shah, Y.; Borah, A.J.; Jadeja, Y.; Thakkar, M.; Bhimani, S.; Chauhan, G. Assessment of groundwater potential zones across Katrol hill fault, Kachchh, Western India: A remote sensing and GIS approach. Open J. Geol. 2022, 12, 25–33. [Google Scholar] [CrossRef]
- Wang, Q.; Jin, T.; Mohamed, M.A.; Deb, D. A novel linear optimization method for section location of single-phase ground faults in neutral noneffectively grounded systems. IEEE Trans. Instrum. Meas. 2021, 70, 1–10. [Google Scholar] [CrossRef]
- Chen, Z.; He, G.; Li, J.; Liao, Y.; Gryllias, K.; Li, W. Domain adversarial transfer network for cross-domain fault diagnosis of rotary machinery. IEEE Trans. Instrum. Meas. 2020, 23, 61–73. [Google Scholar] [CrossRef]
- Wu, Y.; Zhao, R.; Jin, W.; He, T.; Ma, S.; Shi, M. Intelligent fault diagnosis of rolling bearings using a semi-supervised convolutional neural network. Appl. Intell. 2020, 5, 21–29. [Google Scholar] [CrossRef]
- Wu, Z.; Zhang, Q.; Ma, J.; Li, X.; Wen, T. Effectiveness of on-site dielectric test of GIS equipment. IEEE Trans. Dielectr. Electr. Insul. 2018, 25, 1454–1460. [Google Scholar] [CrossRef]
- Zhang, L.; He, C.; Guo, R.; Yuan, W.; Li, J. Research on effectiveness of lightning impulses with different parameters for detecting protrusion defects in GIS. IEEE Trans. Dielectr. Electr. Insul. 2020, 27, 1354–1362. [Google Scholar] [CrossRef]
- Wen, T.; Zhang, Q.; Ma, J.; Liu, X.; Wu, Z.; Zhang, L.; Zhao, J.; Shimomura, N.; Chen, W. Research on the detecting effectiveness of on-site lightning impulse test for GIS equipment with insulation defects. IEEE Trans. Dielectr. Electr. Insul. 2018, 25, 551–558. [Google Scholar] [CrossRef]
- Deng, X.; Zhang, G. Family defect early warning of multi-factor GIS equipment based on ARMA and copula theory. High Volt. Electr. Appl. 2022, 58, 9–16. [Google Scholar]
- Xu, D.; Zhou, C.; Guan, C.; Wang, X. Equipment failure rate prediction method based on ARMA-BP combined model. Firepower Command. Control. 2021, 46, 83–87. [Google Scholar]
- Ji, H.; Ma, G.; Li, C.; Pang, Z.; Zheng, S. Influence of voltage waveforms on partial discharge characteristics of protrusion defect in GIS. IEEE Trans. Dielectr. Electr. Insul. 2016, 23, 1058–1067. [Google Scholar] [CrossRef]
- Han, X.; Li, J.; Zhang, L.; Liu, Z. Partial discharge characteristics of metallic protrusion in GIS under different lightning impulse voltage waveforms based on UHF method. IEEE Trans. Dielectr. Electr. Insul. 2017, 24, 3722–3729. [Google Scholar] [CrossRef]
- He, S.; Zhang, T.; Zhou, L.; Peng, X.; He, L. GIS fault diagnosis strategy based on feature classification algorithm. Autom. Instrum. 2019, 232, 197–200. [Google Scholar]
- Wu, X.; Li, Y. Pang, W. Research on the electric field degradation characteristics and fault probability prediction of GIS bus latent faults. Power Grid Technol. 2014, 12, 1–12. [Google Scholar]
- Wu, Z.; Lyu, B.; Zhang, Q.; Liu, L.; Zhao, J. Phase-space joint resolved PD characteristics of defects on insulator surface in GIS. IEEE Trans. Dielectr. Electr. Insul. 2020, 27, 156–163. [Google Scholar] [CrossRef]
- Yuan, Y.; Ma, S.; Wu, J.; Jia, B.; Li, W.; Luo, X. Frequency feature learning from vibration information of GIS for mechanical fault detection. Sensors 2019, 19, 1949. [Google Scholar] [CrossRef] [PubMed] [Green Version]
- Yang, Y.; Ma, S.; Wu, J.; Jia, B.; Li, W.; Luo, X. Fault diagnosis in gas insulated switchgear based on genetic algorithm and density-based spatial clustering of applications with noise. IEEE Sens. J. 2019, 21, 965–973. [Google Scholar] [CrossRef]
- Ma, S.; Chen, M.; Wu, J.; Wang, Y.; Jia, B.; Jiang, Y. Intelligent fault diagnosis of HVCB with feature space optimization-based random forest. Sensors 2018, 18, 1221. [Google Scholar] [CrossRef] [PubMed] [Green Version]
- He, L.; Yang, J.; Zhang, Z.; Li, Z.; Ding, D.; Yuan, M.; Li, R.; Chen, M. Research on mechanical defect detection and diagnosis method for GIS equipment based on vibration signal. Energies 2021, 14, 5507. [Google Scholar] [CrossRef]
- Zhang, C.; Dong, M.; Ren, M.; Huang, W.; Zhou, J.; Gao, X.; Albarracín, R. Partial discharge monitoring on metal-enclosed switchgear with distributed non-contact sensors. Sensors 2018, 18, 551. [Google Scholar] [CrossRef]
Figure 1.
LSSVM parameter optimization process.
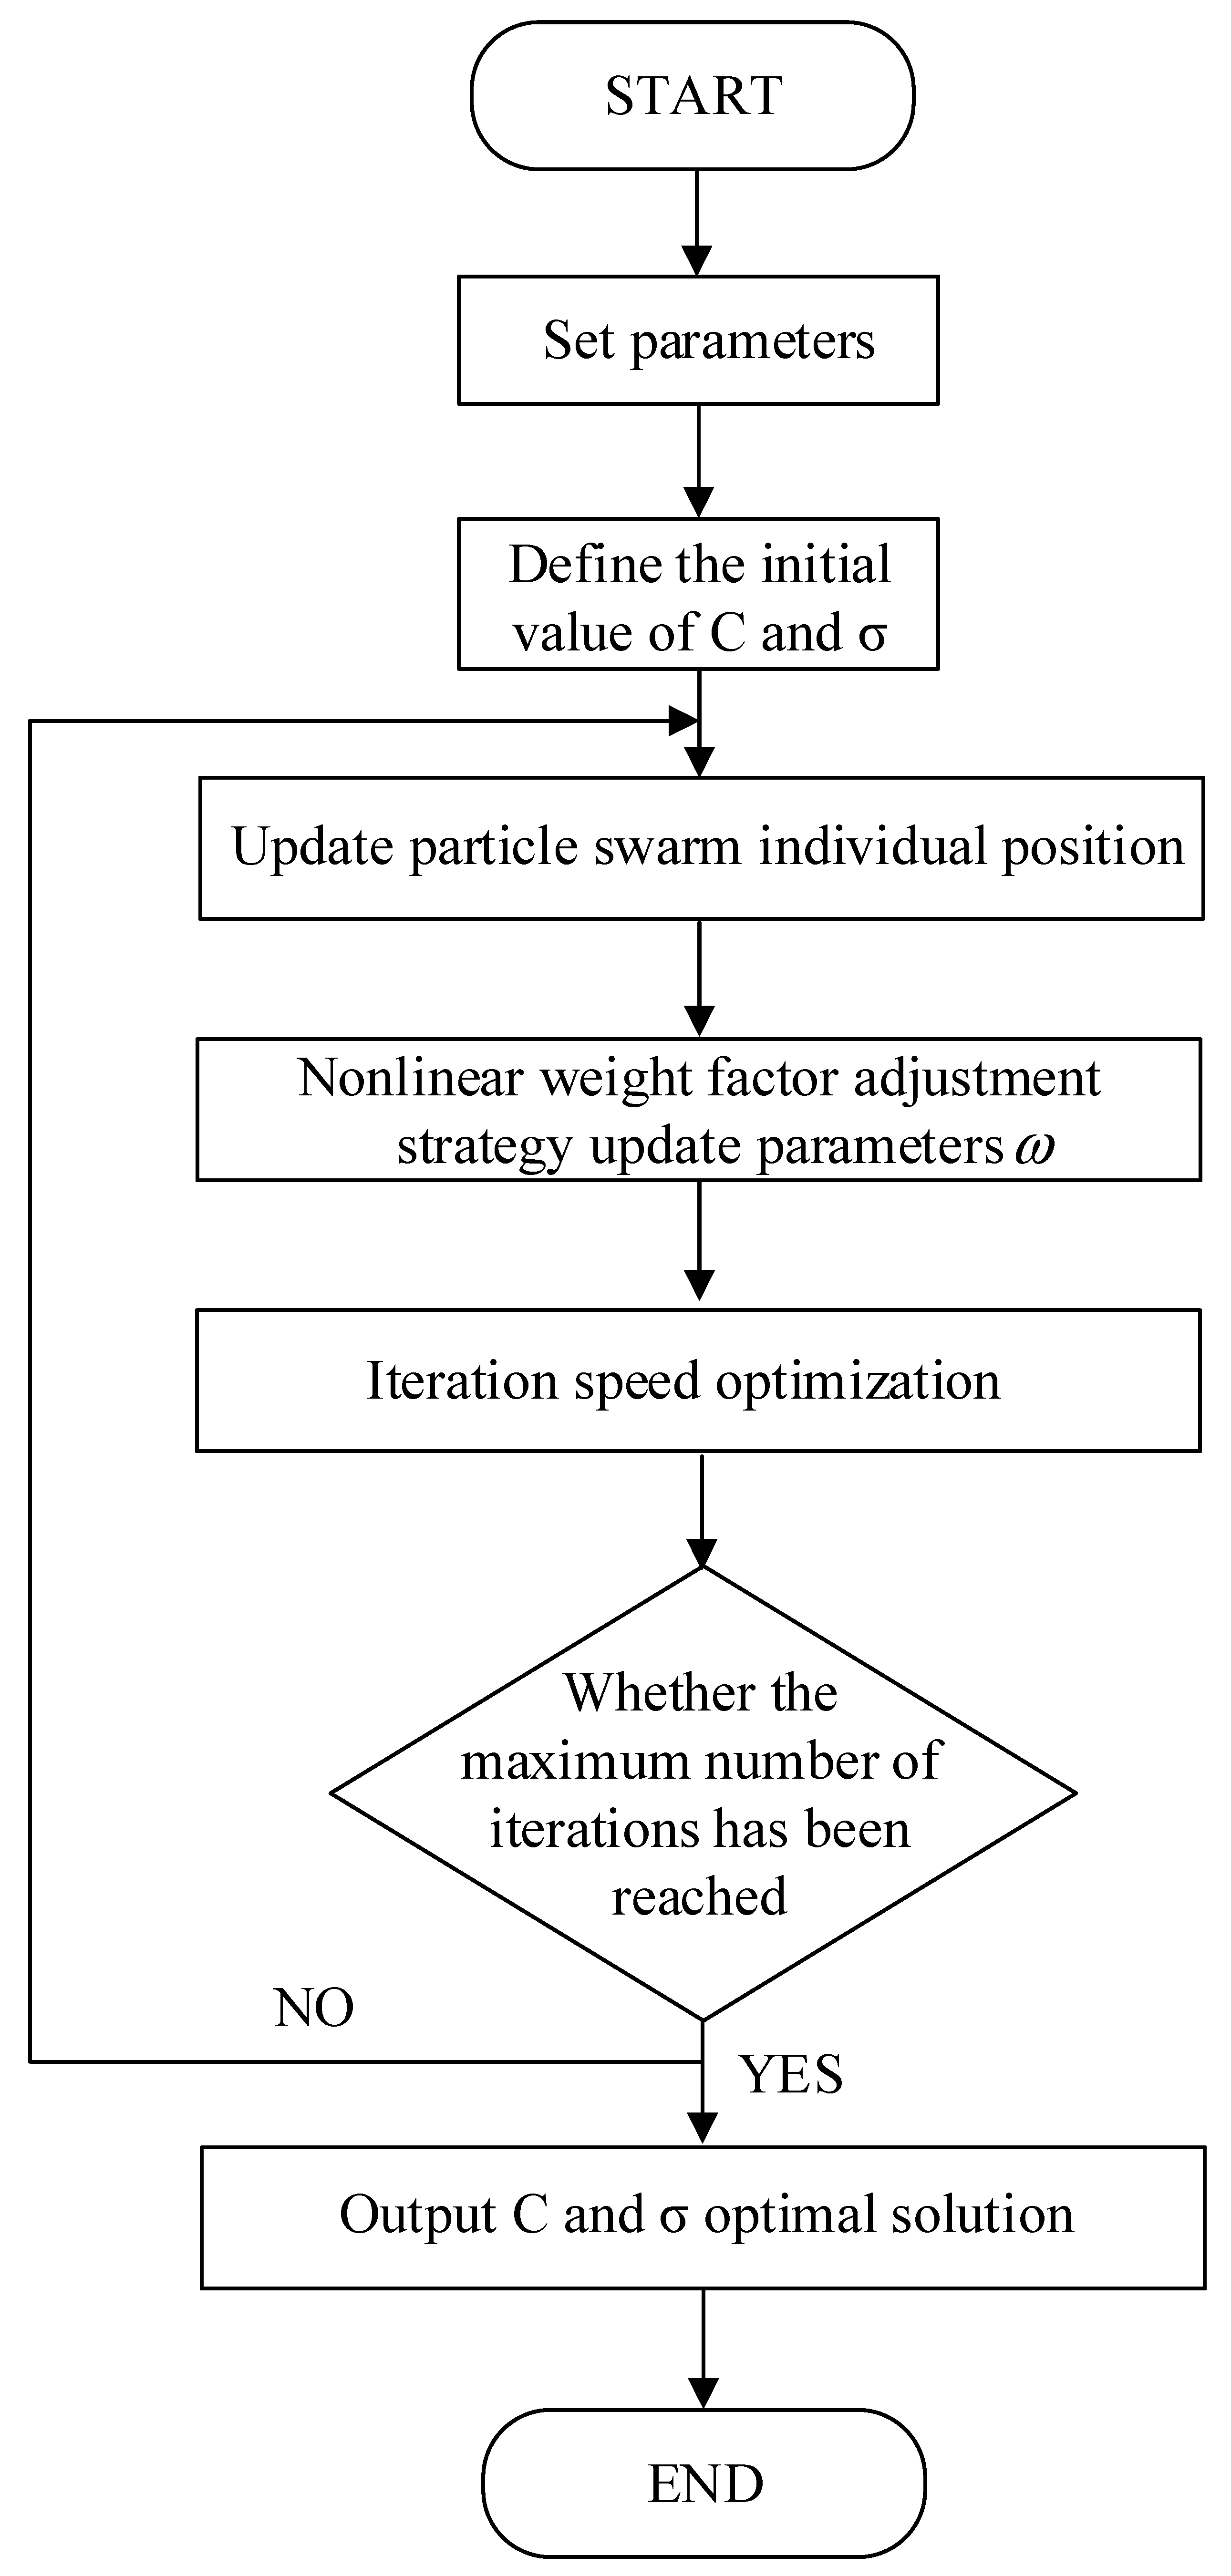
Figure 2.
IPSO iteration curve.


Table 1.
Characteristic data of SF6 decomposition gas.
| Fault State | Sample Eigenvalues | ||
|---|---|---|---|
| SO2/(μL·L−1) | SO2F2/(μL·L−1) | SO2F2/SO2 | |
| Arc discharge | 19.47 | 4.14 | 0.213 |
| Arc discharge | 16.41 | 3.70 | 0.225 |
| Arc discharge | 12.73 | 3.29 | 0.258 |
| Spark discharge | 18.74 | 55.95 | 0.986 |
| Spark discharge | 21.11 | 44.87 | 2.126 |
| Spark discharge | 17.55 | 45.35 | 2.584 |
| Corona discharge | 26.77 | 151.91 | 5.675 |
| Corona discharge | 20.99 | 84.50 | 4.026 |
| Corona discharge | 23.12 | 121.07 | 5.237 |
Table 2.
Related parameters of PSO.
| Parameter | Numerical Value |
|---|---|
| 0.8 | |
| 0.5 | |
| 25 | |
| C1, C2 | 1.5 |
| number of particles | 100 |
Table 3.
Comparison of optimization algorithms.
| Optimization Algorithm | IGA | PSO | IPSO |
|---|---|---|---|
| Number of iterations at convergence | 154 | 126 | 52 |
| Minimum fitness value | 0.0918 | 0.0642 | 0.0223 |
| Convergence time/ms | 7.49 | 8.66 | 4.24 |
Table 4.
Analysis data of GIA gas prediction results.
| Method of Prediction | SO2 | HF | SO2F2 | SOF2 |
|---|---|---|---|---|
| Actual value | 11.84 | 0.67 | 0.15 | 0.8 |
| IGA-LSSVM predictive value | 11.21 | 0.69 | 0.175 | 0.72 |
| Absolute error | −0.63 | 0.02 | 0.025 | 0.08 |
| PSO-LSSVM predictive value | 11.19 | 0.64 | 0.159 | 0.75 |
| Absolute error | 0.65 | −0.03 | 0.009 | −0.05 |
| IPSO-LSSVM predictive value | 11.79 | 0.68 | 0.143 | 0.82 |
| Absolute error | −0.05 | 0.01 | 0.007 | 0.02 |
Table 5.
Comparison of prediction results of different algorithms.
| Fault Type | Number of Samples | Accuracy | ||
|---|---|---|---|---|
| IGA-LSSVM | PSO-LSSVM | IPSO-LSSVM | ||
| 1 | 15 | 86.4 | 77.6 | 85.7 |
| 2 | 10 | 81.7 | 89.5 | 90.1 |
| 3 | 8 | 77.4 | 87.4 | 99.8 |
| 4 | 20 | 83.2 | 85.2 | 95.6 |
Disclaimer/Publisher’s Note: The statements, opinions and data contained in all publications are solely those of the individual author(s) and contributor(s) and not of MDPI and/or the editor(s). MDPI and/or the editor(s) disclaim responsibility for any injury to people or property resulting from any ideas, methods, instructions or products referred to in the content. |
© 2022 by the authors. Licensee MDPI, Basel, Switzerland. This article is an open access article distributed under the terms and conditions of the Creative Commons Attribution (CC BY) license (https://creativecommons.org/licenses/by/4.0/).
Share and Cite
MDPI and ACS Style
Zhao, H.; Zhang, G.; Yang, X. GIS Fault Prediction Approach Based on IPSO-LSSVM Algorithm. Sustainability 2023, 15, 235. https://doi.org/10.3390/su15010235
AMA Style
Zhao H, Zhang G, Yang X. GIS Fault Prediction Approach Based on IPSO-LSSVM Algorithm. Sustainability. 2023; 15(1):235. https://doi.org/10.3390/su15010235
Chicago/Turabian StyleZhao, Hengyang, Guobao Zhang, and Xi Yang. 2023. "GIS Fault Prediction Approach Based on IPSO-LSSVM Algorithm" Sustainability 15, no. 1: 235. https://doi.org/10.3390/su15010235
Note that from the first issue of 2016, this journal uses article numbers instead of page numbers. See further details here.