Abstract
In this paper, an improved back-to-back converter is proposed, and the converter is used as a test power source for vector inspection of relay protection in an active distribution network, which effectively solves the problem that the output voltage and current of the test power source cannot be continuously and stably adjusted. Firstly, a three-phase back-to-back cascade converter is established to analyze the impedance characteristics of its DC terminal. Then a feedforward voltage is added to the inverter to improve the input impedance characteristics of the inverter. Secondly, the system stability and parameter stability of the improved back-to-back converter are analyzed. Finally, the improved converter is used as the test power source for vector inspection of relay protection in the active distribution network. The simulation results show that the stability of the improved back-to-back converter system is greatly improved. The experiment shows that the vector check technology based on an improved back-to-back converter can effectively check the vector of relay protection in an active distribution network and find various installation problems.
1. Introduction
Vector inspection of relay protection is important to enact before the power grid is put into operation. Vector error will lead to false-action or non-action of relay protection in a normal operation state and fault state. Therefore, relevant power grid regulations stipulate that the correctness of the relay protection vector must be strictly checked comprehensively before newly installed equipment or devices with great changes in the circuit are put into operation [1]. At the same time, the relay protection vector inspection technology, applied before commissioning, reduces the safety risk caused by a system switching operation during the commissioning process and reduces the operation workload [2].
In recent years, vector inspection technology that has first been applied in newly built high-voltage substations and transmission networks is put into operation before relay protection [3,4], but there are some difficulties in its application to distribution networks. Compared with the high-voltage substation and transmission network, the line distance of the distribution network is shorter and the transformer capacity is smaller. As a result, the output voltage and output current of the test power source cannot be adjusted continuously and stably, which cannot satisfy the requirements of relay protection vector inspection of the distribution network [5,6].
Back-to-back converters have the advantages of four-quadrant operation, low current harmonic content, and controllable DC voltage, which attracts more and more scholars’ attention and research. In this paper, the control strategy and stability of back-to-back converters are analyzed and studied. Ref. [7] adopts a no-difference beat current control and active power feedback compensation mechanism to improve the harmonic current of the back-to-back converter system and grid-connection reliability. Ref. [8] proposed a coordinated control strategy of two-end converters, which can enhance the stable and reliable operation of the back-to-back MMC-HVDC transmission system. Ref. [9] uses the harmonic state space method to study the stability of back-to-back converters in wind turbines. Impedance matching theory points out that the stability of a cascade system not only depends on the stability of a single converter itself, but also the impedance matching between converters will affect the stability of the system to a large extent [10]. The impedance matching analysis method can be applied to improve and evaluate the stability of AC grid-connected inverters [11,12,13]. In refs. [14,15], the output impedance of the grid-connected inverter is constructed by virtual impedance correction to improve grid-connected stability. Refs. [16,17] proposed an active full bridge converter (DAB)—inverter cascade topology. The control link is designed according to the DC impedance of the cascade system to improve the impedance characteristics of the system and enhance its stability of the system. Ref. [18] studies the dynamic interaction between photovoltaic grid-connected inverters and power grids based on impedance analysis. None of the above references have been able to analyze the stability of the back-to-back converter from an impedance perspective and propose an improvement plan.
To solve these problems, an improved AC/DC-DC/AC cascade converter is proposed, and the converter is used as the test power source for relay protection vector inspection of the active distribution network in this paper. The main innovations of this paper are as follows:
- (1)
- Adding a feedforward voltage to the inverter end of the converter can effectively improve the input impedance characteristics of the inverter, and thus the system stability of the converter;
- (2)
- The vector inspection technology based on the improved back-to-back converter is applied to the vector inspection of the active distribution network for the first time, which can accurately find various installation problems of relay protection.
This paper is organized as follows: in Section 2, the three-phase back-to-back cascaded converter is established to analyze the impedance characteristics of its DC terminal; in Section 3, the system stability and parameter stability of the improved back-to-back converter are analyzed; in Section 4, the principle and flow of distribution network vector inspection are introduced; in Section 5, the improved converter is used as the test power source for vector inspection of relay protection, and vector inspection of relay protection of the active distribution network is carried out; in Section 6, conclusions are drawn.
2. Impedance Characteristics of the Converter
This section analyzes the system impedance of the three-phase back-to-back converter, the output impedance of the rectifier at the DC terminal, and the input impedance of the inverter. When analyzing the input impedance of the inverter, feedforward voltage is added to the inverter end, which can effectively improve the input impedance characteristics of the inverter.
2.1. Converter System Impedance
Firstly, we set up the back-to-back cascading converter topology as shown in Figure 1. The converter on both terminals is composed of three pairs of switch tubes in a three-phase bridge circuit. is the grid voltage at the rectifier end, and are the filter inductance and parasitic resistance of the rectifier converter, respectively, is DC filter capacitor, and are DC voltage and current, respectively, and are the filter inductance and parasitic resistance of the inverter converter, respectively, and is the grid-connected voltage of the inverter.
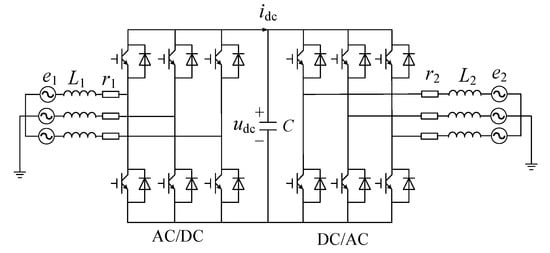
Figure 1.
Topology of back-to-back converters.
The block diagram of the impedance principle of a back-to-back converter cascade system is shown in Figure 2. are transfer functions of rectifier A and inverter B, respectively [19].

Figure 2.
Schematic block diagram of cascade system impedance.
The transfer function G of the converter cascade system is:
As can be seen from the transfer function of the cascade system, the system stability is not only dependent on the stability of a single system but also related to the impedance matching between subsystems. According to the principle of automatic control, if the open loop transfer function of a system is stable, the system is stable. Therefore, can be regarded as the open loop transfer function of the cascade system, which is called the minimum loop ratio. Thus, on the premise that all subsystems are stable, the stability of the whole cascade system can be judged by the stability of the . is related to the control mode of the subsystem. If A is the voltage source converter and B is the current source converter, then is the output impedance of rectifier A compared with the input impedance of inverter B [20], as shown in Equation (2):
where represents the output impedance of source converter A, and represents the input impedance of load converter B.
If A and B have opposite characteristics—that is, A is the power converter and B is the voltage source converter—then is the input impedance ratio of inverter B to the output impedance of rectifier A [21], as shown in Equation (3):
Input impedance and output impedance can be obtained by constructing a small signal model of the system at the static operating point, and the calculation method is shown in Equations (4) and (5):
where and are the input voltage and current small signal disturbance, respectively. Similarly, and are the input voltage and current small signal disturbance, respectively.
2.2. Rectifier Impedance
The control block diagram of the voltage and current double closed-loop control rectifier is established in the dq coordinate system, as shown in Figure 3. In the figure, and , respectively, represent axis d- and q-axis components of grid-connected current at the rectifier terminal. and , respectively, represent the d and q axis components of the rectifier switch duty cycle. and , respectively, represent the components of axis d and axis q of rectifier grid-connected voltage. The symbol “*” represents the given value of the corresponding variable, and the symbol “^” below represents the small signal disturbance of the corresponding variable [22].
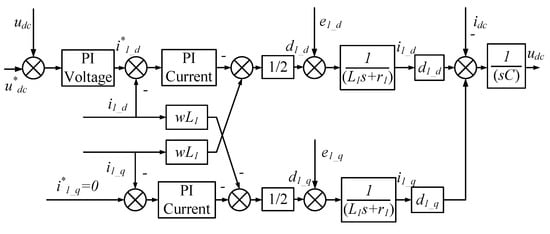
Figure 3.
Control block diagram of the rectifier in dq coordinate system.
The small signal model of the rectifier is established by the small signal analysis method, as shown in Equation (6):
where and are, respectively, the d- and q-axis components of the DC duty ratio of the rectifier system, and U is the steady-state DC voltage.
According to the power balance principle, when the loss in the power transmission process is ignored, the power at the input and output sides of the rectifier should be equal.
Assuming that the three-phase input voltage is symmetrical and balanced without disturbance, while , small signal analysis is performed on Equation (7), and the results are shown in Equation (8):
where is the voltage of the d-axis of the rectifier system grid in steady state and is the steady-state current.
Let the current transfer function from voltage to axis D be , then the small signal equation of power balance is shown in Equation (9), and Equation (10) is the output impedance of the DC terminal of the rectifier:
Since the rectifier in this paper adopts voltage and current double closed-loop control, the axis components of duty cycle disturbance d and q are, respectively:
where is the transfer function of the current loop PI regulator in rectifier control and is the transfer function of the voltage loop PI regulator.
Substitute Equation (11) into Equation (10), then the rectifier model is as follows.
where . Then, the transfer function of DC voltage to d-axis current is shown in Equation (13):
By substituting Equation (13) into Equation (10), the expression of output impedance at the DC terminal of the rectifier can be obtained.
2.3. Inverter Impedance
We establish the control block diagram of the inverter in the converter in the dq coordinate system, as shown in Figure 4.
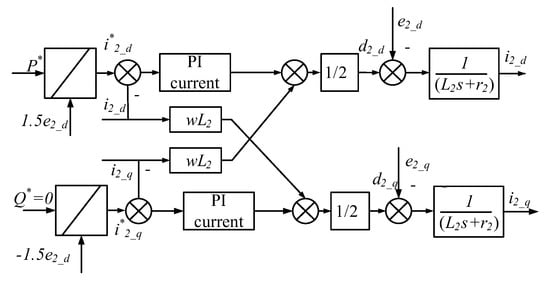
Figure 4.
Control block diagram of an inverter in dq coordinate system.
In this figure, P and Q represent active and reactive power respectively, and , respectively, represent axis d and axis q components of the grid-connected voltage of the inverter system, and , respectively, represent d- and q-axis components of inductance current, and and , respectively, represent the d- and q-axis components of the inverter switch duty cycle [23].
Similar to the derivation of the rectifier model, the small signal model of the inverter is shown in Equation (14):
where are the DC duty cycle d- and q-axis components of the inverter system. Similar to rectifier analysis, the loss in the process of power transmission is ignored, and the impedance of the DC terminal is obtained according to the power balance equation, as shown in Equation (15):
where is the grid d-axis voltage of the inverter system at a steady state.
The inverter adopts constant power control, so the duty cycle disturbance is shown in Equation (16):
where is the transfer function of the PI regulator of the current loop in the control loop of the inverter system. Substitute Equation (16) into Equation (14), then the small signal model of the inverter is shown in Equation (17):
where . Then, the current transfer function of the inverter DC terminal voltage to axis D is shown in Equation (18):
After substituting Equation (18) into Equation (15), the input impedance expression of the DC inverter can be obtained.
2.4. Improved Inverter Impedance
The DC terminal voltage error is used as a given compensation for the inverter d-axis power loop, and the improved inverter transfer function block diagram is shown in Figure 5. The transfer function of inverter DC terminal voltage to d-axis current can be directly derived from Figure 5, as shown in Equation (19):
where k is the voltage feedforward coefficient and is the transfer function of the current loop PI regulator. Substitute Equation (19) into Equation (18) to obtain the improved input impedance of the DC inverter :
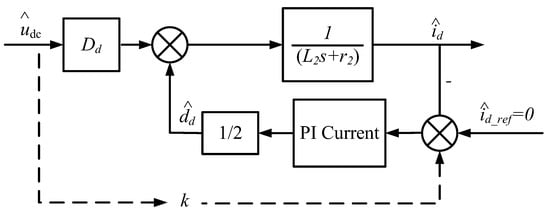
Figure 5.
Improved inverter transfer function block diagram.
3. Stability Analysis
The stability of the improved back-to-back converter directly determines the feasibility of its application in relay protection vector inspection of the distribution network. Therefore, this section analyzes the stability of the improved back-to-back converter from two aspects of subsystem and parameter influence.
3.1. Subsystem Stability Analysis
From the above analysis, the mathematical models of the output impedance of the rectifier and the input impedance of the inverter before and after optimization have been obtained. Because the rectifier acts as a voltage source converter, the minimum loop ratio of the cascade system is the ratio of the rectifier’s output impedance to the inverter’s input impedance. Under the condition of a given power of 5 kW, the output impedance of the rectifier at the DC terminal, the input impedance of the inverter, and the porter diagram of the optimized input impedance of the inverter are shown in Figure 6.
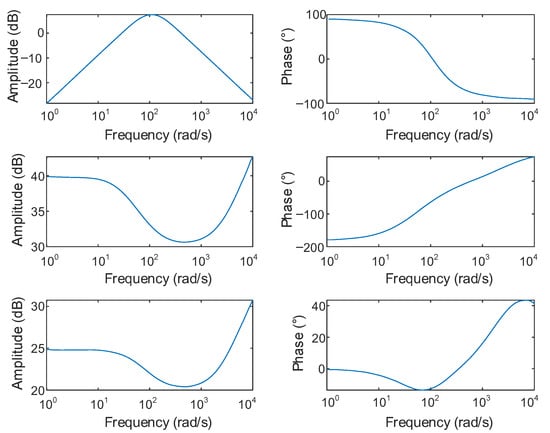
Figure 6.
Bode diagram of input/output impedance of converter.
Figure 6 shows that the output impedance amplitude of the DC rectifier is smaller, and the phase ranges from 90° in the low-frequency band to −90° in the high-frequency band. Compared with the output impedance, the input impedance amplitude of the DC inverter is larger. Its low-frequency phase is −180° showing negative impedance, which is also an important reason for the instability of the cascade system. After the voltage feedforward is introduced into the inverter, the impedance amplitude is reduced and the low-frequency phase is 0°, which shows resistance. Theoretically, it is beneficial to system stability.
3.2. Influence of Parameters on System Stability
First, three parameters K1, K2, and K3 are introduced, which represent the common gain coefficients of the rectifier current loop PI controller, the voltage loop PI controller, and the inverter power loop PI controller, respectively. Equation (21) is the transfer function of the PI controller after introducing the common gain coefficient of the PI parameter:
where are the ratio and integral coefficient.
When the common gain coefficient K1 of the rectifier current loop parameter changes, the bode diagram of the output impedance of the DC terminal is shown in Figure 7a. It can be seen from the figure that when the coefficient K1 changes from 0.1 to 1.5, the amplitude and phase of the output impedance do not change. That is to say, the current loop parameters of the rectifier under the voltage and current double closed-loop control have little effect on the output impedance characteristics, and they are not the dominant factor affecting the instability of the system.
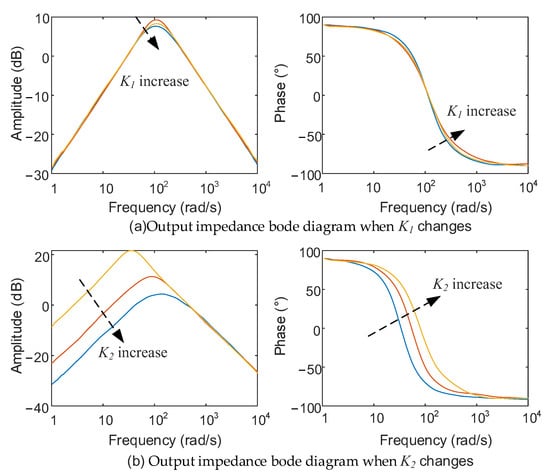
Figure 7.
Output impedance bode diagram when coefficients K1 and K2 change. (a) Output impedance bode with K1 changes. (b) Output impedance bode with K2 changes.
When the common gain coefficient K2 of the voltage loop PI parameter of the rectifier changes, the bode diagram of the output impedance of the DC terminal is shown in Figure 7b. In general, the increase in the voltage loop PI parameter will lead to the increase in high-frequency resonant amplitude in the system, which is not conducive to system stability. In this paper, the influence of impedance on system stability is studied under the premise of system stability. It can be seen from Figure 7 that when the coefficient K2 increases from 0.1 to 1.5, the impedance amplitude of low-frequency rectifier decreases, and the capacitive impedance characteristic of high-frequency rectifier weakens. The increase in coefficient leads to the reduction of impedance amplitude, which is beneficial to the cascade system impedance matching. Therefore, the stability of back-to-back converters will be positively affected.
When the feedforward voltage is introduced into the power loop of the inverter, only the input impedance of the inverter is affected, and it has nothing to do with the rectifier side. Therefore, the change in the input impedance of the optimized inverter is analyzed. Figure 8 shows the input impedance bode diagram before and after optimization when the coefficient K3 changes.
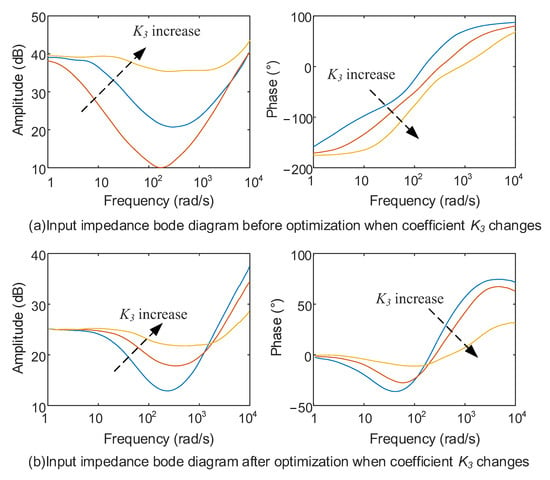
Figure 8.
Input impedance bode diagram before and after optimization when coefficient K3 changes. (a) Input impedance bode diagram before optimization with K3 changes. (b) Input impedance bode diagram after optimization with K3 changes.
When the common gain coefficient K3 of the inverter power loop PI parameter changes, the bode diagram of the input impedance of the DC terminal is shown in Figure 8a. When the coefficient K3 changes from 0.1 to 1.5, the high-frequency input impedance amplitude increases, and the negative impedance characteristic of low-frequency inverter increases. Figure 8b is the bode diagram of the optimized input impedance at the DC terminal when the coefficient K3 changes. By comparing Figure 8a,b, it is obvious that the amplitude of the input impedance after optimization decreases. In addition, the low frequency band changes from the negative impedance characteristic which endangers the stability of the system to the pure resistive characteristic which is beneficial to the stability of the system. It can be seen that the input impedance of inverter with feedforward voltage is beneficial to the stability of cascade system.
Figure 9 shows the bode diagram of the input impedance of the DC inverter before optimization when the power changes. When the power changes from 1 kW to 6 kW, the amplitude of the input impedance of the low-frequency inverter decreases, and the negative impedance characteristic increases. The decrease in the input impedance amplitude can easily cause instability in the cascade system, so the stability of the system can be improved by increasing the amplitude of the input impedance.
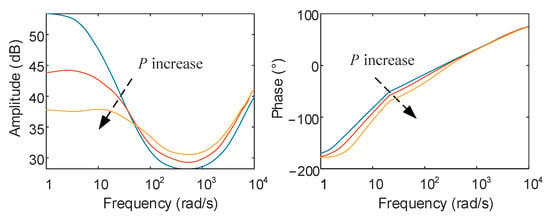
Figure 9.
Input impedance bode diagram before optimization when power changes.
4. Principle of Vector Inspection
Vector inspection of relay protection includes secondary voltage value, secondary current value, the angle between secondary voltage, the angle between secondary current, and the correspondence between angle value and amplitude, etc. Vector inspection mainly checks the current transformer ratio range, polarity selection, voltage, and current secondary circuit wiring correctness. The test device for relay protection vector inspection of the distribution network is shown in Figure 10, which includes the current converter, test device, simulated load, and protection device.
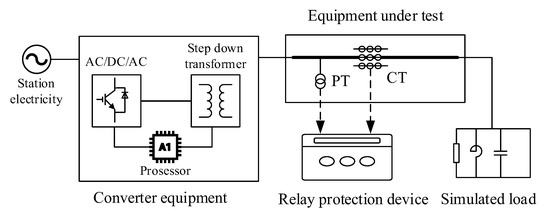
Figure 10.
Vector inspection test device structure.
The input end of the current transformer is connected to 380 V mains power, and the output end is connected to the reception test equipment. The output end of the equipment to be tested is connected to the analog load, and the protection device is connected to the equipment to be tested through the voltage transformer and current transformer.
The current converter includes AC/DC-DC/AC cascade converter module, step-down transformer module, and processor module. The converter module can output continuous, stable, and adjustable current and voltage. Step-down transformers are used for voltage regulation. The processor controls and adjusts the converter module according to the output voltage and current of the converter. The whole converter equipment is required to be able to output the required load current stably and quickly respond to the required pulse current. Its nominal design is 50 kVA, 100 A/150 V phase voltage.
The analog load includes parallel test inductance, inductive analog load, capacitive analog load, and analog grounding line, which can form a variety of loops with the equipment to be tested. The test inductance adopts a fixed value of 0.5 Ω. The inductive analog load is for star connection access, which has an adjustable range of 0–1.0 Ω. The capacitive analog load is for angular connection access, which has an adjustable range of 50 μF 200 μF. The dynamic stability of the analog ground cable must be at least 150 A/min.
The impedance of the test system load is the sum of the impedance of the device under test and the impedance of the simulated load. During the test, we adjust the simulated load to compensate for the test equipment and adjust the system load to the inductive or capacitive load of 1 Ω.
The relay protection vector inspection process of the whole distribution network is as follows:
- According to the type of relay protection, select different locations to connect to the converter equipment and simulated loads;
- Adjust the output voltage and current of the converter equipment and calculate the impedance of the test system load;
- Subtract the simulated load impedance from the system load impedance to obtain an estimated impedance value of the device under test;
- According to the estimated impedance value of the device under test and the test type, adjust the converter device and the simulated load to compensate the system load impedance to the preset value;
- Connect the protection device to the test system and start the test. Check the correctness of the vector according to the secondary voltage and secondary current collected by the protection device.
5. Simulation and Experimental Verification
In this section, the stability of the improved converter is verified by simulation. Then, the improved converter is used as the test power source to verify the relay protection vector inspection technology in the distribution network.
5.1. Converter Stability Verification
For the above theoretical analysis, this paper built a three-phase back-to-back converter cascade system on the MATLAB/SIMULINK simulation platform. Table 1 shows the main circuit parameters in the simulation, and Table 2 shows the PI parameters of each control link. In accordance with the theoretical analysis, the rectifier adopts the DC voltage and filter inductor current double closed-loop control strategy, while the inverter adopts the constant power control mode. Figure 11, Figure 12 and Figure 13, respectively, show the changes in DC terminal voltage, rectifier, and inverter power of the cascade system before and after optimization when the coefficients K1-K3 change. Figure 14 shows the changes in DC terminal voltage, rectifier, and inverter power when output power changes.

Table 1.
Main circuit parameters of the back-to-back converter cascade system.

Table 2.
Controller parameters.
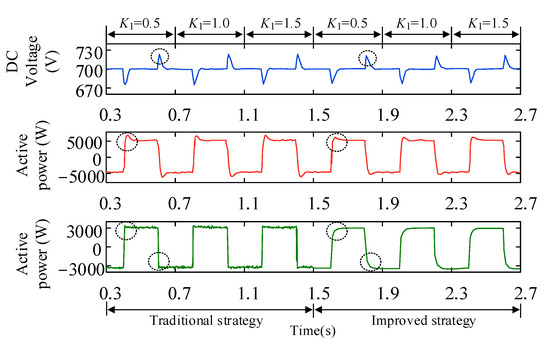
Figure 11.
Waveform of DC terminal voltage, rectifier and inverter power output when coefficient K1 changes.
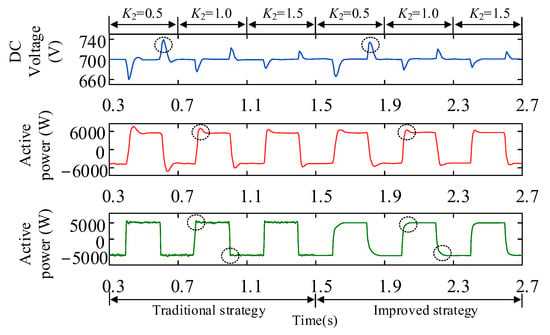
Figure 12.
Waveform of DC terminal voltage, rectifier, and inverter power output when coefficient K2 changes.
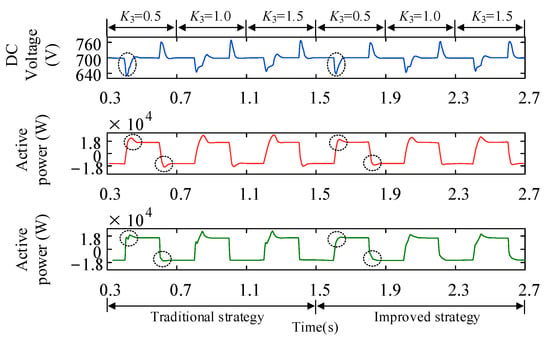
Figure 13.
Waveform of DC terminal voltage, rectifier and inverter power output when coefficient K3 changes.
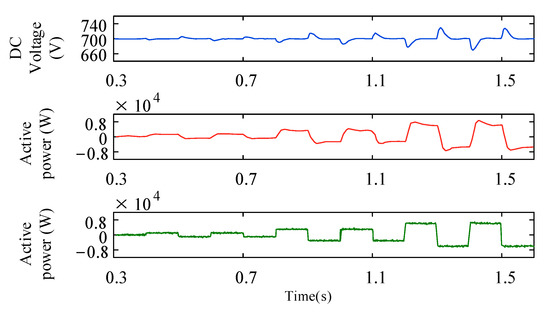
Figure 14.
Waveform of DC terminal voltage, rectifier, and inverter power output when power changes.
Figure 11 shows the waveforms of the DC terminal voltage, rectifier, and inverter power output optimized when coefficient K1 is 0.5, 1.0, and 1.5, respectively. In each case, when the coefficient K1 changes, the system voltage and power are not greatly disturbed. Comparing the two cases, it is obvious that the peak value of the output voltage of the optimized system is smaller. The power transition process is relatively gentle, which has a favorable effect on the system.
Figure 12 shows the waveforms of DC terminal voltage, rectifier, and inverter power output when coefficient K2 is 0.5, 1.0, and 1.5, respectively. As K2 increases, the peak value of DC terminal voltage gradually weakens, and the short-term impact on the system gradually decreases. At the same time, the inverter power output waveform gradually flattens with the increase in the coefficient. According to the above analysis, the increase in the K2 coefficient reduces the output impedance of the rectifier, which is conducive to system stability. The input impedance amplitude of the DC inverter decreases after the feedforward voltage is introduced. Regulating voltage is no longer only the responsibility of the rectifier. At this time, the inverter is also sharing part of the work of regulating voltage, and the system’s adjustability has also been improved.
Figure 13 shows the waveforms of DC terminal voltage, rectifier, and inverter power output when coefficient K3 is 0.1, 0.5, and 0.9, respectively. With the increase in the coefficient, DC terminal voltage distortion and voltage peak value gradually increase. At the same time, the harmonic wave of the rectifier and inverter output power becomes larger under forward power. The increase in inverter power loop parameters enhances the negative impedance characteristics of the inverter, which is not conducive to the stability of the cascade system. Compared with the waveform before and after optimization, the introduction of feedforward voltage effectively reduces the voltage harmonics of the DC terminal, and the output power distortion rate of the rectifier and inverter decreases.
Figure 14 shows the DC terminal voltage, rectifier, and inverter power output of the improved converter when output power P is 1 kW, 3 kW, and 7 kW, respectively. As the power increases, the voltage spike generated by the DC terminal voltage at the power mutation increases. The power variation of the rectifier and inverter gradually becomes uneven, and the stability of the converter system becomes worse.
5.2. Distribution Network Vector Inspection Application
First, the analog load is adjusted so that the end of the device to be tested is connected to the three-phase test inductance, the impedance of which is XS. Adjust the output voltage and current of the converter. The test device automatically reads current, voltage, and active power values, then the impedance of the test system load is calculated as XL. The system load impedance minus the analog load impedance, the estimated value of the impedance to be tested equipment Xd = XL − Xs. Under different test devices, the estimated impedance values of the devices to be tested are shown in Table 3.

Table 3.
Main circuit parameters of the back-to-back converter cascade system.
Secondly, according to the estimated impedance value of the equipment to be tested, the simulation load is adjusted to compensate for the system load impedance to 1 Ω. When adjusting the current converter device for vector inspection, the current output by the converter device should meet certain requirements. Its size is related to the primary current of the device to be tested, as shown in Table 4.

Table 4.
Output current requirements of converter equipment.
5.2.1. Bus and Feeder Vector Inspection
The wiring diagram of the vector inspection of the 10 kV bus and feeder is shown in Figure 15. The power source of the test system comes from the station power, and the currency converter is connected to the equipment under test from the incoming line of the bus I. The simulated load is connected to the device under test from feeder F12. The protection device is connected to the device to be tested through the voltage transformer and current transformer. We adjust the system load to inductive 1 Ω, and then adjust the output current and output voltage of the converter equipment. The relay protections that can be tested are bus low voltage overcurrent protection, feeder F12 overcurrent protection, and quick break protection. The inspection results are shown in Table 5.
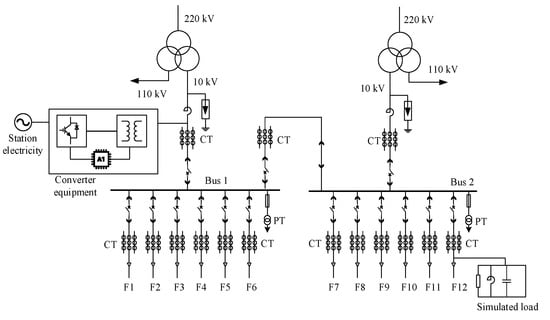
Figure 15.
Relay protection vector inspection wiring diagram of feeder and bus.

Table 5.
Busbar protection test data.
It can be seen from Table 5 and Table 6 that the secondary voltage and secondary current of bus protection and feeder F12 protection are both greater than 0.02 A and 0.2 V, and the secondary current lags almost 90° behind the secondary voltage. Therefore, it can be judged that the vectors of bus protection and feeder F12 protection are correct. Similarly, by changing the position of the converter device and the simulated load, vector inspections can be carried out on other protections of the bus and feeder.

Table 6.
Feeder protection test data.
5.2.2. Distribution Vector Inspection
The wiring diagram for vector inspection of the distribution transformer is shown in Figure 16. The power source of the test system is from the station electricity, and the currency converter is connected to the equipment to be tested from the 1# incoming line of the distribution transformer box, and the analog load is connected to the equipment to be tested from the 1# outgoing line of the distribution transformer. Vector inspection can be carried out for overcurrent protection and quick break protection of the 1# distribution transformer. The current converter is connected to the equipment to be tested from the 2# incoming line of the distribution transformer box, and the analog load is connected to the equipment to be tested from the 2# outgoing line of the distribution transformer. Vector inspection can be carried out for overcurrent protection and quick break protection of the 2# distribution transformer. The inspection results are shown in Table 7.
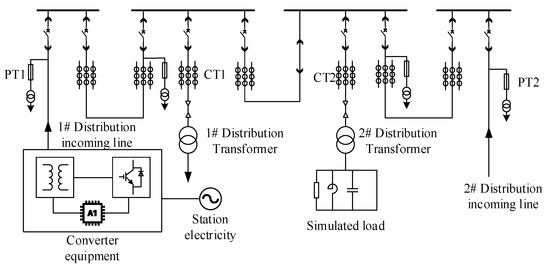
Figure 16.
Vector inspection wiring diagram of relay protection of distribution transformer.

Table 7.
Test data of transformer protection.
As can be seen from Table 7, the secondary voltage and secondary current of distribution transformer overcurrent protection and quick break protection are both greater than 0.02 and 0.2 V. Moreover, the secondary current lags behind the secondary voltage by almost 90°, so the vector of distribution protection is judged to be correct. Similarly, vector inspection can be carried out on other measurement and control devices of the distribution transformer box by changing the position of the current converter and the simulated load. It is not discussed here.
5.2.3. Installation Problems Were Found in Application
The test device constructed in this paper was used to carry out vector inspection on relay protection of a 10 kV distribution network in a certain area, and several installation problems were found, as shown in Table 8. This shows that the vector inspection technology based on improved back-to-back converters can accurately carry out vector inspection of relay protection in the active distribution network and find various installation problems.

Table 8.
Installation problems were found in the application.
6. Conclusions
This paper presents an improved back-to-back converter which is used as a test power source for relay protection vector inspection. The simulation results show that adding feedforward voltage to the inverter can effectively improve the input impedance characteristics of the inverter, thus improving the system stability of the converter. At the same time, the vector inspection technology based on the improved back-to-back converter can meet the requirements of the distribution network and find various installation problems of the relay protection. Due to the limited laboratory conditions, this paper only uses simulation to verify the stability of the improved converter. In future work, experiments will be used to further verify the stability of the improved converter.
Author Contributions
Conceptualization, W.Z., J.R., X.W., T.L., Y.W. and H.F.; software, H.F., T.L.; validation, W.Z. and Y.W.; formal analysis, W.Z., J.R., X.W. and Y.W.; investigation, H.F.; data curation, X.W., T.L. and Y.W.; writing—original draft preparation, H.F., X.W., T.L. and Y.W.; writing—review and editing, H.F., J.R., T.L. and Y.W.; visualization, J.R.; supervision, Y.W.; All authors have read and agreed to the published version of the manuscript.
Funding
This research was funded by Science and Technology Project of State Grid Hebei Electric Power Co., Ltd. (kj2022-001).
Institutional Review Board Statement
Not applicable.
Informed Consent Statement
Not applicable.
Data Availability Statement
Not applicable.
Conflicts of Interest
The authors declare no conflict of interest.
References
- Li, T. Research on vector inspection technology of relay protection before operation. Hebei Electr. Power Technol. 2013, 32, 2. [Google Scholar]
- Zhang, B.; Hao, X.; Cao, S.; Li, T.; Zhao, C. Research on vector inspection technology of relay protection before operation using capacitor compensation. Hebei Electr. Power Technol. 2013, 32, 1–3. [Google Scholar]
- Wang, Q.; Jin, T.; Mohamed, M.A. A Fast and Robust Fault Section Location Method for Power Distribution Systems Considering Multisource Information. IEEE Syst. J. 2021, 16, 1954–1964. [Google Scholar] [CrossRef]
- Rao, C.; Hajjiah, A.; El-Meligy, M.A.; Sharaf, M.; Soliman, A.T.; Mohamed, M.A. A novel high-gain soft-switching DC-DC converter with improved P&O MPPT for photovoltaic applications. IEEE Access 2021, 9, 58790–58806. [Google Scholar]
- Ma, H.; Liu, Z.; Li, M.; Wang, B.; Si, Y.; Yang, Y.; Mohamed, M.A. A two-stage optimal scheduling method for active distribution networks considering uncertainty risk. Energy Rep. 2021, 7, 4633–4641. [Google Scholar] [CrossRef]
- Wang, Q.; Jin, T.; Mohamed, M.A. An innovative minimum hitting set algorithm for model-based fault diagnosis in power distribution network. IEEE Access 2019, 7, 30683–30692. [Google Scholar] [CrossRef]
- Zhou, S. Research on Harmonic Elimination and Reliability of Three-Level back to back Converter; Anhui university: Hefei, China, 2017. [Google Scholar]
- Yang, Y.; Yang, J.; He, Z.; Li, Q.; Xu, W. Control strategy of MMC based back-to-back HVDC transmission system. Autom. Electr. Power Syst. 2017, 41, 120–124. [Google Scholar]
- Kwon, J.; Wang, X.; Bak, C.L.; Blaabjerg, F. Analysis of harmonic coupling and stability in back-to-back converter systems for wind turbines using Harmonic State Space (HSS). In Proceedings of the Energy Conversion Congress and Exposition, Montreal, QC, Canada, 20–24 September 2015; IEEE: Manhattan, NY, USA, 2015; pp. 730–737. [Google Scholar]
- Gao, J.; Zhao, J.; Qu, K.; Li, F. Reconstruction of impedance-based stability criteria in weak grid. Power Syst. Technol. 2017, 41, 2762–2768. [Google Scholar]
- Cespedes, M.; Sun, J. Impedance modeling and analysis of grid-connected voltage-source converters. IEEE Trans. Power Electron. 2013, 29, 1254–1261. [Google Scholar] [CrossRef]
- Xu, J.; Zhang, B.; Qian, Q.; Meng, X.; Xie, S. Robust control and design based on impedance-based stability criterion for improving stability and harmonics rejection of inverters in weak grid. In Proceedings of the Applied Power Electronics Conference and Exposition, Tampa, FL, USA, 26–30 March 2017; IEEE: Manhattan, NY, USA, 2017; pp. 3619–3624. [Google Scholar]
- Lissandron, S.; Dalla Santa, L.; Mattavelli, P.; Wen, B. Experimental validation for impedance-based small-signal stability analysis of single-phase interconnected power systems with grid-feeding inverters. IEEE J. Emerg. Sel. Top. Power Electron. 2016, 4, 103–115. [Google Scholar] [CrossRef]
- Yang, D.; Ruan, X.; Wu, H. Virtual impedance method to improve LCL grid-inverter’s adaptability in weak power grid. Proc. CSEE 2014, 34, 2327–2335. [Google Scholar]
- Wei, S.; Tian, Y.; Wang, Y. Virtual Inductance Control for Enhancing Stability of LCL Inverter in Weak Grid. High Volt. Eng. 2019, 45, 1827–1834. [Google Scholar]
- Tian, Y.; Loh, P.C.; Deng, F.; Chen, Z.; Sun, X.; Hu, Y. Impedance coordinative control for cascaded converter in bidirectional application. IEEE Trans. Ind. Appl. 2015, 52, 4084–4095. [Google Scholar] [CrossRef]
- Tian, Y.; Loh, P.C.; Deng, F.; Chen, Z.; Hu, Y. DC-Link voltage coordinated proportional control for cascaded converter with zero steady-state error and reduced system type. IEEE Trans. Power Electron. 2015, 31, 3177–3188. [Google Scholar] [CrossRef]
- Chen, X.; Zhang, Y.; Wang, Y. Research on the dynamic interaction of photovoltaic grid-connected inverter and power grid based on impedance analysis. Proc. CSEE 2014, 34, 459–4567. [Google Scholar]
- Raza, M.; Prieto-araujo, E.; Gomis-bellmunt, O. Small signal stability analysis of offshore AC network having multiple VSC-HVDC system. IEEE Trans. Power Deliv. 2018, 33, 830–839. [Google Scholar] [CrossRef]
- Zhang, X.; Ruan, X.; Zhong, Q.C. Improving the stability of cascaded DC/DC converter systems via shaping the input impedance of the load converter with a parallel or series virtual impedance. IEEE Trans. Ind. Electron. 2015, 62, 7499–7512. [Google Scholar] [CrossRef]
- Aapro, A.; Messo, T.; Roinila, T.; Suntio, T. Effect of active damping on output impedance of three-phase grid-connected converter. IEEE Trans. Ind. Electron. 2017, 64, 7532–7541. [Google Scholar] [CrossRef]
- Alenius, H.; Roinila, T. Impedance-based stability analysis of paralleled grid-connected rectifiers: Experimental case study in a data center. Energies 2020, 13, 2109. [Google Scholar] [CrossRef]
- Yadav, A.; Chandra, S.; Bajaj, M.; Sharma, N.K.; Ahmed, E.M.; Kamel, S. A Topological Advancement Review of Magnetically Coupled Impedance Source Network Configurations. Sustainability 2022, 14, 3123. [Google Scholar] [CrossRef]
Disclaimer/Publisher’s Note: The statements, opinions and data contained in all publications are solely those of the individual author(s) and contributor(s) and not of MDPI and/or the editor(s). MDPI and/or the editor(s) disclaim responsibility for any injury to people or property resulting from any ideas, methods, instructions or products referred to in the content. |
© 2022 by the authors. Licensee MDPI, Basel, Switzerland. This article is an open access article distributed under the terms and conditions of the Creative Commons Attribution (CC BY) license (https://creativecommons.org/licenses/by/4.0/).