Article

Trends in Adopting BIM, IoT and DT for Facility Management: A Scientometric Analysis and Keyword Co-Occurrence Network Review

Department of Structural, Geotechnical and Building Engineering, Politecnico di Torino, 10129 Turin, Italy
*
Author to whom correspondence should be addressed.
Buildings 2023, 13(1), 15; https://doi.org/10.3390/buildings13010015
Submission received: 15 November 2022 / Revised: 14 December 2022 / Accepted: 16 December 2022 / Published: 21 December 2022

Abstract

:
Facility Management (FM) regards the management of buildings’ assets and requires the administration of a large amount of data that must always be available, but today, they still consist of paper documents, which are susceptible to loss. This is one of the principal causes for costs increase in the Operation and Maintenance (O&M) phase, together with the lack of interoperability and communication. In recent years, the construction industry has been undergoing a process of digitalization, supported from the advent of new technologies that hit the market at low prices. This study aims to indagate the technologies introduced in in the FM sector, in addition the major authors and sources that are studying them. A bibliometric analysis is conducted on 220 documents belonging to the Scopus DB. The documents were analyzed using bibliometric analysis tools, such as Biblioshiny and VOSviewer. The results show how FM and the implementation of technologies in its practices, such as Building information modelling (BIM), Internet of Things (IoT) and Digital Twin (DT), are fields with exponential growth in recent years. Other technologies, such as blockchain, artificial intelligence (AI), machine learning (ML) and augmented reality (AR), emerged as part of digitalization in FM, which is part of the transition towards Construction 4.0.

1. Introduction

1.1. FM Definition and Functions

In recent decades, FM has been gaining an increasing interest as a discipline and profession [1]. The starting point for the recognition of FM as a discipline dates back to 1978, when Herman Miller Research Corp. hosted a conference on “Facility influence on productivity”, which represented the first step towards the creation of the International Facility Management Association (IFMA), one of the world’s largest association for FM professionals [2]. In Europe, this discipline emerged later, almost 25 years ago, when the need of linking construction industry and real estate interests with the efficient use of building assets arose, since “at least 25 percent of the assets of the corporate balance sheets of the companies were tied up in real estate assets requiring effective management” [3].
There are various definitions attributed to FM. The IFMA defines it as “a profession that encompasses multiple disciplines to ensure functionality, comfort, safety and efficiency of the built environment by integrating people, place, process and technology” [4]. Instead, the International Standard Organization (ISO) gives the following definition “FM is an organizational function which integrates people, place and process within the built environment with the purpose of improving the quality of life of people and the productivity of the core business” [5]. Moreover, FM can be defined as a discipline, whose aim is to support the main functions of a building, through “various operation, activities and maintenance services” [6].
All definitions point out the inter-disciplinary nature of the subject in which a unique scope can be recognized: to guarantee and improve functionality and efficiency of the built environment and increase the quality of life of people who live in it.
Because of the presence of various definitions, which are not univocal, the ISO is working to standardize them in order to bring awareness to the field’s value [7]. The areas that this discipline covers are wide and can be divided into soft and hard issues [8]. The hard issues concern the built environment and consist of “building works, building maintenance, building services engineering maintenance, facility services and utilities supply” [8]. The soft issues regards the managing of people and change, such as “real estate management, financial management, human resources management, health safety security environment, change management and contract management” [8].

1.2. Current State of FM Practice

FM requires the administration of a great amount of data, which cover almost all the building’s lifecycle, fundamental for the O&M phase, and finding efficient ways to collect this amount of data is necessary [9]. The maintenance of a building has the involvement of several stakeholders, who produce different types of data that need to be analyzed and integrated [10]. Nowadays, the data flow in this phase is yet to be efficient and performant. It is known that the O&M phase is the most expensive of the whole lifecycle and this is primarily due to incorrect exchange of data [11]. According to the National Institute of Standards and Technology (NIST), an inadequate information exchange and management has an impact on costs that in 2002 was around 10.6 billion dollars, which is borne mainly by operators and owners [12]. According to a NIST’s respondent the not efficient communication between stakeholders causes waste and inefficiency and up to 30% of the total cost of a building project [12]. It has been highlighted how the majority of these costs are caused by “poor communication and maintenance of as-built data, communications failures, inadequate standardization, and inadequate oversight during each life-cycle phase” [12].
Moreover, most of the information needed for the O&M phase is “stored in paper documents” and the digitalization of this type of information takes time and costs [9]. These practices are also due to contracts’ requirements, since in most of them, paper documents containing assets’ information are still required [13]. Cost reduction is, therefore, necessary.

1.3. IoT and BIM for DT in FM

In recent years, FM has been undergoing through changes, with the introduction of new technologies that can represent an opportunity to overcome the limits of inefficient communication. The technologies that permit the management of the information have to be employed in order to create a fluent flow of data from phase to phase. A database for historical data could be represented by BIM, which is “considered to be very useful during building operation stages” thanks to “advanced data storage capability and vivid representation of building information” [14]. According to ISO 29481-1:2010(E), BIM is a: “shared digital representation of physical and functional characteristics of any built object […] which forms a reliable basis for decisions” [15]. The model has the capability of containing huge amount of information since the project phase, but it is rarely used in the O&M phase and the information produced in the design and construction phase is not fully exploited; in addition, its use in FM is still in its nascent phase [14,16]. Instead, the continuous update of the information present in the model, through the building’s life cycle by all the stakeholders, could permit the creation of a reliable source of information, shared and always available from any place.
Besides, the monitoring of the assets can be performed by IoT technologies. Madakam et al. [17] defined IoT as “An open and comprehensive network of intelligent objects that have the capacity to auto-organize, share information, data and resources, reacting and acting in face of situations and changes in the environment”. In the case of building’s assets monitoring, the IoT devices can manage the capture and exchange of information that come directly and instantly from the resources monitored. Gathering these data can be employed for asset monitoring throughout their life cycle [18] for FM practice [19]. The union of BIM and IoT information can lead to the creation of a DT, which for the building sector can be defined as “the interaction between the real-world indoor environment of the building and a digital but realistic virtual representation model of the building environment, which provides the opportunity for real-time monitoring and data acquisition” [17]. DT can offer a real-time insight on assets’ conditions in order to individuate and spatially localize possible failures and also “support decision making process” [20,21]. In fact, the data monitoring can reveal future machines’ health state and consent to organize proper maintenance action, which lead towards predictive maintenance, which allows users to know where, when and if a failure will occur [22]. This type of maintenance lead to a reduction of costs and avoids interruption of service of the building. The potential for combining IoT and BIM for the creation of a DT and the actuation of predictive maintenance practice is a huge and yet to be explored area.

1.4. Structure of the Paper

The paper is structured into four main sections. The Section 1 is the introduction in which are described the fundamental concepts for understanding the topics discussed and the current state and application in FM sector. In the Section 2, the methodology for the collection and the analysis of the bibliometric data is described. Successively, in the Section 3, the results will be discussed, and in the Section 4 and Section 5, the conclusions are proposed.

2. Aim and Methodology

This paper aims to individuate the impact, status and future trends of new technologies in FM for building’s systems through the use of bibliometric analysis. The achievement of this goal will be performed through software tool for bibliometric analysis, which will be studied in order to find the one that is the most fitting for the scope.
The paper’s methodology is described in Figure 1. The process is composed by five steps which can be divided into two phases: a preliminary phase followed by a data visualization, analysis and discussion phase.
The followed steps are:
  • Step 1: preliminary research;
  • Step 2: database (DB) query;
  • Step 3: data cleaning;
  • Step 4: results’ visualization;
  • Step 5: results’ discussion.
The first step consisted of the research of papers and their reading for the individuation of keywords on which the query of the DB is based. The most relevant and recurrent words were selected for the analysis. Eventually, the principal bibliometric analysis methods were indagated, to identify the most appropriate one. At this scope, the principal bibliometric analysis tools were compared, based on the research conducted by [23]. The paper studies the features of the principal tools available for bibliometric analysis, which are listed in Table 1.
Two software were selected for the bibliometric analysis. The first one is Biblioshiny, which emerged as the most complete software tool from the comparison. It is a web-based application developed by Massimo Aria and Corrado Cuccurullo from the University of Naples and University of Campania’s Luigi Vanvitelli, which enables the analysis of bibliometric data and their visualization in graphs and maps [23]. The second software tool selected was VOSviewer, which is a software developed by the Centre for Science and Technology Studies (CWTS) at Leiden University (Leiden, the Netherlands) and permits the creation of bibliometric networks based on co-citation network [23]. From the analysis appeared as the one complementary to Biblioshiny, since performs analysis that are not available in it. The second step was the DB query. The DB chosen for the bibliometric analysis was Scopus, which is produced by Elsevier and is a “an abstract and indexing database with full-text links” [24], which today is considered the biggest “abstract and citation database in the world” [25]. It was chosen because of the big amount of data regarding the topics investigated in this paper. Once the DB was defined, the string for the query needed to be defined. The keywords previously identified were put inside the string query with specific Boolean operators. In fact, the Scopus DB enables an advanced search that permits to include synonyms of a word in order to include a wider number of articles. The string used was:
  • (fm OR “facility management”) AND (iot OR “internet of things”) AND (“digital twin” OR dt) AND (bim OR “Building Information Modelling” OR “Building Information Modeling”) AND (“construction industry” OR “architectural engineering” OR aeco OR “construction management”) AND (LIMIT-TO (LANGUAGE, “English”))
The research was conducted in October 2022 and was limited to articles written in English. The data were downloaded in CSV format and then processed using the software and tools previously introduced in the paragraph.
The third step was the data cleaning, which consisted of the elimination of synonyms and non-pertinent words present in the articles, before running the analysis as shown in Table 2.
The dataset information is listed in Table 3.
The fourth step involved results’ visualization in graphs and co-occurrence network maps.
The fifth and final step included the results’ analysis and their discussion.

3. Results’ Visualization and Discussion

3.1. Three-Field Plot Overview

The three-field plot gives an insight on the countries with the highest scientific production and the major sources related to BIM, IoT and DT and the connected keywords. In addition, it shows the relationship between them. The plot was created using Biblioshiny. In Figure 2, it is possible to see how the keywords BIM, IoT, DT and FM are strongly connected to the United Kingdom (UK), Australia and China. Moreover, the major sources for these topics are the journals Buildings and Automation in Construction, in addition to Sustainability. In particular, the journal Buildings is strongly connected to the topics of BIM, DT, FM, blockchain, IoT and Industry 4.0, whereas Automation in Construction is connected to Artificial Intelligence (AI) as well. Meanwhile, Sustainability, besides the focus on the first three keywords, has a strong flow towards Construction 4.0. From this first analysis, different concepts pop up that are connected to the key topics introduced in Section 1, particularly the terms blockchain, AI, industry 4.0, construction 4.0 and AR. The term blockchain refers to the technology at the base of cryptocurrencies [26] and indicates a “type of distributed database” [27], which is able to make information available in “different geographical locations such as multiple sites, countries, or organizations” [27]. Its principal feature is the absence of a “central administrator or centralized data storage mechanism” [27]. Even if its first application was for cryptocurrencies, this technology can be applied also in other fields [28], such as the construction sector [27], even for the FM activities. Specifically, studies have shown how its application for assets’ management can improve the efficiency of data sharing and protection, with benefits for interoperability and cost reduction [29,30]. Besides, AI and its subfields, such as ML, are catching on and their applications in various industry sectors, including the construction one, are being studied [31]. In particular, ML has been employed in FM as a method for classifying and predicting anomalies of assets in the building such as HVAC [32]. Besides, the AI applications studies have enhanced the rise of other technologies, such as the previously cited blockchain [31]. The terms industry 4.0 refers to the fourth industrial revolution [33] and is based on the advent of new technologies, including IoT and DT, in the sector [34]. The term Construction 4.0 is the relative declination of industry 4.0 in the construction sector and is equally based on new trends and technologies [35].
All these concepts are considered to contribute to the process of digitalization in FM [36].

3.2. Temporal Trends

3.2.1. Annual Scientific Production

The applications of new technologies and the integration of BIM for FM practice in the construction sector are trends that have been studied in recent years only. According to the query of the DB Scopus, the scientific production regarding these topics covers the timespan from 2018 to 2022. As shown in Figure 3, the publications of this type of articles have grown exponentially in the last 4 years, reaching the peak of 105 documents in the 2022, with an annual growth rate around 220.11%. The graph is characterized by an upward trend with an important increase of scientific production between 2020 and 2022.

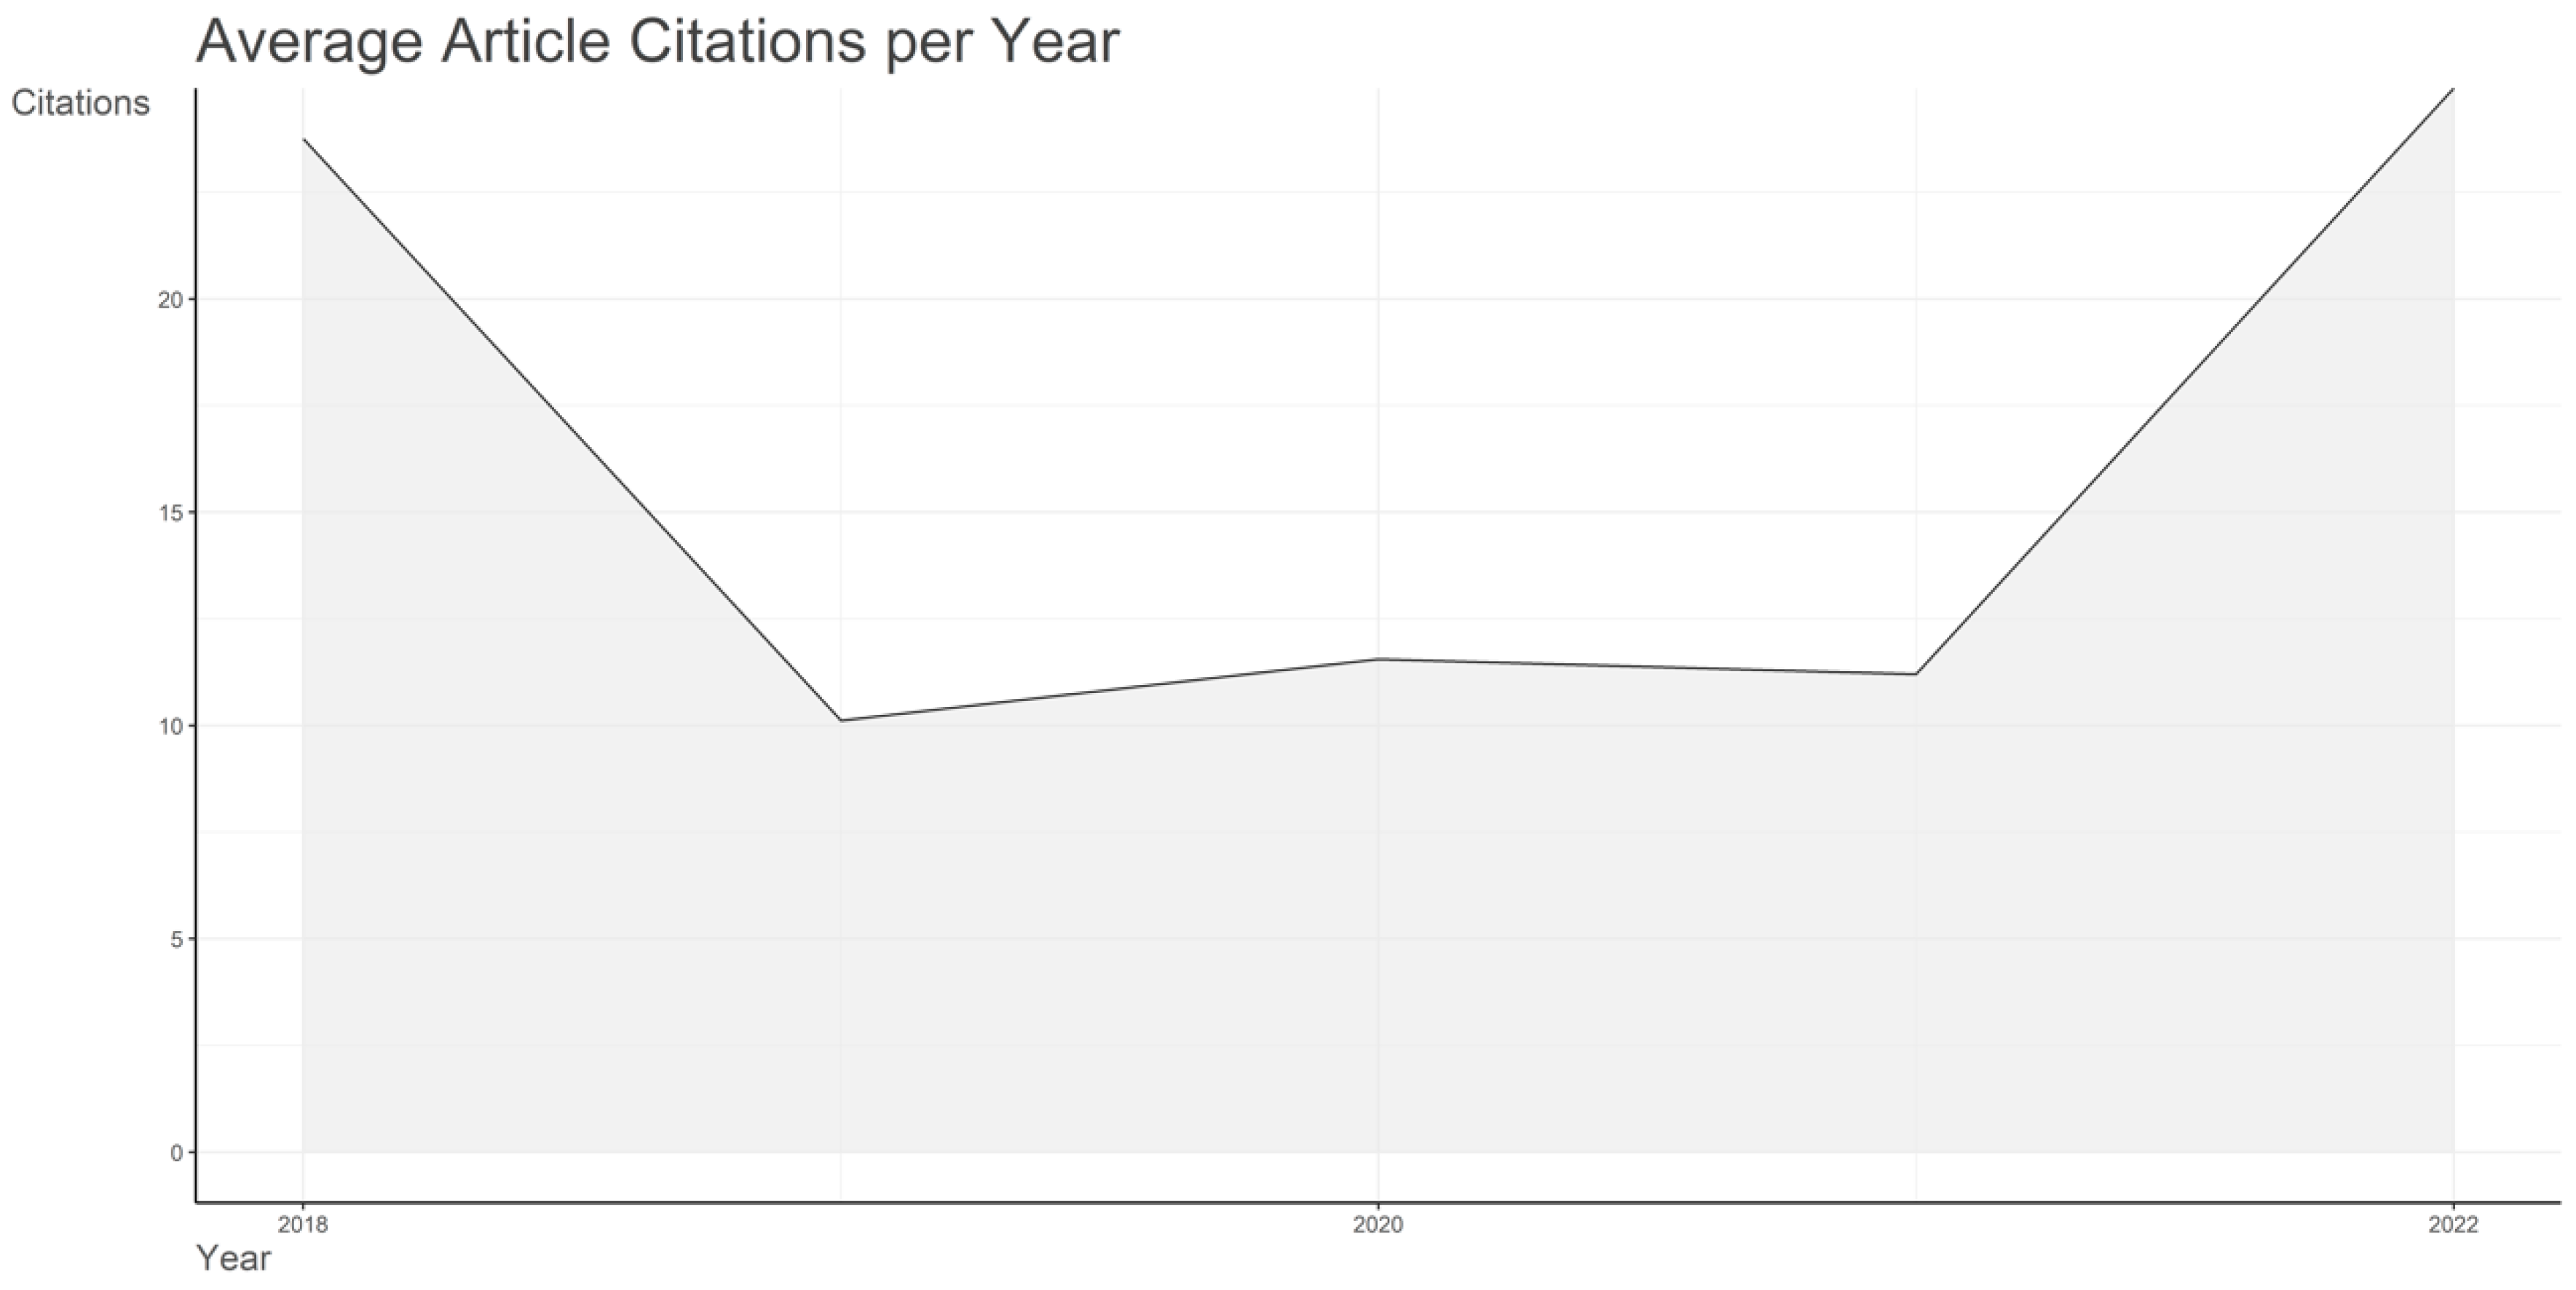
3.2.2. Average Citation per Year Trend

The trend in the graph about the average citations per year, shown in Figure 4, does not match the one about the annual scientific production. Form 2020, there is a decrease of the trend that stabilizes itself between 2019 and 2021 and displays an increase from 2021. The decrease from 2019 to 2021 could be caused by a decrease of international collaboration, since it has been studied how there is a correlation between the number and type of collaborations and the number of citations [37,38].

3.2.3. Words’ Dynamics

The temporal evolution of keywords from 2018 and 2022 is provided in the Figure 5. The graph shows the evolution of the ten most important keywords used by the authors. It is evident that the most used keywords with the biggest growth in 2020 are BIM and DT, proving how scientific production is increasingly focusing on the investigation of these topics.
Keywords such as construction 4.0 and industry 4.0 are also present and are connected to the transformation of these sectors due to the introduction of new technologies such as BIM, DT and IoT. Their growth is visible until 2021, when construction 4.0 suffers an evident decreasing trend, while the industry 4.0 displays a light increase. The words blockchain, connected to the use of IoT technologies and BIM for information storage and validation, follows a similar pattern. The word FM has an upward trend from 2020, without any decrease. This graph shows how these topics are gaining interest in the research area; in particular, the upward trend of BIM, IoT, DT and FM is evident, besides the other words connected to these subjects. In addition, the word AI undergoes an increasing trend from 2020 onwards.

3.3. Authors’ Analysis

The authors’ analysis is useful for the identification of the most relevant authors in a specific field. This type of analysis was conducted using the Biblioshiny software.

3.3.1. Authors’ Productivity through Lotka’s Law

Lotka’s law describes the productivity of authors in a certain subject area [39]. According to [40] Lotka’s law states that “as the frequency of publications increases, the approximate number of authors with that frequency of publications may be predicted”, and in particular, “at a higher level of productivity, there are fewer authors” [40]. This law enables to identify the most significant authors in a certain area. Figure 6 shows the graph of Lotka’s law, generated through Biblioshiny, which relates the percentage of authors and the number of documents published by them. It can be noticed how the percentage of authors with a lower number of articles produced is very high with respect to the percentage of authors with more than three documents published. In particular, only seven authors have written four or more articles in the analyzed area.

3.3.2. Most Relevant Authors

The authors with the highest number of publications are listed in Table 4. Edwards D.J. published the highest number of documents with a total of six documents, followed by Chileshe N., Elghaish F., Li H., Liu Y., Liu Z. and Xu Y., with a total of four articles. Two of the first three authors are from the UK, i.e., Edwards D.J. and Elghaish F. There are also three authors from China, i.e., Liu Z., Xu Y. and Chen C., two from Hong Kong, i.e., Li H. and Liu Y., one from Australia, i.e., Chileshe N. , one from USA, i.e., Anumba C.J., and one from Norway, i.e., Hosamo H.H.

3.3.3. Authors’ Collaboration Network Analysis

The collaboration between authors was also analyzed. In particular, the collaboration network shows research groups that are indagating specific topics and how they are related in addition to the individuation of the largest research group in the analyzed area. Figure 7 shows a total of 14 research groups for the analyzed topic. The biggest group is composed of six authors and ten out of fourteen groups are composed by only two members. In addition, the graph shows how few collaborations exist between groups.
The largest group is the blue group and is composed of:
  • Edwards D.J., Professor at the Birmingham City University, UK;
  • Chileshe N., Professor at the University of South Australia, Australia;
  • Elghaish F., Lecturer at Queen’s University Belfast, Northern Ireland, UK;
  • Hosseini M.R., Professor of the Daikin University, Australia;
  • Olanrewaju O.I., PhD candidate at the Victoria University of Wellington, New Zealand;
  • Ghosh A., Associate Researcher of the University of Deusto in Spain.
The institution to which every author belongs is heterogeneous, with two authors from Australia and two from the UK.
The second largest group is the red group and is composed of:
  • Liu Y. of the University of Melbourne, Australia;
  • Broyd T., Professor at the Bartlett Faculty of the Built Environment, London, UK;
  • Chen K. Professor at the Huazhong University of Science and Technology, Wuhan, China;
  • Cheng J.C.P., Professor of Civil and Environmental Engineering at the Hong Kong; University of Science and Technology, Hong Kong;
  • Fang Y., Lecturer at Monash University, Clayton, Australia.
The second group shows collaborations between authors from different part of the world, with two of them coming from Australia and Hong Kong.
The third group is the green group and is composed by:
  • Li X. Research Assistant Professor at the University of Hong Kong, Hong Kong;
  • Lu W. Professor at the University of Hong Kong, Hong Kong;
  • Xu J. Postdoctoral Fellow at the University of Hong Kong, Hong Kong;
  • Chen J. Research Assistant Professor at the University of Hong Kong, Hong Kong.
All the members of this research group belong to the University of Hong Kong. For what concerns the other group, the purple one is composed by members of the Nanyang Technological University in Singapore and the orange one is composed by authors from the University of Turin in Italy.

3.3.4. Authors’ Impact

An analysis of the authors’ impact was also carried out based on the calculation of the H-index, G-index, M-index and total citations.
The H-index is used to objectively compare “the scientific achievement of researchers and has rapidly become one of the most favored measures of scientific output” [41,42]. This index is based on the number of publications which has received at least h citation [41].
The G-index is defined “as the highest number g of papers that together received g2 or more citations” [43] and is higher than the H-index.
The M-index is the H-index divided by “the number of years since an author’s first publication” [44]
A comparison with the list of pros and cons of the previously cited index is given in Table 5.
The results are shown in Table 6 with the ten most important authors. The author with the highest impact is Edwards D.J., who is a Professor of the Birmingham City University, followed by Chileshe N., who is a Professor at the University of South Australia, and Munoz-La Rivera F., who is a Professor at Pontificia Universidad Católica de Valparaíso, Chile. This classification does not match the one in Section 3.2.2. In fact, only Edwards D.J. and Chileshe N. appear at the top of the table, but they are not followed by the same authors. Indeed, there is a mismatch between the authors with the highest number of publications and the highest impact.

3.3.5. Most Cited Documents

The most cited documents are listed in the Table 7.
The most cited document is the one by Boje C., published in 2020 by Automation in Construction with the title “Towards a semantic Construction Digital Twin: Directions for future research”. This article explores the “Current research landscape around the subject of BIM uses” [51] with the identification of current and future trends. The difficulties connected to BIM’s interoperability created the opportunity to start the challenge for the creation of a DT of the construction [51]. The article carries out an analysis of DT and the technologies employed for its creation, in addition to explore their application in the construction sector. In particular, it highlights the benefits coming from a correct management of data using DT through all the building life-cycle, with a saving of costs and reduction of carbon emissions. Generally, the article “presents a conceptual framework for realizing a Construction DT” [51] based on a literature review. The article was written with the collaboration between the Luxembourg Institute of Science and Technology and the BRE Trust Centre for Sustainable Engineering of the Cardiff University.
The second most cited article is also a scientometric analysis regarding the adoption of AI in the Construction sector, by Pan Y. and Zhang L. of the Nanyang Technological University [52]. The article was published in 2021 by Automation in Construction. Synthetically, the paper highlights three major functions of AI use, in particular:
  • Modeling and pattern detection, which consists of creating readable model of the construction for the artificial intelligence, which can manage a large amount of complex information, in addition to pattern detection, which is useful for individuation through image and videos of “damage-like, crack-like, unsafety condition-like patterns for infrastructure condition assessment and construction safety assurance” [52];
  • Prediction, which consists of the analysis of historical data for event prediction;
  • Optimization, which consists of a “decision making process for seeking and delivering practical sustainable solutions to the construction project.”
The third paper is written by Wong J.K.W. et al., belonging to the University of Technology of Sidney, and published in Automation in Construction in 2018. Additionally, this article is a systematic review on the digital technologies use in FM, with the aim of identifying their state of art and future trends. The digital technologies to which the article refers are BIM, IoT, reality capture technology and Geographical Information System (GIS) [10].
The first three most cited documents are all reviews, and a study has shown that this type of paper is more “likely to be cited extensively” [38].

3.4. Sources’ Analysis

Source analysis is useful for the identification of the most relevant journals in a specific subject area. This type of analysis was conducted using the Biblioshiny software.

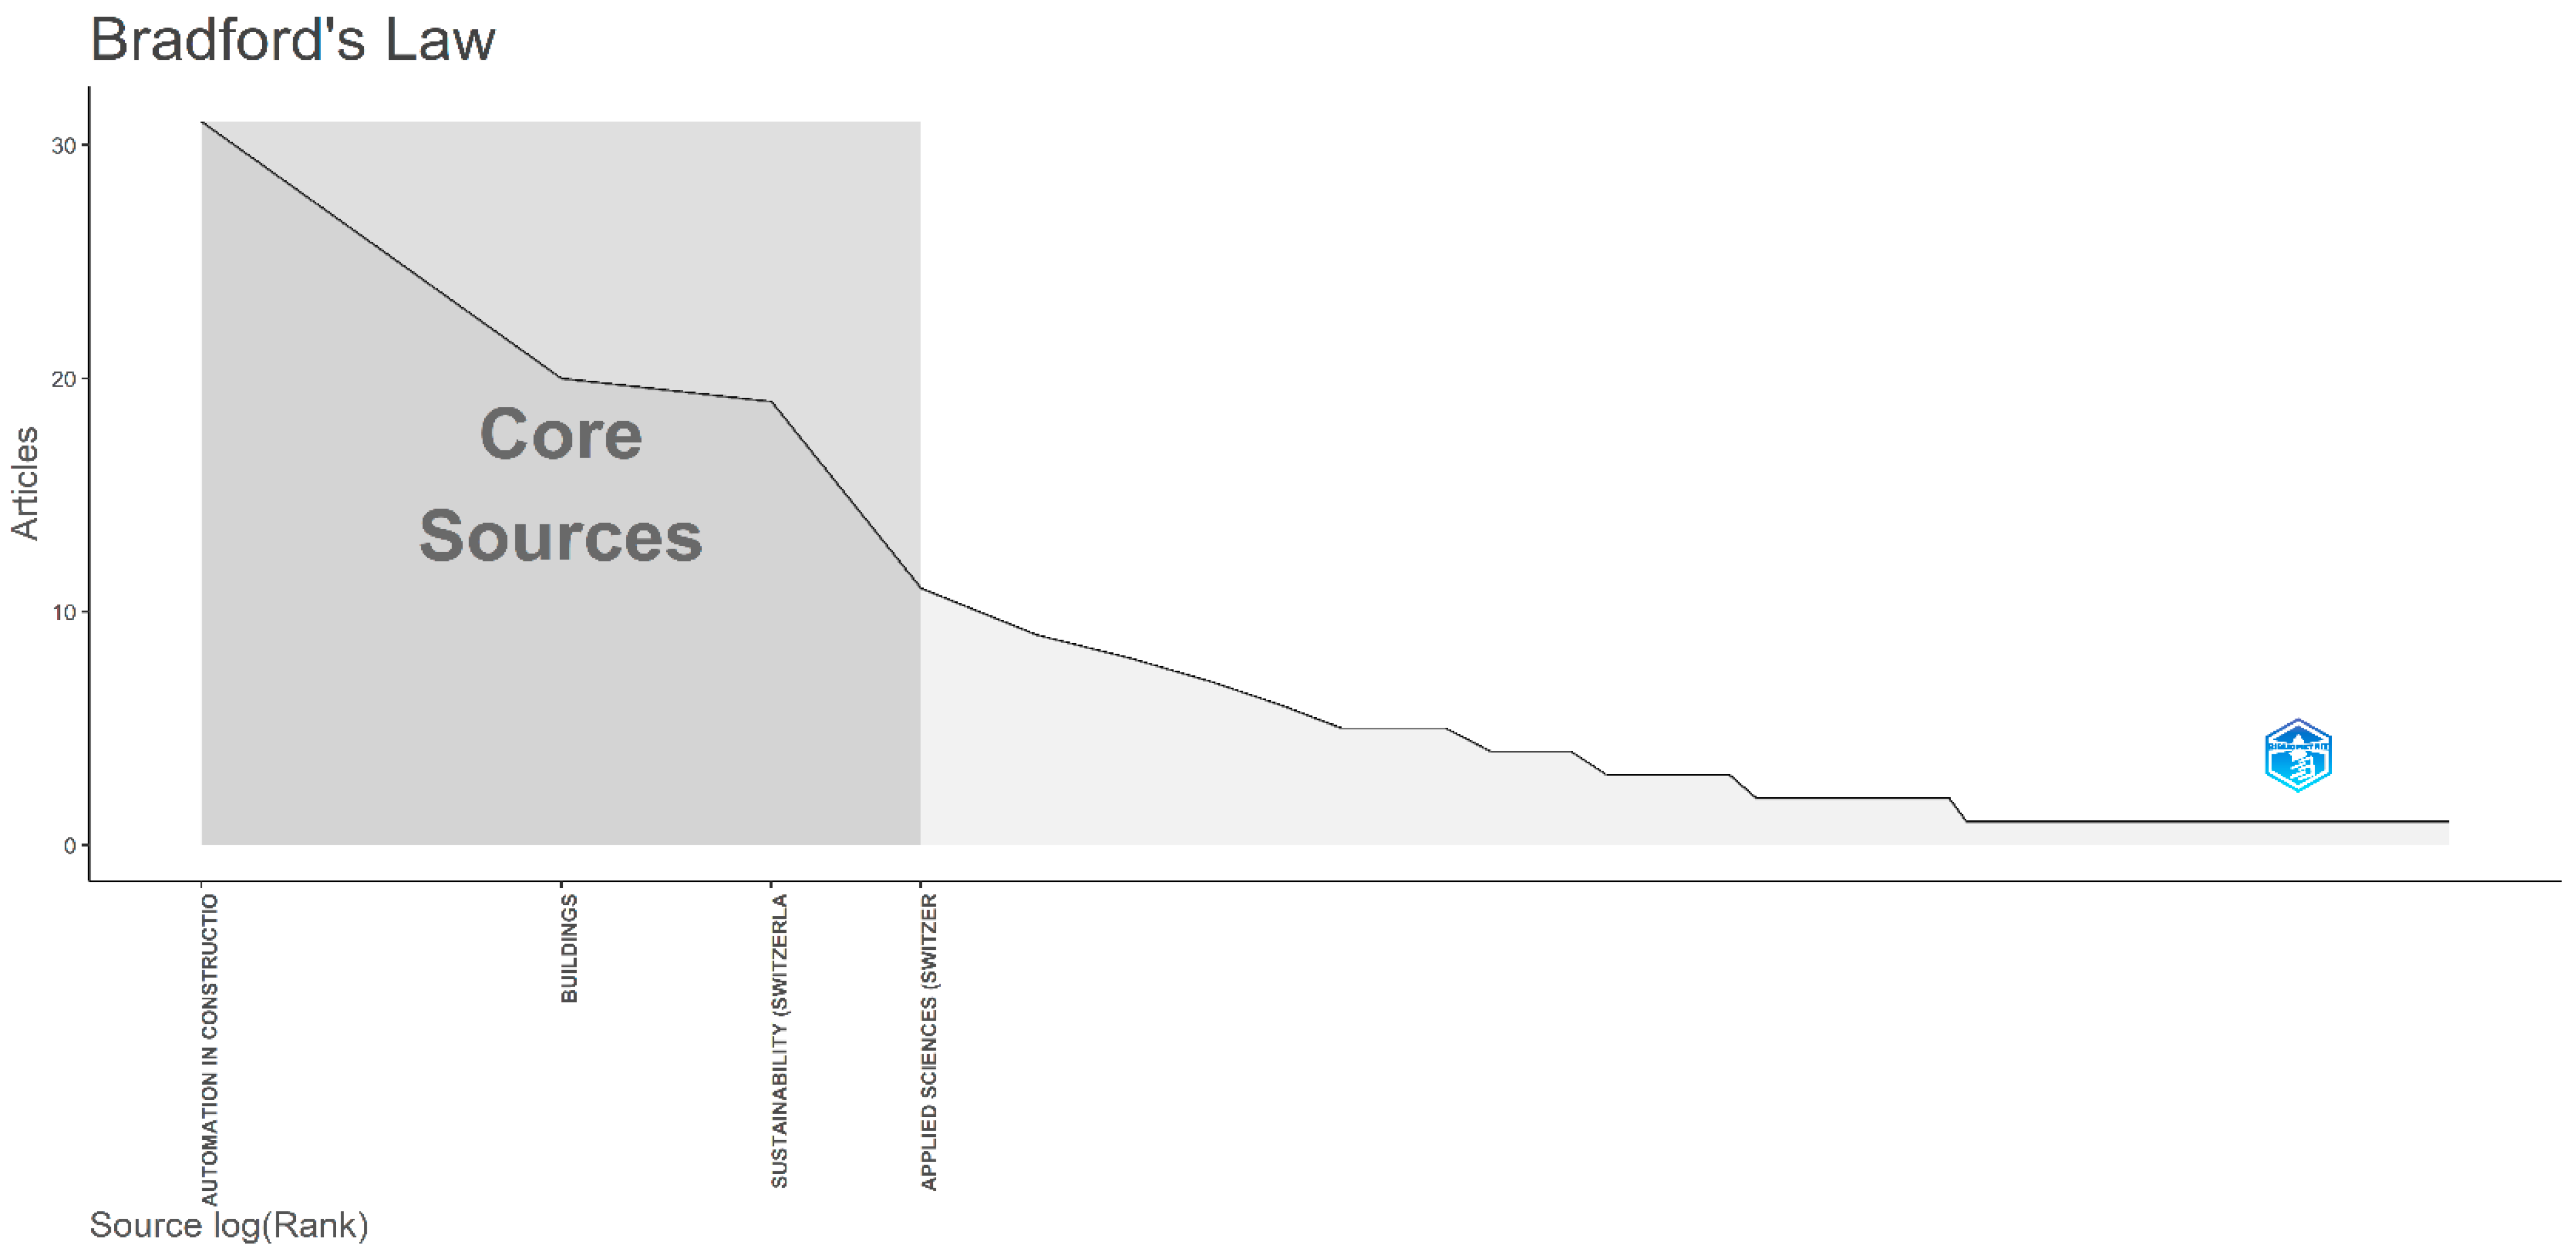
3.4.1. Bradford’s Law

Bradford’s law permits “to identify the core journal in a given field” [53]; in particular, it “reveals a pattern of how literature in a subject is distributed in journals” [53]. Therefore, this law is useful for the individuation of journals that are more committed to a specific field [53]. Besides, it makes possible the division of journals in three zones, where “Bradford called the first zone, the nucleus of periodicals particularly devoted to the given subject” [54]. The others two zones are the middle third, which includes a journal with an average citation amount, and the bottom third, with journals of marginal importance in the related field [55]. The law “predicts that the number of journals in the second and third zones will be n and n2 times larger than the first zone respectively” [55]. This type of analysis was performed thanks to the software Biblioshiny and the output can be seen in Figure 8. The first zone in which the core sources are included is composed of four journals, i.e., Automation in Construction, Buildings, Sustainability and Applied Sciences. The four journals belonging to the core zone have produced a total number of articles equal to 81. In the second zone, twelve journals are present, whose production is equal to 69 articles, and finally, in the third zone 57 journals are present, with a production of 70 articles.

3.4.2. Sources’ Dynamics

The core sources dynamics were analyzed over time. In Figure 9, the temporal trend is displayed for the number of articles published by journals regarding the analyzed topics. Figure 9 shows a general increasing trend for the number of articles regarding BIM, IoT, DT and FM. In particular, the journal Automation in construction has the highest number of occurrences in 2022, followed by the journal Buildings, with thirteen occurrences in 2022. Two journals, Sustainability and Applied Sciences, display a decreasing trend after 2021.

3.4.3. Most Relevant Sources

Table 8 shows the number of articles published by the ten most relevant sources. The one with the highest numbers of articles published is Automation in Construction, with 31 articles, followed by Buildings, with 20 articles, Sustainability, with 19 articles and Applied Sciences, with 11 articles.

3.4.4. Sources’ Impact

The same analysis carried out in Section 3.2.3 was performed for the sources of the DB articles.
In Table 9, the ten sources with highest impact in the studied topics are listed. As for Bradford’s law and the analysis of the most relevant sources, the source with most impact is Automation in Construction, followed by Sustainability and Applied Sciences.

3.5. Social and Geographical Analysis

3.5.1. Countries Scientific Production

In Table 10, the ten countries with the highest scientific production are listed. In first place is China (64 articles), followed by the UK (56 articles), Australia (54 articles), Italy (32 articles) and the USA (31 articles).
This information matches the data in Section 3.2.2, as a majority of the authors with the highest production are from China and Australia.

3.5.2. Most Relevant Affiliations

In this section, the ten most important universities are shown in terms of scientific production for the indagated topics. The results can be seen in Table 11. The first three positions are, respectively, the University of Johannesburg in South Africa, the Birmingham City University in the UK and the Shenzhen University in China. Three out of the ten listed universities are located in Australia, in particular the University of South Australia, Western Sidney University and Deakin University, confirming the country’s high scientific production, followed by the UK, with two institutions.

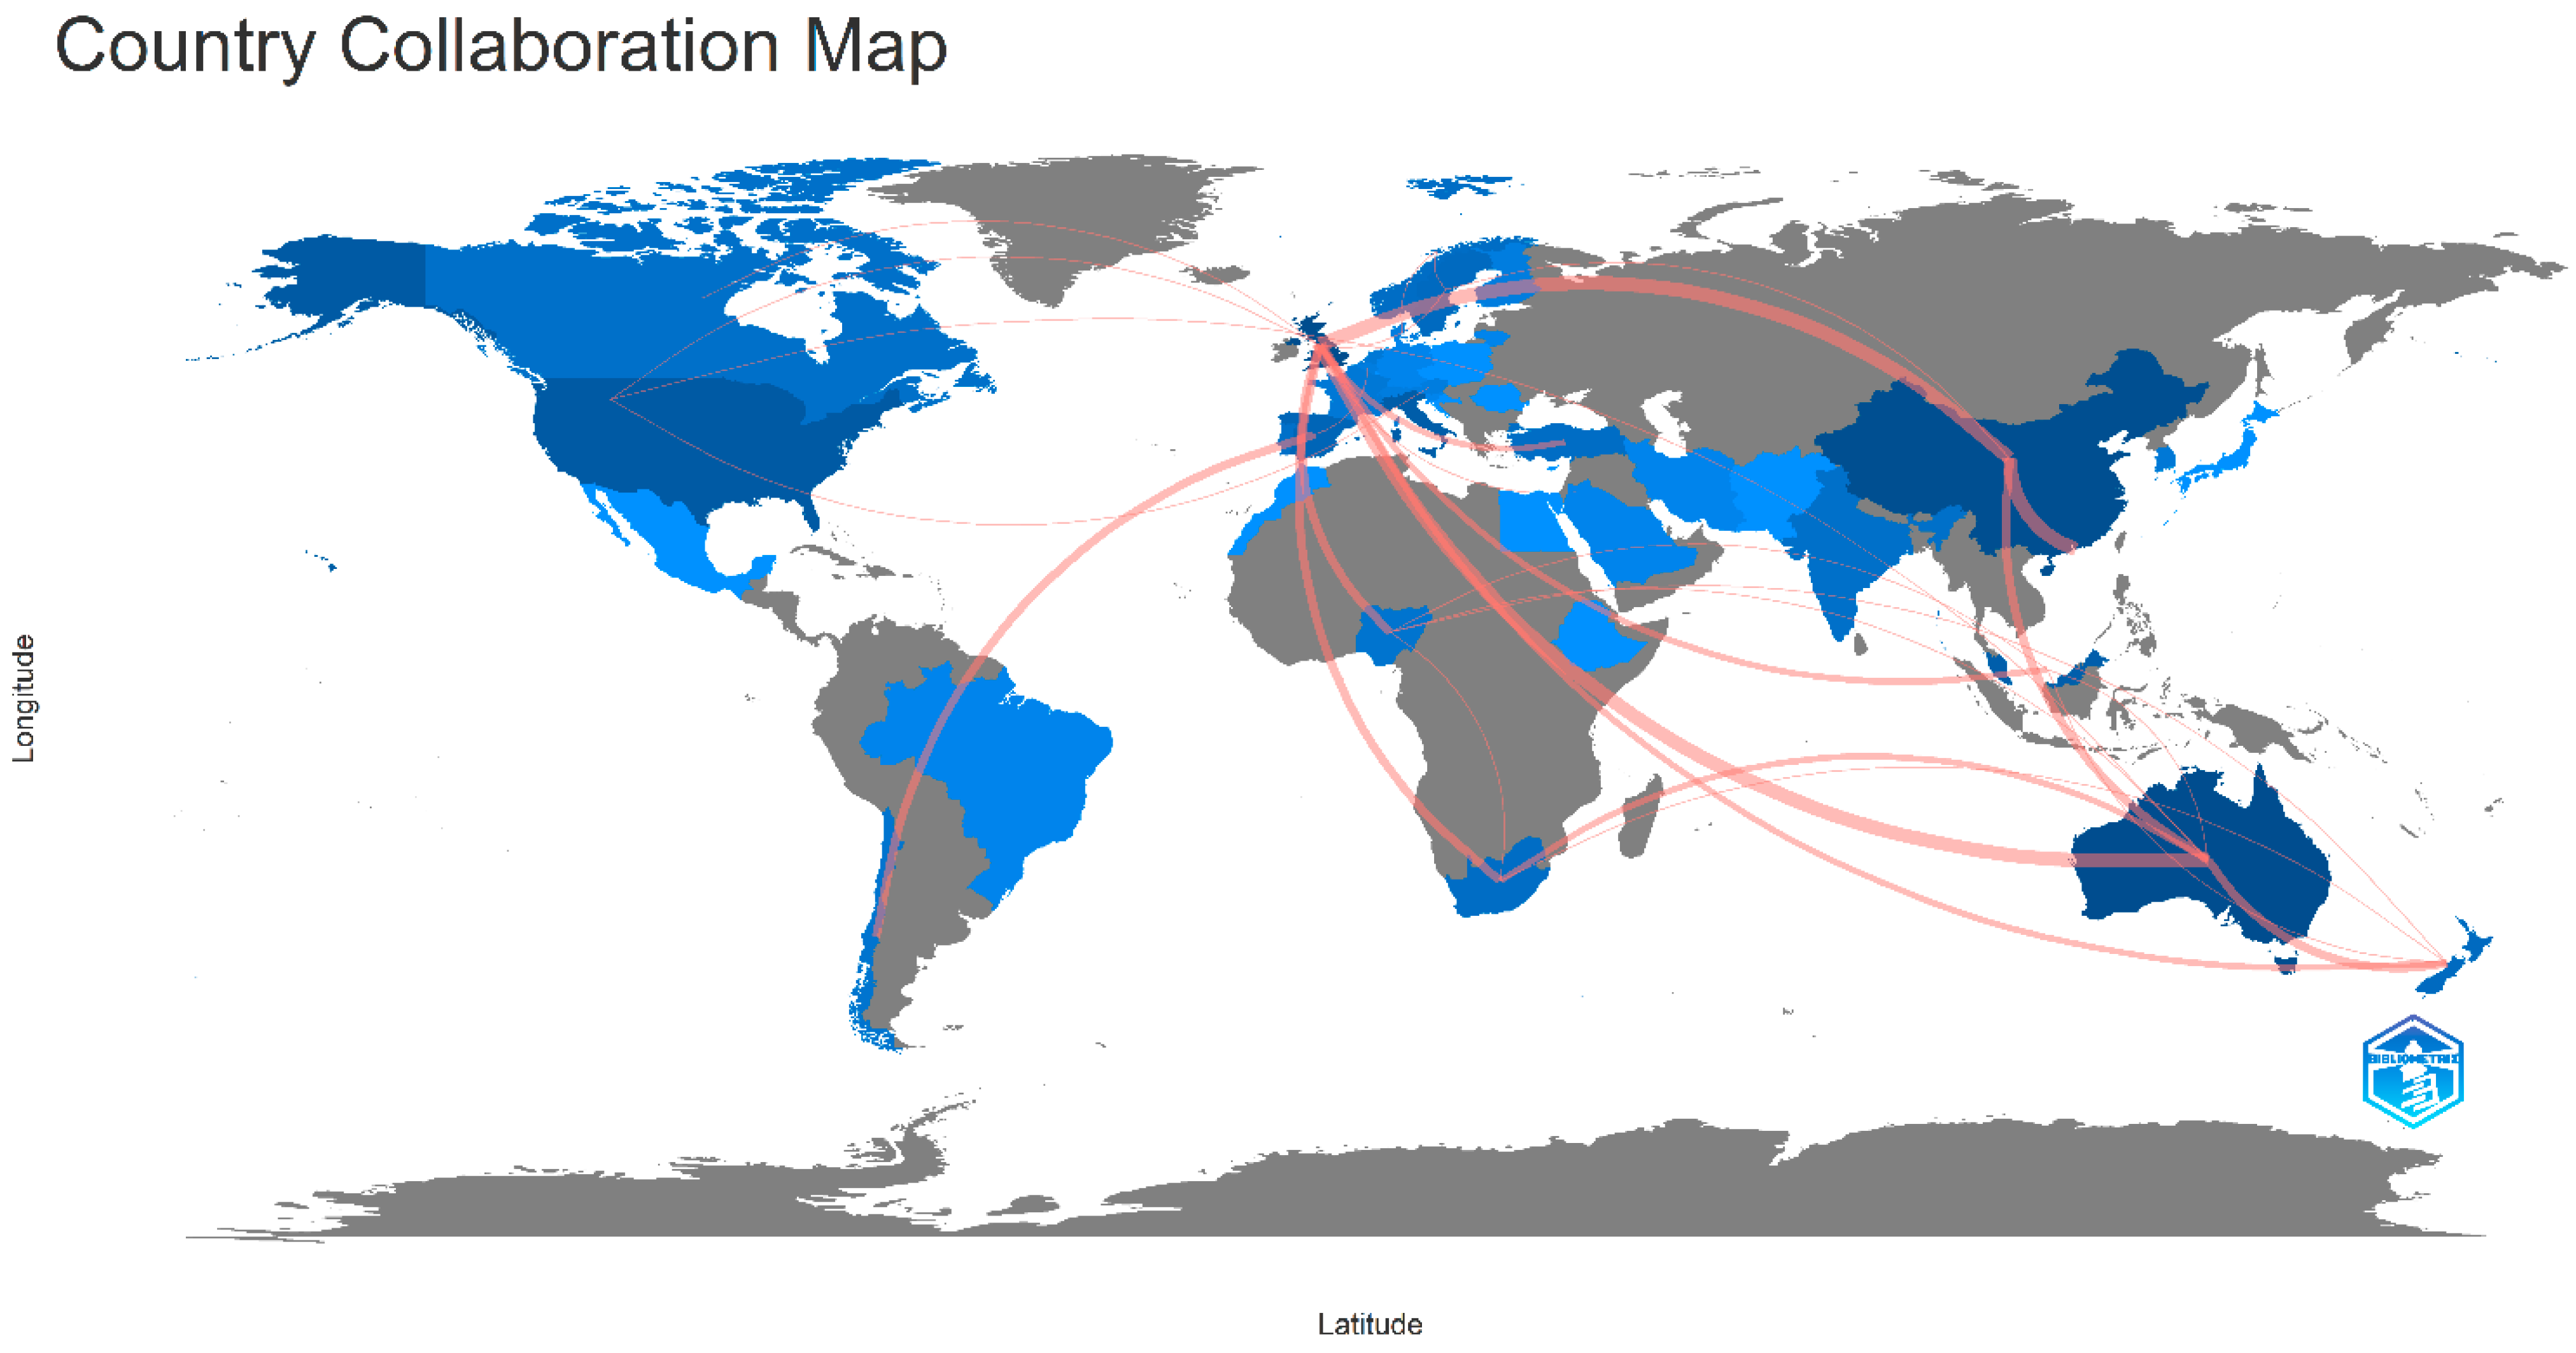
3.5.3. Country Collaboration Map

The collaboration map between countries is described in Figure 10. The highest frequencies of collaborations are between China and Hong Kong, China and the UK and the UK and Australia. These data match the data of the Section 3.2.3, since most of the biggest collaboration groups included authors from Australia, China, Hong Kong and the UK.

3.6. Bibliometric Networks

Bibliometric networks were created using the software tool VOSviewer version 1.6.18. VOSviewer can create three types of maps, based on network data:
  • Network visualization;
  • Overlay visualization;
  • Density visualization.
The network was created based on a bibliographic DB file, which was provided as an input to the software. In this case, the bibliographic data file was downloaded in CSV format by the Scopus DB.

3.6.1. Co-Occurrence Keywords Network Visualization

A co-occurrence keywords analysis was performed, including both authors’ keywords and index keywords, based on bibliographic data, downloaded by the Scopus DB. The map is composed of labels associated to circles. The size of both is determined by the weight of the item, and some of them could not be displayed in order to avoid overlapping [56]. Every item is connected to others by links and by default, the 1000 strongest links are displayed. Each item is displayed with a color which identifies the cluster to which that item is connected to [56]. Clusters are created by default from the software and represent a set of closely related nodes. Especially, maps are created using the VOS mapping technique, “where VOS stands for visualization of similarities” [57,58]. The concept at the base of the VOS mapping technique is the placing of items according to their similarity, with items that have higher similarity closer to each other and items with a lower similarity far from each other [57]. In Figure 11, the map for co-occurrence keywords is displayed. The map is composed of 71 items, connected by 1112 links, which represent “the number of links of an item with other items” [56] and a total link strength equal to 3137, which stands for ”the total strength of the links of an item with other items” [56]. In the map, five clusters can be identified. The bigger one is the red cluster, cluster 1, composed of 20 items, while the smaller one is the purple cluster, cluster 5, composed of 11 items.
Cluster 1 refers to DT and its related field. This cluster includes the words “construction”, “intelligent building”, “construction equipment” and “bridges”, confirming the applications of DT in the construction sector. Moreover, words connected to its possible application are present, such as “operation and maintenance” and “decision making”. In fact, it has been studied how one of the most important values of DT is “a more efficient and informed decision support system” [59], as it provides real-time data that can be analyzed to support decision making [59], which can be fundamental for improving the efficiency of O&M practices. In this cluster, the word “cyber-physical system” also appears, which are systems similar but not identical to DT, but both aim to achieve the cyber physical interaction and integration [60].
Cluster 2 is composed of 15 items related to BIM. It can be seen how BIM is closely related to “architectural design”, since its application nowadays mainly concern this part of the building’s life cycle [61]. This cluster also highlights the strong relation between BIM and data. In fact, this cluster include words such as “information systems”, “information theory”, “information use” and “data integration”. Indeed, BIM is an information model composed by a “3D geometry, non-graphical information, documents and drawings” [62]. Additionally, words related to sustainability are present, since it has been shown by many studies how the use of BIM can “facilitate the very complex processes of sustainable design” [63].
Cluster 3, the blue cluster, focuses on the “construction industry” and its transformation towards “construction 4.0”, which can be defined as a set of multiple areas that are “characterized by keywords that identify emerging trends that have been transferred from Industry 4.0” [64]. Some of these keywords related to emerging trends are present in this cluster such as “IoT” and “big data”. Therefore, it can be seen that the use of new technologies is increasingly affecting the construction industry and marking its evolution.
Cluster 4, the yellow cluster, concerns the “information management” and the “project management”. The cluster proves how these topics are strictly related to “blockchain” and “smart contract”. In particular, smart contract are “pieces of computer code” [65] with the feature of “immutability, security and censorship resistance” [65,66]. Blockchain, together with smart contract, guarantees the security of the information and avoids data loss [65,67]. Besides, in these years, studies concerning blockchain applications for the construction sector are more concentrated on the O&M phase, in particular in combination with BIM [68,69] and its applications for information management. In fact, the use of blockchain can “avoid the centralized control of traditional management” [68] and can be used as a reliable platform for stakeholders, enabling real-time data communication of information [68].
Cluster 5 is the one regarding FM field. Recurring keywords such as “predictive maintenance”, “asset management” and “digitalization” show the path towards which the FM is moving with the use of new technologies. Nowadays, “predictive maintenance” is catching on, which consists of the monitoring of data coming from the building’s assets in order to prevent failure. This type of maintenance is strictly related to ML techniques. Oftentimes, ML methods are used to “predict the condition of building components” [70]. The trend regarding FM is surely going towards “digitalization” and its evolution in this direction is gaining much attention [71].
Finally, the network shows a strong connection between clusters with a high density of links.

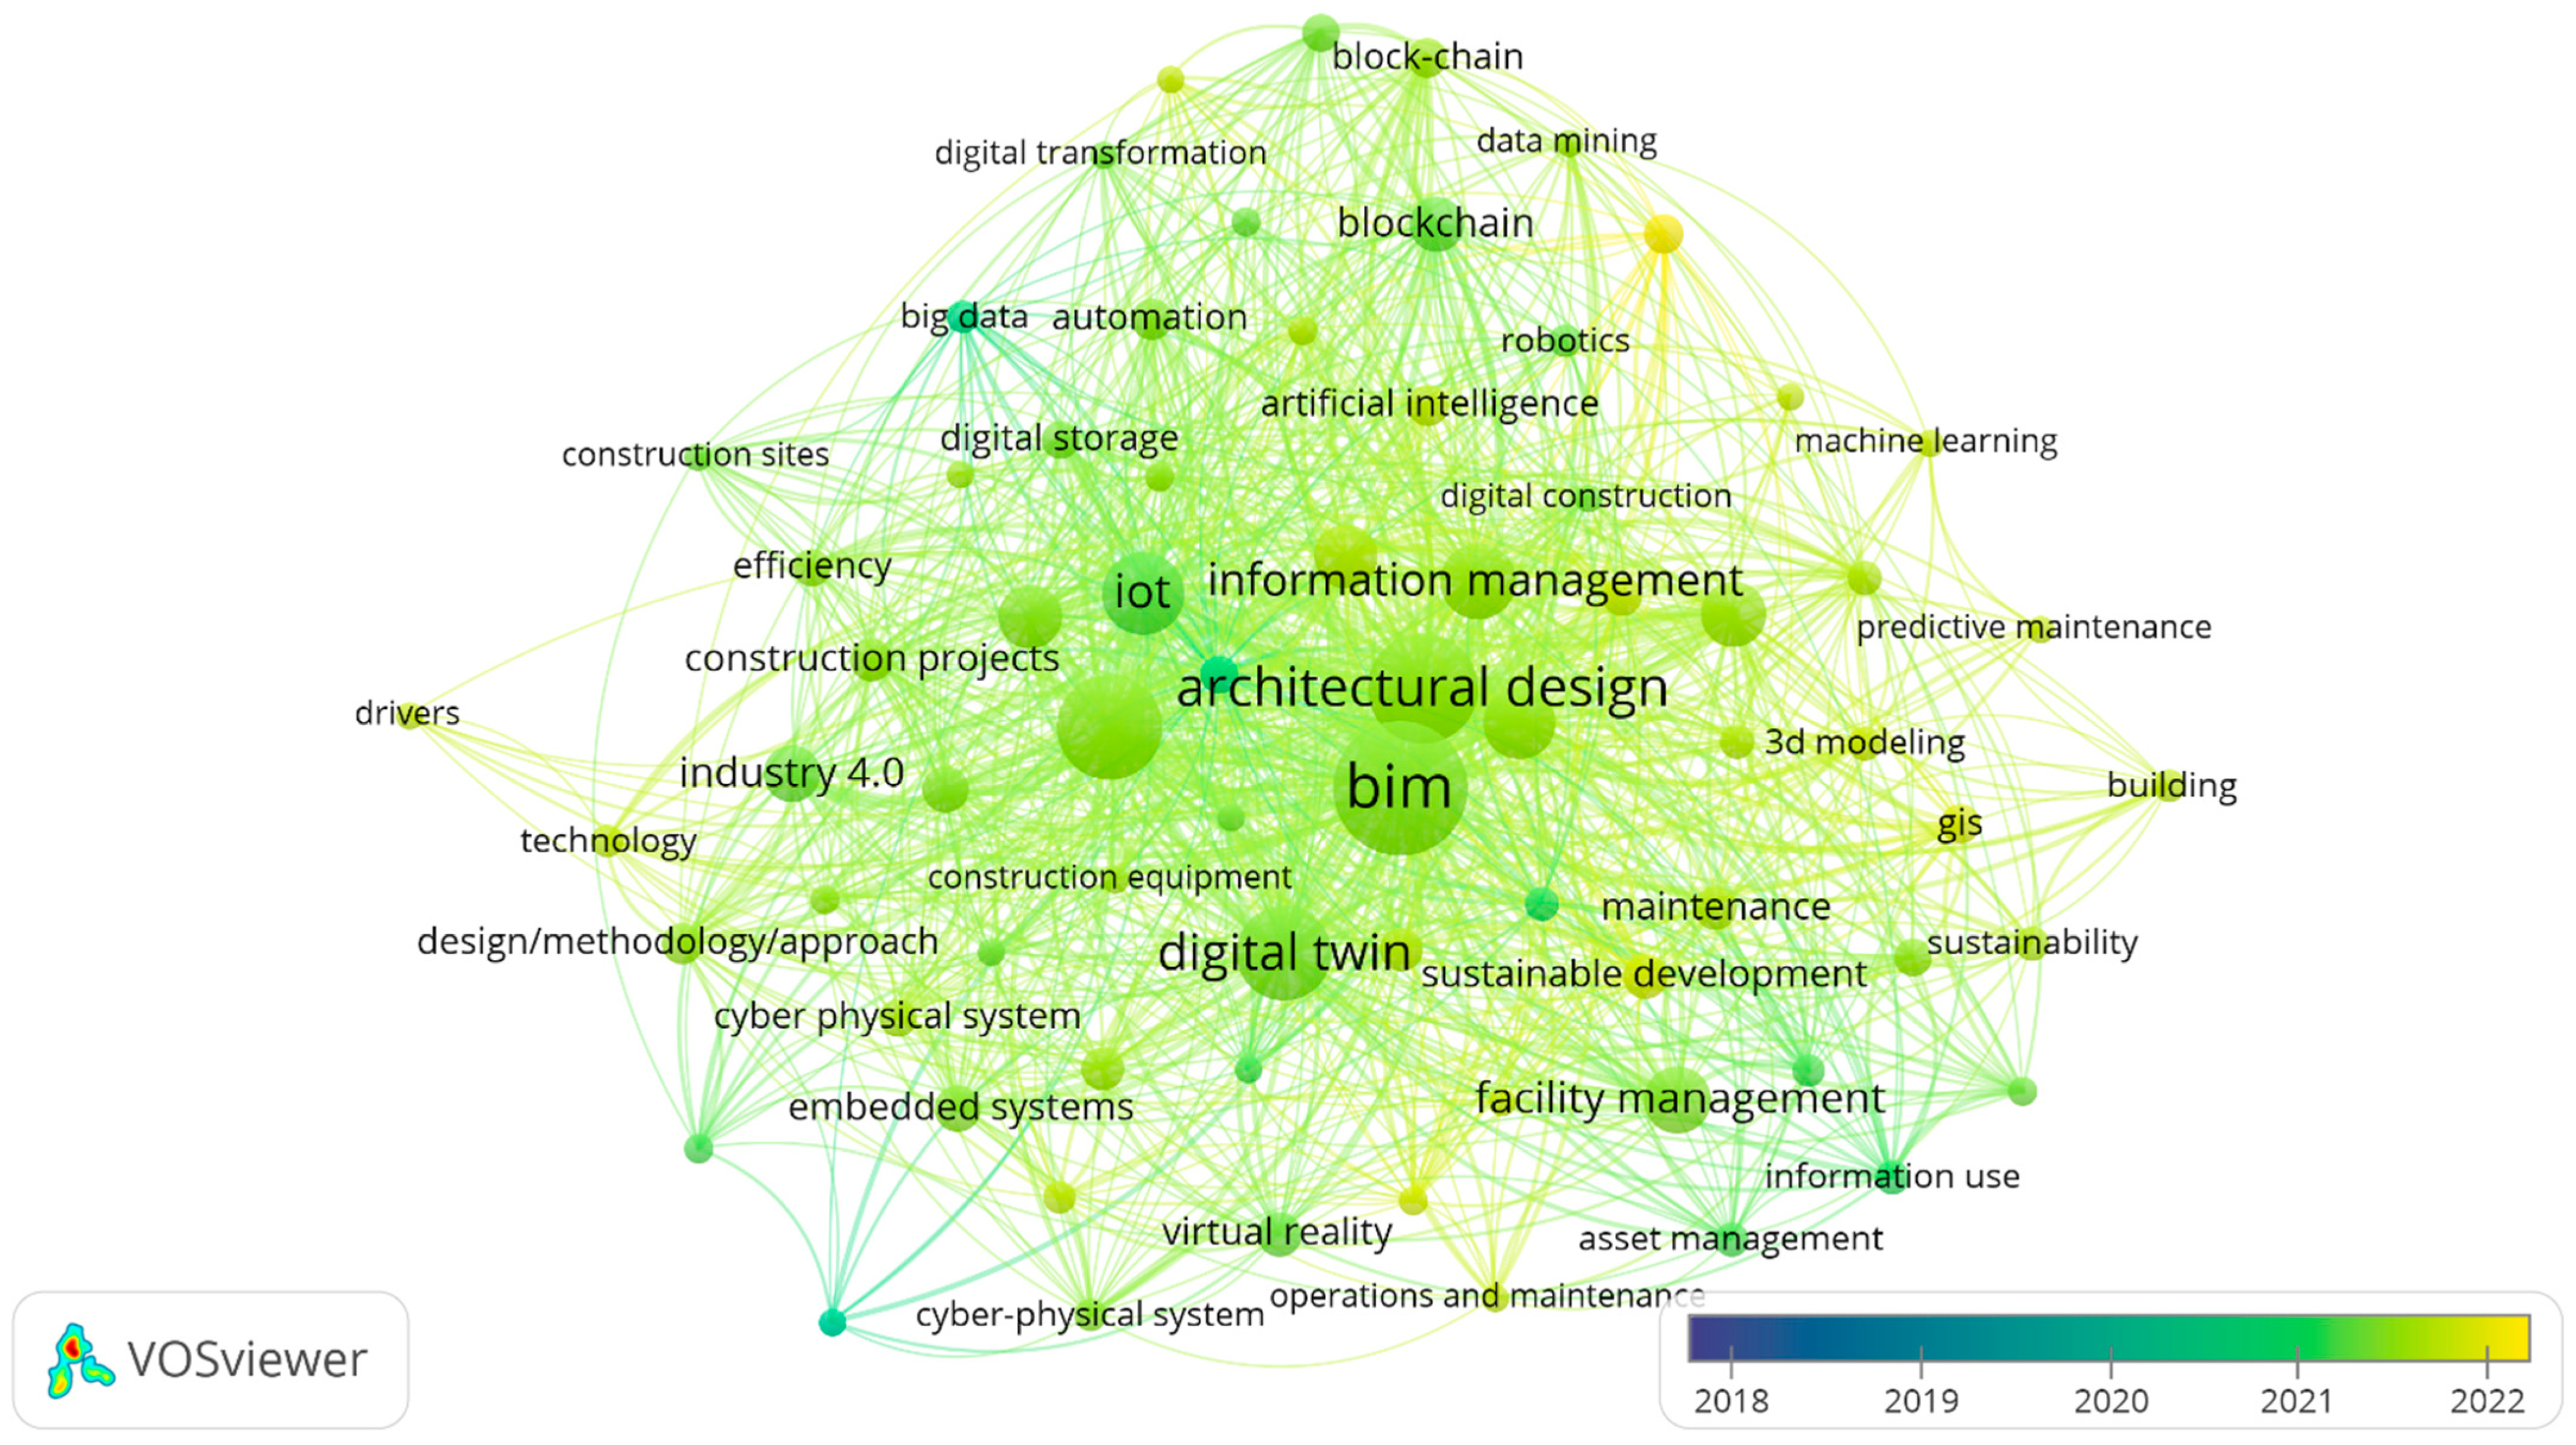
3.6.2. Co-Occurrence Keywords Overlay Visualization

With VOSviewer, an overlay visualization was performed for the individuation of the average publication year of the DB’s material, as shown in Figure 12. The visualization is similar to the network visualization but differs for items’ color [56]. In this case, each item is associated to the color of its average publication year. The map confirms what has been highlighted in Section 3.2.3. with the increase of words’ occurrences in recent years, in particular 2021 and 2022.

3.6.3. Co-Occurrence Keywords’ Density Visualization

With VOSviewer, a density visualization analysis was also performed with the number of links as weight. In this type of visualization, “items are represented by their label in a similar way as in the network visualization and the overlay visualization” [56]. Each point is characterized by colors that go from blue to yellow [56]. If a point is surrounded by a high number of items with a high weight, its color is closer to yellow. On the contrary, if an item is surrounded by few words with a low weight, the color tends to be blue [56]. Figure 13 shows a strong connection between BIM, IoT and DT, all concepts at the base of the transition of the construction sector towards Construction 4.0. These technologies are related to the solution of the issue of management of data that causes loss of efficiency in the project life cycle. In the density map it is present, although with a weak connection; the FM field affirms the attempts to apply these technologies in this sector.

3.7. Thematic Map

A thematic map was created containing authors’ keywords, using Biblioshiny. The thematic map allows to “discriminating the relevance and the development of the discussed issues, highlighting in a given time slice the most debated topics as well as those marginal topics that, in any case, contributed in building the discourse” [72]. It is a map in two dimensions, where the first one is density and the second one is centrality [73]. The density refers to “the degree of development of the themes as measured by the internal associations among the keywords” [73], while centrality stands for “the relevance of the themes as measured by the external associations among the keywords” [73]. The map is composed of four quadrants:
  • The basic themes are in the lower-right quadrant. This quadrant includes not many developed themes but generic ones [74];
  • The motor themes are in the upper-right quadrant. This quadrant includes themes with high centrality and density and are very important and developed for the related subject area [74];
  • The Niche themes are in the upper-left quadrant. This quadrant refers to peripheral themes, which, even if they do not have very high importance, are very specialized and developed internal links [74];
  • The Emerging/declining themes are in the lower-left quadrant. This quadrant includes themes with low centrality and density, but they could evolve in “more transcendental themes in the future” [74].
Figure 14 shows the thematic map of the analyzed DB regarding the authors’ keywords. The circles represent the clusters, whose size is proportional to the number of words included in that cluster [72].
The basic theme quadrant includes BIM, FM and DT, which are important themes but not much developed, together with GIS, smart city, AR, VR and mixed reality.
In the motor themes quadrant words such as “blockchain”, “artificial intelligence” and “smart contract” are present. They are slightly above the relevance degree threshold, so they can be considered highly developed, but with low relevance.
Among the niche themes, positioned in the upper left quadrant, words such as smart city, sustainable building and information management are present. These represent peripheral themes.
The emerging/declining themes include predictive maintenance and smart construction, which could evolve in something more important over time.

4. Conclusions

The FM is a practice that is still stuck with old and inefficient practices, because contracts still require paper documents for building asset information for the operational phase [13]. This is the principal cause for loss information with a consequent increase of the cost connected to O&M phase, in which FM operates [9,11,12]. The resolution of this issue has been the object of study in recent years, specifically finding out how to take advantage of the new technologies that have hit the construction sector in recent years. This paper identifies principal technologies for the FM BIM, IoT and DT. The aim of this paper is to indagate the status of these technologies and their connected trends, besides their application in the FM sector and the authors, sources and countries that are contributing to their research. Firstly, a three-field plot permitted to have an overview on the most productive countries and sources connected to the studied topics. Particularly, a high scientific production was individuated in the UK, Australia and China, as well as from the sources Building, Automation in Construction and Sustainability. The analysis of temporal trends revealed how the number of publications highly increased in recent years, with an annual growth rate of 220.11%.
This increasing trend in scientific production did not match the average citations per year, probably owing to the decrease in international collaboration [37,38], as well as in the authors’ collaboration network analysis (Section 3.2.3.), in which groups are small and have a low degree of collaboration.
The analysis of the words’ dynamics confirmed BIM as the most indagated topic, followed by DT and the increasing interest for the FM area. Other connected themes emerged, such as blockchain, AI, AR, ML and construction industry 4.0. In particular, many studies have shown the potential application of blockchain in FM and is considered both with DT, IoT, AI, AR and others technologies at the base of the digitalization of FM [36]. The analysis of authors revealed that the first ten most productive ones are from the UK, Australia, China, Hong Kong, USA and Norway, a trend that mostly matches the analysis of the countries’ scientific production and most relevant affiliations. The authors’ collaboration network analysis reveals, as anticipated, small research groups with a low degree of collaboration. An analysis of the most cited documents showed that the first three most cited ones are reviews, which are known to be more cited compared to other types of articles [38]. Successively, a source analysis was conducted and enabled to identify the principal sources for the indagated topics. The analysis revealed that the core sources are Automation in Construction, Building, Sustainability and Applied Sciences, with Automation in Construction having the highest number of published documents and the source with the highest impact in the studied field. The country collaboration map shows strong collaboration between China and Hong Kong, China and the UK and the UK and Australia. This pattern can be also captured in the provenience of the members of the research group. Finally, an analysis of the bibliometric networks with the software VOSviewer was conducted. The co-occurrence keywords network analysis showed the presence of five cluster. The first one regarding DT, the second one BIM, the third one construction industry, the fourth one information management and the fifth one FM. The map shows a high level of links between all the clusters. The DT cluster contains words that point out its application in the construction sector; in particular, in the O&M phase. The BIM cluster points out to the importance of information and the use of BIM in this sense, whereas the construction industry cluster evidence the digital transition, in which the sector is headed. In the yellow cluster, the term blockchain is also present, together with the word smart contract, which testify its applications in the construction sector for the information management, together with BIM [68]. The FM’s cluster includes terms such as “predictive maintenance” and “digitalization”, affirming the future direction for the sector. The overlay visualization (Section 3.6.2) matches the trend in word dynamics, with most of the word occurrence in the last two years. Finally, a thematic map analysis was performed, dividing the themes according to their density and relevance degree.
Overall, the study shows increasing interest in the introduction of new technologies in the construction sector, especially in FM. Many efforts have been done to reduce the limits of current FM practice, which are the cause of loss in many aspects of the process, in terms of money and efficiency. The construction sector is shifting towards digitalization pushed from the increase of labor costs and the decrease of the one of technologies [75,76,77].
Furthermore, the paper enables to individuate the major active sources, authors and countries in the sector that can be consulted for further related studies.
Some limitations of the analysis have to be highlighted, starting from the small timespan in which articles are included. This surely testifies how these topics are relatively new and the studies have indagated them only recently. Moreover, the use of only one DB with a query string with a limited number of terms could have affected the content of the DB and exclude some related documents.

5. Future Research

The bibliometric analysis pointed out the technologies that have been gradually introduced to the FM sector in recent years, but a further analysis of their applications is required. In fact, this paper generally covers the themes that are contributing to the digitalization of FM and the actors that are contributing to its study, such as researchers, journals and countries. Future research could focus on the implementation of technologies’ frameworks for enhancing and catalyzing the process of digitalization in FM and offer wider opportunities for their usage.

Author Contributions

Conceptualization, V.V.; methodology, V.V.; software, S.S.; validation, V.V.; formal analysis, S.S.; investigation, V.V. and S.S.; resources, S.S.; data curation, S.S. and V.V.; writing—original draft preparation, S.S. and V.V.; writing—review and editing, V.V.; visualization, S.S. and V.V.; supervision, V.V.; project administration, V.V.; funding acquisition, V.V. All authors have read and agreed to the published version of the manuscript.

Funding

This research was funded by the Italian government, through the PRIN2017 project of the Ministero dell’Istruzione, dell’Università e della Ricerca (MIUR). The project entitled “Distributed Digital Collaboration Framework for Small and Medium-Sized Engineering and Construction Enterprises” is coordinated at the national level by Berardo Naticchia.

Institutional Review Board Statement

Not applicable.

Informed Consent Statement

Not applicable.

Conflicts of Interest

The authors declare no conflict of interest.

References

  1. Tay, L.; Ooi, J.T.L. Facilities management: A ‘Jack of all trades’? Facilities 2001, 19, 357–363. [Google Scholar] [CrossRef]
  2. History. Available online: https://www.ifma.org/about/about-ifma/history/ (accessed on 3 November 2022).
  3. Drion, B.; Melissen, F.; Wood, R. Facilities management: Lost, or regained? Facilities 2012, 30, 254–261. [Google Scholar] [CrossRef]
  4. What Is Facility Management? Available online: https://www.ifma.org/about/what-is-fm/ (accessed on 3 November 2022).
  5. ISO 41011:2017(en), Facility Management—Vocabulary. Available online: https://www.iso.org/obp/ui/#iso:std:iso:41011:ed-1:v1:en (accessed on 3 November 2022).
  6. Yalcinkaya, M.; Singh, V. Building information modeling (BIM) for facilities management—Literature review and future needs; Part of the IFIP International Conference on Product Lifecycle Management. In Product Lifecycle Management for a Global Market; Fukuda, S., Bernard, A., Gurumoorthy, B., Bouras, A., Eds.; Springer: Berlin/Heidelberg, Germany, 2014; pp. 1–10. [Google Scholar]
  7. Roper, K.; Payant, R. The Facility Management Handbook; AMACOM: Noord-Brabant, The Netherlands, 2014. [Google Scholar]
  8. Atkin, B.; Brooks, A. Total Facility Management; John Wiley & Sons: New York, NY, USA, 2021. [Google Scholar]
  9. IFMA. BIM for Facility Managers; John Wiley & Sons: New York, NY, USA, 2013. [Google Scholar]
  10. Wong, J.K.W.; Ge, J.; He, S.X. Digitisation in facilities management: A literature review and future research directions. Autom. Constr. 2018, 92, 312–326. [Google Scholar] [CrossRef]
  11. Guillen, A.J.; Crespo, A.; Gómez, J.; González-Prida, V.; Kobbacy, K.; Shariff, S. Building Information Modeling as Assest Management Tool. IFAC-PapersOnLine 2016, 49, 191–196. [Google Scholar] [CrossRef]
  12. Gallagher, M.P.; O’Conor, A.C.; Dettbarn, J.L., Jr.; Gilday, L.T. Cost Analysis of Inadequate Interoperability in the US Capital Facilities Industry; National Institute of Standards and Technology (NIST): Gaithersburg, MD, USA, 2004; pp. 223–253.
  13. Kelly, G.; Serginson, M.; Lockley, S.; Dawood, N.; Kassem, M. BIM FOR FACILITY MANAGEMENT: A REVIEW AND A CASE STUDY INVESTIGATING THE VALUE AND CHALLENGES. In Proceedings of the 13th International Conference on Construction Applications of Virtual Reality, London, UK, 30–31 October 2013; p. 11. Available online: https://www.researchgate.net/publication/312469604_BIM_for_facility_management_a_review_and_a_case_study_investigating_the_value_and_challenges (accessed on 3 November 2022).
  14. Deng, M.; Menassa, C.C.; Kamat, V.R. From BIM to digital twins: A systematic review of the evolution of intelligent building representations in the AEC-FM industry. ITcon 2021, 26, 58–83. [Google Scholar] [CrossRef]
  15. ISO 29481-1:2010(en), Building Information Modelling—Information Delivery Manual—Part 1: Methodology and Format. Available online: https://www.iso.org/obp/ui/#iso:std:iso:29481:-1:ed-1:v1:en (accessed on 9 November 2022).
  16. Dahanayake, K.C.; Sumanarathna, N. IoT-BIM-based digital transformation in facilities management: A conceptual model. J. Facil. Manag. 2021, 20, 437–451. [Google Scholar] [CrossRef]
  17. Madakam, S.; Lake, V.; Lake, V.; Lake, V. Internet of Things (IoT): A literature review. J. Comput. Commun. 2015, 3, 164. [Google Scholar] [CrossRef] [Green Version]
  18. Mannino, A.; Dejaco, M.C.; Cecconi, F.R. Building information modelling and internet of things integration for facility management—Literature review and future needs. Appl. Sci. 2021, 11, 3062. [Google Scholar] [CrossRef]
  19. Tang, S.; Shelden, D.R.; Eastman, C.M.; Pishdad-Bozorgi, P.; Gao, X. A review of building information modeling (BIM) and the internet of things (IoT) devices integration: Present status and future trends. Autom. Constr. 2019, 101, 127–139. [Google Scholar] [CrossRef]
  20. Seghezzi, E.; Locatelli, M.; Pellegrini, L.; Pattini, G.; Di Giuda, G.M.; Tagliabue, L.C.; Boella, G. Towards an occupancy-oriented digital twin for facility management: Test campaign and sensors assessment. Appl. Sci. 2021, 11, 3108. [Google Scholar] [CrossRef]
  21. Bujari, A.; Calvio, A.; Foschini, L.; Sabbioni, A.; Corradi, A. A Digital Twin Decision Support System for the Urban Facility Management Process. Sensors 2021, 21, 8460. [Google Scholar] [CrossRef] [PubMed]
  22. Digital Twins for IoT Applications—Oracle. 24 November 2018. Available online: https://pdf4pro.com/download/digital-twins-for-iot-applications-oracle-5b4880.html (accessed on 2 December 2022).
  23. Moral-Muñoz: Software Tools for Conducting Bibliometric Analysis in Science: An Up-to-Date Review—Google Scholar. Available online: https://scholar.google.com/scholar_lookup?oi=gsb80&journal_title=Profesional%20de%20la%20informaci%C3%B3n&journal_abbrev=Profesional%20de%20la%20informaci%C3%B3n&issn=1699-2407&author=Jos%C3%A9%20A.%20Moral-Mu%C3%B1oz&author=Enrique%20Herrera-Viedma&author=Antonio%20Santisteban-Espejo&author=Manuel%20J.%20Cobo&title=Software%20tools%20for%20conducting%20bibliometric%20analysis%20in%20science%3A%20An%20up-to-date%20review&language=en&year=2020%2F01%2F19&volume=29&issue=1&doi=10.3145%2Fepi.2020.ene.03&lookup=0&hl=it (accessed on 9 November 2022).
  24. Burnham, J.F. Scopus database: A review. Biomed. Digit. Libr. 2006, 3, 1. [Google Scholar] [CrossRef] [Green Version]
  25. Cantu-Ortiz, F.J. Research Analytics: Boosting University Productivity and Competitiveness through Scientometrics; CRC Press: Boca Raton, FL, USA, 2017. [Google Scholar]
  26. Underwood, S. Blockchain beyond bitcoin. Commun. ACM 2016, 59, 15–17. [Google Scholar] [CrossRef]
  27. Pereira, S.; Nanayakkara, S.; Rodrigo, M.N.N.; Senaratne, S.; Weinand, R. Blockchain technology: Is it hype or real in the construction industry? J. Ind. Inf. Integr. 2020, 17, 100125. [Google Scholar] [CrossRef]
  28. Zheng, Z.; Xie, S.; Dai, H.N.; Chen, X.; Wang, H. Blockchain challenges and opportunities: A survey. Int. J. Web Grid Serv. 2018, 14, 352. [Google Scholar] [CrossRef]
  29. Gunasekara, H.G.; Sridarran, P.; Rajaratnam, D. Effective use of blockchain technology for facilities management procurement process. J. Facil. Manag. 2021, 20, 452–468. [Google Scholar] [CrossRef]
  30. The Past and Future of Blockchain in FM. Available online: http://fmj.ifma.org/article/The+Past+and+Future+of+Blockchain+in+FM/3041474/483818/article.html (accessed on 10 November 2022).
  31. Abioye, S.O.; Oyedele, L.O.; Akanbi, L.; Ajayi, A.; Delgado, J.M.D.; Bilal, M.; Akinade, O.O.; Ahmed, A. Artificial Intelligence in the Construction Industry: A Review of Present Status, Opportunities and Future Challenges. J. Build. Eng. 2021, 44, 103299. [Google Scholar] [CrossRef]
  32. Villa, V.; Bruno, G.; Aliev, K.; Piantanida, P.; Corneli, A.; Antonelli, D. Machine Learning Framework for the Sustainable Maintenance of Building Facilities. Sustainability 2022, 14, 681. [Google Scholar] [CrossRef]
  33. Culot, G.; Nassimbeni, G.; Orez, G.; Sartor, M. Behind the definition of Industry 4.0: Analysis and open questions. Int. J. Prod. Econ. 2020, 226, 107617. [Google Scholar] [CrossRef]
  34. Erboz, G. How To Define Industry 4.0: Main Pillars Of Industry 4.0. In Managerial Trends in the Development of Enterprises in Globalization Era; Slovak University of Agriculture: Nitra, Slovakia, 2017; Available online: https://www.researchgate.net/publication/326557388_How_To_Define_Industry_40_Main_Pillars_Of_Industry_40 (accessed on 3 November 2022).
  35. Sawhney, A.; Riley, M.; Irizarry, J. (Eds.) Construction 4.0: An Innovation Platform for the Built Environment; Routledge: New York, NY, USA, 2020. [Google Scholar]
  36. Lau, W.K.; Ho, K.M.K.; Lam, T.Y.M.; Ma, T.; Chan, H.C.K.; Tsang, C.W.A. Age Composition and Survival of Public Housing Stock in Hong Kong; Thei: Hong Kong, China, 2017; p. 1052. [Google Scholar]
  37. Velez-Estevez, A.; García-Sánchez, P.; Moral-Munoz, J.A.; Cobo, M.J. Why do papers from international collaborations get more citations? A bibliometric analysis of Library and Information Science papers. Scientometrics 2022, 127, 1–39. [Google Scholar] [CrossRef]
  38. Ibanez, A.; Bielza, C.; Larranaga, P. Relationship among research collaboration, number of documents and number of citations: A case study in Spanish computer science production in 2000–2009. Scientometrics 2013, 95, 689–716. [Google Scholar] [CrossRef]
  39. Bibliometric Modeling Processes and the Empirical—ProQuest. Available online: https://www.proquest.com/docview/216894863?pq-origsite=gscholar&fromopenview=true (accessed on 25 October 2022).
  40. Newby, G.B.; Greenberg, J.; Jones, P. Open source software development and Lotka’s Law: Bibliometric patterns in programming. J. Am. Soc. Inf. Sci. Technol. 2003, 54, 169–178. [Google Scholar] [CrossRef]
  41. Engqvist, L.; Frommen, J.G. The h-index and self-citations. Trends Ecol. Evol. 2008, 23, 250–252. [Google Scholar] [CrossRef] [PubMed] [Green Version]
  42. Ball, P. Achievement index climbs the ranks. Nature 2007, 448, 737. [Google Scholar] [CrossRef]
  43. Egghe, L. An Improvement of the h-Index: The g-Index; ISSI: Leuven, Belgium, 2006; p. 4. [Google Scholar]
  44. Dinis-Oliveira, R.J. The H-index in Life and Health Sciences: Advantages, Drawbacks and Challenging Opportunities. Curr. Drug Res. Rev. 2019, 11, 82–84. [Google Scholar] [CrossRef]
  45. Costas, R.; Bordons, M. Is g-index better than h-index? An exploratory study at the individual level. Scientometrics 2008, 77, 267–288. [Google Scholar] [CrossRef] [Green Version]
  46. Kelly, C.D.; Jennions, M.D. The h index and career assessment by numbers. Trends Ecol. Evol. 2006, 21, 167–170. [Google Scholar] [CrossRef]
  47. Batista, P.D.; Campiteli, M.G.; Kinouchi, O. Is it possible to compare researchers with different scientific interests? Scientometrics 2006, 68, 179–189. [Google Scholar] [CrossRef]
  48. Egghe, L. Theory and practise of the g-index. Scientometrics 2006, 69, 131–152. [Google Scholar] [CrossRef]
  49. Sidiropoulos, A.; Katsaros, D.; Manolopoulos, Y. Generalized Hirsch h-index for disclosing latent facts in citation networks. Scientometrics 2007, 72, 253–280. [Google Scholar] [CrossRef] [Green Version]
  50. Aithal, S. Comparative Study of Various Research Indices used to measure quality of Research Publications. Int. J. Appl. Adv. Sci. Res. 2017, 2, 81–89. [Google Scholar] [CrossRef]
  51. Boje, C.; Guerriero, A.; Kubicki, S.; Rezgui, Y. Towards a semantic Construction Digital Twin: Directions for future research. Autom. Constr. 2020, 114, 103179. [Google Scholar] [CrossRef]
  52. Pan, Y.; Zhang, L. Roles of artificial intelligence in construction engineering and management: A critical review and future trends. Autom. Constr. 2021, 122, 103517. [Google Scholar] [CrossRef]
  53. Patra, S.K.; Bhattacharya, P.; Verma, N. Bibliometric Study of Literature on Bibliometrics. DESIDOC Bull. Inf. Technol. 2006, 26, 27–32. [Google Scholar] [CrossRef]
  54. Alabi, G. Bradford’s law and its application. Int. Libr. Rev. 1979, 11, 151–158. [Google Scholar] [CrossRef]
  55. Nash-Stewart, C.E.; Kruesi, L.M.; Del Mar, C.B. Does Bradford’s Law of Scattering predict the size of the literature in Cochrane Reviews? J. Med. Libr. Assoc. 2012, 100, 135–138. Available online: https://www.ncbi.nlm.nih.gov/pmc/articles/PMC3324807/ (accessed on 26 October 2022). [CrossRef] [Green Version]
  56. Van Eck, N.J.; Waltman, L. VOSviewer Manual; Univeristeit Leiden: Leiden, The Netherlands, 2013; Volume 1, pp. 1–53. [Google Scholar]
  57. Van Eck, N.J.; Waltman, L. Software survey: VOSviewer, a computer program for bibliometric mapping. Scientometrics 2009, 84, 523–538. [Google Scholar] [CrossRef] [Green Version]
  58. Van Eck, N.J.; Waltman, L. VOS: A new method for visualizing similarities between objects. In Advances in Data Analysis; Decker, R., Lenz, H.-J., Eds.; Springer: Berlin/Heidelberg, Germany, 2007; pp. 299–306. [Google Scholar]
  59. Rasheed, A.; San, O.; Kvamsdal, T. Digital Twin: Values, Challenges and Enablers From a Modeling Perspective. IEEE Access 2020, 8, 21980–22012. [Google Scholar] [CrossRef]
  60. Tao, F.; Qi, Q.; Wang, L.; Nee, A.Y.C. Digital Twins and Cyber—Physical Systems toward Smart Manufacturing and Industry 4.0: Correlation and Comparison. Engineering 2019, 5, 653–661. [Google Scholar] [CrossRef]
  61. Gamayunova, O.; Vatin, N. BIM-Technology in Architectural Design. Adv. Mater. Res. 2014, 1065–1069, 2611–2614. [Google Scholar] [CrossRef]
  62. BIM Definitions. [Online]. Available online: https://www.ace-cae.eu/fileadmin/New_Upload/3._Area_2_Practice/BIM/Other_Docs/1_S.Mordue_Definition_of_BIM_01.pdf (accessed on 24 October 2022).
  63. Azhar, S.; Brown, J.; Farooqui, R. BIM-based Sustainability Analysis: An Evaluation of Building Performance Analysis Software. In Proceedings of the 45th ASC Annual Conference, Gainesville, FL, USA, 1–4 April 2009; p. 10. [Google Scholar]
  64. Forcael, E.; Ferrari, I.; Opazo-Vega, A.; Pulido-Arcas, J.A. Construction 4.0: A literature review. Sustainability 2020, 12, 9755. [Google Scholar] [CrossRef]
  65. Li, J.; Kassem, M. Applications of distributed ledger technology (DLT) and Blockchain-enabled smart contracts in construction. Autom. Constr. 2021, 132, 103955. [Google Scholar] [CrossRef]
  66. ARUP. Blockchain Technology. Available online: https://www.arup.com/perspectives/publications/research/section/blockchain-technology (accessed on 11 November 2022).
  67. Ganter, M.; Lützkendorf, T. Information management throughout the life cycle of buildings—Basics and new approaches such as blockchain. IOP Conf. Ser. Earth Environ. Sci. 2019, 323, 012110. [Google Scholar] [CrossRef] [Green Version]
  68. Liu, Z.; Chi, Z.; Osmani, M.; Demian, P. Blockchain and building information management (BIM) for sustainable building development within the context of smart cities. Sustainability 2021, 13, 2090. [Google Scholar] [CrossRef]
  69. Li, J.; Greenwood, D.; Kassem, M. Blockchain in the built environment and construction industry: A systematic review, conceptual models and practical use cases. Autom. Constr. 2019, 102, 288–307. [Google Scholar] [CrossRef]
  70. Cheng, J.C.P.; Chen, W.; Chen, K.; Wang, Q. Data-driven predictive maintenance planning framework for MEP components based on BIM and IoT using machine learning algorithms. Autom. Constr. 2020, 112, 103087. [Google Scholar] [CrossRef]
  71. Lee, J.Y.; Irisboev, I.O.; Ryu, Y.-S. Literature Review on Digitalization in Facilities Management and Facilities Management Performance Measurement: Contribution of Industry 4.0 in the Global Era. Sustainability 2021, 13, 13432. [Google Scholar] [CrossRef]
  72. Aria, M.; Cuccurullo, C.; D’Aniello, L.; Misuraca, M.; Spano, M. Thematic Analysis as a New Culturomic Tool: The Social Media Coverage on COVID-19 Pandemic in Italy. Sustainability 2022, 14, 3643. [Google Scholar] [CrossRef]
  73. Language and Communication in International Students’ Adaptation: A Bibliometric and Content Analysis Review. Available online: https://www.researchgate.net/publication/361965772_Language_and_communication_in_international_students%27_adaptation_a_bibliometric_and_content_analysis_review/figures?lo=1&utm_source=google&utm_medium=organic (accessed on 26 October 2022).
  74. The Organizational Commitment in the Company and Its Relationship with the Psychological Contract. Available online: https://www.researchgate.net/publication/348479945_The_Organizational_Commitment_in_the_Company_and_Its_Relationship_With_the_Psychological_Contract/figures?lo=1&utm_source=google&utm_medium=organic (accessed on 26 October 2022).
  75. Elghaish, F.; Matarneh, S.; Talebi, S.; Kagioglou, M.; Hosseini, M.R.; Abrishami, S. Toward digitalization in the construction industry with immersive and drones technologies: A critical literature review. Smart Sustain. Built Environ. 2020, 10, 345–363. [Google Scholar] [CrossRef]
  76. Golizadeh, H.; Hon, C.K.H.; Drogemuller, R.; Hosseini, M.R. Digital engineering potential in addressing causes of construction accidents. Autom. Constr. 2018, 95, 284–295. [Google Scholar] [CrossRef]
  77. Newman, C.; Edwards, D.; Martek, I.; Lai, J.; Thwala, W.D.; Rillie, I. Industry 4.0 deployment in the construction industry: A bibliometric literature review and UK-based case study. Smart Sustain. Built Environ. 2021, 10, 557–580. [Google Scholar] [CrossRef]
Figure 1. Methodology followed for the bibliometric analysis.
Buildings 13 00015 g001
Figure 2. Three-field plot with, starting from the left side, sources, keywords and countries, performed with Biblioshiny version 4.0.
Buildings 13 00015 g002
Figure 3. Annual scientific production analysis, performed with Biblioshiny version 4.0.
Buildings 13 00015 g003
Figure 4. Average citation per year, performed with Biblioshiny version 4.0.
Buildings 13 00015 g004
Figure 5. Words’ dynamics through time performed with Biblioshiny version 4.0.
Buildings 13 00015 g005
Figure 6. Lotka’s law for authors’ productivity, performed with Biblioshiny version 4.0.
Buildings 13 00015 g006
Figure 7. Collaboration network analysis, performed with Biblioshiny version 4.0.
Buildings 13 00015 g007
Figure 8. Source clustering according to Bradford’s law, performed with Biblioshiny version 4.0.
Buildings 13 00015 g008
Figure 9. Sources’ articles publication by year analysis, performed with Biblioshiny version 4.0.
Buildings 13 00015 g009
Figure 10. Countries’ collaboration map analysis performed with Biblioshiny version 4.0.
Buildings 13 00015 g010
Figure 11. Co-occurrence keywords network map analysis performed with VOSviewer.
Buildings 13 00015 g011
Figure 12. Co-occurrence network map temporal overlay performed with VOSviewer.
Buildings 13 00015 g012
Figure 13. Items’ link density visualization performed with VOSviewer.
Buildings 13 00015 g013
Figure 14. Thematic map analysis performed with Biblioshiny version 4.0.
Buildings 13 00015 g014
Table 1. Bibliometric analysis tools features comparison based on [23].
Type of AnalysisMap Visualization
Bibliometric Analysis ToolsAuthorsThematicReferenceEvolutionSpectrogramGeospatialNetworkClusterGeographical OverlappingDensityOverlayTemporal
Bibexcel
Biblioshiny
Bibliomaps
CiteSpace
CitNetExplorer
SciMAT
Sci2 Tool
VOSviewer
Table 2. Data cleaning: list of synonyms.
TopicSynonymsNormalized Term
Building information modellingbim, building information modeling (bim), building information modelling (bim), building information modelling, building information modeling, BIM (BIM)bim
Facility Managementfm, facilities management, construction management, asset managementfm
Internet of Thingsiot, internet of things (IOT), internet of things, internet of thingiot
Digital Twindt, digital twins, digital twindt
Virtual realityvirtual reality (vr), virtual realityvr
augmented realityaugmented reality, augmented reality (ar)ar
digitalizationDigitalisation, digitalizationdigitalization
Smart contractsmart contracts, smart contractsmart contract
Smart buildingSmart building, smart buildings, smart constructionSmart building
Construction industryconstruction sector, construction, construction industryconstruction industry
Table 3. Dataset information.
Dataset Information
Total number of documents220
Timespan2018:2022
Sources76
Average citations per document9.49
Document type
Article122
Review67
Conference paper25
Book4
Book chapter1
Editorial1
Authors
Number of authors675
Authors of single-authored docs15
Authors’ collaboration
Single-authored documents16
Co-authors per document3.69
Document contents
Keywords Plus1216
Author’s Keywords657
Table 4. Most relevant authors analysis performed with Biblioshiny version 4.0.
AuthorsCountryDocuments
Edwards D.J.UK6
Chileshe N.Australia4
Elghaish F.UK4
Li H. Hong Kong4
Liu Y. Hong Kong4
Liu Z. China4
Xu Y. China4
Anumba C.J.USA3
Chen C. China3
Hosamo H.H. Norway3
Table 5. Pros and Cons of H-index, G-index and M-index.
IndexProsCons
H-index
  • Measures quantity and impact with a single indicator [45]
  • It is not affected by extreme values, “such as uncited papers or highly cited papers” [45]
  • It is affected by the “length of the scientific career” [45], penalizing newcomers [46]
  • Does not consider the number of co-authors [45,47]
  • Not sensible to highly cited papers [45,48]
  • Incapability “to differentiate clearly between active and inactive scientists” [45,49]
G-index
  • “It takes into account the weight of the citations received by the top articles of a scientist” [45]
  • “The total number of documents does not limit the value of the index” [45]
  • Susceptible to extreme values such has occasional highly cited documents [45]
M-index
  • Improves and normalizes the H-index [50]
  • “Includes the number of years research as the third variable” [50]
  • “Averages the low and high citations received during the long period of the career” [50]
  • “averages periods of high and low productivity throughout a career, which may or may not be reflective of the current situation of the scientist” [50]
Table 6. Authors’ impact analysis performed with Biblioshiny version 4.0.
AuthorsH-IndexG-IndexM-IndexTotal CitationNumber of PublicationsStart of the Publication Years
Edwards D.J.561.66712762020
Chileshe N.341.53142021
Munoz-La Rivera F.331.54432021
Olanrewaju O.I.331.53032021
Pan Y.331.524832021
Sepasgozar S.331.54332021
Xu Y.331.51542021
Zhang L.331.524832021
Akanbi L.2215322021
Ali K.N.220.58822019
Table 7. Most cited documents analysis performed with Biblioshiny version 4.0.
PaperTotal CitationsTotal Citations per YearNormalized Total Citations
Boje C., 2020, Automation in construction20668.678.32
Pan Y., 2021, Automation in construction -a-b14472.0011.26
Wong J.K.W., 2018, Automation in construction10020.001.00
Pan Y., 2021, Automation in construction -a8542.506.65
Maskury R., 2019, Applied sciences (Switzerland)7919.752.51
Love Ped, 2019, Automation in construction5814.501.84
Hunag M.Q., 2021, Tunnelling and Underground Space technology5326.504.15
Forcael E., 2020, Sustainability (Switzerland)4916.331.98
Opoku D-GJ, 2021, Journal of Building Engineering4723.503.68
Ghosh A., 2021, Engineering, Construction and Architectural Management4020.003.13
Table 8. Most relevant sources.
SourceNumber of Documents
Automation in Construction31
Buildings20
Sustainability
Applied Sciences
19
11
Engineering, Construction and Architectural Management9
Journal of Information Technology in Construction8
Smart and Sustainable Built Environment7
Construction Innovation6
Advances in Civil engineering
IEEE Access
5
5
Table 9. Sources’ impact analysis, performed with Biblioshiny version 4.0.
SourcesH-IndexG-IndexM-IndexTotal CitationNumber of DocumentsStart of the Publication Years
Automation in construction11282.2812312018
Sustainability7132.333188192020
Applied Sciences6111.5162112019
Buildings69395202021
Engineering, construction and architectural management4827092021
Journal of building engineering4529652021
Journal of information technology in construction481.3338582020
Advanced engineering informatics331.52132021
Advances in civil engineering3512552020
Archives of computational methods in engineering331.55832021
Table 10. Scientific production per country, performed with Biblioshiny version 4.0.
CountryNumber of Documents
China64
UK56
Australia
Italy
54
32
USA31
Malaysia25
Spain19
New Zealand10
Norway
Portugal
9
9
Table 11. Most relevant affiliations analysis performed with Biblioshiny version 4.0.
AffiliationsCountryNumber of Documents
University of JohannesburgSouth Africa7
Birmingham City UniversityUK6
Shenzhen UniversityChina6
University of South AustraliaAustralia6
Western Sidney UniversityAustralia6
Deakin UniversityAustralia6
Northumbria UniversityUK5
The University of Hong KongHong Kong5
University of FloridaUSA5
Universitat Politecnica de CatalunyaSpain5
Disclaimer/Publisher’s Note: The statements, opinions and data contained in all publications are solely those of the individual author(s) and contributor(s) and not of MDPI and/or the editor(s). MDPI and/or the editor(s) disclaim responsibility for any injury to people or property resulting from any ideas, methods, instructions or products referred to in the content.

