Article

Purification of Two Taxanes from Taxus cuspidata by Preparative High-Performance Liquid Chromatography

College of Biological and Agricultural Engineering, Jilin University, Changchun 130022, China
*
Author to whom correspondence should be addressed.
Separations 2022, 9(12), 446; https://doi.org/10.3390/separations9120446
Submission received: 9 November 2022 / Revised: 9 December 2022 / Accepted: 13 December 2022 / Published: 16 December 2022
(This article belongs to the Special Issue Chromatography-Mass Spectrometry Technology Research)

Abstract

:
In the present study, an effective method of preparative high-performance liquid chromatography (Prep-HPLC) was established to purify two taxanes in Taxus cuspidata. During the experimental operation, the effects of flow rate, injection volume, and column temperature on the purity of 10-deacetyltaxol (10-DAT) and paclitaxel (PTX) were investigated, and the optimized conditions were as follows: flow rate of 10 mL/min, injection volume of 0.5 mL, and column temperature of 30 °C. Under these conditions, the purity of 10-DAT and PTX reached 95.33% and 99.15%, respectively. The purified products were characterized by scanning electron microscopy (SEM), high-performance liquid chromatography (HPLC), and electrospray ionization-high resolution mass spectrometry (ESI-HRMS). The results demonstrated that preparative HPLC can effectively purify 10-DAT and PTX from Taxus cuspidata with a purity of >95%, which was suitable for the large-scale preparation of 10-DAT and PTX.

1. Introduction

Taxus belongs to the Taxus genus of Taxaceae [1,2,3,4]. It is mainly distributed in warm and subtropical areas of the northern hemisphere and is an evergreen tree or shrub. It is a national first-class protected plant with a history of 2.5 million years, and it is a natural rare anticancer plant that is endangered in the world [5,6,7,8]. Taxus is known as a “living fossil of plants” and a “national treasure”. Paclitaxel extracted from Taxus is an internationally recognized anticancer drug, with a market price of more than 10 million dollars per kilogram [9,10,11]. The content of paclitaxel can be determined by high-performance liquid chromatography (HPLC) [12,13]. Because of its anticancer effects and unique anticancer mechanism, several countries are competing to carry out resource science, biotransformation, and artificial synthesis, and obtain precursor products [14,15,16].
Taxus cuspidata is a species of Taxus plant [17]. As well as paclitaxel, Taxus cuspidata also contains other taxane diterpenoids [18,19,20,21], such as 10-deacetyltaxol (10-DAT) and cephalomannine. However, Taxus cuspidata has complex components and a low content of taxanes, which makes it difficult to separate and purify [22,23,24]. Furthermore, taxanes are unstable in structure and are easily affected by acidic and alkali conditions and temperature, resulting in isomerization and degradation [25]. In addition, due to the similar structures of taxanes, it is difficult to separate and purify taxanes [26,27]. Therefore, the effective separation and purification of taxanes from Taxus cuspidata have important research significance. Among the purification methods of taxanes, the most commonly used are column chromatography, macroporous resin, molecular imprinting, recrystallization, and chromatography [28,29,30,31,32,33,34,35]. Preparative high-performance liquid chromatography (Prep-HPLC) is a liquid chromatography preparation method that uses a high pressure and large flow liquid conveying system to separate samples with high purity on a high-resolution, large-inner-diameter, and high-load separation column [36,37,38]. The product separated by this method is far superior to that obtained by the traditional preparation method in terms of purity, recovery rate, and separation efficiency, so it is widely used in pharmaceutical research and production [39].
Preparative HPLC (Prep-HPLC) is a physical performance testing instrument used in the fields of biology and chemical engineering. According to the load of the sample to be separated, preparative HPLC can be divided into two types: research and development type, and industrial production type [40]. Research-type preparative HPLC belongs to laboratory-scale preparative separation, with sample sizes from micrograms to grams. The separated samples are generally used for biological activity tests, structure identification, and as standard samples. The economic benefit is not the primary consideration in this kind of chromatography, and the requirements for instruments and devices are not difficult to meet. Any instrument that achieves the desired separation goal can be used [41]. For industrial preparative HPLC, economic benefit is the core factor in the purification process, and the amount of purified samples ranges from kg to ton. These two kinds of preparative HPLC are also quite different in their column design. The design, packing, and operation of chromatographic columns used for experimental-scale preparative separation are basically the same as those of common analytical columns, and their internal diameter is generally 10–50 mm, but the internal diameter of preparative columns used for mass production is usually larger than 50 mm. In order to obtain high-efficiency columns, their column types and structures are different from those of the former, and the requirements for packing and packing technology are higher [42].
The structure of preparative high-performance liquid chromatography (Prep-HPLC) is the same as that of the analytical type, but the pump flow rate is larger, and the sample volume is larger. Before preparative HPLC, analytical HPLC experiments are often carried out, and the analytical methods are optimized and applied to preparative HPLC. Generally, it takes the following three steps to enlarge and optimize the analytical method to achieve the preparation method: (1) optimizing the selectivity of the analytical method, (2) carrying out excessive sample loading on the analytical column, and (3) enlarging the preparation column. At present, the operating parameters of each process from analysis to control are optimized mainly by the principle of linear amplification [43,44].
Preparative high-performance liquid chromatography (Prep-HPLC) has the characteristics of high speed and efficiency and high purity of the purified products. Adding a white fraction collector after the detector gives the characteristics of a high column efficiency, high flow rate, and short separation time [45,46,47]. It is suitable for the efficient purification and preparation of taxanes.
Wu et al. established a rapid and stable method for the preparation of six isoflavones in Iris tectorum alcohol extract by macroporous resin column chromatography and preparative high-performance liquid chromatography (Prep-HPLC). After separation by macroporous resin, the content of total flavonoids in crude extract increased from 10.60% to 54.20%, and the recovery rate was 75.12%. Subsequently, the extract was purified by preparative high-performance liquid chromatography and identified by analytical high-performance liquid chromatography and mass spectrometry. The purity of the extract was more than 82.2%. The established method could be used to prepare an effective amount of pure isoflavones from iris tectorum [48].
Li et al. used HPD-300 resin combined with preparative HPLC to separate high-purity spinosad from Ziziphus jujuba seeds. After preparative HPLC separation and recrystallization, the purity of spinosad reached over 98% and the recovery rate was 72.6%. This method is effective and suitable for the large-scale preparation of spinosad [49].
Arzanlou et al. established a semi-preparative HPLC method to purify allicin from garlic extract. The results showed that semi-preparative HPLC produced an obvious peak with a retention time of 12.28 min. The purity (≥95%) and biological activity of purified allicin were equivalent to those of standard allicin. This method can be used to purify allicin in large quantities from garlic extract [50].
As far as we know, the structural detection methods of taxanes include mass spectrometry, nuclear magnetic resonance (NMR), and matrix-assisted laser desorption time-of-flight mass spectrometry [51]. Among them, mass spectrometry is an analytical method to measure the charge–mass ratio of ions, which can be used to analyze isotopic composition, organic structure, and elemental composition. Mass spectrometry can provide abundant structural information in one analysis, and the combination of separation technology and mass spectrometry is a breakthrough in the scientific method of separation. Although there are many kinds of drugs determined by HPLC, the qualitative reliability is poor. However, mass spectrometry is accurate and rapid with only a few samples without complicated pretreatment. Mass spectrometry has been widely used in food, biology, environment, biopharmaceuticals, and other fields. It is expected that mass spectrometry will become the most powerful tool for drug detection [52]. Electrospray ionization-high resolution mass spectrometry (ESI-HRMS) is one of the main techniques of mass spectrometry. Its advantages are rapidness, high sensitivity, strong matrix tolerance, etc. It has been applied to detect polyphenols and amino acids in honey [53], novel fentanyl analogs [54], and the speciation distribution of molybdate and halides (Cl, F, and Br) in interaction [55].
This study aimed to establish an efficient purification method of two taxanes from Taxus cuspidata. Our data demonstrated that the orthogonal experimental design verified the reliability of the preparative high-performance liquid chromatography (Prep-HPLC). The purified products were characterized by scanning electron microscopy (SEM), high-performance liquid chromatography (HPLC), and electrospray ionization-high resolution mass spectrometry (ESI-HRMS). The results showed that preparative high-performance liquid chromatography can effectively purify 10-DAT and PTX from Taxus cuspidata with complex components, with a purity of more than 95%.

2. Materials and Methods

2.1. Materials and Reagents

Taxus cuspidata needles were plucked from a ten-year-old Taxus cuspidata specimen planted in the experimental field of the College of Biological and Agricultural Engineering, Jilin University (Jilin, China).
Mass-spectrum acetonitrile and mass-spectrum methanol were purchased from American Tedia Company (Cincinnati, OH, USA), ethanol (National Pharmaceutical Group Chemical Reagents Co., Ltd., analytically pure, Beijing, China), and purified water were produced by Hangzhou Wahaha Company (Hangzhou, China). Paclitaxel (PTX) and 10-deacetyltaxol (10-DAT) with purity ≥98% (Shanghai Yuanye Technology Co., Ltd., Shanghai, China) were used.

2.2. Ultrasonic Extraction Experiment

The needles of Taxus cuspidata were dried in an oven at 40 °C to constant weight, fully ground, and then mixed with the extractant of ethanol solution. According to Zhang et al., the liquid-to-solid ratio was 20.88:1 [56]. Then, we set the parameters according to the experimental scheme, including the ultrasonic power and ultrasonic time of the ultrasonic crusher [56]. Under this process, taxanes were extracted from Taxus cuspidata powder into the extractant. Finally, the product was collected for centrifugal separation, the supernatant in the centrifuge tube was poured into a rotary evaporator to be evaporated to dryness, the volume was fixed with methanol, and it was then filtered through a 0.22 μm organic microporous membrane as a sample pretreatment solution. Determination of taxane yields was by HPLC.

2.3. Separation of Taxanes by HPLC

According to Zhang et al. [57], the yields of the two taxanes in the extract were quantified by high-performance liquid chromatography (HPLC, UltiMate 3000 Separations Module, Waltham, MA, USA). The gradient elution procedure was set as follows: Inertsil ODS-3 C18 column (250 mm × 4.6 mm, 5 μm); column temperature 30 °C. The detection wavelength was 227 nm; the flow rate was 0.8 mL/min; the injection volume was 10 μL; mobile phase A was purified water and B was acetonitrile. The gradient elution procedure was as follows: B increased from 40% to 50% at 0–10 min, and B increased from 50% to 53% at 10–13 min. B increased from 53% to 73% at 13–25 min, and at 25–30 min, B decreased from 73% to 40% for 10 min.
To generate the mixed standard curve, a total of 10 mg of paclitaxel and 10-DAT standard were accurately weighed and dissolved in methanol to a constant volume of 10 mL. Then, the samples were diluted with methanol to prepare solutions with different concentration gradients. The peak areas of standard solutions with different concentrations were measured by HPLC at 227 nm, and the high-performance liquid standard curves of two standards were drawn with the peak area as the ordinate and the standard concentration as the abscissa. The concentrations of two taxanes were calculated using the calibration curves (the concentration range of the calibration curves was 1.25–125 μg/mL). The total yields of the two main taxanes of Taxus cuspidata were calculated as follows:
Taxane yields = C × V/W
where C (μg/mL) is the total content of two main taxanes, V (mL) is the volume of extraction solution recovered, and W (g) is the weight of Taxus cuspidata.

2.4. Purification Experiment of Preparative HPLC

Preparative HPLC [58] (Hanbon Sci&Tech, Hangzhou, China) was used to collect two taxanes in Taxus cuspidata extract. The gradient elution procedure was set as follows: Hedera ODS-2 C18 column (250 mm × 20 mm, 5 μm, detection wavelength 227 nm). Then, according to the experimental scheme (single-factor and orthogonal experiments scheme), the parameters were set, including flow rate, injection volume, and column temperature. Mobile phase A was purified water and B was acetonitrile. Gradient elution procedure: B increased from 40% to 50% at 0–10 min, and B increased from 50% to 53% at 10–13 min. B increased from 53% to 73% at 13–25 min, and at 25–30 min, B decreased from 73% to 40% for 10 min.
Taxanes purity = Taxane   yields   in   T a x u s   c u s p i d a t a T a x u s   c u s p i d a t a   total   amount   ×   100 %
Recovery   rate   of   taxanes = Taxane   yields   after   purification Taxane   yields   before   purification   ×   100 %

2.5. Single-Factor Experiments

As the two taxanes purity of Taxus cuspidata may be influenced by various factors, single-factor experiments were designed and carried out. The following factors, including flow rate, injection volume, and column temperature, were set according to the purity of the two products. The experimental range of different factors used in this study was: flow rate = 5–15 mL/min, injection volume = 0.5–2.5 mL (the extract concentration of Taxus cuspidata was 20 mg/mL), and column temperature = 20–40 °C.

2.6. Orthogonal Experimental Design

Three factors, flow rate (X1), injection volume (X2), and column temperature (X3), were selected as the dependent variables in the single-factor experiments, and the taxanes purity was used for the orthogonal experimental design [59].
The data-processing system of IBM SPSS Statistics 26 was used for data statistics, and curve-fitting was performed using the Origin Pro 2021 software.

2.7. SEM

The microstructures of the two purified products were observed by the Sigma300 ultralow-temperature scanning electron microscope (Oberkochen, Germany). We took a small amount of purified product, dropped it on the silicon wafer, dried it, placed it on the conductive adhesive, sprayed gold by ion sputtering, and observed and took photographs by scanning electron microscopy [60].

2.8. ESI-HRMS

Waters Xevo G3 QTOF electrospray ionization-high resolution mass spectrometry (ESI-HRMS, Milford, MA, USA) was used to identify the purified product [61], and the gradient elution procedure was set as follows: Agilent ZORBAX RRHD SB-C18 column (100 mm × 2.1 mm, 1.8 μm, column temperature 30 °C). The detection wavelength was 227 nm. The constant flow rate was 0.8 mL/min, the injection volume of the sample was 5 μL, mobile phase A was purified water, and B was acetonitrile. Gradient elution procedure: B increased from 40% to 50% at 0–10 min, and B increased from 50% to 53% at 10–13 min. B increased from 53% to 73% at 13–25 min, and at 25–30 min, B decreased from 73% to 40% for 10 min, which was consistent with HPLC. Mass spectrometry electrospray ionization source (ESI), in positive ion mode: mass scanning range: m/z 100–1500; spray voltage: 3500 V; ion source temperature: 350 °C.

3. Results

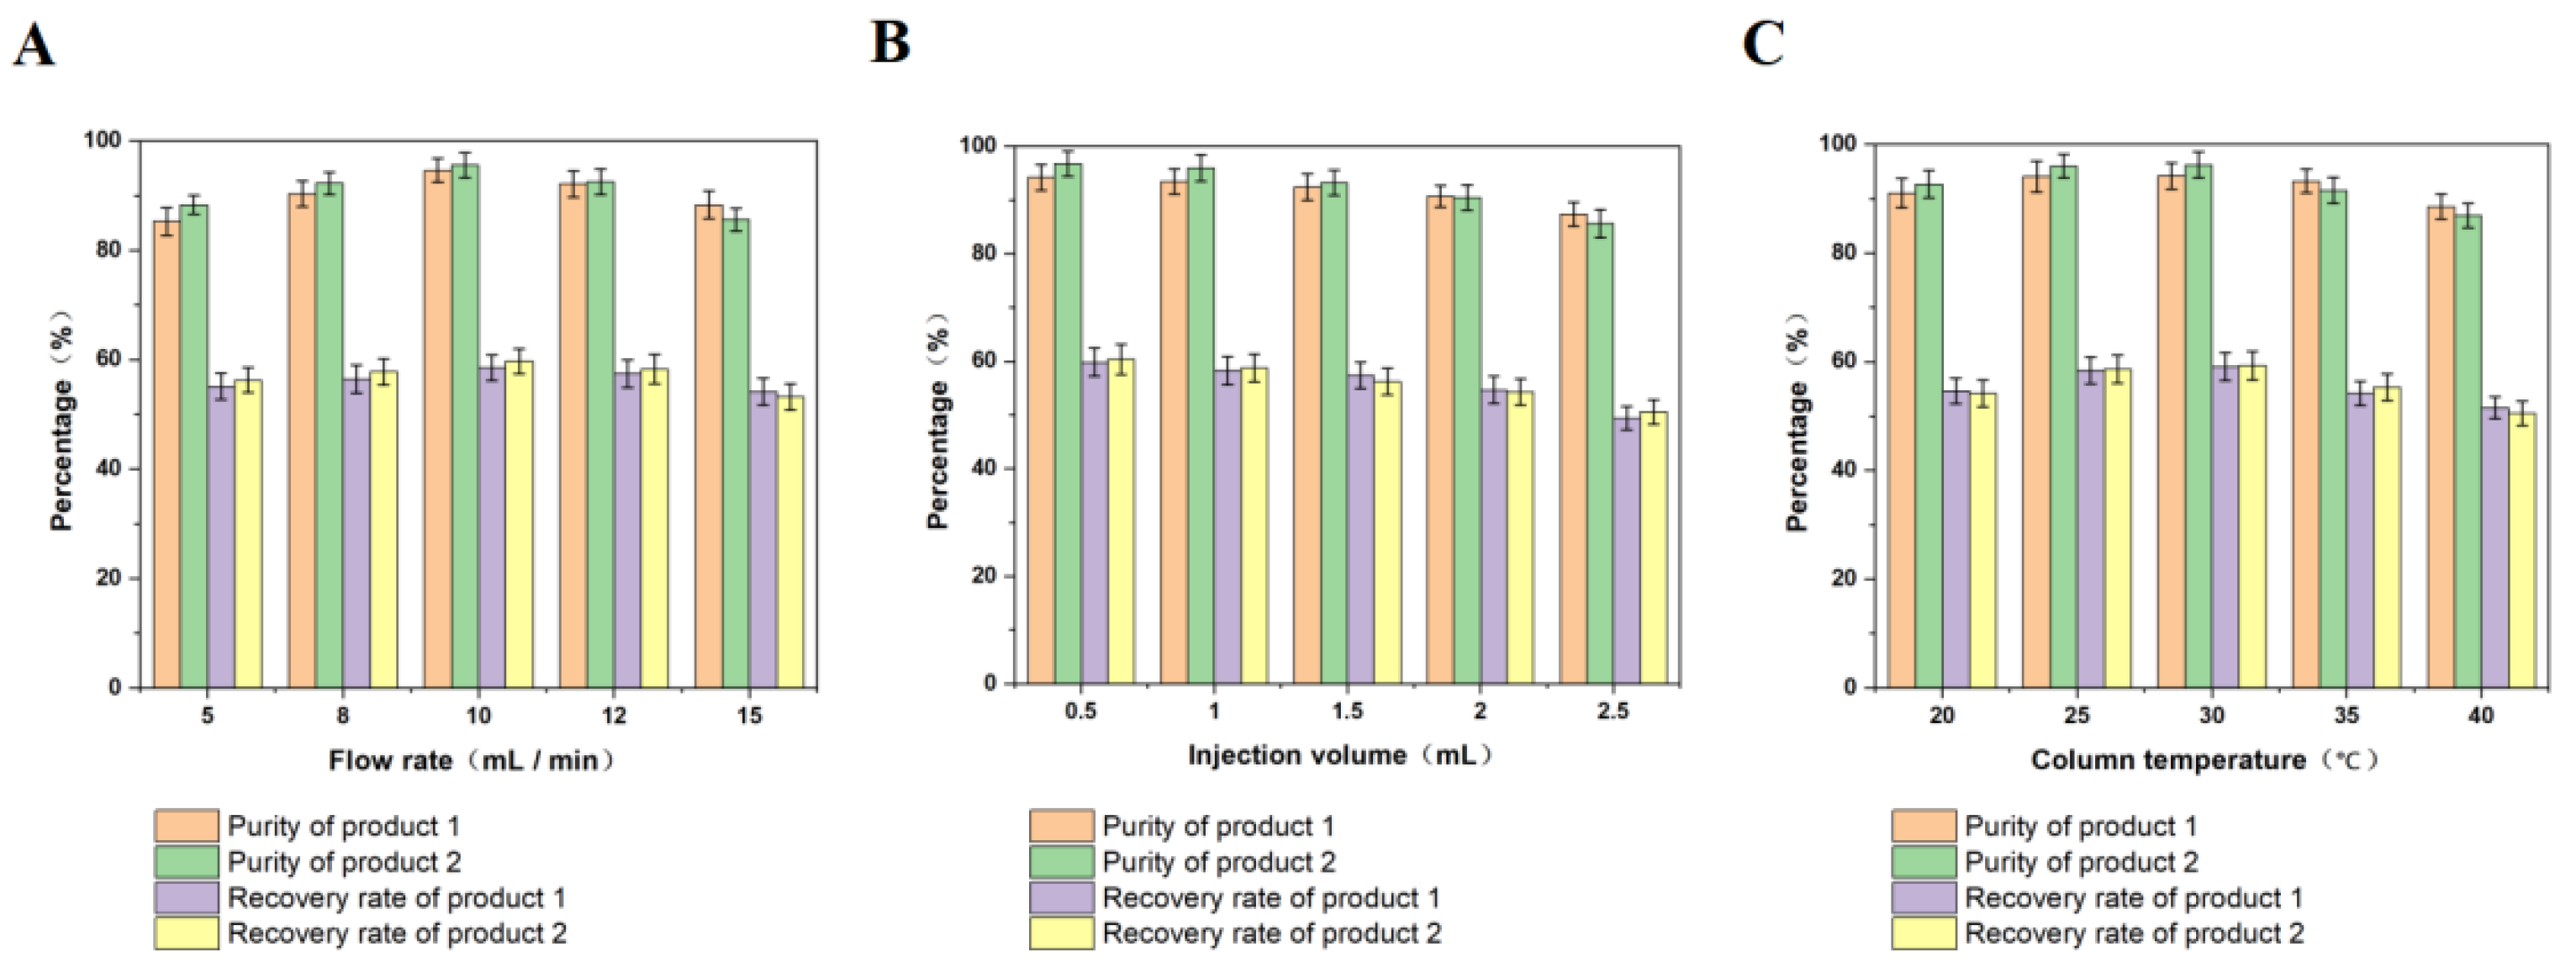
3.1. Single-Factor Experiments

3.1.1. Effect of Flow Rate on Purity and Recovery of the Two Products

The flow rate was one of the main factors affecting the purification of the two products by preparative high-performance liquid chromatography. We evaluated the effect of the flow rate on the purity and recovery rate of the two products. Flow rates of 5 mL/min, 8 mL/min, 10 mL/min, 12 mL/min, and 15 mL/min were tested. As shown in Figure 1A, after comparing the purity of the two products at different flow rates, we found that when the flow rate was 10 mL/min, the purity and recovery rate of the two products reached the maximum value. Therefore, the best flow rate was 10 mL/min. Increasing the flow rate is a very effective way to improve the yield, because it can shorten the cycle of preparative HPLC. However, when the flow rate increased to more than 10 mL/min, due to the control of the diffusion resistance of the stationary phase, the capacity of the separation column decreased, and the peaks of the components lengthened and overlapped, resulting in a reduction in the separation effectiveness [62]. On the other hand, the increase in flow rate also means the use of more mobile phases, resulting in the waste of reagents. When the flow rate is too low, the separation time can be increased, and it takes 60 min to complete an elution unit (flow rate was 5 mL/min), which means that the preparation efficiency decreases and a lot of reagents are consumed for Prep-HPLC. Therefore, in this study, the further optimized range of flow rate was found to be 8–12 mL/min.

3.1.2. Effect of Injection Volume on Purity and Recovery of the Two Products

The injection volume was one of the main factors affecting the purification of the two products by preparative HPLC. We evaluated the effect of injection volume on the purity and recovery rate of the two products. Injection volumes of 0.5 mL, 1.0 mL, 1.5 mL, 2.0 mL, and 2.5 mL were tested. The results are shown in Figure 1B. The results showed that the purity and recovery rate of the two products were highest when the injection volume was 0.5 mL. This may be because, with the increase in injection volume, the cycle period of preparative high-performance liquid chromatography is prolonged, the peak is widened, and the purity and recovery rate of the two products are reduced. Moreover, if the injection volume increases too much, the peak diffusion will intensify, which will not provide a good separation environment for the chromatographic column, resulting in the reduction or even disappearance of the separation effect [63]. Therefore, in this study, the further optimized range of injection volume was found to be 0.5–1.5 mL.

3.1.3. Effect of Column Temperature on Purity and Recovery of the Two Products

Column temperature is one of the main factors affecting the purification of the two products by preparative high-performance liquid chromatography. We evaluated the influence of column temperature on the purity and recovery rate of the two products. As shown in Figure 1C, the column temperatures were 20 °C, 25 °C, 30 °C, 35 °C, and 40 °C, and the retention time advanced when the temperature increased. Generally, the column temperature increased by 1 °C and the retention value decreased by 1~2%. The change in retention value can also cause a change in resolution. Theoretically, increasing the temperature is beneficial to improving the column efficiency and resolution, which will change the viscosity of the mobile phase (generally, the column pressure decreases) and the solubility of analytes, thus affecting the retention characteristics and selectivity of some substances. The imbalance of temperature will lead to the distortion of the peak. Therefore, the column temperature plays an important role in the separation process of liquid chromatography. For a stable and reliable separation result, the temperature change in the column cannot be ignored. The advantage of temperature-optimized liquid chromatography is that it is easy to use, and changes to the chromatographic column and mobile phase are not required. It is an effective parameter to change peak spacing and improve separation. In this experiment, when the temperature increased from 20 °C to 30 °C, the purity and recovery rate of the two products gradually increased, and when the temperature was higher than 30 °C, it gradually decreased. In preparative HPLC, the increase in column temperature can speed up the separation process, but the unstable retention time of the sample will increase the difficulty of detection. When the temperature exceeds 30 °C, the resolution may also decrease, resulting in the decrease in purity. On the contrary, when the column temperature is low, the resolution will be improved, but the separation time will be prolonged, because at low temperatures, the increase in viscosity of the mobile phase will prolong the detection time and increase the wear of the pump. At the same time, the relative decrease in solubility caused by low temperatures will lead to the buffer salt crystallizing and blocking the pump, injection valve, pipeline, and chromatographic column, and impurities will be adsorbed on the packing and be difficult to elute, thus affecting the service life of the chromatographic column [64]. Therefore, in this study, the further optimization range of column temperature was found to be 25–35 °C.

3.2. Optimization of Preparation Conditions for Purification of the Two Products by Orthogonal Experimental Design

In the process of purification of the two products by preparative high-performance liquid chromatography, the flow rate, the injection volume, and the column temperature all have a certain influence on the purity of the two products. Therefore, to improve the purity of the two products, the purification conditions of preparative high-performance liquid chromatography were optimized. The flow rate, injection volume, and column temperature in the purification process were selected as the investigation objects, and the purity of the two products was taken as the investigation index. The three-factor and three-level orthogonal experimental design was applied to optimize the purification conditions of preparative high-performance liquid chromatography.
Table 1 shows the design factor level table. X1, X2, and X3 are used to represent the three factors, namely flow rate, injection volume, and column temperature, respectively.
The results of the orthogonal experimental design scheme with three factors and three levels are shown in Table 2. According to the experimental design scheme, three average tests were carried out for each experiment, and then the average value was taken. The purity of product 1 is Yi. The purity of product 2 is yi.
Combining range analysis and variance analysis, the results of the orthogonal experimental design were analyzed, as shown in Table 2 and Table 3. It can be seen from the value of Rj that there was a significant sequence of factors in this experiment. In the process of preparative HPLC purification of product 1, the flow rate was the main factor affecting the purity of product 1, followed by the injection volume, and finally the column temperature. The significance test of the p-value showed that p (X1) = 0.008 < 0.01, which indicated that the influence of flow rate on the purity of product 1 was extremely significant. p (X2) = 0.024 < 0.05, which showed that the influence of the injection volume on the purity of product 1 reached a significant level. Finally, p (X3) = 0.253 > 0.05, which showed that the influence of column temperature on the purity of product 1 did not reach a significant level. At the same time, the analysis showed that the optimal combination of experimental factors was X12X21X32, which indicated that the optimal conditions in the process of purifying product 1 were: the flow rate was 10 mL/min, the injection volume was 0.5 mL, and the column temperature was 30 °C. At this time, the purity of product 1 was highest, reaching 95.33%.
Combining range analysis and variance analysis, the results of the orthogonal experimental design were analyzed, as shown in Table 2 and Table 4. The value of Rj indicates that there was a significant sequence of factors in this experiment. In the process of preparative HPLC purification of product 2, the flow rate was the main factor affecting the purity of product 2, followed by the injection volume, and finally the column temperature. The significance test of the p value showed that p (X1) = 0.005 < 0.01, which indicated that the flow rate had an extremely significant effect on the purity of product 2. p (X2) = 0.014 < 0.05 showed that the influence of injection volume on the purity of product 2 reached a significant level, and p (X3) = 0.478 > 0.05 indicated that the influence of column temperature on the purity of product 2 did not reach a significant level. At the same time, the analysis showed that the best combination of experimental factors was X12X21X32, which indicated that in the process of purifying product 2, the best experimental conditions were as follows: the flow rate was 10 mL/min, the injection volume was 0.5 mL, and the column temperature was 30 °C. At this time, the purity of product 2 was highest, reaching 99.15%.

3.3. Results and Analysis of Optimized Preparative HPLC

Taxanes in Taxus cuspidata are difficult to separate due to their structural similarity. As the mobile phase of preparative high-performance liquid chromatography has a high flow rate, the solvent consumption is high. Therefore, when this method is used to separate and purify substances, the separated substances must have a good separation degree and high purity, and the running time needs to be short to reduce the running cost. In this paper, a C18 column was used, and the material with high polarity came out first. By optimizing the flow rate, injection volume, and column temperature, product 1 and product 2, which are difficult to separate, achieved a good baseline separation (Figure 2). The separation effect was equivalent to that of analytical high-performance liquid chromatography, and the product purity could be guaranteed. As shown in Figure 2, the peak time of product 1 was 15.725 min, and that of product 2 was 20.272 min. The polarity of product 1 was larger than that of product 2. The two products were recovered and detected respectively, including by SEM, HPLC, and ESI-HRMS.

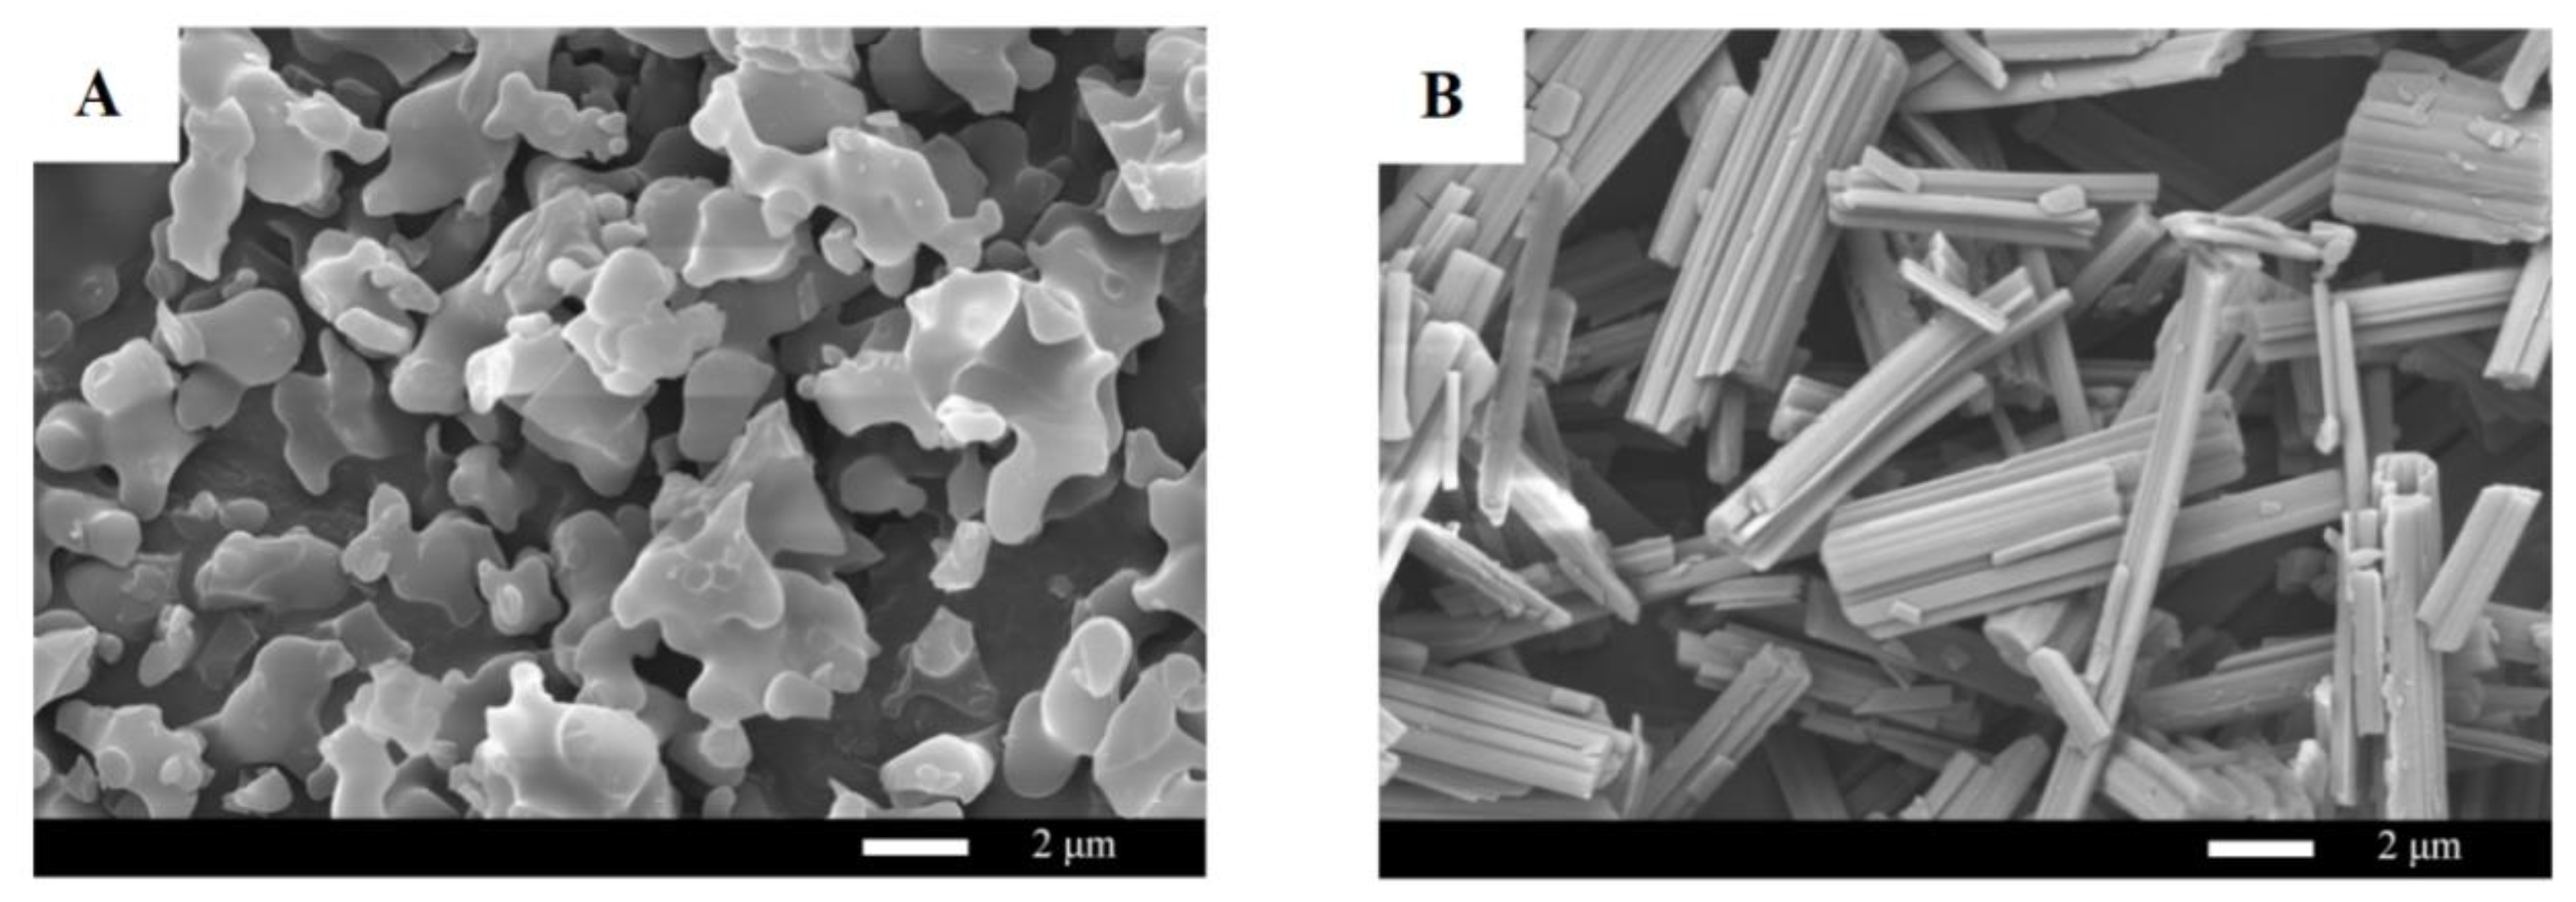
3.4. SEM Analysis of Purified Products

A crystal is a substance formed by the regular periodic repeated arrangement of particles (molecules, atoms, and ions) in three-dimensional space. Macroscopically, crystals have their own unique and symmetrical shapes, such as the cube of salt. Ice is a hexagonal prism, alum is octahedral, etc. The two purified products were used as two kinds of crystals, and their microstructures could be observed by scanning electron microscopy (SEM). Figure 3 shows that product 1 presented an irregular shape with an irregular three-dimensional structure (Figure 3A); the average major diameter of product 1 was about 2 μm. Product 2 showed a long columnar structure (Figure 3B). The average length diameter of product 2 was 8 μm. The smaller the particle radius of the crystal, the stronger the solubility and the lower the melting point. Therefore, the solubility of product 1 was slightly stronger than that of product 2, and its melting point was slightly lower than that of product 2. According to Huayuan net (https://www.chemsrc.com/, accessed on 23 September 2022), the melting point of 10-DAT was 182–184 °C, and that of PTX was 213 °C. This was consistent with the law of crystal length and diameter presented by scanning electron microscopy (SEM).

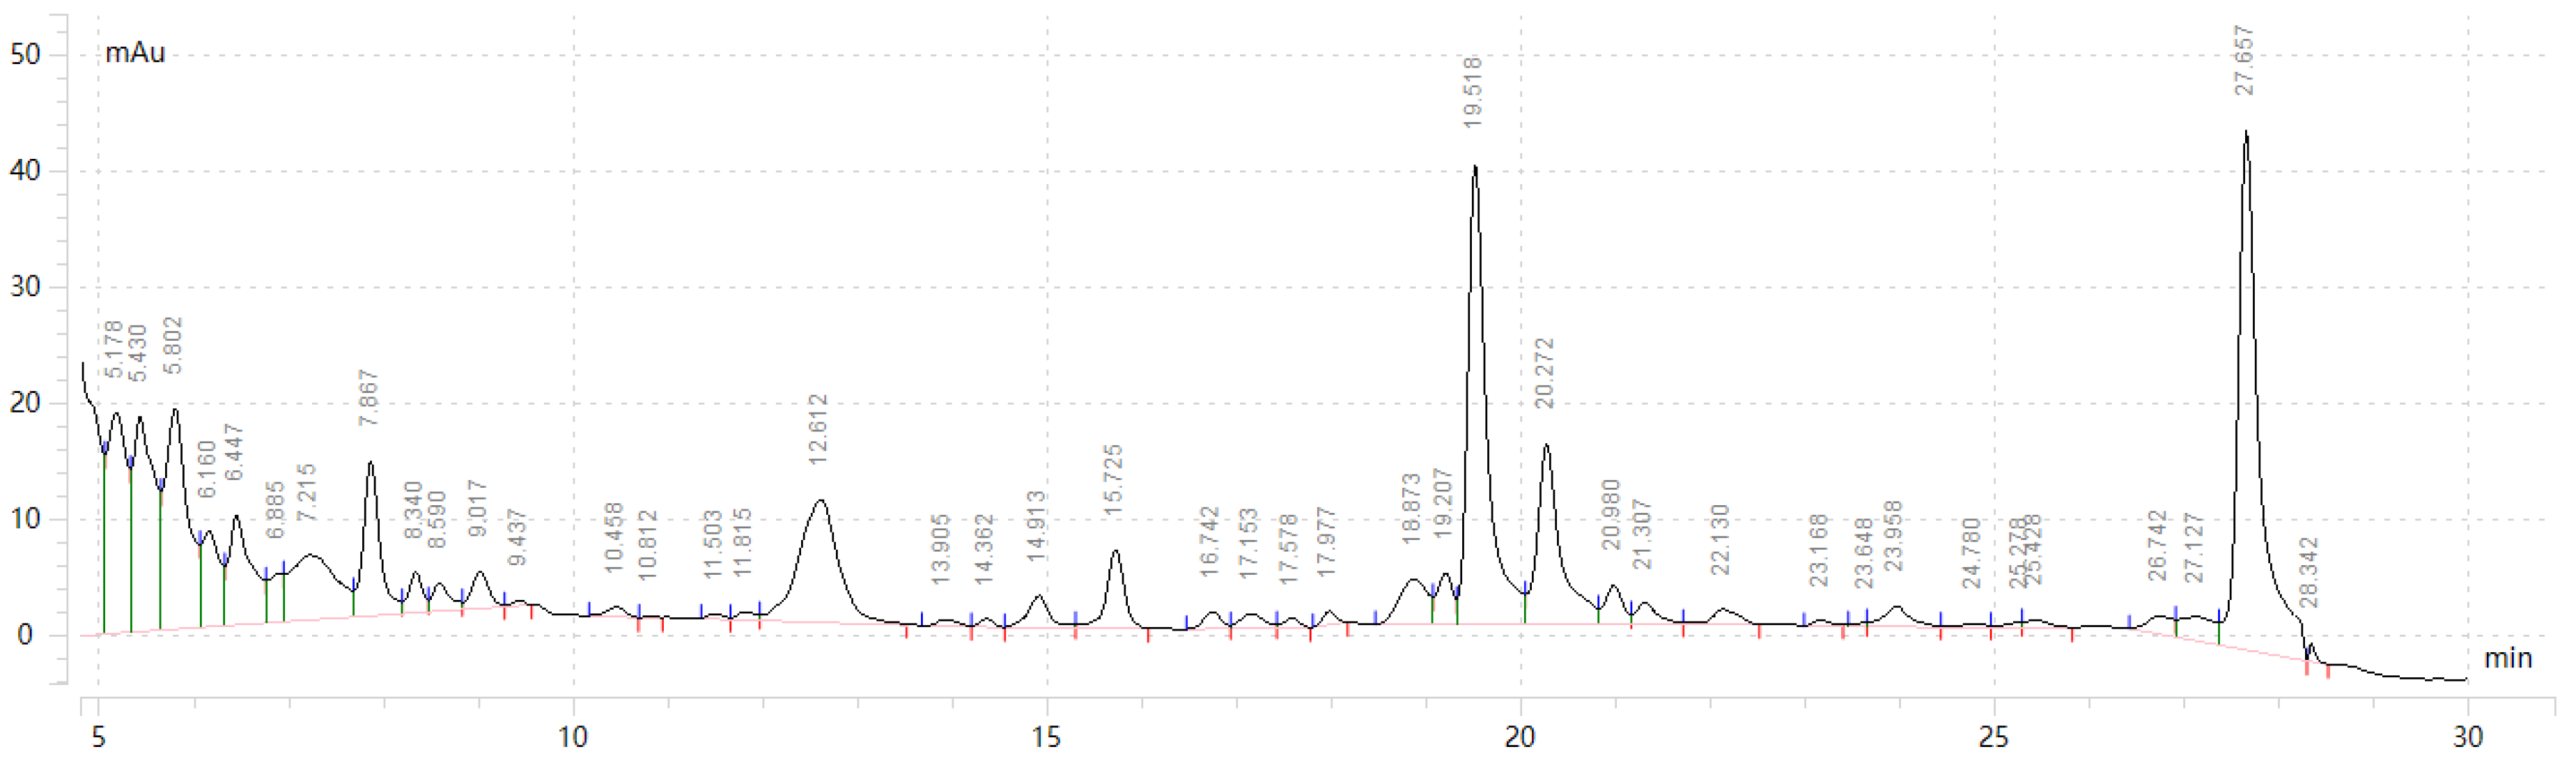
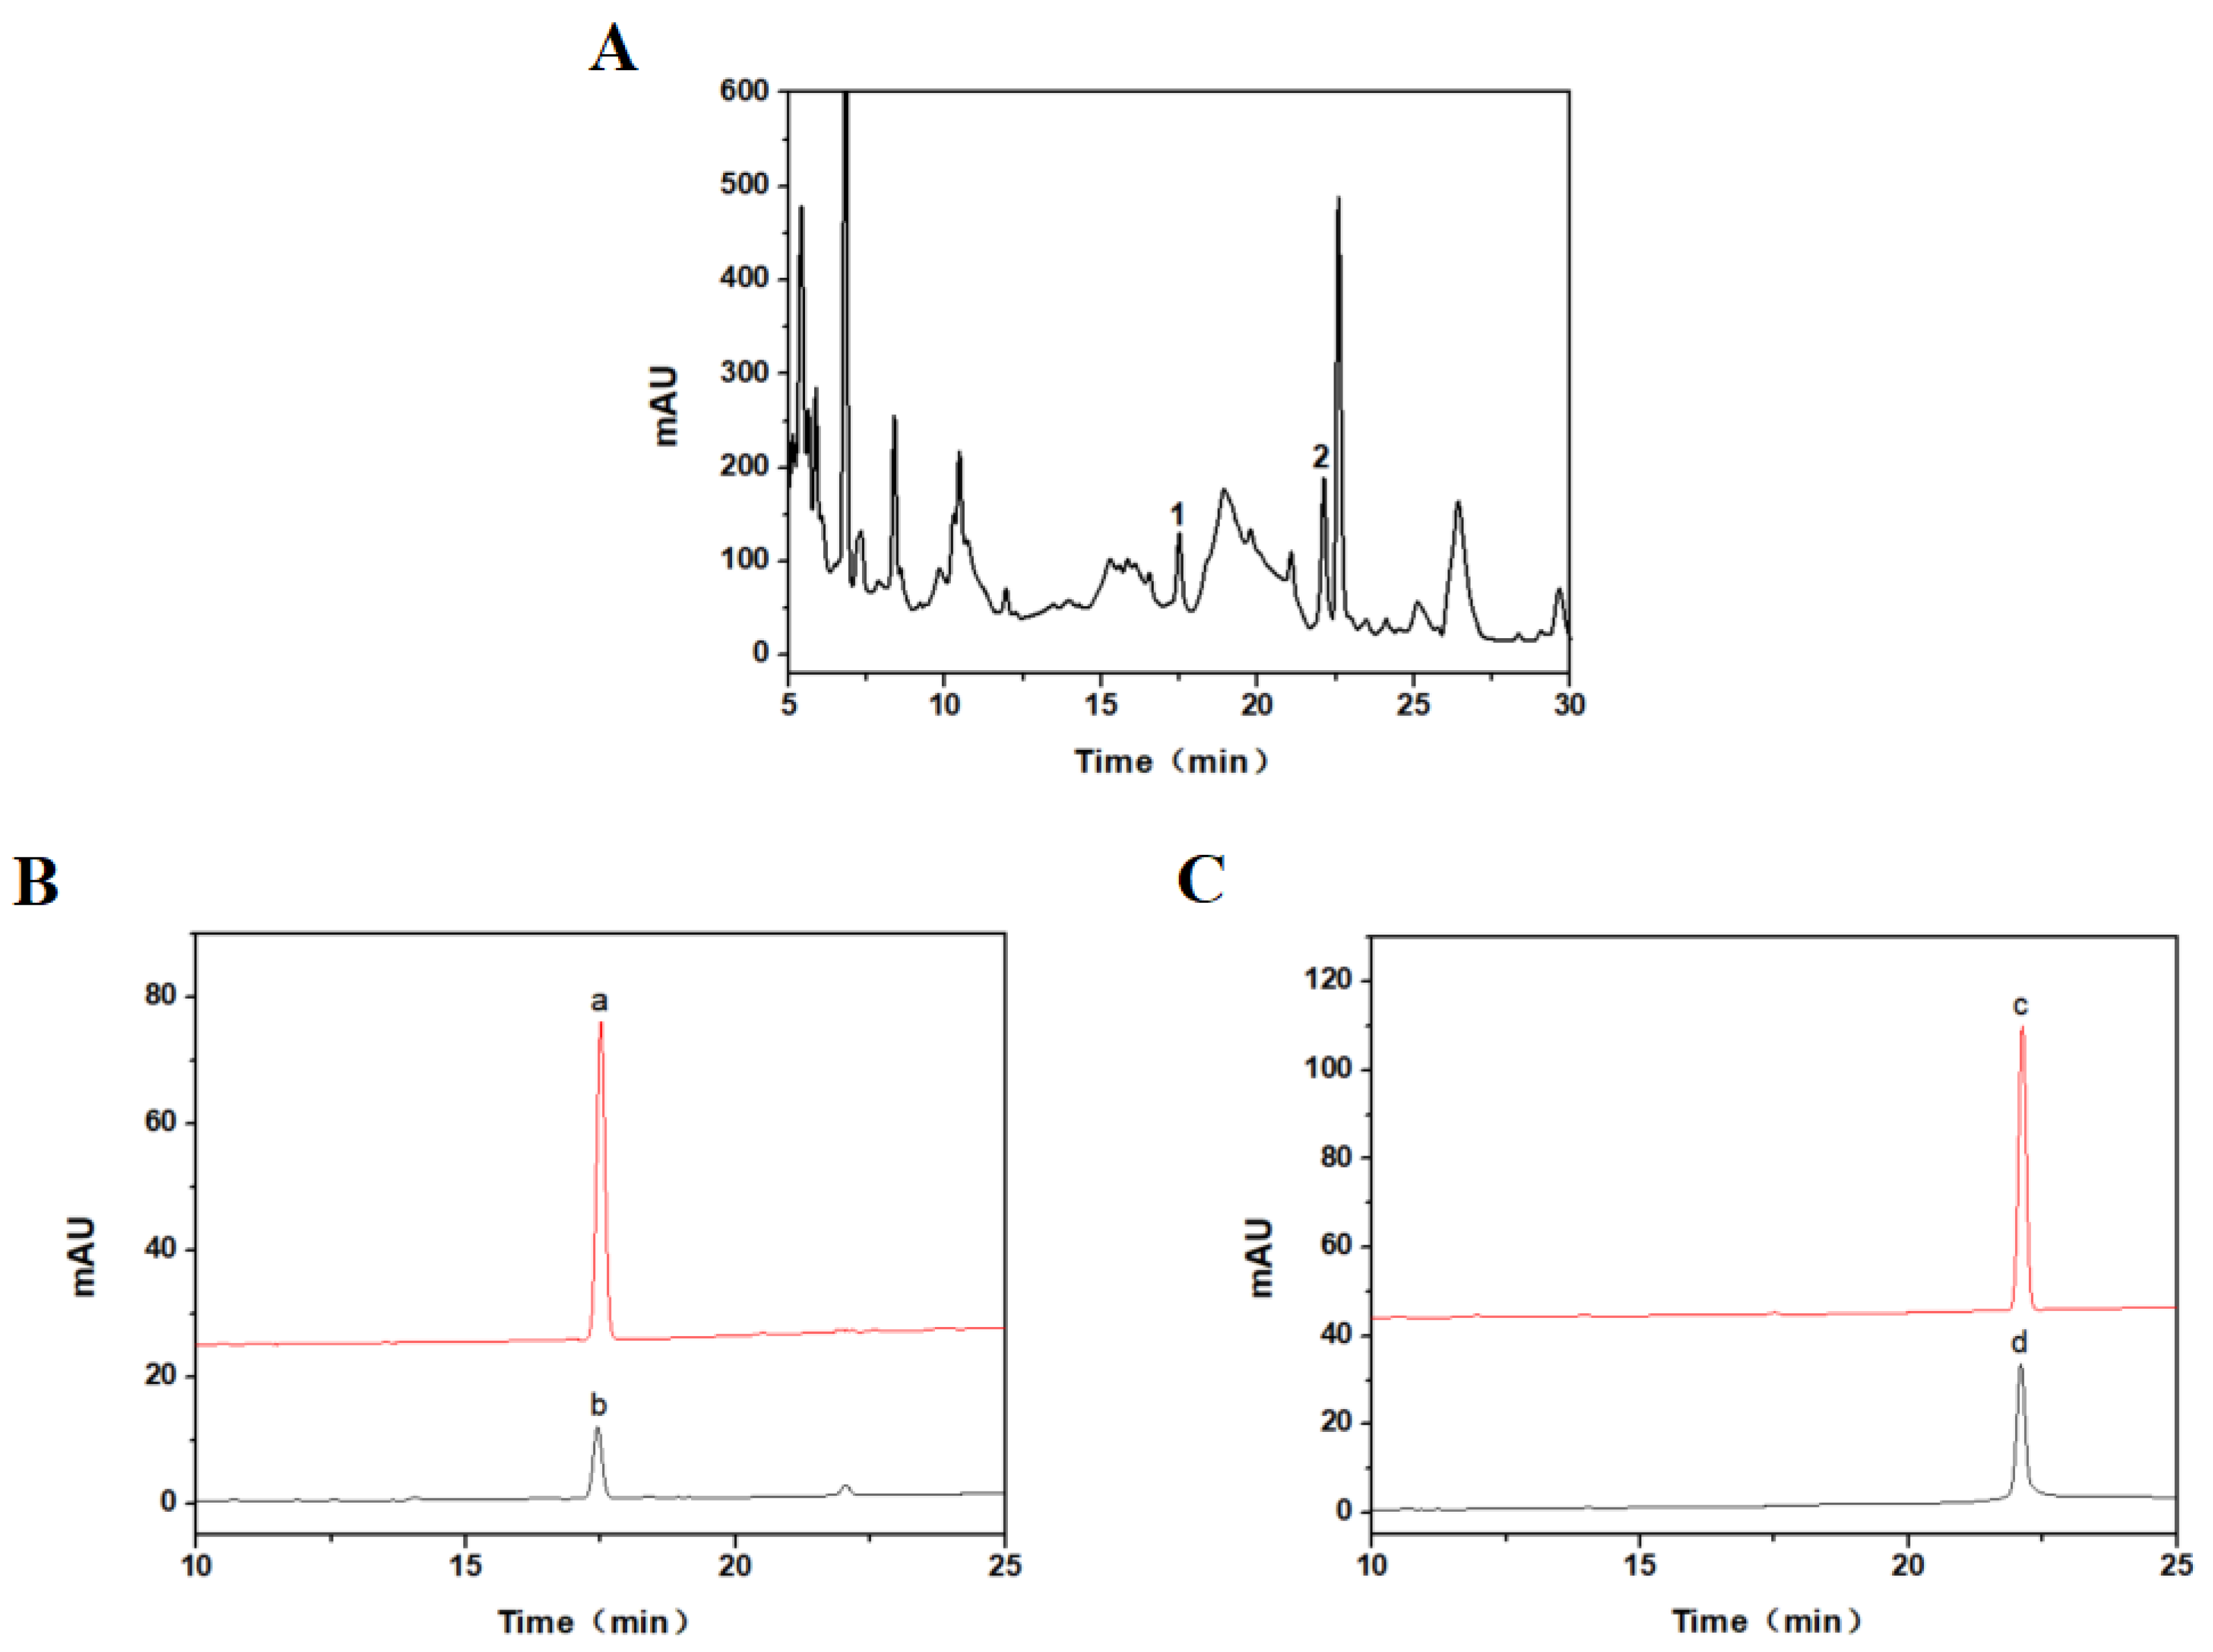
3.5. HPLC Detection of Purified Products

Figure 4A shows the HPLC diagram of Taxus cuspidata extract. It can be seen from the diagram that the components of Taxus cuspidata extract were complex, in which compound 1 was 10-DAT and compound 2 was paclitaxel (PTX). In Figure 4B, compound a (Figure 4B(a)) was the standard of 10-DAT and compound b (Figure 4B(b)) was the purified product 1. The peak time of the two products was the same, and they were preliminarily judged to be the same substance. In Figure 4C, compound c (Figure 4C(c)) was the standard product of paclitaxel, and compound d (Figure 4C(d)) was the purified product 2. The peak time of the two compounds was the same, and it was preliminarily judged that they were the same substance.

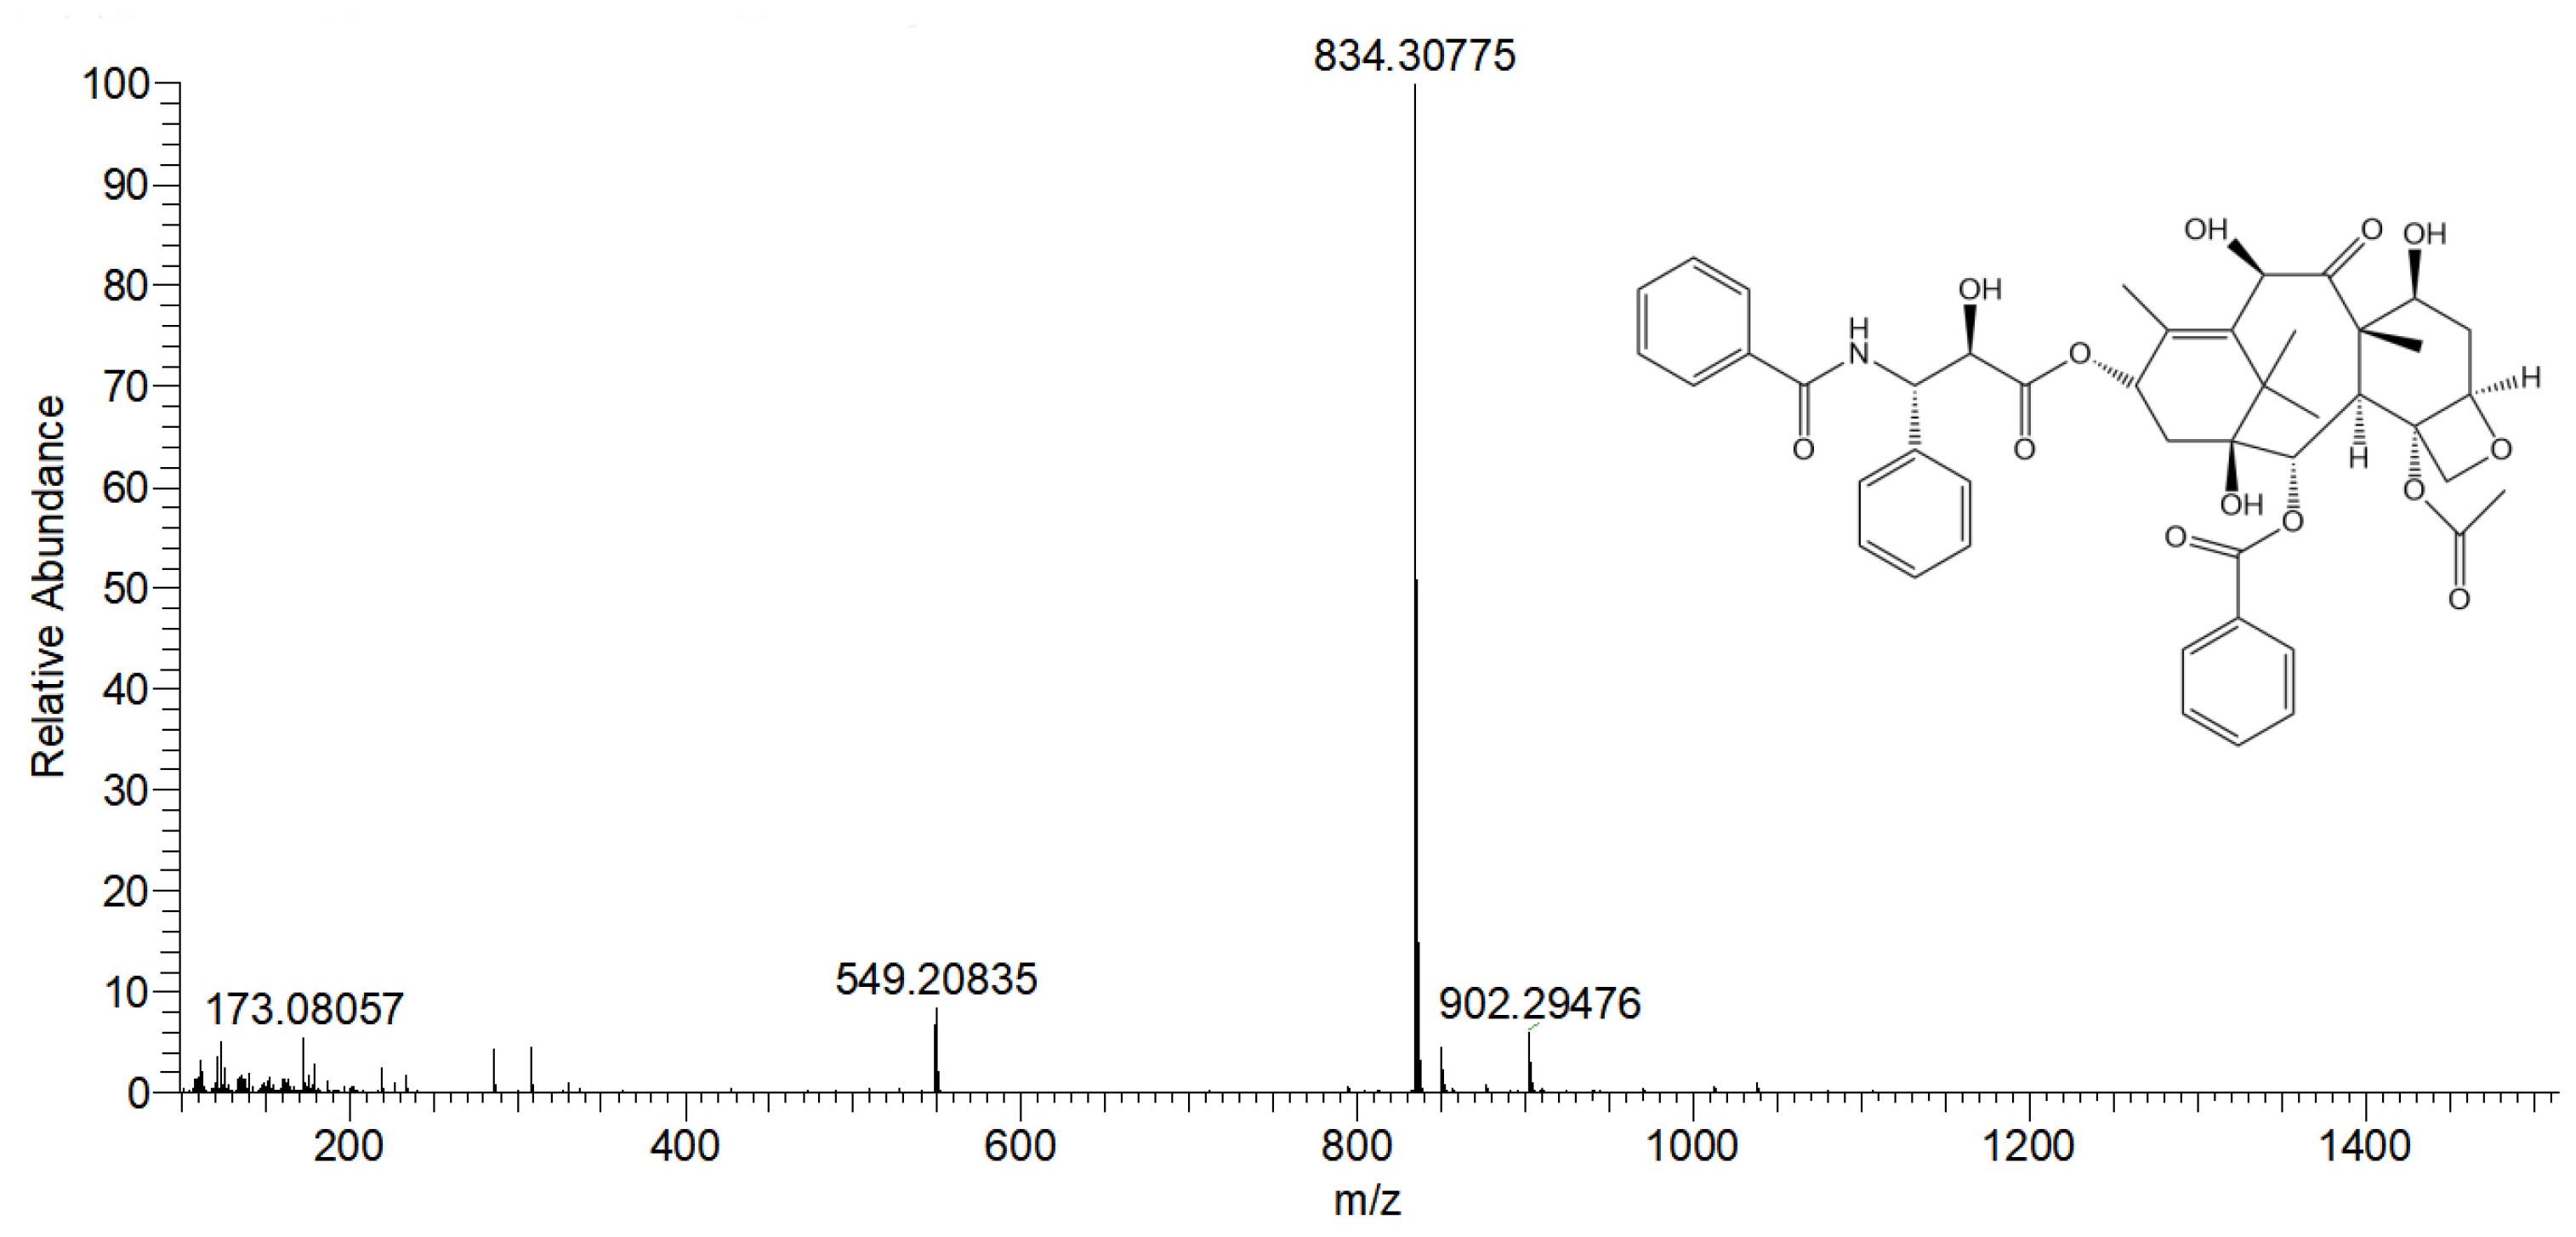
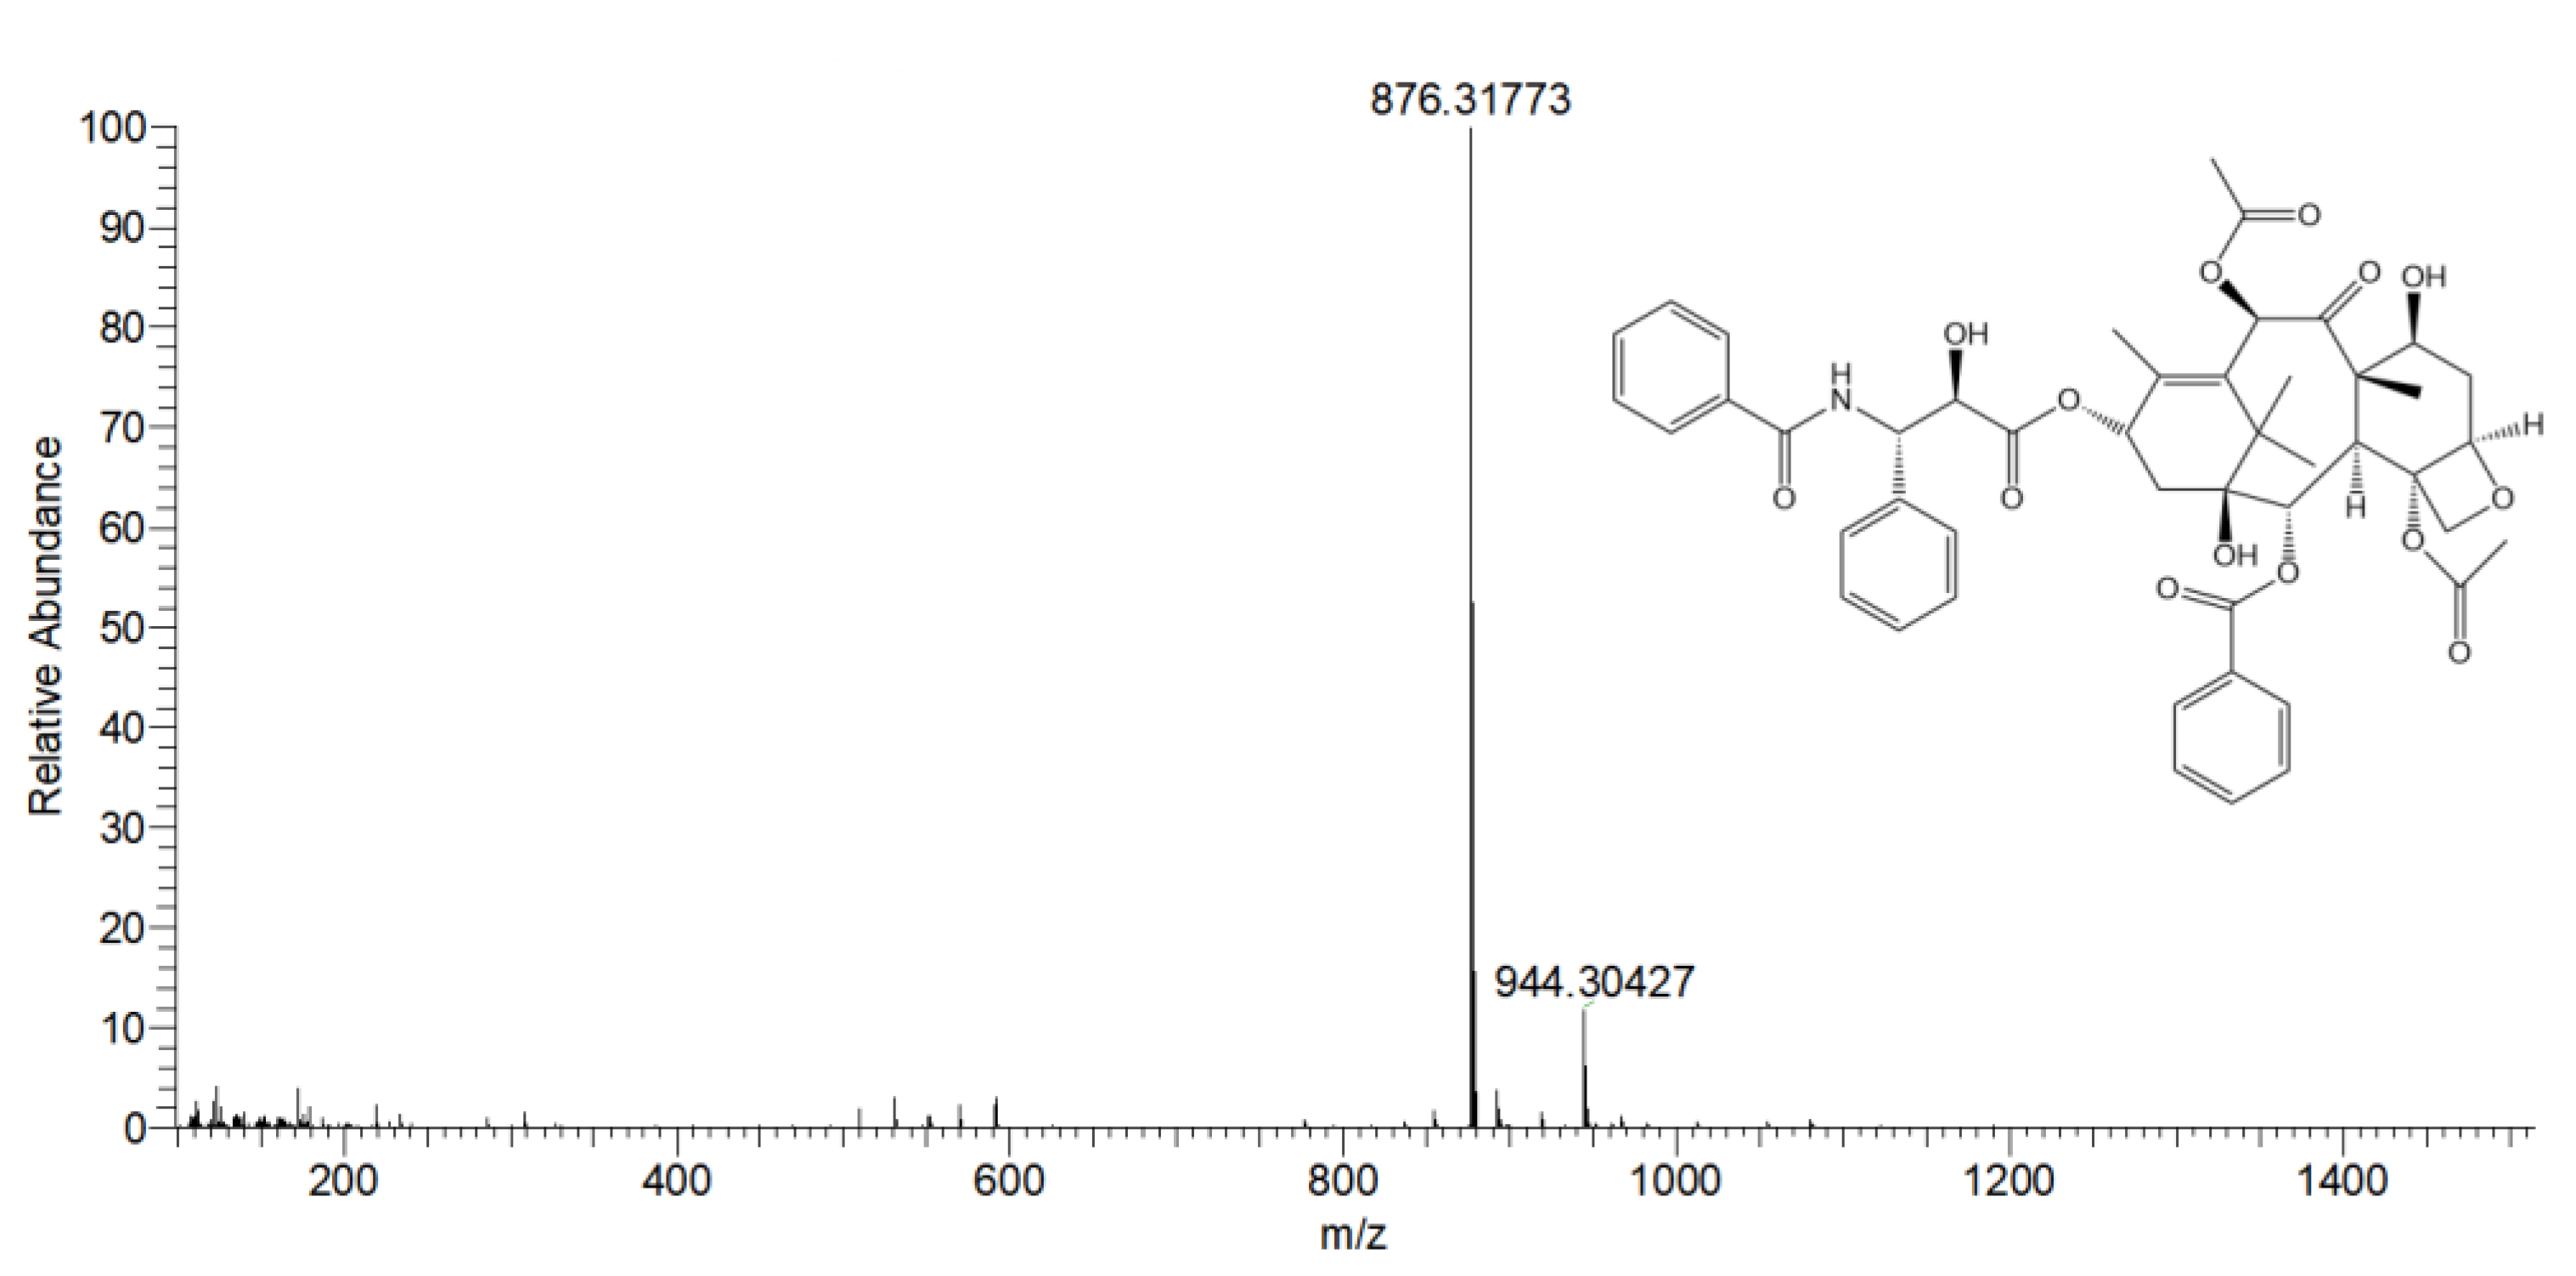
3.6. ESI-HRMS Detection of Preparative High-Performance Liquid Chromatography Products

As shown in Figure 5, the accurate mass-to-charge ratio of target molecular ions was 834.30775 in ESI-HRMS positive ion mode. Compared with the standard spectrum library, the theoretical value of C45H49NO13 was 834.3204, and the relative error was only 0.01265 (p < 0.05). Therefore, in the positive ion mode, the molecular formula of the mass spectrum peak m/z 834.30775 should be C45H49NO13, and the substance was 10-deacetyltaxol (10-DAT) in combination with the experimental conditions.
As shown in Figure 6, the accurate mass-to-charge ratio of the target molecular ions was 876.31773 in ESI-HRMS positive ion mode. Compared with the standard spectrum library, the theoretical value of C47H51NO14 was 876.3310, and the relative error was only 0.01327 (p < 0.05). Therefore, in the positive ion mode, the molecular formula of the mass spectrum peak m/z 876.31773 should be C47H51NO14. Combined with the experimental conditions, the substance was paclitaxel (PTX).
In recent years, researchers have conducted a lot of research on the purification of taxanes. Fang et al. established the method for the separation and purification of taxane diterpenoids compound 10-deacetylbaccatin III (10-DAB III). 10-DAB III was refined by using column chromatography and recrystallization, and the proportion of chromatography liquid was determined using the content of impurities; the amount of chloroform was selected at the first recrystallization; the amounts of acetone and n-hexane at the second recrystallization and the temperature and time of recrystallization were selected using purity and yield as indexes. Under the optimum conditions, the purity of the purified sample was 99.34% and the yield was 83.50%. This technology had a good purification effect on the purification of 10-DAB III [65]. Lee et al. also carried out experimental research on the purification of paclitaxel. First, they evaluated the effects of crude extract purity and pure paclitaxel content on the fractional precipitation behavior (purity, yield, fractional precipitation time, and precipitation shape and size) to improve the purification efficiency of paclitaxel. With the increase in crude extract purity and pure paclitaxel content, the yield and purity of paclitaxel increased, and the precipitation time and size decreased. In addition, they found that regardless of the purity of the crude extract, the maximum content of pure paclitaxel in fractional precipitation was 0.45-0.51% (w/v) [66]. Liang et al. separated and purified six taxanes from Taxus chinensis cell culture extract by high-speed countercurrent chromatography. The crude cell culture extract was first treated with Al2O3 column chromatography and then divided into two parts: fraction 1 and fraction 2. The purity of six taxanes obtained by purification was more than 93% [67].
In the present study, preparative high-performance liquid chromatography (Prep-HPLC) was used to purify two taxanes in Taxus cuspidata. This method has the advantages of rapidness, high efficiency, high separation efficiency, and good analysis accuracy. Moreover, the chromatographic column can be used repeatedly, and the product with high purity can be obtained.

4. Conclusions

An efficient purification method of taxanes from Taxus cuspidata was established. Our data showed that preparative HPLC is an effective method to purify two taxanes in Taxus cuspidata. When the flow rate was 10 mL/min, the injection volume was 0.5 mL, and the column temperature was 30 °C, the purity of the two taxanes reached the maximum. Two products with peak times of 15.725 min and 20.272 min were collected. ESI-HRMS identified that product 1 was 10-deacetyltaxol (10-DAT) with a purity of 95.33% and product 2 was paclitaxel (PTX) with a purity of 99.15%. The purified products were characterized by scanning electron microscopy (SEM), high-performance liquid chromatography (HPLC), and electrospray ionization-high resolution mass spectrometry (ESI-HRMS). The results showed that preparative HPLC could effectively purify 10-DAT and PTX from Taxus cuspidata with complex components. This method was effective and is suitable for the large-scale preparation of 10-DAT and PTX.

Author Contributions

Conceptualization, Y.Z., Z.Z. and Y.T.; methodology, Y.Z. and W.L.; software, Y.Z.; validation, Y.Z. and Z.Z.; formal analysis, Y.Z.; investigation, Y.Z., Z.Z., W.L. and H.M.; resources, Y.Z.; data curation, Y.Z.; writing—original draft preparation, Y.Z.; writing—review and editing, S.W.; visualization, S.W.; supervision, S.W.; funding acquisition, S.W. All authors have read and agreed to the published version of the manuscript.

Funding

This research was funded by “The 13th Five Year Plan” for Nation Science and Technology in Rural Area (No. 3G016W112418), Jilin Province Science and Technology Development Key Program (No. 20180201009NY), Changchun City Science and Technology Development Program (No. NK15SS22), and Key Laboratory of Ministry of Education (No. K201101).

Institutional Review Board Statement

Not applicable.

Informed Consent Statement

Not applicable.

Data Availability Statement

The data shown in this study are contained within the article.

Acknowledgments

The authors would like to extend their appreciation to the development plan project during “The 13th Five Year Plan” for Nation Science and Technology in Rural Area (No. 3G016W112418), Jilin Province Science and Technology Development Key Program (No. 20180201009NY), Changchun City Science and Technology Development Program (No. NK15SS22), and Key Laboratory of Ministry of Education (No. K201101).

Conflicts of Interest

The authors declare no conflict of interest.

References

  1. Nan, D.; Zhe, X.; Bing, H.; Lijuan, H.; Shaomei, L.; Chunyan, Y. Optimization of callus induction and subculture conditions of Taxus chinensis. J. Pharm. Sci. Innov. 2015, 41, 2058–2062. [Google Scholar] [CrossRef]
  2. Kim, H.-G.; Kim, J.-H. Elucidation of the Mechanism and Kinetics of Ultrasonic Extraction of Paclitaxel from Plant Cell Cultures of Taxus chinensis. Biotechnol. Bioprocess Eng. 2022, 27, 668–677. [Google Scholar] [CrossRef]
  3. Charpin, D.; Pichot, C.; Belmonte, J.; Sutra, J.-P.; Zidkova, J.; Chanez, P.; Shahali, Y.; Sénéchal, H.; Poncet, P. Cypress Pollinosis: From Tree to Clinic. Clin. Rev. Allergy Immunol. 2019, 56, 174–195. [Google Scholar] [CrossRef] [PubMed]
  4. Meng, A.-P.; Li, J.; Pu, S.-B. Chemical Constituents of Leaves of Taxus chinensis. Chem. Nat. Compd. 2018, 54, 841–845. [Google Scholar] [CrossRef]
  5. Gao, L.-M.; Tan, S.-L.; Zhang, G.-L.; Thomas, P. A new species of Amentotaxus (Taxaceae) from China, Vietnam, and Laos. PhytoKeys 2019, 130, 25–32. [Google Scholar] [CrossRef] [Green Version]
  6. Tang, D.F.; Liu, D.H.; Jiang, L.W.; Wang, S.Z.; Li, L.; Xiang, B.W. Tissue culture of Taxus chinensis var. mairei. Hunan Agric. Sci. 2008, 47, 21–23. [Google Scholar] [CrossRef]
  7. Hook, I.; Poupat, C.; Ahond, A.; Guénard, D.; Guéritte, F.; Adeline, M.-T.; Wang, X.-P.; Dempsey, D.; Breuillet, S.; Potier, P. Seasonal variation of neutral and basic taxoid contents in shoots of European Yew (Taxus baccata). Phytochemistry 1999, 52, 1041–1045. [Google Scholar] [CrossRef]
  8. Wu, M.; Wu, Y.; Zhou, J.; Pan, Y. Structural characterisation of a water-soluble polysaccharide with high branches from the leaves of Taxus chinensis var. mairei. Food Chem. 2009, 113, 1020–1024. [Google Scholar] [CrossRef]
  9. Vidensek, N.; Lim, P.; Campbell, A.; Carlson, C. Taxol Content in Bark, Wood, Root, Leaf, Twig, and Seedling from Several Taxus Species. J. Nat. Prod. 1990, 53, 1609–1610. [Google Scholar] [CrossRef]
  10. Ehrsam, D.; Sieber, S.; Oufir, M.; Porta, F.; Hamburger, M.; Huwyler, J.; Zu Schwabedissen, H.E.M. Design, Synthesis, and Characterization of a Paclitaxel Formulation Activated by Extracellular MMP9. Bioconjugate Chem. 2020, 31, 781–793. [Google Scholar] [CrossRef]
  11. Zhu, J.; Sun, H.; Callmann, C.E.; Thompson, M.P.; Battistella, C.; Proetto, M.T.; Carlini, A.S.; Gianneschi, N.C. Paclitaxel-terminated peptide brush polymers. Chem. Commun. 2020, 56, 6778–6781. [Google Scholar] [CrossRef] [PubMed]
  12. Perdue, J.D.; Seaton, P.J.; Tyrell, J.A.; DeVido, D.R. The removal of Cremophor® EL from paclitaxel for quantitative analysis by HPLC–UV. J. Pharm. Biomed. Anal. 2006, 41, 117–123. [Google Scholar] [CrossRef] [PubMed] [Green Version]
  13. Kamal, M.M.; Nazzal, S. Development and validation of a HPLC-UV method for the simultaneous detection and quantification of paclitaxel and sulforaphane in lipid based self-microemulsifying formulation. J. Chromatogr. Sci. 2020, 57, 931–938. [Google Scholar] [CrossRef]
  14. Chen, T.S.; Li, X.; Bollag, D.; Liu, Y.-C.; Chang, C.-J. Biotransformation of taxol. Tetrahedron Lett. 2001, 42, 3787–3789. [Google Scholar] [CrossRef]
  15. Sanchez-Muñoz, R.; Perez-Mata, E.; Almagro, L.; Cusido, R.M.; Bonfill, M.; Palazon, J.; Moyano, E. A Novel Hydroxylation Step in the Taxane Biosynthetic Pathway: A New Approach to Paclitaxel Production by Synthetic Biology. Front. Bioeng. Biotechnol. 2020, 8, 410. [Google Scholar] [CrossRef] [PubMed]
  16. Papas, S.; Akoumianaki, T.; Kalogiros, C.; Hadjiarapoglou, L.; Theodoropoulos, P.A.; Tsikaris, V. Synthesis and antitumor activity of peptide-paclitaxel conjugates. J. Pept. Sci. 2007, 13, 662–671. [Google Scholar] [CrossRef]
  17. Li, H.; Dou, M.; Wang, X.; Guo, N.; Kou, P.; Jiao, J.; Fu, Y. Optimization of Cellulase Production by a Novel Endophytic Fungus Penicillium oxalicum R4 Isolated from Taxus cuspidata. Sustainability 2021, 13, 6006. [Google Scholar] [CrossRef]
  18. Tong, X.-J.; Fang, W.-S.; Zhou, J.-Y.; He, C.-H.; Chen, W.-M.; Fang, Q.-C. Three New Taxane Diterpenoids from Needles and Stems of Taxus cuspidata. J. Nat. Prod. 2004, 58, 233–238. [Google Scholar] [CrossRef]
  19. Yu, S.-H.; Zhang, M.-L.; Wang, Y.-F.; Huo, C.-H.; Gu, Y.-C.; Shi, Q.-W. A New Taxane from the Hard Wood of Taxus cuspidata. Z. Für Nat. B 2010, 65, 635–638. [Google Scholar] [CrossRef]
  20. Kim, B.J.; Gibson, D.M.; Shuler, M.L. Effect of the plant peptide regulator, phytosulfokine-α, on the growth and Taxol production from Taxus sp. suspension cultures. Biotechnol. Bioeng. 2006, 95, 8–14. [Google Scholar] [CrossRef]
  21. Huo, C.; Zhang, X.; Li, C.; Wang, Y.; Shi, Q.; Kiyota, H. A new taxol analogue from the leaves of Taxus cuspidata. Biochem. Syst. Ecol. 2007, 35, 704–708. [Google Scholar] [CrossRef]
  22. Bai, J.; Kitabatake, M.; Toyoizumi, K.; Fu, L.; Zhang, S.; Dai, J.; Sakai, J.; Hirose, K.; Yamori, T.; Tomida, A. Production of biologically active taxoids by a callus culture of Taxus cuspidata. J. Nat. Prod. 2004, 67, 58–63. [Google Scholar] [CrossRef] [PubMed]
  23. Zhong, C.; Yuan, Y.-J. Responses of Taxus cuspidata to hydrodynamics in bubble column bioreactors with different sparging nozzle sizes. Biochem. Eng. J. 2009, 45, 100–106. [Google Scholar] [CrossRef]
  24. Ge, L.; Qi, Q.; Zhang, Q.; Guo, C.; Shi, B. Content changes of endogenous hormones in Taxus cuspidata during the flower development. Wit Trans. Built Environ. 2014, 145, 683–690. [Google Scholar] [CrossRef]
  25. Naill, M.C.; Kolewe, M.E.; Roberts, S.C. Paclitaxel uptake and transport in Taxus cell suspension cultures. Biochem. Eng. J. 2012, 63, 50–56. [Google Scholar] [CrossRef] [Green Version]
  26. Kingston, D.; Newman, D.J. Taxoids: Cancer-fighting compounds from nature. Curr. Opin. Drug Discov. Dev. 2007, 10, 130. [Google Scholar] [CrossRef] [Green Version]
  27. Yadava, U.; Gupta, H.; Roychoudhury, M. Stabilization of Microtubules by Taxane Diterpenoids: Insight from Docking and MD simulations. J. Biol. Phys. 2015, 41, 117–133. [Google Scholar] [CrossRef] [Green Version]
  28. Yang, X.; Liu, K.; Xie, M. Purification of taxol by industrial preparative liquid chromatography. J. Chromatogr. A 1998, 813, 201–204. [Google Scholar] [CrossRef]
  29. Ke, C.; Ren, Y.; Gao, P.; Han, J.; Tao, Y.; Huang, J.; Yang, X. Separation and purification of pyrroloquinoline quinone from fermentation broth by pretreatment coupled with macroporous resin adsorption. Sep. Purif. Technol. 2021, 257, 117962. [Google Scholar] [CrossRef]
  30. Ulusoy, M.; Aslıyüce, S.; Keskin, N.; Denizli, A. Beauvericin purification from fungal strain using molecularly imprinted cryogels. Process Biochem. 2022, 113, 185–193. [Google Scholar] [CrossRef]
  31. Gast, M.; Wondany, F.; Raabe, B.; Michaelis, J.; Sobek, H.; Mizaikoff, B. Use of Super-Resolution Optical Microscopy to Reveal Direct Virus Binding at Hybrid Core–Shell Matrixes. Anal. Chem. 2020, 92, 3050–3057. [Google Scholar] [CrossRef] [PubMed]
  32. Zeng, Z.; Wang, Y.; Shi, J.; Zhou, S.; Tang, W.; Chen, Z. Enhanced boron removal by crmnfeni-based high-entropy alloys during purification of silicon. Sep. Purif. Technol. 2021, 279, 119682. [Google Scholar] [CrossRef]
  33. Hu, C.; Mei, H.; Guo, H.; Yu, Z.; Zhu, J. Purification of ammonium nitrate via recrystallization for isotopic profiling using isotope ratio mass spectrometry. Forensic Sci. Int. 2021, 328, 111009. [Google Scholar] [CrossRef]
  34. Bailey, G.G.; Needham, L.L. Simultaneous quantification of erythrocyte zinc protoporphyrin and protoporphyrin IX by liquid chromatography. Clin. Chem. 2020, 32, 2137–2142. [Google Scholar] [CrossRef]
  35. Shi, Y.; Chen, S.-P.R.; Jia, Z.; Monteiro, M.J. Analysis of cyclic polymer purity by size exclusion chromatography: A model system. Polym. Chem. 2020, 11, 7354–7361. [Google Scholar] [CrossRef]
  36. Vanova, J.; Malinak, D.; Andrys, R.; Kubat, M.; Mikysek, T.; Rousarova, E.; Musilek, K.; Rousar, T.; Cesla, P. Optimization of gradient reversed phase high performance liquid chromatography analysis of acetaminophen oxidation metabolites using linear and non-linear retention model. J. Chromatogr. A 2022, 1669, 462956. [Google Scholar] [CrossRef]
  37. Liu, M.; Li, X.; Liu, Q.; Xie, S.; Zhu, F.; Chen, X. Preparative isolation and purification of 12 main antioxidants from the roots of Polygonum multiflorum Thunb. using high-speed countercurrent chromatography and preparative HPLC guided by 1,1′-diphenyl-2-picrylhydrazyl-HPLC. J. Sep. Sci. 2020, 43, 1415–1422. [Google Scholar] [CrossRef] [PubMed]
  38. Kim, H.-S.; Fernando, I.P.S.; Lee, S.-H.; Ko, S.-C.; Kang, M.C.; Ahn, G.; Je, J.-G.; Sanjeewa, K.; Rho, J.-R.; Shin, H.J.; et al. Isolation and characterization of anti-inflammatory compounds from Sargassum horneri via high-performance centrifugal partition chromatography and high-performance liquid chromatography. Algal Res. 2021, 54, 102209. [Google Scholar] [CrossRef]
  39. Nugroho, T.T.; Puja, K.; Eryanti, Y.; Miranti, M. Fractionation of Garcinia Mangostana Fruit Pericarp Cellulase Assisted Extracts by Preparative Thin Layer Chromatography and High Performance Liquid Chromatography. J. Nat. Indones. 2020, 18, 31. [Google Scholar] [CrossRef]
  40. Dufour, A.; Thiébaut, D.; Loriau, M.; Ligiero, L.; Vial, J. Corona charged aerosol detector non-uniform response factors of purified alcohol ethoxylated homologues using liquid chromatography. J. Chromatogr. A 2020, 1627, 461402. [Google Scholar] [CrossRef]
  41. Jiang, T.; Ghosh, R.; Charcosset, C. Extraction, purification and applications of curcumin from plant materials—A comprehensive review. Trends Food Sci. Technol. 2021, 112, 419–430. [Google Scholar] [CrossRef]
  42. Bredahl, E.K.; Kjaerulff, L.; Ndi, C.; Semple, S.; Buirchell, B.; Møller, B.L.; Staerk, D. Isolation and structure elucidation of caryophyllane sesquiterpenoids from leaves of Eremophila spathulata. Phytochem. Lett. 2022, 47, 156–163. [Google Scholar] [CrossRef]
  43. Liu, Y.; Murakami, N.; Wang, L.; Zhang, S. Preparative high-performance liquid chromatography for the purification of natural acylated anthocyanins from red radish (Raphanus sativus L.). J. Chromatogr. Sci. 2008, 46, 743–746. [Google Scholar] [CrossRef] [PubMed] [Green Version]
  44. Ferretti, R.; Carradori, S.; Guglielmi, P.; Pierini, M.; Casulli, A.; Cirilli, R. Enantiomers of triclabendazole sulfoxide: Analytical and semipreparative HPLC separation, absolute configuration assignment, and transformation into sodium salt. J. Pharm. Biomed. Anal. 2017, 140, 38–44. [Google Scholar] [CrossRef]
  45. Liu, R.; Choi, H.S.; Kim, S.-L.; Kim, J.-H.; Yun, B.-S.; Lee, D.-S. 6-Methoxymellein Isolated from Carrot (Daucus carota L.) Targets Breast Cancer Stem Cells by Regulating NF-κB Signaling. Molecules 2020, 25, 4374. [Google Scholar] [CrossRef]
  46. Gritti, F. Rebirth of recycling liquid chromatography with modern chromatographic columns: Extension to gradient elution. J. Chromatogr. A 2021, 1653, 462424. [Google Scholar] [CrossRef]
  47. Zhai, L.; Xu, X.; Liu, J.; Jing, C.; Yang, X.; Zhao, D.; Jiang, R.; Sun, L.-W. A Novel Biochemical Study of Anti-Dermal Fibroblast Replicative Senescence Potential of Panax Notoginseng Oligosaccharides. Front. Pharmacol. 2021, 12, 690538. [Google Scholar] [CrossRef]
  48. Wu, Z.; Ren, S.; Chen, T.; Hui, A.; Zhang, W. Separation and purification of six isoflavones from Iris tectorum Maxim by macroporous resin-based column chromatography coupled with preparative high-performance liquid chromatography. Sep. Sci. Technol. 2020, 55, 1686–1694. [Google Scholar] [CrossRef]
  49. Li, H.; Shi, J.; Li, Y.; Wang, C.; Hou, G.; Cong, W.; Zhao, F. Purification of spinosin from Ziziphi Spinosae Semen using macroporous resins followed by preparative high-performance liquid chromatography. J. Sep. Sci. 2019, 42, 3134–3140. [Google Scholar] [CrossRef]
  50. Arzanlou, M.; Bohlooli, S.; Omid, M.R. Purification of Allicin From Garlic Extract Using Semi-Preparative High Performance Liquid Chromatography. Jundishapur J. Nat. Pharm. Prod. 2015, 10, e17424. [Google Scholar] [CrossRef]
  51. Kumar, P.; Singh, B.; Thakur, V.; Thakur, A.; Thakur, N.; Pandey, D.; Chand, D. Hyper-production of taxol from Aspergillus fumigatus, an endophytic fungus isolated from Taxus sp. of the Northern Himalayan region. Biotechnol. Rep. 2019, 24, e00395. [Google Scholar] [CrossRef] [PubMed]
  52. Hoffmann, N.; Mayer, G.; Has, C.; Kopczynski, D.; Al Machot, F.; Schwudke, D.; Ahrends, R.; Marcus, K.; Eisenacher, M.; Turewicz, M. A Current Encyclopedia of Bioinformatics Tools, Data Formats and Resources for Mass Spectrometry Lipidomics. Metabolites 2022, 12, 584. [Google Scholar] [CrossRef] [PubMed]
  53. Gao, Y.; Xue, A.; Li, X.; Huang, X.; Ning, F.; Zhang, X.; Liu, T.; Chen, H.; Luo, L. Analysis of chemical composition of nectars and honeys from Citrus by extractive electrospray ionization high resolution mass spectrometry. LWT-Food Sci. Technol. 2020, 131, 109748. [Google Scholar] [CrossRef]
  54. Nan, Q.; Hejian, W.; Ping, X.; Baohua, S.; Junbo, Z.; Hongxiao, D.; Huosheng, Q.; Fenyun, S.; Yan, S. Investigation of Fragmentation Pathways of Fentanyl Analogues and Novel Synthetic Opioids by Electron Ionization High-Resolution Mass Spectrometry and Electrospray Ionization High-Resolution Tandem Mass Spectrometry. J. Am. Soc. Mass Spectrom. 2020, 31, 277–291. [Google Scholar] [CrossRef]
  55. Dang, D.H.; Evans, R.D. Application of ESI-HRMS for molybdenum speciation in natural waters: An investigation of molybdate-halide reactions. Talanta 2018, 179, 221–229. [Google Scholar] [CrossRef]
  56. Zhang, Y.; Zhao, Z.; Meng, H.; Li, W.; Wang, S. Ultrasonic Extraction and Separation of Taxanes from Taxus cuspidata Optimized by Response Surface Methodology. Separations 2022, 9, 193. [Google Scholar] [CrossRef]
  57. Zhang, Y.; Zhao, Z.; Li, W.; Tang, Y.; Meng, H.; Wang, S. Separation and Purification of Taxanes from Crude Taxus cuspidata Extract by Antisolvent Recrystallization Method. Separations 2022, 9, 304. [Google Scholar] [CrossRef]
  58. Petrásková, L.; Káňová, K.; Brodsky, K.; Hetman, A.; Petránková, B.; Pelantová, H.; Křen, V.; Valentová, K. Sulfated Phenolic Substances: Preparation and Optimized HPLC Analysis. Int. J. Mol. Sci. 2022, 23, 5743. [Google Scholar] [CrossRef]
  59. Wang, H.-J.; Pan, M.-C.; Chang, C.-K.; Chang, S.-W.; Hsieh, C. Optimization of Ultrasonic-Assisted Extraction of Cordycepin from Cordyceps militaris Using Orthogonal Experimental Design. Molecules 2014, 19, 20808–20820. [Google Scholar] [CrossRef] [Green Version]
  60. Suzer, S.; Strelcov, E.; Kolmakov, A. Comparative Operando XPS and SEM Spatiotemporal Potential Mapping of Ionic Liquid Polarization in a Coplanar Electrochemical Device. Anal. Chem. 2021, 93, 13268–13273. [Google Scholar] [CrossRef]
  61. Bourhim, T.; Villareal, M.O.; Couderc, F.; Hafidi, A.; Isoda, H.; Gadhi, C. Melanogenesis Promoting Effect, Antioxidant Activity, and UPLC-ESI-HRMS Characterization of Phenolic Compounds of Argan Leaves Extract. Molecules 2021, 26, 371. [Google Scholar] [CrossRef] [PubMed]
  62. Gao, D.-X.; Quan, C.; Zhang, W.; Li, H.-M.; Huang, T.; Sun, Y.-Y.; Yan, T.; Liu, J.-B. Purification of folic acid candidate reference material by preparative high-performance liquid chromatography. J. Liq. Chromatogr. Relat. Technol. 2017, 40, 419–427. [Google Scholar] [CrossRef]
  63. Stevens, J.M.; Hamstra, A.; Hegeman, T.; Scharrer, G. Factors and parameters that directly affect recovery of collected fractions in preparative hplc. LC-GC Asia Pacific. 2006, 24, 102–105. [Google Scholar] [CrossRef] [Green Version]
  64. Brandt, A.; Mann, G.; Arlt, W. Temperature gradients in preparative high-performance liquid chromatography columns. J. Chromatogr. A 1997, 769, 109–117. [Google Scholar] [CrossRef]
  65. Fang, D.S.; Wang, Y.W.; Gan, Y.J.; Gao, H.W.; Chen, D.H. Study on Separation and Purification of Taxane Diterpenoids Compound 10-DAB III. China Pharm. 2012, 23, 3879–3881. [Google Scholar]
  66. Lee, J.-Y.; Kim, J.-H. Influence of crude extract purity and pure paclitaxel content on fractional precipitation for purification of paclitaxel. Sep. Purif. Technol. 2013, 103, 8–14. [Google Scholar] [CrossRef]
  67. Liang, Z.; Huang, Y.; Xie, Z.; Xu, X. Application of High-Speed Counter-Current Chromatography for Isolation and Purification of Paclitaxel and Related Taxanes from Taxus chinensis Cell Culture. Sep. Sci. Technol. 2015, 50, 851–858. [Google Scholar] [CrossRef]
Figure 1. The effects of flow rate, injection volume, and column temperature on the purity and recovery rate of the two products (p < 0.05), subfigures representation legend.
Separations 09 00446 g001
Figure 2. Preparative HPLC of Taxus cuspidata extract.
Separations 09 00446 g002
Figure 3. SEM images of (A) product 1 and (B) product 2.
Separations 09 00446 g003
Figure 4. HPLC detection charts of (A) Taxus cuspidata extract (compound 1 was 10-DAT and compound 2 was PTX), (B) 10-DAT standard (a) and product 1 (b), and (C) PTX standard (c) and product 2 (d).
Separations 09 00446 g004
Figure 5. Electrospray ionization-high resolution mass spectrometry (ESI-HRMS) of product 1.
Separations 09 00446 g005
Figure 6. Electrospray ionization-high resolution mass spectrometry (ESI-HRMS) of product 2.
Separations 09 00446 g006
Table 1. Test factor level table.
Factor LevelX1
Flow Rate (mL/min)
X2
Injection Volume (mL)
X3
Column Temperature (°C)
180.525
2101.030
3121.535
Table 2. Range analysis of the effects of table flow rate, injection volume, and column temperature on the purity of the two products.
RunX1X2X3Yi (%)yi (%)
133185.7987.28
212392.4393.37
331390.0591.26
413290.5890.48
523392.6194.31
632289.3590.92
722194.1798.67
821295.3399.15
911192.9693.64
Y - j191.9992.7890.97X1 > X2 > X3
Y - j294.0491.9891.75
Y - j388.4089.6691.70
Rj5.643.120.78
y - j192.5094.6893.20X1 > X2 > X3
y - j297.3894.3293.52
y - j389.8290.6992.98
Rj7.563.990.54
Table 3. Variance analysis of effects of table flow rate, injection volume, and column temperature on the purity of product 1.
Source of VariationSum of SquaresDegree of FreedomMean SquareF-Valuep-Value
X148.910224.455127.4520.008
X215.76727.88341.0860.024
X31.13520.5672.9570.253
Pure error0.38420.192
Total75,374.3629
Note: p < 0.01 indicates that the factors had an extremely significant influence on the test results, and p < 0.05 indicates a significant influence.
Table 4. Variance analysis of effects of the table flow rate, injection volume, and column temperature on the purity of product 2.
Source of VariationSum of SquaresDegree of FreedomMean SquareF-Valuep-Value
X188.082244.041219.6810.005
X229.256214.62872.9650.014
X30.43720.2191.0910.478
Pure error0.40120.200
Total78,346.5379
Note: p < 0.01 indicates that the factors had an extremely significant influence on the test results, and p < 0.05 indicated significant influence.
Publisher’s Note: MDPI stays neutral with regard to jurisdictional claims in published maps and institutional affiliations.

