1. Introduction
The increasing number of attacks on computer networks has put immense pressure on SOC operations. Therefore, SOCs require an intrusion detection system (IDS) that operates effectively in SOC-compatible conditions, while providing high accuracy and transparency [
1]. Signature-based IDS detect known attacks in 70–95% of cases; however, they fail to recognize new threats and generate false-positive volumes that exceed the capacity of SOC analysts [
2,
3]. Machine learning-based intrusion detection systems (ML-IDS) offer significant improvements in detecting attacks, with accuracies for Random Forest (RF), XGBoost, and deep learning algorithms reported in the range of 90–98% based on benchmarking data [
4,
5]. A comprehensive cross-dataset study showed that although machine learning models perform almost perfectly on a given dataset, their accuracy decreases significantly when applied to a new unseen network [
6]. However, ML models face a practical limitation: their decision logic is opaque, making them difficult to understand, audit, and challenge [
6]. Self-supervised learning approaches have demonstrated the ability to reduce dependence on attack-labeled data while maintaining competitive detection performance across diverse network environments [
7]. Moreover, regulatory requirements, such as the General Data Protection Regulation (GDPR), stipulate the necessity of providing rationales for algorithmic decisions [
8], reinforcing transparency as a primary design requirement.
ML-based IDS approaches in the current literature share three operational limitations, motivating the Random Forest-specific focus of this work. First, Random Forest and related ensembles of decision tree learners such as XGBoost expose only the aggregate feature importance at the ensemble level without providing any individual decision thresholds that can be used to configure firewalls [
5,
6,
9]. Second, deep neural networks have substantial weaknesses in terms of stealthy and low-frequency attacks. For instance, in the full-class test suite of CSE-CIC-IDS2018, deep neural networks and convolutional neural networks yielded F1-scores of 0% and 4.73% for the Infiltration categories, respectively, [
10], indicating that macro-accuracy does not imply model robustness. Third, most reviewed ML-based IDS studies were evaluated on a single benchmark dataset, providing insufficient evidence of robustness across heterogeneous SOC environments with different network monitoring infrastructures and feature extractors [
11,
12].
Several approaches based on explainable artificial intelligence (XAI) techniques have been developed to address this transparency deficit. The use of post hoc methods, such as Local Interpretable Model-agnostic Explanations (LIME) [
13] and SHapley Additive explanations (SHAP) [
14], is a common practice in the considered studies and is applied as separate downstream steps after classification. Although these methods improve analyst understanding in controlled settings, they introduce a per-instance latency of 15–300 ms, which is generally incompatible with the sustained SOC throughput requirements [
15]. Beyond latency, attributions computed by post hoc approaches provide a quantified measure of the marginal importance of features; however, they do not specify the exact threshold conditions under which the classifier changes its output. Thus, SOC analysts cannot retrieve the decision condition from an alert record, which limits their ability to audit, challenge, or document individual classification decisions [
16]. In addition, LIME suffers from output variance from repeated queries of identical inputs [
17,
18]. Both LIME and SHAP lack the criteria by which a classifier decides to change its decisions, implying that the decision-making process cannot be inferred from an attribution trace alone [
16,
19]. The combination of these shortcomings renders any such process incapable of providing the consistent audit trail required for SOC-reportable incidents [
16].
Six limitations (G1–G6) were identified in the reviewed literature: (G1) post hoc latency and stochastic inconsistency; (G2) an absence of IF-THEN rules with raw-unit thresholds usable for firewall configuration; (G3) a lack of SOC-compatible MITRE ATT&CK attribution within the classification forward pass; (G4) insufficient cross-dataset validation across incompatible feature extractors; (G5) an absence of statistically validated adaptive feedback that models analyst label noise, missed review rounds, and bounded weekly correction budgets; and (G6) no unified pipeline simultaneously addressing detection, intrinsic explanation, rule deployment, ATT&CK mapping, cross-dataset adaptation, and validated adaptive feedback under sustained SOC throughput conditions. These six limitations were systematically surveyed and mapped against the 12 representative studies listed in the comparison table in
Section 2 [
16,
19].
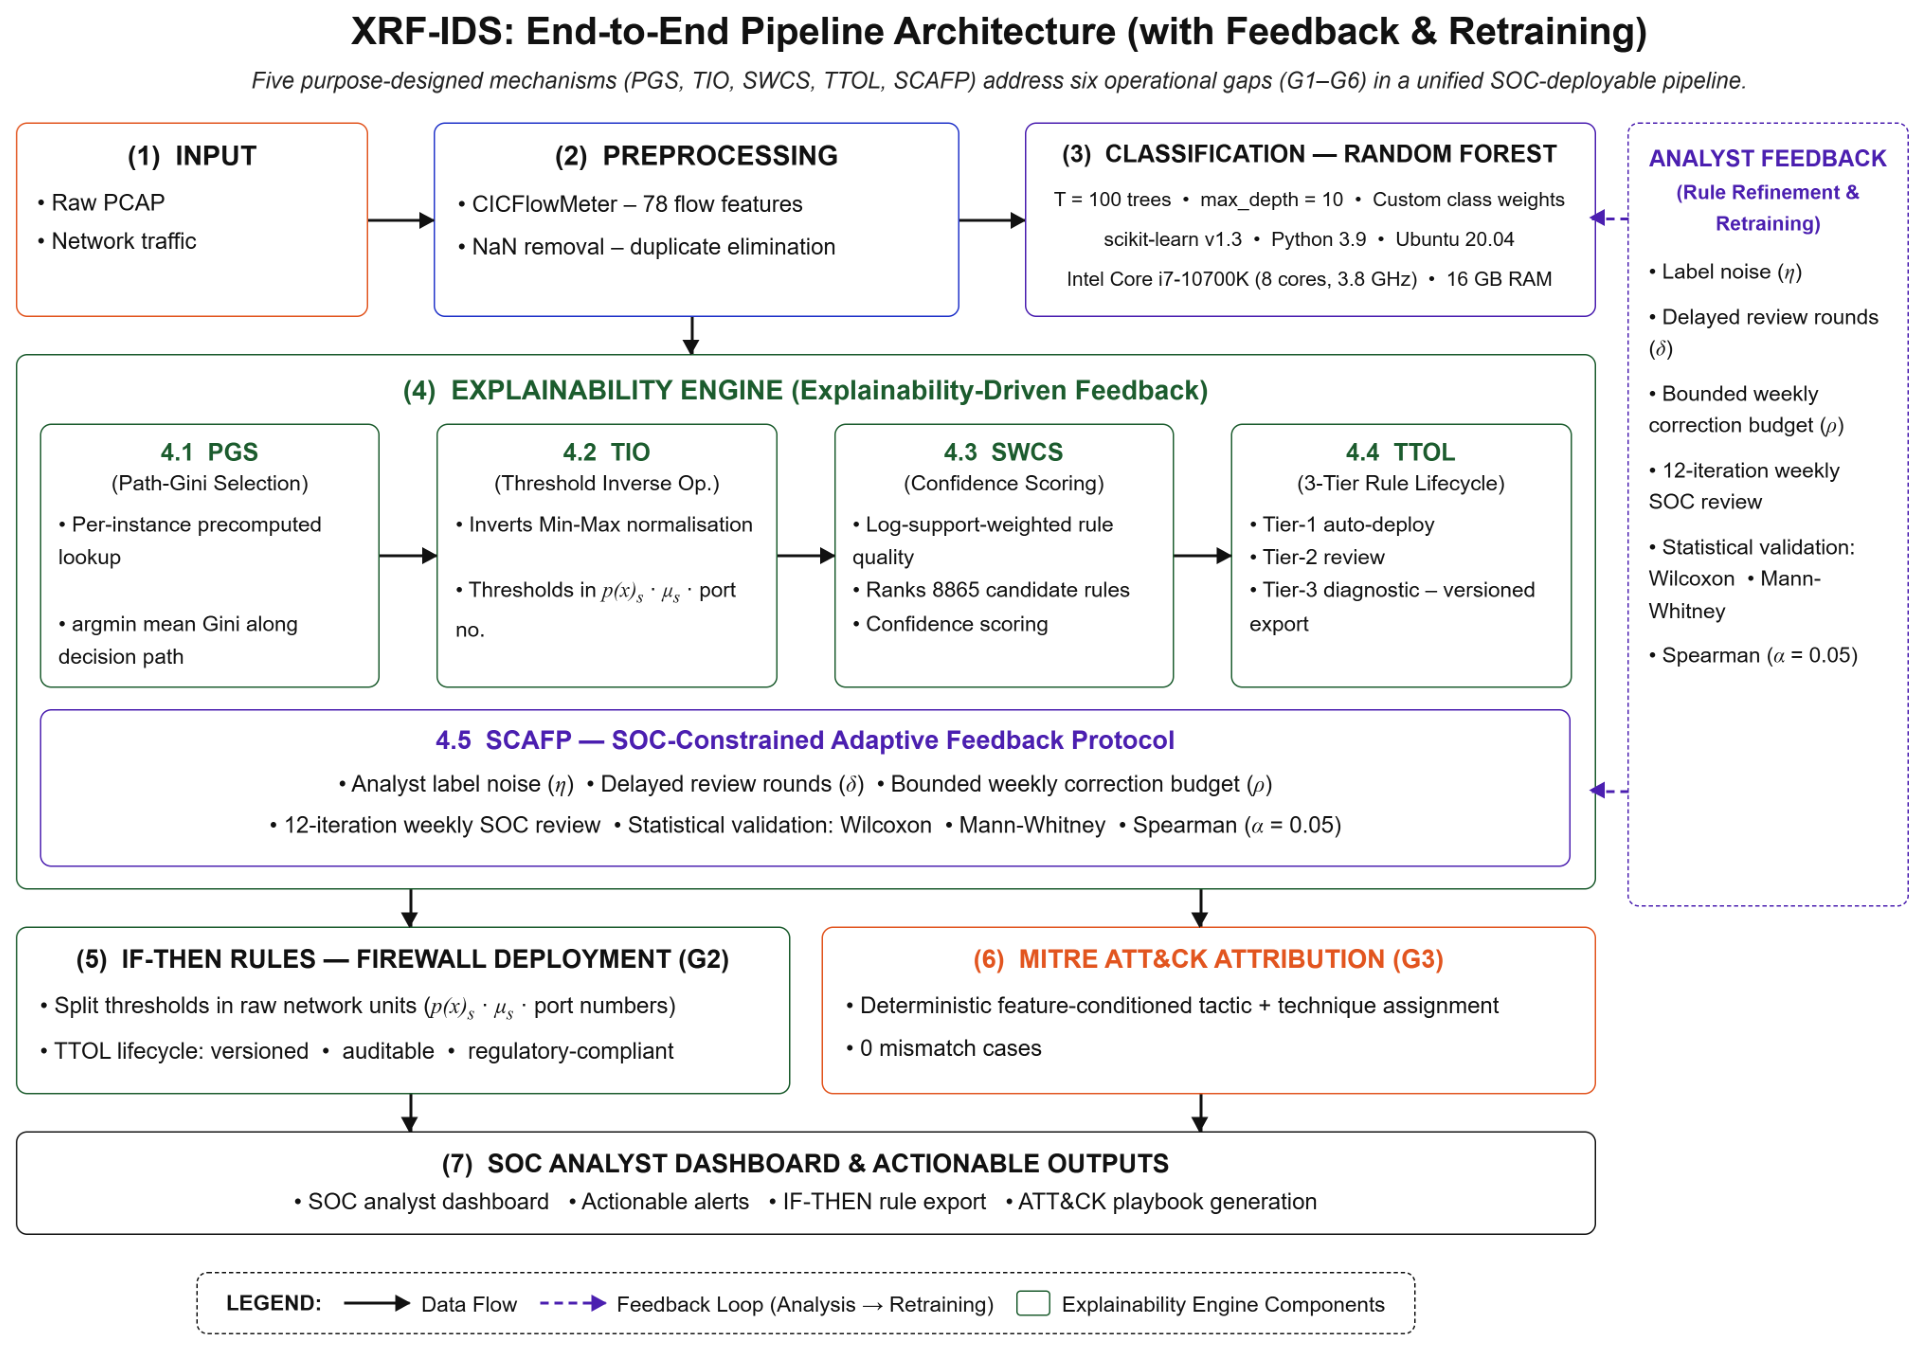
This study proposes an eXplainable Random Forest Intrusion Detection System (XRF-IDS) that jointly integrates intrinsic explainability, raw-unit IF-THEN rule deployment, SOC-compatible MITRE ATT&CK mapping, cross-dataset adaptation, and statistically validated adaptive feedback within a single SOC-oriented detection pipeline. XRF-IDS employs depth-limited RF (
trees, max_depth
) and introduces five purpose-designed mechanisms: Path-Gini Selection (PGS), Threshold Inverse Operationalization (TIO), Support-Weighted Confidence Score (SWCS), Three-tier Operational Lifecycle (TTOL), and SOC-Constrained Adaptive Feedback Protocol (SCAFP), as illustrated in
Figure 1 and formalized in
Section 3.
The novelty of this study is established relative to the two closest prior directions identified in
Section 2. Relative to post hoc explanation frameworks for intrusion detection [
13,
14,
16,
17], which compute feature attributions after classification at a measured cost of 15–300 ms per flow [
15] and do not guarantee agreement with the underlying ensemble decision, the proposed path-selection criterion is computed within the standard forest prediction call, achieves empirically measured fidelity against the ensemble majority vote, and has not been proposed in this form in the surveyed literature. Relative to prior rule-extraction systems that report split thresholds in the normalized feature space and require manual back-transformation before deployment, the threshold reconstruction, confidence-support ranking, and tiered deployment lifecycle introduced here operationalize selected decision paths directly into raw-unit rule specifications, avoiding the manual back-transformation step required by prior methods. The contributions of this work span algorithmic design, specifically the per-instance PGS criterion, three-parameter SCAFP protocol, and system-level integration, jointly enabling SOC-compatible deployment under operational constraints. The main contributions of this study are as follows:
Path-Gini Selection with operationalized rule deployment (PGS + TIO/SWCS/TTOL). The PGS selects the representative decision path per classified flow as
, where
is the mean Gini impurity along tree
t root-to-leaf paths. Unlike population-level rule extraction methods [
20,
21], the PGS operates per instance without incurring additional inference costs. Three complementary mechanisms operationalize the selected path: TIO reconstructs split thresholds in raw network units; SWCS ranks candidate rules using a log-support-weighted confidence score; and TTOL organizes rules into three deployment tiers with automated versioning. The full formalization is presented in
Section 3.5 and
Section 3.6.
SOC-compatible ATT&CK attribution and cross-dataset adaptation. XRF-IDS assigns MITRE ATT&CK tactics and technique identifiers simultaneously with classification through a deterministic feature-conditioned function at a sub-microsecond overhead without an external knowledge base [
22,
23,
24]. The cross-dataset evaluation of NF-ToN-IoT-v3 [
11,
25] (2025) and NF-UNSW-NB15-v2 (2015) across five labeling budgets identified the optimal adaptation of the operating points. The details are provided in
Section 4.5 and
Section 4.6.
SCAFP: Statistically validated adaptive feedback under realistic SOC constraints. SCAFP jointly parameterizes analyst label noise (
), missed review rounds (
), and bounded weekly correction budget (
) constraints, which were absent in previous protocols [
26,
27]. Improvement was validated through three non-parametric tests, and ablation analysis was used to isolate the contribution of each operationally critical parameter. Details are provided in
Section 3.8 and
Section 4.7.
4. Experimental Results and Analysis
This section presents an evaluation of XRF-IDS across seven dimensions: in-domain detection performance, baseline comparison, SOC-compatible throughput and explainability, IF-THEN rule extraction, MITRE ATT&CK mapping, cross-dataset adaptation, and adaptive feedback loop effectiveness. For in-domain detection, the performance was measured via per-class precision, recall, F1-score, and false positive rate, using standard metrics computed against a held-out test set ( flows). A one-vs-rest strategy was used in the multiclass ROC-AUC calculations. The five-fold cross-validation results included the mean accuracy and 95% CI ().
4.1. In-Domain Detection Performance
4.1.1. Overall Accuracy and Stability
Under a random, stratified i.i.d. -style split (
flows, 30% held out), XRF-IDS achieved 97.57% test accuracy, with an out-of-bag (OOB) score of 97.55% (
) [
6]. A complementary temporal-split evaluation (
Section 4.8) yields 89.13% accuracy; the latter reflects deployment on genuinely unseen future traffic rather than traffic drawn from the same time window as training, and constitutes the more operationally realistic generalization estimate of the two. The five-fold stratified cross-validation yielded
(95% CI: [97.45%, 97.66%]), confirming stable performance across all training folds.
4.1.2. Per-Class Detection Metrics
The per-class AUC scores (one-vs-rest) are listed in
Table 8, and the threshold sensitivity for the Infiltration class is discussed in
Section 4.1.4.
Three distinct false-positive quantities are used across this manuscript. The one-vs-rest per-class FPR reported in
Table 8 is defined, for a class
c, as FPR
c = (flows not truly
c, predicted as
c)/(total flows not truly
c). Under this definition, the Normal row’s FPR
counts attack flows incorrectly predicted as Normal, relative to all actual attack flows. The operational IDS false-positive rate, used from
Section 3.8 onward, counts truly-Normal flows incorrectly flagged as any attack class, relative to all Normal flows; this is the SOC-relevant alert-volume metric. The SCAFP FPR is identical in definition to the operational false-positive rate, tracked over the 12-week deployment simulation.
4.1.3. Confusion Matrix Analysis
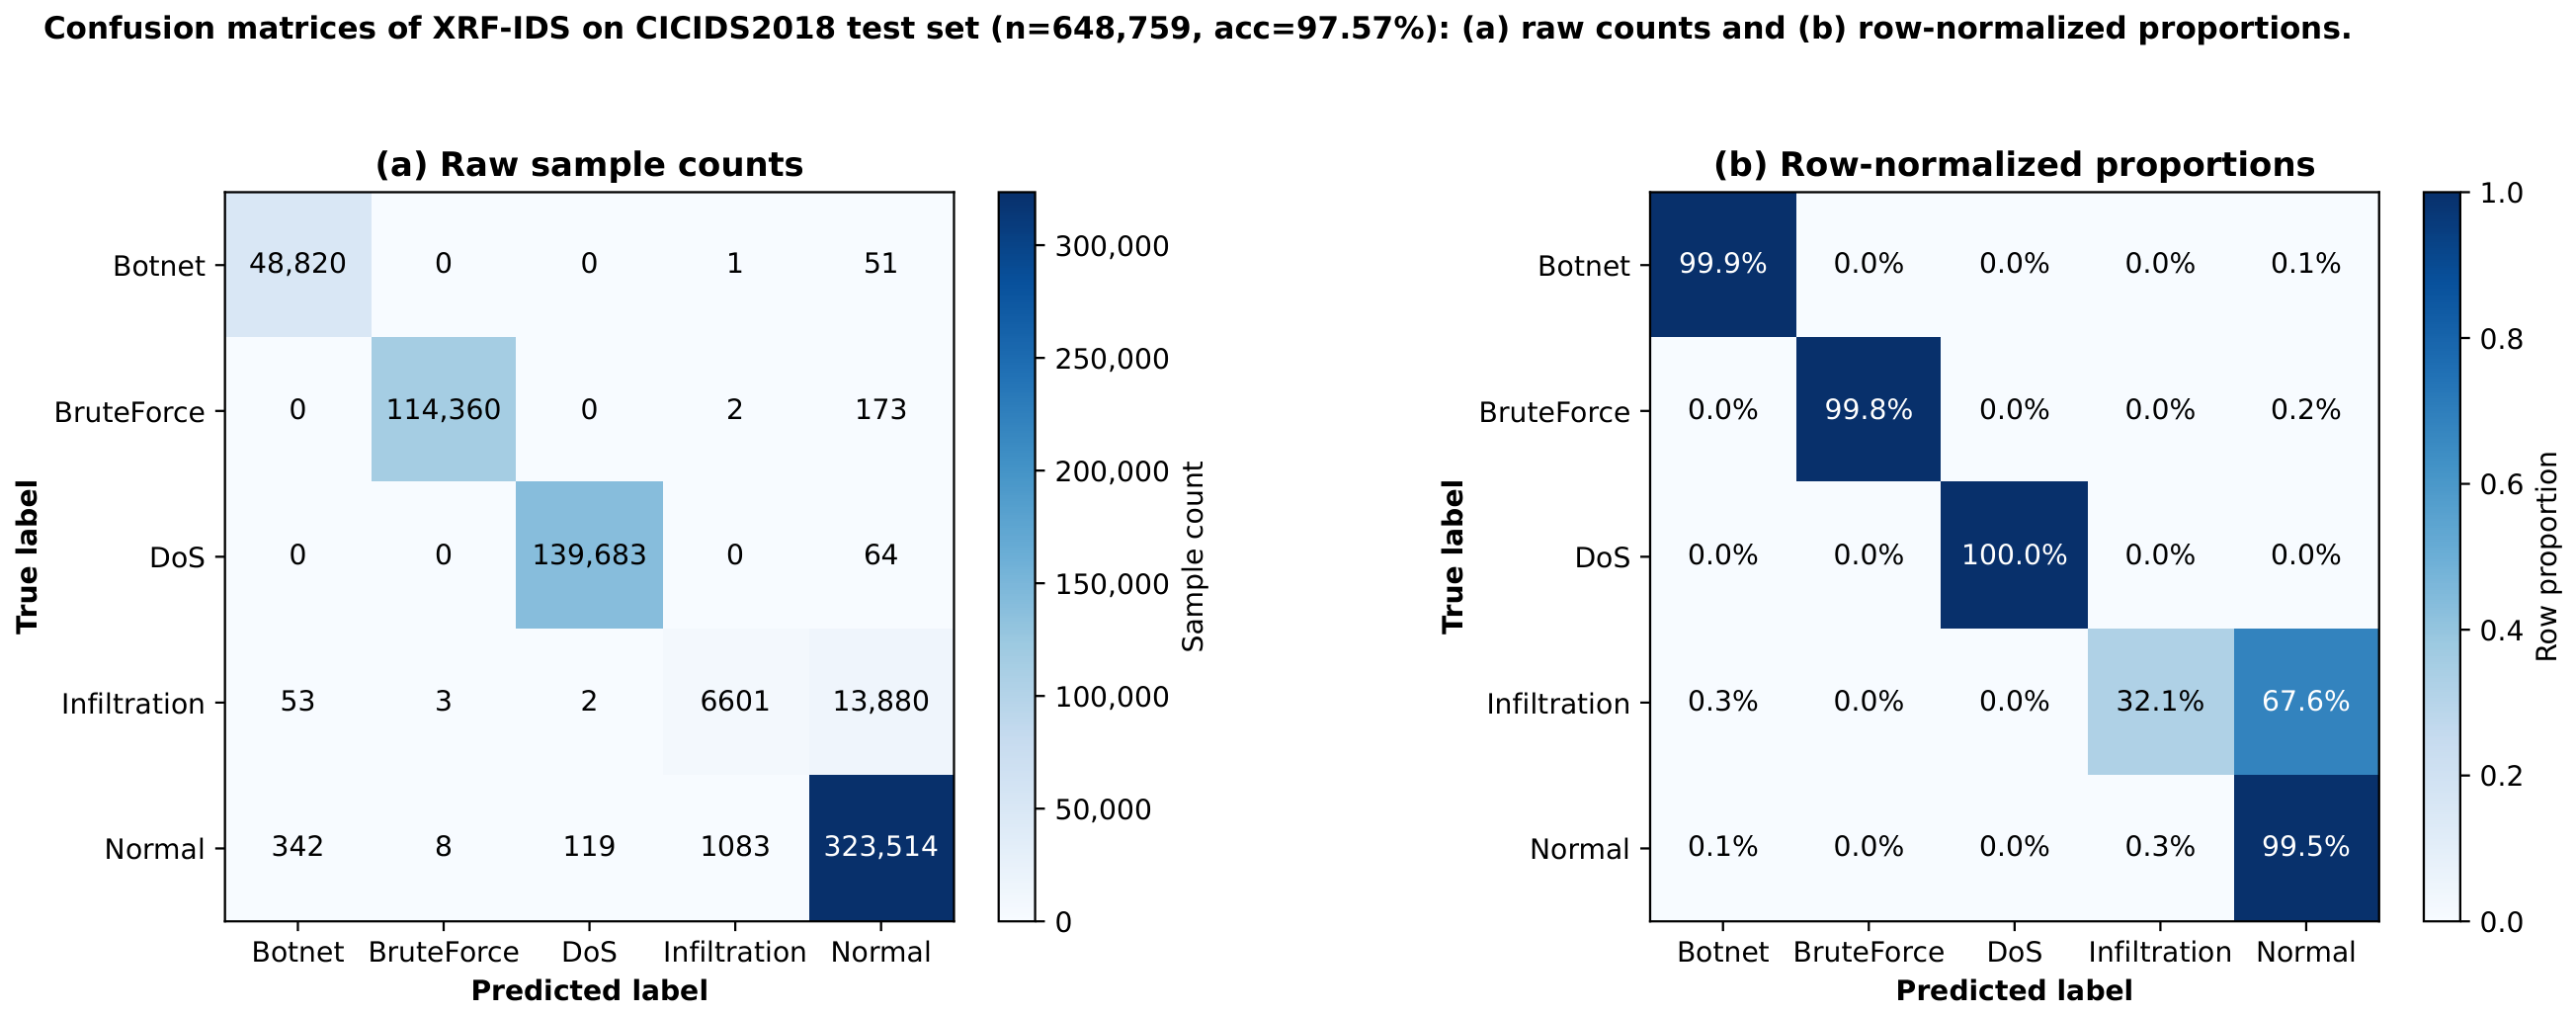
Off-diagonal concentrations are localized exclusively to the Infiltration row (
Figure 2), where 67.6% of true Infiltration flows are misclassified as Normal, consistent with the single-packet probe profile documented in
Appendix A.
4.1.4. Infiltration Class Analysis
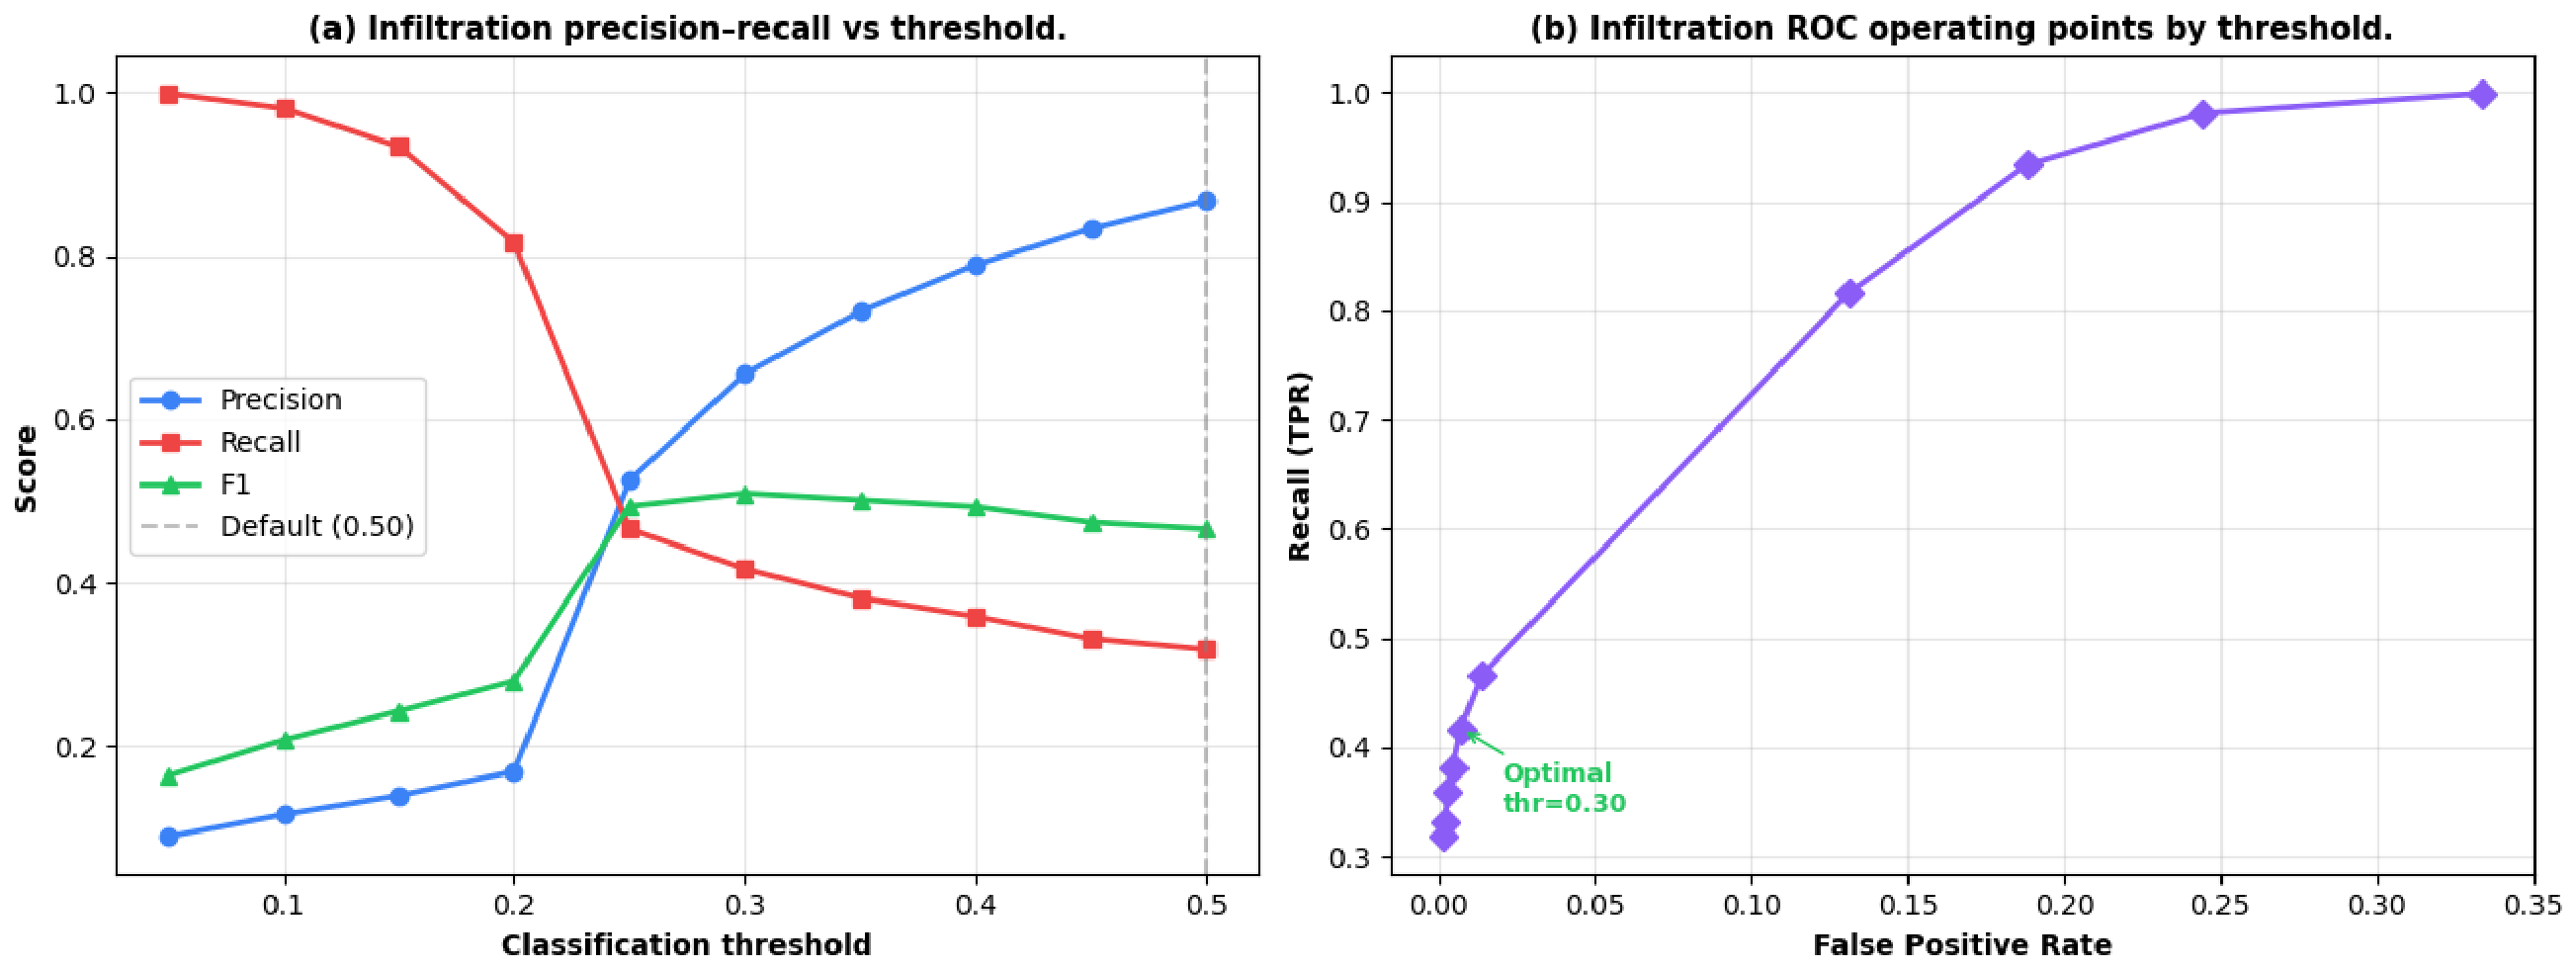
Threshold calibration was performed for the Infiltration class (
Figure 3). At the default threshold (
), Infiltration recall was 32.14% (
Table 8). The threshold sweep (
Figure 3a) shows recall increasing and precision decreasing as
is lowered; the recommended operating point at
(
Figure 3b) raises recall to 41.7% at a false positive rate of 0.72% (AUC
), evaluated on the
stratified test flows. For additional validation, the same operating point was re-evaluated on the full 648,759-flow hold-out partition (
, 25× larger), confirming Recall
and yielding F1
(Precision
) at 97.35% overall accuracy, consistent with the smaller-sample result and validated at substantially higher statistical power.
The threshold sweep reveals a sharp discontinuity between
(Rec
, FPR
) and
(Rec
, FPR
), indicating that approximately 40% of Infiltration flows receive posterior probabilities in the ambiguous range
where the model cannot assign a confident class decision. Lowering the threshold further to
raises recall to 98.09% but collapses precision to 11.60% (F1
, overall accuracy
), generating approximately 133,000 false alarms on the test partition confirming
as the optimal operating point. The class weight sweep confirms the same constraint: F1 peaks at weight
(F1
) and collapses at weight
(F1
, overall accuracy
, Normal recall
), generating 435 false alarms per 1000 legitimate flows and an operationally unacceptable false-positive volume [
3]. The domain rule (Fwd_Pkt_Len_Max
AND Tot_Fwd_Pkts
) adds zero improvement beyond
threshold calibration, confirming that port scan probes and legitimate single-packet flows are statistically indistinguishable in the CICFlowMeter feature space.
The difficulty of detecting Infiltration is well documented in the literature. Cheng et al. [
10] reported that DNN achieved F1
and CNN achieves F1
on the same CSE-CIC-IDS2018 dataset; XRF-IDS at
is approximately
better than the best published deep learning result on this class. Hajj et al. [
29] excluded Infiltration entirely from their evaluation. Fernandes et al. [
43] demonstrated that a dedicated LSTM combined with Tomek links and random undersampling still achieves a sensitivity
for this class. Liu et al. [
44] documented errors throughout the CSE-CIC-IDS2018 creation lifecycle, including attack orchestration, feature generation, and labeling. Goldschmidt and Chudá [
12] identified Infiltration under-representation as a primary benchmark limitation. An AUC of 0.9432 confirmed that XRF-IDS correctly ranked Infiltration flows above Normal in 94.32% of the cases, but the decision boundary could not be crossed cleanly without generating operationally unacceptable false-positive volumes. XRF-IDS does not purport to be a complete Infiltration detection solution; resolution requires inter-flow temporal features from flow sequences grouped by source IP, identified as the primary future direction.
4.1.5. Feature Importance Analysis
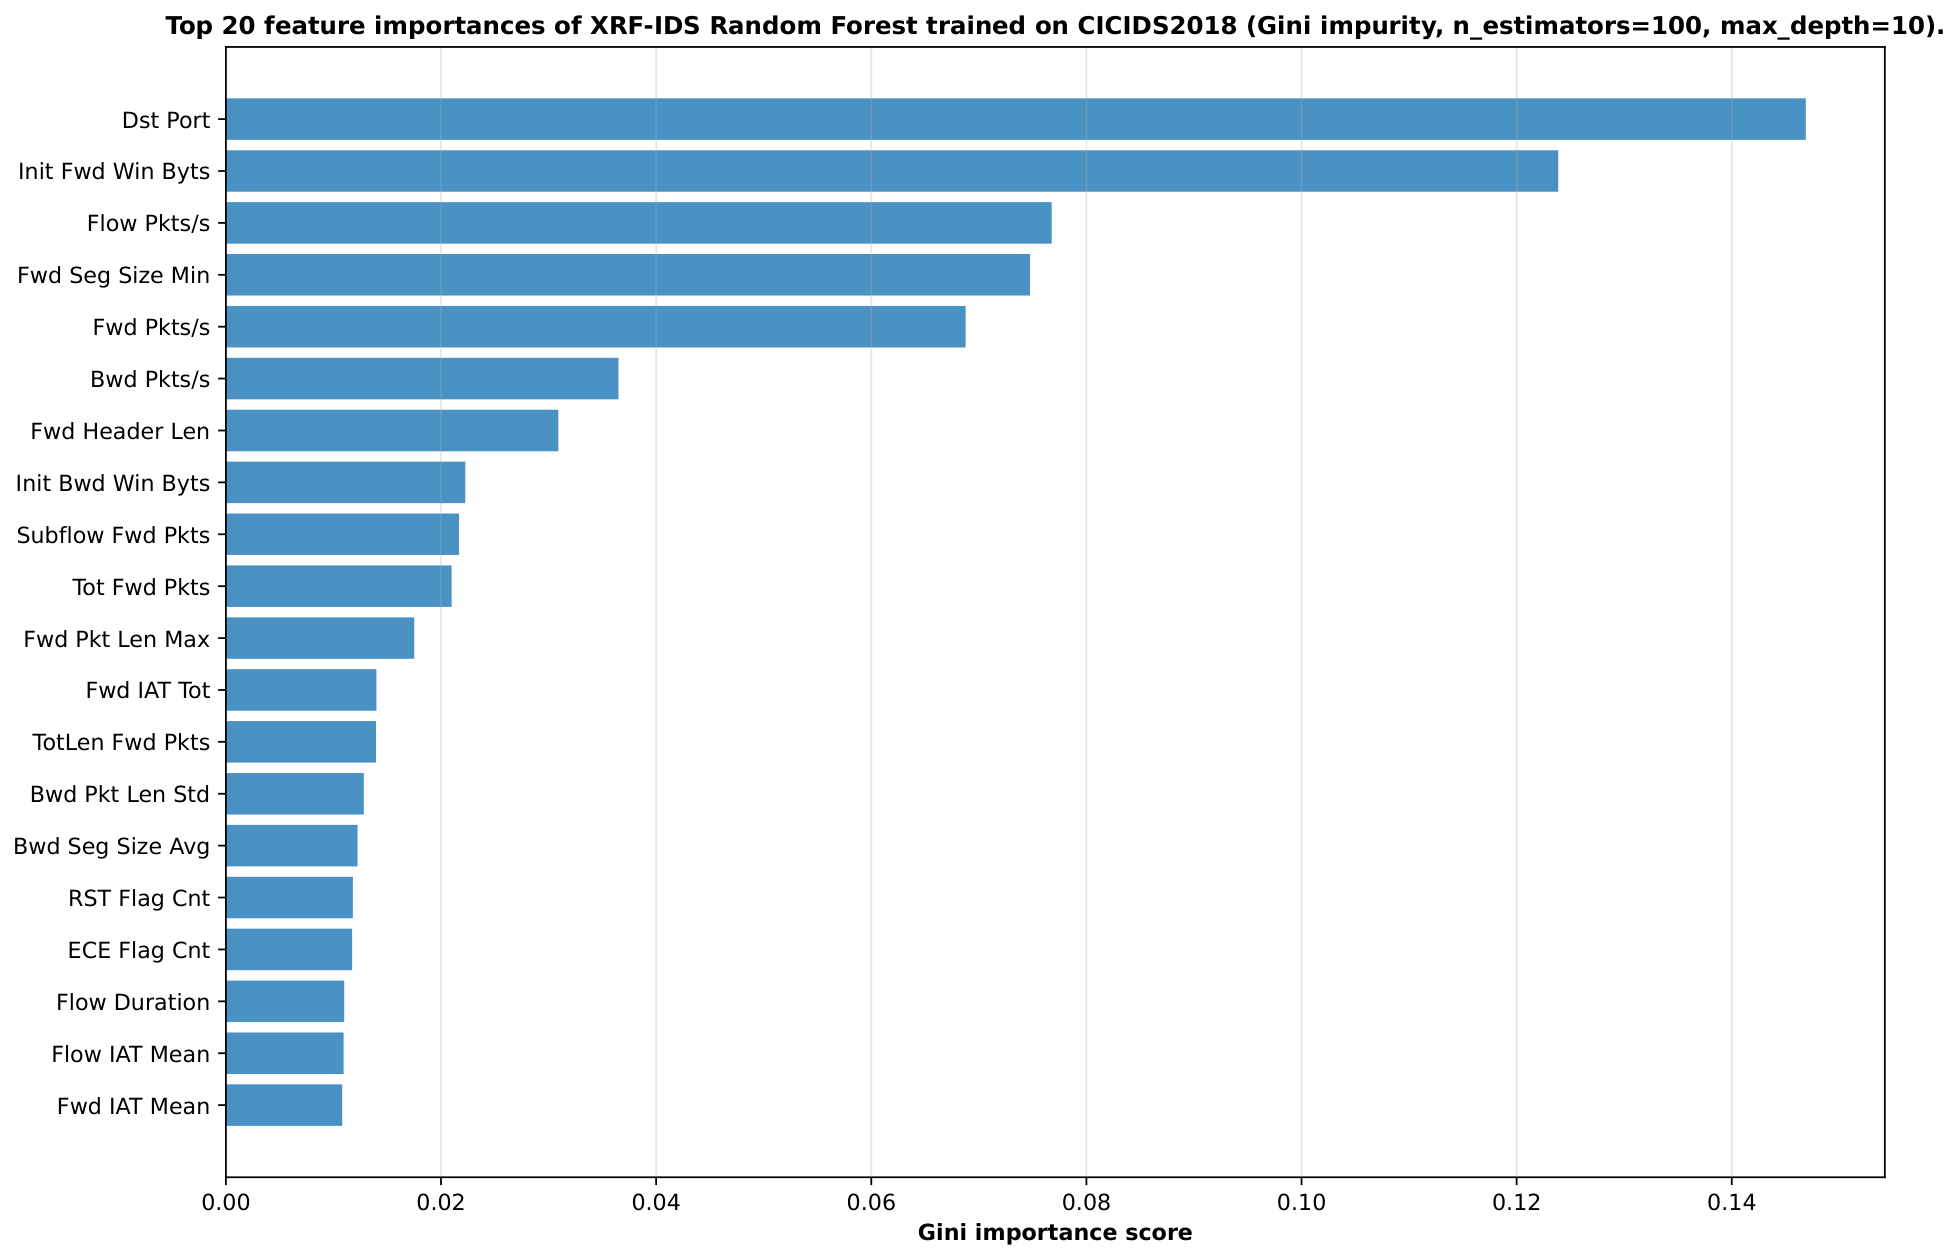
Figure 4 shows the top-20 Gini importance scores. The two highest-ranked features were Dst Port (14.69%) and Init Fwd Win Byts (12.39%), which jointly accounted for 27.08% of cumulative importance. Port-based discrimination is evident in the feature importance ranking: DoS targets port 80, BruteForce targets port 22, and Botnets use a non-standard high port.The initial window-byte size discriminates between Botnets (small window, ≤32,737 B) and DoS (large window, >26,722 B). Packet rate and header-length features collectively capture volumetric and connection-setup signatures that differentiate BruteForce from Normal and Infiltration from Normal at finer granularities [
2,
5].
4.2. Baseline Model Comparison
Table 9 compares XRF-IDS against six baselines on the same hold-out set: Decision Tree (max_depth
), XGBoost, LightGBM, RF + SMOTE, RDTIDS proxy [
20] (Decision Tree at depth 6, re-implementing the methodology of [
20]), and inTrees proxy [
21] (RF path extraction on the full 648,759-flow hold-out partition, re-implementing the methodology of [
21]). XRF-IDS achieved the highest accuracy (97.57%) and macro precision (0.9704). The Decision Tree baseline at identical depth yields 80.75% accuracy (a 16.82 pp gap), confirming that the RF ensemble provides substantial accuracy gains over a single interpretable tree, while XRF-IDS recovers single-tree interpretability through PGS path selection.
4.3. SOC-Compatible Throughput and Explainability Latency
4.3.1. End-to-End Latency and Throughput
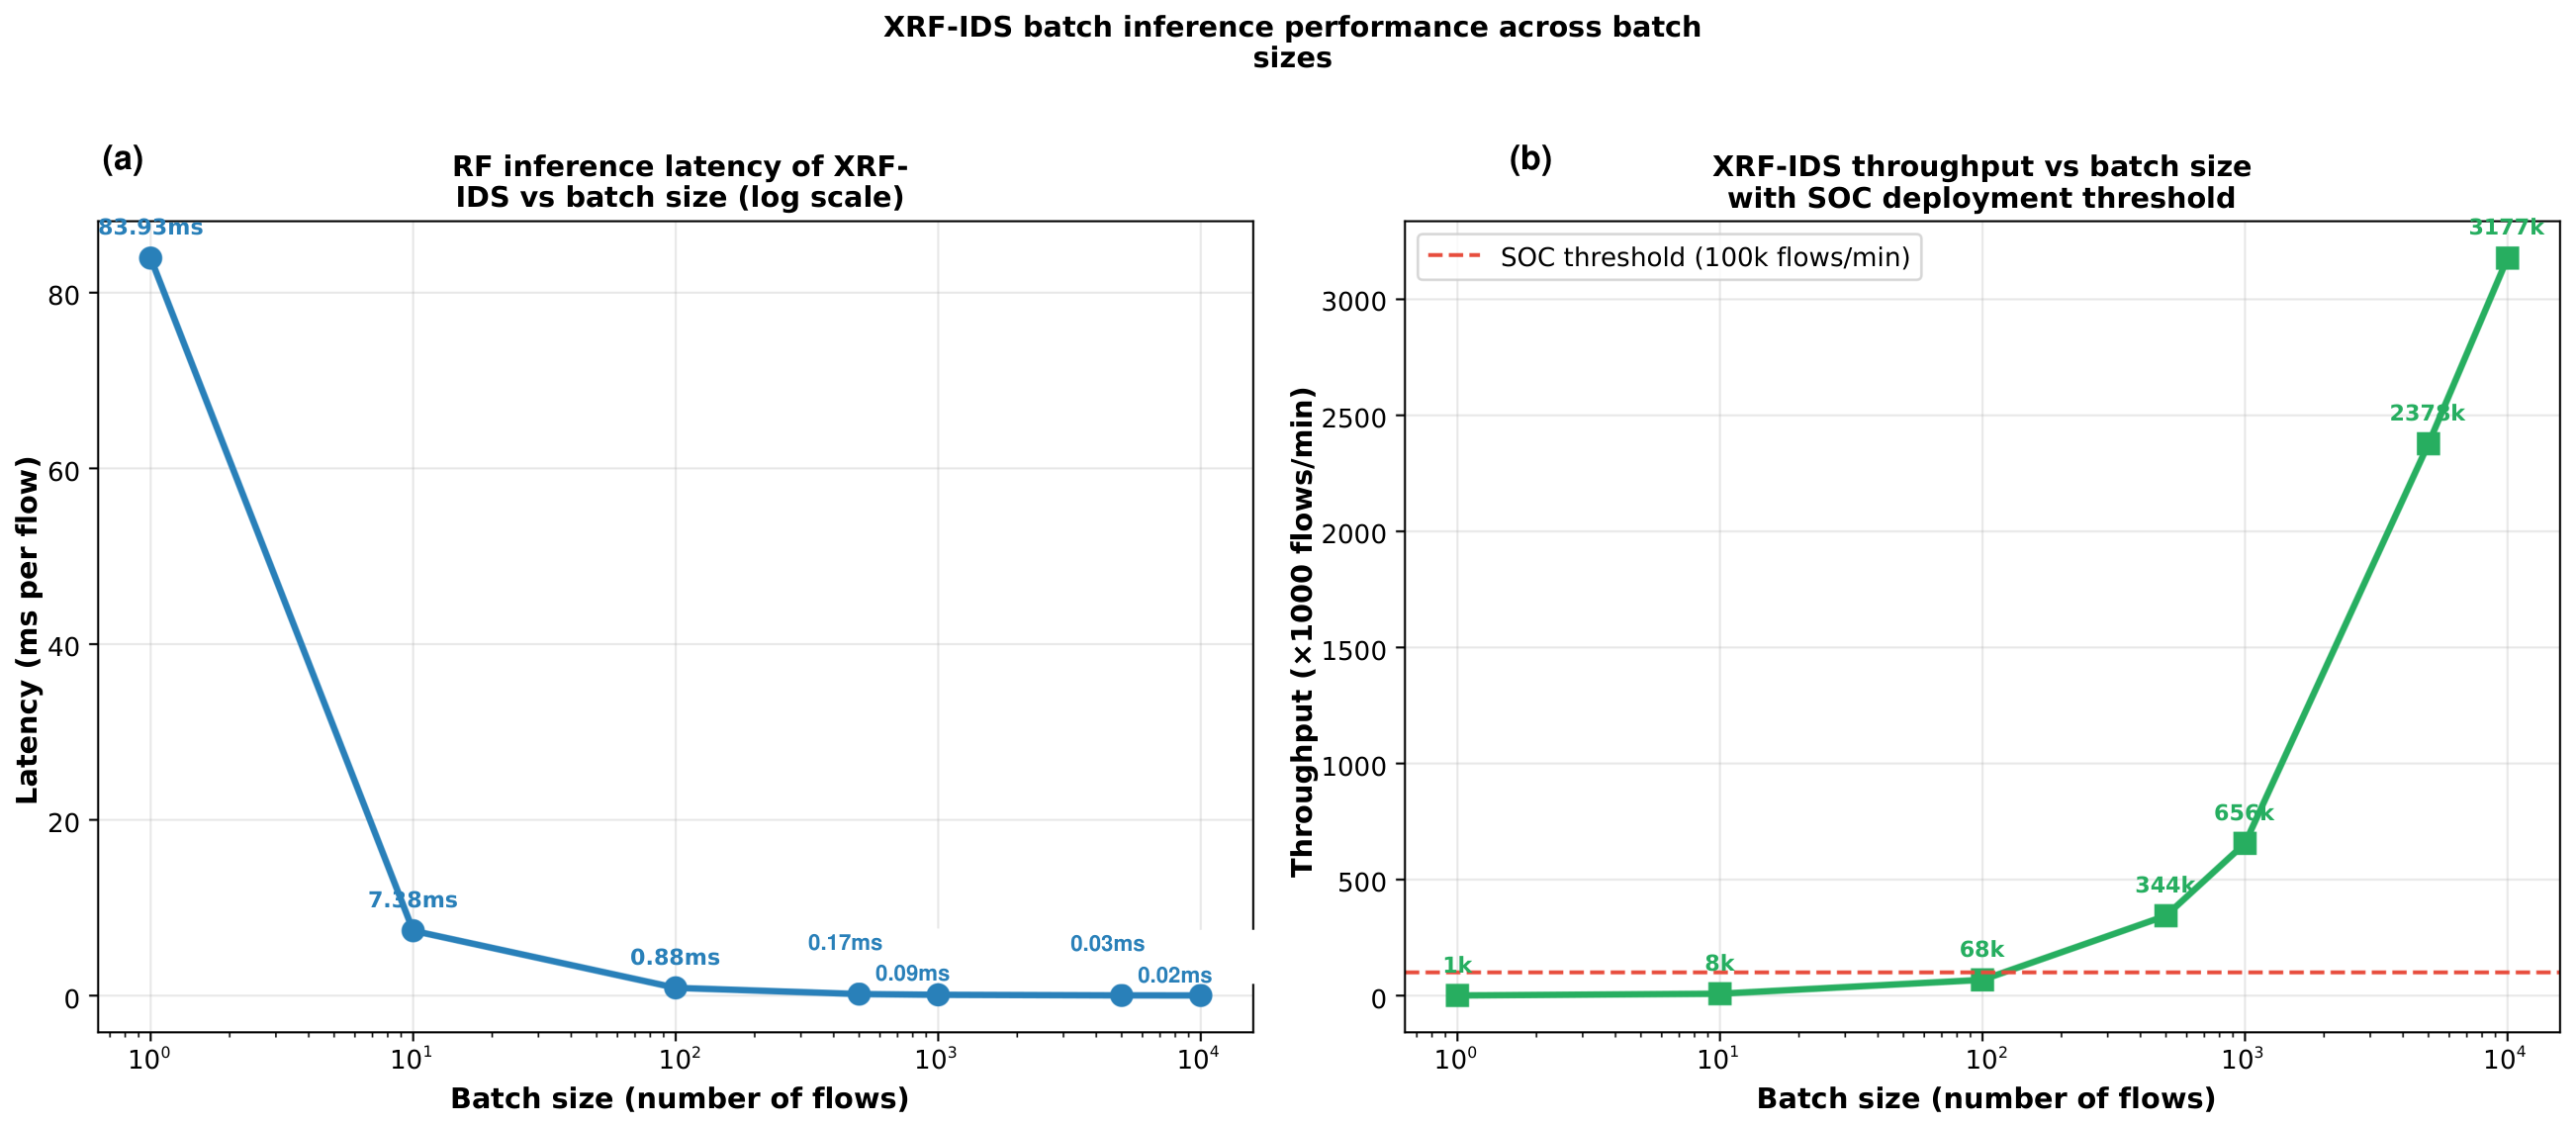
XRF-IDS achieved a maximum throughput of 3,177,431 flows/min at a batch size of 10,000, which was approximately 32 times higher than the SOC threshold [
3] (
Figure 5). Throughput exceeded 100,000 flows/min for all batch sizes from 500 onward. This throughput measurement covers the RF classification step only and does not include upstream feature extraction latency (CICFlowMeter: approximately 50–200 ms per flow depending on hardware), log ingestion, alert enrichment, or SIEM integration overhead. End-to-end SOC pipeline profiling is identified as a future evaluation priority.
4.3.2. Explainability Latency Comparison
Table 6 quantifies the latency and throughput advantage of PGS over SHAP and LIME. Beyond throughput, PGS provides four structural properties absent from post hoc methods: (i) deterministic per-instance explanations: identical inputs always produce identical outputs [
16]; (ii) a 99.36% empirical ensemble fidelity, verified on the full 648,759-flow hold-out partition (
Table 5), with disagreements flagged for analyst review; (iii) raw-unit threshold conditions: TIO reconstructs thresholds in raw network units (port numbers, pkt/s, μs) that map directly to firewall rules without post-processing [
16]; and (iv) zero inference overhead: the 0.13 s precomputation occurs once at training time. Concurrent multithread workload testing and end-to-end integration with a live SIEM pipeline have not yet been performed and are identified as the primary future evaluation directions.
4.4. IF-THEN Rule Extraction Quality
The generation of rules via the SWCS and TTOL, starting from the customized RF_rules model, resulted in 8865 candidate rules for four attacks (Botnet, BruteForce, DoS, and Infiltration). The DoS rules had the highest mean support value because of their volumetric and high-rate flooding nature, whereas the Infiltration rules have the lowest mean support value because of their low volume and stealthy attack nature. After filtering based on the quality scores (
5) and deduplication of conditions, 500 rules were selected to be unique in structure. TTOL assignment resulted in 499 Tier-1 rules (confidence
, support
), one Tier-2 analyst-review rule, and zero Tier-3 diagnostic-only rules. A large number of Tier-1 rules indicate high separability of CSE-CIC-IDS2018 according to the defined thresholds, and datasets with lower separability result in balanced TTOL assignments [
6]. The 499 Tier-1 rules have an average confidence of 98.7% and an average support of 27,413 training samples, while their average complexity is
, consistent with max_depth = 10. Coverage analysis showed that the top 20% of rules (100 rules) accounted for 25.3% of attack detections at a 99.2% mean confidence [
1].
4.5. MITRE ATT&CK Mapping Implementation Check
Table 10 presents
an implementation correctness check. The class-to-technique mapping is defined a priori in
Section 3.7 using signatures derived from training-partition feature ranges (
Appendix A); the table confirms that the deterministic function correctly implements this pre-defined mapping without a lookup or logic error. Independent, instance-level expert validation of the mapping’s semantic accuracy, ideally with inter-rater agreement across multiple analysts, is identified as future work. The rationale for each mapping, including the class-level heterogeneity of DoS and Infiltration, is detailed in
Section 3.7. Beyond correctness, this mapping is also unlike other attempts to integrate ATT&CK into the security process pipeline [
24] that require annotation of pre-existing signatures offline and techniques such as [
22,
23] that require knowledge graph lookups at an average execution time of 100–200 ms per flow. XRF-IDS performs attribution within the classification forward pass in sub-microseconds of overhead without external knowledge sources or unstructured inputs. Specifically, the mapping latency of XRF-IDS is <1 μs per flow, repeatedly measured, which is three orders of magnitude faster than that of knowledge graph [
22] (100–200 ms) and text-based [
23] (requires unstructured inputs unavailable from raw flow records) methods. A feature-conditioned refinement rule additionally reclassified 3.2% of the BruteForce detections based on Fwd Pkts/s exceeding 10,000 pkt/s, correctly reassigning all to the impact tactic (TA0040) and demonstrating extensibility. This evaluation covers four kill-chain phases, and broader validation across the full ATT&CK taxonomy is left for future research [
3].
4.6. Cross-Dataset Adaptation
4.6.1. Domain Gap and Adaptation Efficiency
The experimental conditions are presented in
Table 11; the combined-data retraining procedure is described in
Section 3.4. Cross-dataset evaluation uses binary (Benign/Attack) classification to bridge the incompatible class taxonomies of CSE-CIC-IDS2018 and NF-ToN-IoT-v3, with 91.6% representing a conservative lower bound, as WebAttack and Reconnaissance misclassifications were counted as errors [
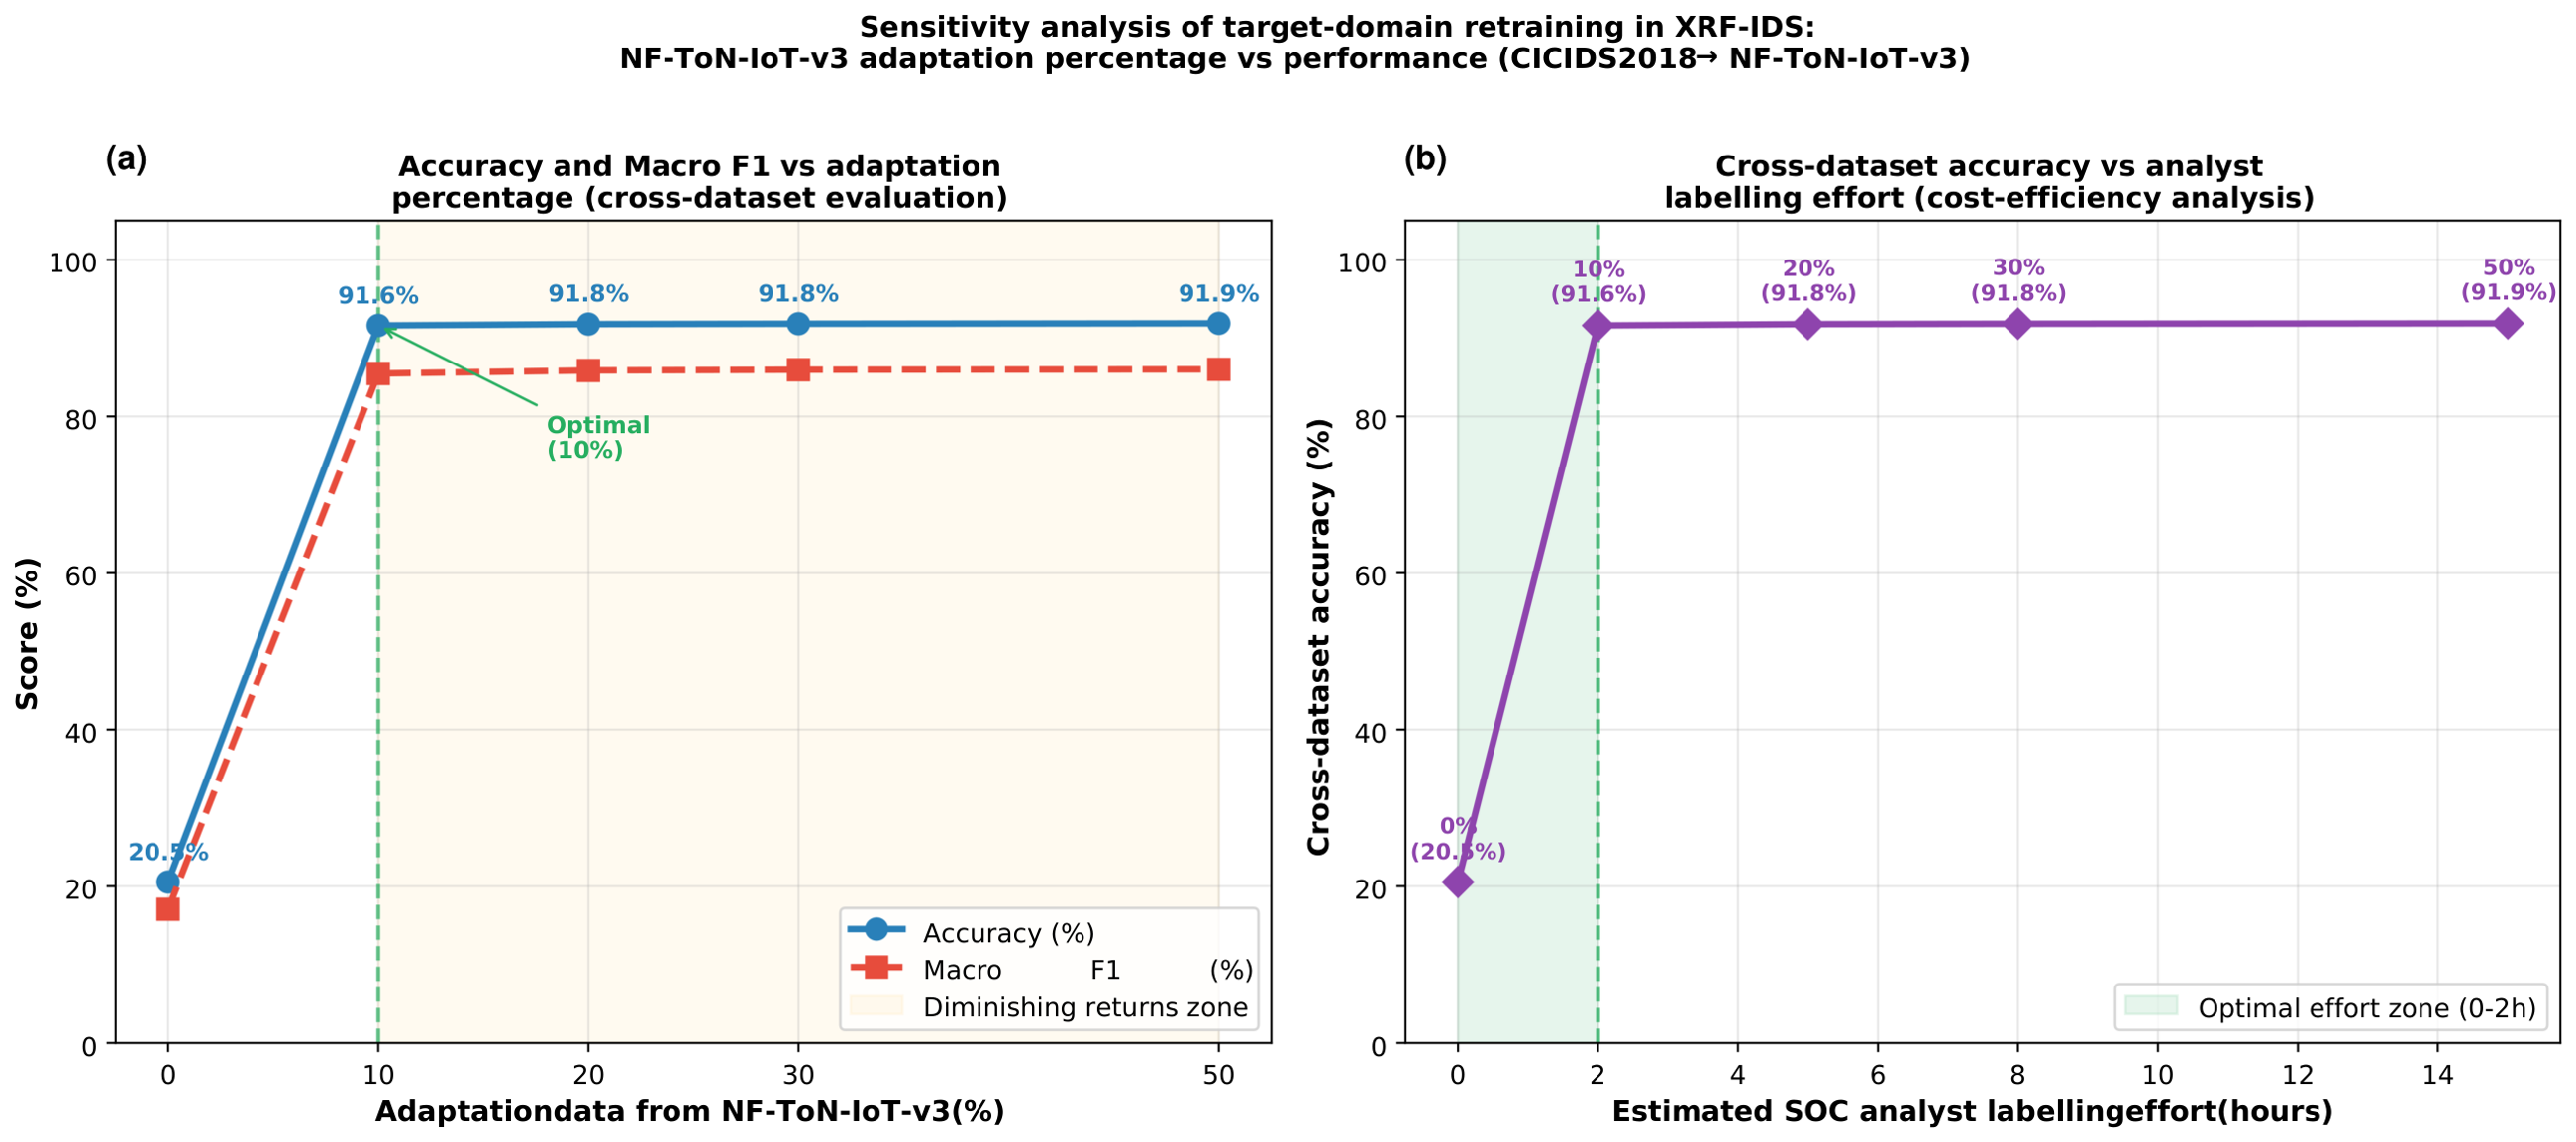
11]. The direct transfer condition achieved 20.5% accuracy on NF-ToN-IoT-v3, confirming the well-documented domain gap between CICFlowMeter and NetFlow/nProbe extractors [
6,
14]. Target-domain retraining with 10% labeled NF-ToN-IoT-v3 flows (≈39,005 samples) achieved 91.6% accuracy and a gain of 71.1 pp. The zero-shot evaluation on NF-UNSW-NB15-v2 achieves 94.66% overall accuracy but Attack F1
(
Table 12), an apparent contradiction explained by class imbalance: with 3.78% attack prevalence, a classifier predicting all flows as Benign achieves 96.22% accuracy. The near-zero Attack F1 confirms that the model identifies no attacks in the zero-shot mode and that the overall accuracy is a misleading metric in this imbalanced setting.
4.6.2. Adaptation Sensitivity Analysis
Accuracy and macro F1 rose sharply between 0% and 10% adaptation data, and then plateaued with marginal improvements of 0.3 pp between 10% and 50% (
Figure 6). At 200–500 binary triage decisions per hour, a 10% adaptation budget requires approximately 78–195 h of analysis. The active learning selection of the 3,900 most uncertain flows reduces this process by approximately 8 h. These results identified 10% as the optimal operating point, maximizing the accuracy per analysis hour [
2,
6]. This diminishing-return characterization is not available for any single-condition cross-dataset evaluation in the reviewed literature. For the NF-UNSW-NB15-v2, five independent seeds were evaluated for each budget. On average, the cost-optimal point is 0.50% adaptation (10,000 flows, mean Attack F1
); however, this optimum is not consistent across all five seeds individually. The per-seed optima range from 0.25% to 1.01%, and the result should therefore be interpreted as mean-optimal rather than universally optimal. The decrease in mean Attack F1 from 0.50% to 1.01% (
) falls within one standard deviation and is not statistically significant. In contrast, the further decline to 1.89% (
,
) exceeds the standard deviation observed at 1.89% (
) and constitutes a real, statistically distinguishable effect: beyond the cost-optimal budget, additional NF-UNSW-NB15-v2 samples begin to overfit the combined training set toward the target-domain feature distribution, mildly displacing the CSE-CIC-IDS2018 source representation rather than continuing to close the residual domain gap [
11].
4.7. Adaptive Feedback Loop Results
4.7.1. Performance Evolution and
Statistical Significance
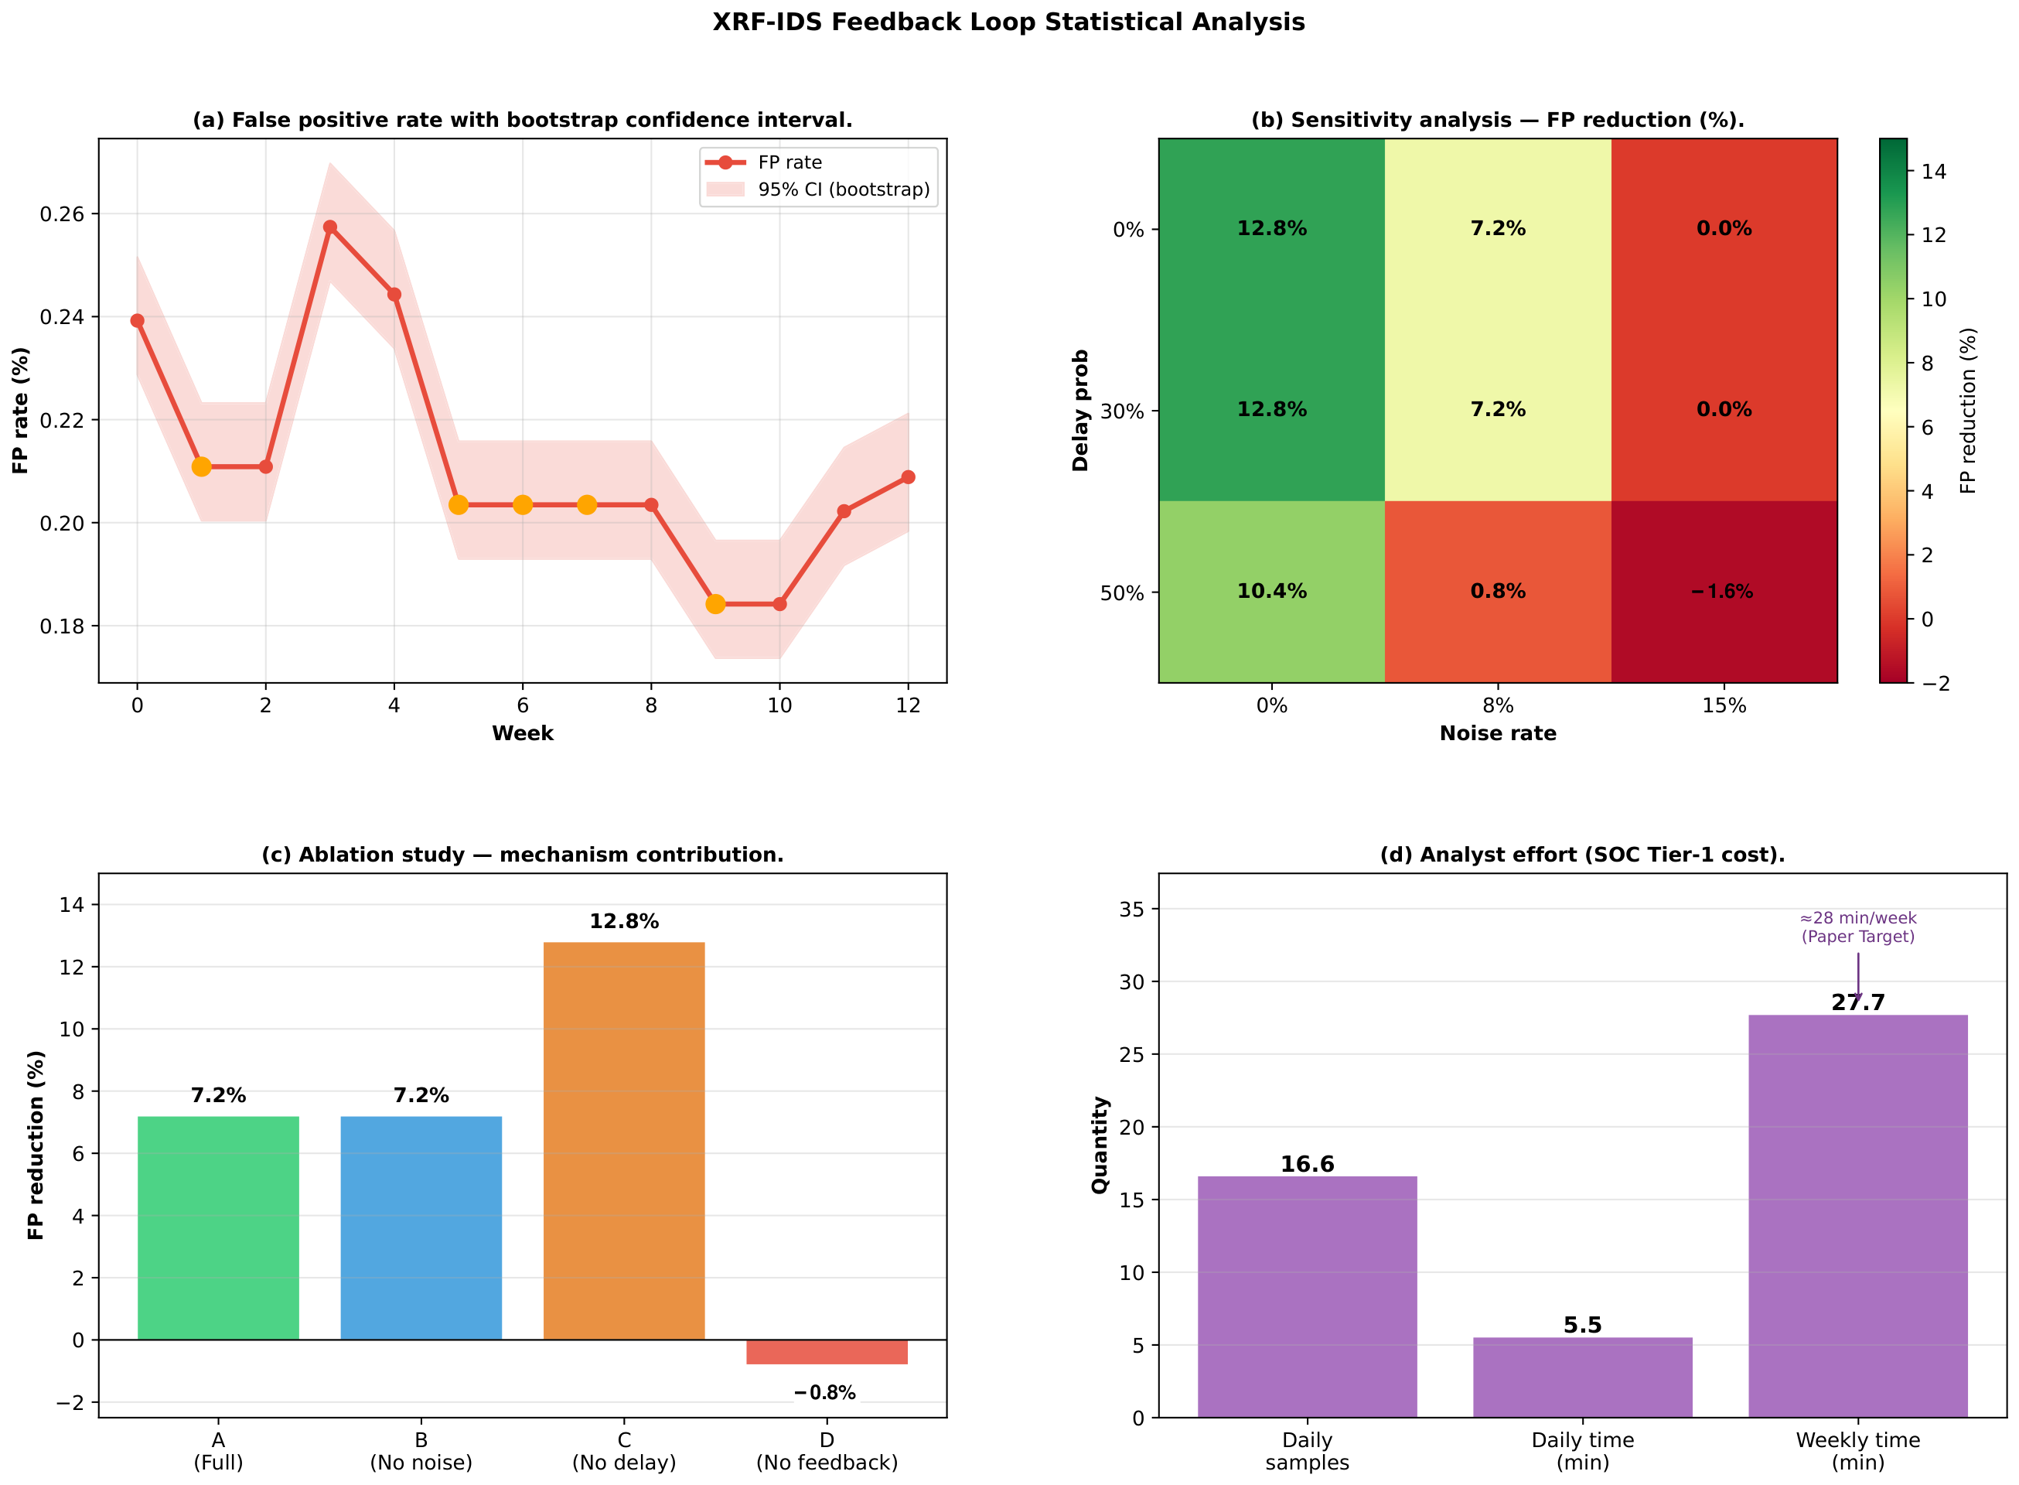
Figure 7 presents the evolution of the accuracy, false-positive rate, and false-negative rate over the 12-iteration simulation under the full SCAFP constraint model (
Section 3.8). The FPR values at each iteration were computed over the monitoring-window partition used during the iteration’s simulated deployment cycle, not over the static held-out test partition reserved for in-domain evaluation. The two partitions were drawn from the same CSE-CIC-IDS2018 distribution but were independently evaluated to preserve the integrity of the test set. The FNR decreased from 2.185 to 2.175% over the same period. The total SCAFP analyst effort comprises 998 corrections across 12 iterations (≈83 per iteration; ≈28 min/week at 20 s/decision) [
1,
3].
Table 13 presents three non-parametric tests applied to the FPR trajectory across the 12 feedback iterations (weeks 1–12; week 0 is the pre-feedback baseline and is excluded from this comparison). The Mann–Whitney
U test used in earlier analysis assumes independent samples, an assumption violated by the sequential, model-retraining structure of the weekly simulation; it is replaced here with the Mann–Kendall trend test, which is appropriate for time-ordered, dependent observations. All three tests are individually significant at the uncorrected
level; however, a Bonferroni correction for three tests (
) shows that only the Spearman trend correlation survives (
,
). The 12-week horizon was chosen to approximate a standard quarterly SOC review cycle for a proof-of-concept deployment; it necessarily limits the statistical power available to detect anything beyond a moderate-to-large effect. This is reflected directly in the results: the Wilcoxon signed-rank effect size is small (rank-biserial correlation
), and a bootstrap 95% confidence interval on the first-half-versus-second-half FPR difference is
percentage points, consistently positive, confirming the direction of the reduction, but narrow and close to zero at the lower bound, which is the expected signature of a small sample rather than evidence against a real effect. These results should therefore be read as an indicative, first-pass characterization of SCAFP’s effectiveness rather than a high-power confirmatory test. We interpret these results cautiously: the downward FPR trend over the 12-week deployment simulation is statistically supported by the Spearman trend correlation, which does not require the independence assumption violated by the sequential simulation structure and remains significant after correction for multiple comparisons. The Wilcoxon and Mann–Kendall results are directionally consistent but are not treated as independent confirmatory evidence given this correction. Both the Wilcoxon and one-sample
t-tests are conducted as one-sided tests (testing specifically for a decrease in FPR), justified by the mechanism’s design: SCAFP corrects confirmed false positives through analyst feedback, so the only scientifically plausible outcomes are a reduction in FPR or no effect; an increase is not a mechanistically plausible alternative. This directional hypothesis was specified prior to observing the results, rather than selected post hoc.
To address the single-simulation-run limitation noted above, the full 12-week deployment simulation was independently repeated five times with varying random seeds (
Table 14). All five runs show a positive FPR reduction, ranging from
to
(mean
, 95% CI
, entirely above zero). Within-run trend significance varies naturally across seeds: three of five runs individually reach significance at the uncorrected
level (Spearman
), while two do not (
,
), illustrating genuine run-to-run variability in a stochastic simulation with
per run. Treating each of the five independent runs as one observation, a one-sample
t-test rejects the null hypothesis of zero reduction (
,
); a non-parametric one-sample Wilcoxon signed-rank test yields
, the minimum
p-value achievable by this exact test at
given that all five runs share the same sign. This between-run consistency, obtained from genuinely independent replicates rather than re-analysis of a single trajectory, provides stronger evidence for the direction of the effect than the single-seed analysis alone, while the modest
and the two non-significant within-run trends are acknowledged as remaining limitations.
4.7.2. Ablation Study
Table 15 presents results from a 6-iteration ablation conducted on a stratified 50,000-flow subsample, separate from the 12-iteration primary evaluation used for significance testing (
Table 13). The reduced iteration count is sufficient to isolate the directional effect of each parameter; the 6-iteration horizon consistently captures the performance differential between configurations because FPR stabilization is observed within four iterations across all tested settings. Statistical significance claims in
Table 13 are drawn from the full 12-iteration sequence and are independent of the ablation findings presented herein. Removing the label noise (Config. B) produces no measurable change, indicating that the 8% analyst error rate does not substantially impede convergence. Removing delays (Config. C) increases the FP reduction from 7.2% to 12.8% (
pp), identifying delayed analyst availability as the primary performance bottleneck [
3]. Removing all feedback (Config. D) produces a slightly negative result (
), confirming that analyst corrections are the causal drivers of FP improvement [
2].
4.7.3. Extended Sensitivity Analysis
A 96-configuration sweep (
,
{0.00, 0.15, 0.30, 0.50},
) was conducted using prediction-level simulation on the full RF model evaluated over the static held-out test partition (baseline operational FPR = 0.24%, 1552 false-positive flows among the Normal-class test set). All 96 configurations yield positive FPR reduction (range:
to
pp), confirming SCAFP robustness across the full tested parameter space. This prediction-level sweep, which applies corrections directly to the static test-set predictions without model retraining, is distinct from the iterative, retraining-based simulation shown in
Figure 7b, which spans a substantially larger effect range due to genuine model updates across iterations. At the most adverse retraining-based configuration (
,
), the small number of iterations (six) combined with a 50% per-round chance of a missed review round means that few or no correction rounds may succeed by chance; the resulting FPR reduction at this cell is subject to substantially higher variance than at more moderate parameter settings and can occasionally fall near or below zero as a consequence of this variance rather than indicating that feedback is systematically harmful under these conditions. Budget
is the dominant parameter; label noise
has a secondary effect with a critical threshold near
; and missed rounds
have the smallest effect. The baseline FP trajectory (1552 → 1411 → 1284 → 1172 → 1070 → 976 → 884 → 809 → 809 → 741 → 741 → 741 → 677 flows) shows monotonic convergence.
4.8. Temporal Evaluation
To assess whether the random stratified split overestimated performance, a date-based evaluation was conducted. Flows from 14–16 February 2018 (Week 1: 3,133,873 flows) were used for training; flows from 20–28 February 2018 (Week 2: 10,948,944 flows) were used for testing. This temporal, generalization-oriented evaluation yields 89.13% accuracy, 8.44 pp below the random i.i.d.-style stratified split (97.57%,
Section 4.1). Per-class analysis identifies three dataset-inherent causes: (1) Infiltration is absent from Week 1 by dataset design; (2) DoS sub-types differ structurally across weeks; and (3) BruteForce is near-absent in the test set (841 flows out of 10.9 million). These findings confirm that CSE-CIC-IDS2018 is scenario-stratified rather than temporally i.i.d.
5. Discussion
5.1. Interpretation of Detection Performance
The near-perfect F1 scores for Botnet, BruteForce, and DoS reflect alignment between their discriminative feature spaces and the depth-limited RF decision boundaries. As reported in
Section 4.1.5, Dst Port and Init Fwd Win Byts together accounted for 27.08% of the ensemble importance, suggesting that max_depth = 10 acts as an inductive bias toward promoting discriminative features into the higher depths of the decision trees, a process that would otherwise be undermined by greater depths or retrospective attributions.
The modest recall for Infiltration reflects an unavoidable feature-space overlap between reconnaissance probes (single-packet scans) and legitimate short flows, compounded by a deliberate design choice to prioritize low false-positive rates over maximizing detection for this rare class. As shown in
Section 4.1.4, the model correctly ranks these flows (AUC
), but the decision boundary cannot be crossed cleanly without overwhelming SOC analysts with false alarms. This constraint is not unique to our approach; it has been independently documented by Cheng et al. [
10], Hajj et al. [
29], Fernandes et al. [
43], and Goldschmidt and Chudá [
12] on the same benchmark. Full resolution requires inter-flow temporal features (e.g., short-term source-IP sequences), which we identify as the primary direction for future work.
5.2. Significance of Intrinsic Explainability
The PGS latency advantage over SHAP and LIME (
Table 6) is structural: its
complexity bound matches the prediction call itself, ensuring that explanation throughput scales with classification throughput regardless of model size. In SOC deployments where explanations are required only for alerts (typically
of flows), the throughput gap narrows, but the three structural properties that matter for audit trails (determinism, empirically measured ensemble fidelity, and raw-unit threshold conditions) remain unavailable from post hoc methods regardless of volume [
16].
5.3. Deployment Implications
As reported in
Section 4.3, the system sustains throughput comfortably above the SOC minimum requirement while maintaining bounded
per-sample complexity. Deployment coverage follows a similar pattern: 499 of the 500 extracted rules reach Tier-1 auto-deployment, with the top 20% accounting for 25.3% of attack detections at 99.2% mean confidence, though such high separability is unlikely to hold in more heterogeneous enterprise traffic [
1].
SCAFP extends this static coverage over time: starting from a pre-feedback FPR baseline of 0.24% (
Section 3.8), the single-seed simulation provides a 12.7% FPR reduction, and validation across five independent random seeds confirms a mean reduction of 14.50% (95% CI
;
Table 14). The ablation study results (
Table 15) show that the feedback delay is a key obstacle. When the delays were removed (Config. C), the FPR reduction increases from 7.2% to 12.8% (+5.6 pp), indicating that prompt analyst review is critical for performance improvement. Disabling label noise did not change the FPR. Thus, the consistency of weekly feedback from analysts appears to be more crucial than the precision of their annotations [
1,
3].
5.4. Cross-Target-Domain Retraining
The cross-dataset results used binary classification; the 20.5% direct-transfer and 91.6% adapted accuracy figures represent benign/attack discrimination. The explainability mechanisms specific to this work (PGS, TIO, SWCS, TTOL rule tiers, MITRE ATT&CK mapping) are defined around the five-class CSE-CIC-IDS2018 attack taxonomy and were not re-evaluated under cross-dataset binary adaptation; this evaluation is scoped to classification performance and adaptation efficiency only, and extending intrinsic explainability and MITRE-mapped rule extraction to the adapted binary classifier is identified as future work. The conservative evaluation strategy counts WebAttack and reconnaissance misclassifications as errors, making 91.6% of the lower bound on matched-class performance. Accuracy rises sharply from 20.5% to 91.6% with just 10% of labeled target-domain data, then plateaus, with only 0.3 pp of additional gain across the 10%–50% range despite sevenfold more analyst effort. Active learning reduces this to approximately 8 h [
2,
6]. These results suggest that XRF-IDS is better characterized as domain-adaptable than as domain-invariant. The practical implication is that deployment in a new network environment requires approximately 78–195 analyst-hours of binary triage effort before acceptable performance is recovered, which is a non-trivial upfront cost that must be weighed against the alternative of deploying a signature-based system requiring continuous manual rule maintenance. For NF-UNSW-NB15-v2, the practical recommendation of a 0.50% adaptation budget is derived from the mean across five seeds rather than from a budget that is optimal under every random sampling of the adaptation set; SOC operators should therefore treat 0.50%–1.01% as an effective operating range rather than a single precise value. The decline observed beyond 1.89% adaptation is attributed to overfitting of the combined training set toward the target-domain feature distribution, which is a known risk of naive sample concatenation in target-domain retraining that could be mitigated in future work through sample re-weighting or domain-adversarial regularization [
11].
5.5. Limitations
Infiltration detection. Even after optimal threshold calibration (), XRF-IDS detects fewer than half of Infiltration attacks (recall ). From an operational standpoint, this is a substantive limitation: a SOC relying solely on XRF-IDS would miss the majority of this category. The system should therefore be deployed with the explicit expectation that Infiltration requires a complementary detection layer. Full resolution demands richer feature representations than CICFlowMeter’s single-flow aggregates, specifically, inter-flow temporal context, which we prioritize as future work.
Benchmark diversity. CSE-CIC-IDS2018 was captured in 2018 under controlled testbed conditions. Encrypted traffic is excluded from the evaluation. The CICFlowMeter features include payload-based statistics that carry discriminative values for TLS-encrypted flows; however, this is outside the scope of the current evaluation.
MITRE ATT&CK mapping scope. The mapping experiment includes four attack classes, thereby serving as an implementation correctness check for the evaluated kill-chain phases, but not a statistical accuracy evaluation for all 193 techniques included in the taxonomy. Extension to other attack taxonomies based on knowledge graphs constitutes a promising future research path.
Simulation versus deployment. No SOC analysts participated in the study, and all feedback was simulated using the constraint model defined in
Section 3.8. The SCAFP constraint model (
Section 3.8) is grounded in reported SOC operational characteristics [
1,
3] but cannot capture real analyst behavior in terms of cognitive load, alert fatigue, or domain expertise variability. Therefore, the results should be interpreted as indicative of the potential of the mechanism under controlled conditions, pending validation with real SOC analysts.
Throughput evaluation scope. The throughput was evaluated using a single-process batch simulation model with dedicated hardware. Concurrent multi-thread workload performance and end-to-end pipeline latency, including SIEM integration, alert enrichment, and analyst notification overhead, were not measured and may differ from the reported batch-processing figures in production environments.
Temporal evaluation. A date-based evaluation yields 89.13% accuracy, with three dataset-inherent causes identified (Infiltration absent from training partition by design, DoS sub-type shift, and BruteForce near-absent in test). These findings confirm that CSE-CIC-IDS2018 is scenario-stratified by construction (each capture day executes a scripted, non-overlapping subset of attack types) rather than temporally i.i.d.
SOC pipeline scope. End-to-end SOC pipeline profiling including feature extraction, log ingestion, alert enrichment, rule deployment, and SIEM integration was not conducted within the scope of this study and was identified as a priority for future operational validation.
Adaptation budget seed-sensitivity. On NF-UNSW-NB15-v2, the recommended 0.50% adaptation budget is mean-optimal across five seeds but not optimal for every individual seed (per-seed optima span 0.25–1.01%). Practitioners should validate the adaptation budget on a held-out subset of their own target domain rather than relying solely on the single value reported here.
Online adaptive IDS methods. Hoeffding Trees, Adaptive Random Forest, and related streaming classifiers [
26,
27] update incrementally on each arriving flow without batch retraining, which is fundamentally different from SCAFP’s weekly analyst-driven retraining cycle. A controlled comparison is precluded by the static batch format of CSE-CIC-IDS2018, which does not preserve the original temporal ordering of flows required for a fair streaming evaluation. Furthermore, none of the surveyed streaming IDS methods generated deployable IF-THEN rules in raw network units, which is the primary operational contribution of XRF-IDS. A comparison with streaming baselines on a purpose-built streaming benchmark is identified as a priority for future work.
6. Conclusions
This paper presents XRF-IDS, a SOC-oriented prototype and framework built around a depth-limited Random Forest IDS with five specifically designed mechanisms (PGS, TIO, SWCS, TTOL, and SCAFP), validated under controlled experimental conditions rather than demonstrated as a deployable SOC solution. Together, these mechanisms address six operational challenges (G1–G6) not jointly addressed by any single previously surveyed system (
Table 1). When evaluated on the CSE-CIC-IDS2018 dataset (2,162,527 flows, five classes), XRF-IDS achieved competitive detection accuracy while delivering explanations two orders of magnitude faster than SHAP, with empirically measured ensemble fidelity (99.36%), supporting the kind of audit trails a production SOC deployment would require, though not yet validated as such. The cross-dataset evaluation based on NF-ToN-IoT-v3 (2025) achieved 91.6% classification accuracy after only 10% target-domain retraining, and on NF-UNSW-NB15-v2 (2015) reached mean Attack F1
at a 0.50% adaptation budget, averaged over five independent seeds. SCAFP decreased the FPR by a mean of 14.50% (95% CI
) across five independently seeded 12-iteration deployment simulations, with all five runs showing a positive reduction (one-sample
t-test,
). Each simulated weekly review cycle required approximately 28 min of analyst time; this figure is distinct from the smaller-scale ablation study (
Table 15) used only to isolate individual parameter contributions. As detailed in
Section 5, the following limitations remain: benchmark recency, ATT&CK mapping scope, simulation-based feedback validation, and seed-dependent variability of the NF-UNSW-NB15-v2 adaptation budget recommendation. Future work will focus on the evaluation of more recent benchmarks, encrypted traffic, and production validation using real SOC analysts.