Author Contributions
Conceptualization, A.E. and J.S.; methodology, A.E.; software, A.E.; validation, A.E., J.S. and H.U.; formal analysis, A.E.; investigation, A.E.; resources, J.S. and H.U.; data curation, A.E.; writing—original draft preparation, A.E.; writing—review and editing, A.E., J.S. and H.U.; visualization, A.E.; supervision, J.S. and H.U.; project administration, J.S. All authors have read and agreed to the published version of the manuscript.
Figure 1.
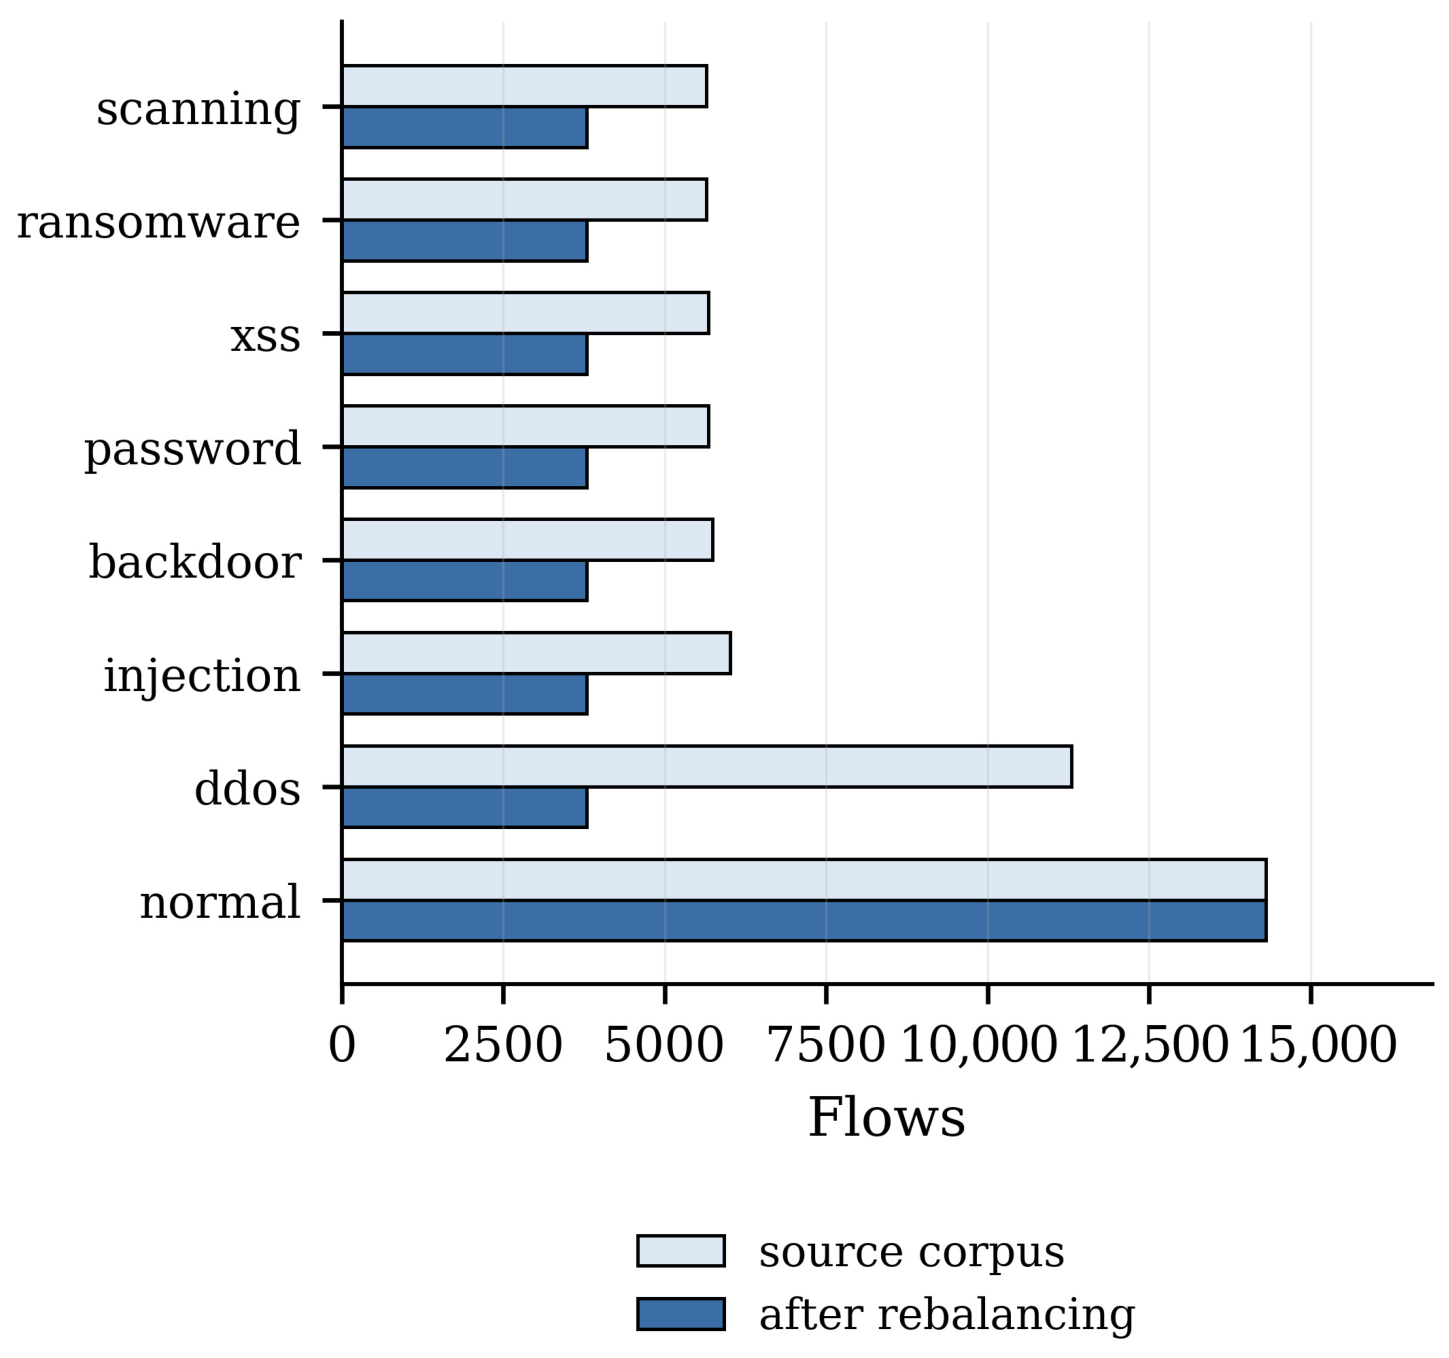
Class composition of the TON_IoT network corpus before and after rebalancing. Attack families are downsampled to a common cap of 10,317 flows and man-in-the-middle keeps its natural size of 1043 because it falls below the cap.
Figure 1.
Class composition of the TON_IoT network corpus before and after rebalancing. Attack families are downsampled to a common cap of 10,317 flows and man-in-the-middle keeps its natural size of 1043 because it falls below the cap.
Figure 2.
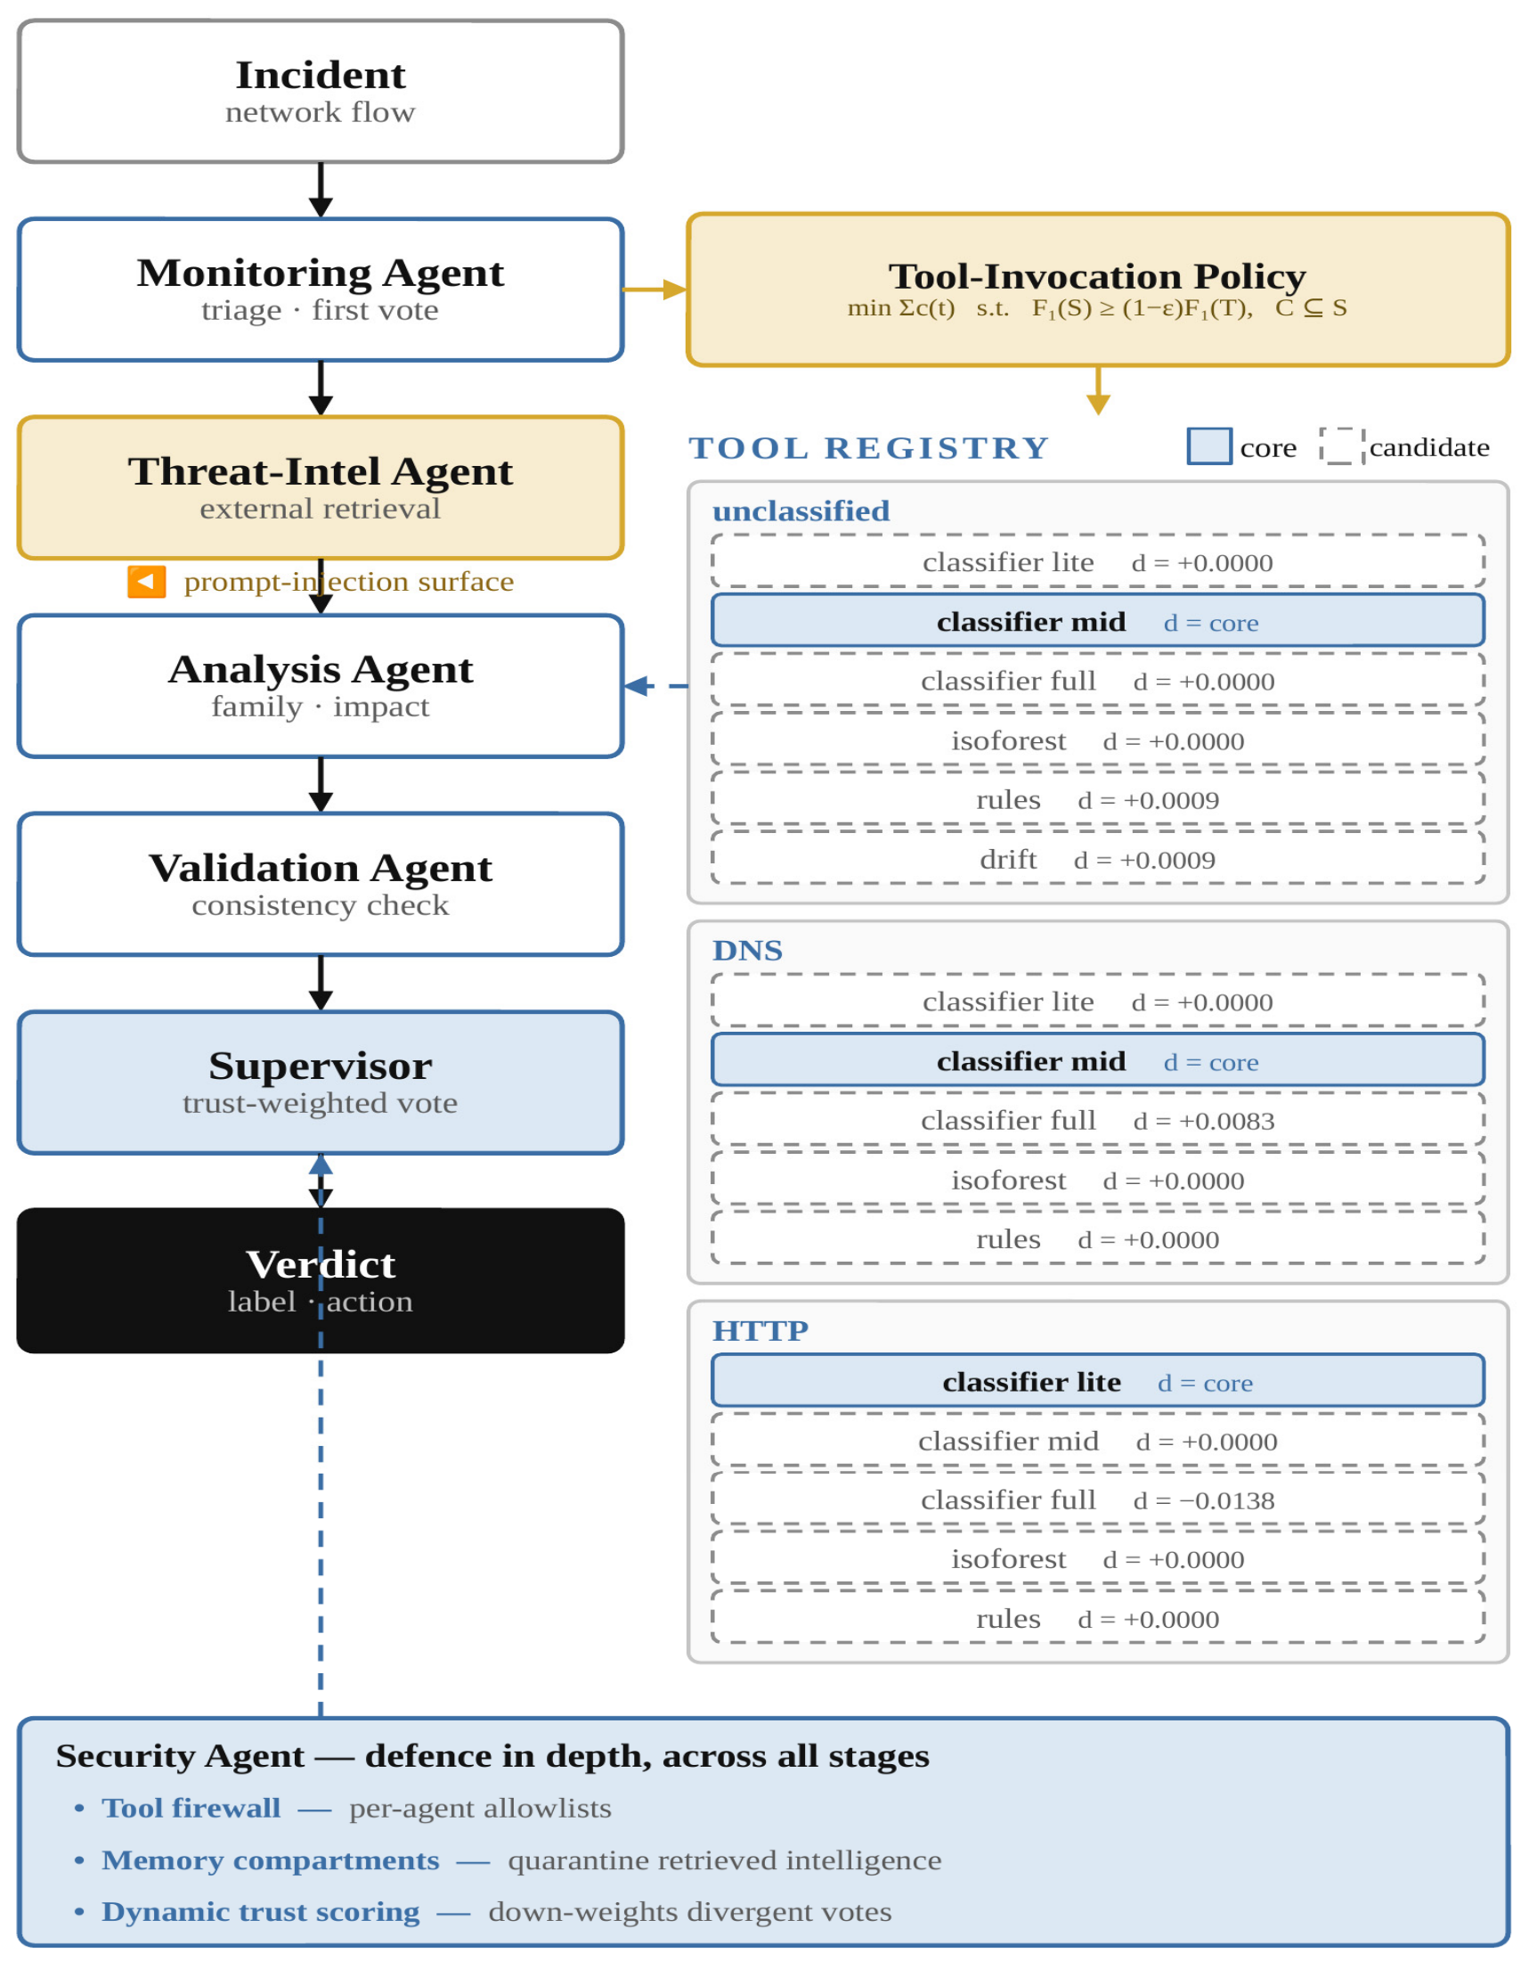
The multi-component detection pipeline. Five agents feed a trust-weighted consensus. The tool-invocation policy selects a subset of the registry subject to a mandatory core and an explicit accuracy floor; the marginal values d beside each candidate are those measured on the TON_IoT validation partition at a tolerance of 0.02. The threat-intelligence agent is the designated injection surface.
Figure 2.
The multi-component detection pipeline. Five agents feed a trust-weighted consensus. The tool-invocation policy selects a subset of the registry subject to a mandatory core and an explicit accuracy floor; the marginal values d beside each candidate are those measured on the TON_IoT validation partition at a tolerance of 0.02. The threat-intelligence agent is the designated injection surface.
Figure 3.
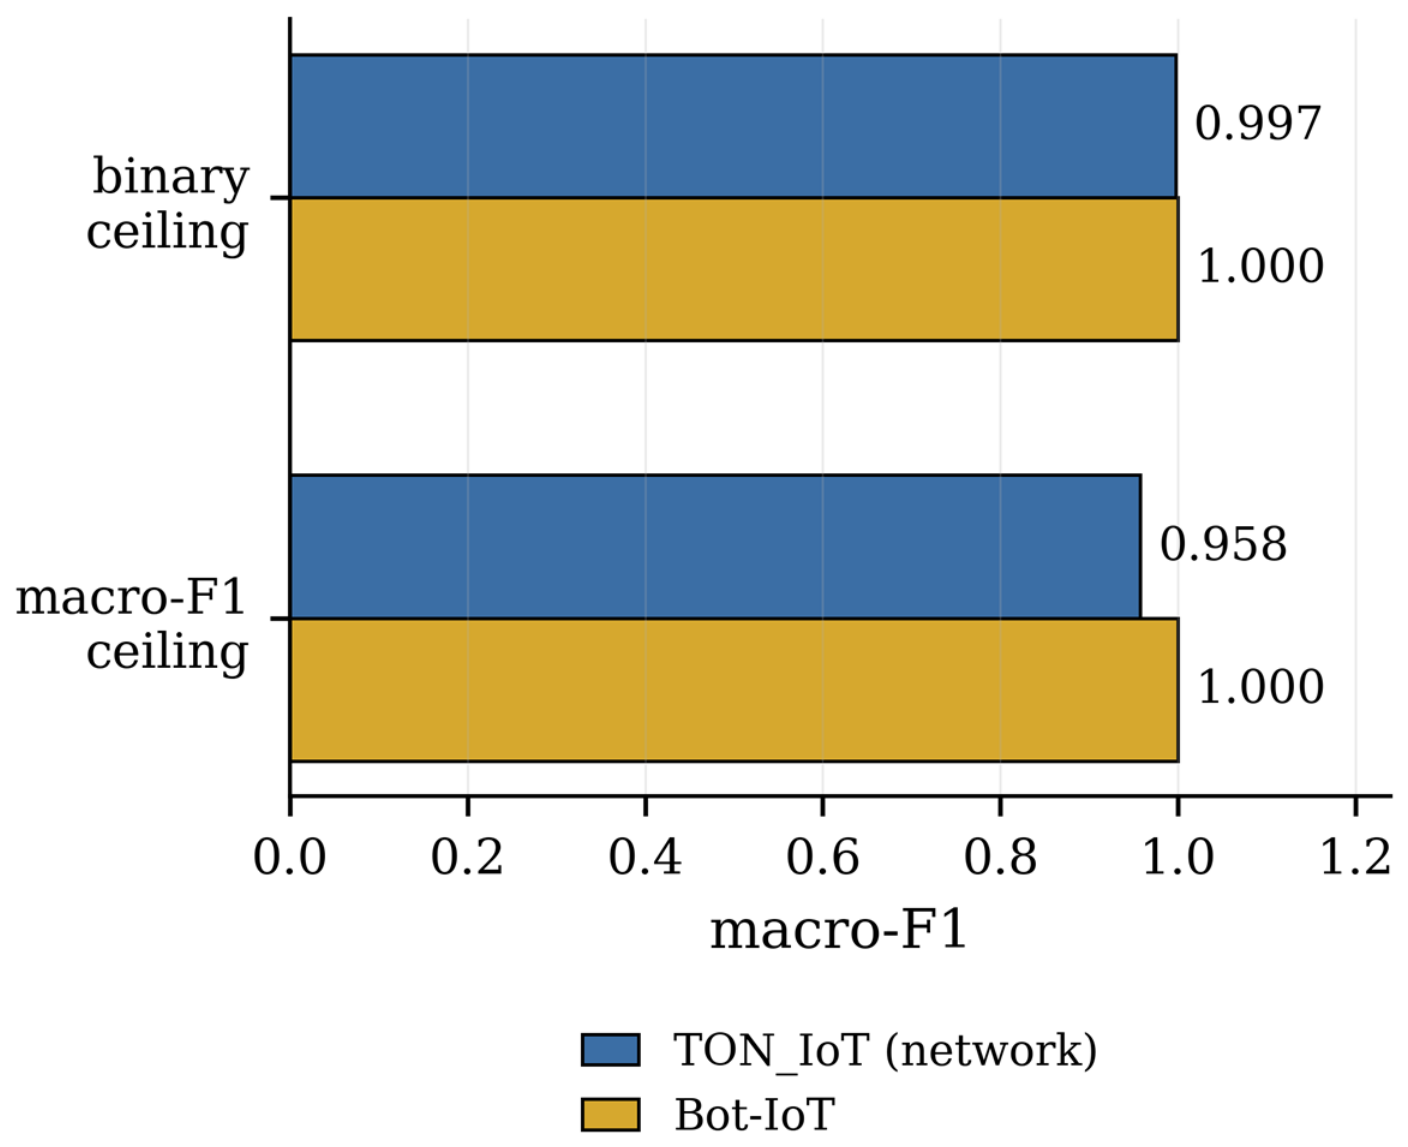
Empirically achievable ceilings on both corpora, fitted directly to the labels with no agent layer. Bot-IoT is close to saturated and TON_IoT retains headroom since it carries ten classes including one rare family.
Figure 3.
Empirically achievable ceilings on both corpora, fitted directly to the labels with no agent layer. Bot-IoT is close to saturated and TON_IoT retains headroom since it carries ten classes including one rare family.
Figure 4.
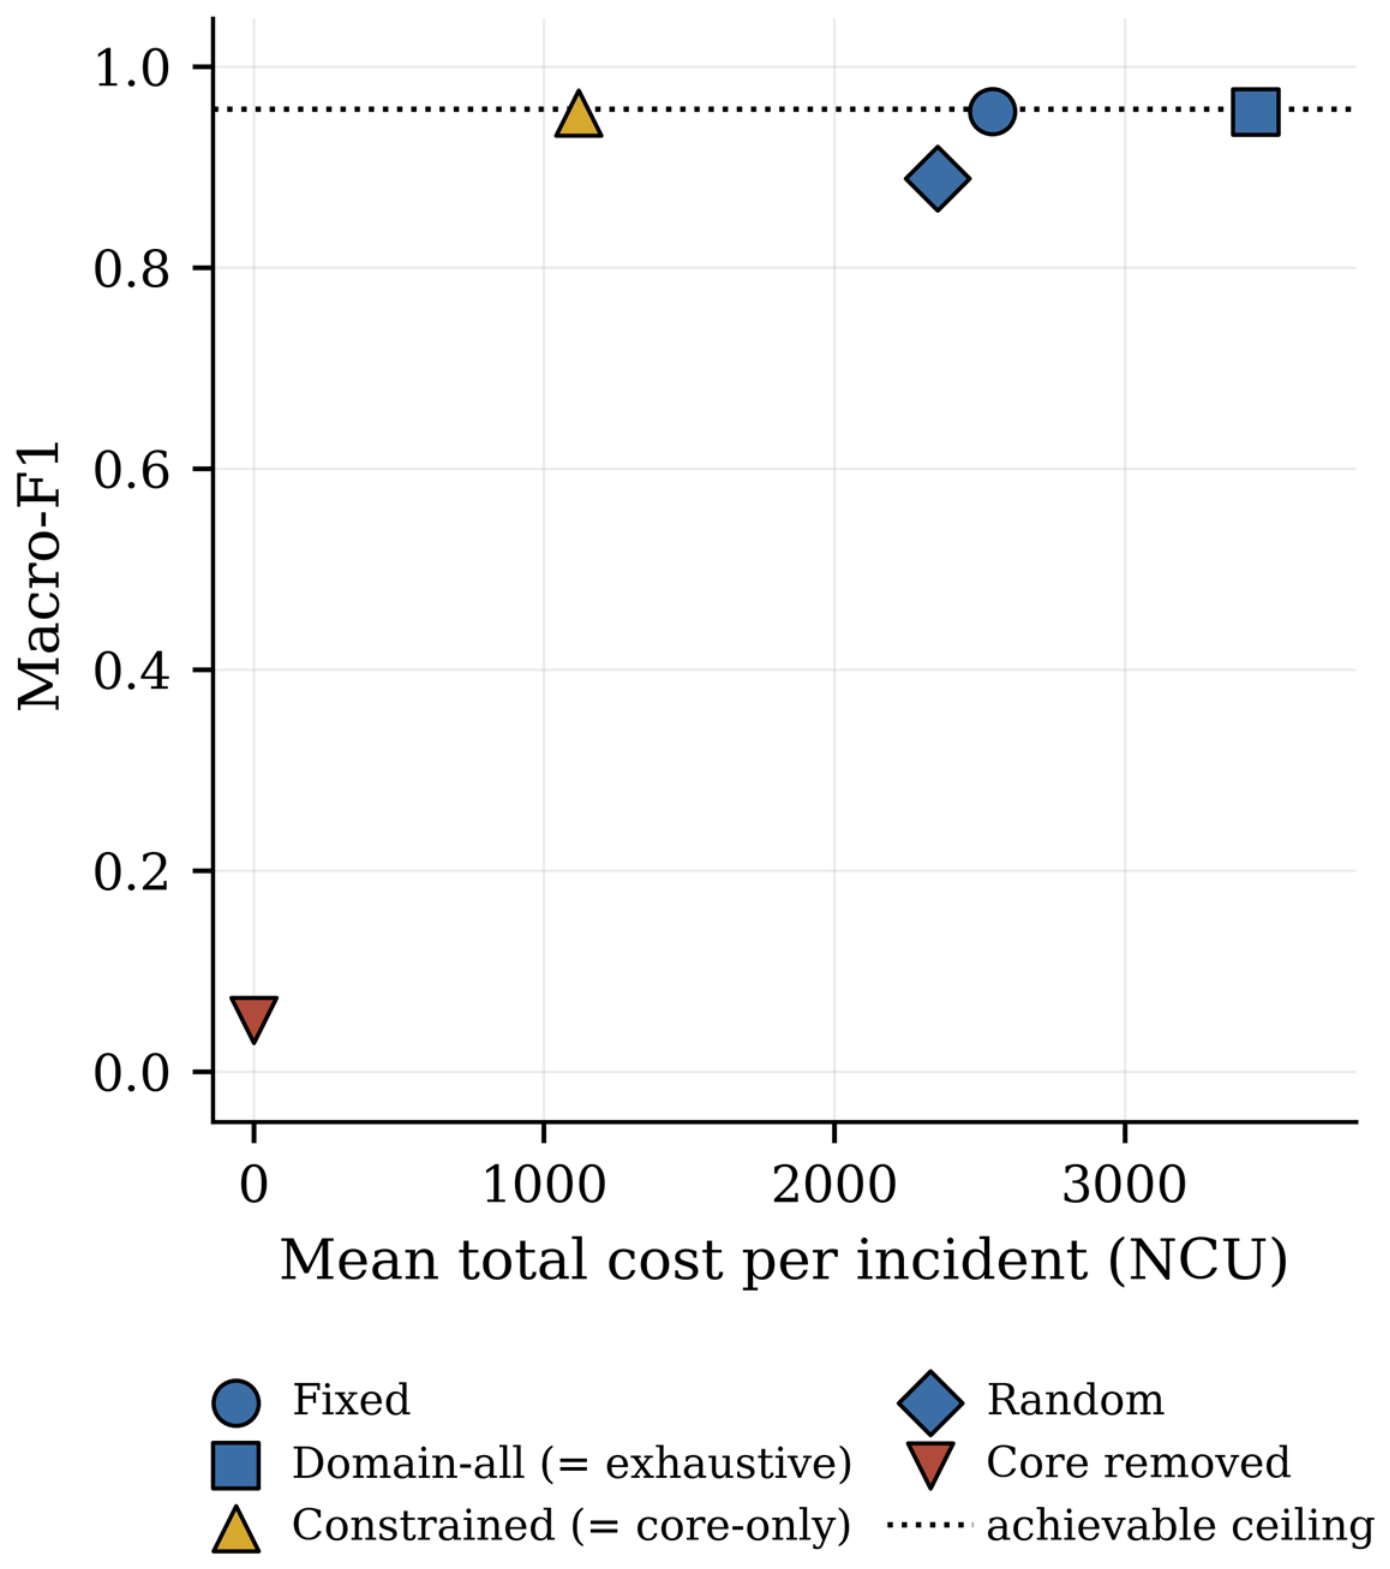
Cost-accuracy frontier on TON_IoT. The constrained policy and core-only occupy identical coordinates, marked with a single star, at 3.08 times lower cost than exhaustive invocation for a macro-F1 difference of 0.0007. The core-removal condition sits far below the frontier at negligible cost, which is the point of including it.
Figure 4.
Cost-accuracy frontier on TON_IoT. The constrained policy and core-only occupy identical coordinates, marked with a single star, at 3.08 times lower cost than exhaustive invocation for a macro-F1 difference of 0.0007. The core-removal condition sits far below the frontier at negligible cost, which is the point of including it.
Figure 5.
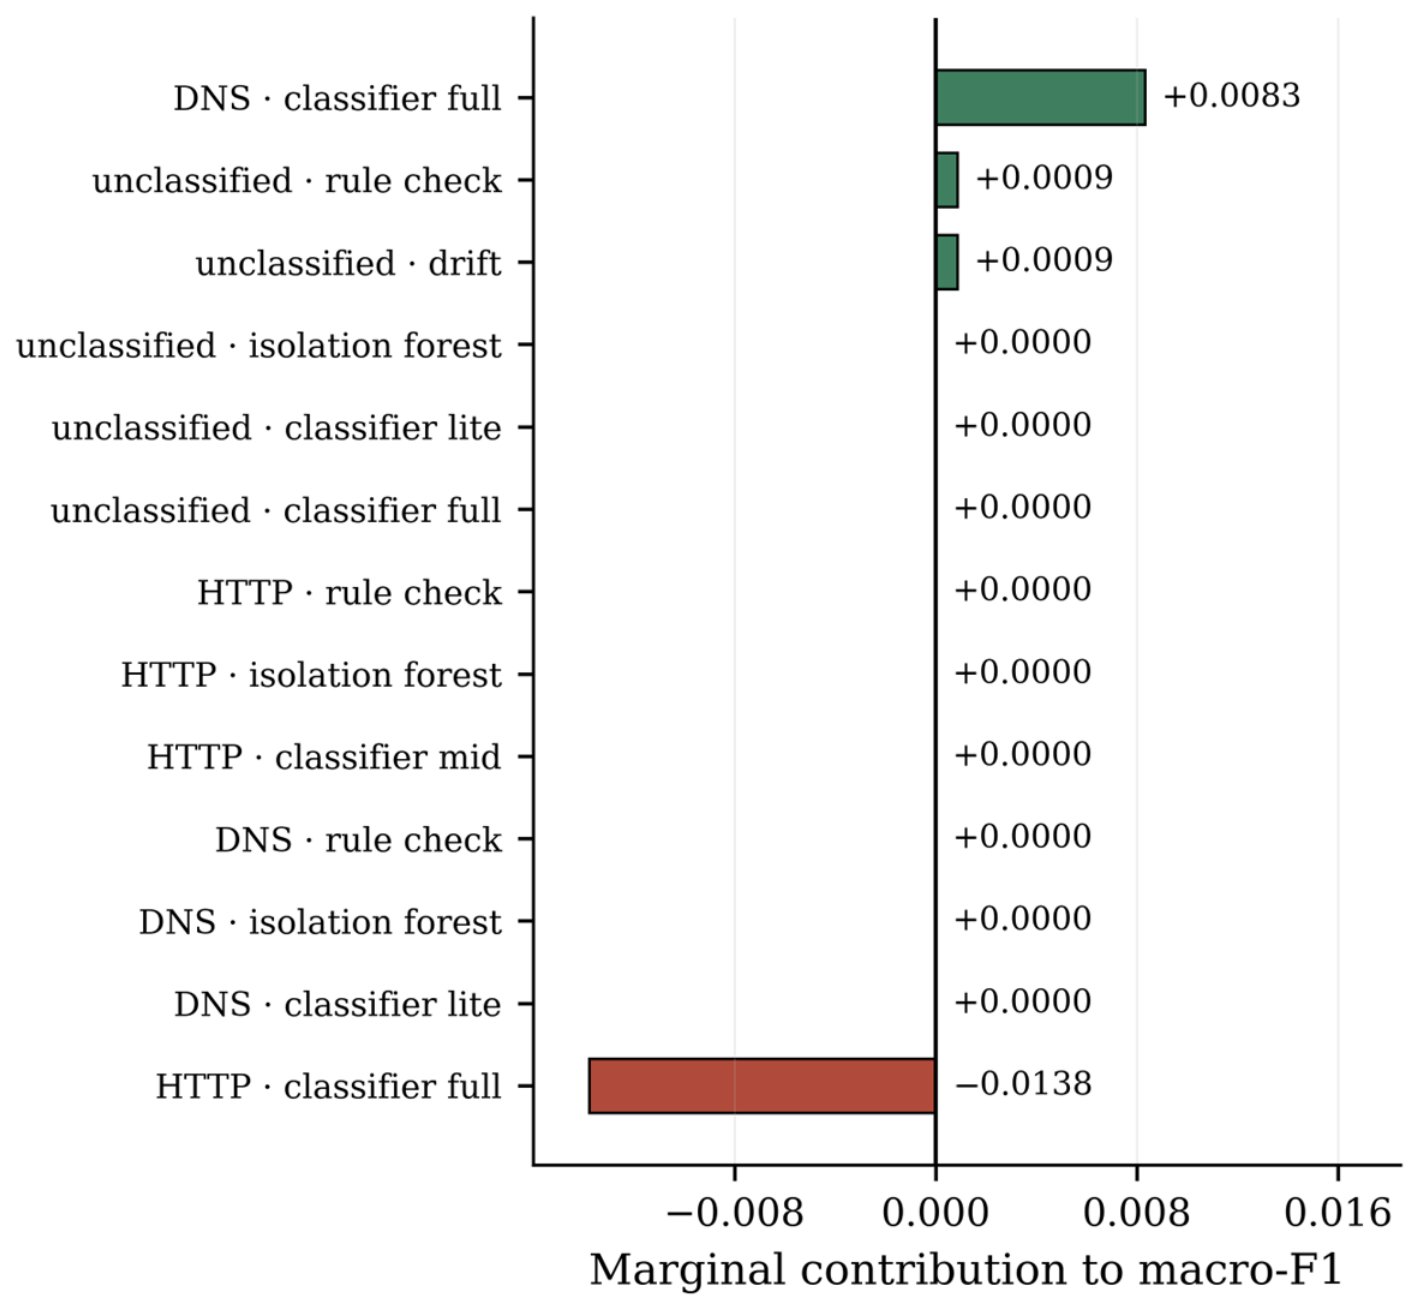
Marginal contribution of each candidate tool to macro−F1, measured on top of the mandatory core within each group. Core members are excluded because they are never scored against the alternative of their own absence. Auxiliary detectors contribute at or near zero once a classifier is present.
Figure 5.
Marginal contribution of each candidate tool to macro−F1, measured on top of the mandatory core within each group. Core members are excluded because they are never scored against the alternative of their own absence. Auxiliary detectors contribute at or near zero once a classifier is present.
Figure 6.
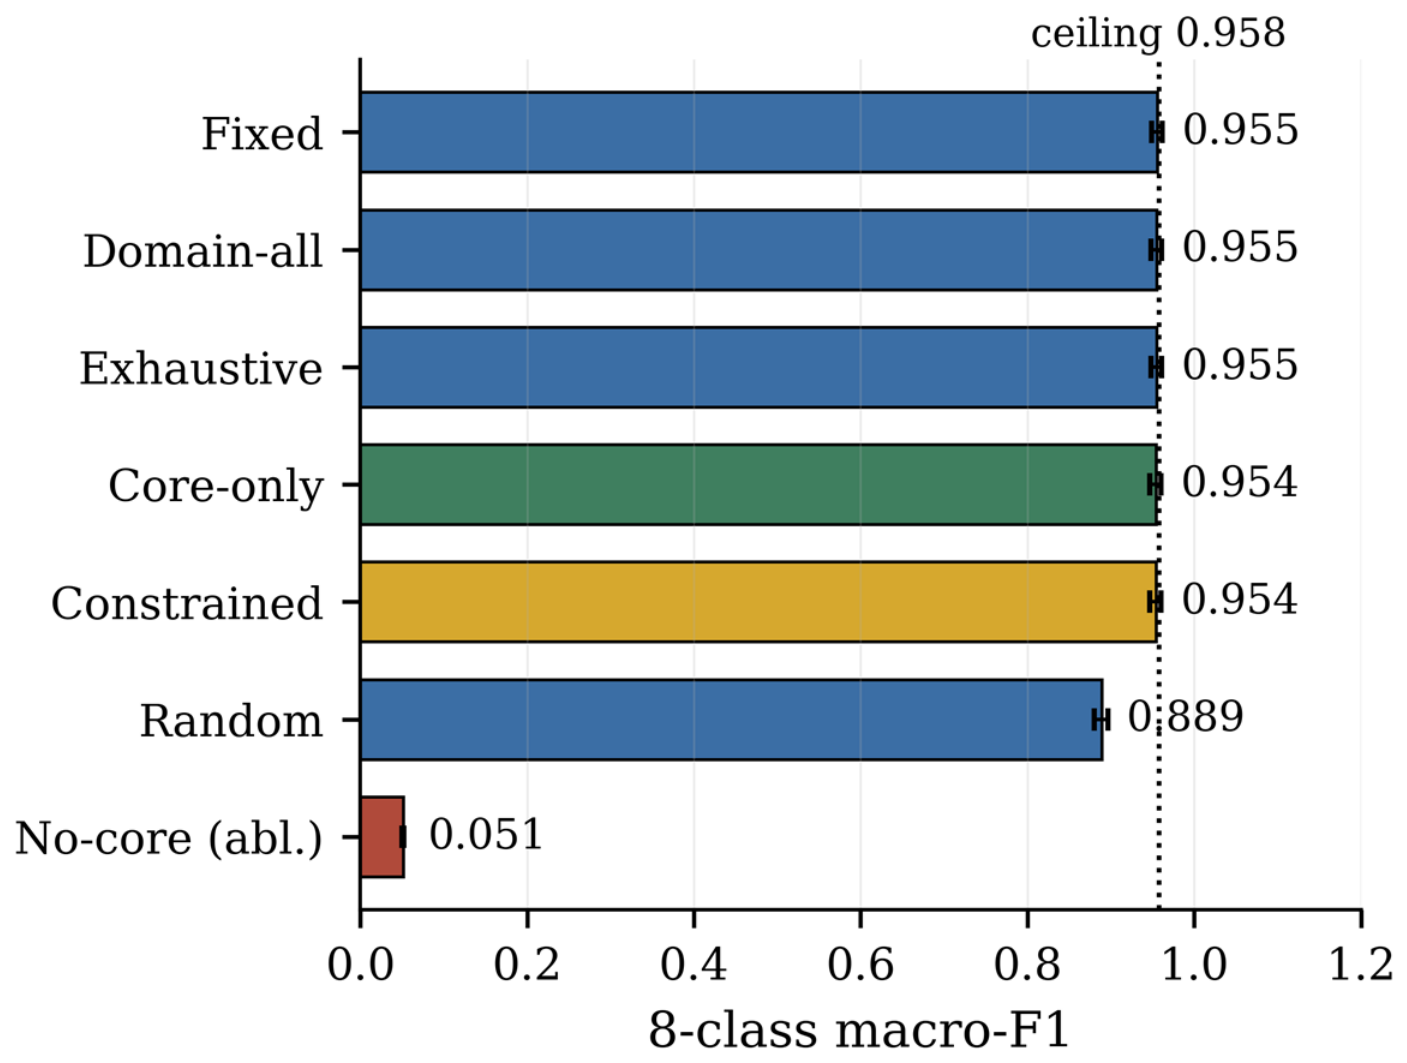
Macro-F1 by condition on TON_IoT with bootstrap 95% confidence intervals. Five conditions cluster within 0.007 of one another near the measured ceiling. Removing the mandatory core loses 94.65% relative at negligible cost, which shows that the constraint is what makes the recovery possible.
Figure 6.
Macro-F1 by condition on TON_IoT with bootstrap 95% confidence intervals. Five conditions cluster within 0.007 of one another near the measured ceiling. Removing the mandatory core loses 94.65% relative at negligible cost, which shows that the constraint is what makes the recovery possible.
Figure 7.
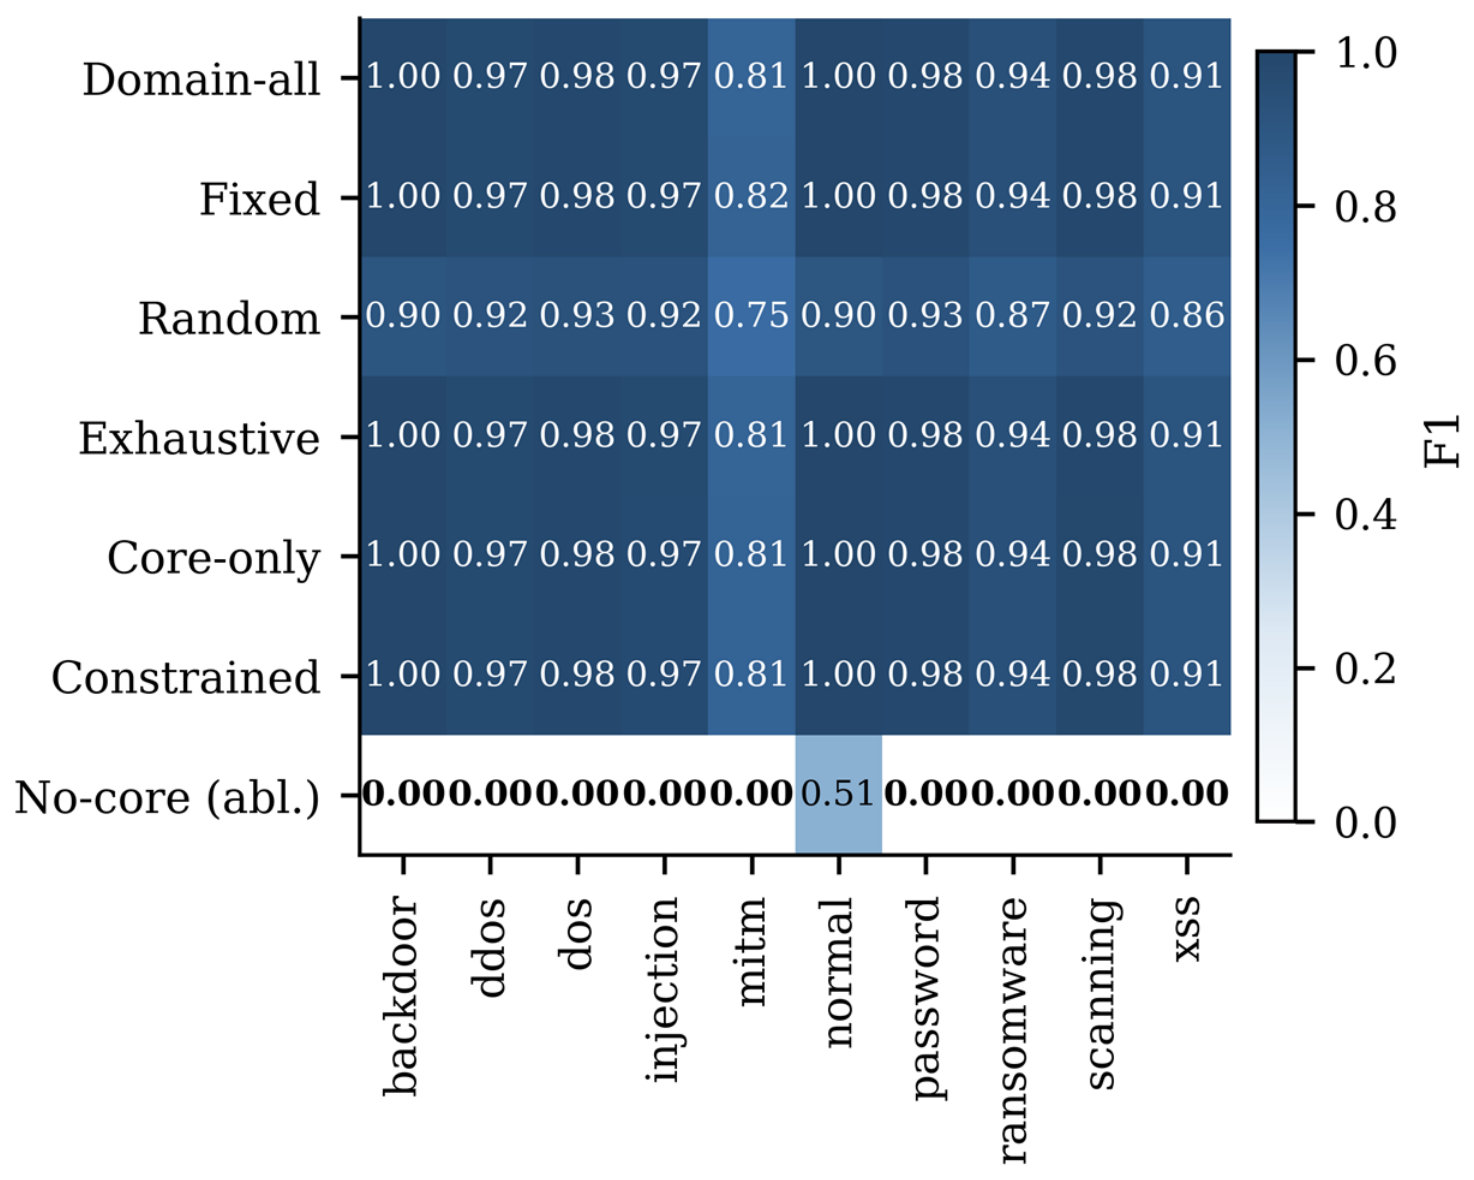
Per-class F1 across all conditions on TON_IoT. Values below 0.10 are shown in bold. Removing the mandatory core eliminates nine of ten classes entirely; the five non-degenerate conditions are almost indistinguishable from one another.
Figure 7.
Per-class F1 across all conditions on TON_IoT. Values below 0.10 are shown in bold. Removing the mandatory core eliminates nine of ten classes entirely; the five non-degenerate conditions are almost indistinguishable from one another.
Figure 8.
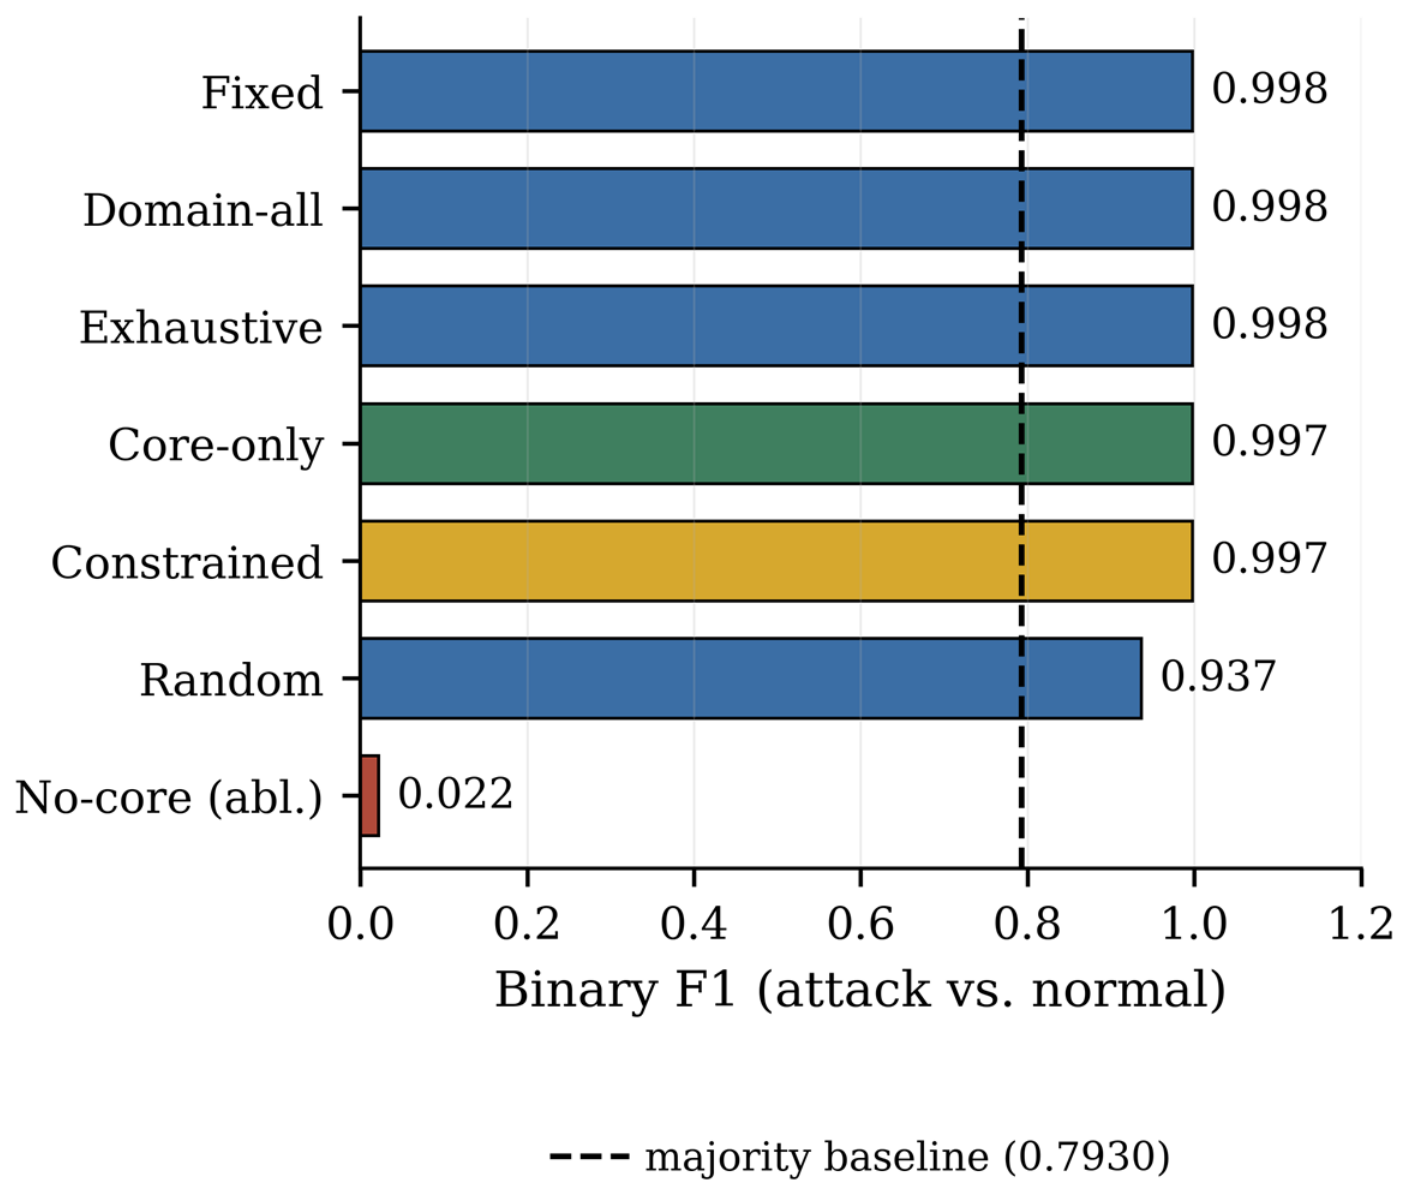
Binary attack-versus-normal F1 by condition on TON_IoT against the majority-class baseline of 0.7876. The core-removal experiment falls far below the baseline, the single clearest indication that its output carries no information.
Figure 8.
Binary attack-versus-normal F1 by condition on TON_IoT against the majority-class baseline of 0.7876. The core-removal experiment falls far below the baseline, the single clearest indication that its output carries no information.
Figure 9.
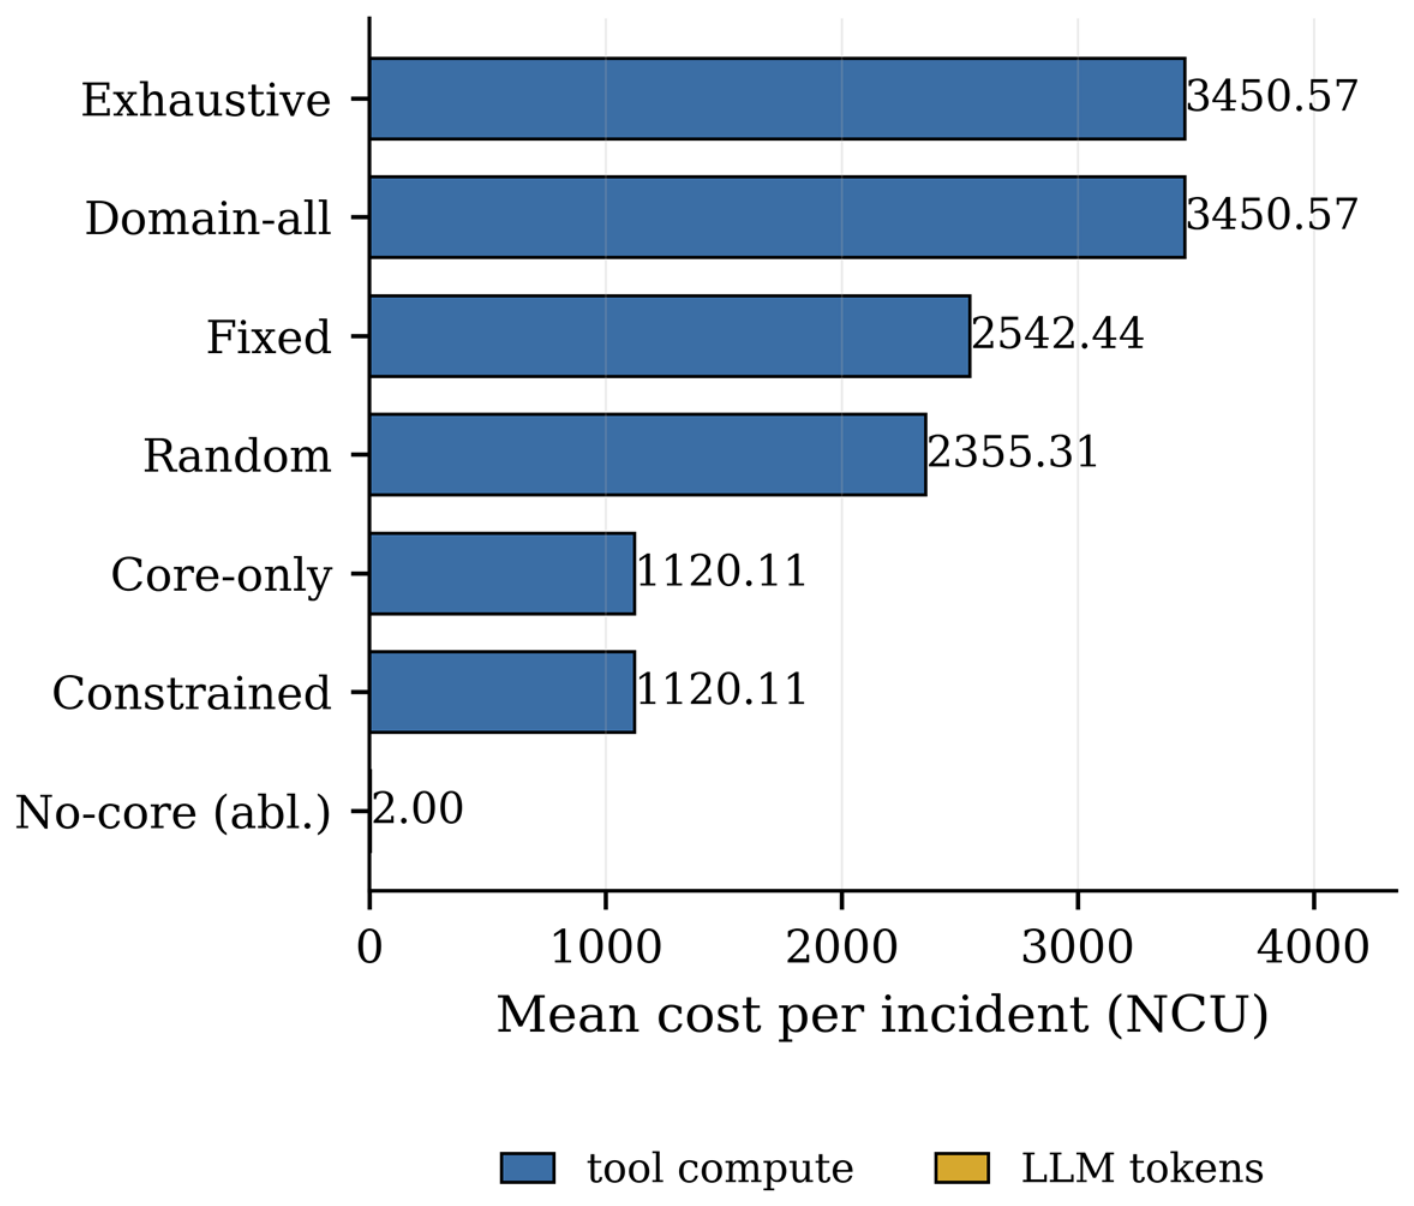
Cost decomposition per incident on TON_IoT, separating tool compute from language model tokens. The configuration reported here fuses evidence deterministically, so token cost is zero by construction and the figures characterize the tool layer exclusively.
Figure 9.
Cost decomposition per incident on TON_IoT, separating tool compute from language model tokens. The configuration reported here fuses evidence deterministically, so token cost is zero by construction and the figures characterize the tool layer exclusively.
Figure 10.
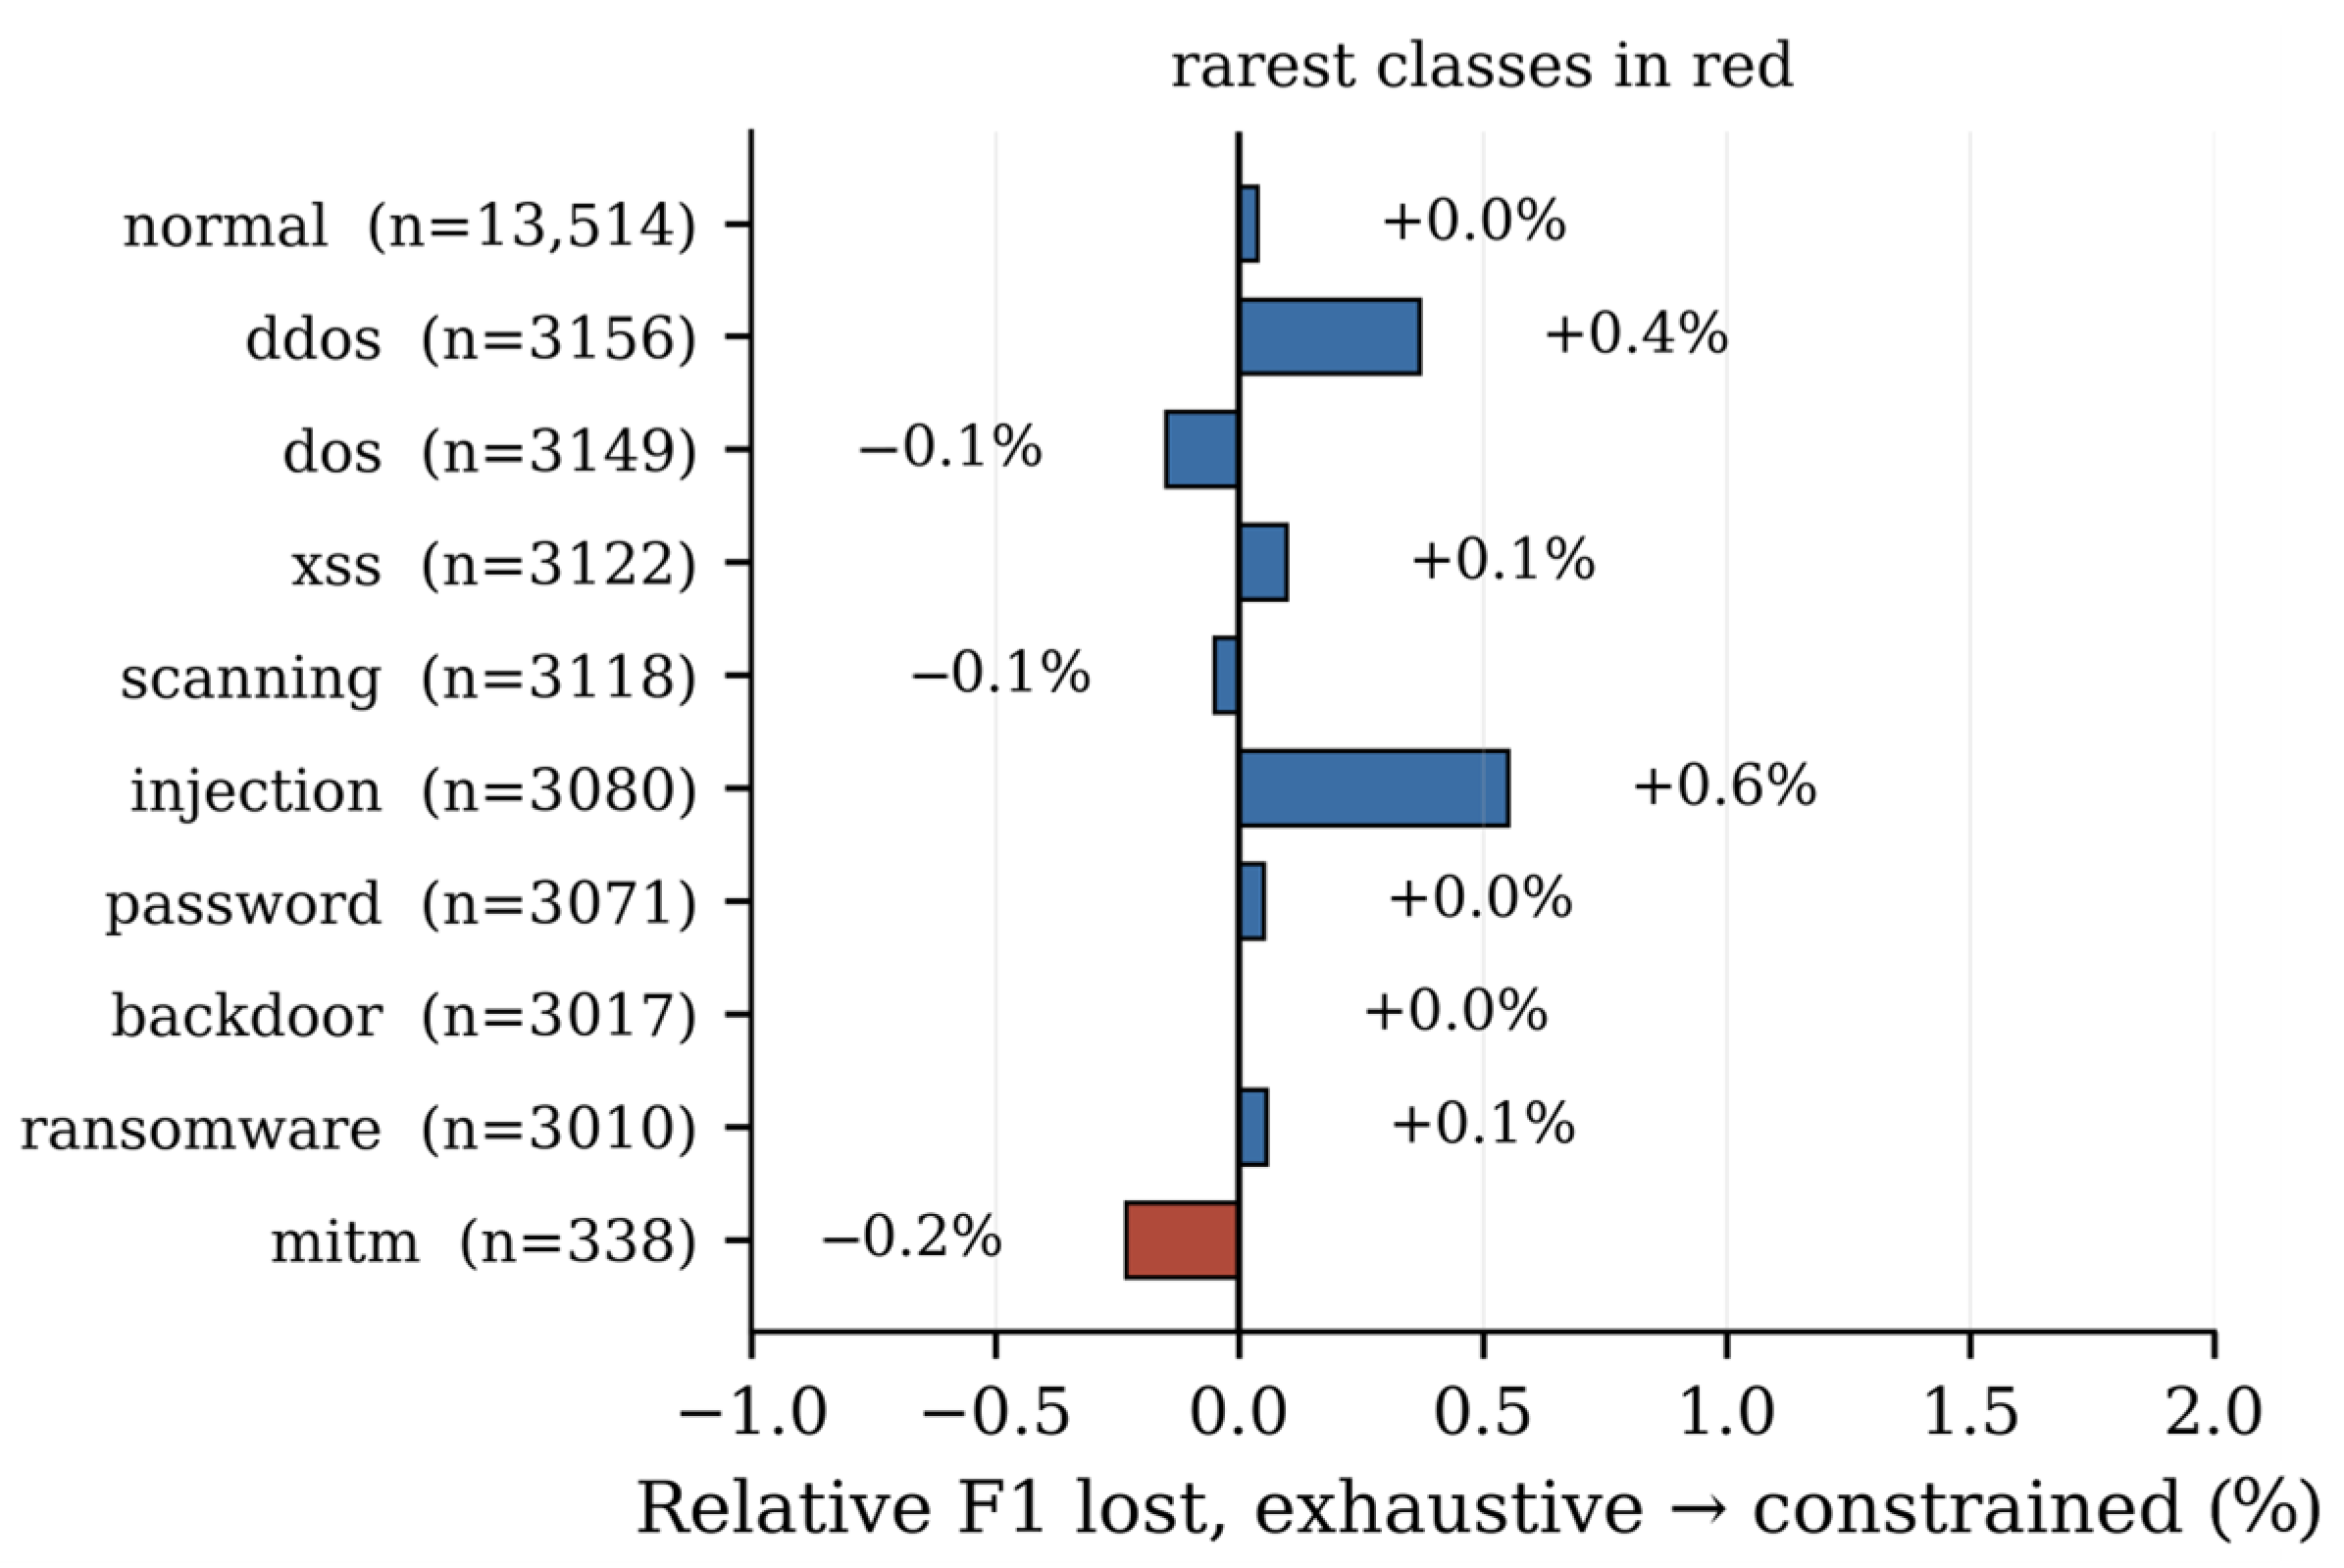
Relative F1 change from exhaustive invocation to the constrained policy at ε = 0.02 on TON_IoT, ordered by class frequency. At this tolerance no class is materially harmed. At ε = 0.05 the rarest class loses ten percent while common classes lose under one, which is the operational limit on relaxing the floor.
Figure 10.
Relative F1 change from exhaustive invocation to the constrained policy at ε = 0.02 on TON_IoT, ordered by class frequency. At this tolerance no class is materially harmed. At ε = 0.05 the rarest class loses ten percent while common classes lose under one, which is the operational limit on relaxing the floor.
Table 1.
Position of this work relative to the most closely related studies. We are not aware of prior work that measures the interaction between the cost-driven tool-invocation policy and the class-discriminative capability of the tools it is allowed to decline with costs obtained by timing and results replicated across corpora.
Table 1.
Position of this work relative to the most closely related studies. We are not aware of prior work that measures the interaction between the cost-driven tool-invocation policy and the class-discriminative capability of the tools it is allowed to decline with costs obtained by timing and results replicated across corpora.
| Study | Focus | Tool Policy | Costs Timed | Ceiling
Reported | Majority
Baseline |
|---|
| [19] | IoT IDS survey | N/A | no | no | no |
| [25] | deep learning for IDS | N/A | no | no | partial |
| [26] | cross-corpus transfer | N/A | no | no | no |
| [27] | standard feature sets | N/A | no | no | no |
| [29] | generalization | N/A | no | N/A | no |
| [49] | adaptive cost | learned | yes | no | no |
| [53] | agent injection | N/A | no | N/A | N/A |
| This work | agentic IoT IDS | constrained | yes | yes | yes |
Table 2.
Traffic groups after viability filtering and rebalancing. Each group receives independently fitted detectors at three capacity tiers.
Table 2.
Traffic groups after viability filtering and rebalancing. Each group receives independently fitted detectors at three capacity tiers.
| Corpus | Group | Train | Test | Live Features | Classes |
|---|
| TON_IoT | Unclassified | 22,895 | 23,194 | 20 | 10 |
| TON_IoT | DNS | 9610 | 9581 | 17 | 9 |
| TON_IoT | HTTP | 5786 | 5800 | 16 | 8 |
| TON_IoT | pooled | 64,291 | 38,575 | 29 | 10 |
| Bot-IoT | UDP | 7313 | 4395 | 19 | 4 |
| Bot-IoT | TCP | 6320 | 3786 | 18 | 4 |
| Bot-IoT | Pooled | 13,633 | 8181 | 19 | 4 |
Table 3.
Evaluation partitions for both corpora. The majority-class binary F1 is the score a constant prediction achieves and is quoted beside every binary result in
Section 4.
Table 3.
Evaluation partitions for both corpora. The majority-class binary F1 is the score a constant prediction achieves and is quoted beside every binary result in
Section 4.
| Corpus | Pool | Train | Validation | Test | Benign
Fraction | Majority
Binary F1 |
|---|
| TON_IoT | 128,583 | 64,291 | 25,717 | 38,575 | 0.350 | 0.7876 |
| Bot-IoT | 27,267 | 13,633 | 5453 | 8181 | 0.350 | 0.7839 |
Table 4.
Timed invocation costs in normalized cost units, by corpus and group. Costs are marginal batched compute per incident, normalized so that the cheapest tool equals 1.0.
Table 4.
Timed invocation costs in normalized cost units, by corpus and group. Costs are marginal batched compute per incident, normalized so that the cheapest tool equals 1.0.
| Corpus | Group | Lite | Mid | Full | Isoforest | Rules |
|---|
| TON_IoT | unclassified | 318 | 905 | 1770 | 610 | 1.1 |
| TON_IoT | DNS | 678 | 1847 | 3547 | 1404 | 2.0 |
| TON_IoT | HTTP | 807 | 2095 | 3941 | 1754 | 2.4 |
| Bot-IoT | UDP | 279 | 694 | 1403 | 556 | 1.0 |
| Bot-IoT | TCP | 310 | 769 | 1546 | 610 | 1.1 |
Table 5.
Experimental conditions. The core-removal condition is exempt from the automated quality check, since its purpose is to reproduce a failure under controlled conditions.
Table 5.
Experimental conditions. The core-removal condition is exempt from the automated quality check, since its purpose is to reproduce a failure under controlled conditions.
| Condition | Tools Called | Core Enforced | Role |
|---|
| Exhaustive | All, widest tier per group | Yes | Cost upper bound |
| Domain-all | All in group | Yes | Routing baseline |
| Fixed | One full tier per group | Yes | Unmeasured engineer’s choice |
| Random | Uniform random subset | No | Sanity check |
| Core-only | Mandatory core alone | Yes | Minimal sufficient set |
| Constrained | Core under accuracy floor | Yes | Method under evaluation |
| Core removed | Cost-minimal subset | No | Reproduces the failure |
Table 6.
Achievable macro-F1 under different fitting regimes. The pooled figure is the comparator for all agent results; the averaged figure is a different statistic and is included only to document a comparison error we made and corrected.
Table 6.
Achievable macro-F1 under different fitting regimes. The pooled figure is the comparator for all agent results; the averaged figure is a different statistic and is included only to document a comparison error we made and corrected.
| Corpus | Pooled | Averaged | Global | Binary | Comparable to Agents |
|---|
| TON_IoT | 0.9552 | 0.8755 | 0.9578 | 0.9974 | pooled and global only |
| Bot-IoT | 0.9999 | 0.9990 | 0.9999 | 1.0000 | pooled and global only |
Table 7.
Detection performance and cost on the TON_IoT network corpus. Mean over five seeds, n = 38,575 test flows. Measured macro-F1 ceiling 0.9578; majority-class binary F1 0.7876.
Table 7.
Detection performance and cost on the TON_IoT network corpus. Mean over five seeds, n = 38,575 test flows. Measured macro-F1 ceiling 0.9578; majority-class binary F1 0.7876.
| Condition | Macro-F1 | % of Ceiling | Binary F1 | Cost (NCU) | Tools | Dead |
|---|
| Exhaustive | 0.9549 | 99.70 | 0.9976 | 3451 | 3.6 | 0 |
| Domain-all | 0.9549 | 99.70 | 0.9976 | 3451 | 3.6 | 0 |
| Fixed | 0.9555 | 99.76 | 0.9978 | 2542 | 1.0 | 0 |
| Random | 0.8888 | 92.80 | 0.9366 | 2355 | 2.4 | 0 |
| Core-only | 0.9542 | 99.62 | 0.9974 | 1120 | 1.0 | 0 |
| Constrained | 0.9542 | 99.62 | 0.9974 | 1120 | 1.0 | 0 |
| Core removed | 0.0511 | 5.33 | 0.0217 | 2.0 | 1.6 | 8/10 |
Table 8.
Paired comparisons against exhaustive invocation on TON_IoT. Differences are in macro-F1, from 2000 paired bootstrap replicates over the shared test partition.
Table 8.
Paired comparisons against exhaustive invocation on TON_IoT. Differences are in macro-F1, from 2000 paired bootstrap replicates over the shared test partition.
| Condition | Δ Macro-F1 | 95% CI | p | Relative (%) | Interpretation |
|---|
| Domain-all | 0.0000 | [0.0000, 0.0000] | 1.000 | 0.00 | identical |
| Fixed | +0.0006 | [−0.0002, +0.0018] | 0.278 | +0.06 | equivalent |
| Random | −0.0650 | [−0.0716, −0.0585] | <0.001 | −6.81 | moderate loss |
| Core-only | −0.0007 | [−0.0031, +0.0014] | 0.526 | −0.08 | equivalent |
| Constrained | −0.0007 | [−0.0031, +0.0014] | 0.526 | −0.08 | equivalent |
| Core removed | −0.9039 | [−0.9100, −0.8968] | <0.001 | −94.65 | catastrophic |
Table 9.
Detection performance and cost on Bot-IoT. Mean over five seeds, n = 8181 test flows. Measured macro-F1 ceiling 0.9999; majority-class binary F1 0.7839.
Table 9.
Detection performance and cost on Bot-IoT. Mean over five seeds, n = 8181 test flows. Measured macro-F1 ceiling 0.9999; majority-class binary F1 0.7839.
| Condition | Macro-F1 | % of Ceiling | Binary F1 | Cost (NCU) | Tools | Dead |
|---|
| Exhaustive | 0.9990 | 99.91 | 0.9991 | 2051 | 3.0 | 0 |
| Domain-all | 0.9990 | 99.91 | 0.9991 | 2051 | 3.0 | 0 |
| Fixed | 0.9999 | 100.00 | 0.9999 | 1469 | 1.0 | 0 |
| Random | 0.9376 | 93.77 | 0.9724 | 1404 | 2.1 | 0 |
| Core-only | 0.9997 | 99.98 | 0.9997 | 294 | 1.0 | 0 |
| Constrained | 0.9997 | 99.98 | 0.9997 | 294 | 1.0 | 0 |
| Core removed | 0.2422 | 24.22 | 0.7266 | 1.0 | 1.0 | 2/4 |
Table 10.
Accuracy-floor sweep on TON_IoT. Tier assignments are listed for the DNS, HTTP and residual groups respectively. Cost ratios are against exhaustive invocation at 3451 NCU.
Table 10.
Accuracy-floor sweep on TON_IoT. Tier assignments are listed for the DNS, HTTP and residual groups respectively. Cost ratios are against exhaustive invocation at 3451 NCU.
| ε | Tier Assignment | Macro-F1 | Cost (NCU) | Cost Ratio | Rel. Loss (%) |
|---|
| 0.005 | full + lite + mid | 0.9534 | 1536 | 2.25 times | 0.16 |
| 0.010 | full + lite + mid | 0.9534 | 1536 | 2.25 times | 0.16 |
| 0.020 | lite + mid + mid | 0.9542 | 1120 | 3.08 times | 0.07 |
| 0.050 | lite + lite + mid | 0.9411 | 768 | 4.49 times | 1.45 |
| 0.100 | lite + lite + mid | 0.9411 | 768 | 4.49 times | 1.45 |
| 0.200 | lite + lite + lite | 0.9360 | 482 | 7.16 times | 1.98 |
Table 11.
Indirect prompt injection results on both corpora, n = 300 incidents each. Both arms and both payload families returned no change from the clean control.
Table 11.
Indirect prompt injection results on both corpora, n = 300 incidents each. Both arms and both payload families returned no change from the clean control.
| Corpus | Payload Family | Arm | Verdicts Changed |
|---|
| TON_IoT | in-distribution | injected | 0.00% |
| TON_IoT | in-distribution | defended | 0.00% |
| TON_IoT | held-out | injected | 0.00% |
| TON_IoT | held-out | defended | 0.00% |
| Bot-IoT | in-distribution | injected | 0.00% |
| Bot-IoT | in-distribution | defended | 0.00% |
| Bot-IoT | held-out | injected | 0.00% |
| Bot-IoT | held-out | defended | 0.00% |