Article

Towards an Accessible Industry 4.0: Design and Experimental Validation of a Reproducible IIoT Architecture Based on a Compact PLC Platform, Factory I/O, Node-RED and Azure

by
Félix Chávez-Jácome
*,
Jhonatan Guagalango-Minga
,
Elizabeth Salazar-Jácome
and
Javier De la Torre-Guzmán
Department of Engineering Sciences, Universidad Tecnológica Israel, Quito 170516, Ecuador
*
Author to whom correspondence should be addressed.
Future Internet 2026, 18(7), 364; https://doi.org/10.3390/fi18070364
Submission received: 13 June 2026 / Revised: 2 July 2026 / Accepted: 13 July 2026 / Published: 15 July 2026
(This article belongs to the Special Issue Intelligent Industrial IoT)

Abstract

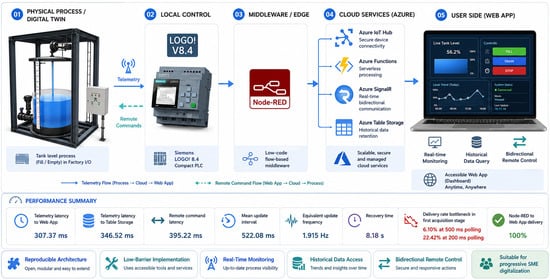
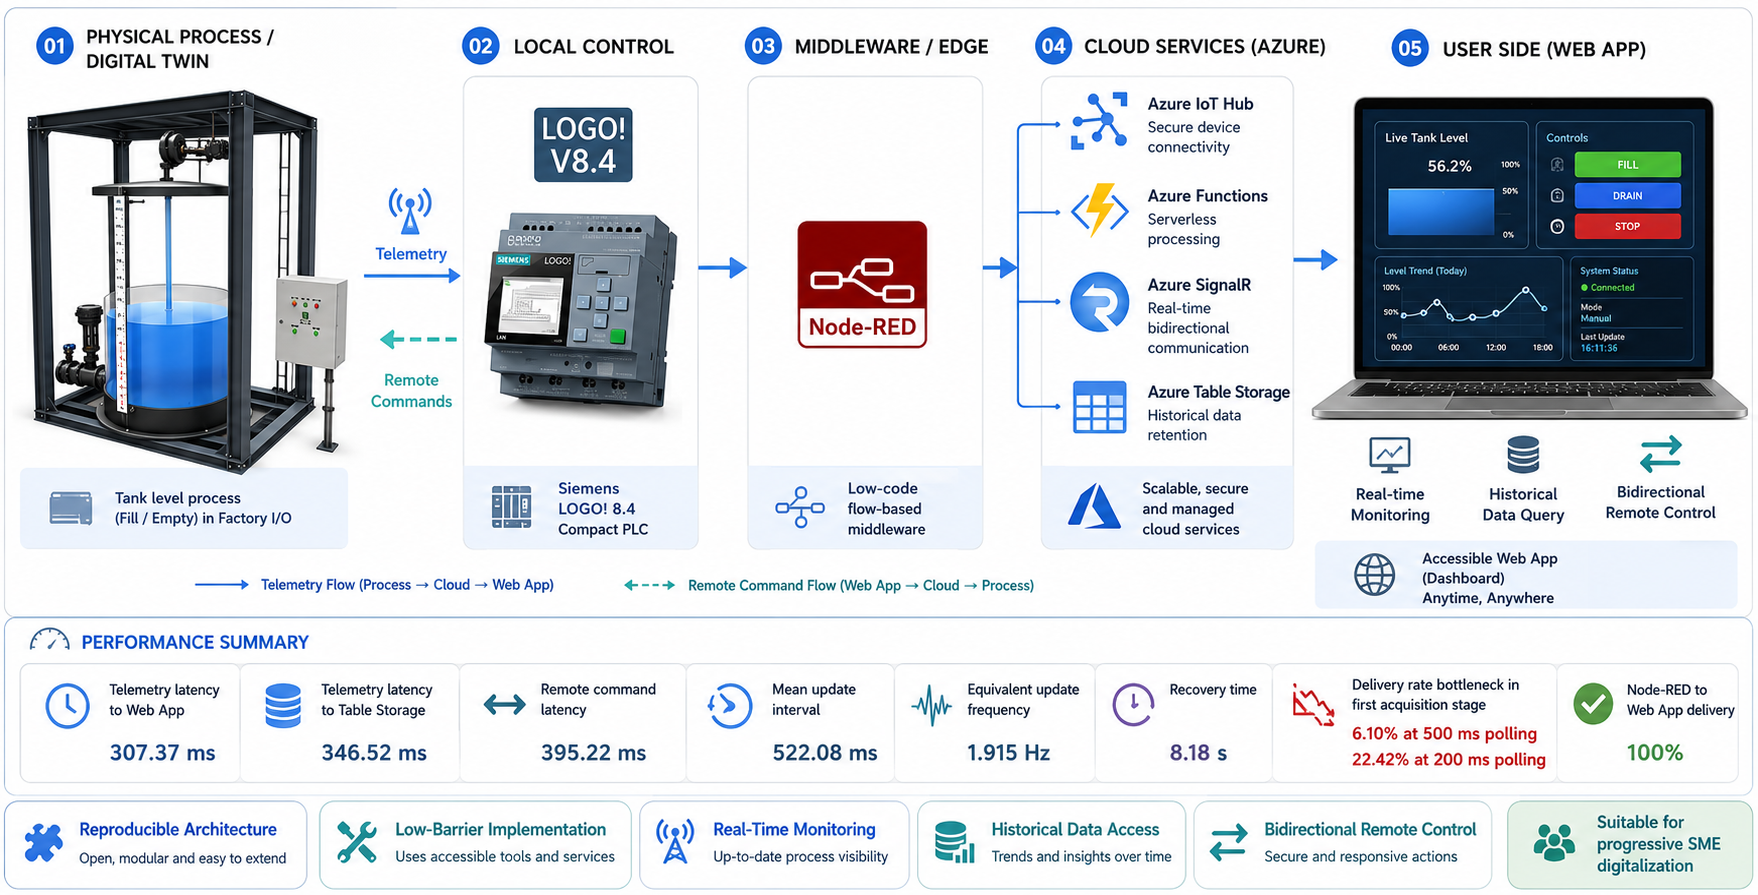
This paper presents the design and experimental validation of a hybrid architecture for the Industrial Internet of Things (IIoT), based on a Siemens LOGO! v8.4 programmable logic controller (PLC) (Siemens AG, Munich, Germany), Node-RED v3.1.3 (OpenJS Foundation, Wilmington, DE, USA), Microsoft Azure (Microsoft Corporation, Redmond, WA, USA), and Factory I/O v2.5.5 (Real Games Unipessoal Lda, Gondomar, Porto, Portugal). The proposal integrates three main functions—real-time telemetry, structured historical data storage and bidirectional remote control—over an automated tank level process. The architecture was organized into four functional layers: local automation, middleware integration, cloud services and web application. Validation was conducted using five performance metrics: end-to-end latency, remote command latency, successful delivery rate, update rate, and service recovery time. The results confirm the technical feasibility of the proposed architecture for remote monitoring and control, while also identifying the main bottlenecks in the transmission chain. Overall, the study provides an experimental basis for modular and reproducible IIoT solutions with a low adoption barrier and potential applicability to progressive digitalization scenarios in small- and medium-sized enterprises.

Graphical Abstract

1. Introduction

The concept of Industry 4.0 did not emerge spontaneously; rather, it took shape as advanced automation, industrial communication networks and distributed computing capabilities began to redefine the logic of production systems [1,2,3]. Within this transformation, the Industrial Internet of Things (IIoT) has played a central role by enabling the interconnection of sensors, actuators, controllers and supervision platforms within a coherent infrastructure [4,5]. This evolution has favored the development of solutions with remote monitoring, real-time visualization, historical data storage and bidirectional control capabilities for automated processes [6,7].
Despite these advances, significant technical challenges remain. The recent literature identifies interoperability, scalability, reliability, security and low latency [7,8,9,10]. Moreover, excessive reliance on cloud-only schemes may introduce delays, affect synchronization between components, and degrade overall system behavior. For this reason, hybrid edge–cloud and fog–cloud architectures have become increasingly relevant [8,11,12].
In this context, programmable logic controllers (PLCs) continue to serve as the backbone of local control in most industrial environments. Their temporal determinism, operational robustness and standardized connectivity make them widely accepted platforms for process control. Consequently, their integration with IIoT gateways, flexible middleware and cloud services should be understood not as a replacement of traditional control, but as an extension of its monitoring, data logging and remote control capabilities [13,14,15,16,17].
This discussion becomes even more relevant when accessible technical solutions are considered. In many industrial settings, particularly in small- and medium-sized enterprises (SMEs), the adoption of Industry 4.0 is constrained by limitations in budget, infrastructure and technical specialization [18,19]. Under such conditions, compact, modular and reproducible architectures are especially valuable as a gradual entry point into industrial digitalization [6,20,21,22].
The problem is not only technological, but also methodological. Although a broad literature on IIoT architectures exists, a significant portion of prior work remains predominantly conceptual or provides only limited experimental validation. In many cases, functional frameworks and layered architectures are described, but the actual interaction among components is not documented in sufficient detail and performance metrics are not systematically reported. As a result, a gap persists between architectures proposed at the conceptual level and those that have been experimentally implemented and validated in a reproducible manner [7,9,21,23,24,25].
In response to this gap, the present work proposes and experimentally validates a reproducible IIoT architecture based on a compact PLC platform, Factory I/O, Node-RED and Microsoft Azure. The solution integrates local control, real-time monitoring, structured historical data storage and bidirectional remote control within a replicable experimental environment. Its contribution is twofold: first, it proposes a compact and modular architecture based on widely available tools; second, it incorporates validation through latency, delivery, update and recovery metrics in order to provide quantitative evidence on its technical feasibility. Although the study does not constitute a direct validation in a real SME, it offers a useful experimental basis for future research on progressive digitalization in smaller-scale production contexts [6,21,22].
The remainder of this manuscript is organized as follows. Section 2 describes the methodological approach, the implemented architecture, the variable mapping strategy, and the experimental metrics. Section 3 presents the validation results. Section 4 discusses the findings in relation to the literature and the practical scope of the proposal. Finally, Section 5 summarizes the main conclusions and future research directions.

2. Materials and Methods

2.1. Methodological Approach and Design Rationale

The present study followed an experimental approach aimed at the design, implementation and validation of a reproducible IIoT architecture for real-time monitoring, historical data storage and bidirectional remote control of an automated level control process. The research focused on the functional implementation of a prototype and its evaluation through performance metrics in order to provide quantitative evidence [23,26,27].
The design criterion was based on three methodological principles. First, IIoT architectures must satisfy requirements of interoperability, scalability, reliability, security and low latency, especially when integrating heterogeneous devices and distributed services [7,9,28]. Second, edge–cloud and fog–cloud configurations offer advantages over fully cloud-centric schemes when local control must be preserved while remote monitoring is enabled under temporary constraints [11,12,29]. Third, PLCs remain technically valid platforms in Industry 4.0 environments when they are integrated with flexible middleware and cloud services rather than being completely replaced [13,14,15].
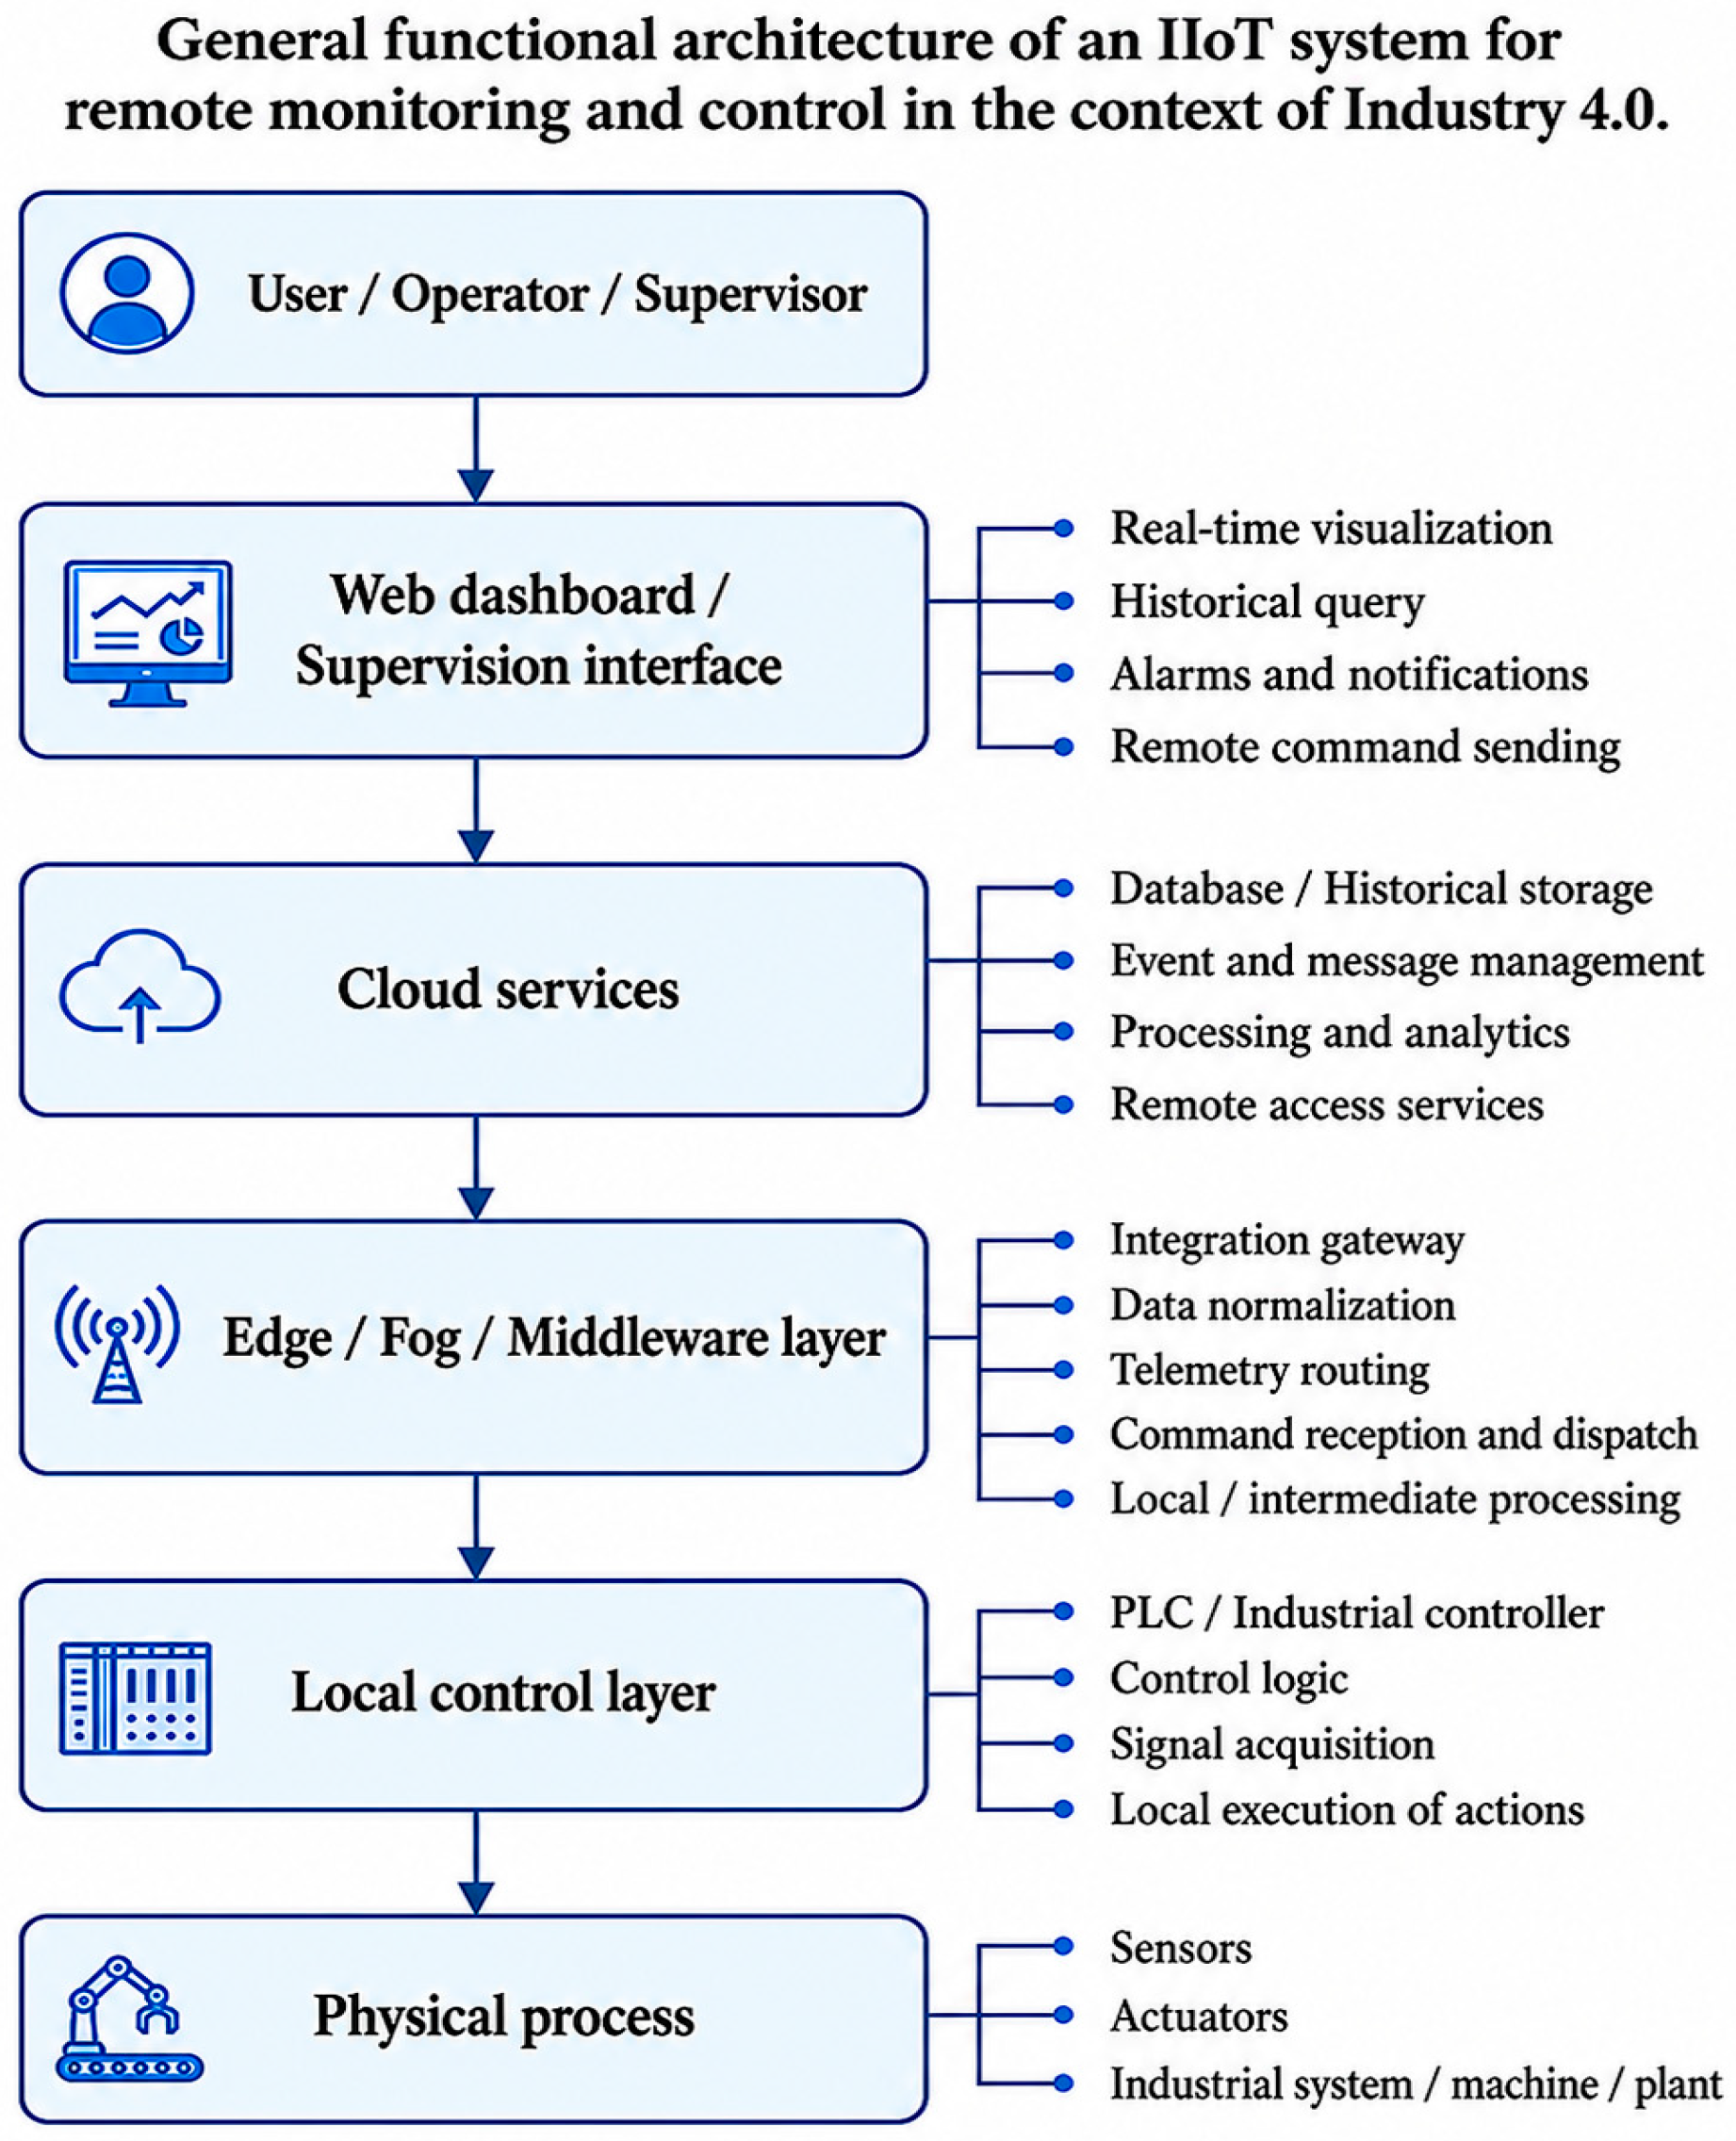
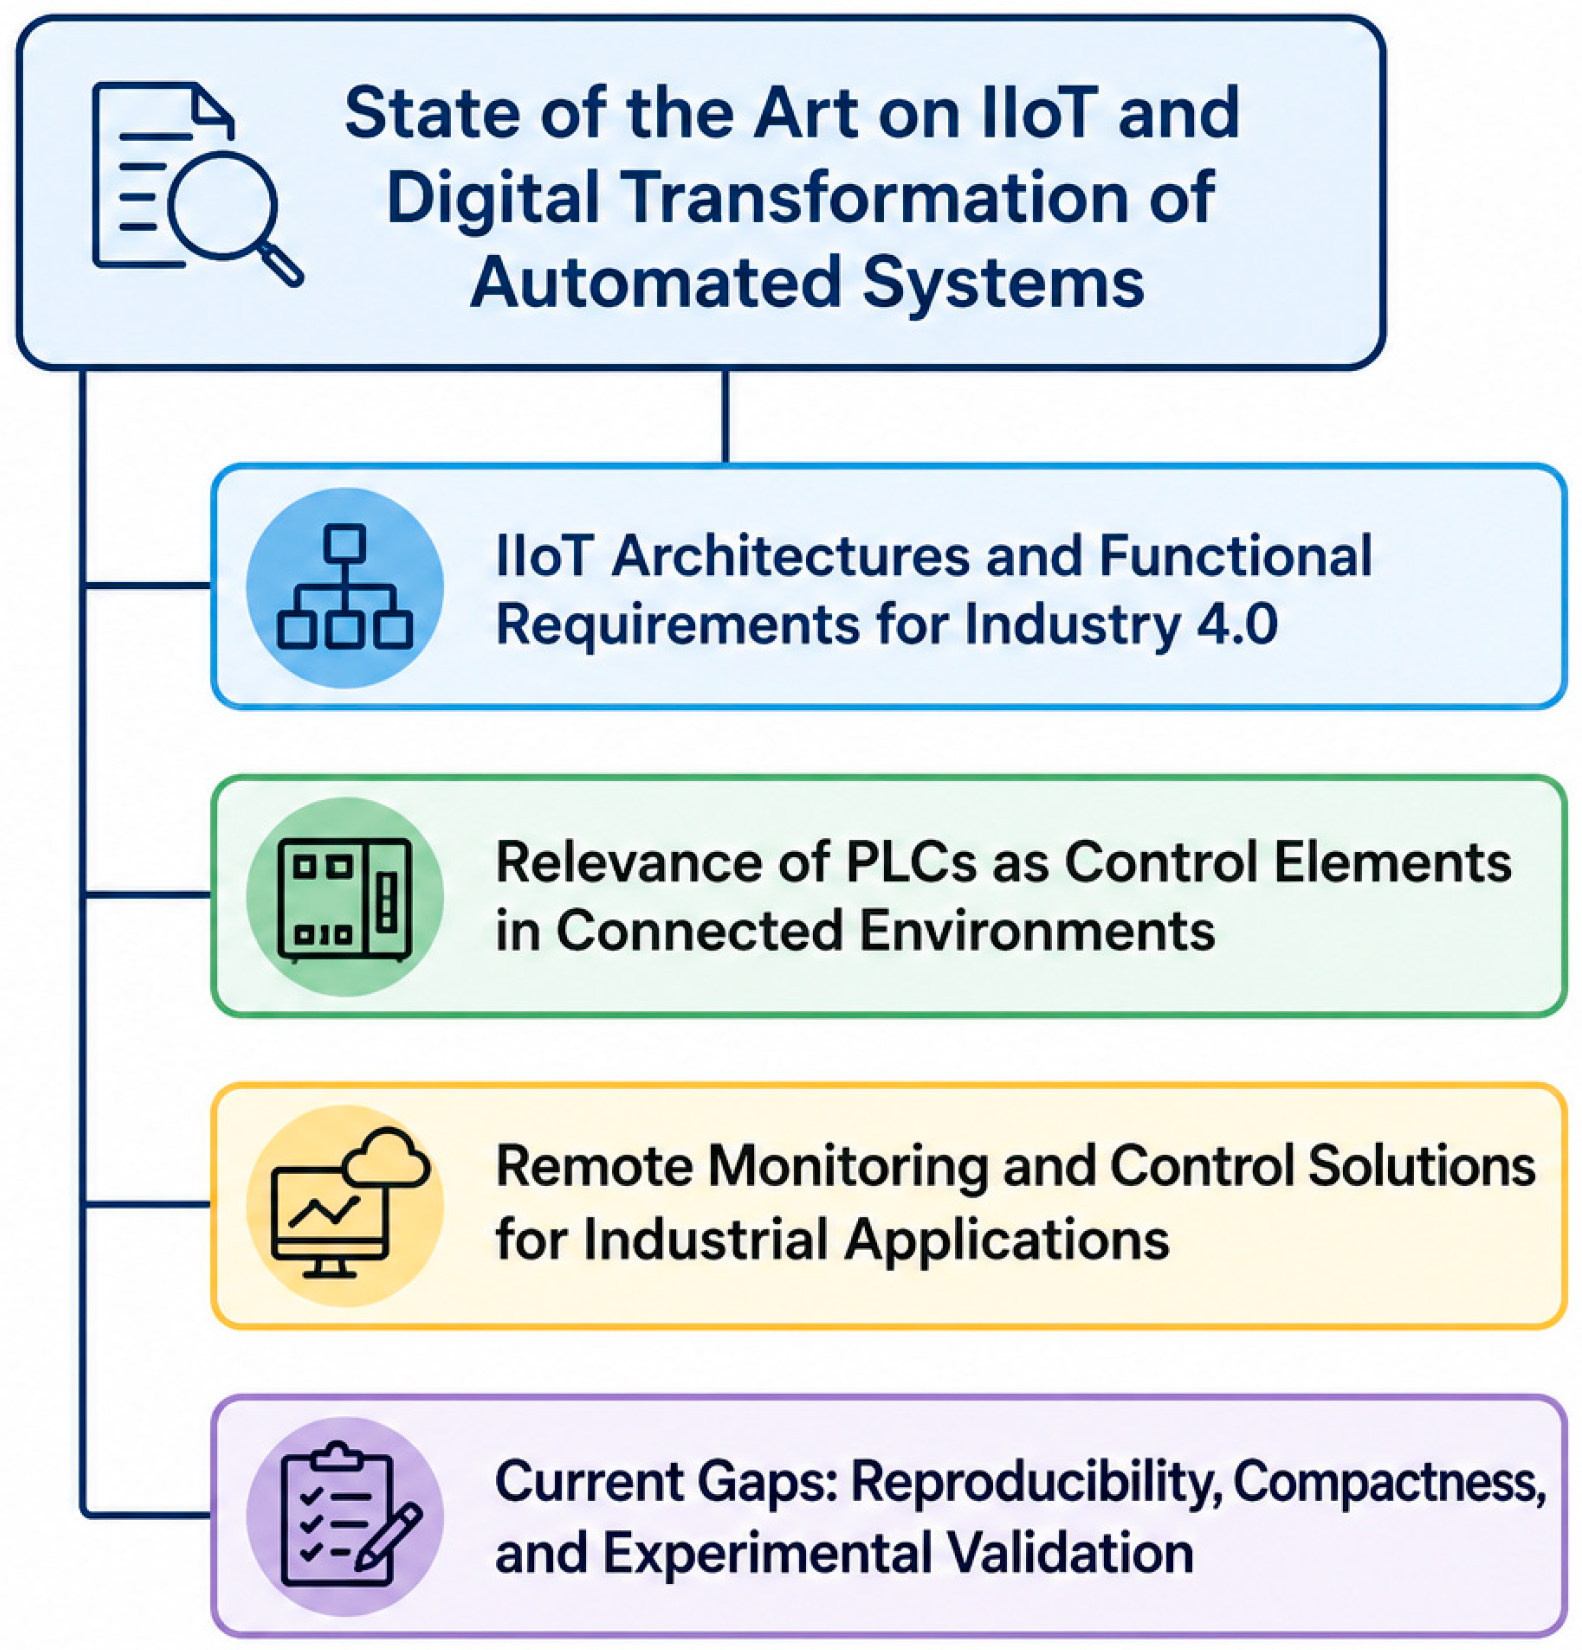
Considering the above, an architecture organized into four layers was established: a local automation layer, integration layer, cloud layer and remote application layer. This structure sought to decouple the visualization, data logging and remote access functions from the process control system in order to maintain a reproducible and scalable modular solution [23,24,27]. Figure 1 and Figure 2, together with Table 1 and Table 2, summarize the conceptual and methodological framework that guided the design of the system, as well as the main gaps identified in the literature and the positioning of the proposal in relation to them.
Consequently, this work is not presented as a broad revision of the IIoT, but as a concrete methodological response to a well-defined gap: the lack of compact and reproducible IIoT architectures capable of integrating local control, telemetry, structured historical data storage and remote control with explicit experimental validation [19,24].

2.2. Experimental System and Implemented Architecture

The implemented architecture was conceived as a hybrid IIoT solution to integrate local control, upstream telemetry, structured historical data storage, and downstream remote control over an automated, tank level process. The experimental system was built using Factory I/O as a process environment, Siemens LOGO! 8.4 as a local control PLC platform, Node-RED v5.0.1 as middleware and IIoT gateway, Microsoft Azure as cloud infrastructure and a Web App as a monitoring and control interface.
From a functional point of view, the architecture supported two complementary flows. The first corresponded to the telemetry upstream, in which the process variables were acquired locally, processed by Node-RED and sent to Azure for real-time dissemination and structured historical data storage. The second corresponded to the remote control downstream, whereby the commands issued from the Web App were transmitted through Azure and subsequently written to the PLC via Node-RED. This bidirectionality made it possible to evaluate the architecture not only as a monitoring solution, but as a distributed system of supervision and remote action.
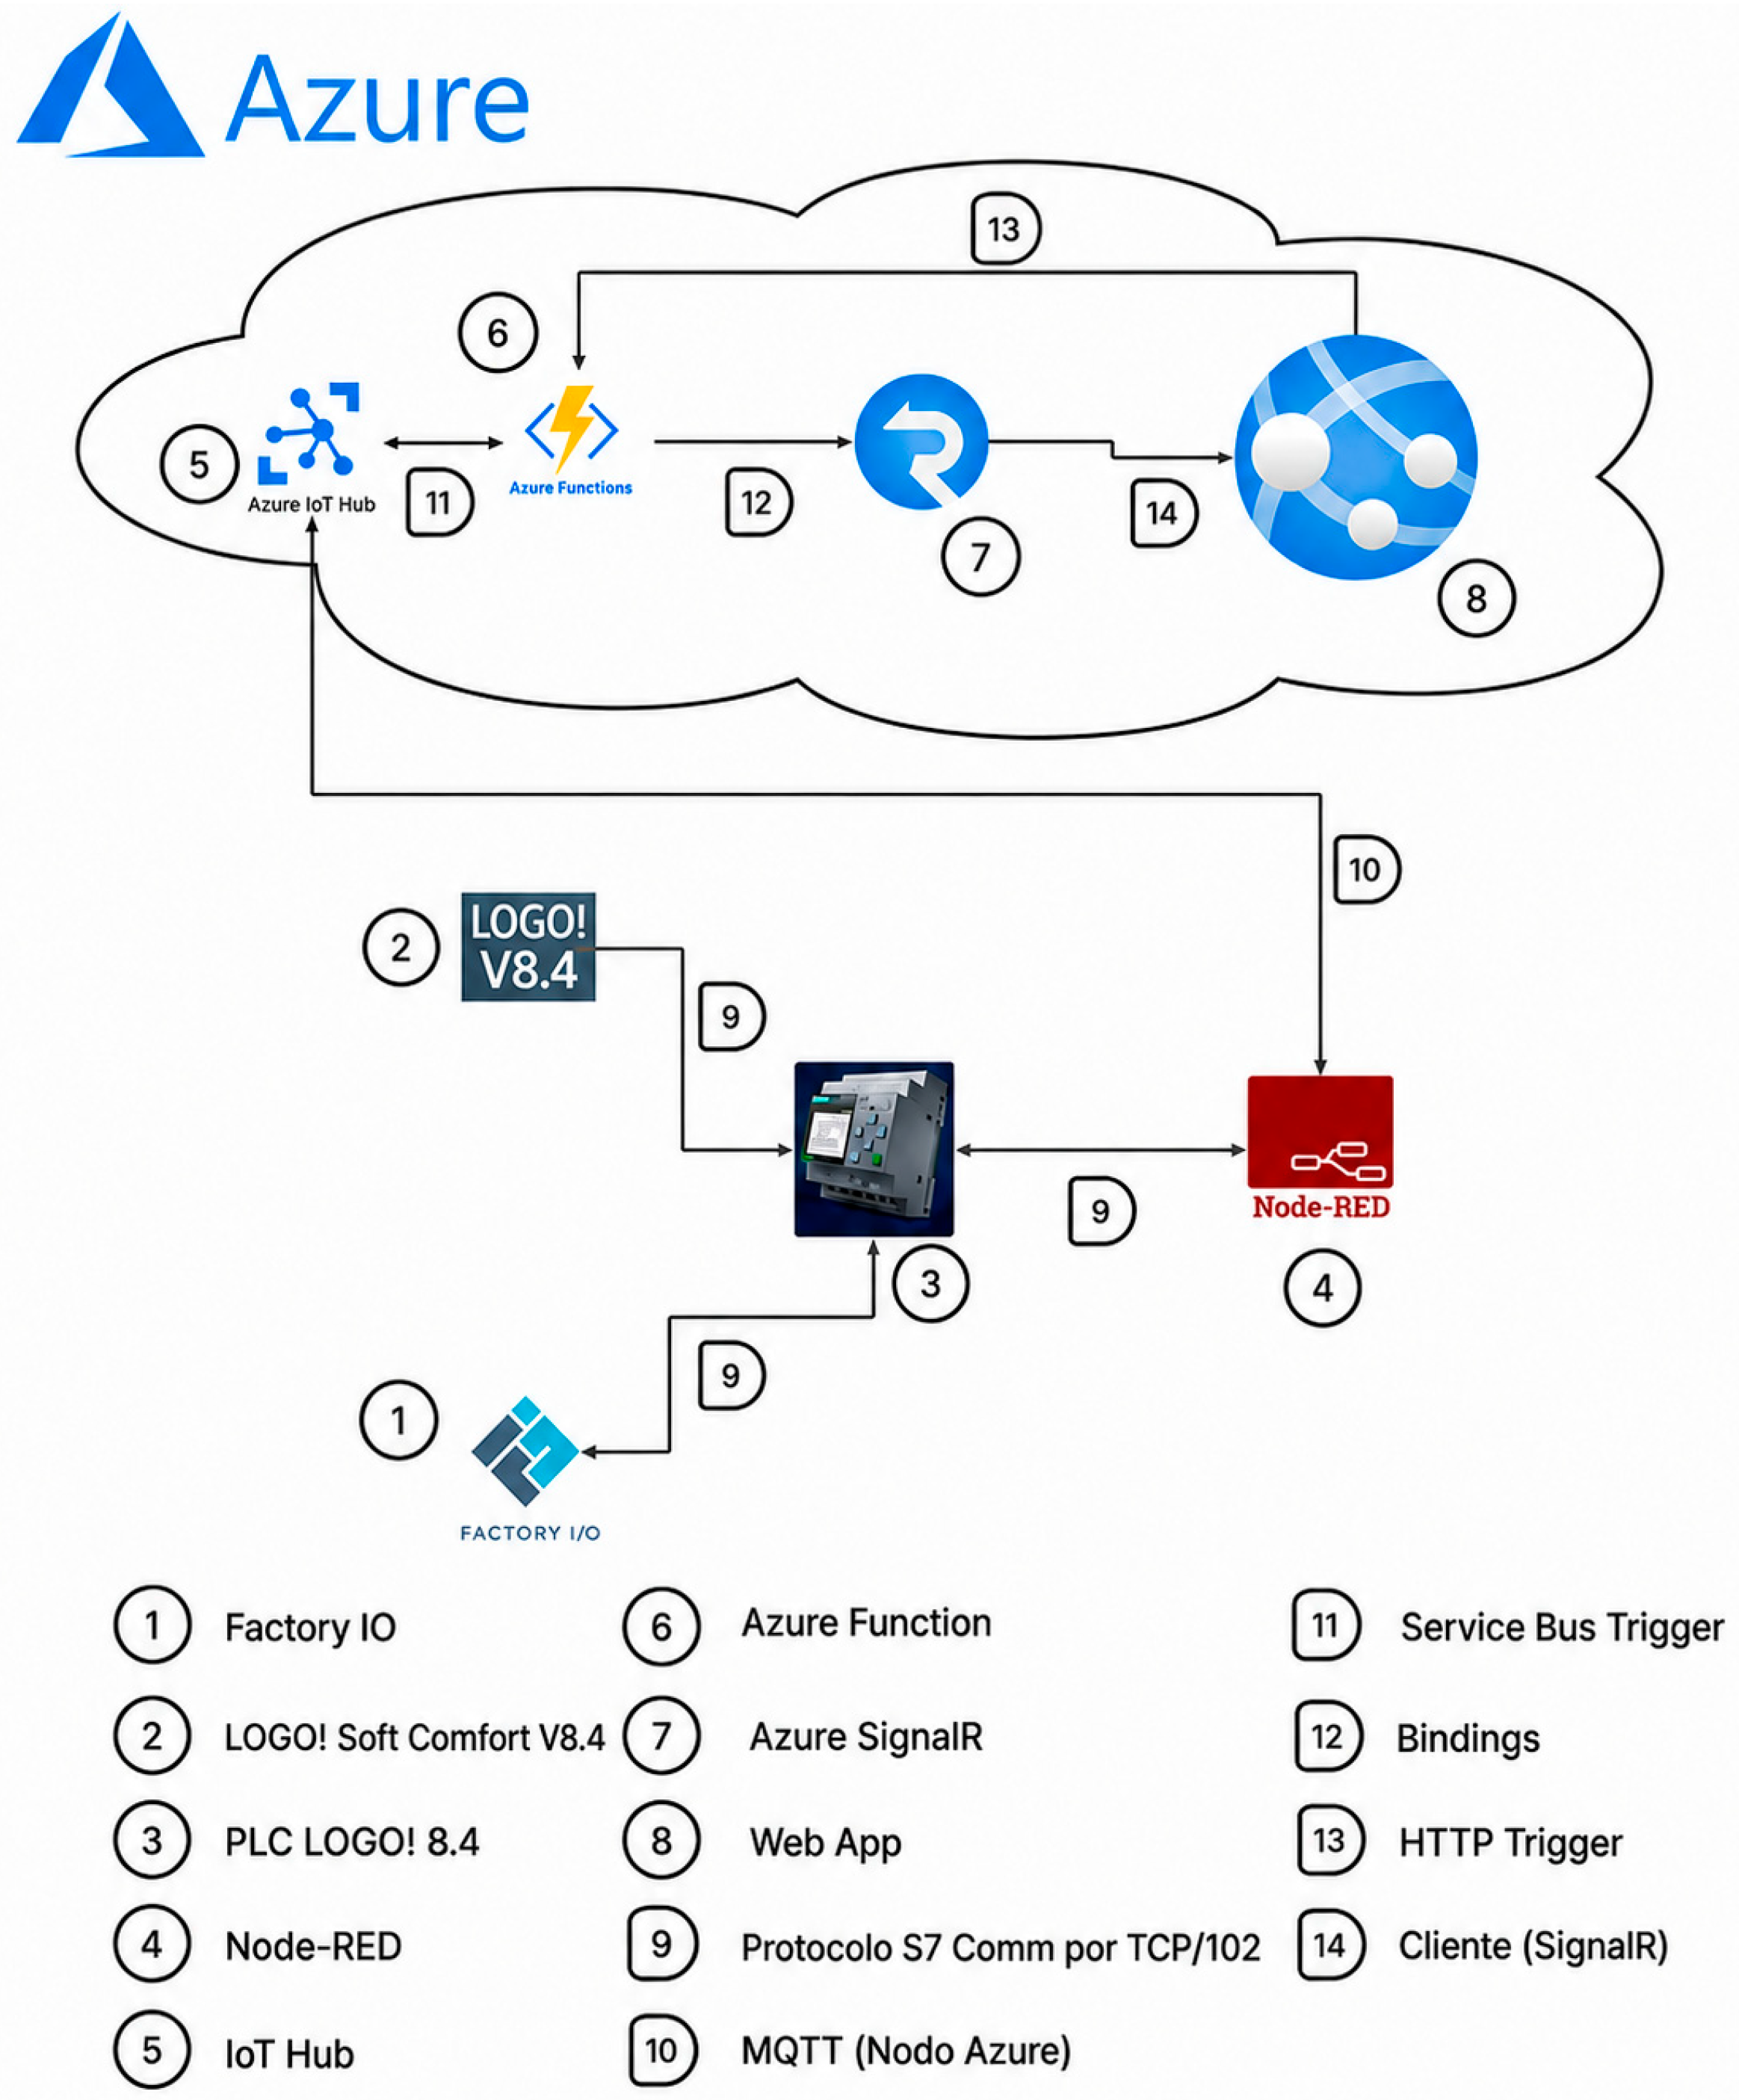
Figure 3 shows the proposed overall architecture of the IIoT system. It shows the relationship between the automated process, the local controller, the integration layer, the cloud services and the remote application. This figure constitutes the visual core of the article, since it connects the general methodological framework with the concrete implementation developed in the study.
From Figure 3, it can be understood that the architecture was designed to retain immediate control of the process at the local layer, delegating to Node-RED and Azure the functions of control, data distribution, persistence and remote access. This functional separation was intentional and responded to the objective of building a reproducible solution without sacrificing modularity or expandability.

2.3. Local Automation Layer

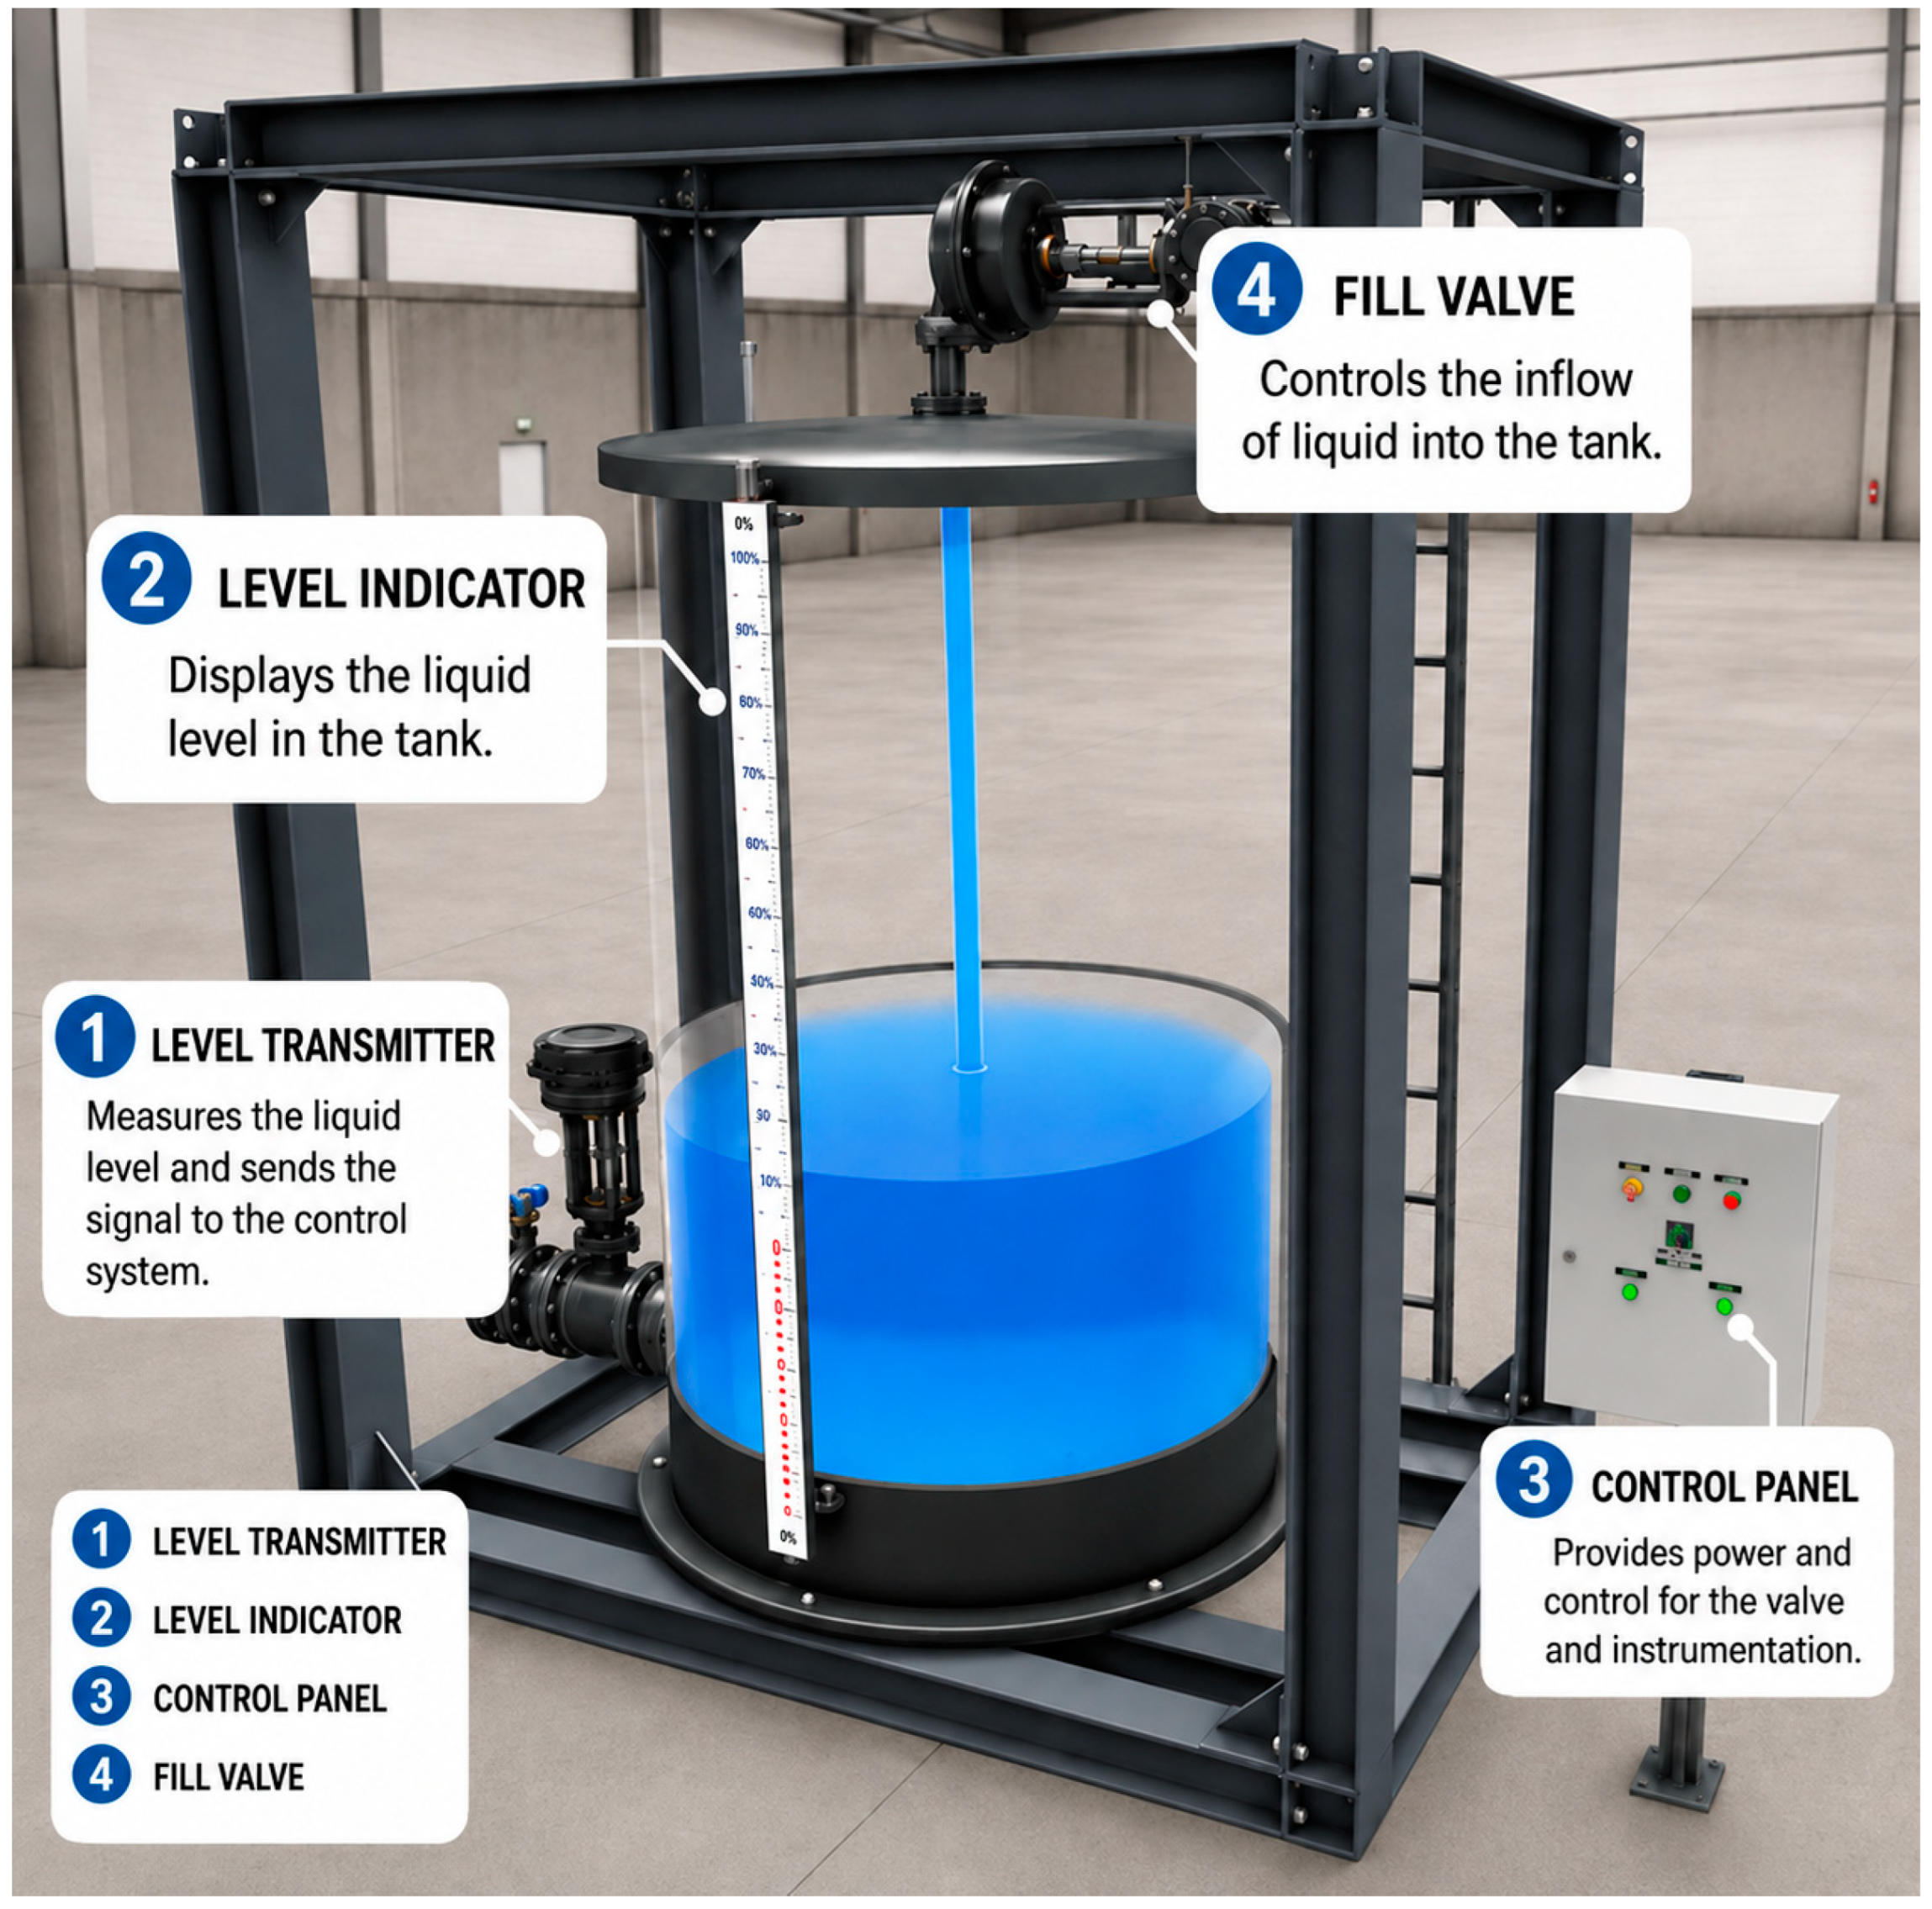
The local automation layer concentrated on the immediate interaction with the process and the execution of the control logic. The experimental process consisted of a tank filling and emptying system modeled in Factory I/O, while the control logic was programmed using Siemens LOGO! Soft Comfort V8.4, which was used to configure the PLC behavior for manual and automatic operation. The system was designed to operate in manual mode and automatic mode. This made it possible to evaluate different forms of interaction with the process and observe the behavior of the architecture under different operating conditions. The local controller managed variables associated with running, stopping, filling, emptying and tank level, preserving immediate control of the process even in the absence of remote intervention. This methodological decision is consistent with the permanence of PLC as a robust control core [13,14,15,16,23].
From an operational perspective, Factory I/O provided a virtual reproduction of the tank level process, which can be interpreted as a simplified digital twin for experimental purposes. Figure 4 shows the local automation environment of the level control process. Its inclusion is important because it visually documents the actual experimental base on which the entire architecture was built, a key aspect for the replicability of the study.

2.4. System Variables and Interlayer Mapping

The integration between the local layer and the cloud layer required an explicit mapping of variables so that process signals could be treated consistently throughout the architecture. To do this, the variables were organized into three functional groups: local inputs, cloud-associated variables, and system outputs. Local inputs represented actions and signals from the operating environment, while cloud variables were associated with remote flags read or written from Node-RED.
The separation fulfilled two fundamental methodological functions. First, it improved the traceability of information between the process, the PLC, and the cloud. Second, it reduced the coupling between local logic and remote logic, favoring a modular organization of the system. This form of structuring coincides with works that use Node-RED as integration middleware, where the clear definition of tags, data paths, and relationships between variables is a requirement to preserve functional order and facilitate future extensions [13,14,15].
The correspondence between process variables and their projection towards the upper layers is summarized in Table 3, which constitutes one of the most important methodological elements for the reproducibility of the system.

2.5. Local Integration Layer: Communication Between PLC and Node-RED

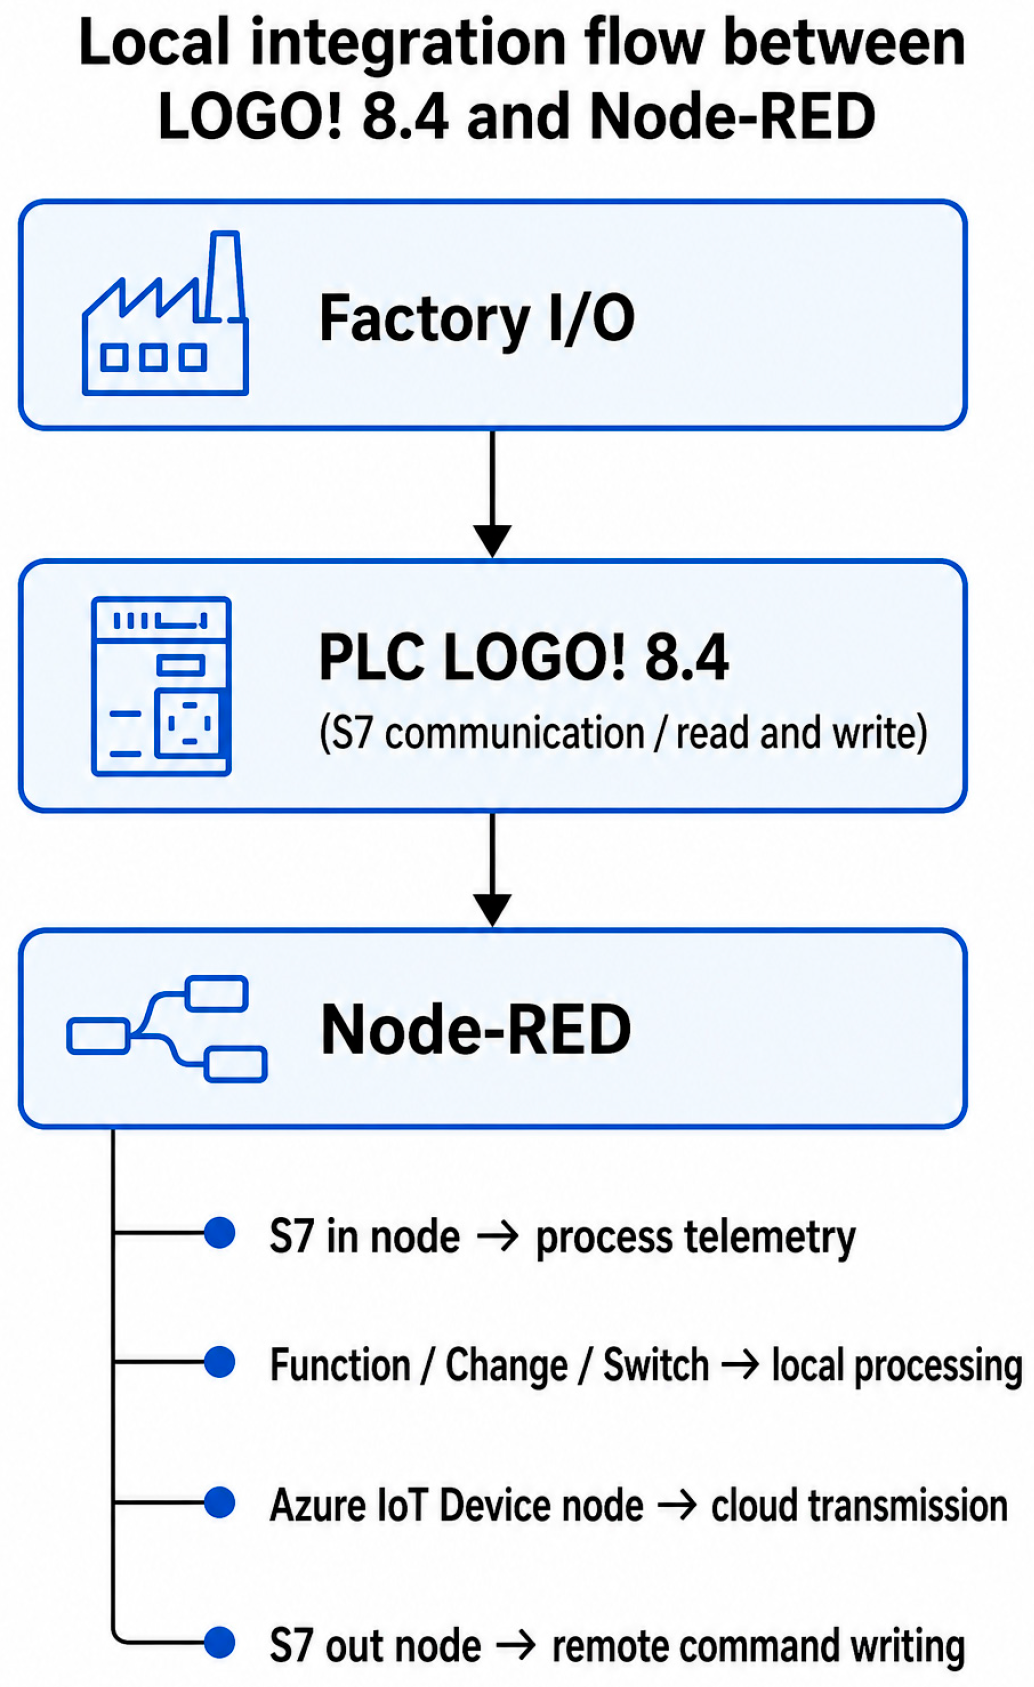
The local integration layer was implemented using Node-RED, configured to communicate with the PLC through the node-network-contrib-s7 node. The communication used standardized parameters from the industrial environment, including ISO-on-TCP, PLC IP address, port 102, slot 1, and specific addresses for analog brands and variables. Signals intended for sending to the cloud were handled by s7-in nodes, while commands from the cloud were written over the process by s7-out nodes.
From a functional perspective, Node-RED performed four fundamental operations: reading telemetry from the PLC, transforming and packaging data, sending it to Azure IoT Hub, and receiving remote commands for subsequent writing to the controller.
Figure 5 shows the local integration flow between Logo 8.4! and Node-RED, visualizing the role of middleware in data acquisition, transformation, and transmission.
The methodological importance of this figure lies in the fact that it allows us to understand how the IIoT gateway is articulated with the local controller. In this study, Node-RED was not only used as a protocol connector, but as a lightweight integration environment capable of maintaining the separation between local control and higher services, in line with open SCADA approaches reported in the literature [14,15,33,34]. An additional practical advantage of Node-RED in this architecture is its open source nature, which facilitates reproducibility, accessibility and future adaptation in low-barrier IIoT implementations.

2.6. Cloud Layer: Messaging, Events, Visualization and Persistence

The cloud layer was built on a set of Azure services that distributed functions related to messaging, event management, storage and remote access. The core of this layer was Azure IoT Hub, where the IoT device corresponding to the on-premises system was registered and both upstream telemetry functions and Cloud-to-Device (C2D) messages were managed. The connection between Node-RED and Azure IoT Hub was made using the Azure-IoT-Device node, using the hostname, device ID and primary key under Message Queuing Telemetry Transport (MQTT) protocol.
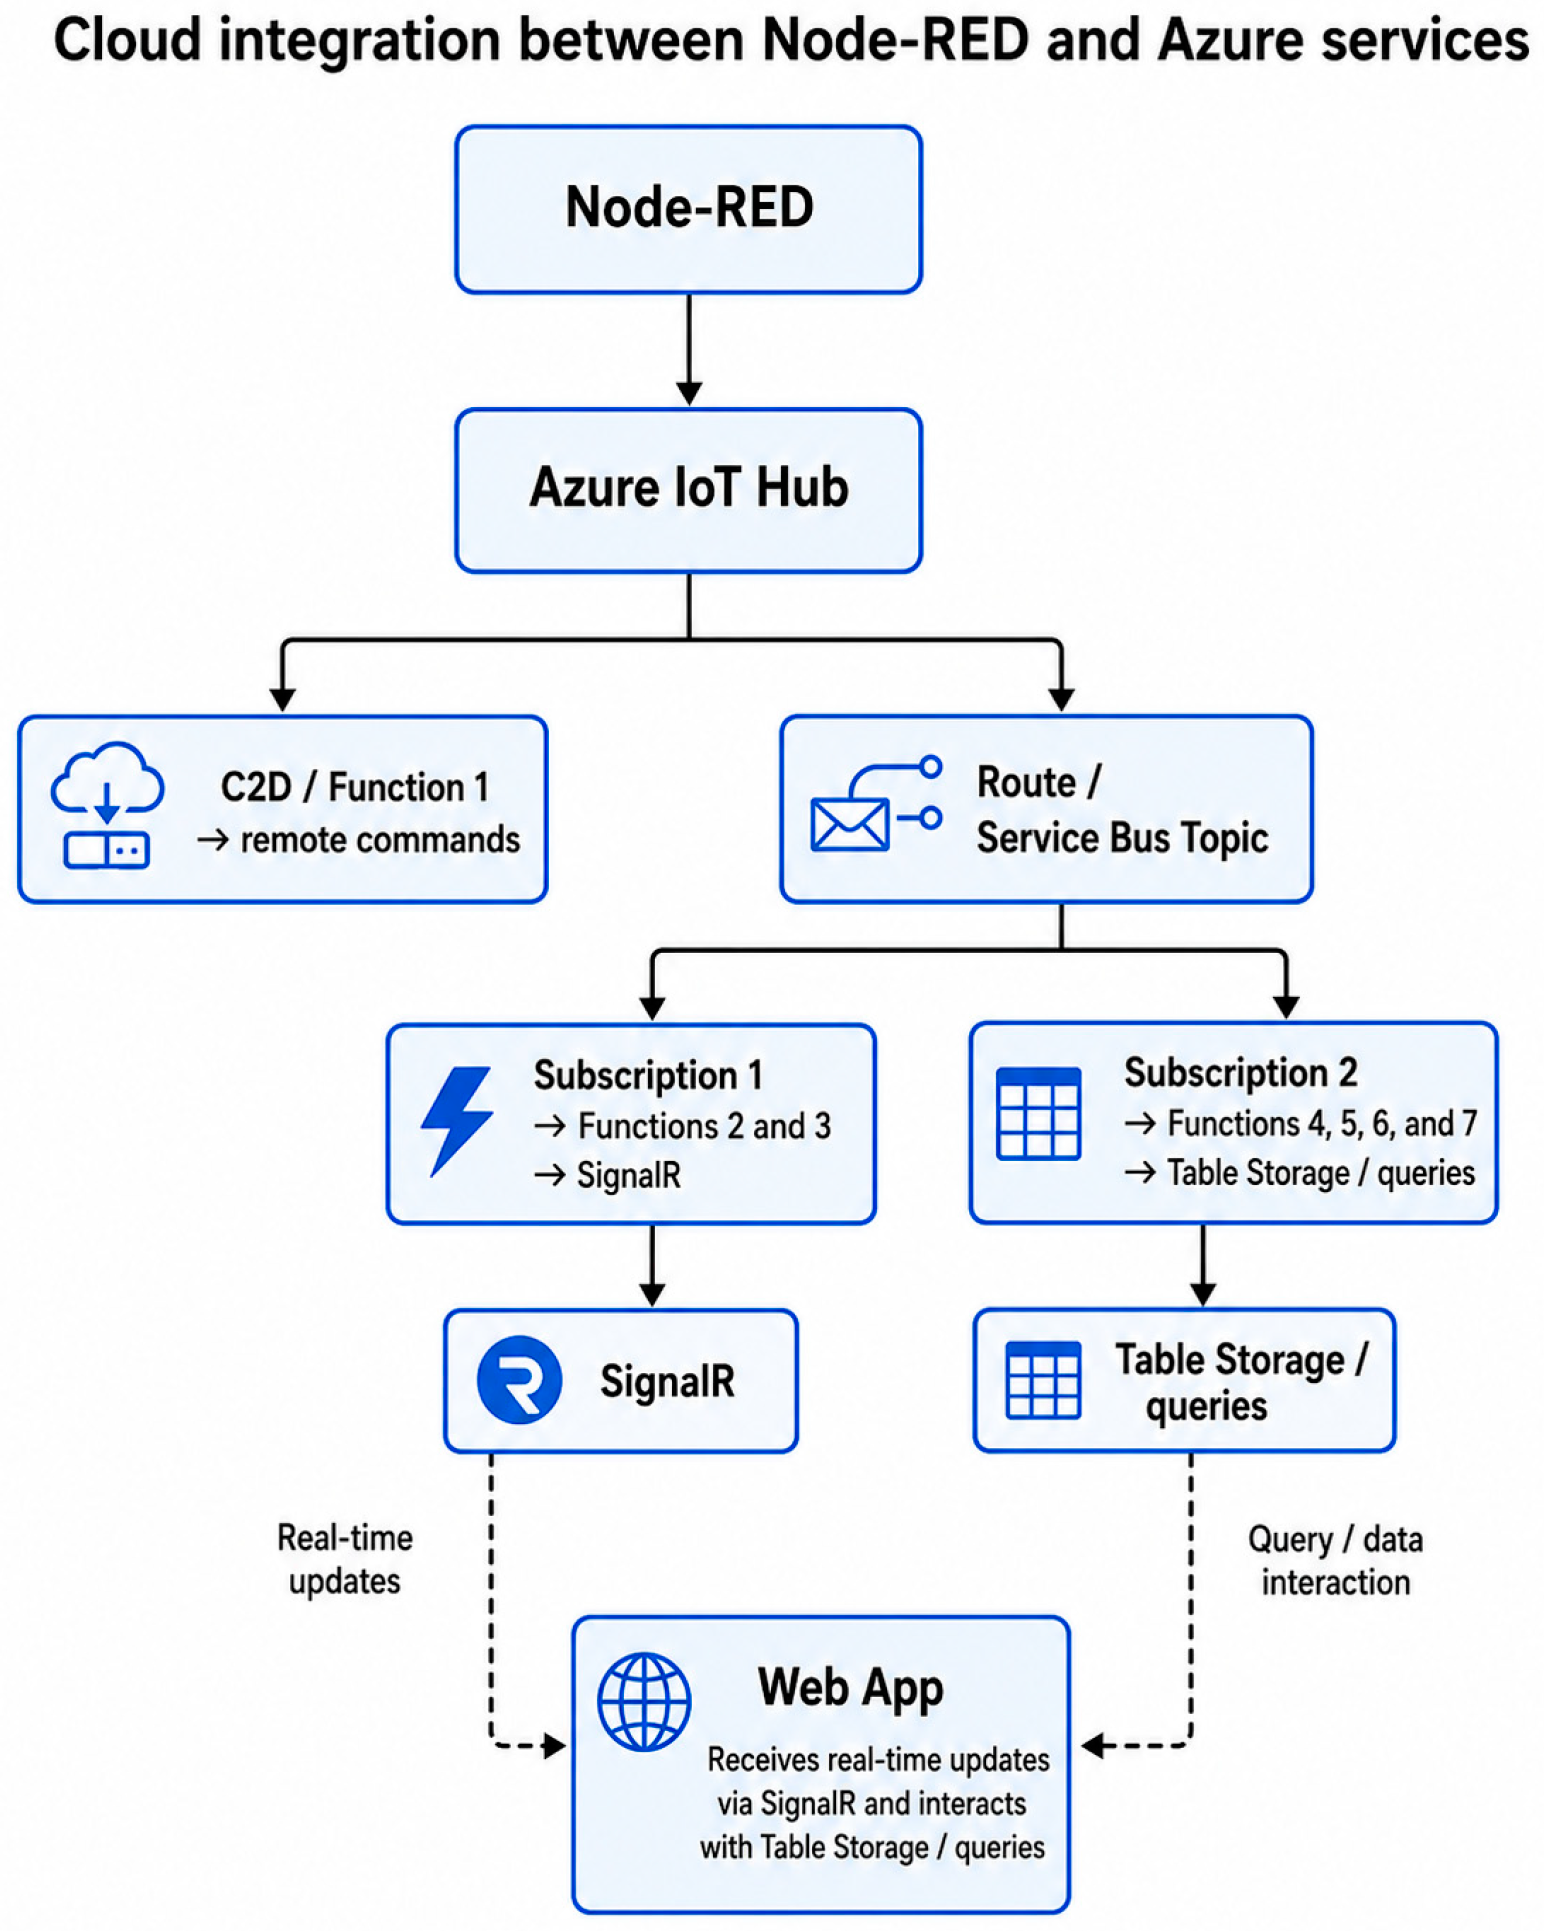
As a routing mechanism, the architecture also incorporated Azure Service Bus, configured through a topic, and differentiated subscriptions for real-time storage and broadcast functions. Azure Functions were deployed on this infrastructure with separate responsibilities: sending commands to the process, telemetry negotiation and dissemination using Azure SignalR, storing in Azure Table Storage, and querying histories from the Web App.
Figure 6 summarizes the cloud integration between Node-RED and Azure services, showing the relationship between IoT Hub, Functions, SignalR, Service Bus, Table Storage, and the Web App.
In this architecture, the functional separation of services responded to the decoupled approach, where each component assumed a specific responsibility within the overall flow of the system [8]. This decision favored the structural clarity, scalability and maintainability of the system, in addition to facilitating the direction between real-time telemetry, historical persistence and top-down control.
Although cybersecurity was not the primary focus of this study, the implemented architecture incorporated standard cloud-side access mechanisms, including device authentication credentials in Azure IoT Hub and controlled message exchange through defined service endpoints. In real industrial deployments, this architecture should be complemented with additional measures such as secure credential management, encrypted communications, role-based access control, and user authentication in the Web App in order to strengthen protection against unauthorized access and command misuse.

2.7. Application Layer and Bidirectional System Flow

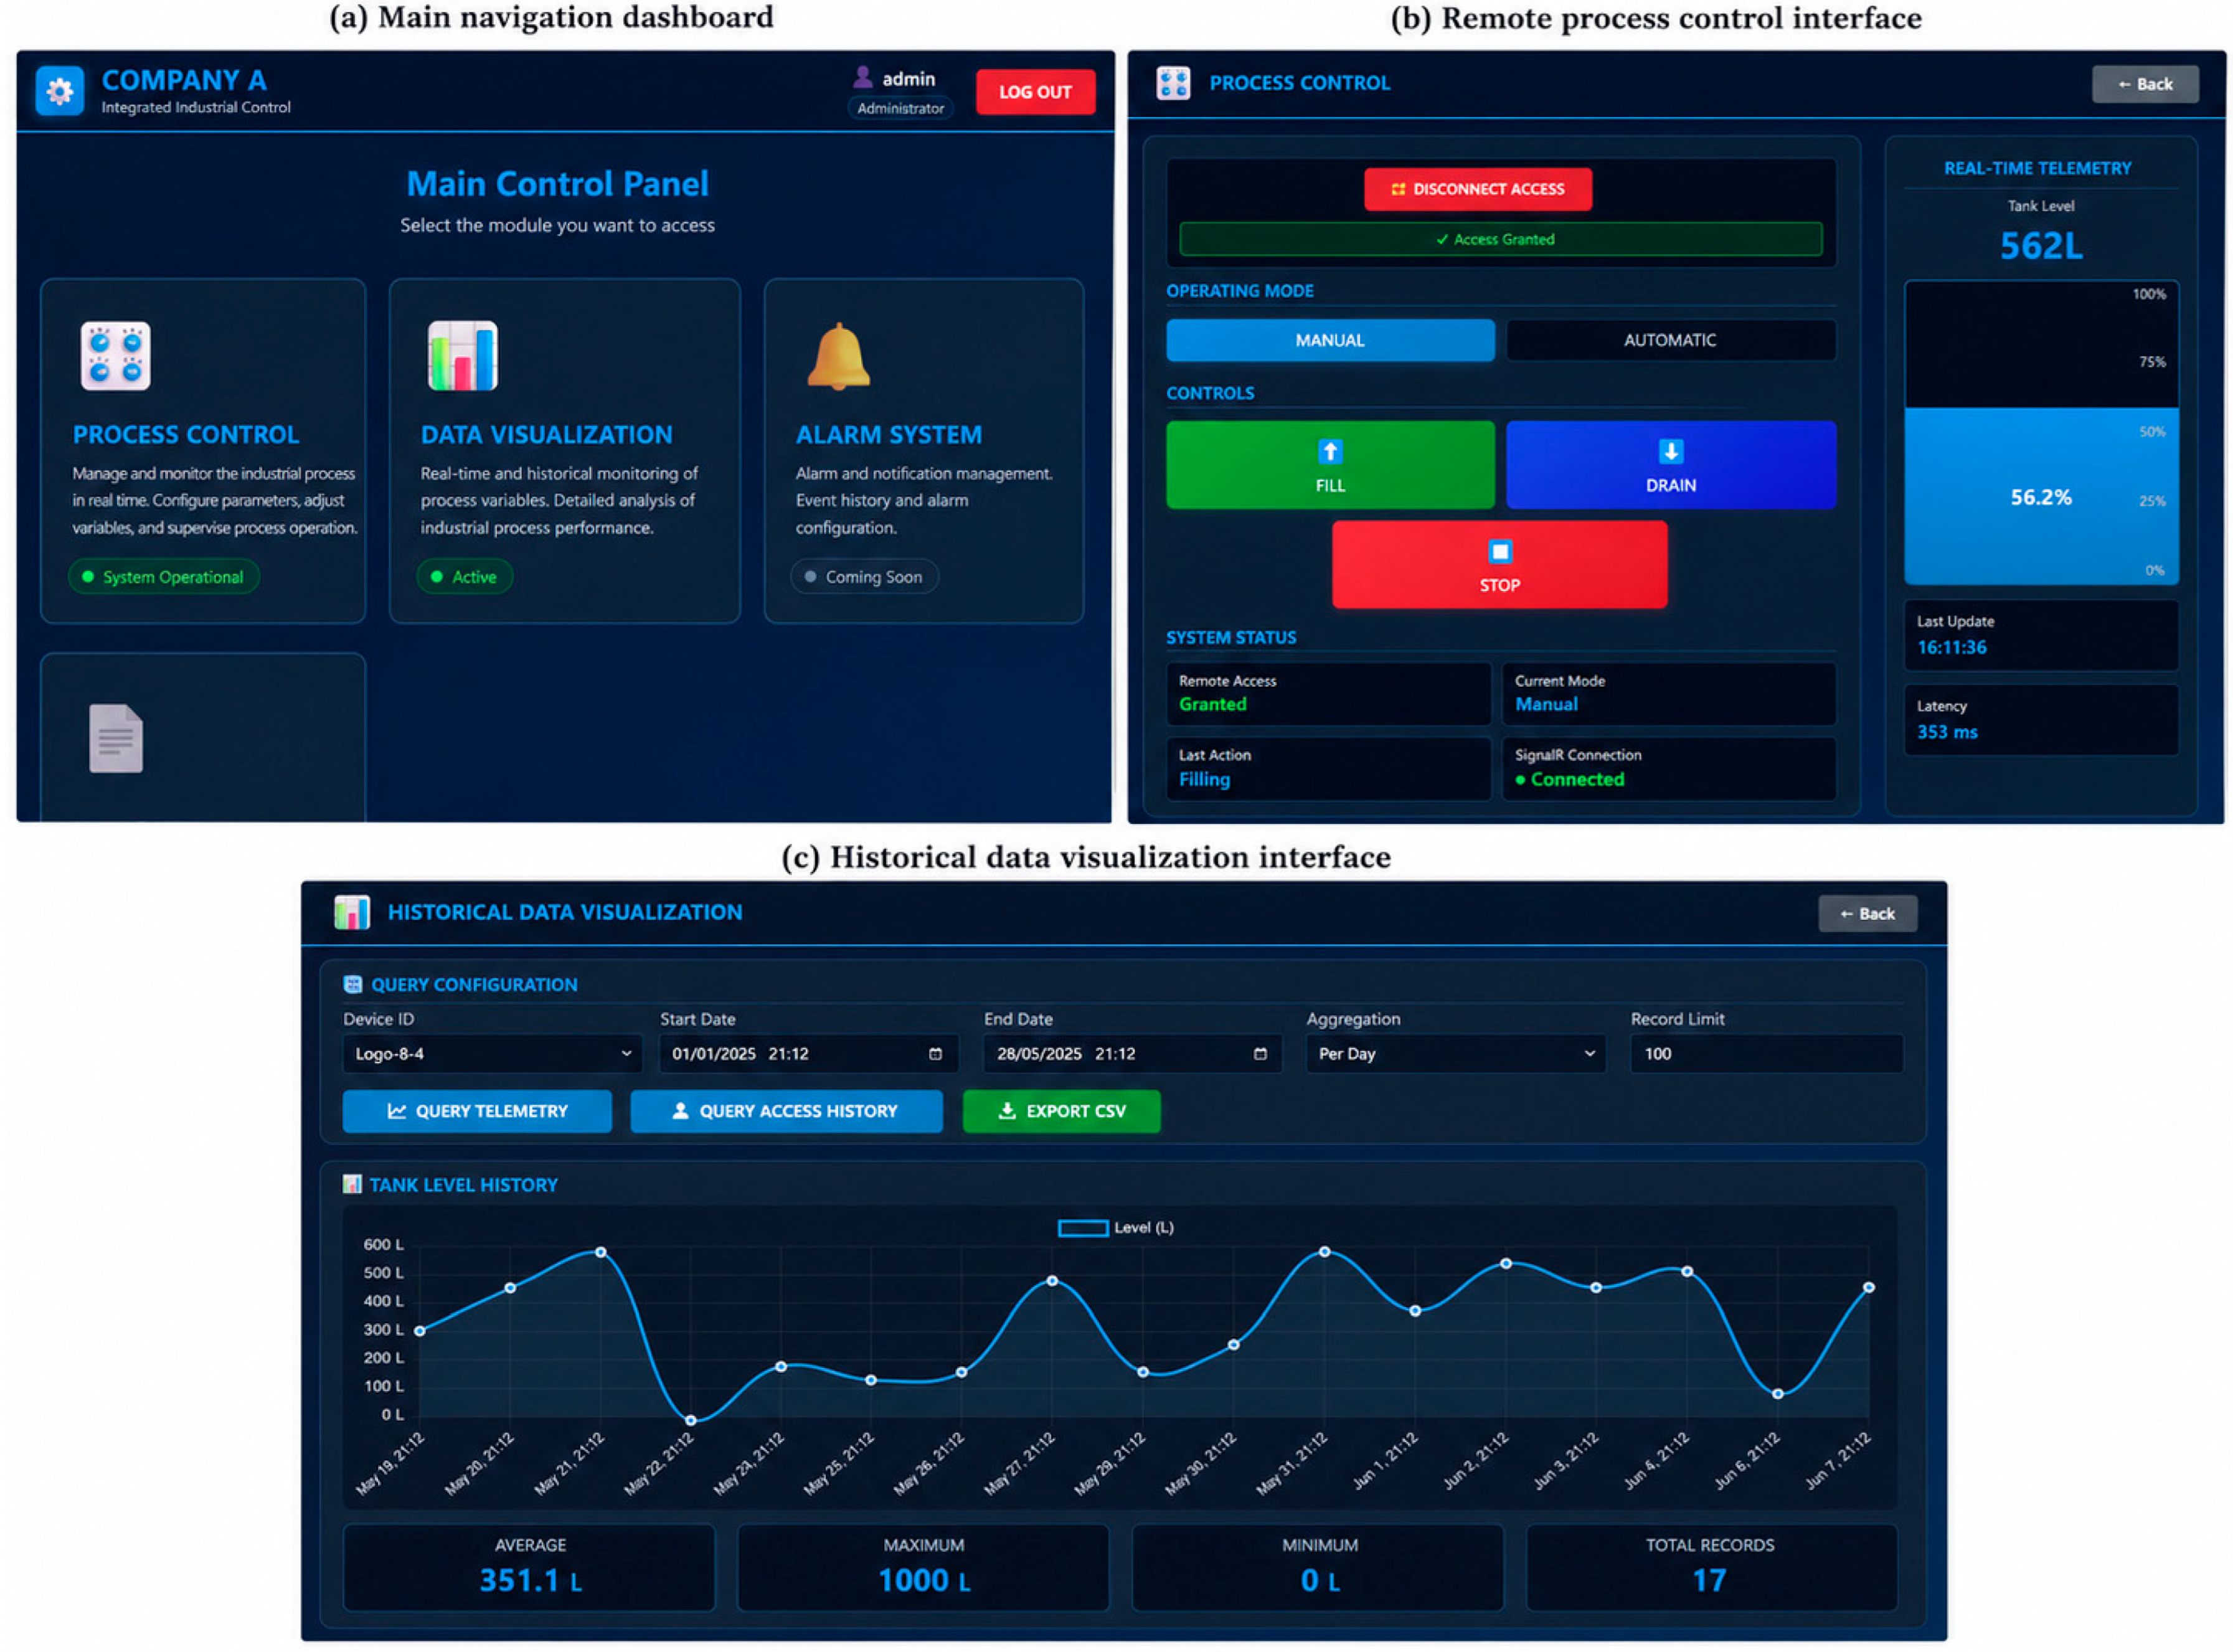
The application layer was implemented using a Web App deployed in Azure App Service, designed to allow the user to access different monitoring and control screens from any location with an internet connection. The functional structure of the application included login, main navigation, control screen and historical display screen, enabling both the real-time telemetry query and retrieval of stored data and the issuance of commands to the process.
Figure 7 presents the main interfaces of the developed Web App, including the navigation dashboard, the remote process control screen, and the historical data visualization module. Its inclusion is relevant because it documents the actual user-facing layer through which the architecture materializes its monitoring, supervisory and remote control functions. In addition to illustrating the integration of the different layers of the system, this figure shows how telemetry, operator interaction and historical query are implemented in a unified application environment.
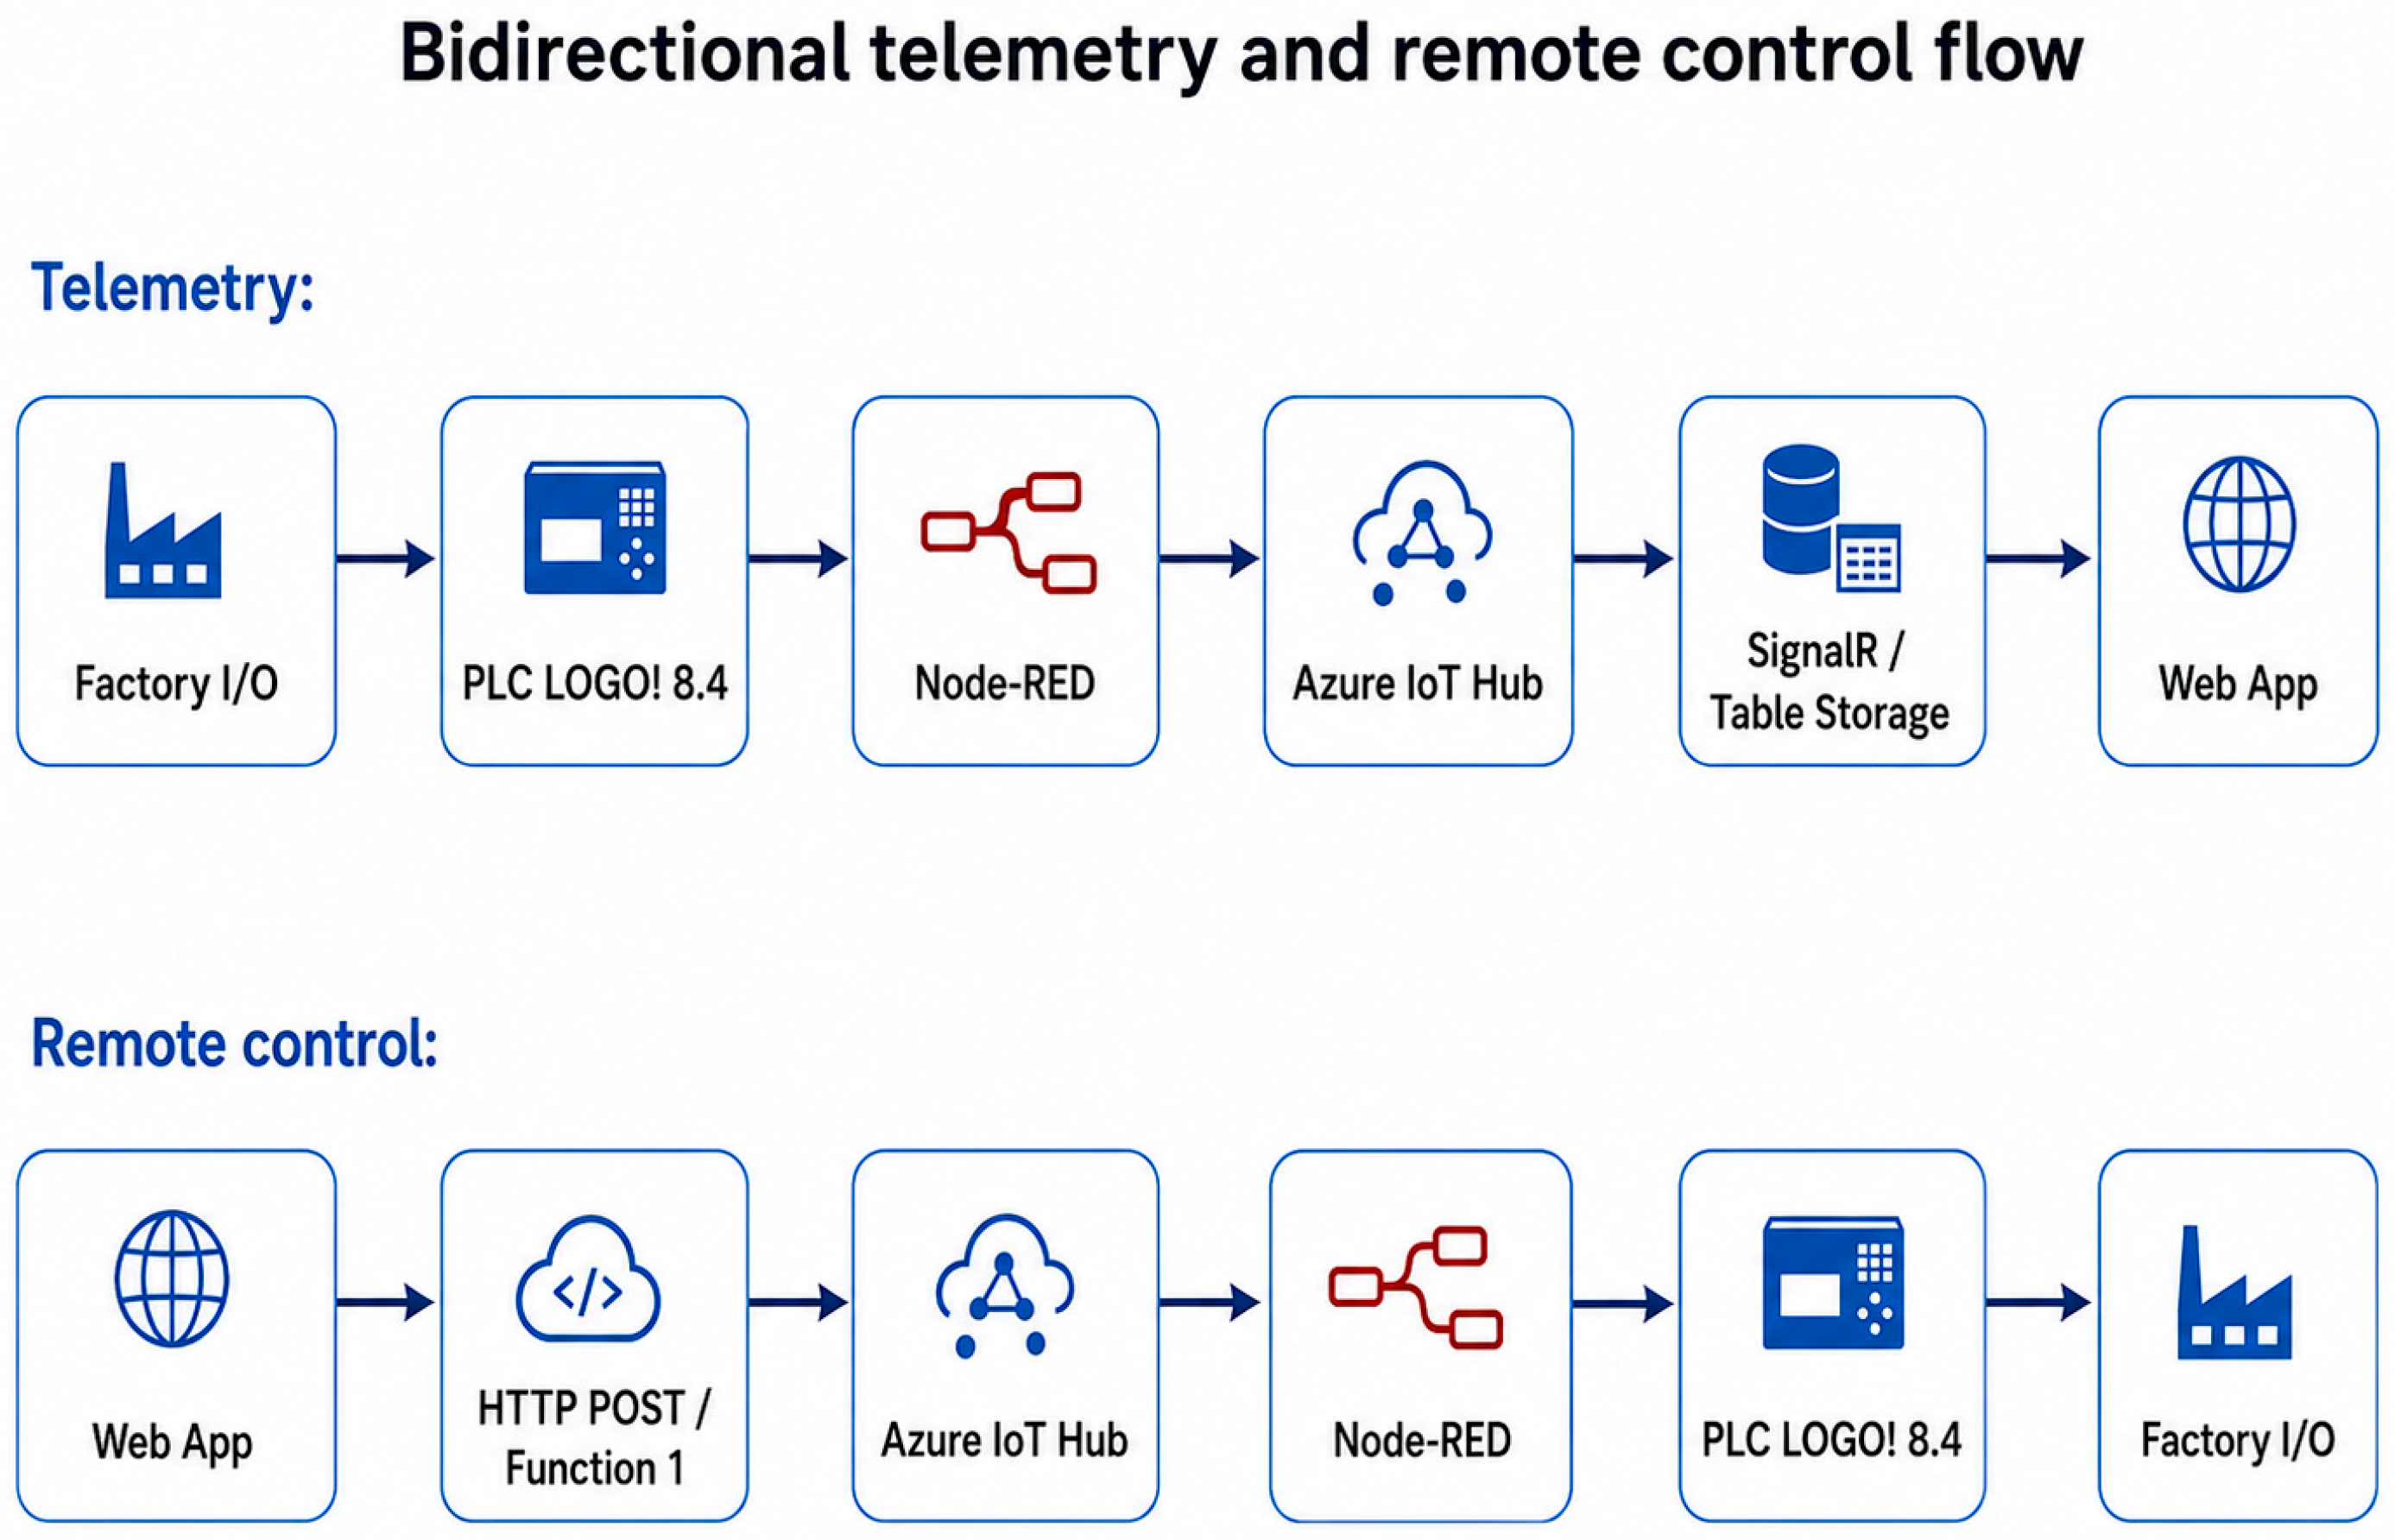
The overall operation of the system was based on two complementary flows. The telemetry flow followed the following chain: Factory I/O → LOGO! 8.4 PLC → Node-RED → Azure IoT Hub → SignalR/Table Storage → Web App. On the other hand, the remote control flow operated in reverse: Web App → HTTP POST/Azure Functions → Azure IoT Hub → Node-RED → LOGO! 8.4 PLC → Factory I/O.
Figure 8 presents this bidirectional flow of telemetry and remote control, condensing the core operating principle of the implemented architecture.

2.8. Remote Command Processing and Distributed Control Logic

One of the most relevant methodological elements was the way control messages were processed after arriving from Azure. The commands issued from the Web App were sent through HTTP functions to IoT Hub and then received in the Azure node of Node-RED. From there, the flow performed several processing stages: message separation, conversion to JSON, identification of the corresponding input, transformation to Boolean values, filtering using switch nodes, and routing to the s7-out nodes.
This strategy allowed a single remote function to control multiple actions of the system, maintaining clarity in the relationship between cloud command and local PLC variables. The formal correspondence between remote commands and control variables is summarized in Table 4.
Together, Table 3 and Table 4 provide the variable-level documentation required to support the functional reproducibility of the proposed architecture across its local, integration and cloud layers.

2.9. Experimental Metrics and Evaluation Criteria

The experimental validation of the system was structured around five metrics: end-to-end telemetry latency, remote command latency, successful delivery rate, update rate, and service recovery time.
These metrics were defined to characterize the temporal and functional behavior of the architecture in its two directions of operation: bottom-up monitoring and top-down control. The selection of these variables responded to the need to evaluate not only the overall connectivity of the system, but also its operational performance, its effective delivery capacity and its behavior in the face of connectivity disturbances, dimensions that the recent literature recognizes as critical in distributed IIoT systems [7,9,28,30].
Each selected metric addressed a specific performance dimension of the architecture. End-to-end telemetry latency was used to evaluate the temporal efficiency of upstream monitoring, remote command latency to assess the responsiveness of downstream control, successful delivery rate to quantify transmission reliability, update rate to characterize the usability of the remote visualization layer, and service recovery time to reflect the functional resilience of the system after connectivity interruptions.
The specific description of each metric, as well as its calculation and final values, are presented in the Section 3.

3. Results

This section presents the results of the experimental validation of the proposed IIoT architecture.

3.1. End-to-End Telemetry Latency

End-to-end telemetry latency was evaluated along two transmission paths: Factory I/O → Web App, associated with real-time visualization using SignalR, and Factory I/O → Table Storage, associated with historical cloud storage. For both routes, only observations corresponding to the normal operating regime were analyzed, excluding records after the interruption of communication with SignalR.
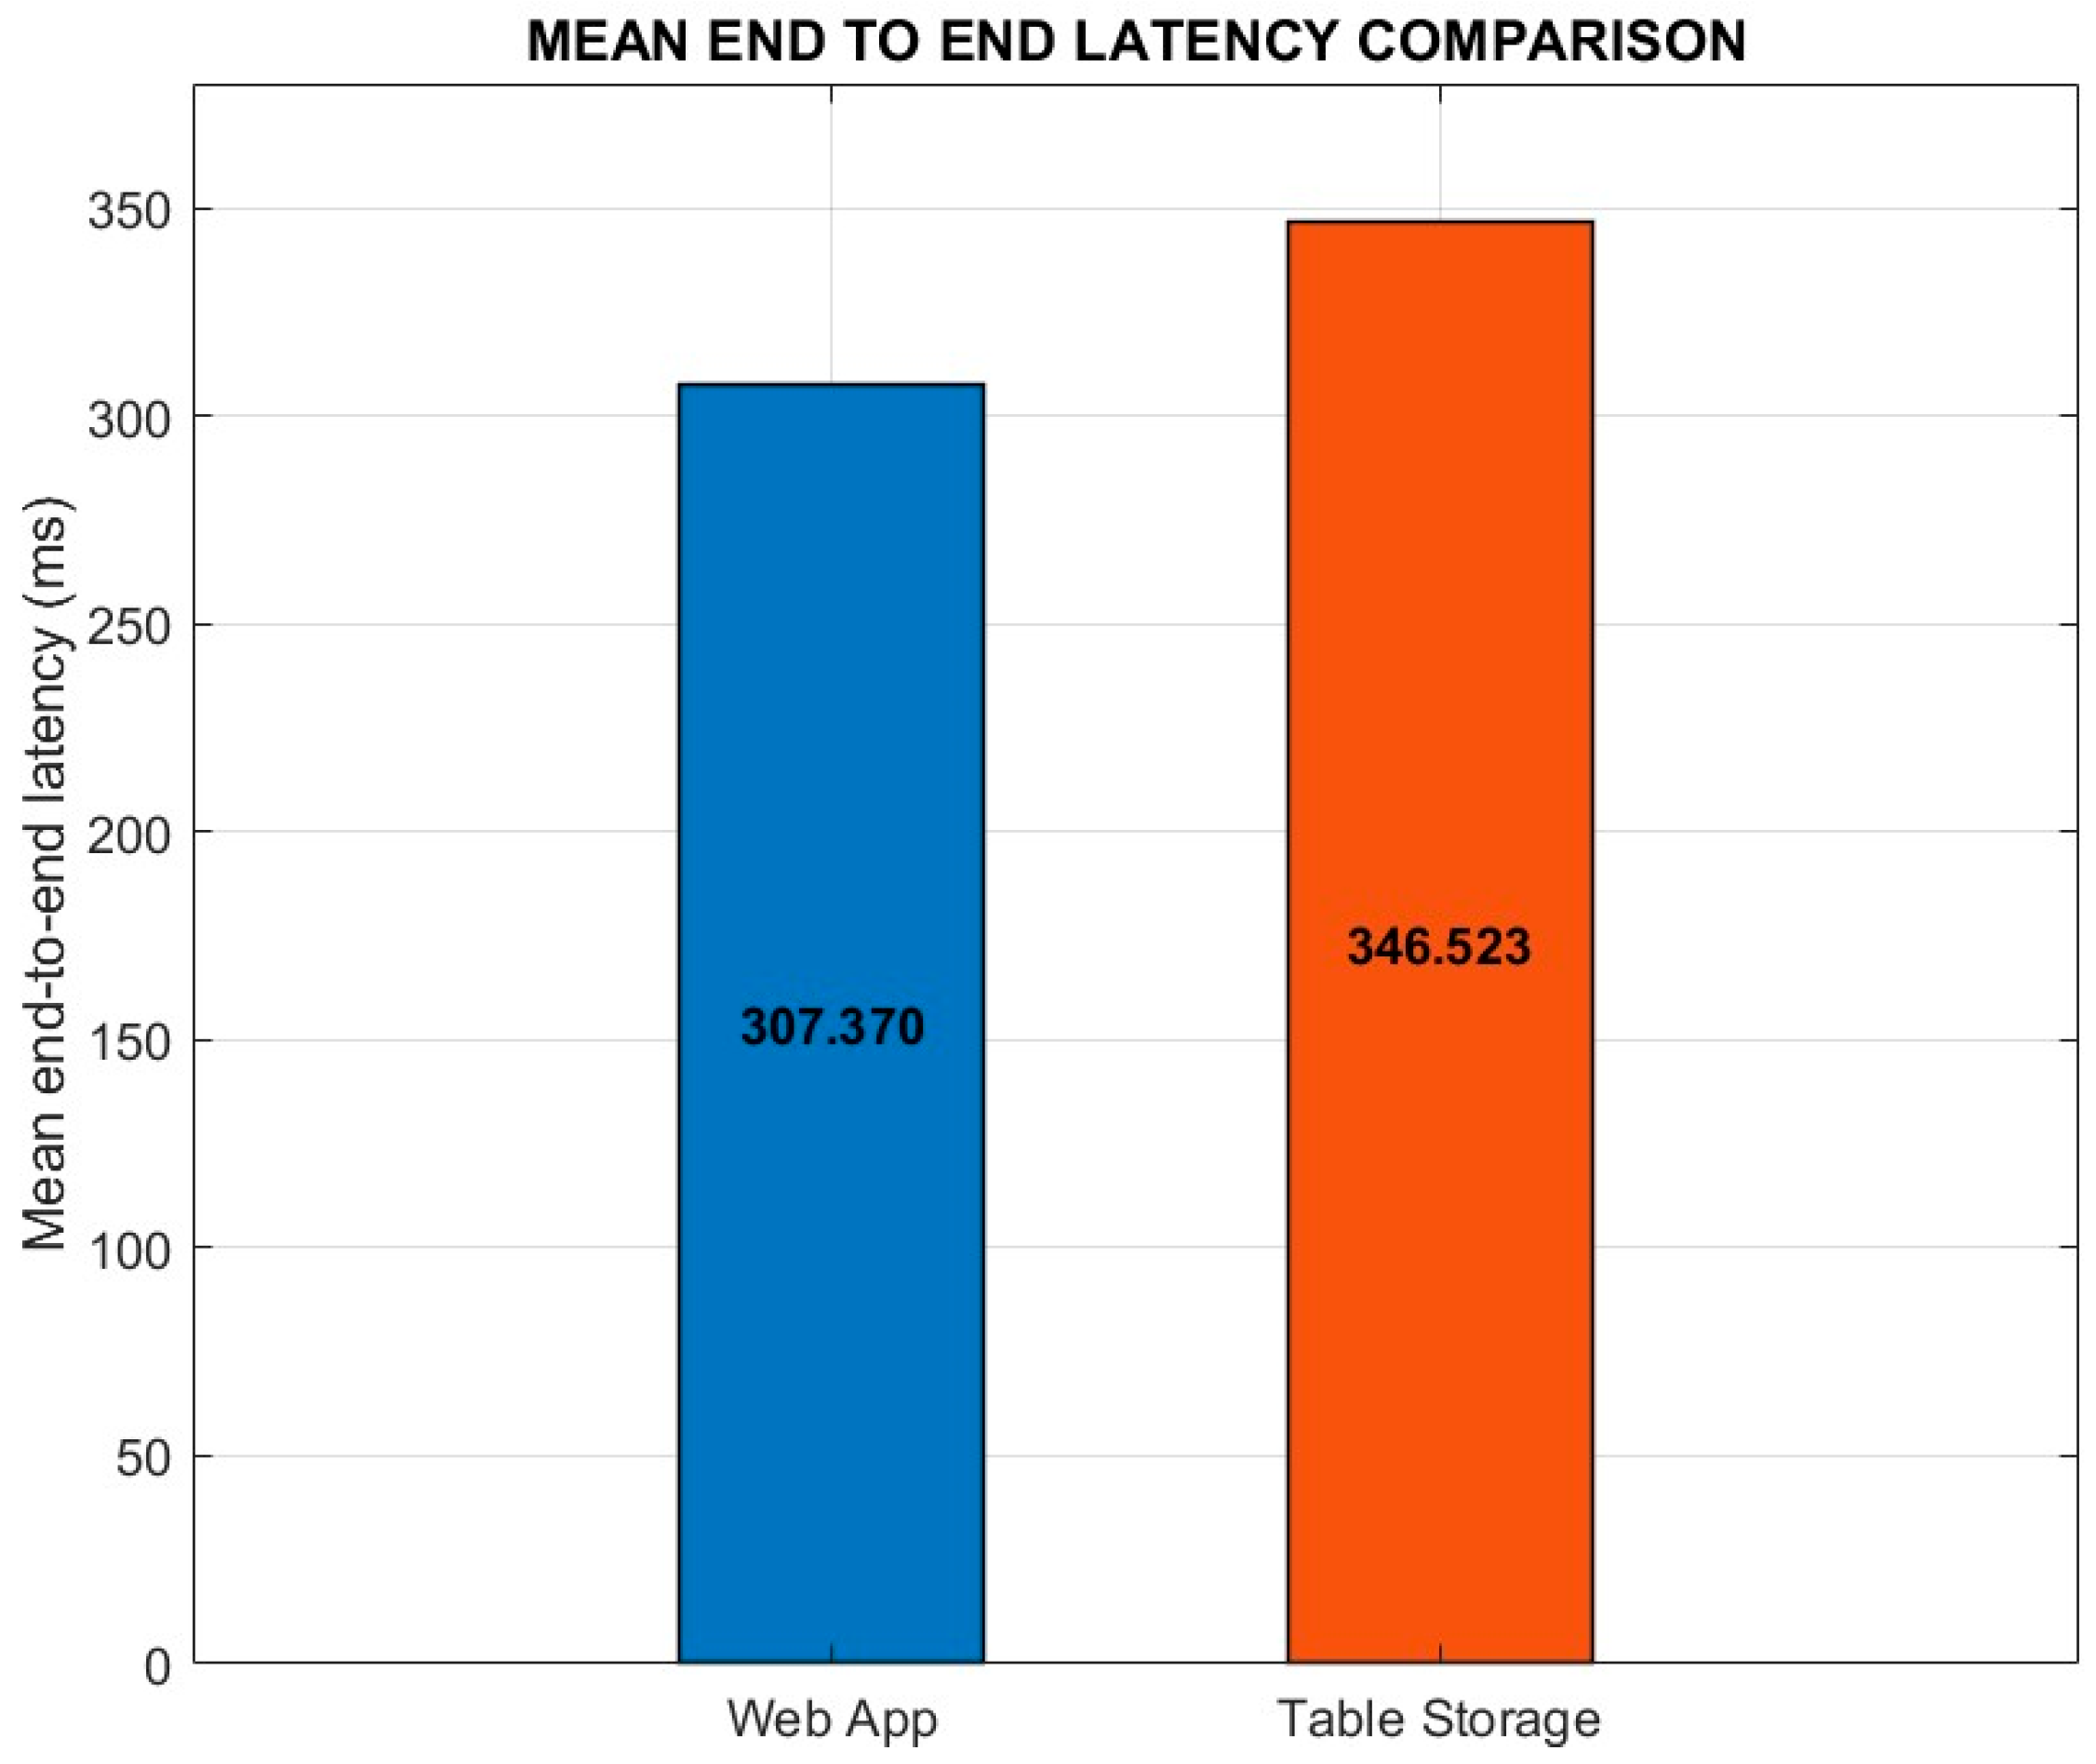
In total, 1564 valid observations were processed for each route. The path to the Web App showed a mean total latency of 307.37 ms, a median of 307.022 ms, a standard deviation of 36.81 ms, and a 95th percentile of 362.027 ms. The path to Table Storage recorded a mean total latency of 346.523 ms, a median of 345.009 ms, a standard deviation of 42.147 ms, and a 95th percentile of 407.038 ms. Generally speaking, these results show that the path associated with structured historical data storage imposes a greater delay and wider dispersion than real-time visualization.
The comparison between the two paths is shown in Figure 9, where it can be seen that telemetry destined for the Web App exhibits a lower delay than the telemetry sent to Table Storage. The difference between the means was 39.135 ms, suggesting additional overhead to the cloud data logging process.
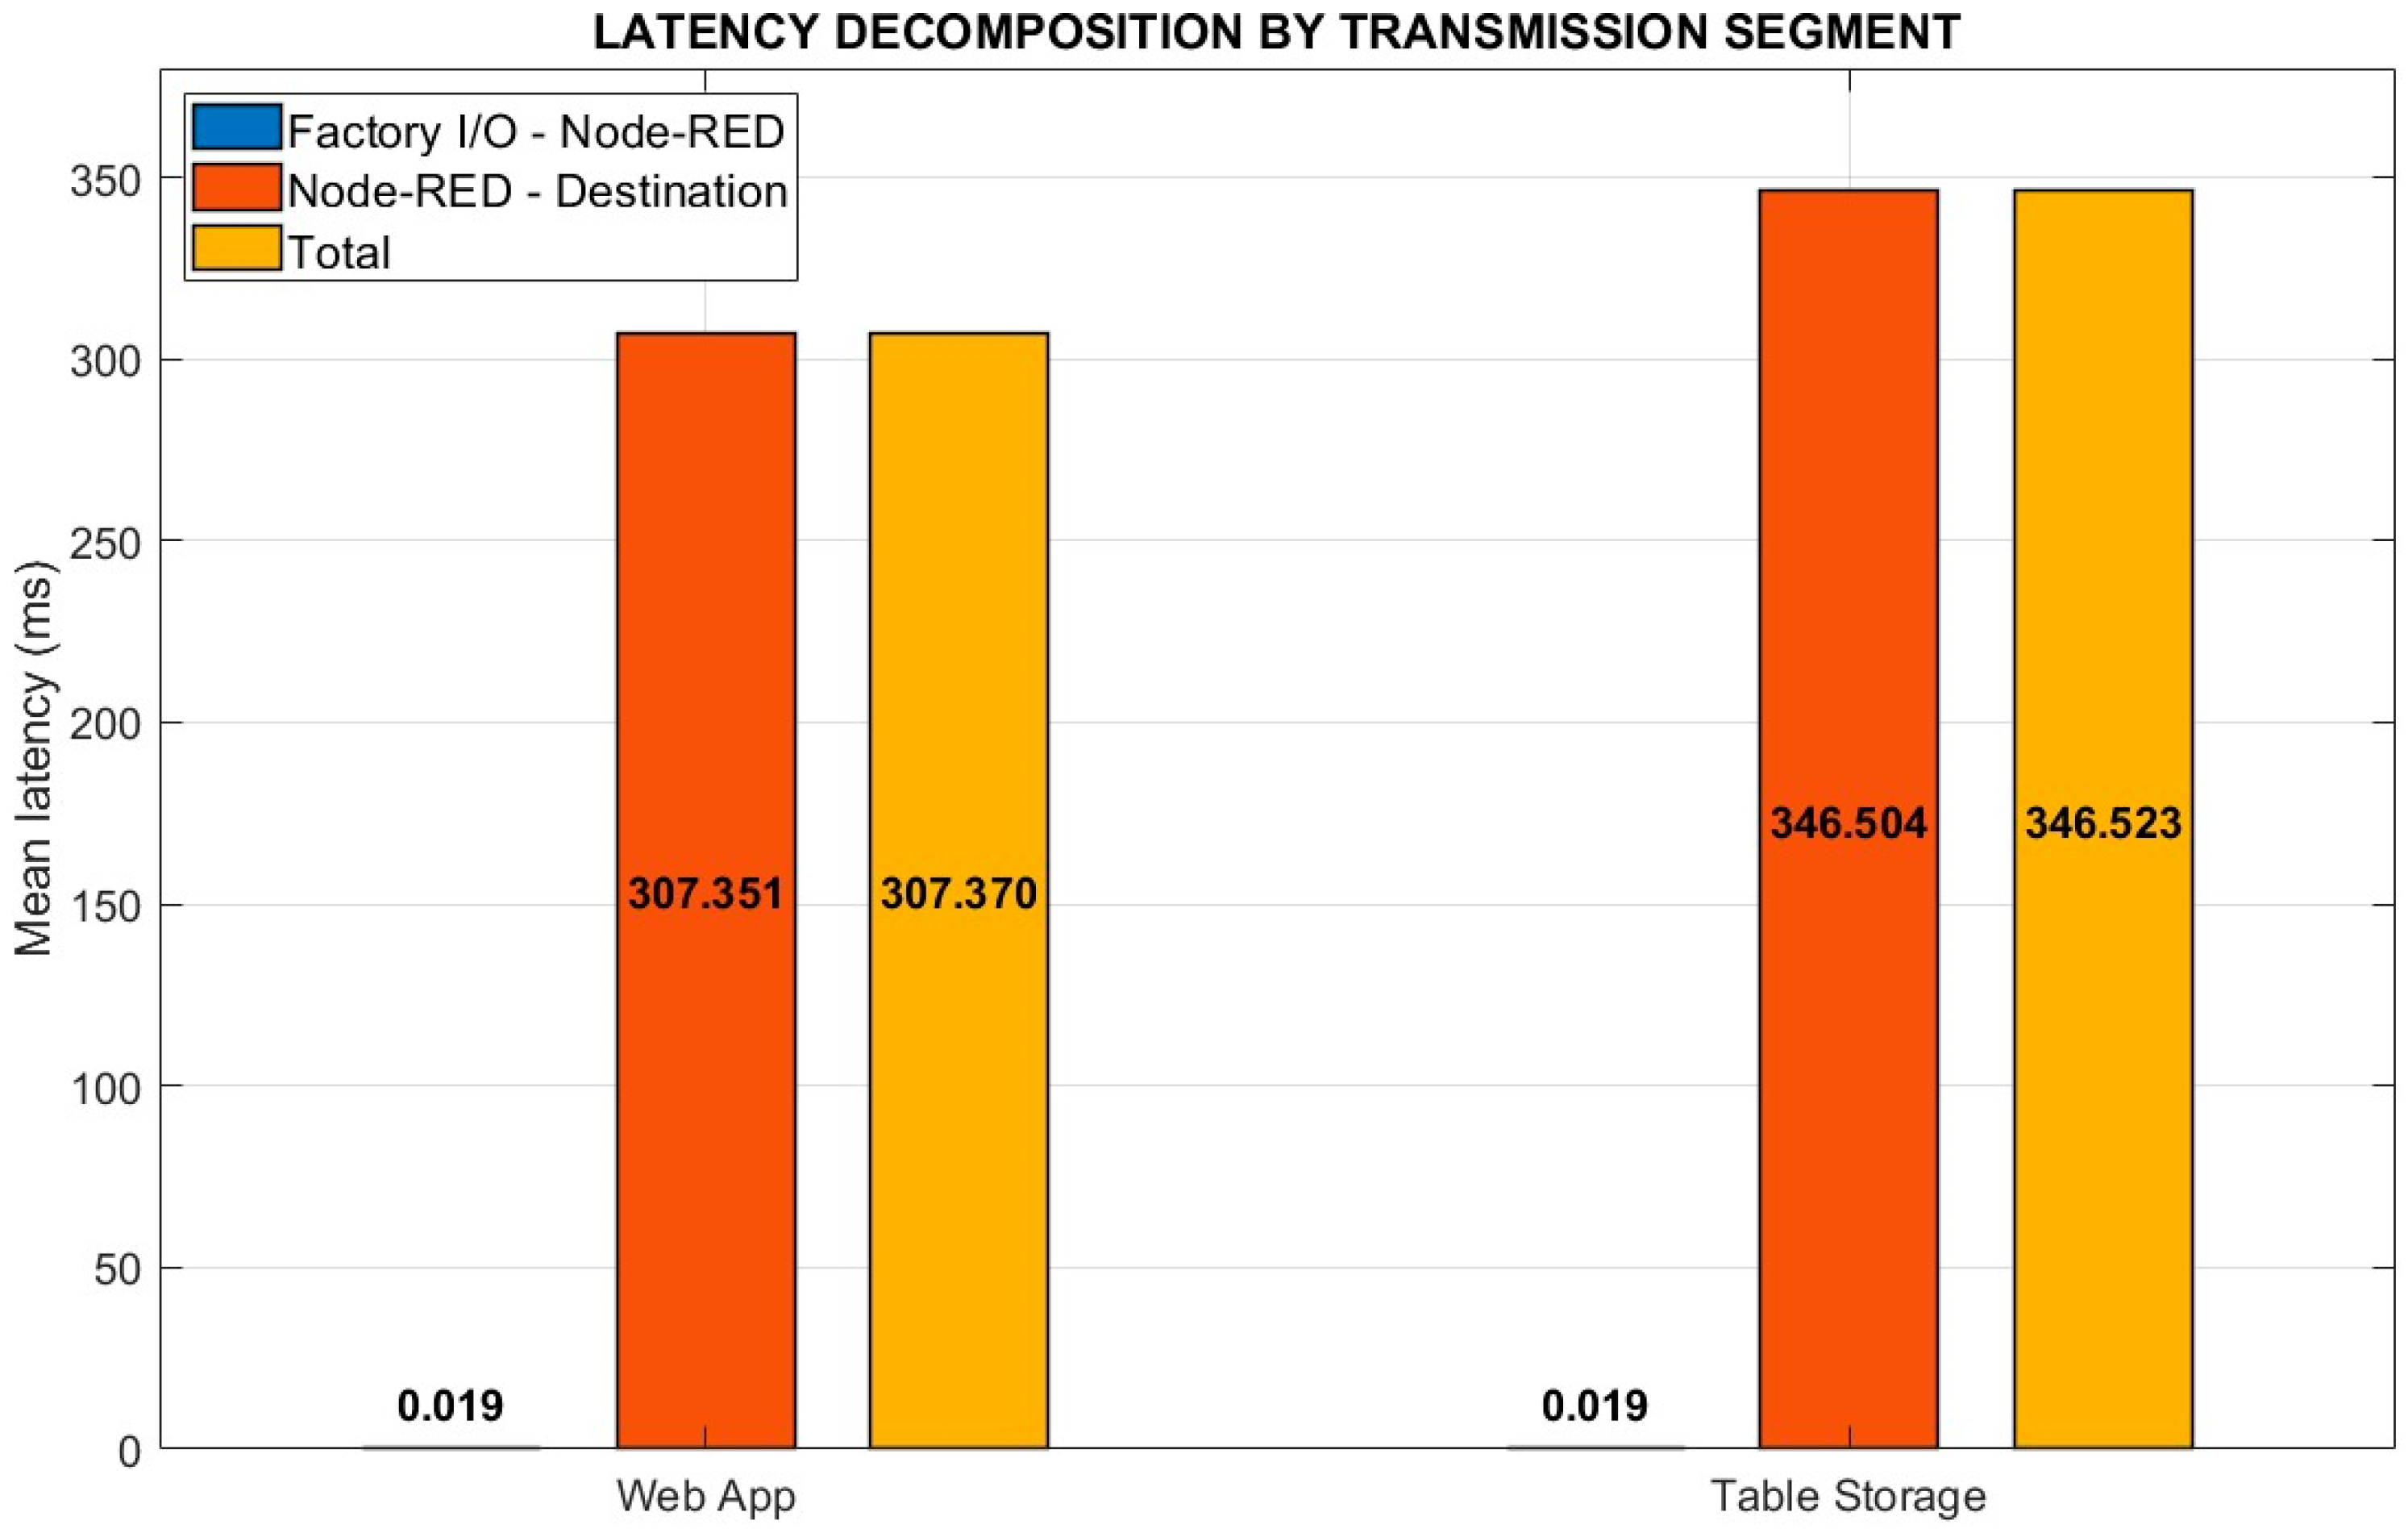
The overall comparison shown in Figure 9 is completed by the dispersion measures reported in Table 5 and by the subsequent decomposition of latency contributions across transmission segments shown in Figure 10.
The decomposition by sections shows that the Factory I/O → Node-RED segment provided a practically negligible latency in both paths, with a mean of 0.019 ms and a median of 0.017 ms. As a result, the largest contribution of the total delay was concentrated in the second transmission leg: Node-RED → Web in the display path and Node-RED → Table Storage in the storage path. This decomposition is presented in Figure 10, where it is evident that the temporal behavior of the system is dominated by the communication layer and cloud services, and not by local acquisition.
Table 5 summarizes the descriptive statistics of end-to-end latency and its transmission rates. Overall, the results show that the architecture maintains times compatible with near-real-time remote monitoring, although structured historical data storage introduces an additional time cost compared to remote viewing [9].

3.2. Remote Command Latency

Remote command latency was evaluated based on the time elapsed between the issuance of an instruction in the Web App and its reception in the LOGO! 8.4 PLC, decomposing the process into two sections: Web App → Node-RED and Node-RED → PLC LOGO!. A total of 112 valid observations were analyzed.
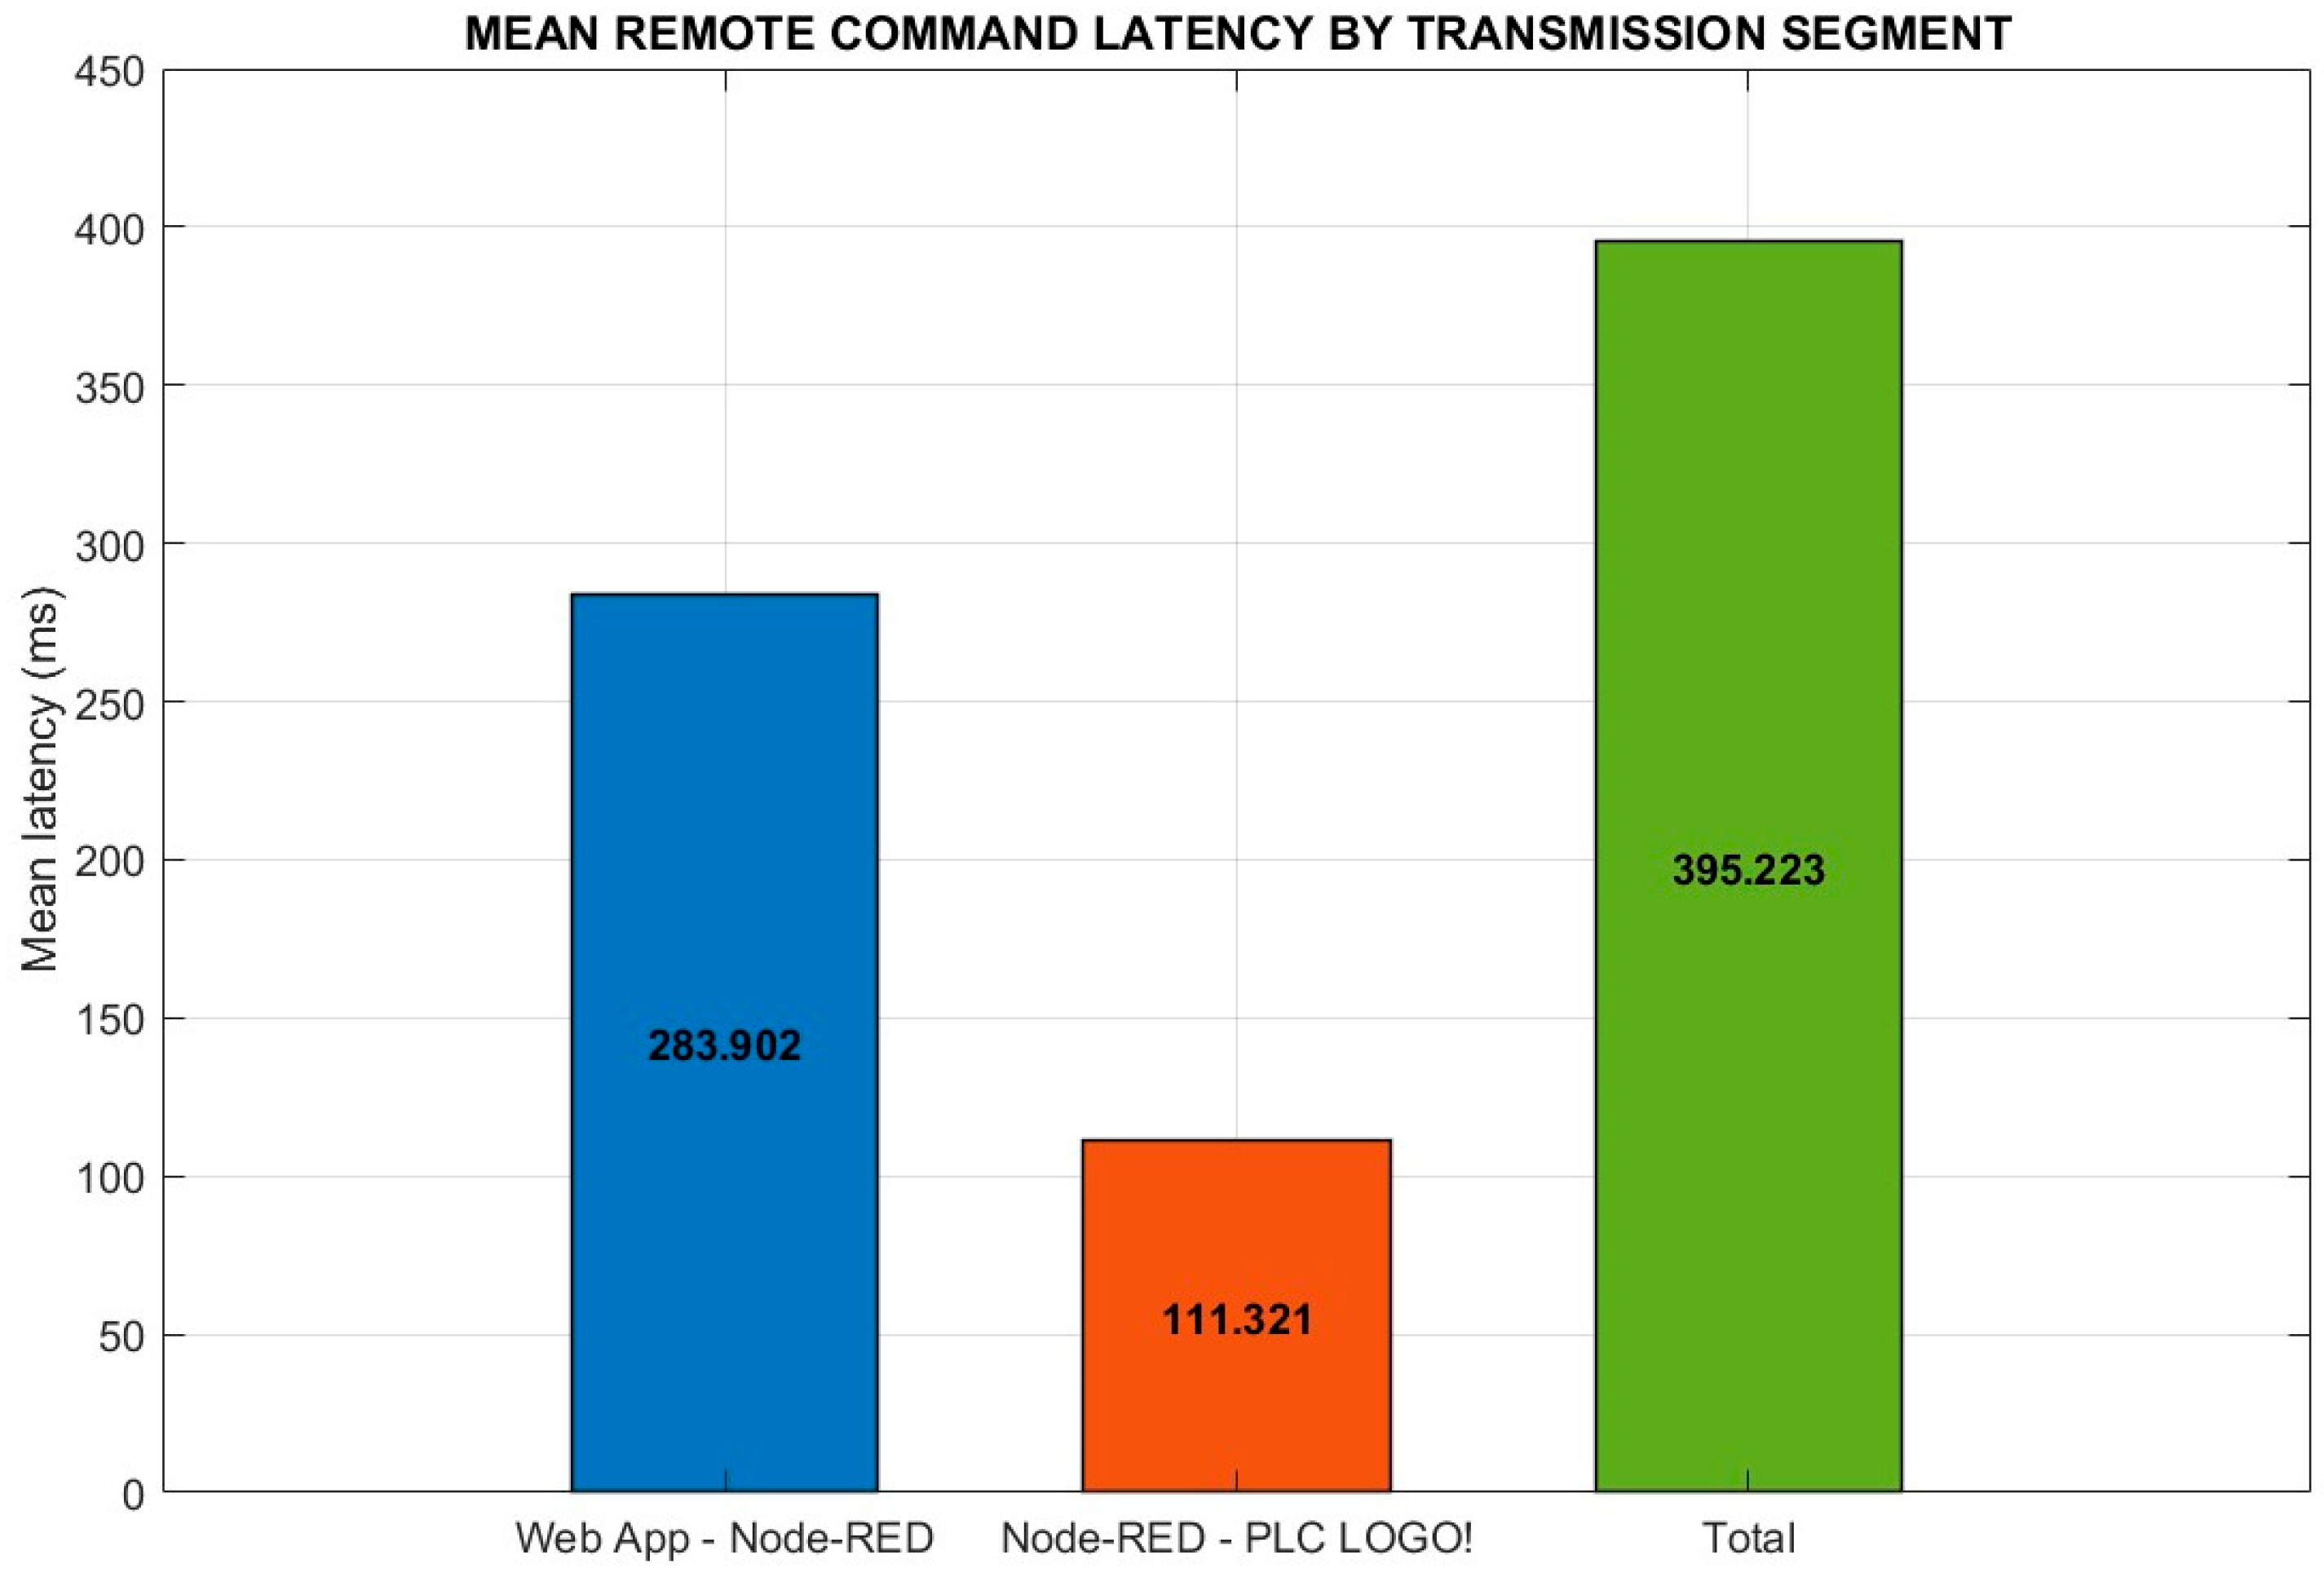
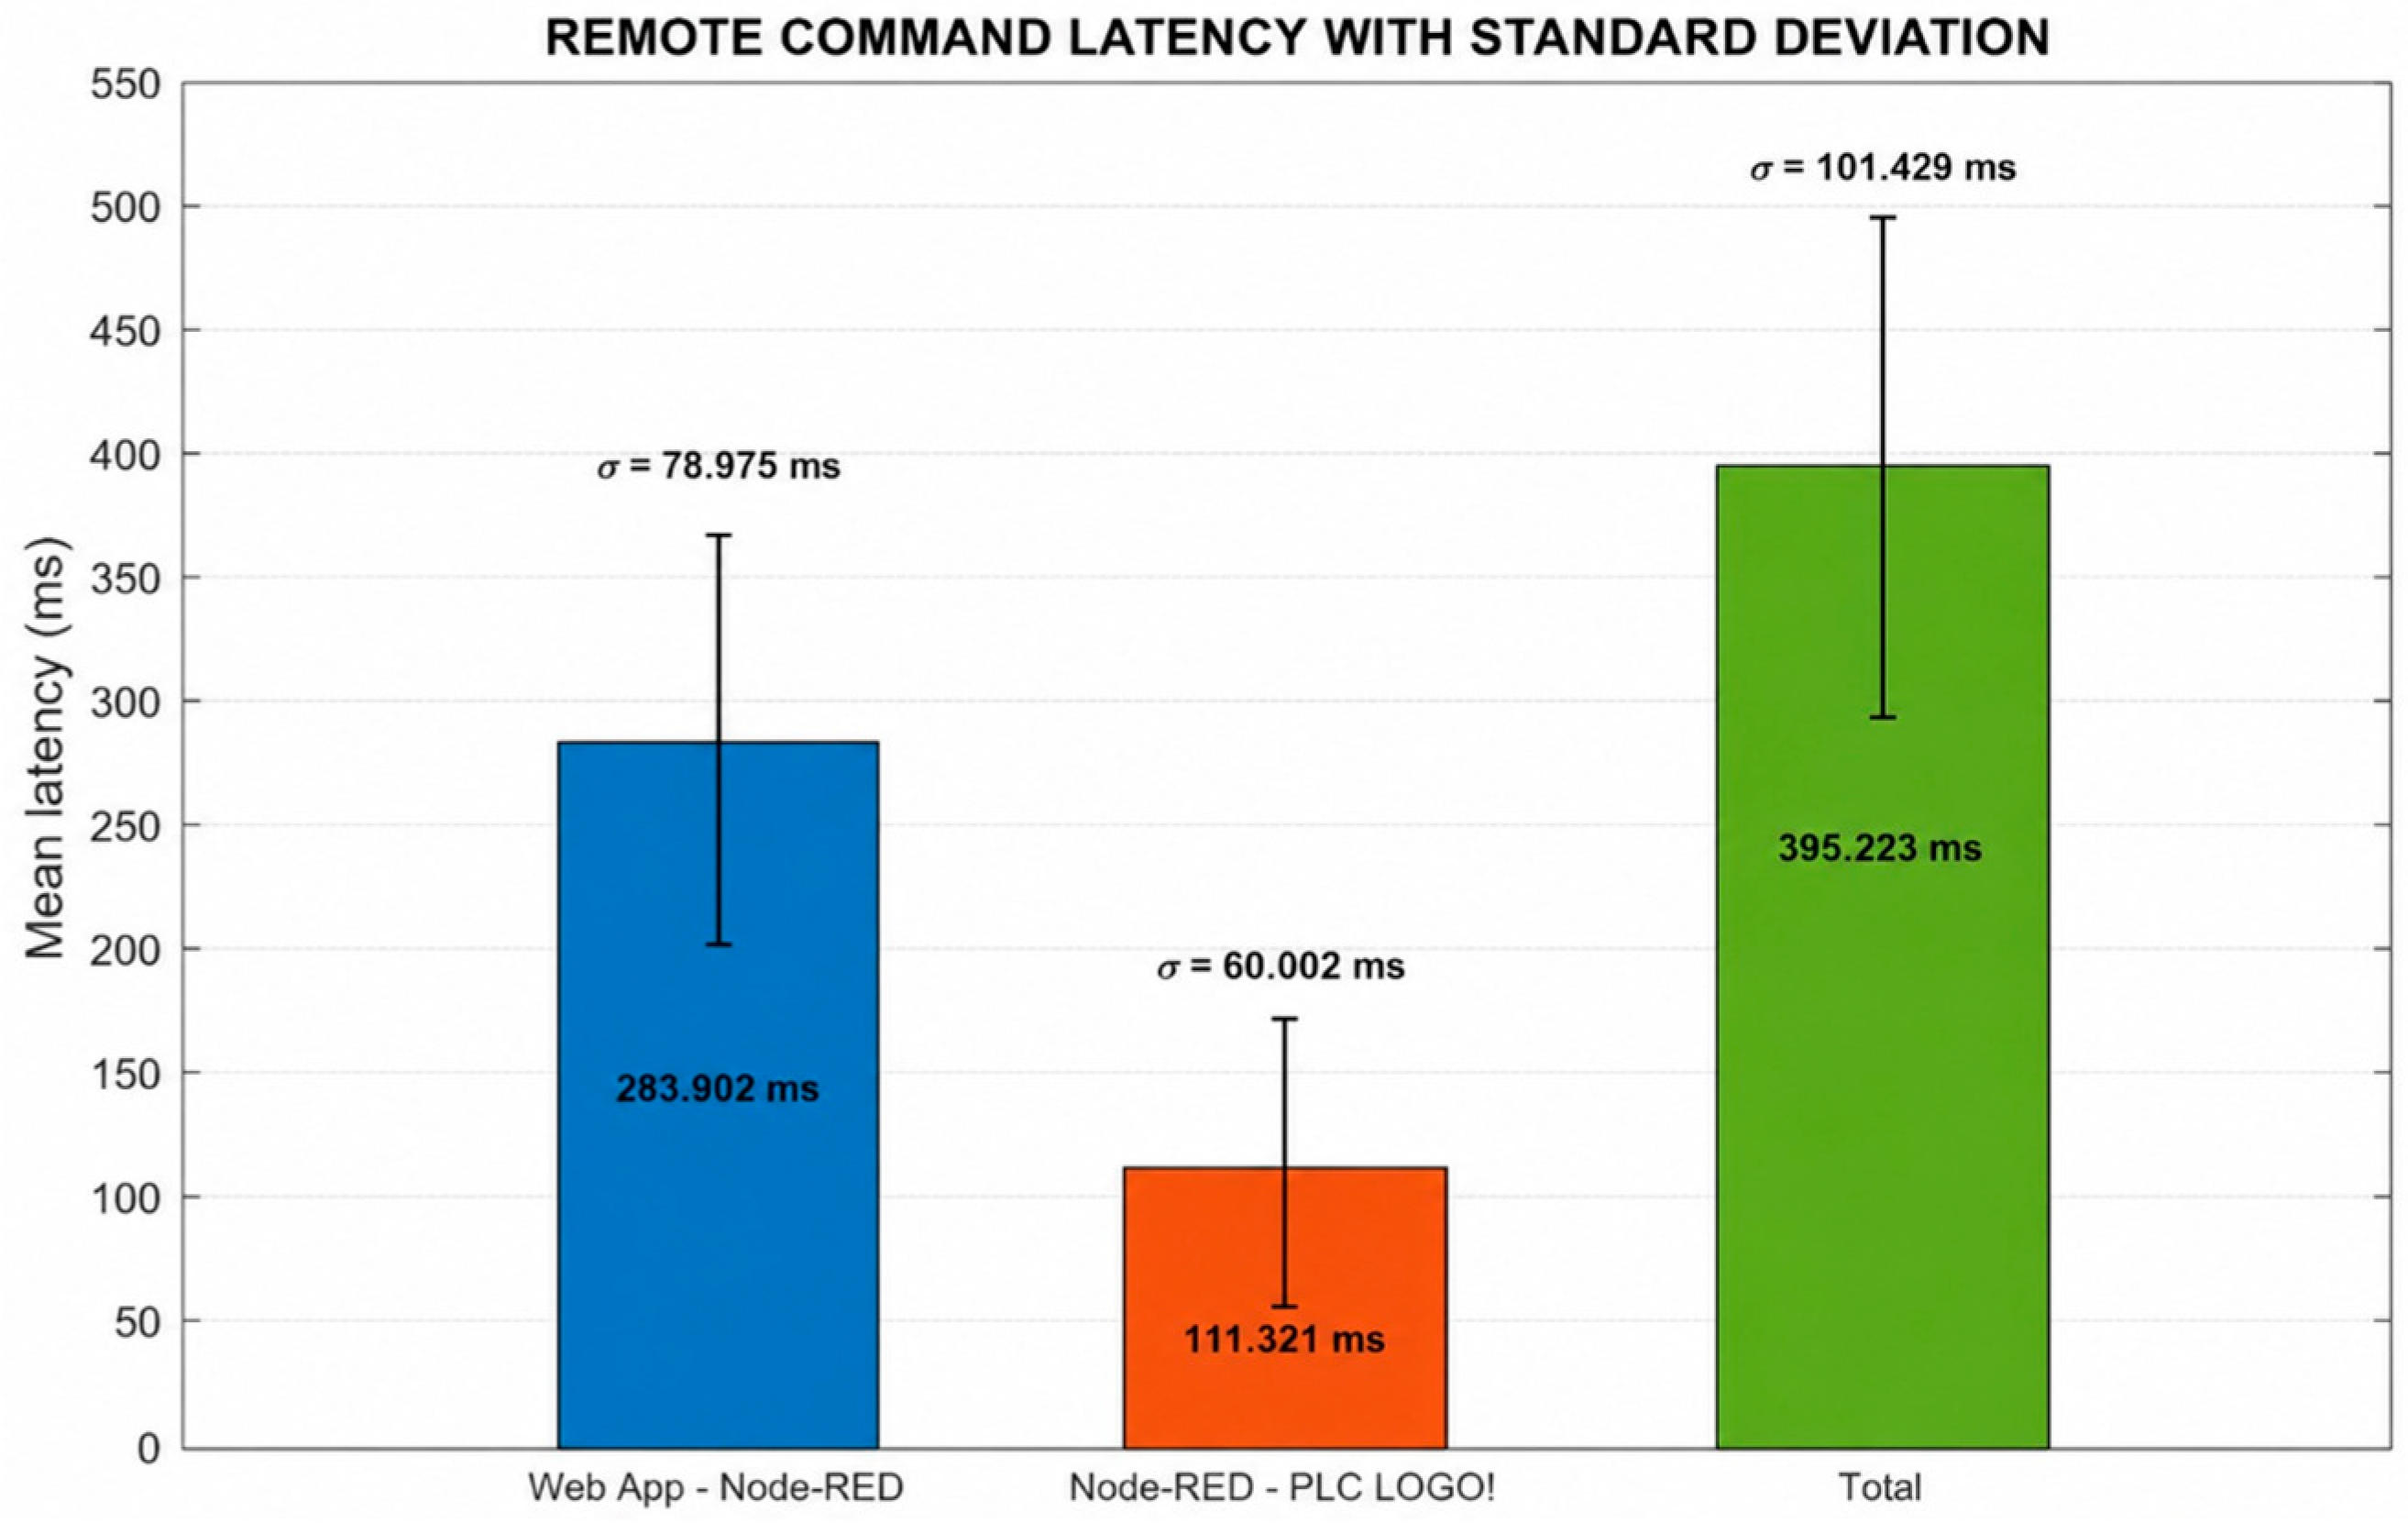
The results show that the Web App → Node-RED section presented a mean latency of 283.902 ms, a median of 255 ms, a standard deviation of 78.975 ms and a 95th percentile of 459.15 ms. On the other hand, the Node-RED → PLC LOGO! section recorded a mean latency of 111.321 ms, a median of 110.455 ms, a standard deviation of 60.002 ms and a 95th percentile of 203.273 ms. The total latency of the remote command reached a mean of 395.223 ms, a median of 385.105 ms, a standard deviation of 101.429 ms, and a 95th percentile of 605.047 ms.
Figure 11 compares the average latencies per leg and clearly shows that the largest contribution to the total response time is concentrated between the remote interface and Node-RED.
The mean comparison presented in Figure 11 is further complemented by the variability analysis shown in Figure 12 and by the descriptive statistics summarized in Table 6.
Figure 12, which incorporates the standard deviation, also confirms that the greatest dispersion of the metric is also located in this first segment. This indicates that the main temporal load of the remote control is not in the local writing of the command on the controller, but in the communication between the application layer and the integration gateway.
Table 6 summarizes the descriptive statistics corresponding to this metric. In functional terms, the architecture maintains adequate response times for remote control, although with a higher variability than that observed in upstream telemetry.

3.3. Successful Telemetry Delivery Rate

The successful delivery rate was evaluated in two sections of the architecture: Factory I/O → Node-RED and Node-RED → Web App. Two polling interval configurations were tested in Node-RED (500 ms and 200 ms), and the metric was defined as the percentage of events received with respect to the events sent in each transmission leg.
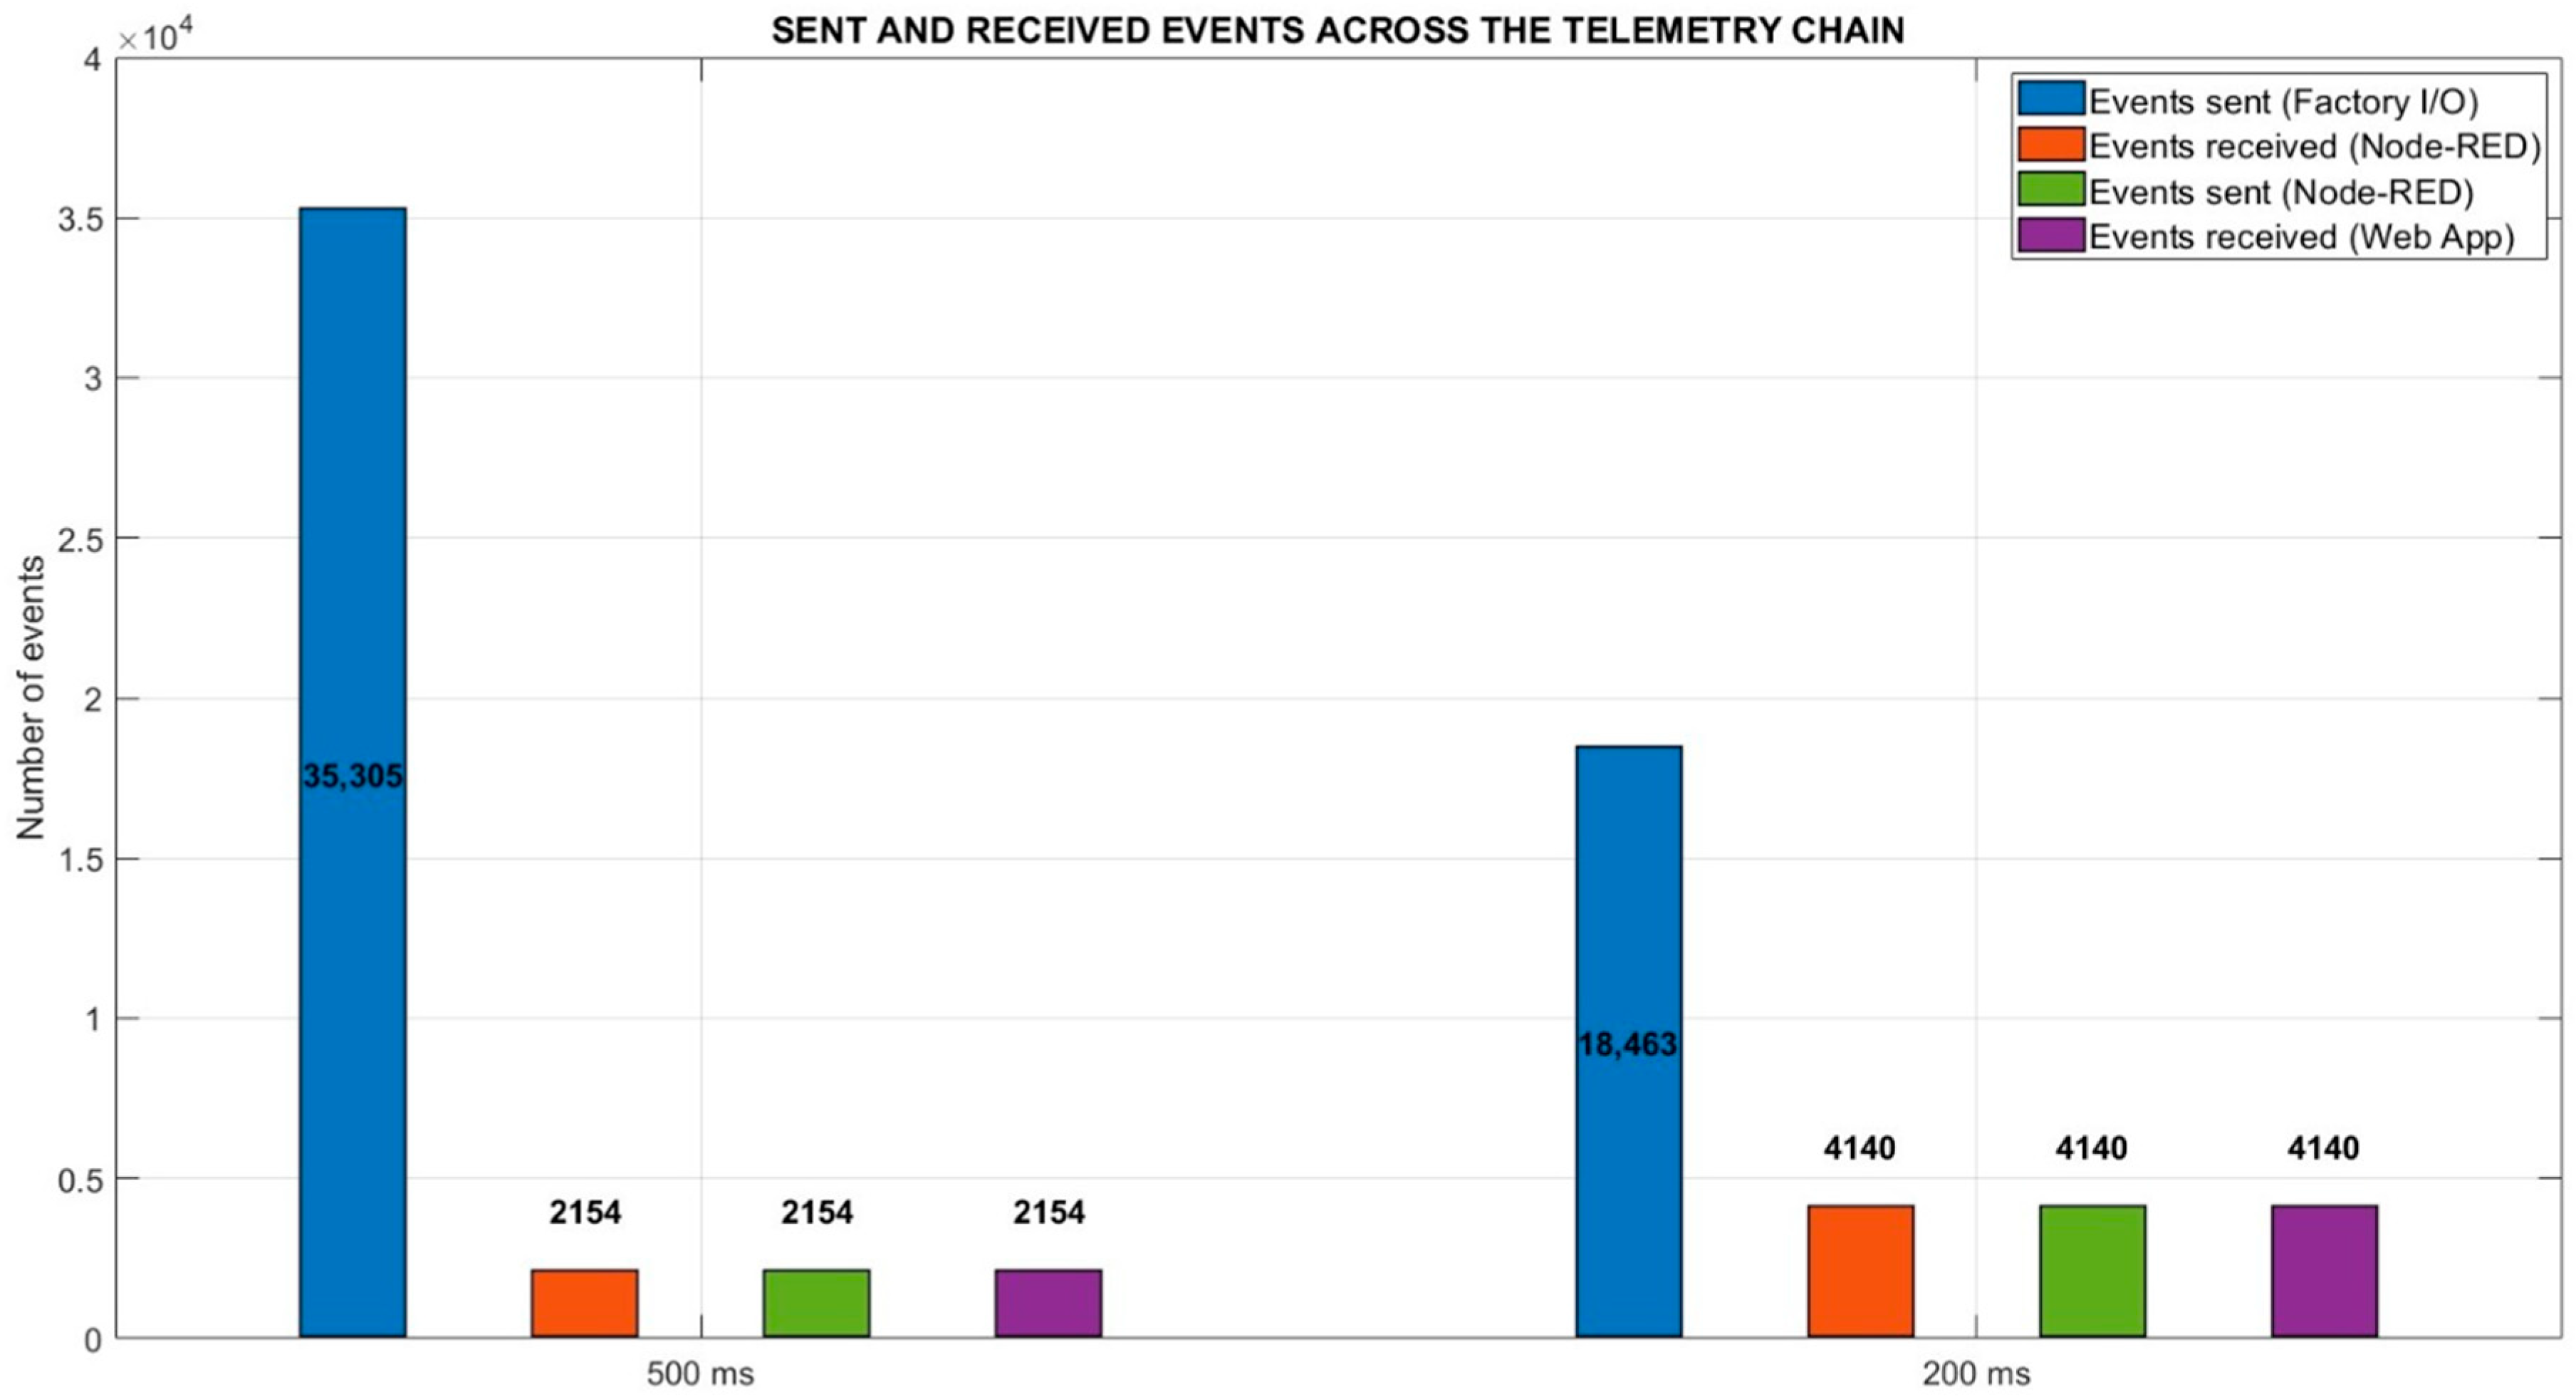
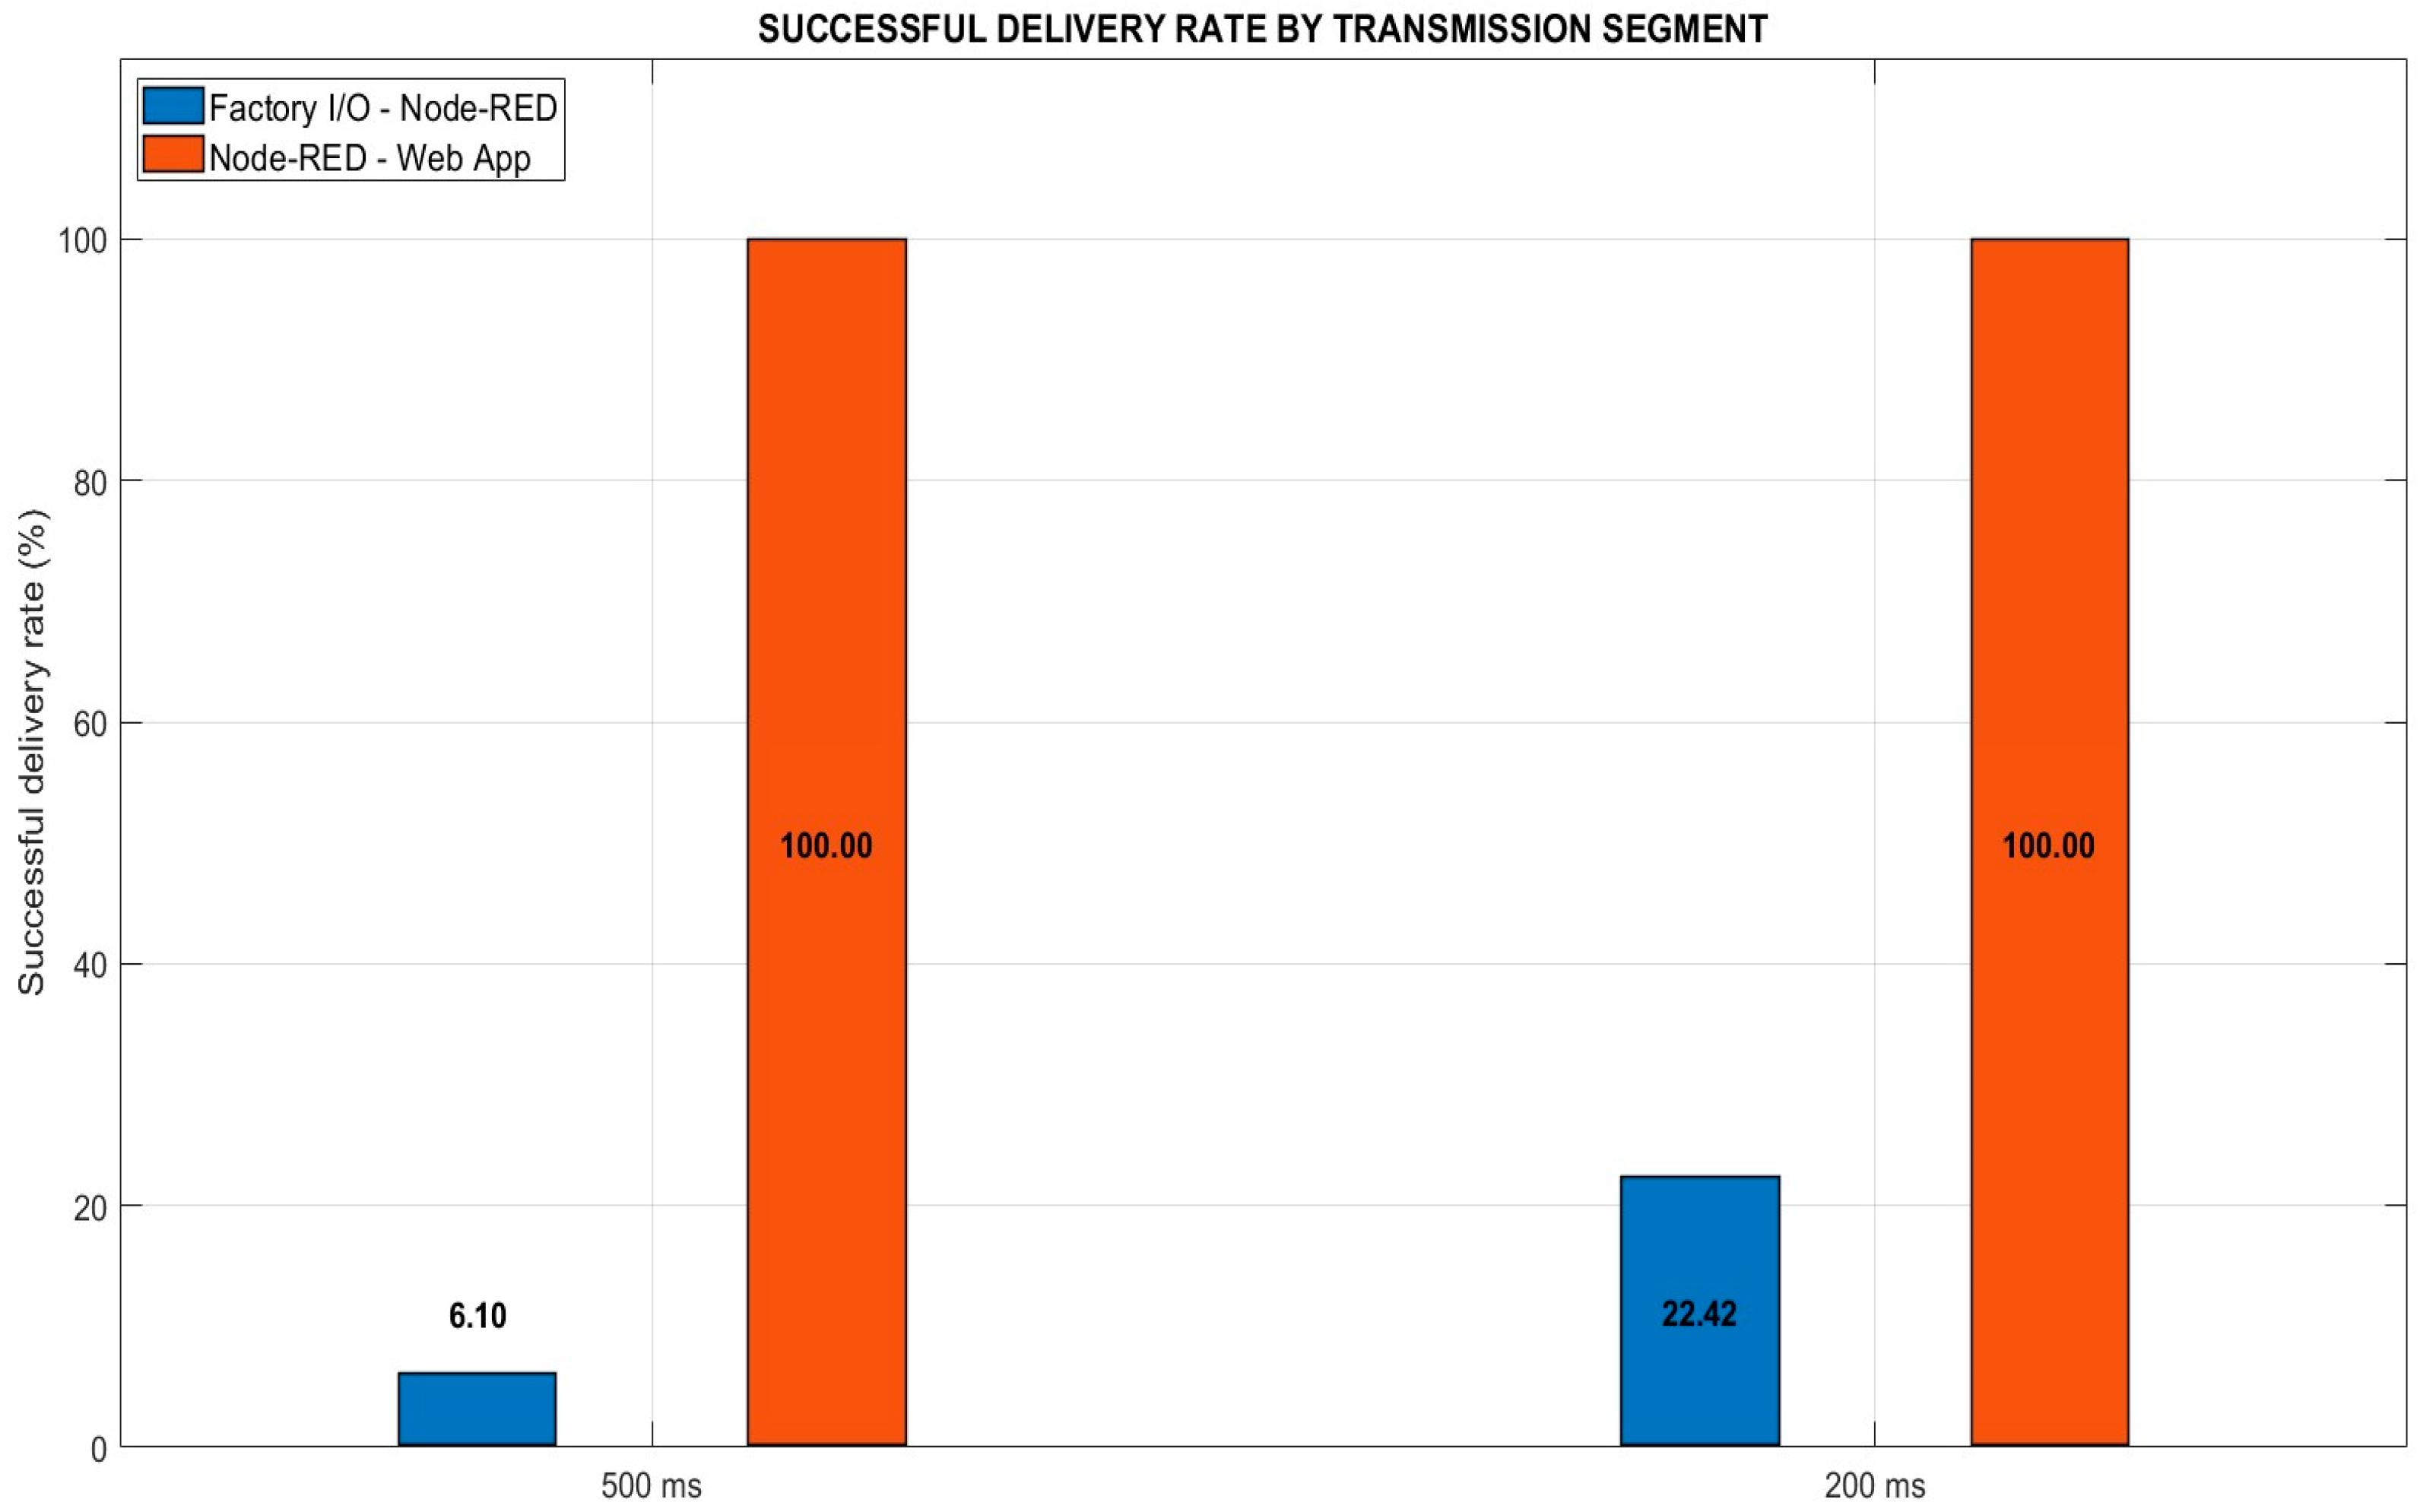
The results show that the main loss of events is concentrated in the first leg of the telemetry chain. With a timing of 500 ms, 35,305 events were sent from Factory I/O and only 2154 were received in Node-RED, which corresponds to a delivery rate of 6.10% and a loss of 93.90%. When Node-RED time was reduced to 200 ms, 18,463 events were sent and 4140 were received, reaching a delivery rate of 22.42% and a loss of 77.58%.
A root-cause analysis indicates that this loss pattern is primarily associated with the acquisition mechanism implemented in the first segment of the architecture. Communication between Factory I/O and Node-RED was established through the S7 protocol over ISO-on-TCP, where Node-RED operated as a cyclic polling client, reading the analog register NAI1 from the PLC at fixed intervals. Under this scheme, a fundamental frequency asymmetry emerged: Factory I/O updated the PLC variable at a considerably higher rate than the polling cycle configured in Node-RED. Because the S7 register retains only the most recent value and does not provide internal buffering or event history, multiple intermediate updates may be overwritten before acquisition. This explains why reducing the polling interval from 500 ms to 200 ms improved the delivery rate without eliminating the loss. An additional contributing factor is the use of the “emit only when value changes” filter in the S7 node, which suppresses consecutive repeated readings and may further reduce the number of emitted samples under quasi-stationary conditions. Therefore, the observed losses should not be interpreted as network transmission faults, but as an inherent limitation of cyclic register polling under strong mismatch between data generation and acquisition rates. In real industrial deployments, this effect is usually mitigated through PLC-side buffering, event-triggered acquisition or publish–subscribe communication strategies such as MQTT or OPC UA. Moreover, the update rate of Factory I/O may exceed that of many physical sensors, which likely amplifies the apparent loss rate in the experimental environment.
In contrast, the second section of the architecture maintained a completely stable behavior under both conditions. For both 500 ms and 200 ms, the number of events sent from Node-RED matched the number of events received in the Web App, producing a 100% delivery rate and a 0% loss. This indicates that the data, once successfully acquired by Node-RED, is delivered in its entirety to the remote interface.
The percentage comparison of these rates is shown in Figure 13, where it is clearly identified that the main constraint of the system is not in the cloud broadcast, but in the initial capture of events.
Figure 14 complements this result by using the absolute counts of events sent and received, which allows the magnitude of the loss in the first leg to be visualized more clearly.
Table 7 summarizes the delivery and loss values for both experimental conditions. Taken together, these results show that the overall reliability of telemetry is mainly conditioned by the synchronization between the event generation environment and the acquisition mechanism implemented in Node-RED [28].

3.4. Telemetry Update Rate

The update rate was evaluated from the time between successive updates observed in the remote visualization layer. Because a small number of extreme values was associated with atypical connectivity episodes, a filtering criterion was applied excluding observations greater than 2000 ms; under this criterion, 1662 valid observations were analyzed.
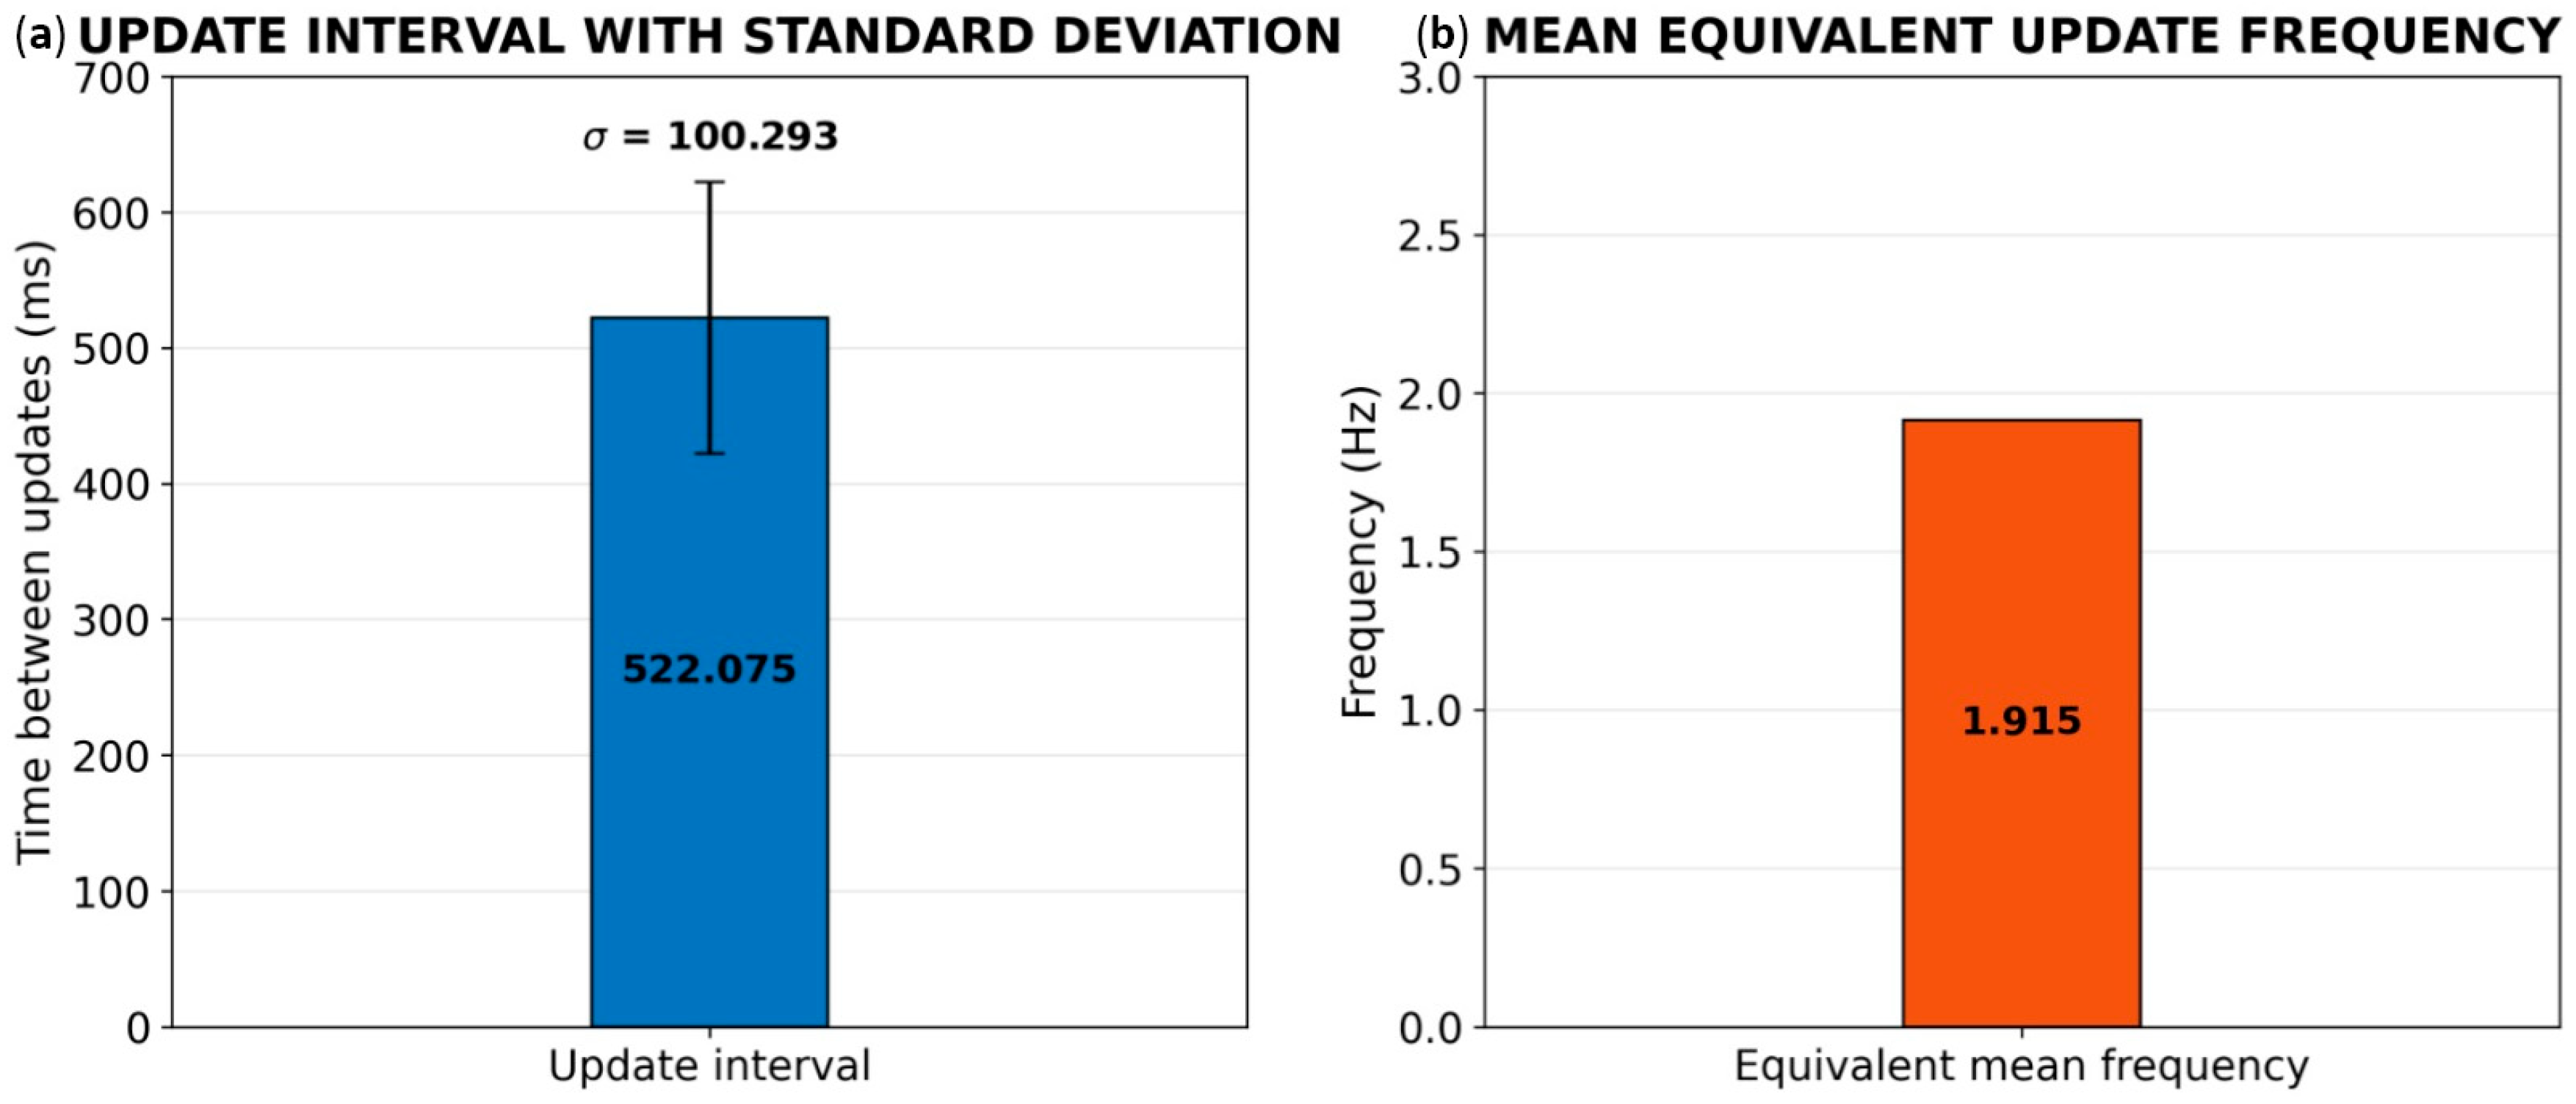
The mean time between updates was 522.075 ms, with a median of 544 ms, standard deviation of 100.293 ms, minimum of 287 ms, maximum of 1534 ms, and 95th percentile of 578 ms. The equivalent mean frequency was 1.915 Hz, while the coefficient of variation reached 19.21%. The proximity between the mean, the median and the 95th percentile indicates a stable and representative behavior of the normal operating regime. These data can be seen reflected in Table 8.
The variability and operational stability of the update process are illustrated in Figure 15, where Figure 15a shows the mean update interval together with its standard deviation and Figure 15b presents the equivalent mean refresh frequency in Hz. These visual results complement the descriptive statistics reported in Table 8 and confirm that the architecture maintains a sufficiently agile and stable update behavior for near-real-time remote monitoring under normal operating conditions [35].

3.5. Service Recovery Time

Recovery time was assessed from the interval between communication loss and functional restoration of telemetry at the remote viewing layer. In total, 23 valid events were analyzed, measured in seconds.
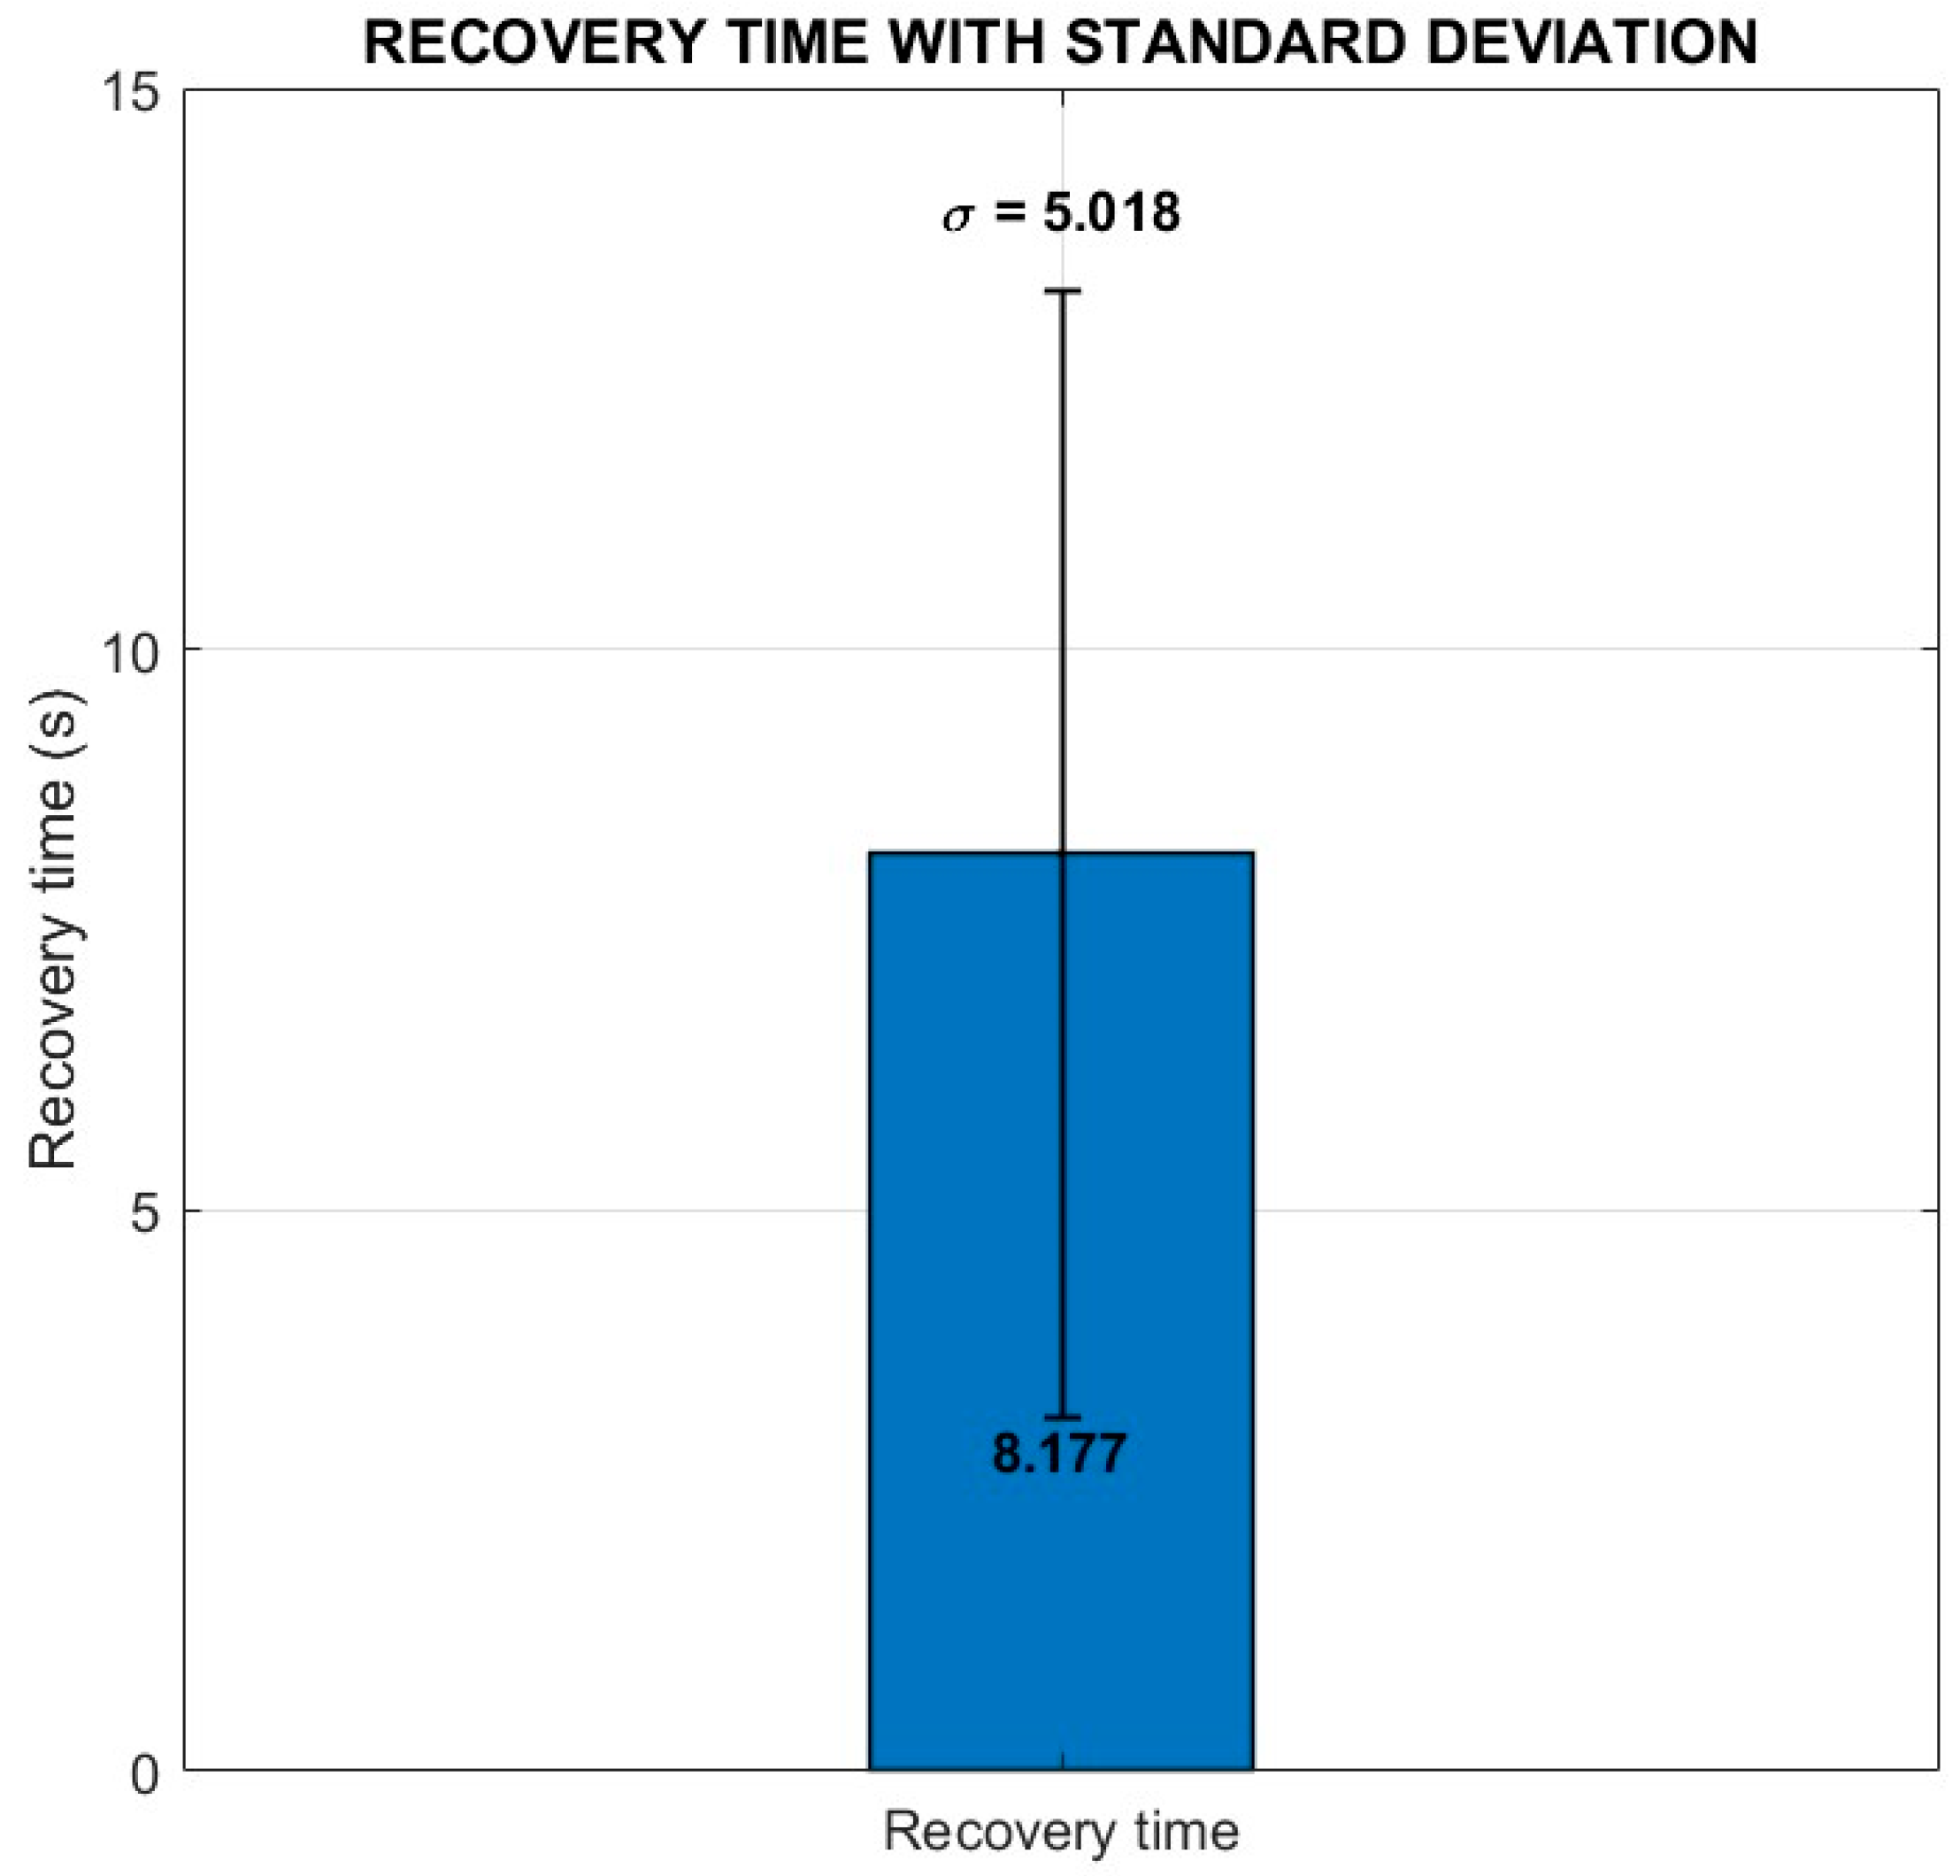
The results summarized in Table 9 indicate a mean recovery time of 8.177 s, a median of 12.826 s, a standard deviation of 5.018 s, a minimum value of 2.817 s, a maximum value of 12.895 s, and a 95th percentile of 12.877 s. These values indicate that, although some recovery events occurred in relatively short times, a significant proportion of the reconnections were concentrated around 12.8 s.
It is important to note that this metric does not represent the exact internal reconnection time of the SignalR mechanism, since the process depends on the automatic retry logic implemented by the client library. For this reason, the reported value should be interpreted as the functional recovery time of the service rather than as the exact internal protocol recovery time. The variability of the recovery process is summarized in Figure 16, which shows the mean recovery time together with its standard deviation. When interpreted jointly with Table 9, these results indicate that the architecture has an effective capacity to recover from connectivity interruptions, allowing remote monitoring of the process to be restored without direct manual intervention, although with perceptible restoration times for the end user.

4. Discussion

The results obtained allow us to interpret the proposed architecture from four complementary dimensions: temporal performance of telemetry, remote control response, reliability of the transmission chain and operational robustness of the remote service. The findings show that the architecture is not only functional, but can also be assessable from a performance perspective, which brings it closer to more demanding experimental validation studies in the field of applied IIoT [7,23,30,36]. In this sense, the main contribution of the work lies not only in having connected a compact PLC with middleware and cloud services, but also in having shown with concrete metrics where the main time costs and functional constraints of the system are located [7,37].
First, the end-to-end telemetry latency evidenced a behavior consistent with hybrid IIoT architectures, in which the main temporal burden tends to shift towards the communication and cloud service layers. As shown in Table 5 and Figure 9, the Factory I/O–Node-RED section was practically negligible compared with to the total delay, while the greatest contribution was concentrated between Node-RED and cloud services. This finding is consistent with edge–cloud architectures in which global latency does not depend exclusively on the controller or plant environment, but also on the articulation between middleware, messaging, distributed services, and the application layer [7,11,29,38,39]. In addition, the observed difference between the path to the Web App and the path to Table Storage suggests that historical persistence introduces a reasonable additional overhead, which is also expected in systems where real-time visualization and storage fulfill different functions within the architecture [6,23].
Second, remote command latency showed a different dynamic from upstream telemetry. As shown in Table 6 and in Figure 11 and Figure 12, the main delay was no longer located in data dissemination, but in the Web App–Node-RED path, whereas local writing on the PLC maintained shorter and relatively more stable times. This result is particularly important because it indicates that the architecture preserves an efficient local control layer, while the remote control experience depends more strongly on the interaction between the web application, cloud services and the integration gateway. In other words, the main limitation does not appear to lie in the PLC as the control core, but in the distributed layer that mediates between user action and local execution, which reinforces the continued validity of the PLC as a robust element in control systems [13,39,40,41]. At the same time, this observation is consistent with studies showing that the PLC–middleware–cloud chains should be analyzed not only in functional terms, but also in temporal terms, since delay variations may emerge precisely in the coupling segments between heterogeneous layers [7,30].
As summarized in Table 10, the quantitative comparison with representative implemented IIoT studies suggests that the proposed architecture operates within a competitive supervisory time range, although the available benchmarks are only partially commensurable. Ref. [30] provides the closest timing-related precedent for the PLC–Node-RED acquisition stage, showing that even millisecond-level mismatch may accumulate and generate missing values. By contrast, the system reported by [31,32] operates at supervisory refresh scales of seconds to minutes, whereas the present architecture maintains a mean telemetry update interval of 522.075 ms and an equivalent average update frequency of 1.915 Hz. In addition, the latency envelope discussed by [38] indicates that sub-500 ms behavior is a reasonable target for responsive edge–cloud IIoT communication. Under that criterion, the mean telemetry latencies observed in the present study—307.37 ms toward the Web App and 346.523 ms toward Table Storage–can be considered quantitatively consistent with current low-latency, non-deterministic IIoT practice. Therefore, while the reference studies do not provide a fully homogeneous benchmark set, they do support the interpretation that the proposed architecture achieves competitive supervisory responsiveness while preserving a broader and more explicitly quantified validation framework.
Third, the successful delivery rate clearly revealed one of the architecture’s most sensitive points. As summarized in Table 7 and visualized in Figure 13 and Figure 14, the loss of events was almost entirely concentrated in the Factory I/O–Node-RED leg, while the Node-RED–Web App transmission maintained full delivery once the telemetry had been captured by the middleware. This finding has an important methodological and technical implication, since the system does not primarily fail in cloud-side dissemination, but in the initial acquisition of events. In other words, the architecture is robust for transporting and exposing information that has already been incorporated into the integration layer, but still critically depends on the synchronization between the generating environment and the read mechanism in Node-RED. This is consistent with recent studies reporting that degradation in IIoT architectures can result from temporal misalignments, incompatible sampling rates, or log loss during the transition between industrial layer and middleware, even when the superior infrastructure behaves correctly [23,28,30]. The improvement observed by reducing the Node-RED time from 500 ms to 200 ms further confirms that the problem is not structurally static, but sensitive to configuration parameters, which opens a clear line of future optimization [35,42,43].
Fourth, telemetry update rate and service recovery time provide additional insight into the operational robustness of the system from a perspective closer to actual use. On the one hand, Table 8 and Figure 15 show that telemetry refresh stabilizes around half a second, with an equivalent average frequency of 1.9 Hz. This suggests that the architecture maintains sufficiently agile behavior for near-real-time remote monitoring without requiring a highly complex infrastructure. On the other hand, Table 9 and Figure 16 indicate that the system can functionally restore monitoring after connectivity loss, although not instantaneously. The concentration of several events around 12.8 s suggests that recovery is strongly influenced by client-side reconnection behavior and not exclusively by transport infrastructure. Consequently, the metric should be interpreted as the functional recovery time of the service rather than as exact internal protocol recovery time [44,45]. In operational terms, this distinction is reasonable, since in remote monitoring scenarios the decisive factor is not always the internal recovery time of the protocol, but the time required for the operator to retrieve useful information through the interface [23,31,32].
These results reinforce the contribution of the work within an accessible Industry 4.0 vision [18,20]. The architecture demonstrates that it is possible to articulate a compact PLC platform, low-technical threshold middleware such as Node-RED, and widely available cloud services to build a reproducible IIoT solution with real monitoring, data logging, and remote control capabilities. This aspect is particularly relevant when projected towards scenarios of progressive digitalization, where it is not always feasible to adopt extensive or highly specialized infrastructures. In this sense, the study is aligned with works that propose gradual trajectories of digital transformation in SMEs and that underline the importance of modular, technically understandable and relatively transferable solutions [6,20,21,22,24]. However, the main limitations of the present study must also be acknowledged. The validation was conducted in an experimental environment, long-term temporal stability could not be fully assessed and no techno-economic evaluation was performed. These limitations define clear directions for future work, including longer operating windows, replication in real physical systems, deeper analysis of the Factory I/O–Node-RED acquisition stage, and evaluation of remote control performance under real industrial conditions. For this reason, the value of the present work lies not in presenting a definitive solution, but in providing a well-defined experimental foundation on which future studies on the progressive adoption of IIoT in smaller-scale production contexts can be built.

5. Conclusions

This work presented the design and experimental validation of a reproducible and modular hybrid IIoT architecture based on a compact PLC platform, Node-RED, Microsoft Azure and Factory I/O, aimed at integrating local control, remote monitoring, historical data storage and bidirectional control over an automated tank level process. Unlike predominantly conceptual approaches, the proposal was grounded in a functional implementation and evaluated through technical performance metrics, which made it possible to assess its behavior from an operational perspective.
The results confirmed the technical feasibility of the architecture. Telemetry exhibited behavior compatible with near-real-time remote monitoring, although the temporal burden was mainly associated with the cloud layer. Remote control proved functional, but with higher delay between the web application and the middleware than in the local writing stage on the PLC. Likewise, the delivery rate showed that the main restriction of the system lies in the initial acquisition of events, whereas transmission toward the remote interface remained intact once that stage was completed. Update rate and recovery time also showed stable behavior under normal operating conditions and an effective capacity for service restoration after connectivity interruptions.
Beyond its functional validation, the main contribution of the study lies in the precise identification of the critical performance stages of a compact and reproducible IIoT architecture. In this sense, the work provides a useful experimental basis for future studies on PLC–middleware–cloud integration, event acquisition optimization and evaluation of IIoT solutions with a lower technical barrier. Future work should extend the validation to longer operating windows, replicate the architecture in real physical systems and further analyze the Factory I/O–Node-RED acquisition stage, as well as remote control response, under real industrial conditions. These efforts would provide a stronger basis for the progressive adoption of IIoT in SMEs.

Author Contributions

Conceptualization, F.C.-J.; methodology, J.G.-M.; validation, J.D.l.T.-G.; formal analysis, E.S.-J.; investigation, J.G.-M. and F.C.-J.; resources, J.D.l.T.-G.; data curation, J.G.-M.; writing—original draft preparation, F.C.-J.; writing—review and editing, F.C.-J. and E.S.-J. All authors have read and agreed to the published version of the manuscript.

Funding

This research was funded by Universidad Tecnológica Israel (UISRAEL), Research Project No. UISRAEL-2025-PRY-0016.

Data Availability Statement

The datasets generated and/or analyzed during the current study are not publicly available due to technical and project-related limitations. Requests for access to the datasets should be directed to the corresponding author.

Acknowledgments

During the preparation of this study, the authors used ChatGpt 5.6 for the purpose of improving the writing of the abstract and reviewing the structure of the document. The authors have reviewed and edited the result and assume full responsibility for the content of this publication.

Conflicts of Interest

The authors declare no conflicts of interest.

Abbreviations

The following abbreviations are used in this manuscript:
IIoTIndustrial Internet of Things
PLCProgrammable Logic Controller
C2DCloud-to-Device
SMEsSmall- and Medium-Sized Enterprises

References

  1. Haricha, K.; Khiat, A.; Issaoui, Y.; Bahnasse, A.; Ouajji, H. Recent Technological Progress to Empower Smart Manufacturing: Review and Potential Guidelines. IEEE Access 2023, 11, 77929–77951. [Google Scholar] [CrossRef] [Scilit]
  2. Hu, Y.; Jia, Q.; Yao, Y.; Lee, Y.; Lee, M.; Wang, C.; Zhou, X.; Xie, R.; Yu, F.R. Industrial Internet of Things Intelligence Empowering Smart Manufacturing: A Literature Review. IEEE Internet Things J. 2024, 11, 19143–19167. [Google Scholar] [CrossRef] [Scilit]
  3. Yaqub, M.Z.; Alsabban, A. Industry-4.0-Enabled Digital Transformation: Prospects, Instruments, Challenges, and Implications for Business Strategies. Sustainability 2023, 15, 8553. [Google Scholar] [CrossRef] [Scilit]
  4. Wójcicki, K.; Biegańska, M.; Paliwoda, B.; Górna, J. Internet of Things in Industry: Research Profiling, Application, Challenges and Opportunities—A Review. Energies 2022, 15, 1806. [Google Scholar] [CrossRef] [Scilit]
  5. Ferencz, K.; Domokos, J.; Kovács, L. Cloud Integration of Industrial IoT Systems. Architecture, Security Aspects and Sample Implementations. Acta Polytech. Hung. 2024, 21, 7–28. [Google Scholar] [CrossRef] [Scilit]
  6. Liu, Y.; Ni, Z.; Karlsson, M.; Gong, S. Methodology for Digital Transformation with Internet of Things and Cloud Computing: A Practical Guideline for Innovation in Small- and Medium-Sized Enterprises. Sensors 2021, 21, 5355. [Google Scholar] [CrossRef] [Scilit] [PubMed]
  7. Mirani, A.A.; Velasco-Hernandez, G.; Awasthi, A.; Walsh, J. Key Challenges and Emerging Technologies in Industrial IoT Architectures: A Review. Sensors 2022, 22, 5836. [Google Scholar] [CrossRef] [Scilit] [PubMed]
  8. Andriulo, F.C.; Fiore, M.; Mongiello, M.; Traversa, E.; Zizzo, V. Edge Computing and Cloud Computing for Internet of Things: A Review. Informatics 2024, 11, 71. [Google Scholar] [CrossRef] [Scilit]
  9. Behnke, I.; Austad, H. Real-Time Performance of Industrial IoT Communication Technologies: A Review. IEEE Internet Things J. 2024, 11, 7399–7410. [Google Scholar] [CrossRef] [Scilit]
  10. Alabadi, M.; Habbal, A.; Wei, X. Industrial Internet of Things: Requirements, Architecture, Challenges, and Future Research Directions. IEEE Access 2022, 10, 66374–66400. [Google Scholar] [CrossRef] [Scilit]
  11. Hästbacka, D.; Halme, J.; Barna, L.; Hoikka, H.; Pettinen, H.; Larrañaga, M.; Björkbom, M.; Mesiä, H.; Jaatinen, A.; Elo, M. Dynamic Edge and Cloud Service Integration for Industrial IoT and Production Monitoring Applications of Industrial Cyber-Physical Systems. IEEE Trans. Ind. Inform. 2022, 18, 498–508. [Google Scholar] [CrossRef] [Scilit]
  12. Jamil, M.N.; Schelén, O.; Afif Monrat, A.; Andersson, K. Enabling Industrial Internet of Things by Leveraging Distributed Edge-to-Cloud Computing: Challenges and Opportunities. IEEE Access 2024, 12, 127294–127308. [Google Scholar] [CrossRef] [Scilit]
  13. Sehr, M.A.; Lohstroh, M.; Weber, M.; Ugalde, I.; Witte, M.; Neidig, J.; Hoeme, S.; Niknami, M.; Lee, E.A. Programmable Logic Controllers in the Context of Industry 4.0. IEEE Trans. Ind. Inform. 2021, 17, 3523–3533. [Google Scholar] [CrossRef] [Scilit]
  14. Nițulescu, I.-V.; Korodi, A. Supervisory Control and Data Acquisition Approach in Node-RED: Application and Discussions. IoT 2020, 1, 76–91. [Google Scholar] [CrossRef] [Scilit]
  15. Folgado, F.J.; Calderón, D.; González, I.; Calderón, A.J. Review of Industry 4.0 from the Perspective of Automation and Supervision Systems: Definitions, Architectures and Recent Trends. Electronics 2024, 13, 782. [Google Scholar] [CrossRef] [Scilit]
  16. Yao, K.C.; Lin, C.L.; Pan, C.H. Industrial Sustainable Development: The Development Trend of Programmable Logic Controller Technology. Sustainability 2024, 16, 6230. [Google Scholar] [CrossRef] [Scilit]
  17. Cheng, G.; Wan, Z.; Ding, W.; Sun, R. Memory Allocation Strategy in Edge Programmable Logic Controllers Based on Dynamic Programming and Fixed-Size Allocation. Appl. Sci. 2023, 13, 10297. [Google Scholar] [CrossRef] [Scilit]
  18. Estensoro, M.; Larrea, M.; Müller, J.M.; Sisti, E. A Resource-Based View on SMEs Regarding the Transition to More Sophisticated Stages of Industry 4.0. Eur. Manag. J. 2022, 40, 778–792. [Google Scholar] [CrossRef] [Scilit]
  19. Alqoud, A.; Schaefer, D.; Milisavljevic-Syed, J. Industry 4.0: A Systematic Review of Legacy Manufacturing System Digital Retrofitting. Manuf. Rev. 2022, 9, 32. [Google Scholar] [CrossRef] [Scilit] [PubMed]
  20. Mittal, S.; Khan, M.A.; Romero, D.; Wuest, T. A Critical Review of Smart Manufacturing & Industry 4.0 Maturity Models: Implications for Small and Medium-Sized Enterprises (SMEs). J. Manuf. Syst. 2018, 49, 194–214. [Google Scholar] [CrossRef] [Scilit]
  21. Cotrino, A.; Sebastián, M.A.; González-Gaya, C. Industry 4.0 Roadmap: Implementation for Small and Medium-Sized Enterprises. Appl. Sci. 2020, 10, 8566. [Google Scholar] [CrossRef] [Scilit]
  22. Ghobakhloo, M.; Iranmanesh, M.; Vilkas, M.; Grybauskas, A.; Amran, A. Drivers and Barriers of Industry 4.0 Technology Adoption among Manufacturing SMEs: A Systematic Review and Transformation Roadmap. J. Manuf. Technol. Manag. 2022, 33, 1029–1058. [Google Scholar] [CrossRef] [Scilit]
  23. Calderón, D.; Folgado, F.J.; González, I.; Calderón, A.J. Implementation and Experimental Application of Industrial IoT Architecture Using Automation and IoT Hardware/Software. Sensors 2024, 24, 8074. [Google Scholar] [CrossRef] [Scilit] [PubMed]
  24. Abdulaziz, Q.A.; Mad Kaidi, H.; Masrom, M.; Hamzah, H.S.; Sarip, S.; Dziyauddin, R.A.; Muhammad-Sukki, F. Developing an IoT Framework for Industry 4.0 in Malaysian SMEs: An Analysis of Current Status, Practices, and Challenges. Appl. Sci. 2023, 13, 3658. [Google Scholar] [CrossRef] [Scilit]
  25. Ungurean, I.; Gaitan, N.C. A Dynamic IIoT Framework Based on the Publish–Subscribe Paradigm. Sensors 2023, 23, 9829. [Google Scholar] [CrossRef] [Scilit] [PubMed]
  26. Ramzey, H.; Badawy, M.; Elhosseini, M.; A. Elbaset, A. I2OT-EC: A Framework for Smart Real-Time Monitoring and Controlling Crude Oil Production Exploiting IIOT and Edge Computing. Energies 2023, 16, 2023. [Google Scholar] [CrossRef] [Scilit]
  27. Qiu, F.; Kumar, A.; Hu, J.; Sharma, P.; Tang, Y.B.; Xu Xiang, Y.; Hong, J. A Review on Integrating IoT, IIoT, and Industry 4.0: A Pathway to Smart Manufacturing and Digital Transformation. IET Inf. Secur. 2025, 2025, 9275962. [Google Scholar] [CrossRef] [Scilit]
  28. Goknil, A.; Nguyen, P.; Sen, S.; Politaki, D.; Niavis, H.; Pedersen, K.J.; Suyuthi, A.; Anand, A.; Ziegenbein, A. A Systematic Review of Data Quality in CPS and IoT for Industry 4.0. ACM Comput. Surv. 2023, 55, 1–38. [Google Scholar] [CrossRef] [Scilit]
  29. Sengupta, J.; Ruj, S.; Bit, S.D. A Secure Fog-Based Architecture for Industrial Internet of Things and Industry 4.0. IEEE Trans. Ind. Inform. 2021, 17, 2316–2324. [Google Scholar] [CrossRef] [Scilit]
  30. Hijazi, A.; Andó, M.; Pödör, Z. Data Losses and Synchronization According to Delay in PLC-Based Industrial Automation Systems. Heliyon 2024, 10, e37560. [Google Scholar] [CrossRef] [Scilit] [PubMed]
  31. Albița, A.; Selișteanu, D. A Compact IIoT System for Remote Monitoring and Control of a Micro Hydropower Plant. Sensors 2023, 23, 1784. [Google Scholar] [CrossRef] [Scilit] [PubMed]
  32. Salem, R.M.M.; Saraya, M.S.; Ali-Eldin, A.M.T. An Industrial Cloud-Based IoT System for Real-Time Monitoring and Controlling of Wastewater. IEEE Access 2022, 10, 6528–6540. [Google Scholar] [CrossRef] [Scilit]
  33. Korodi, A.; Nițulescu, I.-V.; Fülöp, A.-A.; Vesa, V.-C.; Demian, P.; Braneci, R.-A.; Popescu, D. Integration of Legacy Industrial Equipment in a Building-Management System Industry 5.0 Scenario. Electronics 2024, 13, 3229. [Google Scholar] [CrossRef] [Scilit]
  34. Lacasa, A.; Llopis, J.; Montés, N.; Peinado-Asensi, I.; Garcia, E. Cross-PLC: An I3oT Cross Platform to Manage Communications for Applications in Real Factories. Sensors 2025, 25, 2973. [Google Scholar] [CrossRef] [Scilit] [PubMed]
  35. Fedullo, T.; Morato, A.; Tramarin, F.; Rovati, L.; Vitturi, S. A Comprehensive Review on Time Sensitive Networks with a Special Focus on Its Applicability to Industrial Smart and Distributed Measurement Systems. Sensors 2022, 22, 1638. [Google Scholar] [CrossRef] [Scilit] [PubMed]
  36. Vaclavova, A.; Strelec, P.; Horak, T.; Kebisek, M.; Tanuska, P.; Huraj, L. Proposal for an IIoT Device Solution According to Industry 4.0 Concept. Sensors 2022, 22, 325. [Google Scholar] [CrossRef] [Scilit] [PubMed]
  37. Oñate, W.; Sanz, R. Analysis of Architectures Implemented for IIoT. Heliyon 2023, 9, e12868. [Google Scholar] [CrossRef] [Scilit] [PubMed]
  38. Bădoi, C.I.; Kartal Çetin, B.; Çetin, K.; Karataş, Ç.; Özbek, M.E.; Şahin, S. A Hierarchical Framework Leveraging IIoT Networks, IoT Hub, and Device Twins for Intelligent Industrial Automation. Appl. Sci. 2026, 16, 645. [Google Scholar] [CrossRef] [Scilit]
  39. Bin Mofidul, R.; Alam, M.M.; Rahman, M.H.; Jang, Y.M. Real-Time Energy Data Acquisition, Anomaly Detection, and Monitoring System: Implementation of a Secured, Robust, and Integrated Global IIoT Infrastructure with Edge and Cloud AI. Sensors 2022, 22, 8980. [Google Scholar] [CrossRef] [Scilit] [PubMed]
  40. Bacchiani, L.; De Palma, G.; Sciullo, L.; Bravetti, M.; Di Felice, M.; Gabbrielli, M.; Zavattaro, G.; Della Penna, R. Low-Latency Anomaly Detection on the Edge-Cloud Continuum for Industry 4.0 Applications: The SEAWALL Case Study. IEEE Internet Things Mag. 2022, 5, 32–37. [Google Scholar] [CrossRef] [Scilit]
  41. Sathupadi, K.; Achar, S.; Bhaskaran, S.V.; Faruqui, N.; Abdullah-Al-Wadud, M.; Uddin, J. Edge-Cloud Synergy for AI-Enhanced Sensor Network Data: A Real-Time Predictive Maintenance Framework. Sensors 2024, 24, 7918. [Google Scholar] [CrossRef] [Scilit] [PubMed]
  42. Zhang, T.; Wang, G.; Xue, C.; Wang, J.; Nixon, M.; Han, S. Time-Sensitive Networking (TSN) for Industrial Automation: Current Advances and Future Directions. ACM Comput. Surv. 2024, 57, 1–38. [Google Scholar] [CrossRef] [Scilit]
  43. Walani, C.C.; Doorsamy, W. Edge vs. Cloud: Empirical Insights into Data-Driven Condition Monitoring. Big Data Cogn. Comput. 2025, 9, 121. [Google Scholar] [CrossRef] [Scilit]
  44. Ahmed Murtaza, A.; Saher, A.; Hamza Zafar, M.; Kumayl Raza Moosavi, S.; Faisal Aftab, M.; Sanfilippo, F. Paradigm Shift for Predictive Maintenance and Condition Monitoring from Industry 4.0 to Industry 5.0: A Systematic Review, Challenges and Case Study. Results Eng. 2024, 24, 102935. [Google Scholar] [CrossRef] [Scilit]
  45. Marinagi, C.; Reklitis, P.; Trivellas, P.; Sakas, D. The Impact of Industry 4.0 Technologies on Key Performance Indicators for a Resilient Supply Chain 4.0. Sustainability 2023, 15, 5185. [Google Scholar] [CrossRef] [Scilit]
Figure 1. Conceptual organization of the main research axes supporting the proposed IIoT architecture.
Futureinternet 18 00364 g001
Figure 2. Layered functional architecture of the proposed IIoT system based on PLC, Node-RED, Azure services and web application.
Futureinternet 18 00364 g002
Figure 3. Overall functional architecture of the proposed IIoT system for remote monitoring and control of the tank level process in the context of Industry 4.0.
Futureinternet 18 00364 g003
Figure 4. Local automation environment of the experimental tank level control process.
Futureinternet 18 00364 g004
Figure 5. Local integration flow between LOGO! 8.4 PLC and Node-RED.
Futureinternet 18 00364 g005
Figure 6. Cloud integration between Node-RED and Azure services.
Futureinternet 18 00364 g006
Figure 7. Main interfaces of the developed Web App: (a) main navigation dashboard; (b) remote process-control interface; and (c) historical tank-level data visualization. In the control interface, green indicates the filling command and active or connected states, blue indicates the draining command and the selected operating mode, and red indicates process-stopping or remote-access-disconnection actions. The light-blue curve in panel (c) represents the historical tank-level measurements.
Futureinternet 18 00364 g007
Figure 8. Bidirectional telemetry and remote control flow.
Futureinternet 18 00364 g008
Figure 9. Mean end-to-end latency comparison.
Futureinternet 18 00364 g009
Figure 10. Latency decomposition by transmission segment.
Futureinternet 18 00364 g010
Figure 11. Mean remote command latency by transmission segment.
Futureinternet 18 00364 g011
Figure 12. Remote command latency with standard deviation.
Futureinternet 18 00364 g012
Figure 13. Successful delivery rate by transmission segment.
Futureinternet 18 00364 g013
Figure 14. Sent and received events across the telemetry chain.
Futureinternet 18 00364 g014
Figure 15. Telemetry update behavior of the proposed IIoT architecture. (a) Mean time between successive telemetry updates, with error bars representing ±1 standard deviation. (b) Equivalent mean update frequency.
Futureinternet 18 00364 g015
Figure 16. Service recovery time with standard deviation.
Futureinternet 18 00364 g016
Table 1. Comparison of representative studies used to define the methodological design of the proposed IIoT architecture.
ReferenceApplication DomainCore Architectural ComponentsRemote Monitoring/Control CapabilityMain Contribution and Limitation
[6]Digital transformation in SMEsReview of IIoT reference architecture, including RAMI 4.0, IIRA, Open Fog, and edge-fog-cloud approachesRemote monitoring and partial remote controlLinks IoT and cloud computing to progressive digitalization in SMEs; however, it is not centered on experimental validation of a reproducible IIoT architecture.
[7]General IIoT reviewReview of IIoT reference architecture, including RAMI 4.0, IIRA, Open Fog, and edge-fog-cloud approachesConceptual monitoring/control perspectiveIdentifies key architectural requirements and challenges; however, it does not provide an experimental implementation.
[13]PLCs in Industry 4.0Conceptual analysis of PLCs in CPS and Industry 4.0Not focused on remote monitoring/control implementationReinforces the continued relevance of PLCs as local control cores; however, it does not propose an experimental IIoT architecture.
[23]Microgrid with photovoltaic and hydrogen energyFour-layer IIoT architecture combining industrial automation, IoT hardware/software, and web visualizationRemote monitoring; remote control not clearly emphasizedProvides experimental validation of a multilayer IIoT architecture; however, it is not focused on a compact or low-barrier architecture.
[30]PLC-based industrial automationPLC + Node-RED + multiple databasesMonitoring-oriented: remote control not addressedAnalyzes delays, synchronization, and data losses in PLC–Node-RED–database integration; however, it does not propose a complete cloud-based monitoring and remote control architecture.
[31]Micro-hydropower plantCompact IIoT system with MQTT, monitoring and controlYesProposes a compact and adaptable IIoT solution for monitoring and remote control; however, it is tied to a specific application domain.
[32]Wastewater treatmentCloud-based industrial IoT system for monitoring and controlYesIntegrates real-time monitoring, alarms, and valve control in a cloud-based scheme; however, it is application-specific and less focused on reproducibility.
Proposed workExperimental tank level processCompact PLC platform + Factory I/O + Node-RED + Azure Yes, bidirectionalReproducible IIoT architecture with experimental validation, structured historical data storage, real-time monitoring, and remote control in a low-barrier technical framework.
Table 2. Methodological gaps identified in the literature and their relationship to the proposed IIoT architecture.
Identified GapEvidence from the LiteratureTechnical ImplicationHow the Present Study Addresses It
Predominance of conceptual or only partially validated architectures.Multiple reviews and proposals describe general frameworks, but with limited experimental validation.Practical system behavior cannot be assumed without direct evaluation.The present study proposes an implemented and experimentally validated architecture in a reproducible environment.
Limited attention to synchronization, delays, and data losses in PLC–middleware-cloud chains.PLC–Node-RED–database integration studies report temporal misalignment, accumulated delays, and record losses.The acquisition chain cannot be assumed to be transparent or degradation-free.The architecture is evaluated through latency, delivery rate, update rate, recovery, and related performance metrics.
Scarcity of compact and low-barrier solutions.Several studies rely on broad infrastructures or highly application-specific domains.Transferability toward gradual adoption scenarios is reduced.A compact PLC platform and widely available tools are used to support a more accessible implementation.
Incomplete integration between real-time monitoring, structured historical data storage, and bidirectional remote control.Some works prioritize monitoring, while others integrate control without including both functions together with historical access.The functional value of the distributed architecture is reduced.The proposed system integrates real-time supervision, historical query, and bidirectional remote control.
Limited orientation toward progressive digitalization in small-scale contexts.The SME-oriented literature often provides methodological roadmaps rather than reproducible technical architectures.There is a lack of experimental technical bases for future adoption studies.The study is positioned as a technical basis for future research on progressive Industry 4.0 adoption.
Dependence on highly specific application domains.Several antecedents are tied to wastewater, microgrids, or hydropower systems.Generalization of results may be limited.A generic architecture is proposed over a reproducible automated process with broader experimental transferability.
Table 3. Process variables, local signals, and cloud integration mapping.
CategorySignal/VariableAssignmentFactory IO/Local SourcePLC/Cloud Mapping
Local inputManual mode selectorManualV0.0NI1
Local inputAutomatic mode selectorAutomaticV0.1NI2
Local inputEmergency stopEmergencyV0.2NI3
Local inputFilling pushbutton (manual)FillingV0.3NI4
Local inputEmptying pushbutton (manual)EmptyingV0.4NI5
Local inputStart pushbutton (automatic)StartV0.5NI6
Local inputStop pushbutton (automatic)StopV0.6NI7
Local inputLevel measurementLevel measurementVW200NAI1
Cloud input/outputManual/automatic modeR_Manual/Auto-M1
Cloud input/outputStart pushbutton (automatic)R_Start-M2
Cloud input/outputStop pushbutton (automatic)R_Stop-M3
Cloud input/outputFilling pushbutton (manual)R_Filling-M4
Cloud input/outputEmptying pushbutton (manual)Emptying-M5
Cloud input/outputConnection requestR_Request-M9
Cloud outputRemote mode enabledRemote_mode_yes-M6
Cloud outputRemote mode disabledRemote_mode_no-M7
Cloud outputLevel measurementLevel measurement-NAI1
Local outputTank filling valveTank filling valve-AQ1
Local outputTank emptying valveTank emptying valve-AQ2
Table 4. Mapping of remote commands between the cloud layer and the local controller variables.
Functional DescriptionNode-RED VariablePLC MarkerExample Message
Manual/automatic mode selectionManual/AutomaticM01Manual/Auto, on;
Manual/Auto, off
Automatic start commandStartM02Start, on; Start, off
Automatic stop commandStopM03Stop, on; Stop, off
Manual filling commandFillingM04Filling, on; Filling, off
Manual emptying commandEmptyingM05Emptying, on; Emptying, off
Connection request/activationRequestM09Activation, on; Activation, off
Table 5. Descriptive statistics of end-to-end latency.
RouteSegmentnMeanMedianStd. Dev.MinimumMaximumP95
Web AppFactory IO-Node-RED15640.0190.0170.025−0.0020.5370.037
Node-RED-Web1564307.351307.00036.809222519362
Total1564307.370307.02236.810222.027519.024362.027
Table StorageFactory IO-Node-RED15640.0190.0170.025−0.0020.5370.037
Node-RED-Table Storage1564346.50434542.145261728407
Total1564346.523345.00942.147261.007728.015407.038
Table 6. Descriptive statistics of remote command latency.
RouteSegmentnMeanMedianStandard Deviation.
All commandsWeb App–Node-RED112283.90225578.975
All commandsNode-RED–PLC LOGO!112111.321110.45560.002
All commandsTotal Latency112395.223385.105101.429
Table 7. Successful telemetry delivery rate by transmission segment.
Node-RED Time (ms)Events Sent (Factory I/O)Events Received (Node-RED)Events Sent (Node-RED)Events Received (Web App)Delivery Rate FIO-NR (%)Delivery Rate NR-Web (%)Losses FIO-NR (%)Losses NR-Web (%)
50035,3052154215421546.1010093.900
20018,46341404140414022.4210077.580
Table 8. Descriptive statistics of the time between telemetry updates.
MetricnMeanMedianStandard
Deviation
MinimumMaximum95th
Percentile
Mean
Equivalent
Frequency
Coefficient of
Variation
Time between updates (ms)1662522.075544100.29328715345781.91519.21
Table 9. Descriptive statistics of service recovery time.
MetricnMeanMedianStandard
Deviation
MinimumMaximum95th
Percentile
Recovery time (s)238.17712.8265.0182.81712.89512.877
Table 10. Quantitative contextual benchmarking of time-related behavior against representative implemented IIoT studies.
ReferenceQuantitative Time-Related Evidence Reported in the StudyComparable DimensionInterpretation Relative to the Present Work
[30]PLC average interval: 0.9995 s; database-side average interval: 1.0146 s; approximate mismatch: 15.1 ms per cycle.Acquisition-stage temporal mismatch and delay accumulation in PLC–Node-RED chains.This study provides the closest quantitative precedent for the first-leg bottleneck observed in the present architecture. Although it does not report cloud telemetry latency, it confirms that even millisecond-level acquisition mismatch can accumulate and generate missing values in PLC–Node-RED pipelines.
[31]Full data refresh sequence approximately every 20 s; archive entry every 1 min.Monitoring refresh cycle and supervisory timing.Compared with this compact IIoT system, the present work operates at a substantially faster supervisory timescale, with a mean telemetry update interval of 522.075 ms and an equivalent mean frequency of 1.915 Hz, indicating a more agile remote monitoring layer.
[32]Sensor acquisition every 15 min; dashboard refresh every 5 s.Cloud monitoring refresh and supervisory update behavior.The present work shows a much faster telemetry visualization cycle than this cloud-based wastewater monitoring system, since its update interval remains in the sub-second range on average (522.075 ms), whereas Salem et al. operate with second-level dashboard refresh and minute-level sensing.
[38]Design objective of keeping end-to-end latency below 500 ms under target operating conditions; reporting periods between 100 ms and 10 s depending on device class.Edge–cloud latency envelope and scalable telemetry behavior.Although not directly reporting a mean telemetry latency equivalent to ours, this framework defines a realistic low-latency operating envelope. In this context, the mean telemetry latencies of the present work (307.37 ms to Web App and 346.523 ms to Table Storage) fall within the same sub-500 ms latency range expected for responsive edge–cloud IIoT communication.
Present workMean end-to-end telemetry latency: 307.37 ms (Web App) and 346.523 ms (Table Storage); mean remote command latency: 395.233 ms; mean telemetry update interval: 522.075 ms; equivalent mean update frequency: 1.915 Hz.Unified cross-layer temporal characterization.Unlike the compared studies, the present work reports a coherent set of experimental timing metrics covering telemetry, remote control, update behavior, delivery reliability and recovery under a single reproducible validation environment.
Disclaimer/Publisher’s Note: The statements, opinions and data contained in all publications are solely those of the individual author(s) and contributor(s) and not of MDPI and/or the editor(s). MDPI and/or the editor(s) disclaim responsibility for any injury to people or property resulting from any ideas, methods, instructions or products referred to in the content.