1. Introduction
The rapid evolution of mobile communication systems toward fifth- and sixth-generation (5G/6G) networks has significantly increased the demand for reliable and seamless connectivity under user mobility. In such environments, the handover process plays a critical role in maintaining service continuity as users move across coverage areas of different base stations. Efficient handover mechanisms are essential to ensure quality of service (QoS), reduce latency, and prevent connection interruptions [
1].
In current cellular networks, handover decisions are primarily based on radio signal measurements, including Reference Signal Received Power (RSRP), Reference Signal Received Quality (RSRQ), and Signal-to-Noise Ratio (SNR). These parameters reflect the quality of the radio link and are used in combination with thresholds, hysteresis margins, and time-to-trigger mechanisms to determine when a handover should occur [
2,
3].
Although handover behavior is expected to depend on radio quality, user mobility, and service-level performance, the relative contribution of these factors remains difficult to quantify in real-world environments. Existing studies on handover performance mainly rely on simulation-based models or theoretical analyses, where network dynamics are often simplified [
4,
5]. In contrast, measurement-based studies using drive-test data provide a more realistic representation of network behavior, capturing the combined effects of interference, user mobility, network topology, and traffic load [
6].
In recent years, machine learning (ML) techniques have been increasingly explored to enhance handover decision-making in mobile networks. ML-based approaches enable adaptive and data-driven optimization by learning complex relationships between radio parameters and network performance indicators [
7,
8]. However, many of these studies focus on predictive performance without providing a detailed empirical analysis of the underlying factors influencing handover behavior.
This gap motivates the need for a comprehensive data-driven investigation of handover dynamics using real-world measurements. In particular, it remains unclear how radio signal indicators, QoS metrics, and mobility-related variables jointly contribute to handover behavior under practical measurement conditions.
In this paper, a data-driven and machine learning-based analysis of handover behavior in mobile networks is presented. A formal method for automatic detection of handover events is proposed based on changes in the serving cell identifier. The relationships between radio signal indicators, QoS metrics, mobility-related variables, and handover occurrence are quantitatively evaluated using statistical and machine learning methods. In addition, problematic scenarios, including connection degradation events, are identified and analyzed to assess their effect on network stability.
The main contributions of this work can be summarized as follows:
A formal and automated approach for handover event detection based on real-world measurement data is proposed.
A quantitative analysis of the relationship between radio indicators, QoS metrics, mobility-related variables, and handover behavior is conducted.
Problematic scenarios, including degradation events, are identified and their impact on network stability is evaluated.
A machine learning model is applied to validate the relative importance of different factors influencing handover decisions.
The results of this study provide insights into the mechanisms driving handover behavior and highlight the importance of QoS-aware, data-driven and ML-assisted mobility management strategies for future 5G and beyond communication networks. Unlike many existing studies that primarily rely on simulation environments or focus mainly on predictive optimization, the proposed work emphasizes empirical measurement-based analysis and interpretability of handover-related factors under realistic urban mobility conditions.
2. Related Work
2.1. Traditional Handover Mechanisms
Handover mechanisms are a fundamental component of cellular networks, ensuring seamless connectivity as user equipment moves across coverage areas. In LTE and 5G systems, handover decisions are primarily based on radio signal measurements such as Reference Signal Received Power, Reference Signal Received Quality, and Signal-to-Noise Ratio. These parameters are evaluated using predefined thresholds, hysteresis margins, and time-to-trigger mechanisms to balance responsiveness and stability [
9,
10,
11].
Although such approaches are widely adopted due to their simplicity and robustness, they suffer from several limitations. In particular, threshold-based mechanisms rely on static configurations and do not adapt well to dynamic network conditions, including interference variations, user mobility patterns, and traffic load. This can result in inefficient handover decisions, leading to unnecessary handovers or degraded quality of service (QoS).
2.2. Mobility Management and Handover Optimization in 5G Networks
The evolution toward 5G and beyond networks has significantly increased the complexity of mobility management due to ultra-dense deployments, heterogeneous architectures, and diverse service requirements. Several studies have investigated advanced handover optimization techniques, including load-aware strategies, network slicing, and edge computing integration [
12,
13].
Recent survey papers provide comprehensive overviews of handover management challenges and solutions in 5G systems. For example, Tayyab et al. [
14] and Haghrah et al. [
15] highlight the limitations of conventional handover approaches in next-generation networks, emphasizing the need for adaptive and context-aware mechanisms. Similarly, Alraih et al. [
16] discuss the challenges of handover optimization in beyond-5G environments, including increased signaling overhead and mobility-induced instability.
Despite these efforts, most of the proposed solutions are evaluated in simulation environments, which may not accurately represent real-world network conditions. As a result, the applicability of these approaches to practical deployments remains an open question.
2.3. Machine Learning-Based Handover Approaches
To overcome the limitations of traditional methods, machine learning techniques have been increasingly explored for improving handover decision-making. ML-based approaches enable data-driven optimization by capturing complex relationships between radio parameters, user mobility, and network performance [
17].
Several studies have proposed ML-based models for handover prediction and optimization. For instance, Hatipoglu et al. [
18] applied machine learning techniques to predict handover performance in beyond-5G networks, while Tanveer et al. [
19] explored reinforcement learning approaches for adaptive handover management in ultra-dense networks. In addition, deep learning and reinforcement learning methods have been proposed to optimize handover policies dynamically [
20].
A systematic mapping study by Párraga-Villamar et al. [
21] further confirms the growing interest in ML-based handover solutions. However, many of these works primarily focus on improving predictive accuracy, often at the expense of interpretability and physical insight into the underlying factors influencing handover behavior.
2.4. Measurement-Based Studies and Real-World Data
Measurement-based studies using drive-test data provide valuable insights into actual network performance under realistic conditions. Unlike simulation-based approaches, these studies capture the combined effects of interference, environmental variability, and operator-specific configurations.
Some recent works have explored real-time analytics and data-driven optimization for mobility management. For example, Elbatal [
22] investigated dynamic handover optimization using real-time network data, while Yusof et al. [
23] applied machine learning techniques to mobility management in specific scenarios such as UAV communications.
Despite these contributions, relatively few studies combine real-world measurement data with detailed statistical analysis and interpretable machine learning models. In particular, the relationship between spatial characteristics, radio signal quality, and handover behavior remains insufficiently explored in empirical datasets.
2.5. Research Gap
Based on the reviewed literature, several limitations can be identified. First, a large portion of existing research relies on simulation-based evaluations, which may not accurately reflect real network conditions. Second, although radio signal parameters are extensively studied, relatively few works jointly analyze radio indicators, QoS metrics, mobility-related variables, and degradation conditions using real-world measurement data. Third, ML-based approaches tend to prioritize predictive performance without providing sufficient insight into feature importance and underlying network behavior. The proposed approach prioritizes interpretability and empirical mobility analysis over maximizing predictive complexity.
To address these limitations, this study presents a data-driven analysis of handover behavior based on real-world drive-test measurements. In contrast to existing works, the proposed approach combines statistical analysis with interpretable machine learning models to evaluate the influence of radio, QoS-related, and mobility-related parameters. The contribution of the present study lies in the integration of real-world drive-test measurements, statistical analysis, QoS degradation analysis, and interpretable machine learning-based validation within a unified empirical mobility analysis framework.
3. Methodology
3.1. Drive-Test Measurement Environment
To investigate handover behavior under realistic mobility conditions, the dataset was collected through a series of real-world drive-test experiments conducted in Astana, Republic of Kazakhstan. Astana represents a dense urban environment characterized by heterogeneous propagation conditions, varying traffic density, and intensive mobile broadband usage, making it suitable for studying mobility-related network behavior in LTE/5G systems.
The measurements were performed using Samsung Galaxy Tab S9 devices (Samsung Electronics, Suwon, South Korea) operating on the Android platform and equipped with a custom-developed mobile application named Mobtest 1.0. The application was designed for continuous collection of network-related measurements during mobility and supports real-time acquisition of radio, QoS, and geographical parameters. During the drive tests, the devices were mounted inside a vehicle and continuously recorded measurements while moving along predefined urban routes, including dense traffic roads, intersections, and highly populated districts.
The measurement campaign focused on practical LTE/5G mobile broadband scenarios involving multiple mobile network operators. The collected parameters included timestamp, serving cell identifier, network type, signal strength, throughput, latency, geographical coordinates, device speed, and service response indicators. Measurements were periodically sampled with intervals of several seconds, enabling temporal tracking of mobility behavior and handover transitions [
24].
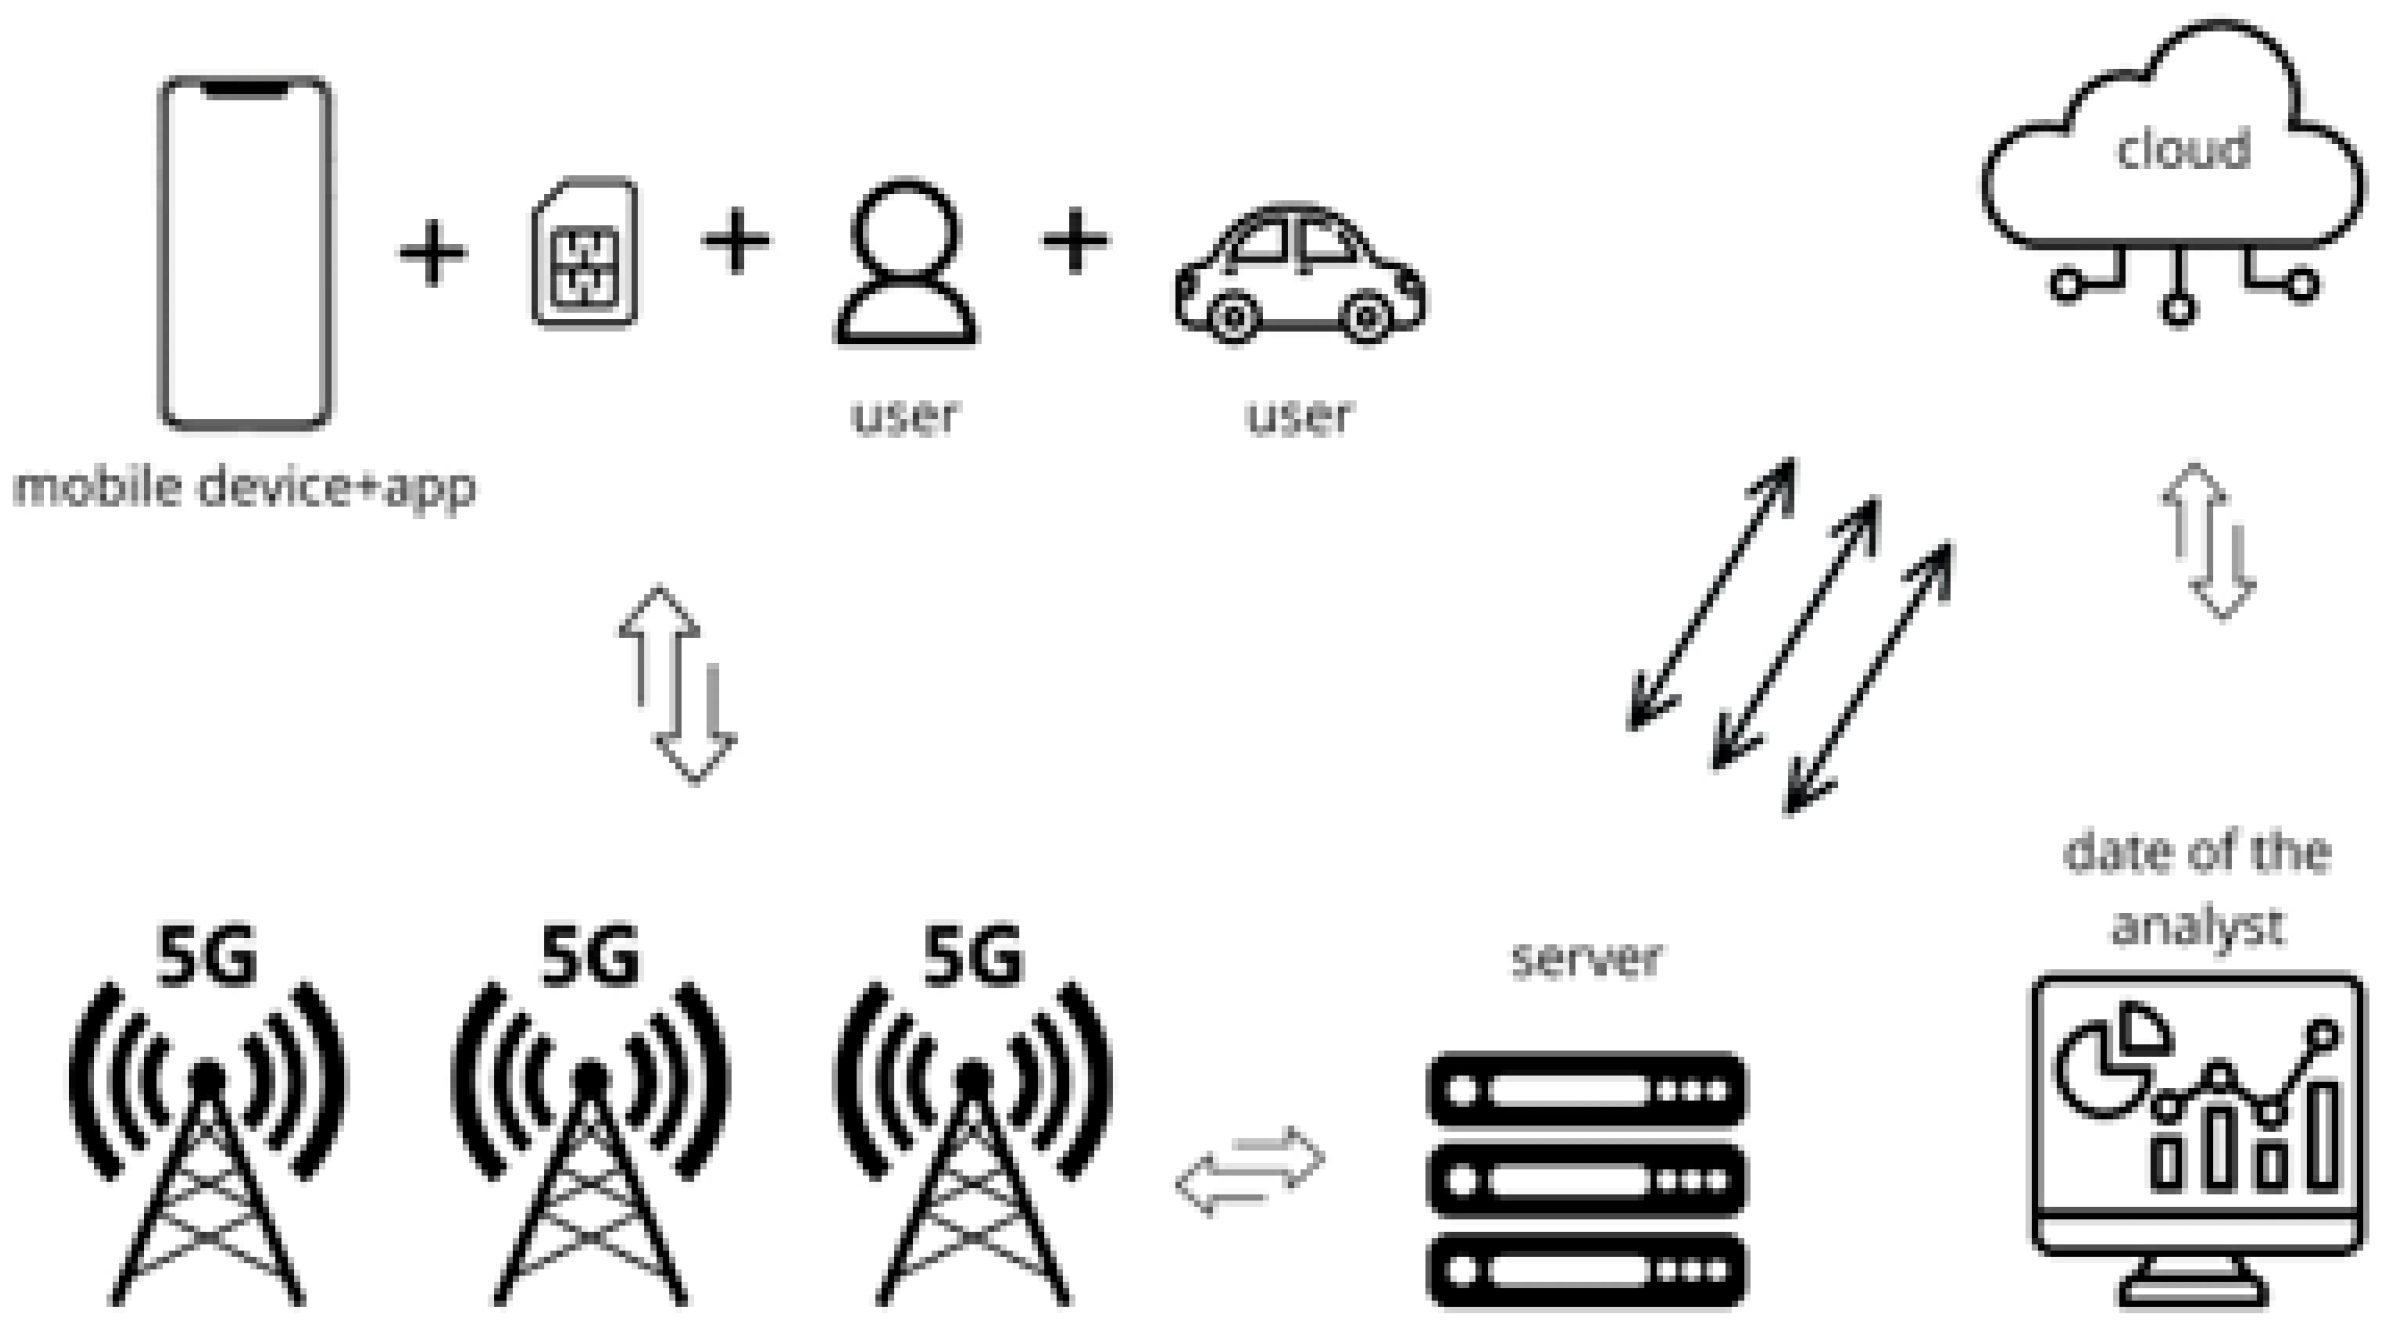
Figure 1 illustrates the architecture used for the drive-test measurement campaign and data collection process.
To ensure consistency and reduce hardware-related variability, identical device configurations and measurement settings were maintained throughout the experiments. The vehicle speed was generally maintained below 70 km/h in accordance with urban traffic regulations in Astana. The collected measurements therefore reflect realistic user mobility conditions, including variations caused by interference, traffic load, and urban propagation characteristics.
3.2. Dataset Description and Preprocessing
The study is based on a dataset obtained from real-world mobile network measurements collected during drive-test experiments. The dataset contains approximately 27,000 records, each representing a network measurement associated with user activity.
Each record includes temporal, spatial, radio, and performance-related parameters. The key attributes of the dataset are as follows:
- -
Temporal information: timestamp of the measurement (test_time);
- -
User identifier: device_id;
- -
Network parameters: network_type, operator, cell_id, lac;
- -
Radio signal indicator: signal_strength;
- -
Quality of service metrics: ping_time, page_response_latency, page_download_speed, speed;
- -
Geographical coordinates: latitude, longitude;
- -
Service status indicator: response_flag.
The dataset was collected in the city of Astana, Republic of Kazakhstan, during drive-test measurements conducted in a real urban environment. Therefore, the data reflect practical network conditions, including user mobility, interference, and variability in service performance.
Prior to analysis, the dataset was preprocessed by removing records with missing values in key variables. The data were then sorted chronologically based on the timestamp (test_time) for each device to preserve temporal continuity. This step is essential for reliable detection of mobility events.
The dataset primarily reflects application-level web-browsing traffic scenarios rather than continuous radio-layer mobility sessions. Consequently, the observed handover behavior corresponds to practical user activity measurements under realistic urban deployment conditions.
Table 1 presents the main dataset variables used in the proposed analysis framework, including radio-quality, QoS-related, and mobility parameters, together with their descriptions, measurement units, and analytical roles within the preprocessing, handover analysis, and machine learning prediction stages.
3.3. Handover Event Detection
Handover events were formally defined as changes in the serving cell identifier between consecutive observations. Let
Cell IDi denote the serving cell at time
i. A handover event is defined as (1):
where Δ
ti is the time difference between consecutive samples and
Tmax is a threshold ensuring temporal continuity of the user trajectory.
Based on this formulation, a programmatic procedure was implemented to automatically detect handover events across the dataset. Each detected event was assigned a unique identifier, and a structured dataset of handover events was constructed. This dataset includes both spatial and radio parameters at the moment of handover.
3.4. Detection of Problematic Scenarios
Two types of problematic scenarios were analyzed.
Ping-Pong Handover
Ping-pong events were defined as rapid switching between two cells (A → B → A) within a short time interval. Detection was performed by analyzing consecutive handover sequences.
Connection Degradation (RLF Proxy)
Since direct indicators of radio link failure were not available, a proxy definition was introduced based on threshold conditions (2):
This definition captures conditions associated with poor radio quality and degraded user experience.
The threshold values used in the degradation proxy were selected according to empirical distributions observed in the collected dataset rather than optimized toward machine learning performance. Specifically, signal strength below −95 dBm was considered indicative of weak radio conditions, ping time above 300 ms represented elevated network delay, throughput below 3 Mbps reflected degraded service performance, and page response latency above 1500 ms indicated substantial application-level delay. These threshold values correspond to degraded operational regions observed within the empirical QoS distributions and were introduced to improve analytical transparency and reproducibility.
3.5. Machine Learning-Based Handover Prediction
To complement the statistical analysis, a machine learning model was used to predict handover events. Logistic Regression was selected as an interpretable baseline model suitable for analyzing linear dependencies between QoS indicators and handover events, while Random Forest was employed to capture potential nonlinear interactions among mobility-related features. The machine learning component of this study is intended primarily as an interpretable analytical framework for validating relationships between QoS-related features and handover occurrence rather than as a standalone novel optimization architecture.
The model uses the following input features derived from the dataset:
- -
signal_strength;
- -
ping_time;
- -
speed;
- -
page_response_latency;
- -
page_download_speed.
The selected feature set was constrained by the parameters available within the drive-test measurement framework. Several important mobility-related indicators, including neighbor-cell measurements, interference metrics, handover control signaling parameters, and base-station load information, were not available in the current dataset.
The dataset exhibited severe class imbalance, with handover events representing less than 1% of observations. Random downsampling of the majority class was applied only to the training subset to obtain a 1:3 positive-to-negative ratio.
After feature engineering, the final machine learning dataset contained 27,032 complete observations. Five records were excluded due to missing dynamic features. Data partitioning was performed using a device-level hold-out strategy to reduce potential information leakage between training and testing subsets. The training subset contained 14,741 samples, while the testing subset contained 12,291 samples. Due to the rarity of handover events, the training subset exhibited severe class imbalance, with a negative-to-positive ratio of approximately 102:1. To address this issue, random downsampling of the majority class was applied exclusively to the training subset, resulting in a 1:3 positive-to-negative ratio. The testing subset was kept unchanged to preserve realistic class distribution. Random seed initialization (rng(42)) was applied to ensure reproducibility. Logistic Regression was implemented with a binomial distribution. Random Forest was implemented using bootstrap aggregation with 100 trees and MaxNumSplits = 20. The classification threshold was selected by maximizing the F1-score.
4. Results
4.1. Handover Statistics
A total of 232 handover events were identified in the dataset comprising 27,037 observations, resulting in a handover occurrence rate of 0.86%. This relatively low rate reflects the characteristics of the web-browsing dataset, where multiple measurements correspond to application-level interactions rather than continuous radio-level mobility. The experiments were conducted using MATLAB R2024a environment.
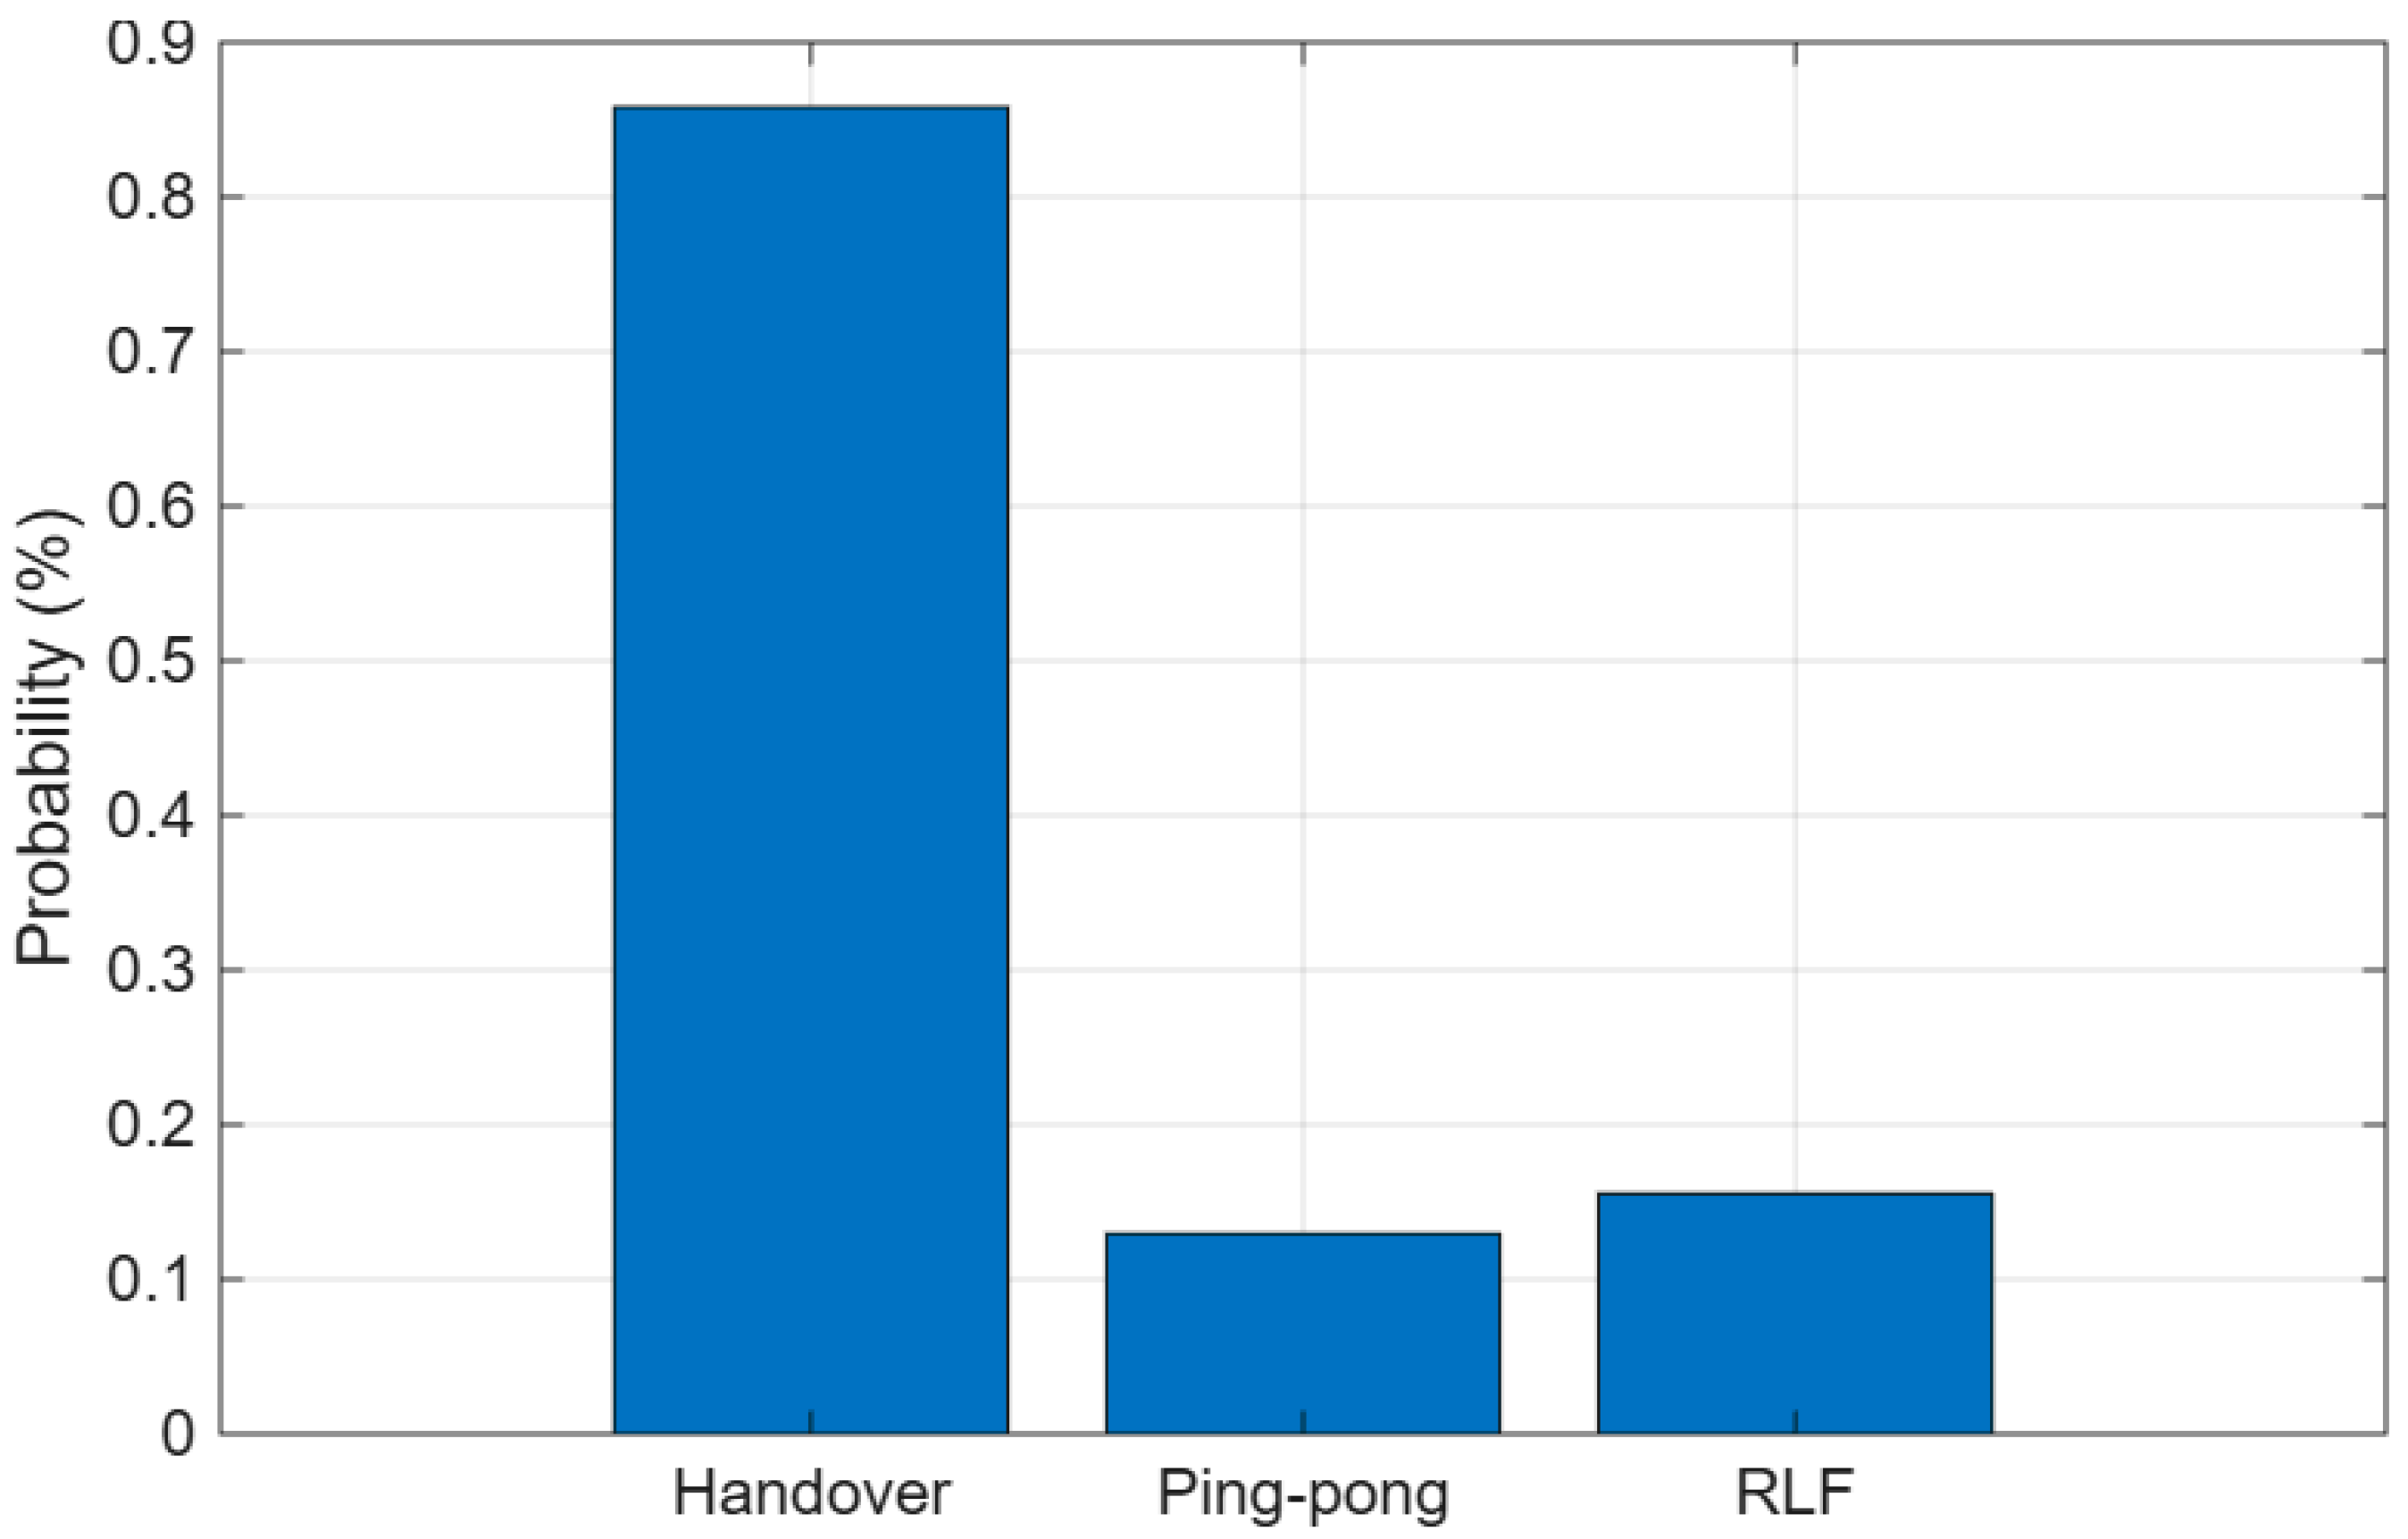
The temporal analysis confirms that handover events are sparsely distributed across the dataset, with no evidence of excessive oscillatory behavior. Specifically, the probability of ping-pong events was estimated at 0.13%, indicating that rapid back-and-forth transitions between cells are infrequent (
Figure 2). This suggests that the majority of detected handovers correspond to stable mobility transitions.
As summarized in
Table 2, handover events are relatively rare.
4.2. QoS and Handover Behavior Analysis
A proxy-based definition of connection degradation was applied to identify performance-critical conditions. The proportion of degraded samples was estimated at 0.16%, indicating that only a small fraction of observations corresponds to strict degradation scenarios.
A comparative analysis of QoS metrics reveals that degraded conditions are primarily associated with increased latency (
Table 3). Specifically, the average ping time increases from 103.85 ms under normal conditions to 232.62 ms in degraded states. In contrast, the average throughput remains relatively stable (15.54 vs. 15.76), suggesting that delay-related metrics are more sensitive to degradation than throughput in web-browsing scenarios.
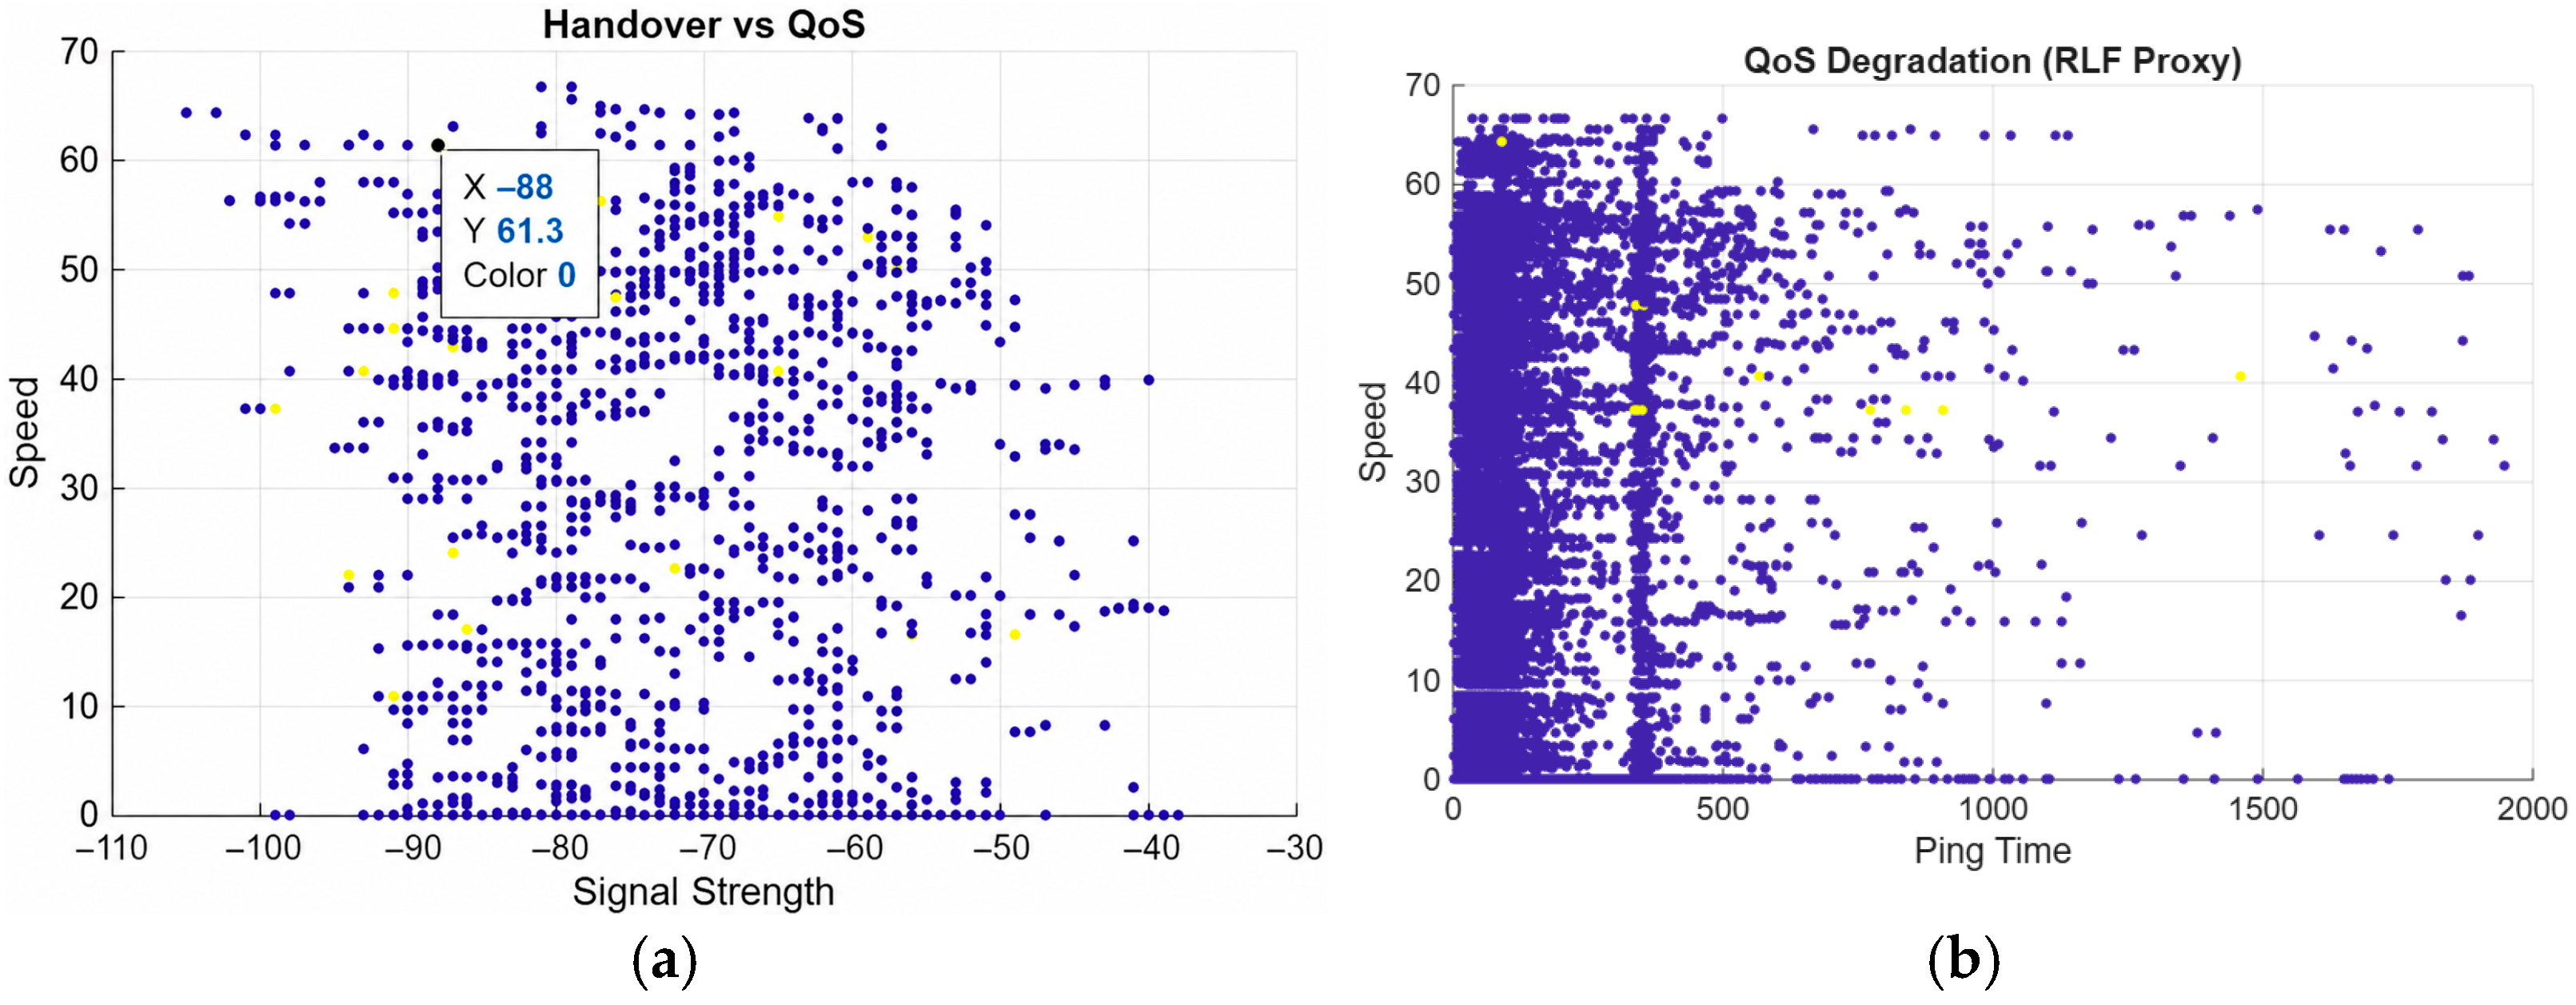
Figure 3a illustrates the relationship between handover events and QoS parameters. The results show that handover events are distributed across a wide range of signal strength and throughput values, without forming clearly separable clusters. This indicates that handover occurrence cannot be explained by a single parameter and is influenced by multiple interacting factors.
4.3. Statistical Correlation Analysis
To statistically validate the relationship between network indicators and handover occurrence, Spearman rank correlation analysis was performed. Spearman correlation was selected due to the non-Gaussian distribution of QoS indicators and the presence of nonlinear relationships within the measurement dataset.
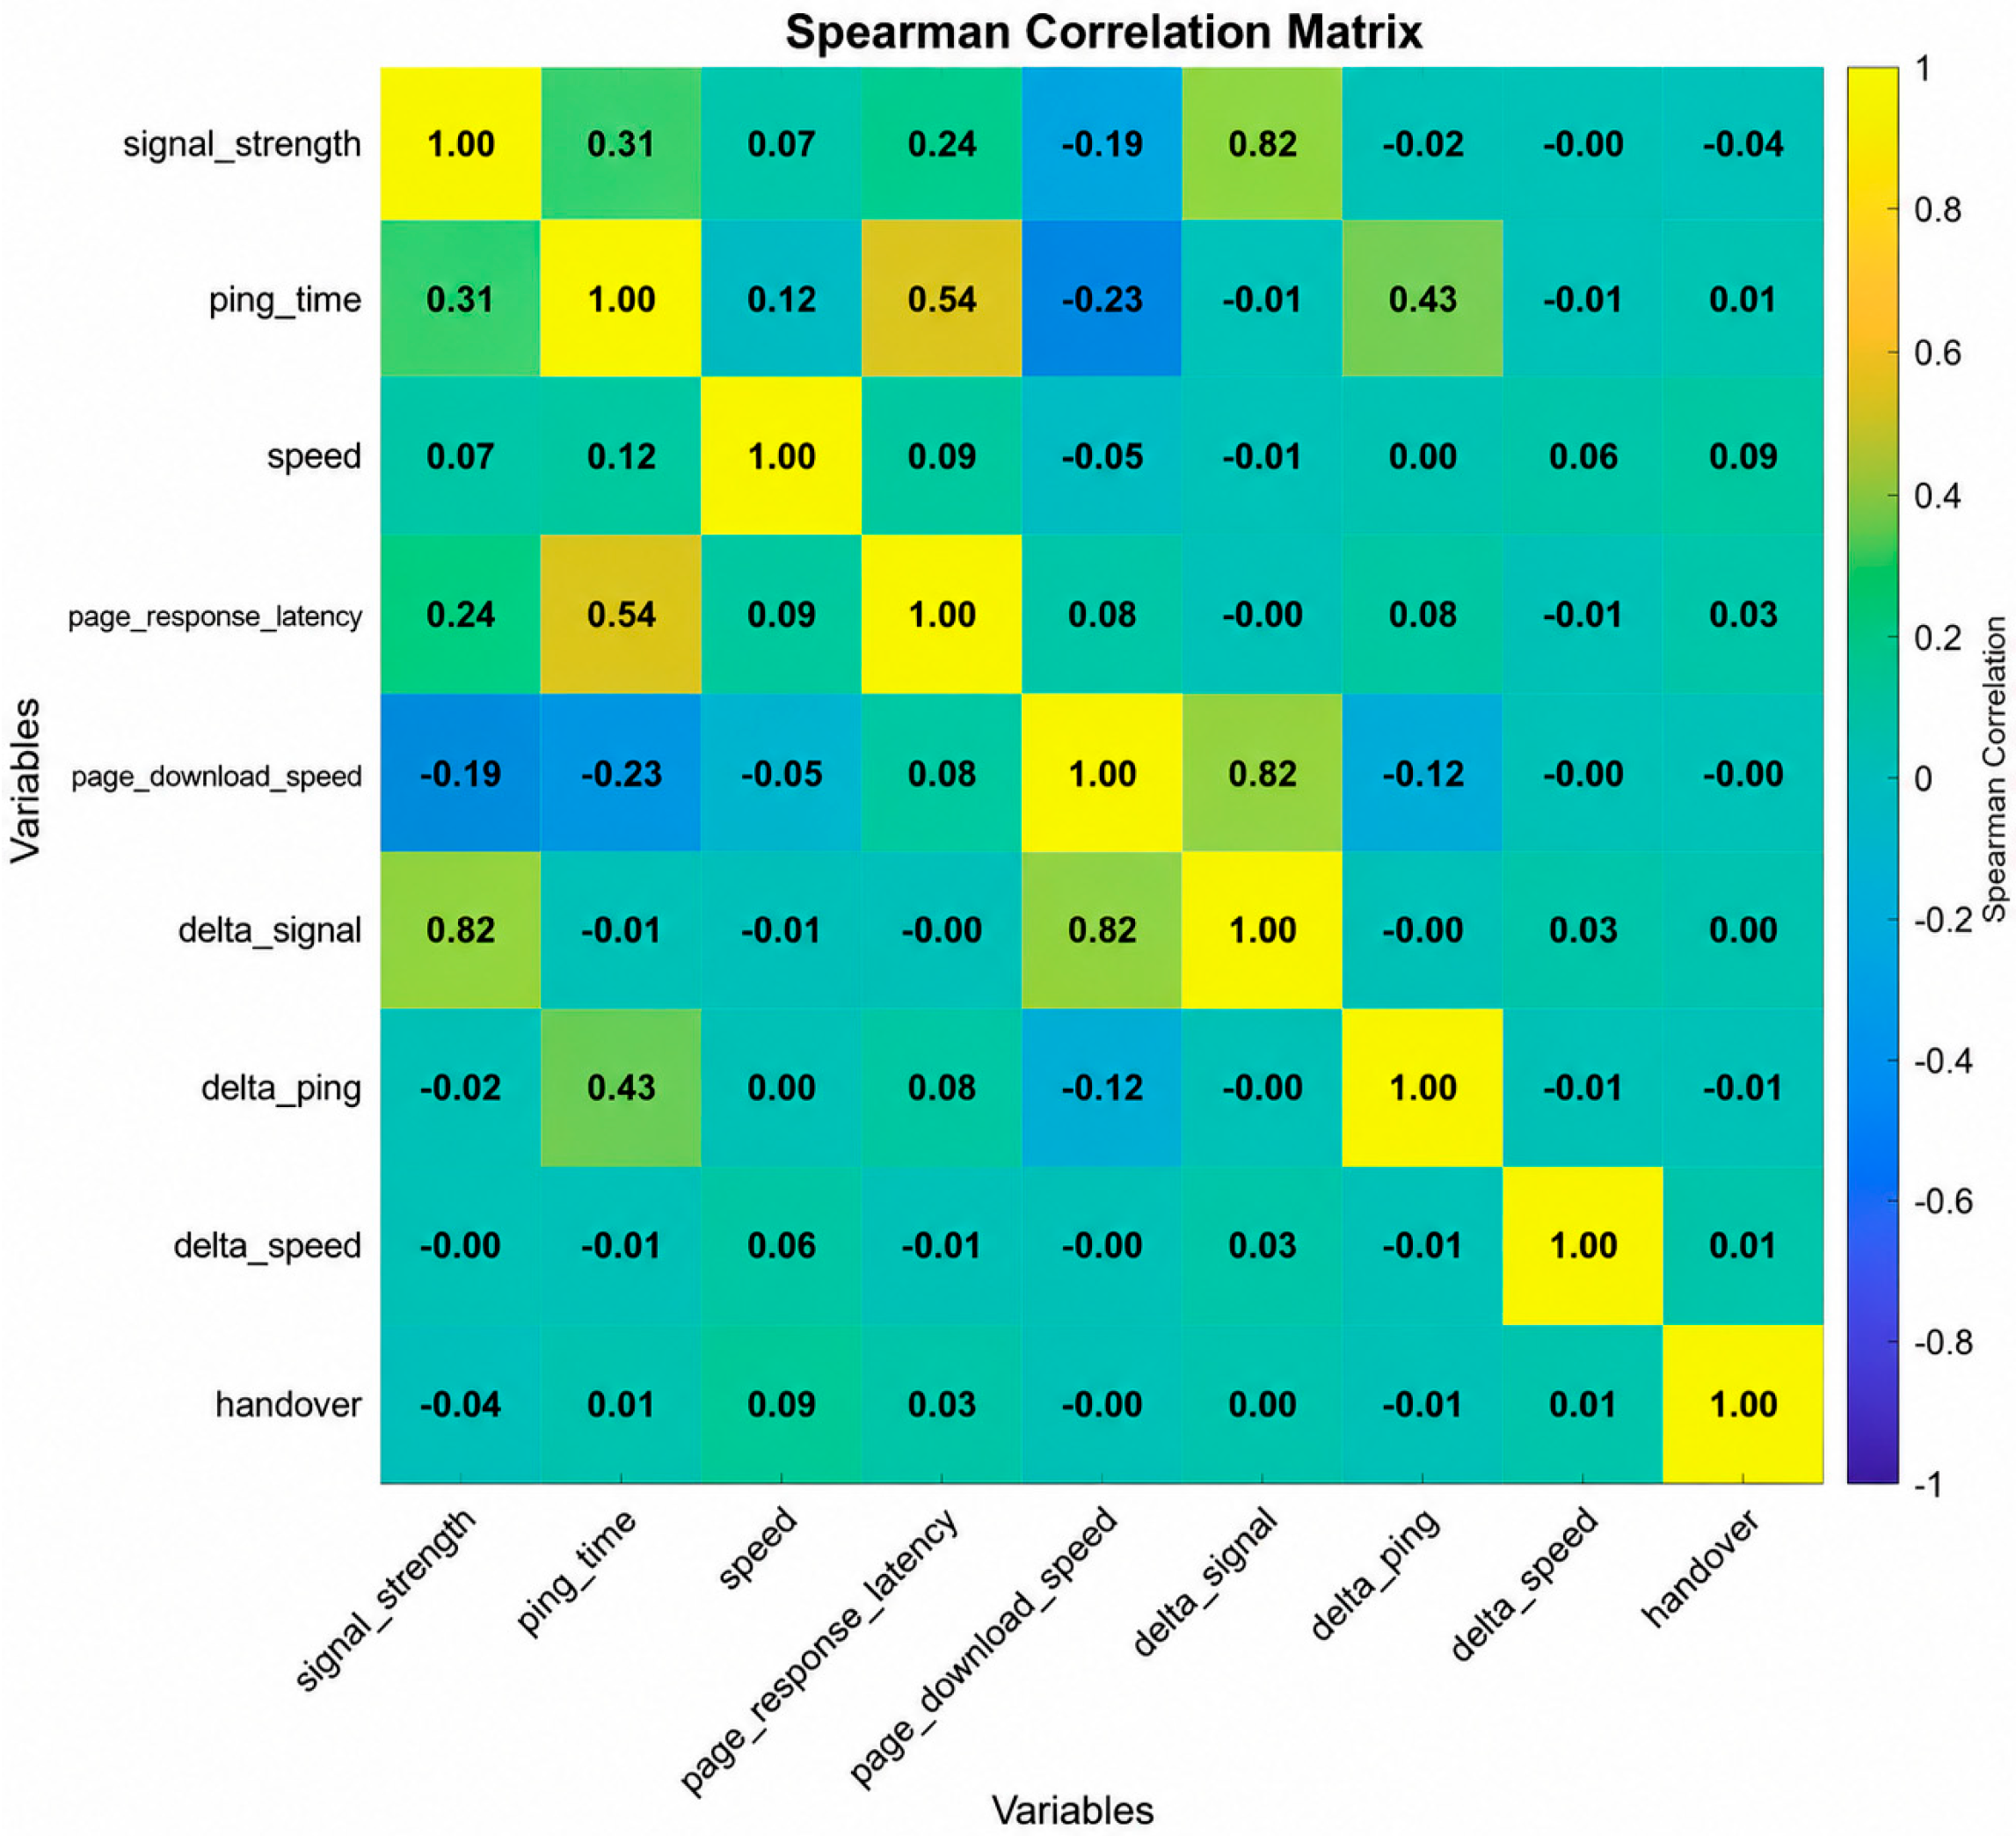
Figure 4 presents the correlation matrix between radio indicators, QoS-related variables, dynamic features, and handover occurrence. Correlation coefficients range from −1 (strong negative relationship) to +1 (strong positive relationship), while statistical significance was assessed using
p-values.
Table 4 summarizes the Spearman correlation coefficients and statistical significance values (
p-values) between network indicators and handover occurrence.
The results indicate that individual network variables demonstrate relatively weak direct associations with handover occurrence. Signal strength exhibits a weak negative correlation with handover events (ρ = −0.04, p < 0.001), whereas device speed shows the strongest positive association (ρ = 0.09, p < 0.001). Page response latency demonstrates a weak positive relationship (ρ = 0.03, p < 0.001), while download speed and dynamic features exhibit negligible direct influence.
The correlation analysis further reveals stronger dependencies among QoS indicators themselves. Ping time and page response latency demonstrate moderate positive correlation (ρ = 0.54), while ping time and page download speed exhibit negative correlation (ρ = −0.23). These findings indicate that handover behavior cannot be explained by a single predictor and is influenced by multiple interacting mobility and network-related factors.
4.4. Machine Learning-Based Analysis and Prediction of Handover Events
To evaluate the predictive relationship between network parameters and handover occurrence, machine learning models were applied using both linear and nonlinear approaches.
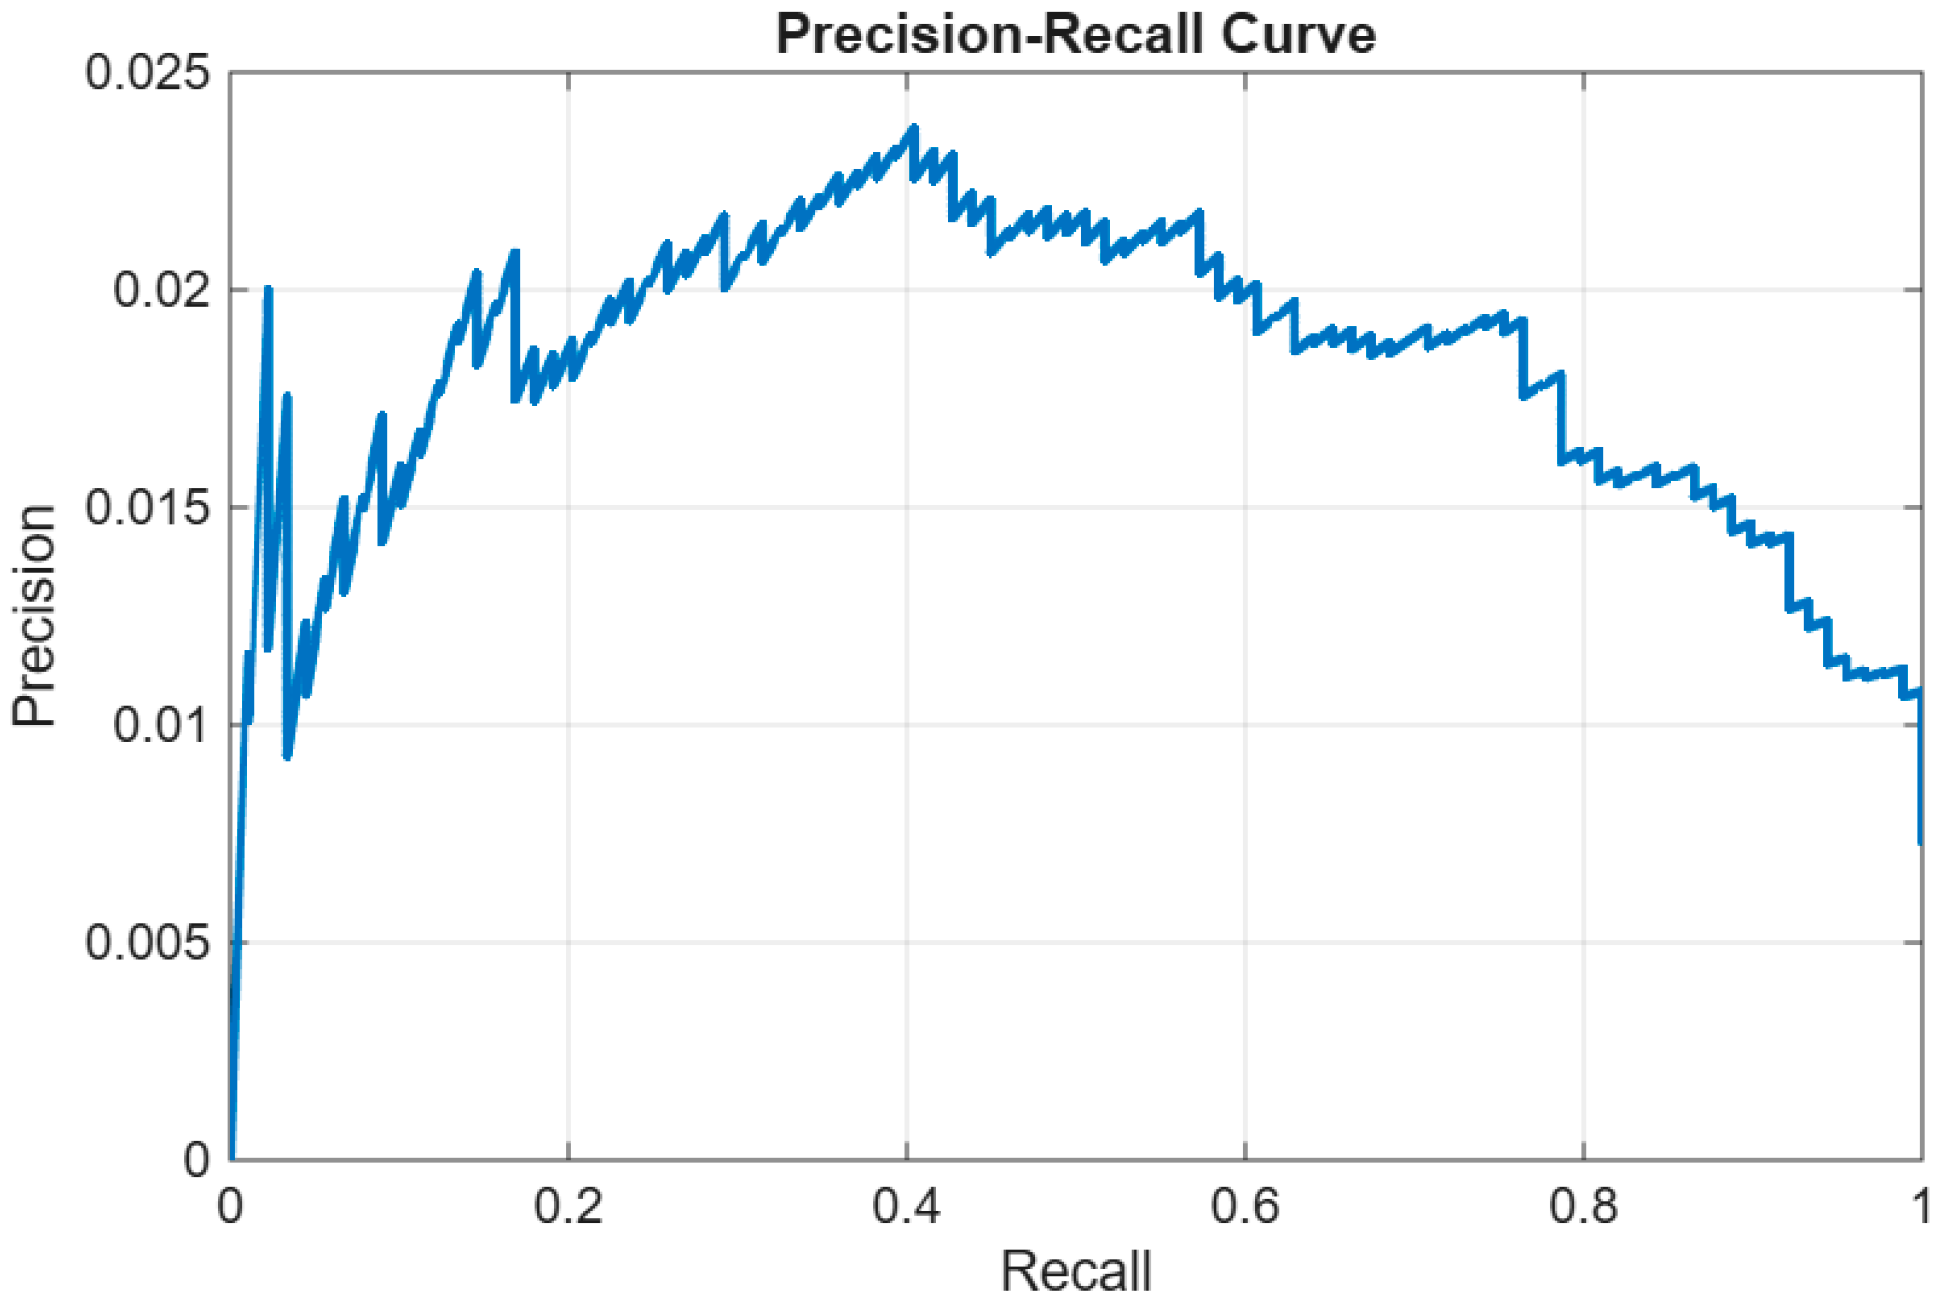
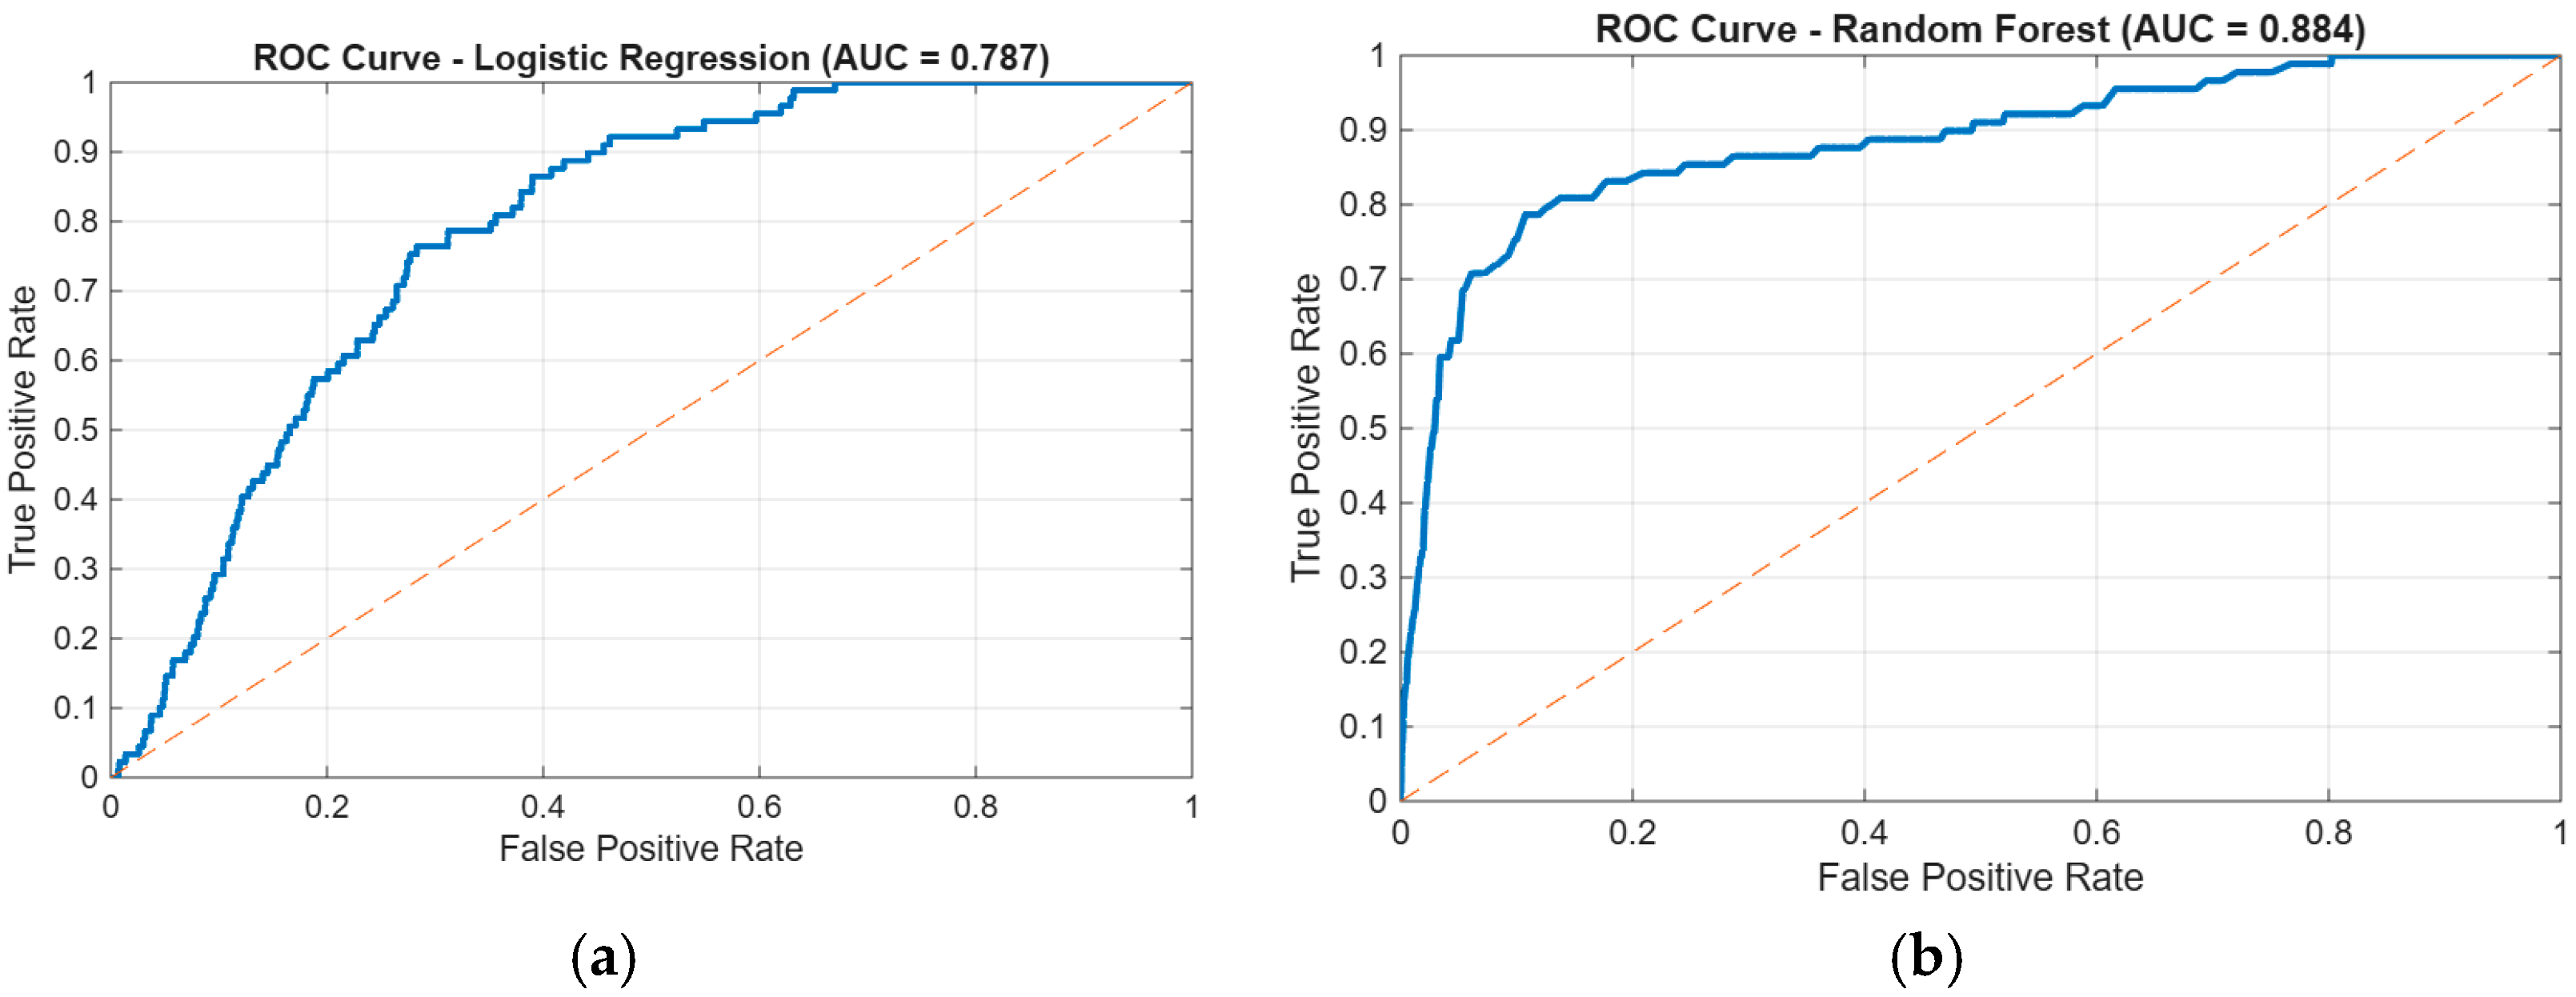
The model achieved an AUC of 0.787 (95% CI: 0.753–0.821), indicating moderate discriminative capability between handover and non-handover observations. After threshold optimization, the model achieved a recall of 0.40, meaning that approximately 40% of handover events were correctly detected. However, the precision remained low (0.023), resulting in an F1-score of 0.044. This behavior is primarily attributed to the severe class imbalance, where handover events constitute less than 1% of the dataset.
Figure 5a shows the ROC curve for logistic regression. The curve demonstrates a clear separation from the random baseline, confirming that the model captures meaningful patterns in the data, although its practical detection performance is limited.
To account for potential nonlinear relationships, a Random Forest model was used as a baseline. The Random Forest model achieved higher predictive performance, with AUC = 0.902, precision = 0.117, recall = 0.843, and F1-score = 0.205. The corresponding 95% bootstrap confidence interval for AUC was [0.858, 0.943]. As shown in
Figure 5b, the Random Forest curve consistently dominates the logistic regression curve, suggesting that nonlinear interactions between features play an important role in handover behavior.
The quantitative comparison of model performance is summarized in
Table 5.
Given the severe class imbalance, additional evaluation was conducted using the precision–recall framework.
Figure 6 presents the precision–recall curve, which shows that the model consistently outperforms the random baseline despite low absolute precision values. Although precision remains limited due to the rarity of handover events, the observed improvement over the baseline indicates that the model captures informative patterns for distinguishing between handover and non-handover states.
To improve model interpretability, Logistic Regression coefficients and Random Forest feature importance were analyzed. The Logistic Regression model indicated that speed and page response latency were statistically significant predictors of handover occurrence. In contrast, Random Forest feature importance showed that dynamic signal variation (delta_signal) had the highest contribution to prediction performance, followed by speed and page response latency. This result suggests that temporal variations in network conditions provide important predictive information for handover behavior, whereas individual static QoS indicators exhibit only limited direct explanatory power.
5. Discussion
The presented results provide several important insights into the behavior of handover events and their relationship with network performance in real-world mobile network measurements.
First, the analysis confirms that handover events are relatively rare in web-browsing datasets, with an occurrence rate below 1%. This has a direct impact on the performance of machine learning models, as severe class imbalance limits the achievable precision. In this context, the observed low precision values should not be interpreted as a model failure, but rather as an inherent characteristic of rare-event detection problems.
Second, the comparison between logistic regression and Random Forest models highlights the importance of nonlinear relationships in handover behavior. While logistic regression provides interpretable coefficients and captures general trends, its predictive performance is limited. In contrast, the Random Forest model significantly improves recall (from 0.40 to 0.83) and AUC (from 0.787 to 0.884), demonstrating that handover events are influenced by complex interactions between network parameters that cannot be fully represented by linear models.
Despite this improvement, the results also show that accurate event-level prediction remains challenging. The increase in recall is accompanied by a relatively low precision, indicating a trade-off between detecting more handover events and increasing the number of false positives. This trade-off is typical for highly imbalanced datasets and suggests that further improvements would require either additional informative features or alternative modeling strategies, such as cost-sensitive learning or temporal sequence models.
Another important observation is that no single QoS parameter can fully explain handover occurrence. The scatter analysis demonstrates that handover events are distributed across a wide range of signal strength and throughput values. This supports the hypothesis that handover decisions are driven by multiple interacting factors, including radio conditions, user mobility, and network dynamics.
The analysis of degradation events further indicates that latency is a more sensitive indicator of performance issues than throughput in web-browsing scenarios. This finding is consistent with the nature of application-level traffic, where user experience is often dominated by delay rather than raw data rate.
From a practical deployment perspective, the relatively low precision indicates that the current framework is more suitable for offline mobility analytics and exploratory network behavior analysis rather than direct real-time autonomous handover control, where excessive false alarms may introduce additional signaling overhead. In particular, the demonstrated performance of nonlinear models indicates their potential applicability within future data-driven mobility management frameworks in 5G and beyond networks.
However, several limitations of the study should be acknowledged. First, the dataset is based on web-browsing measurements, which do not directly capture all radio-level parameters typically used in handover decision-making. Second, the definition of degradation events relies on a proxy rather than explicit radio link failure indicators, which may limit the accuracy of this analysis. Finally, the rarity of handover events restricts the ability to achieve high precision in prediction tasks. In addition, the presented dataset was collected within a single urban environment and primarily reflects web-browsing traffic conditions. Therefore, the obtained results should be interpreted as an empirical measurement-based case study and may not fully generalize to all mobility scenarios or heterogeneous deployment conditions. The obtained findings are consistent with previous machine learning-based handover studies reporting that mobility behavior depends on multiple interacting radio and QoS conditions rather than single indicators [
17,
18,
19,
20]. The superior performance of Random Forest over Logistic Regression is also aligned with previous nonlinear mobility prediction studies.
Future work may incorporate datasets collected under additional traffic profiles, including video streaming, continuous mobility sessions, and heterogeneous multi-city deployments to enable broader evaluation of mobility behavior under practical cellular conditions. Future work also may investigate reinforcement learning and sequence-aware optimization approaches for adaptive mobility management in beyond-5G and 6G systems.
6. Conclusions
This study presented a data-driven analysis of handover behavior in mobile networks using real-world web-browsing measurements. A formal approach for automatic detection of handover events was developed based on changes in the serving cell identifier, enabling the construction of a structured dataset for further analysis.
The results demonstrate that handover events are relatively rare and occur under diverse network conditions, without a clear dependence on any single QoS parameter. The analysis of degradation scenarios showed that latency is a more sensitive indicator of performance issues than throughput in the considered dataset.
Machine learning models were applied to evaluate the predictive relationship between network parameters and handover occurrence. While logistic regression provided interpretable insights into the influence of key features, its predictive performance was limited. In contrast, the Random Forest model achieved significantly higher discriminative capability, confirming the importance of nonlinear relationships in handover behavior. However, the results also highlight that accurate event-level prediction remains challenging due to the highly imbalanced nature of the dataset.





 ,
,