Article

Edge-Enhanced YOLOV8 for Spacecraft Instance Segmentation in Cloud-Edge IoT Environments

1
School of Mathematics and Computer Science, Tongling University, Tongling 244061, China
2
Anhui Engineering Research Center of Intelligent Manufacturing of Copper-Based Materials, Tongling University, Tongling 244061, China
3
College of Software Engineering, Zhengzhou University of Light Industry, Zhengzhou 450001, China
*
Author to whom correspondence should be addressed.
Future Internet 2026, 18(1), 59; https://doi.org/10.3390/fi18010059
Submission received: 23 November 2025 / Revised: 12 January 2026 / Accepted: 14 January 2026 / Published: 20 January 2026
(This article belongs to the Special Issue Convergence of IoT, Edge and Cloud Systems)

Abstract

The proliferation of smart devices and the Internet of Things (IoT) has led to massive data generation, particularly in complex domains such as aerospace. Cloud computing provides essential scalability and advanced analytics for processing these vast datasets. However, relying solely on the cloud introduces significant challenges, including high latency, network congestion, and substantial bandwidth costs, which are critical for real-time on-orbit spacecraft services. Cloud-edge Internet of Things (cloud-edge IoT) computing emerges as a promising architecture to mitigate these issues by pushing computation closer to the data source. This paper proposes an improved YOLOV8-based model specifically designed for edge computing scenarios within a cloud-edge IoT framework. By integrating the Cross Stage Partial Spatial Pyramid Pooling Fast (CSPPF) module and the WDIOU loss function, the model achieves enhanced feature extraction and localization accuracy without significantly increasing computational cost, making it suitable for deployment on resource-constrained edge devices. Meanwhile, by processing image data locally at the edge and transmitting only the compact segmentation results to the cloud, the system effectively reduces bandwidth usage and supports efficient cloud-edge collaboration in IoT-based spacecraft monitoring systems. Experimental results show that, compared to the original YOLOV8 and other mainstream models, the proposed model demonstrates superior accuracy and instance segmentation performance at the edge, validating its practicality in cloud-edge IoT environments.

1. Introduction

Advancements in aerospace technology have greatly improved human capabilities for space exploration. Numerous satellites and crewed spacecraft have been launched in succession, leading to an increase in space-related activities. A crucial aspect of these activities is the on-orbit servicing of spacecraft, which is essential for ensuring the safety and sustainable development of the space environment [1]. This encompasses various tasks, including space assembly (such as in-orbit connections and the construction or assembly of spacecraft), space maintenance (such as surface repairs and component replacements), and servicing (such as the recovery of malfunctioning spacecraft and the capture of space debris) [2]. In the context of these on-orbit services, the categories of spacecraft components are often necessary to be accurately identified, such as solar panels and main bodies, as well as to detect high-level features, including edge contours, corner points, and dimensions of these components. This information is vital for providing robust data support for estimating the relative poses of spacecraft [3]. Obtaining this information typically requires instance segmentation of spacecraft images.
The conventional cloud-centric approach, which involves transmitting all raw image data to the cloud for processing, faces significant hurdles in this context, including high communication latency, network bandwidth constraints, and potential single points of failure. These limitations are at odds with the real-time demands of on-orbit services. Cloud-edge IoT computing offers a viable solution by distributing the computational load: deploying lightweight models on edge devices (e.g., satellites) for immediate processing while leveraging the cloud for heavier tasks like model training and long-term data storage [4]. However, the presence of complex backgrounds in space can interfere with the accuracy of this segmentation, as the background may overlap with the spacecraft, leading to the loss of boundary information and inconsistencies in size features. This, in turn, adversely affects the precision of regression box positioning in spacecraft image segmentation, especially when using resource-limited edge hardware. Therefore, designing an improved, edge-efficient model for instance segmentation tasks related to spacecraft is crucial for ensuring the segmentation results are accurate and reliable within a cloud-edge IoT framework.
To resolve the issues of low segmentation accuracy, poor regression box positioning, and computational inefficiency on edge devices in traditional methods, this paper proposes an improved YOLOV8-based spacecraft instance segmentation model tailored for cloud-edge IoT environments. The model offers three key advantages:
(1)
The CSPPF module is used to enhance the backbone of the YOLOV8 model [4], which leverages pyramid pooling operations and cross-stage merging strategies for fusing multi-scale feature maps. This improvement greatly boosts the backbone network’s capability to extract information from feature maps, reducing missed or false detections in multi-target environments.
(2)
The head structure of the improved YOLOV8 model utilizes the WDIOU loss function as its primary box regression loss function. A non-linear and dynamic focusing strategy is utilized by this function to increase the model’s precision in locating target objects and enhancing mask quality in instance segmentation tasks, effectively addressing the limitations of the original YOLOV8 model and improving convergence speed.
(3)
To the best of our knowledge, this is the first lightweight instance segmentation model designed for spacecraft imagery within a cloud-edge IoT architecture, achieving a balanced trade-off between accuracy, speed, and deployability.
Experimental results indicate that the enhanced model outperforms the original YOLOV8 model, with mask precision (Pmask) improving by 2.1%, average recall (AR) by 1.3%, and mask average precision (mAPmask@0.5:0.95) by 1.7%. More importantly, the model maintains a compact size and efficient inference speed, making it suitable for the envisioned cloud-edge IoT architecture where edge intelligence is paramount. In addition, the reduced computational load and the gains in mAPmask and AR further enhance its practical relevance. The lower GFLOPs reduce energy consumption and processing latency, making the model more feasible for deployment on lightweight embedded or space-qualified hardware. The increase in mAPmask improves target identification reliability, reducing misclassification risk in critical tasks, while the increase in AR decreases missed detections, supporting more stable perception in applications such as autonomous rendezvous and orbital maintenance.

2. Related Works

2.1. Cloud-Edge IoT and Edge Intelligence

The convergence of IoT, cloud computing, and edge computing has given rise to the cloud-edge IoT paradigm [5]. This hierarchical architecture aims to optimize the processing of IoT-generated data by performing time-sensitive computations at the network edge, thereby reducing latency and bandwidth usage, while utilizing the cloud for resource-intensive batch processing and global management [6]. A key enabler of this paradigm is edge intelligence, which involves deploying lightweight AI models directly on edge devices [7]. In the context of spacecraft monitoring, IoT refers to the network of onboard sensors (e.g., cameras, LiDAR) and computing nodes that collect and process data in real-time. Our work contributes to this field by developing a high-accuracy, computationally efficient instance segmentation model for a challenging edge application: spacecraft image analysis. The model is designed to operate within a cloud-edge IoT architecture, where it processes images locally on the satellite (edge) and transmits only semantic results to the ground station (cloud), thereby reducing latency and bandwidth—a core IoT objective.

2.2. Instance Segmentation Methods

Due to the swift progress in deep learning, Instance segmentation based on deep learning has become a prominent research topic in computer vision. This approach has demonstrated considerable advantages for numerous practical applications, including scene understanding, image analysis, augmented reality, and video surveillance [8]. Deep learning-based instance segmentation approaches are generally classified into two types: two-stage and one-stage methods.

2.2.1. Two-Stage Methods

Two-stage methods typically decouple the tasks of object detection and mask prediction. Tan et al. [9] proposed a two-stage convolutional neural network (T-SCNN) that first identifies potential targets using the minimum bounding rectangle (MBR) method and then trains the network on extracted target images. Armstrong et al. [10] created a synthetic dataset to train a two-stage model for unmanned spacecraft segmentation. Hariharan et al. [11] introduced the SDS algorithm, which uses the Multiscale Combinatorial Grouping (MCG) algorithm [12] to select candidate regions, extracts features via CNN [13], classifies them with SVM [14], and applies NMS before final mask prediction. However, CNN-based feature extraction alone often resulted in loss of detail and positional information. Girshick et al. [15] proposed RCNN, which uses selective search for candidate regions, AlexNet [16] for feature extraction, and SVM for classification, improving feature representation but suffering from slow training and testing due to overlapping candidate boxes. He et al. [17] developed Mask RCNN from Faster-RCNN [18], adding a mask prediction branch and replacing RoI Pooling with RoI Align to achieve high-quality instance segmentation. Despite their effectiveness, these methods often involve complex multi-step processes. Gao et al. [19] proposed SSAP, introducing ‘instance category’ to map pixels directly to instance masks via a single classification. Ke et al. [20] introduced Mask Transfiner, using a multi-scale feature pyramid and sequence encoder to improve segmentation of small objects.
Despite the effectiveness of these methods in managing image details and spatial information, they still present certain drawbacks. For instance, the candidate regions produced during target detection could hinder segmentation accuracy. Moreover, these approaches typically require a two-step process: initial target detection followed by pixel-level segmentation. This sequential requirement necessitated multiple models and steps, thereby complicating implementation and incurring high computational costs, which is often prohibitive for real-time processing on edge devices.

2.2.2. One-Stage Methods

One-stage methods offer a direct mapping from input pixels to instance masks, enabling concurrent segmentation and detection with high speed and real-time performance, making them suitable for edge computing. Bolya et al. [21] proposed YOLACT, which uses an FPN to fuse backbone features. Its detection branch provides target category, bounding box, and mask confidence, while the segmentation branch generates a mask prototype map; the final result is produced by multiplying the two. YOLACT offers good speed and generalization but struggles with accurate positioning in multi-target overlapping scenes. To address issues like label rewriting and anchor imbalance in YOLOV3, Hurtik et al. [22] proposed Poly-YOLO, which uses a four-corner approximation for irregular polygon instance segmentation. It reduces parameters by 60% and improves average accuracy by 40% compared to YOLOV3, but increases post-processing complexity and remains suboptimal for small, irregular targets. He et al. [23] introduced FastInst, a query-driven single-stage method that dynamically selects semantic-rich pixel encodings as initial queries. It uses a two-path decoder to alternately update query and pixel features and a GT mask-guided learning mechanism, achieving 32.5 FPS and over 40% AP on the COCO dataset, outperforming most real-time models in speed and accuracy. Where the inherent speed of one-stage methods is a decisive advantage. It is worth noting that the pursuit of efficiency in this field is continuous. Very recently, Wang et al. [24] introduced YOLOv10, which further pushes the Pareto frontier of accuracy and latency for real-time object detection through comprehensive architectural and optimization strategies, setting a new benchmark for lightweight models. Although our work focuses on the specific challenges of spacecraft imagery, the design principles behind YOLOv10 provide valuable insights for future edge-oriented model compression. For instance, enhanced versions of YOLOv10 have been developed for specialized monitoring tasks such as underwater ecological surveying [25] and construction site safety inspection [26], demonstrating the framework’s versatility. Similarly, the YOLOv8-seg architecture has been successfully tailored for precise instance segmentation in agricultural domains, such as plant disease identification [27], highlighting the critical role of efficient, specialized models in resource-constrained edge environments. Beyond the continual evolution of CNN and Transformer-based architectures, the recent emergence of state-space models (SSMs), particularly the Mamba architecture, has shown remarkable potential for efficient long-range dependency modeling. Initially achieving success in medical image segmentation [28], the principles of Mamba are being actively explored for broader vision tasks, including super-resolution and semi-supervised learning [29]. Very recently, hybrid designs like Rose-Mamba-YOLO [30] have begun to integrate Mamba’s efficient sequence modeling strengths into the YOLO framework, suggesting a promising future direction for building even more powerful and efficient backbone networks for edge-deployed instance segmentation models.
The evolution of one-stage methods highlights a consistent drive towards higher efficiency and accuracy. Our work continues this trajectory by building upon the YOLOV8 framework, which itself represents a state-of-the-art balance in the one-stage family. We specifically enhance YOLOV8 to address the challenges of spacecraft imagery, with a constant view towards its eventual deployment in resource-constrained cloud-edge IoT environments, where the inherent speed of one-stage methods is a decisive advantage.

3. Proposed Model

3.1. Cloud-Edge IoT Architecture for Spacecraft Monitoring

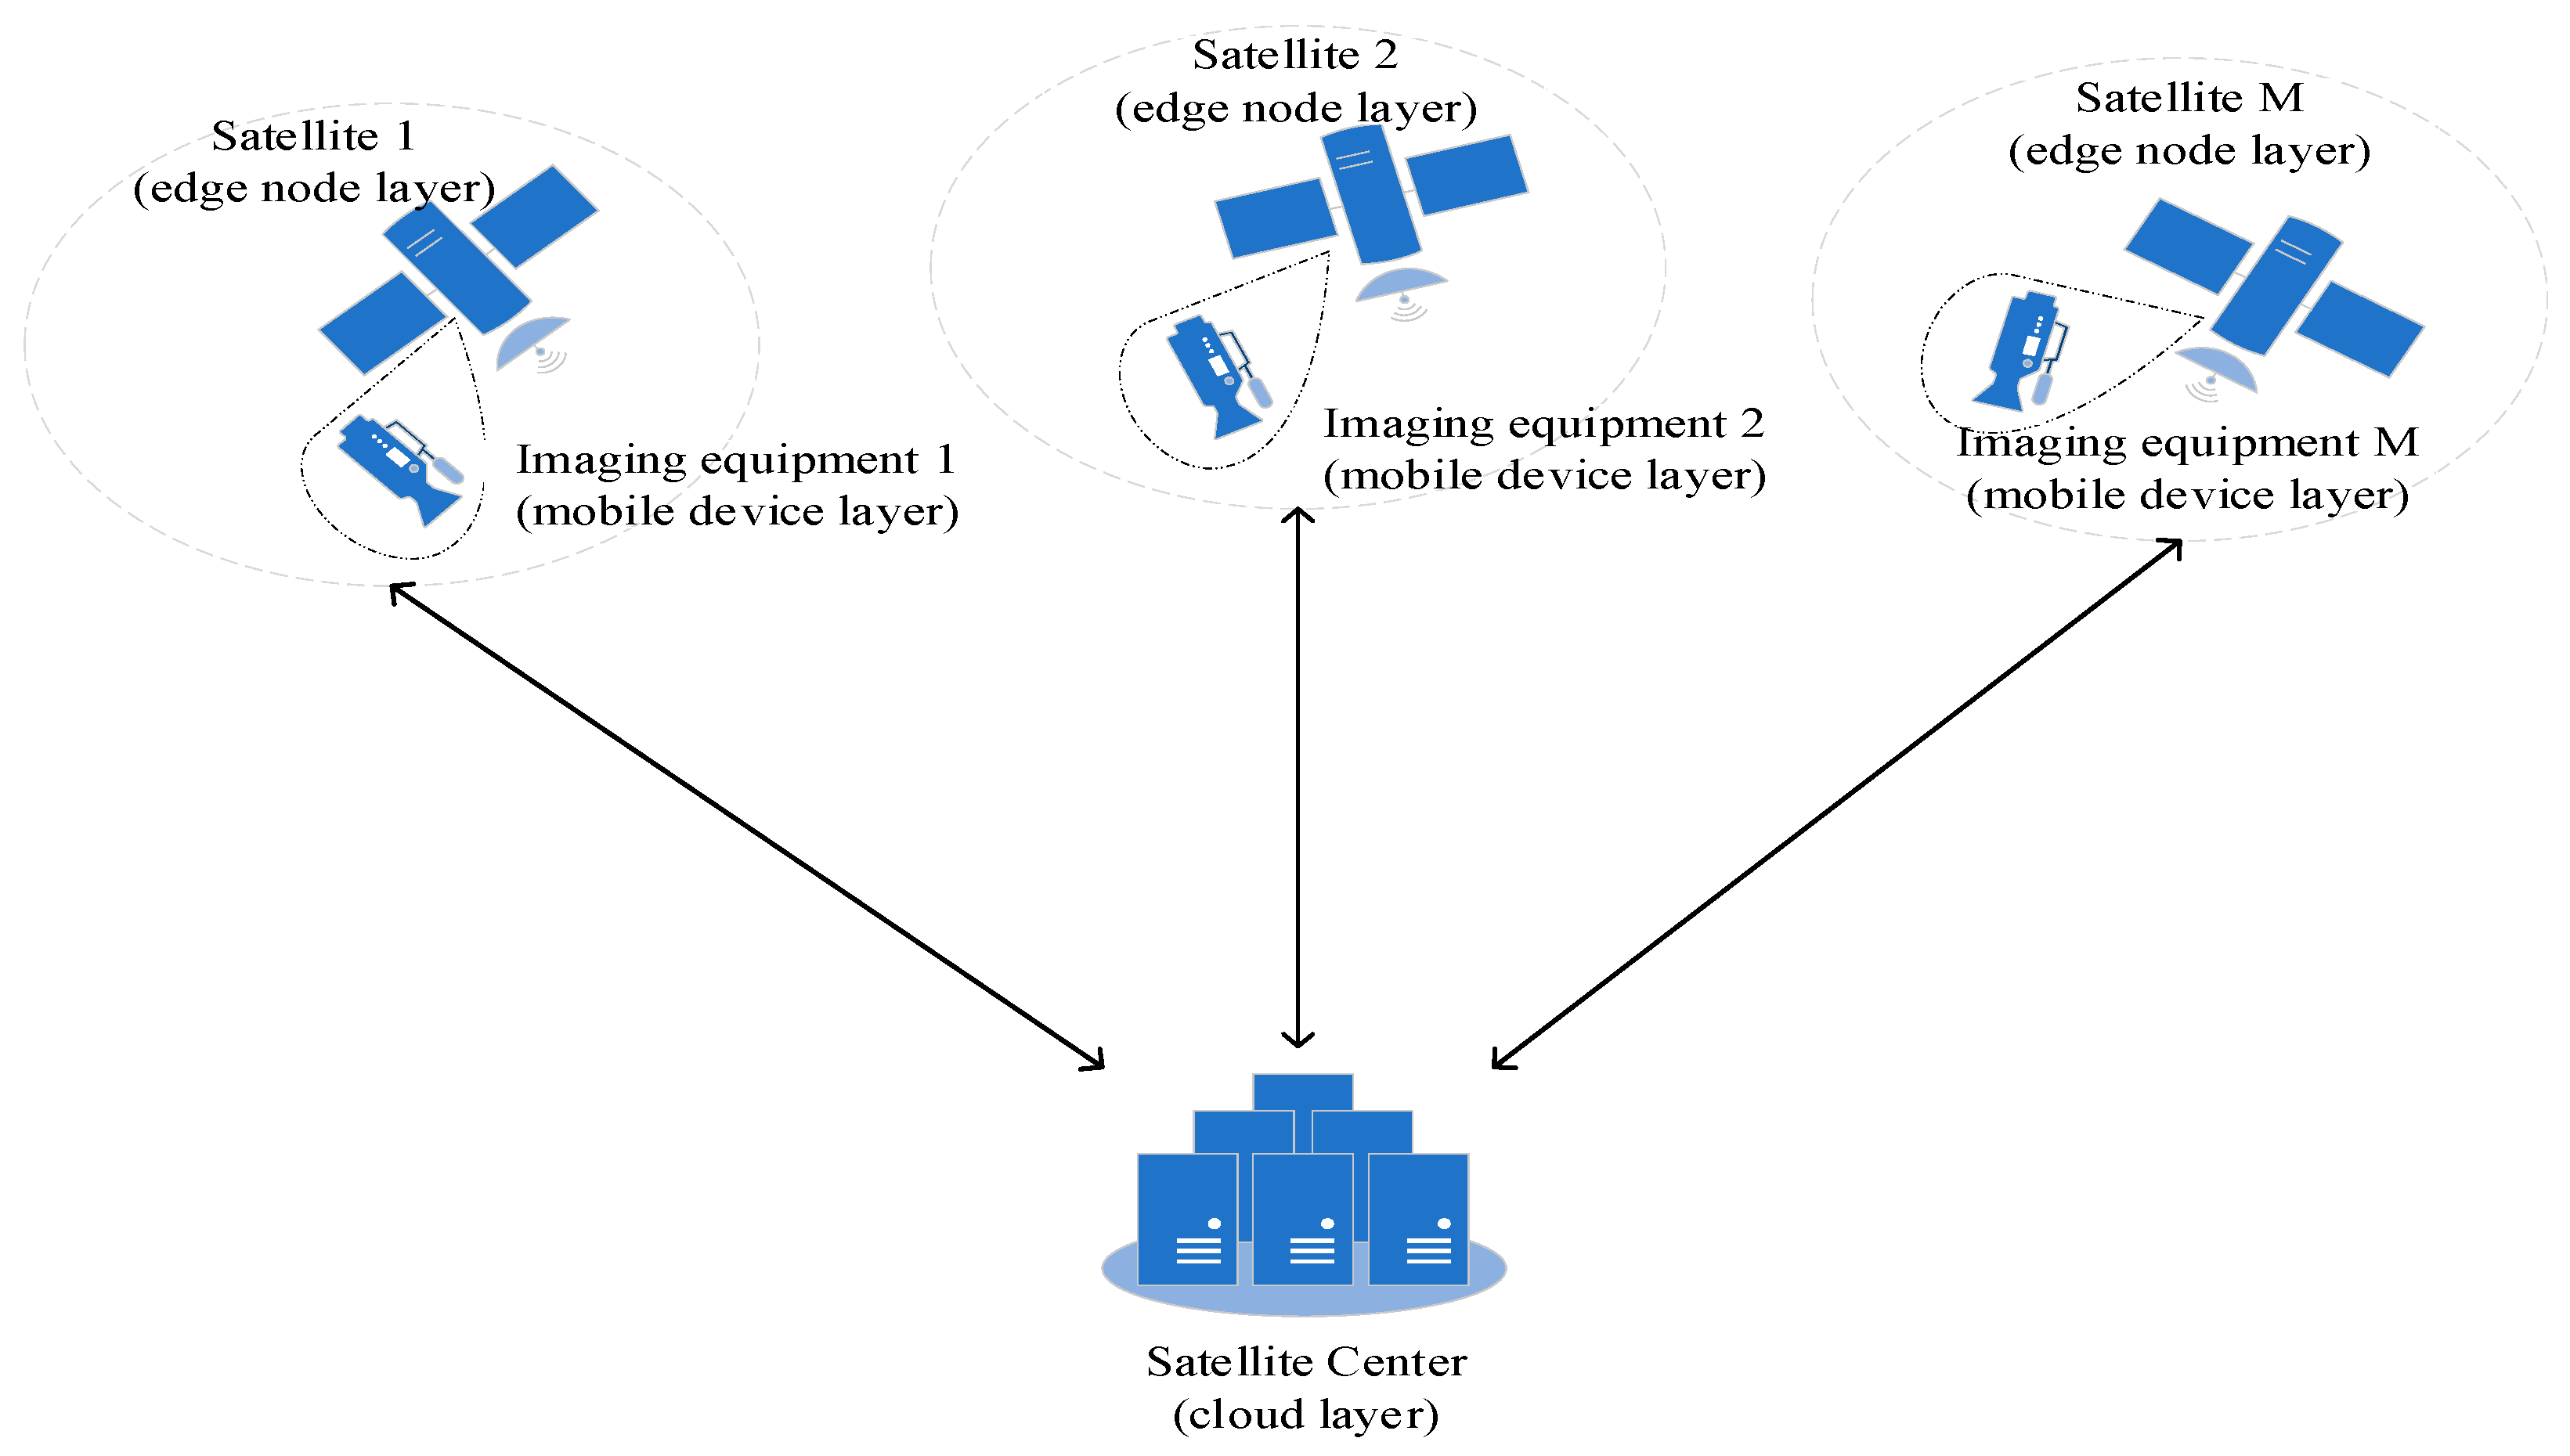
Our proposed system follows a hierarchical cloud-edge IoT architecture tailored for autonomous spacecraft monitoring and on-orbit servicing. As shown in Figure 1, The architecture consists of three layers:
Mobile Device Layer (Imaging Equipment): This layer is responsible for capturing high-resolution images via onboard cameras or sensors deployed on spacecraft or orbital platforms. It serves as the front-end data acquisition interface, with no local inference capability, and transmits raw image data to the edge node layer for processing.
Edge Node Layer (Satellite/Orbital Platform): Equipped with lightweight computing hardware (e.g., NVIDIA Jetson Orin, FPGA, or radiation-hardened processors), this layer runs our improved YOLOv8 model in real-time for instance segmentation. Only the compressed segmentation masks (binary or run-length encoded) and metadata (class labels, confidence scores, bounding box coordinates, and timestamps) are transmitted to the cloud.
Cloud Layer (Ground Station/Satellite Center): Receives and aggregates data from multiple edge nodes, performs deep analysis, long-term storage, model retraining, and global mission planning. Updated models can be pushed back to edge devices periodically.
This architecture directly addresses the IoT-based spacecraft monitoring scenario by embedding intelligence at the edge, enabling real-time decision-making while leveraging the cloud for scalability and management—a core tenet of cloud-edge IoT. Finally, the advantage of this design in reducing computational complexity stems from the algorithm itself and does not rely on any specific GPU hardware-specific acceleration units. Therefore, it can be directly migrated to simpler or more specialized hardware platforms.

3.2. Algorithm Details

Cloud-Edge Deployment Strategy: In our proposed system architecture, the trained model is deployed on an edge device (e.g., a satellite processor). The device performs real-time instance segmentation on captured images. Only the resulting segmentation masks and metadata are transmitted to the cloud for further analysis, storage, or visualization. This strategy dramatically reduces the uplink bandwidth requirement compared to streaming raw video and minimizes latency for critical on-orbit decisions.
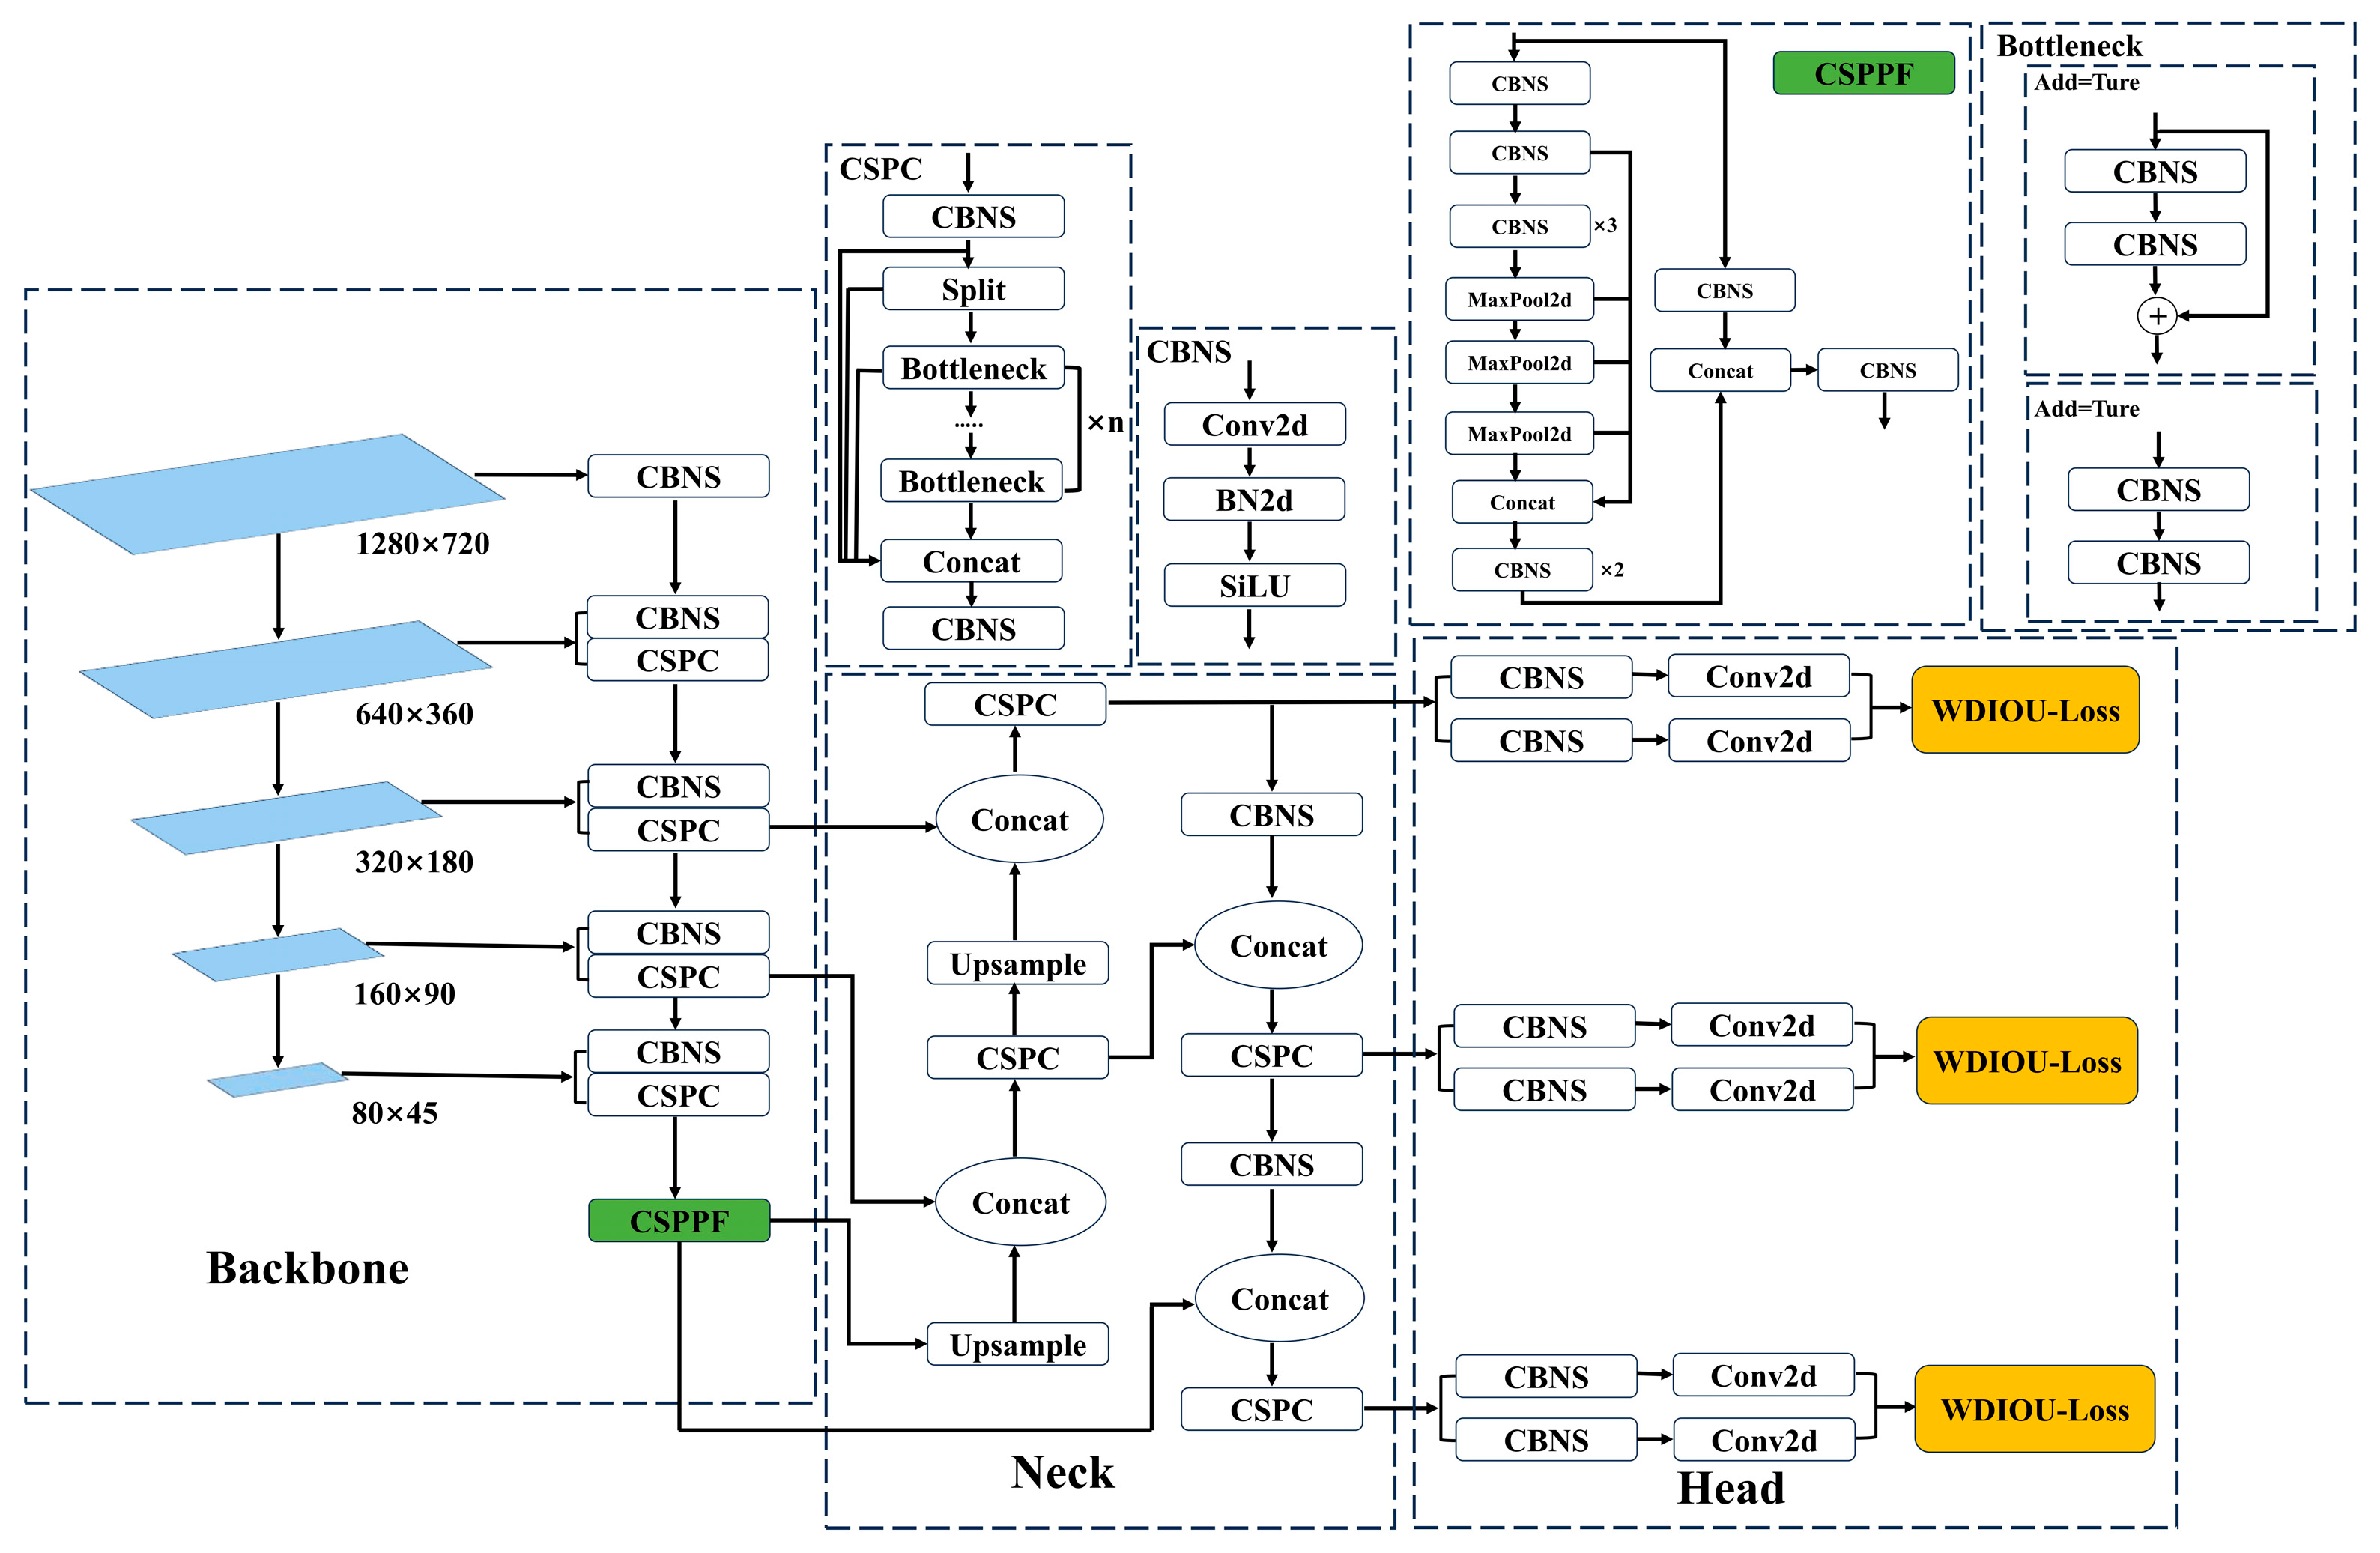
An improved YOLOV8-based model for spacecraft instance segmentation in cloud-edge IoT environments is presented in this paper. The model includes three main parts: (1) Backbone: The backbone serves as the foundation of the network, responsible for extracting advanced semantic features. This paper proposes the integration of the CSPPF structure into the backbone, which employs a cross-stage feature fusion strategy to enhance feature variability across different levels. This enhancement not only bolsters the backbone’s feature extraction capability but also mitigates the overfitting risk during network training. Consequently, it addresses the challenges of misidentifying target objects in YOLOV8 in multi-target scenarios and ensures that the network maintains robust segmentation performance even in challenging situations. (2) Neck: The neck acts as a connector between the backbone and the head structure, facilitating the extraction and fusion of feature maps produced by the backbone. This process enriches the context information available for subsequent segmentation tasks, which is crucial for accurate edge-based inference. (3) Head: The head constitutes the final output part of the entire network and is responsible for predicting and calculating the loss value. WDIOU serves as the overall regression box loss function by combining the WIOU and Dual Focal Loss (DFL) functions. This method boosts the model’s ability to understand the shape and location of target objects during training, thus enhancing detection precision and dependability while promoting faster convergence. Figure 2 shows the complete architecture of the models. Project code [31]: https://github.com/cehndashuai/yolov8_pro_cssp.git (accessed on 13 January 2026).

3.2.1. CSPPF Module

The SPPF (Spatial Pyramid Pooling Fast) module in the original YOLOV8 model is widely utilized for feature fusion. Although it can help integrate features from different levels, it does not adequately incorporate high-level semantic information in a computationally efficient manner. Consequently, the resulting feature maps may exhibit a deficiency in contextual richness without a significant gain in feature representation diversity per computational unit. This deficiency can confuse the detector, resulting in missed detections and false alarms, which negatively impacts accuracy in complex environments and wastes the limited processing capabilities of edge devices.
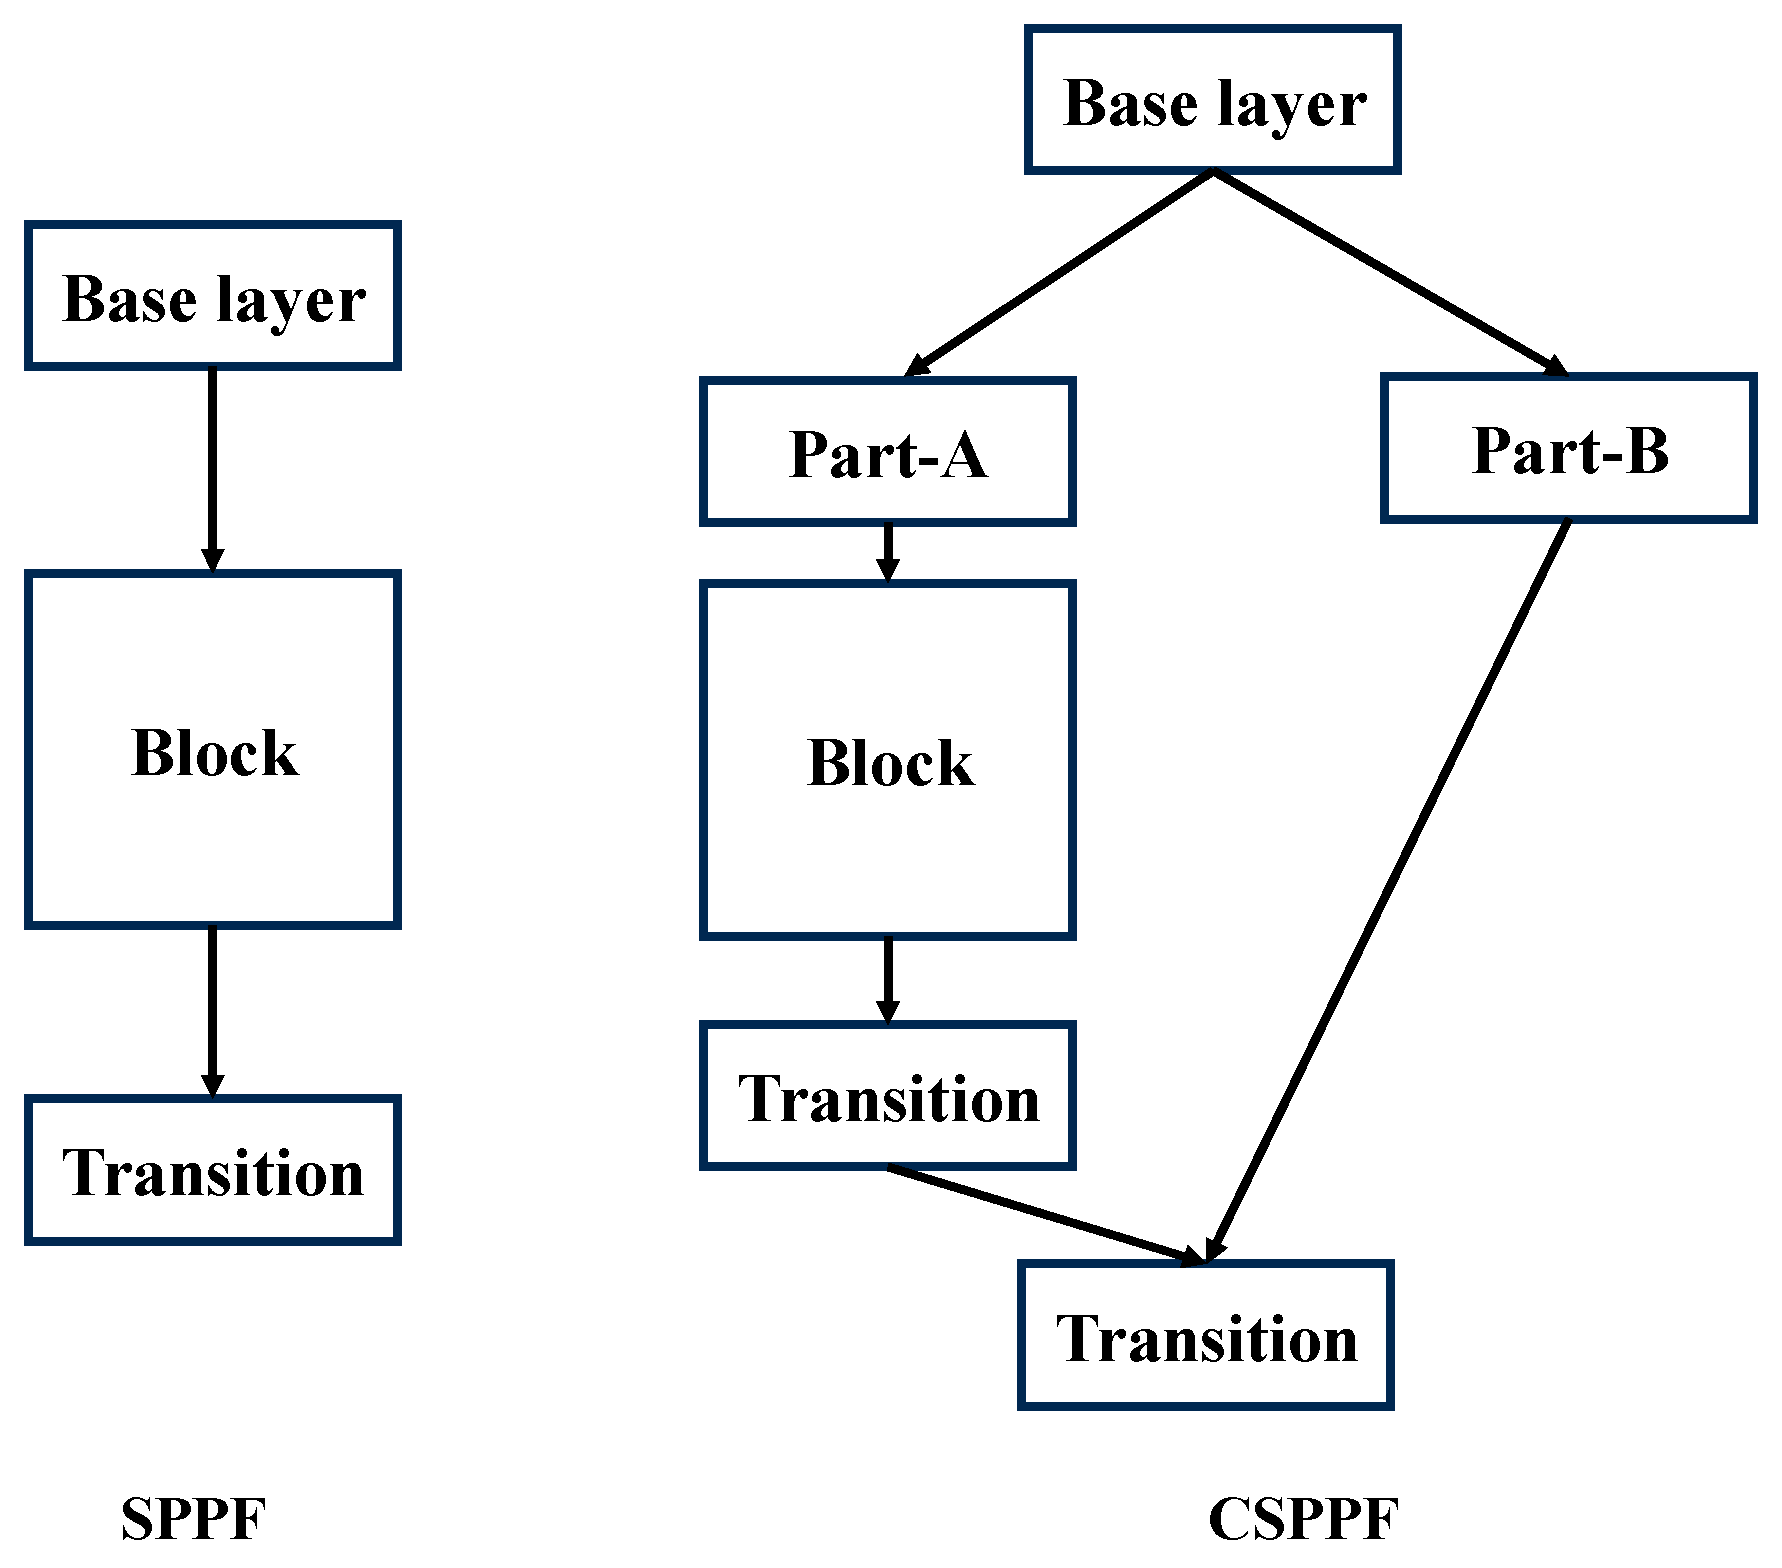
To tackle this issue, we introduced a CSPPF (Cross Stage Partial Spatial Pyramid Pooling Fast) module. Unlike the SPPF module, the CSPPF uses a cross-stage partial strategy that significantly reduces the likelihood of data redundancy during the information integration process. This method improves the integration of semantic information across multiple levels, allowing the detector to acquire advanced and intricate semantic insights, thus enhancing the precision of detecting multiple objects and boosting the network’s ability to learn. Figure 3 shows a comparison of the feature fusion strategies in SPPF and CSPPF.
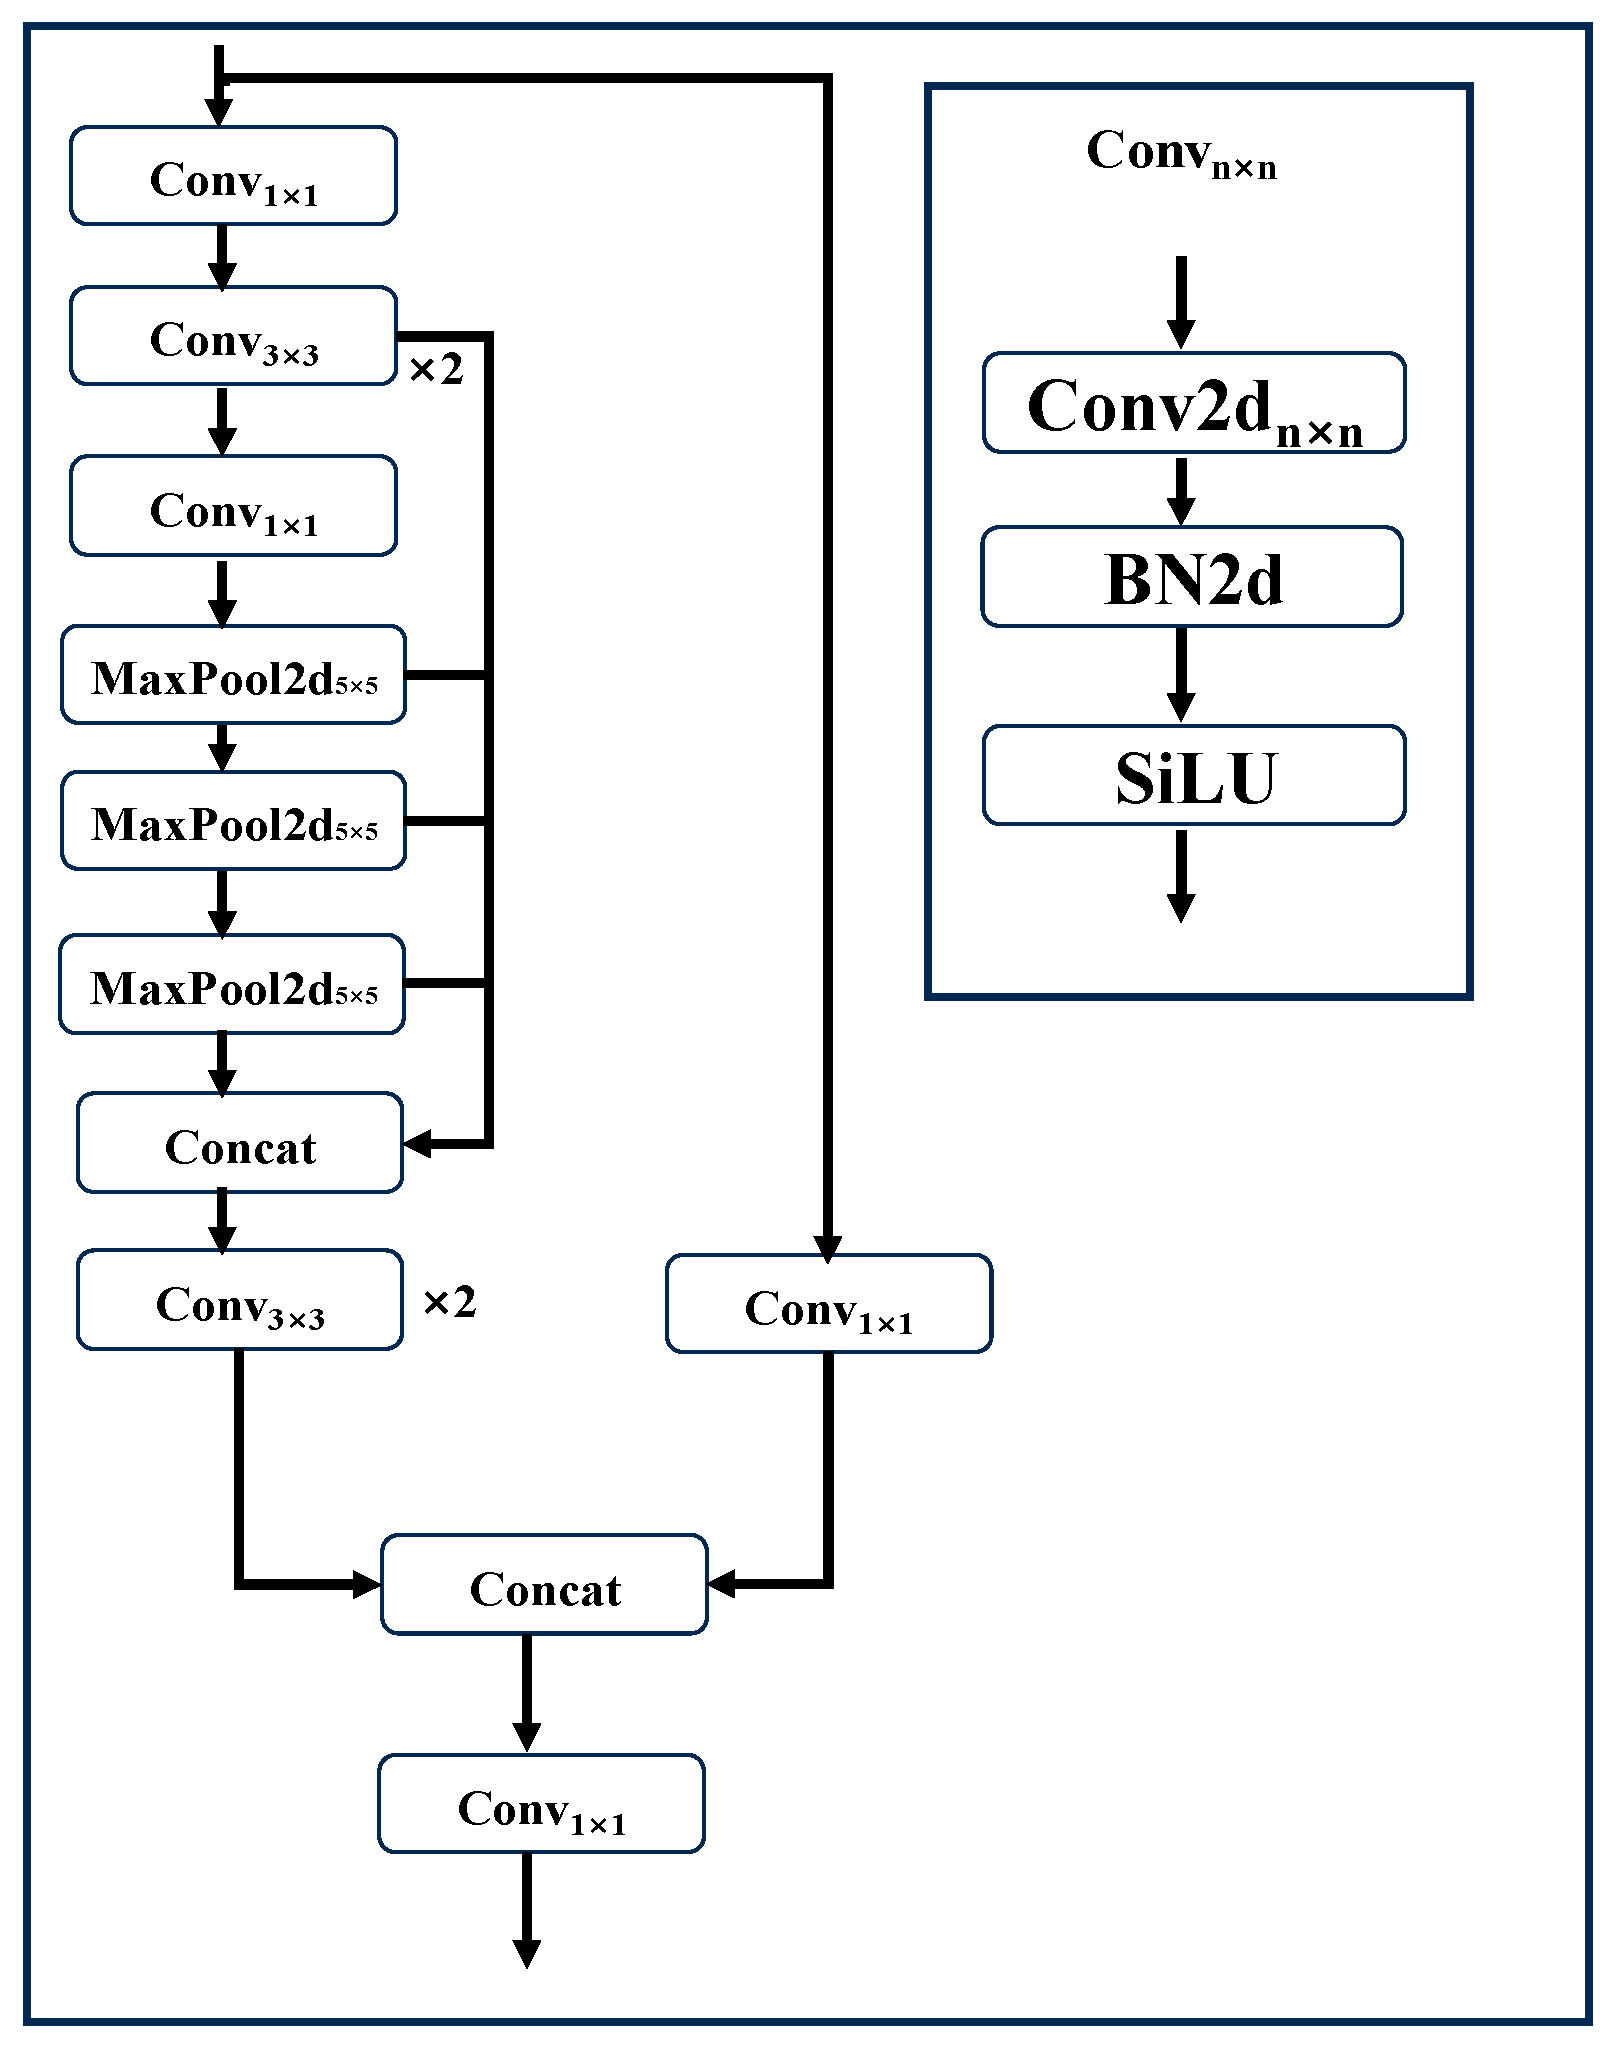
The design of the CSPPF module is shown in Figure 4. This module employs pyramid pooling operations, where feature maps at different scales are pooled separately. This pooling process effectively extracts feature information from each scale. Subsequently, a fixed-dimensional feature vector is created by concatenating the pooled feature maps. This approach facilitates the integration of both local and global features at the feature map level while maintaining spatial information, thus preventing the loss of location data for target objects. The design of the CSPPF module emphasizes not only the extraction and fusion of feature information but also aims to improve the model’s identify capability in a multi-object environment under computational constraints. By utilizing the pyramid pooling operations, the model can more effectively capture features of various target objects, therefore increasing the accuracy and reliability of detection. In addition, the CSPPF module incorporates a hierarchical feature fusion mechanism, which ensures effective integration of feature information across different levels, thereby bolstering the model’s generalization capability. To stop different layers from repeatedly learning the same gradient information, the CSPPF module truncates gradient flow, which improves training efficiency and overall performance. Finally, the advantage of this design in reducing computational complexity stems from the algorithm itself and does not rely on any specific GPU hardware-specific acceleration units. Therefore, its efficiency advantage is hardware-platform independent and can be directly migrated to simpler or more specialized hardware platforms.
The detailed calculation process of the CSPPF module is outlined as follows:
(1)
Let the input image be X. X undergoes convolution, batch normalization, and SiLU activation to obtain Z1. This operation effectively extracts complex and high-order features and serves as a foundation for the following stage of feature fusion. The detailed process is illustrated in Equation (1):
Z 1 = S i L U ( B N ( C o n v 3 × 3 ( S i L U ( B N ( C o n v 3 × 3 ( S i L U ( B N ( C o n v 1 × 1 ( X ) ) ) ) ) ) ) ) )
where C o n v 1 × 1 is a 1 × 1 convolution layer, while C o n v 3 × 3 is a 3 × 3 convolution layer. BN() is used for batch normalization; SiLU() is a SiLU activation function.
(2)
After the convolution operation on Z1, batch normalization combined with SiLU activation is performed, followed by three down-sampling operations to obtain H1, H2, and H3. Finally, H1, H2, and H3 are concatenated to obtain H4. The specific process is illustrated in Equation (2):
H 1 = M a x P o o l 2 d ( S i L U ( B N ( C o n v 1 × 1 ( Z 1 ) ) ) ) H 2 = M a x P o o l 2 d ( H 1 ) H 3 = M a x P ool 2 d ( H 2 ) H 4 = c o n c a t ( H 1 , H 2 , H 3 )
where MaxPool2d() is the maximum pooling function with a window of 5 × 5, and concat() is a concatenation function.
(3)
H5 was obtained after concatenating H1, H2, H3, and Z1 and performing convolutions, batch normalization, and SiLU activation function operations. The specific process is illustrated in Equation (3):
H 5 = S i L U ( B N ( C o n v 3 × 3 ( S i L U ( B N ( C o n v 3 × 3 ( c o n c a t ( H 1 , H 2 , H 3 , Z 1 ) ) ) ) ) ) )
(4)
The input X undergoes convolution, batch normalization, and SiLU activation, followed by concatenation with H5. Then the result is then convolved, batch normalized, and SiLU activated to obtain H6. The specific process is shown in Equation (4):
H 6 = S i L U ( B N ( C o n v 1 × 1 ( c o n c a t ( H 5 , S i L U ( B N ( C o n v 1 × 1 ( X ) ) ) ) ) ) )

3.2.2. WDIOU Loss Function

The overall loss function in instance segmentation for the YOLOV8 model is based on the regression box loss and the mask loss, as shown:
L o s s = L o s s b _ b o x + L o s s m a s k
where Loss is the model’s overall loss function, L o s s b _ b o x represents the regression detection box loss, and L o s s m a s k represents the mask loss.
The regression detection box loss function in the original YOLOV8 structure uses Complete Intersection over Union (CIOU)-Loss and DFL. CIOU-Loss aims to predict an entirely accurate label value. However, in real-world scenarios, object boundaries are often unclear. Furthermore, CIOU-Loss does not explicitly consider the balance between difficult and easy samples, which can impede the model’s convergence speed and final accuracy.
To address these issues and better suit our cloud-edge IoT scenario, which demands efficient and robust learning, the proposed method in this paper replaces the original box loss with the WDIOU loss function. WDIOU combines a WIOU component with the DFL. The WIOU employs a dynamic non-monotonic focusing mechanism. Instead of relying solely on IoU, it uses an “outlier” metric to assess the quality of anchor boxes, thereby providing a more intelligent strategy for gradient gain allocation. This approach reduces the excessive influence of high-quality easy examples while mitigating the negative impact of low-quality outliers. This allows the model to focus more on anchor boxes of normal quality during training, leading to more stable convergence and better generalization—a key requirement for models operating in the varied and unpredictable environment of space. The process is specifically illustrated in Equations (6) and (7):
L o s s W I O U = exp [ ( x x G T ) 2 + ( y y G T ) 2 ( W G 2 + H G 2 ) ] × L o s s I O U × r
r = β α β φ φ
where x and y are the coordinate values of the center point of the model prediction box; xGT and yGT are the coordinate values of the center point of the real box, r is the gradient gain of the model; W G and H G are the closed anchor box’s minimum width and height, respectively; β is the outlier degree, with its value controlled by the two hyperparameters α and φ .
The global mask loss was calculated using Binary Cross-Entropy (BCE) Loss. The specific process is illustrated in Equation (8):
L o s s B C E = 1 N × i = 1 N [ y i log ( p i ) + ( 1 y i ) log ( 1 p i ) ]
where N is the total samples count. y i is the actual label for the i-th sample, and p i is the likelihood that the i-th sample is classified as a positive sample.

4. Experiment

4.1. Experimental Parameters

Training and testing were conducted in the same environment, with the following hardware configuration parameters: NVIDIA GeForce RTX 4060 8 G, Intel(R) Core(TM) i5-14600KF, 32 GB memory. The following software configuration parameters: Windows 11 operating system, CUDA 11.8, Python 3.8, and pytorch 2.0.1. Note: Due to the lack of a real-world environment, the RTX 4060 was only intended to simulate resource-constrained development/testing environments and was not intended to simulate aerospace-grade hardware.
The method of stochastic gradient descent (SGD) was applied, starting with a learning rate of 0.01. The model’s configuration included a momentum factor of 0.937, a regularization coefficient of 0.0005, an input image resolution of 1280 × 720, a batch size of 16, and training over 150 epochs.

4.2. Evaluation Metrics

The study employed Pmask, AR, and mAPmask@0.5:0.95% as metrics for evaluation. Meanwhile, to assess edge efficiency, we also considered Model Size and GFLOPs on a hardware platform with limited resources.
Pmask indicated the percentage of samples that were truly positive out of all those predicted to be positive. The specific process is displayed in Equation (9):
P m a s k = T P T P + F P
TP is the number of samples correctly identified as positive, while FP is the number of samples that were truly negative but mistakenly identified as positive. AR represents the top Recall calculated when a fixed count of prediction boxes was detected in each image and then averaged by different IOU thresholds. The specific process is depicted in Equation (10):
Re c a l l = T P T P + F N A R = 1 N i = 1 N Re c a l l i
FN stands for the incorrectly identified negative samples, while N indicates the count of IOU thresholds.
mAPmask@0.5:0.95% indicated that the ratio of the overlap area to the combined area of the predicted and labeled boxes started from 0.5 to 0.95, and the average precision value (AP) was calculated every 0.05, and then the calculated results were averaged. The specific process is shown in Equation (11):
m A P m a s k = 1 c o u n t n = 1 c o u n t 0 1 P n ( r ) d r
where count is the total number of instance segmentation categories in the dataset and Pn is the average precision of the segmentation target category.

4.3. Experimental Dataset

A total of 1300 images with good image quality, moderate illumination, and high clarity were selected from the SDDSP dataset [32], which served as the foundational data for subsequent training and verification processes. The Labelme annotation tool was used for manual annotation to enhance the accuracy of spacecraft instance segmentation. After annotation, 1410 spacecraft instance segmentation targets were identified, which served as supporting data for subsequent model training. Regarding dataset allocation, a training set of 1000 images was selected for the instance segmentation model, while a set of 300 images was employed as a validation set to test the model’s performance and generalization.
We followed the official default configuration of the YOLOV8 benchmark model for data preprocessing and data augmentation. During training, the model automatically applied standard augmentation strategies, including random flipping, scaling, and color dithering. During validation and testing, all augmentations were disabled, and only the input images were scaled proportionally to a fixed size and normalized. This setup ensured that all comparative experiments (between the benchmark model and our improved model) were conducted under exactly the same preprocessing conditions, allowing performance differences to be directly attributed to changes in the network architecture.

4.4. Ablation Study

In order to verify the effects of different improvements, this paper conducted ablation experiments. As depicted in Table 1, the YOLOV8 + WDIOU model achieved better evaluation metrics than YOLOV8 + CIOU, with Pmask increasing by 0.6%, AR by 0.7%, and mAPmask@0.5:0.95 by 0.4% compared with YOLOV8. Here the bold text indicated the best result. Table 2, Table 3 and Table 4 were the same as above.
Table 1. The impact of different modules.
ModelEpochPmask%AR%mAPmask@0.5:0.95%
YOLOV8 + CIOU15091.888.891.9
YOLOV8 + WDIOU15092.489.592.3
YOLOV8 + WDIOU + CSPPF15093.990.193.6
Subsequently, the CSPPF module was integrated into YOLOV8 + WDIOU, the YOLOV8 + WDIOU + CSPPF model demonstrated enhancements in the evaluation metrics, with Pmask increasing by 1.5%, AR by 0.6%, and mAPmask@0.5:0.95 by 1.3% compared with YOLOV8 + WDIOU. Furthermore, the model showed improvements in Pmask by 2.1%, AR by 1.3%, and mAPmask@0.5:0.95 by 1.7% compared with the original YOLOV8.

4.5. Comparison of Different Models

The improved YOLOV8 model was compared against the baseline model YOLOV8 and other prominent models (Yolact, Yolact++, YOLOV5, YOLOV9 and YOLOV12). All models were trained for 150 epochs in the same experimental environment until they reached convergence. As shown in Table 2, the improved YOLOV8 model demonstrated superior performance in the spacecraft instance segmentation task. Compared with the baseline model YOLOV8 [4], Yolact [21], Yolact++ [33], YOLOV5 [34], YOLOV9 [35], and YOLOV12 [36], the evaluation metric Pmask increased by 2.1%, 22.1%, 14.4%, 3.4%, 0.9% and 0.7%,, respectively. Additionally, AR increased by 1.3%, 20.1%, 17.6%, 10.1%, 2.9%, and 1.7%, respectively, while mAPmask@0.5:0.95 increased by 1.7%, 23.1%, 17.7%, 27.3%, 19.2%, and 0.9% respectively. Collectively, these results underscore the advantages of this improved YOLOV8 model in spacecraft instance segmentation. In contrast, although YOLOV9 had a high Pmask (mask accuracy) of 93.0%, its mAPmask was only 74.4%, indicating that although its detection results were accurate, they were not comprehensive and stable enough, and there might be a large number of missed detections or inaccurate positioning issues. The mAPmask of YOLOV5 was as low as 66.3%, indicating a significant difference in segmentation quality compared to other models. YOLOV12 was a powerful model that performed well in precision (Pmask) and outperforms YOLOV5 and YOLOV9 in overall performance, but it still failed to address its minor weaknesses in recall (AR) relative to the YOLOV8 baseline. In the end, it was comprehensively surpassed in metrics by the targeted optimization model in this paper. The AR of our algorithm reached 90.1%, which meant that the model had the strongest ability to “find everything” and the lowest missed detection rate. This was crucial in multi-objective scenarios, such as multiple spacecraft components.
Table 2. Comparison of segmentation effects of different models.
ModelEpochPmask%AR%mAPmask@0.5:0.95%
Yolact15071.870.070.5
Yolact++15079.572.575.9
YOLOV515090.580.066.3
YOLOV915093.087.274.4
YOLOV1215093.288.492.7
YOLOV8(baseline)15091.888.891.9
Ours15093.990.193.6
To further substantiate the model’s suitability for cloud-edge IoT deployments, we provided a comparative analysis of computational efficiency, a critical metric for edge devices. As depicted in Table 3, we evaluated the model size (in Megabytes, MB), GFLOPs and inference time on a single NVIDIA GeForce RTX 4060 GPU to simulate a constrained edge computing environment. While our proposed model had a slightly increased parameter count compared to the original YOLOV8 due to the enhanced feature fusion in the CSPPF module, its computational complexity (GFLOPs) and inference time had indeed decreased, mainly due to the optimization of the network structure by the CSPPF module. It significantly reduced redundant calculations through cross stage partial connections and gradient flow truncation, thereby increasing the model’s expressive power (increasing the number of parameters) while reducing the computational burden of single inference. As shown in Table 2, this improvement resulted in a comprehensive performance leap of 2.1% increased in Pmask, 1.3% increase in AR, and 1.7% increase in mAPmask. This was an extremely efficient and cost-effective improvement. While the practical value of the obtained accuracy gains, while seemingly modest in percentage terms, is magnified by the exceptional reliability requirements of space missions. In critical on-orbit servicing tasks—such as autonomous rendezvous with a non-cooperative target, precision capture of space debris, or detailed inspection of a spacecraft’s exterior—the consequences of a single missed detection or a misaligned bounding box can be catastrophic. The increase in AR signifies a reduction in the probability of overlooking small or occluded components. Similarly, the improvement in mask precision supports more accurate pixel-level understanding of target geometry, which is fundamental for robust relative pose estimation. In this high-risk, high-cost domain, even incremental improvements in algorithmic reliability contribute significantly to overall mission success and safety. On the other hand, YOLOV12 exceled in model lightweighting, with fewer parameters (2.86 M), lower computational cost (9.9 GFLOPs) and shorter reasoning time (22.7 ms) compared to our model (4.05 M, 11.7 GFLOPs, 26.3 ms), indicating higher theoretical computational efficiency in resource-constrained environments, our model achieved significant overall performance improvements with an acceptable increase in computational overhead: in spacecraft instance segmentation, mAPmask@0.5:0.95% was 0.9% higher than YOLOV12, AR was improved by 1.7%, and Pmask was improved by 0.7%. Particularly in multi-object and complex background scenarios, our model exhibited stronger robustness. Therefore, our model achieved a better balance between computational efficiency and segmentation accuracy, making it particularly suitable for cloud-edge IoT tasks that required high segmentation accuracy while still being able to run on edge devices. If future tasks imposed stricter constraints on computing resources, the model could be further compressed through quantization, pruning, and other means. YOLOV12 was more suitable for scenarios with extremely high real-time requirements but for which a certain degree of accuracy loss was acceptable. In addition, We further evaluated scalability on lower-resource hardware (Jetson Nano 4 GB) using TensorRT optimization. Our model achieved 6.8 FPS with INT8 quantization, demonstrating its deployability on actual edge devices. This confirms that our improvements do not compromise real-time performance, making it suitable for scalable cloud-edge IoT deployments.
Table 3. Comparison of segmentation performance of different models.
ModelLayersParametersGFLOPsInference Time (ms)
YOLOV81513.4112.138.6
YOLOV93802.7814.929.3
YOLOV122942.869.922.7
Ours1654.0511.726.3

4.6. Comparison of Model Prediction Effects

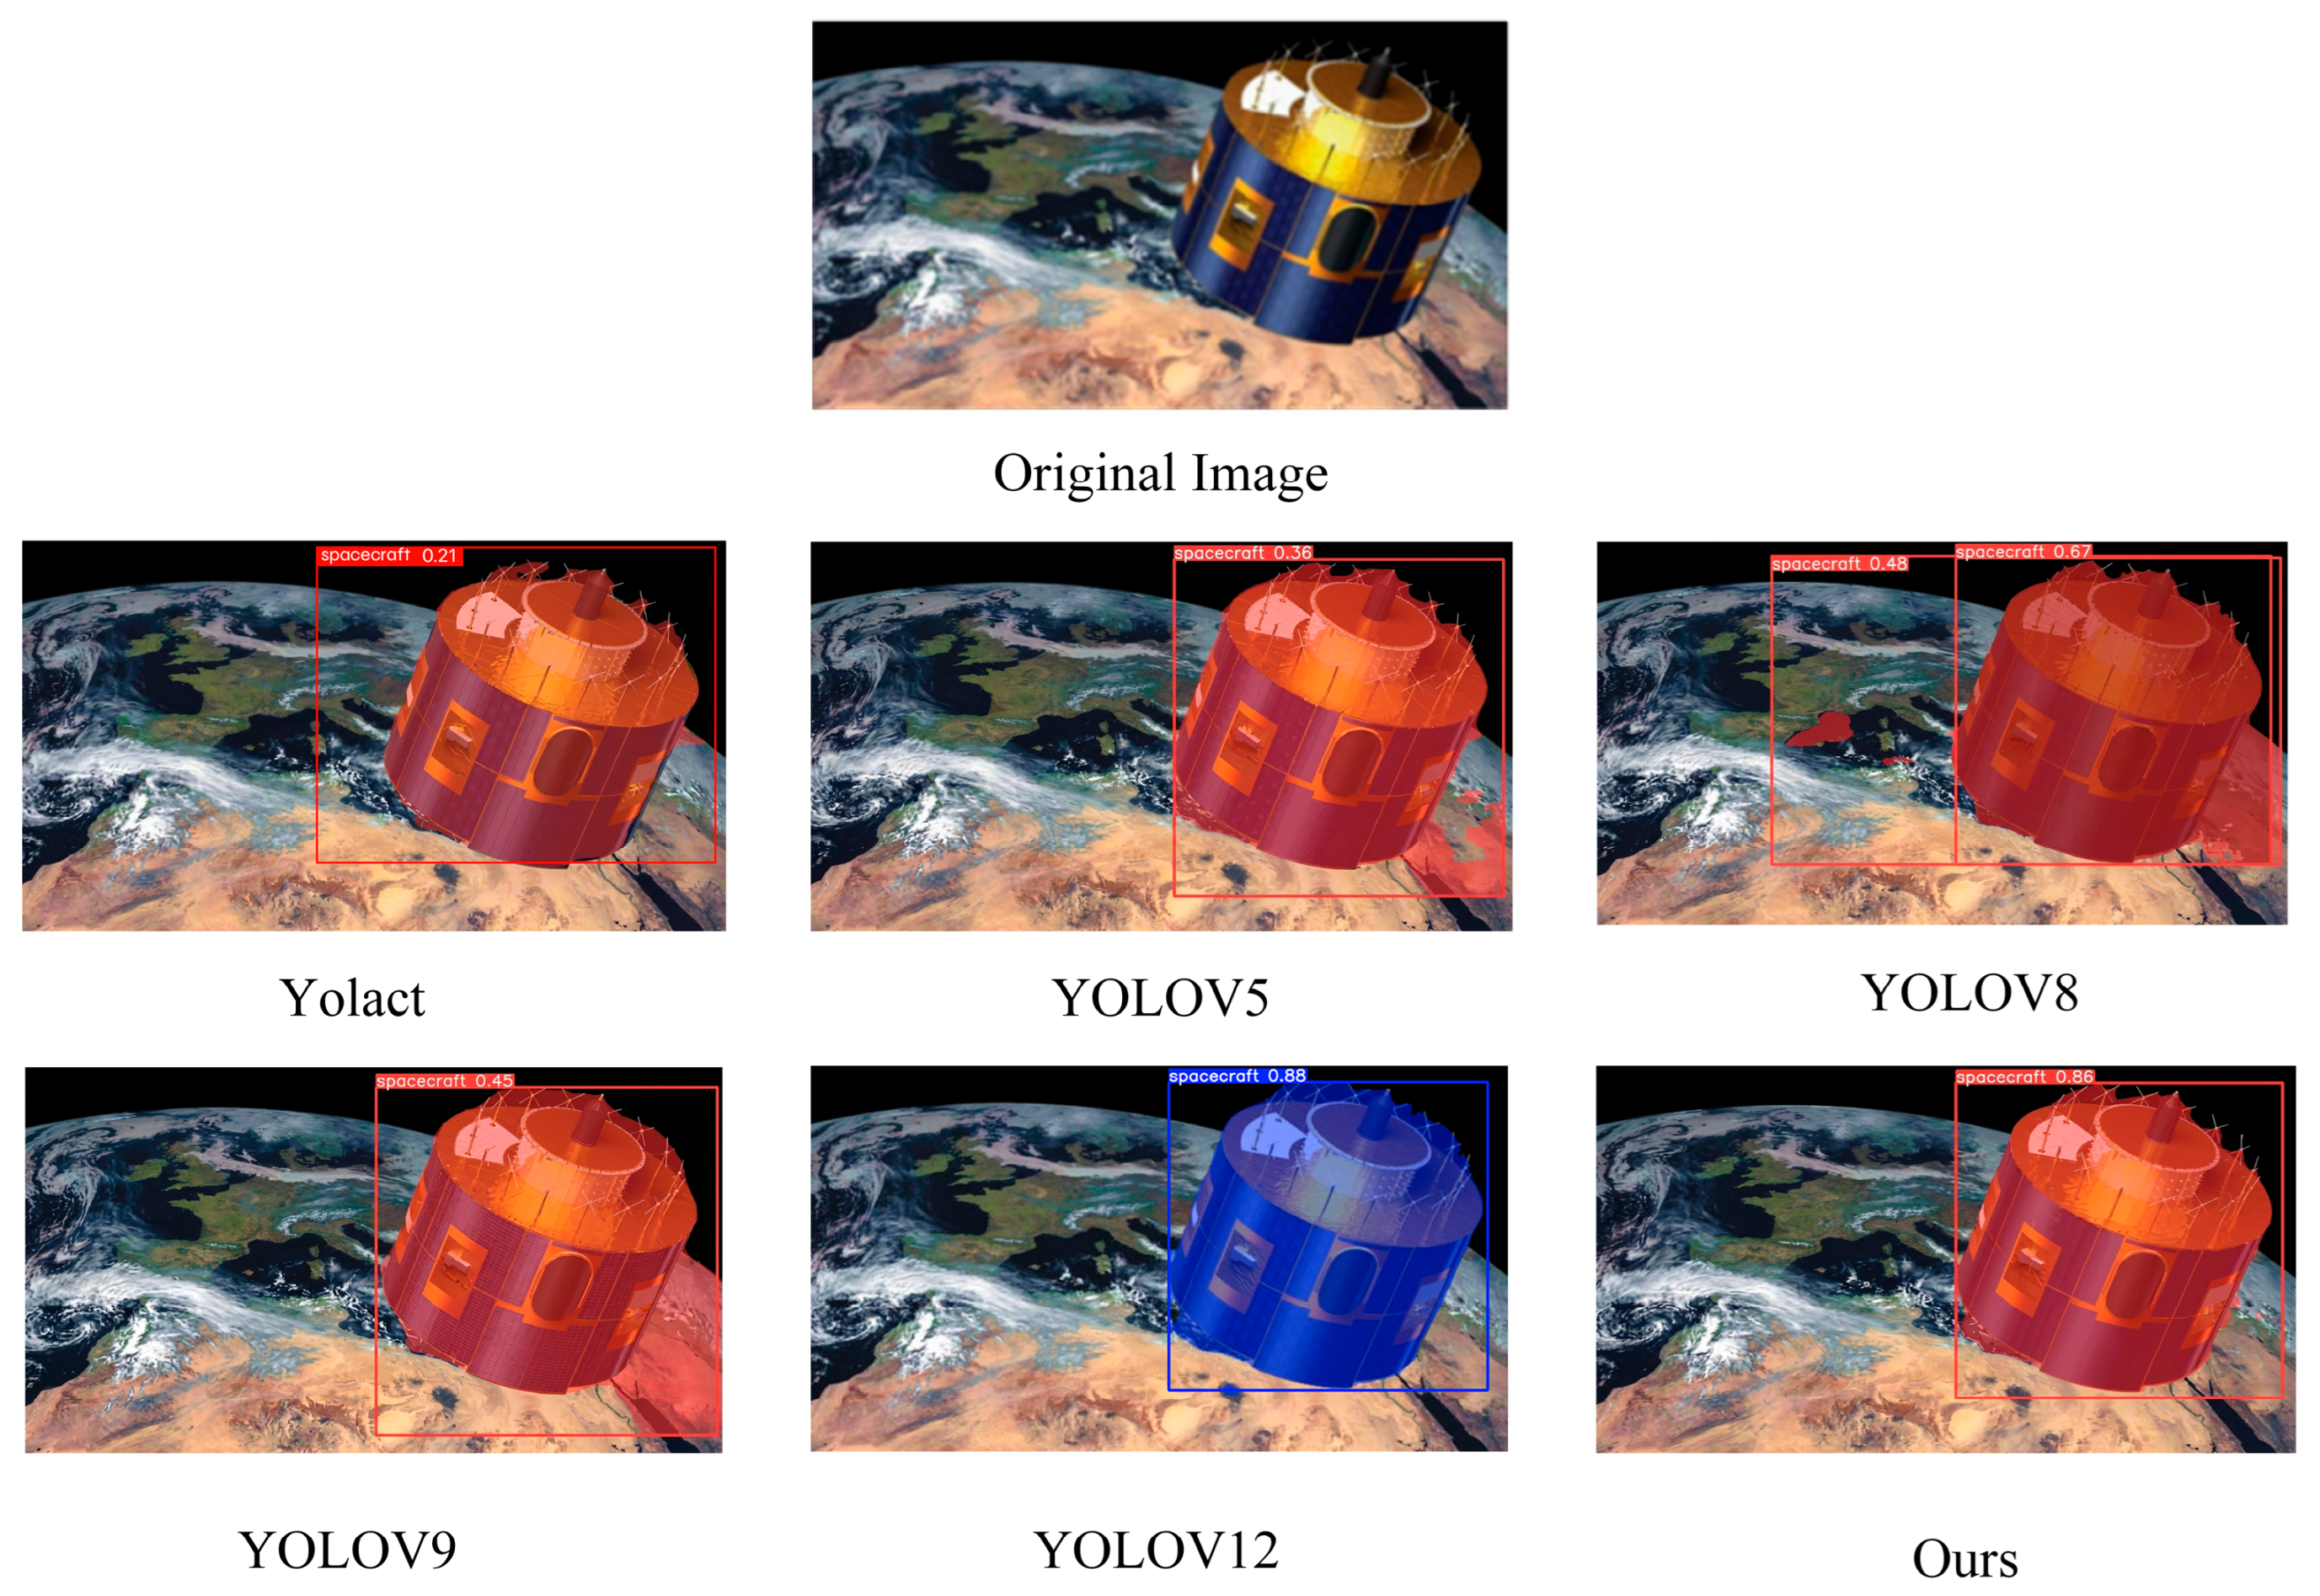
Figure 5 compares different models for spacecraft instance segmentation with a single target object in the background. The analysis indicated that the regression box positioning of the Yolact model was inaccurate, lacking the capability to effectively fit and accurately identify the frame compared with the improved YOLOV8. The YOLOV5 model misidentified the background as the target object due to its inaccurate regression frame, resulting in a significant decrease in segmentation accuracy. Similar issues were observed with the YOLOV9 model. The YOLOV8 model incorrectly recognized the Earth’s background as the target and misclassified background pixels. YOLOV12 achieved an accuracy of 0.88 in single-instance segmentation, slightly higher than the 0.86 of our proposed model. This was mainly because the “overly rich” contextual information provided by CSPPF could distract the model. The model might become overly focused on irrelevant textures and features in the background and try to understand them, rather than concentrating on the single foreground target as the YOLOV12 model does. So while the CSPPF module significantly improved feature extraction capabilities in multi-target and complex background scenarios, its multi-level context fusion might introduce slight interference in minimalist scenes, resulting in slightly lower accuracy than some lightweight models in single-target detection tasks. This suggested that future feature extraction modules could be designed with adaptive or hybrid structures, dynamically adjusting the receptive field and feature fusion strategy based on the complexity of the input scene. This would allow for further improvement in efficiency and accuracy in simple scenarios while maintaining multi-target performance.
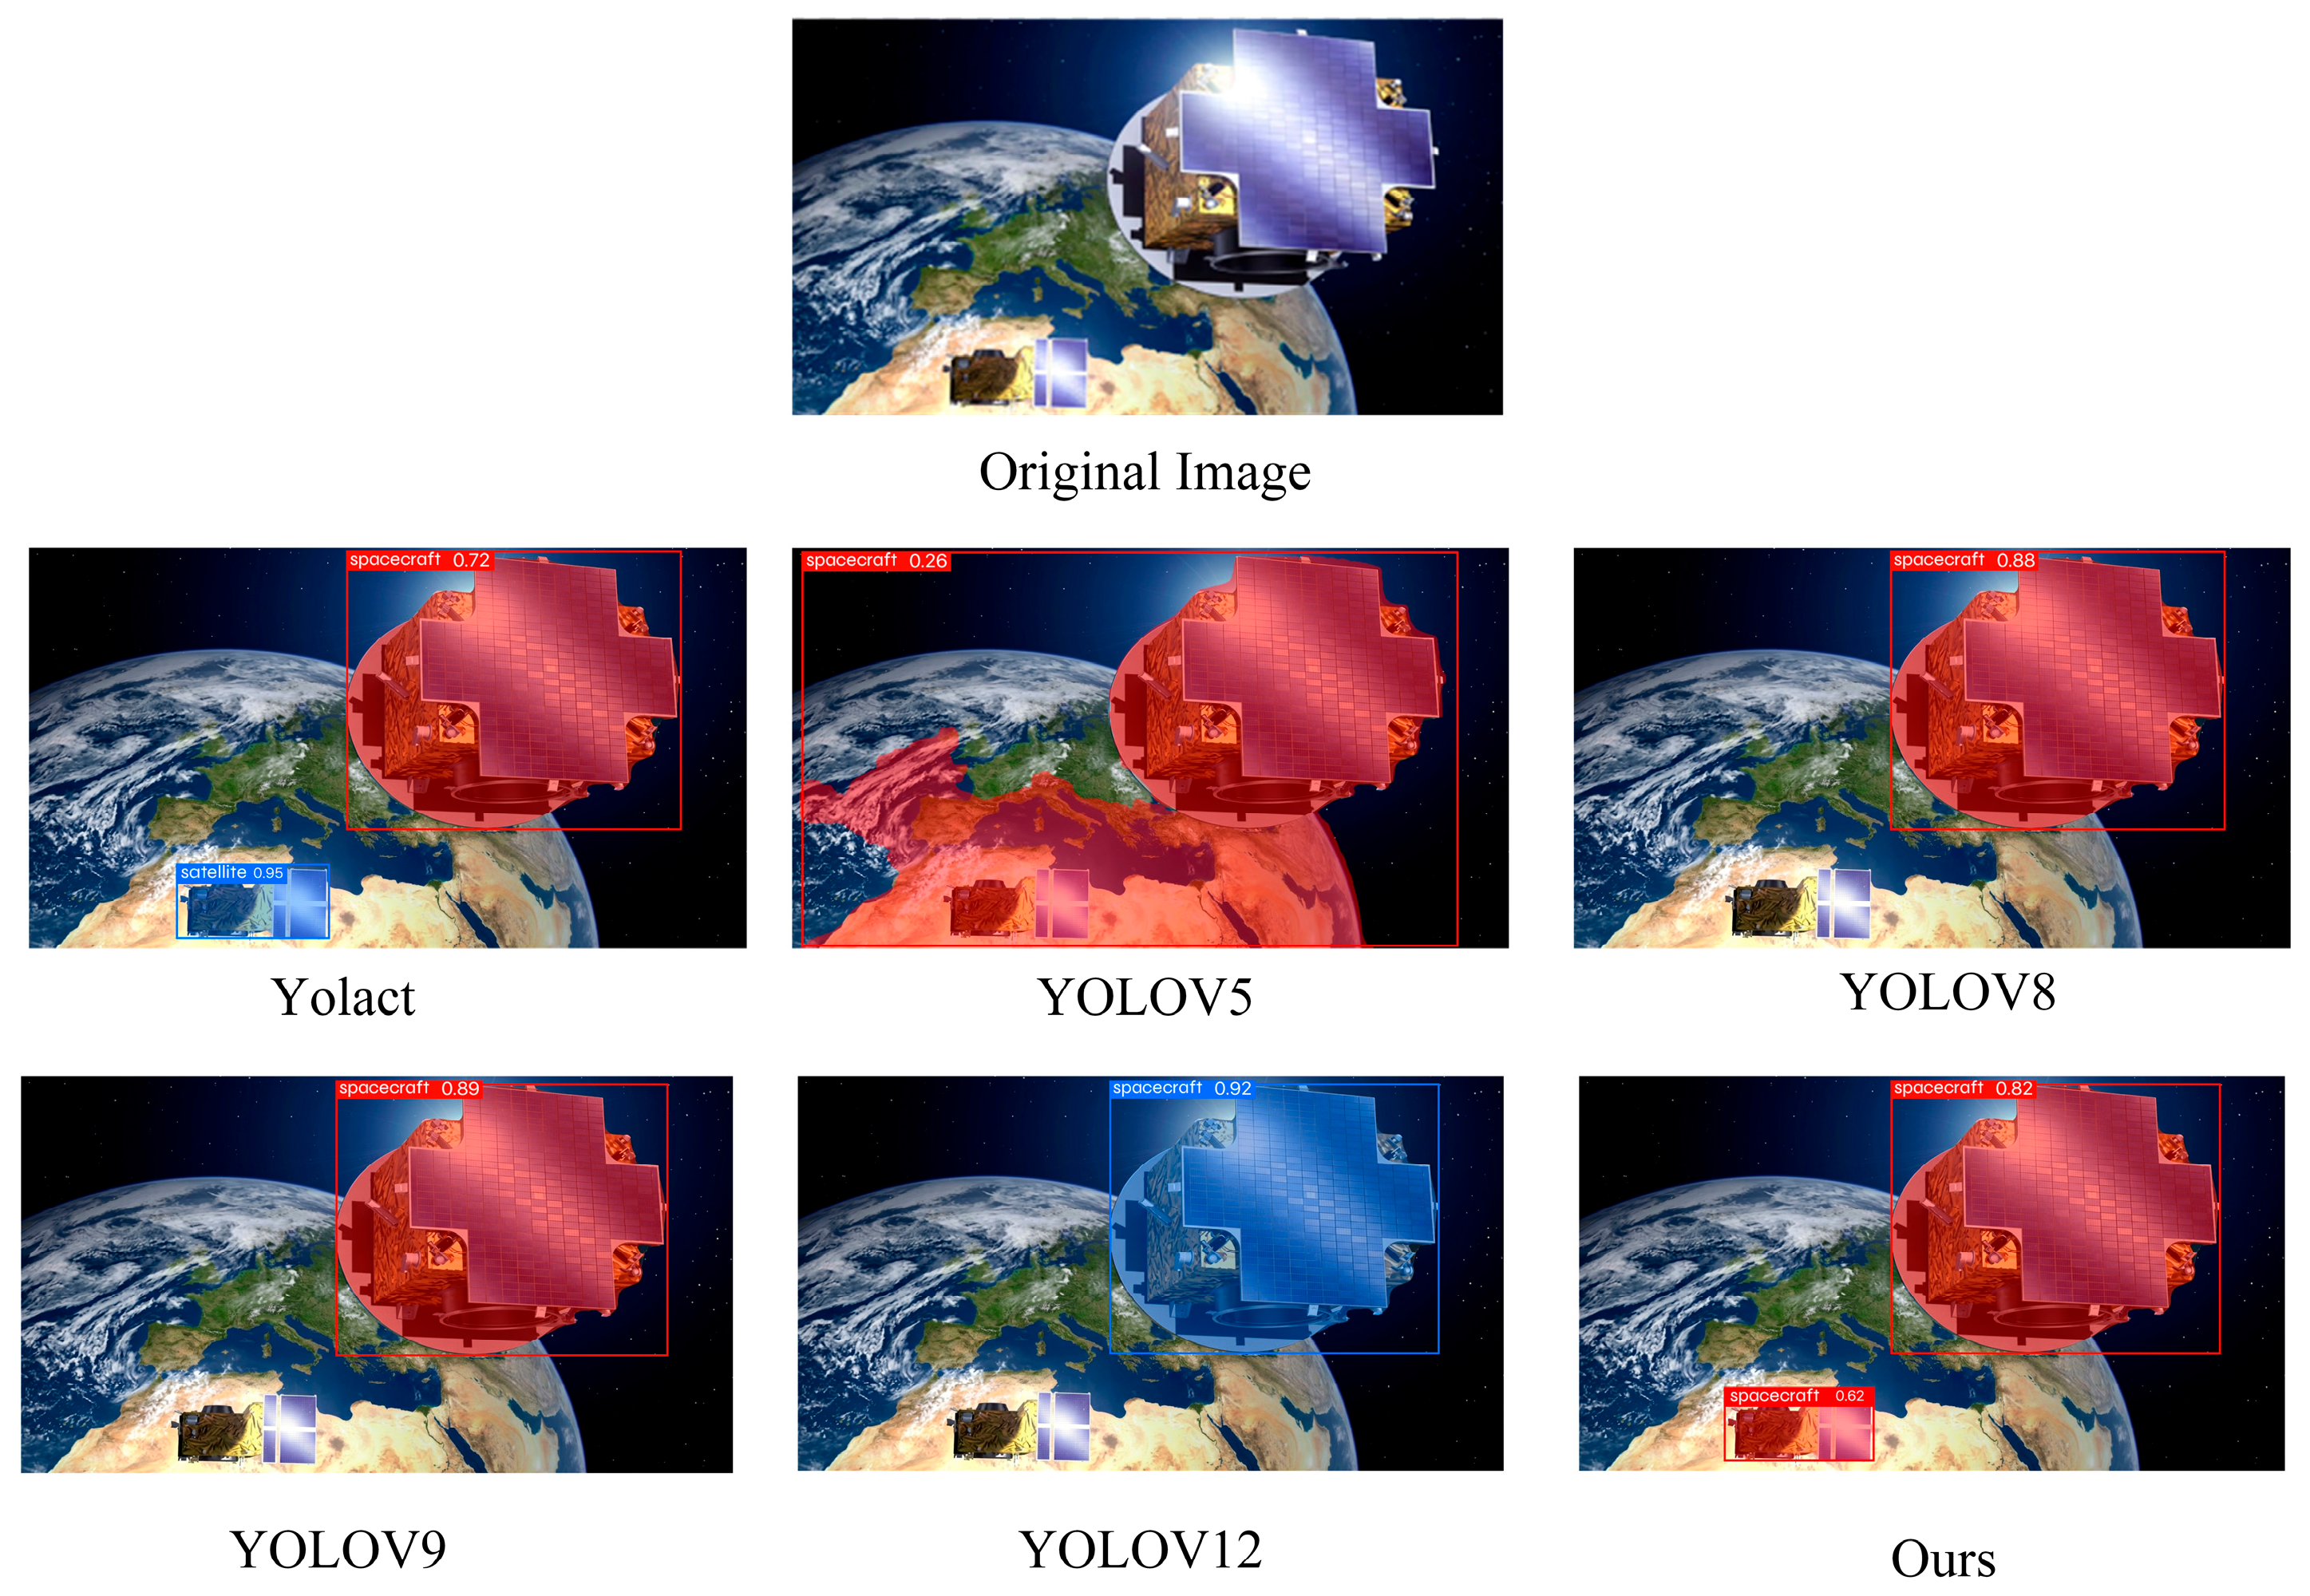
Figure 6 compares different models for spacecraft instance segmentation with multiple target objects in the background. It was found that the Yolact model struggled with box positioning, failing to accurately identify target locations. The YOLOV5 model treated multiple targets and the background as a single detection, leading to significant false detections. YOLOV12, YOLOV9 and YOLOV8 missed some target detections. However, the improved YOLOV8 model enhanced feature extraction during the Backbone stage, providing richer semantic information and greater segmentation accuracy in multi-target scenarios. This also demonstrated that our model had strong performance in multi-target scenarios.
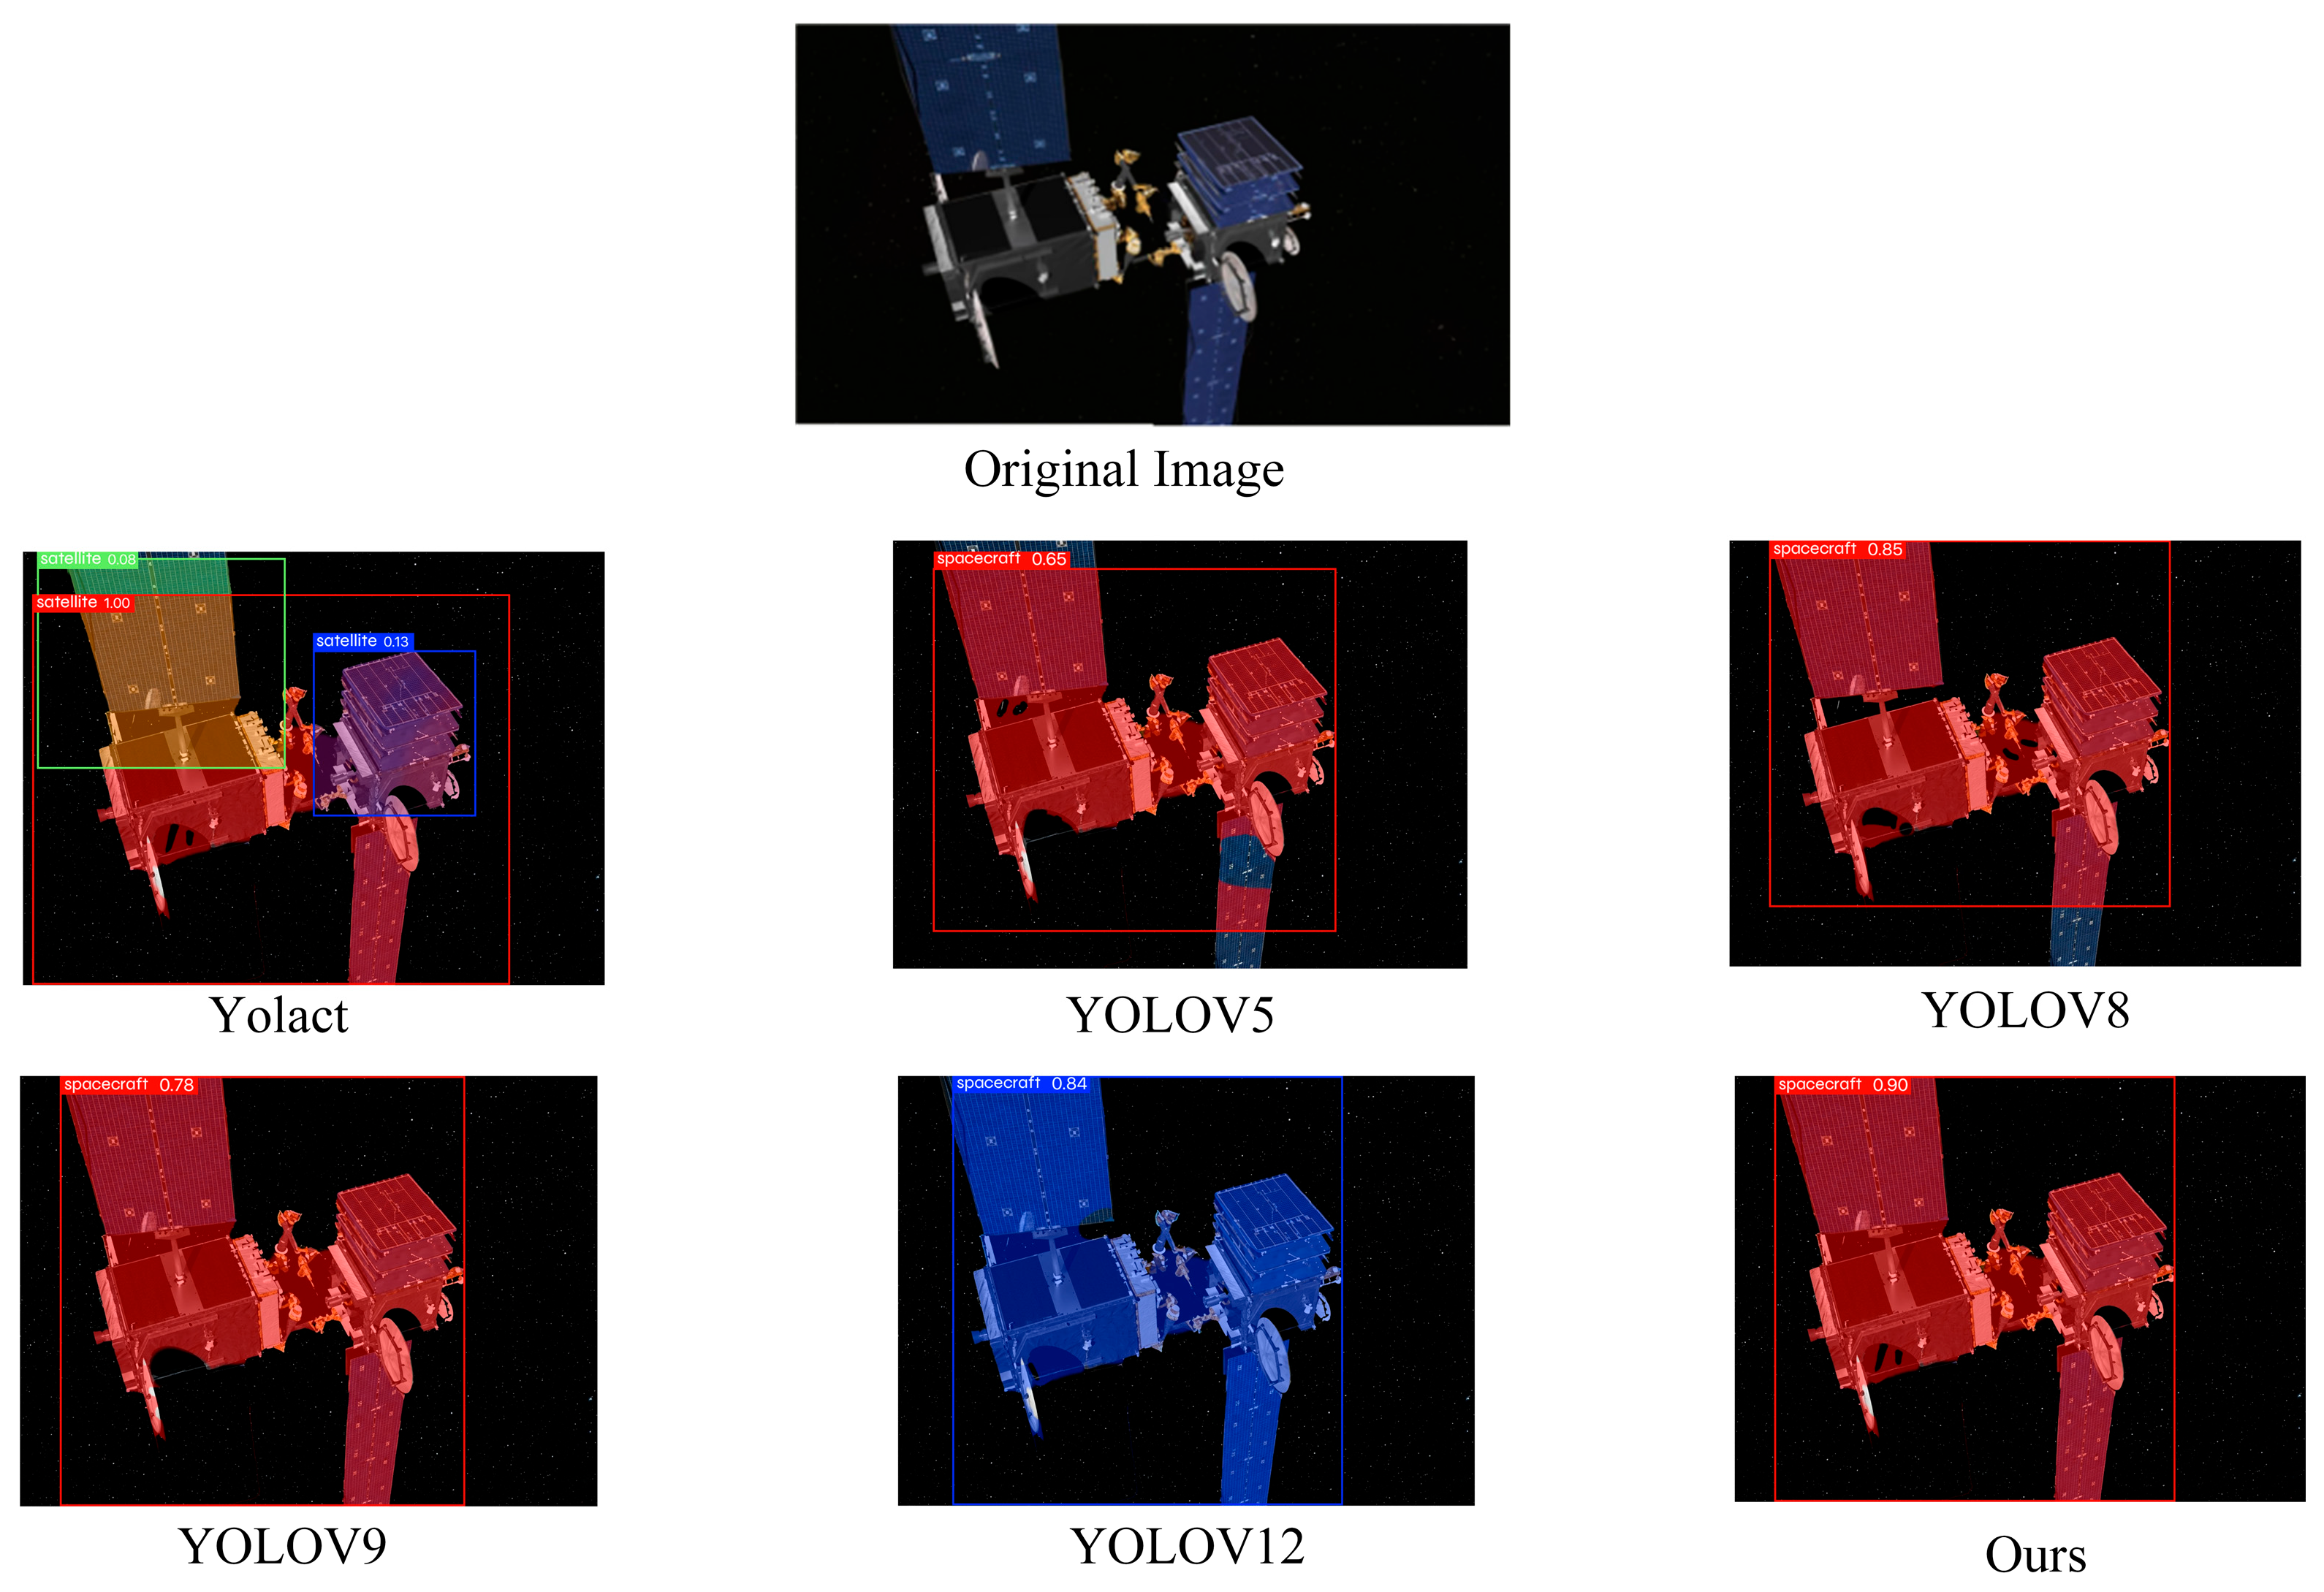
Figure 7 compares different models for spacecraft instance segmentation without the background. The Yolact model showed poor target recognition, resulting in target box confusion. YOLOV5 also performed poorly in object segmentation and box positioning. Both YOLOV9 and YOLOV8 struggled with low confidence in object categories, with YOLOV8 specifically having issues with box accuracy. Meanwhile, due to the absence of background interference, our model (0.90) significantly outperformed YOLOV12 (0.84) in segmentation accuracy. Therefore, the improved YOLOV8 model outperformed the others, demonstrating its superiority and feasibility.

4.7. Training Process Analysis

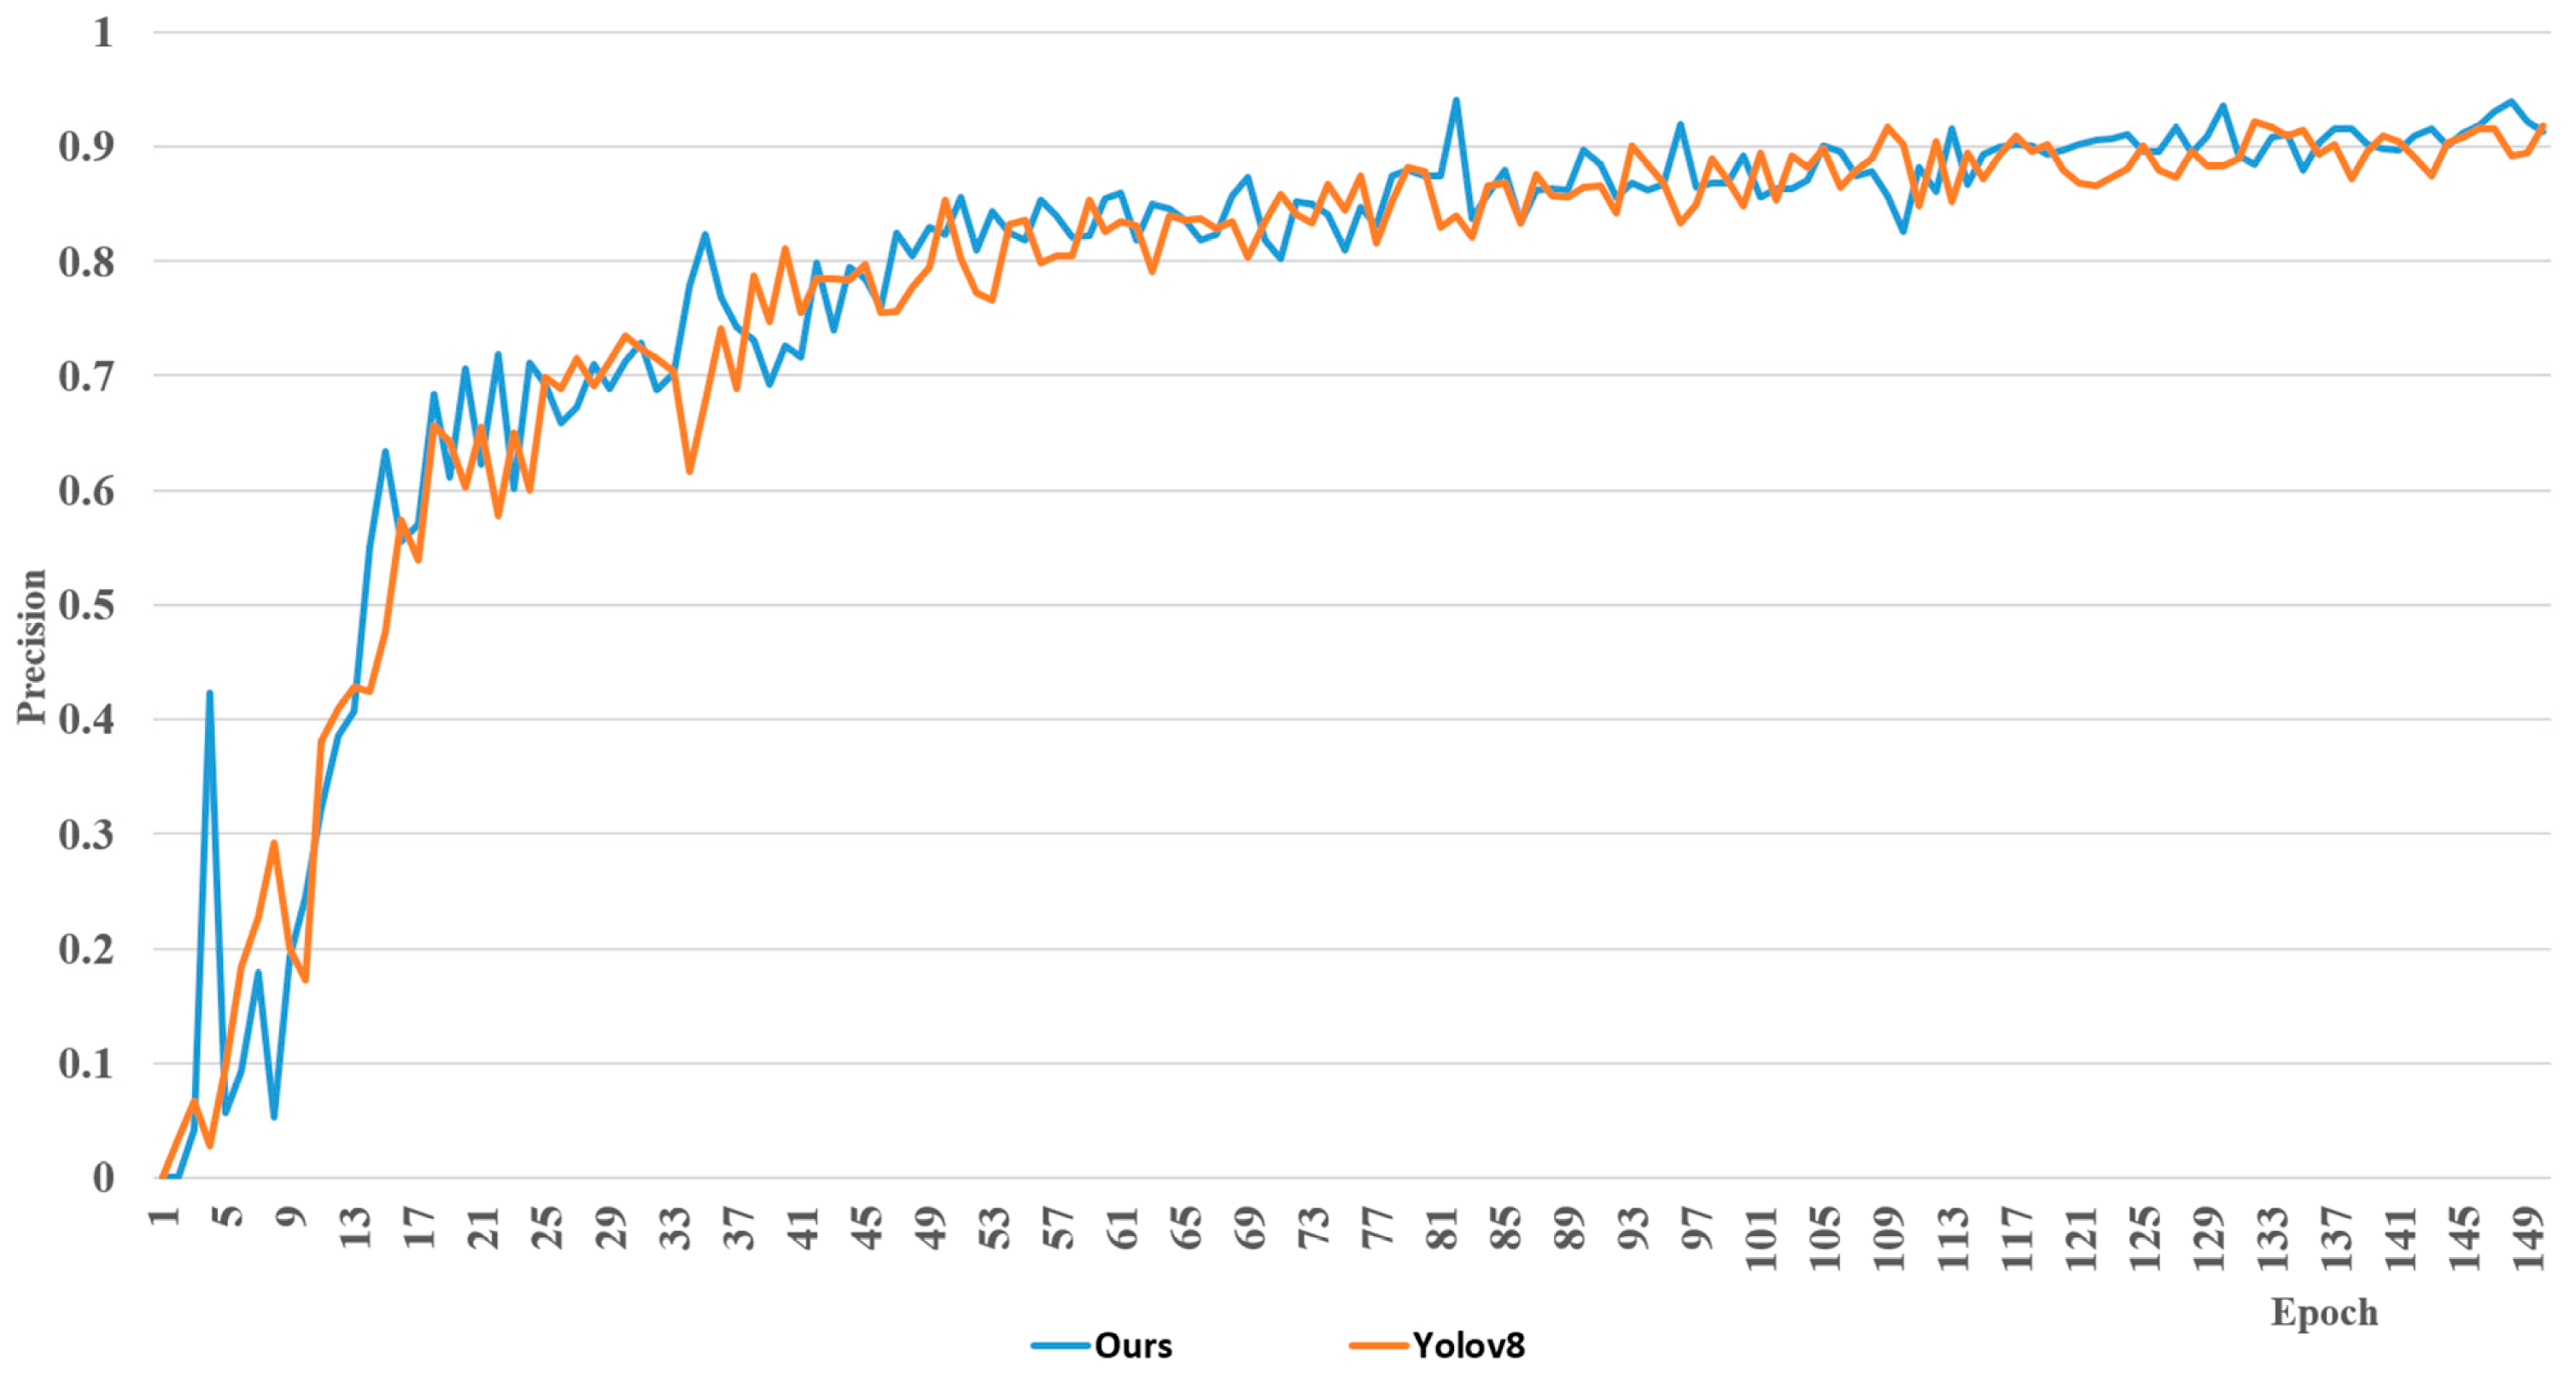
The SDDSP dataset was utilized to train the improved YOLOV8 model over 150 epochs. The accuracy comparison is depicted in Figure 8, while the horizontal axis represented training epochs and the vertical axis represented training accuracy. The precision curve indicates that around the 130th epoch, the improved model began to converge, achieving higher accuracy and stability than the original YOLOV8 model.
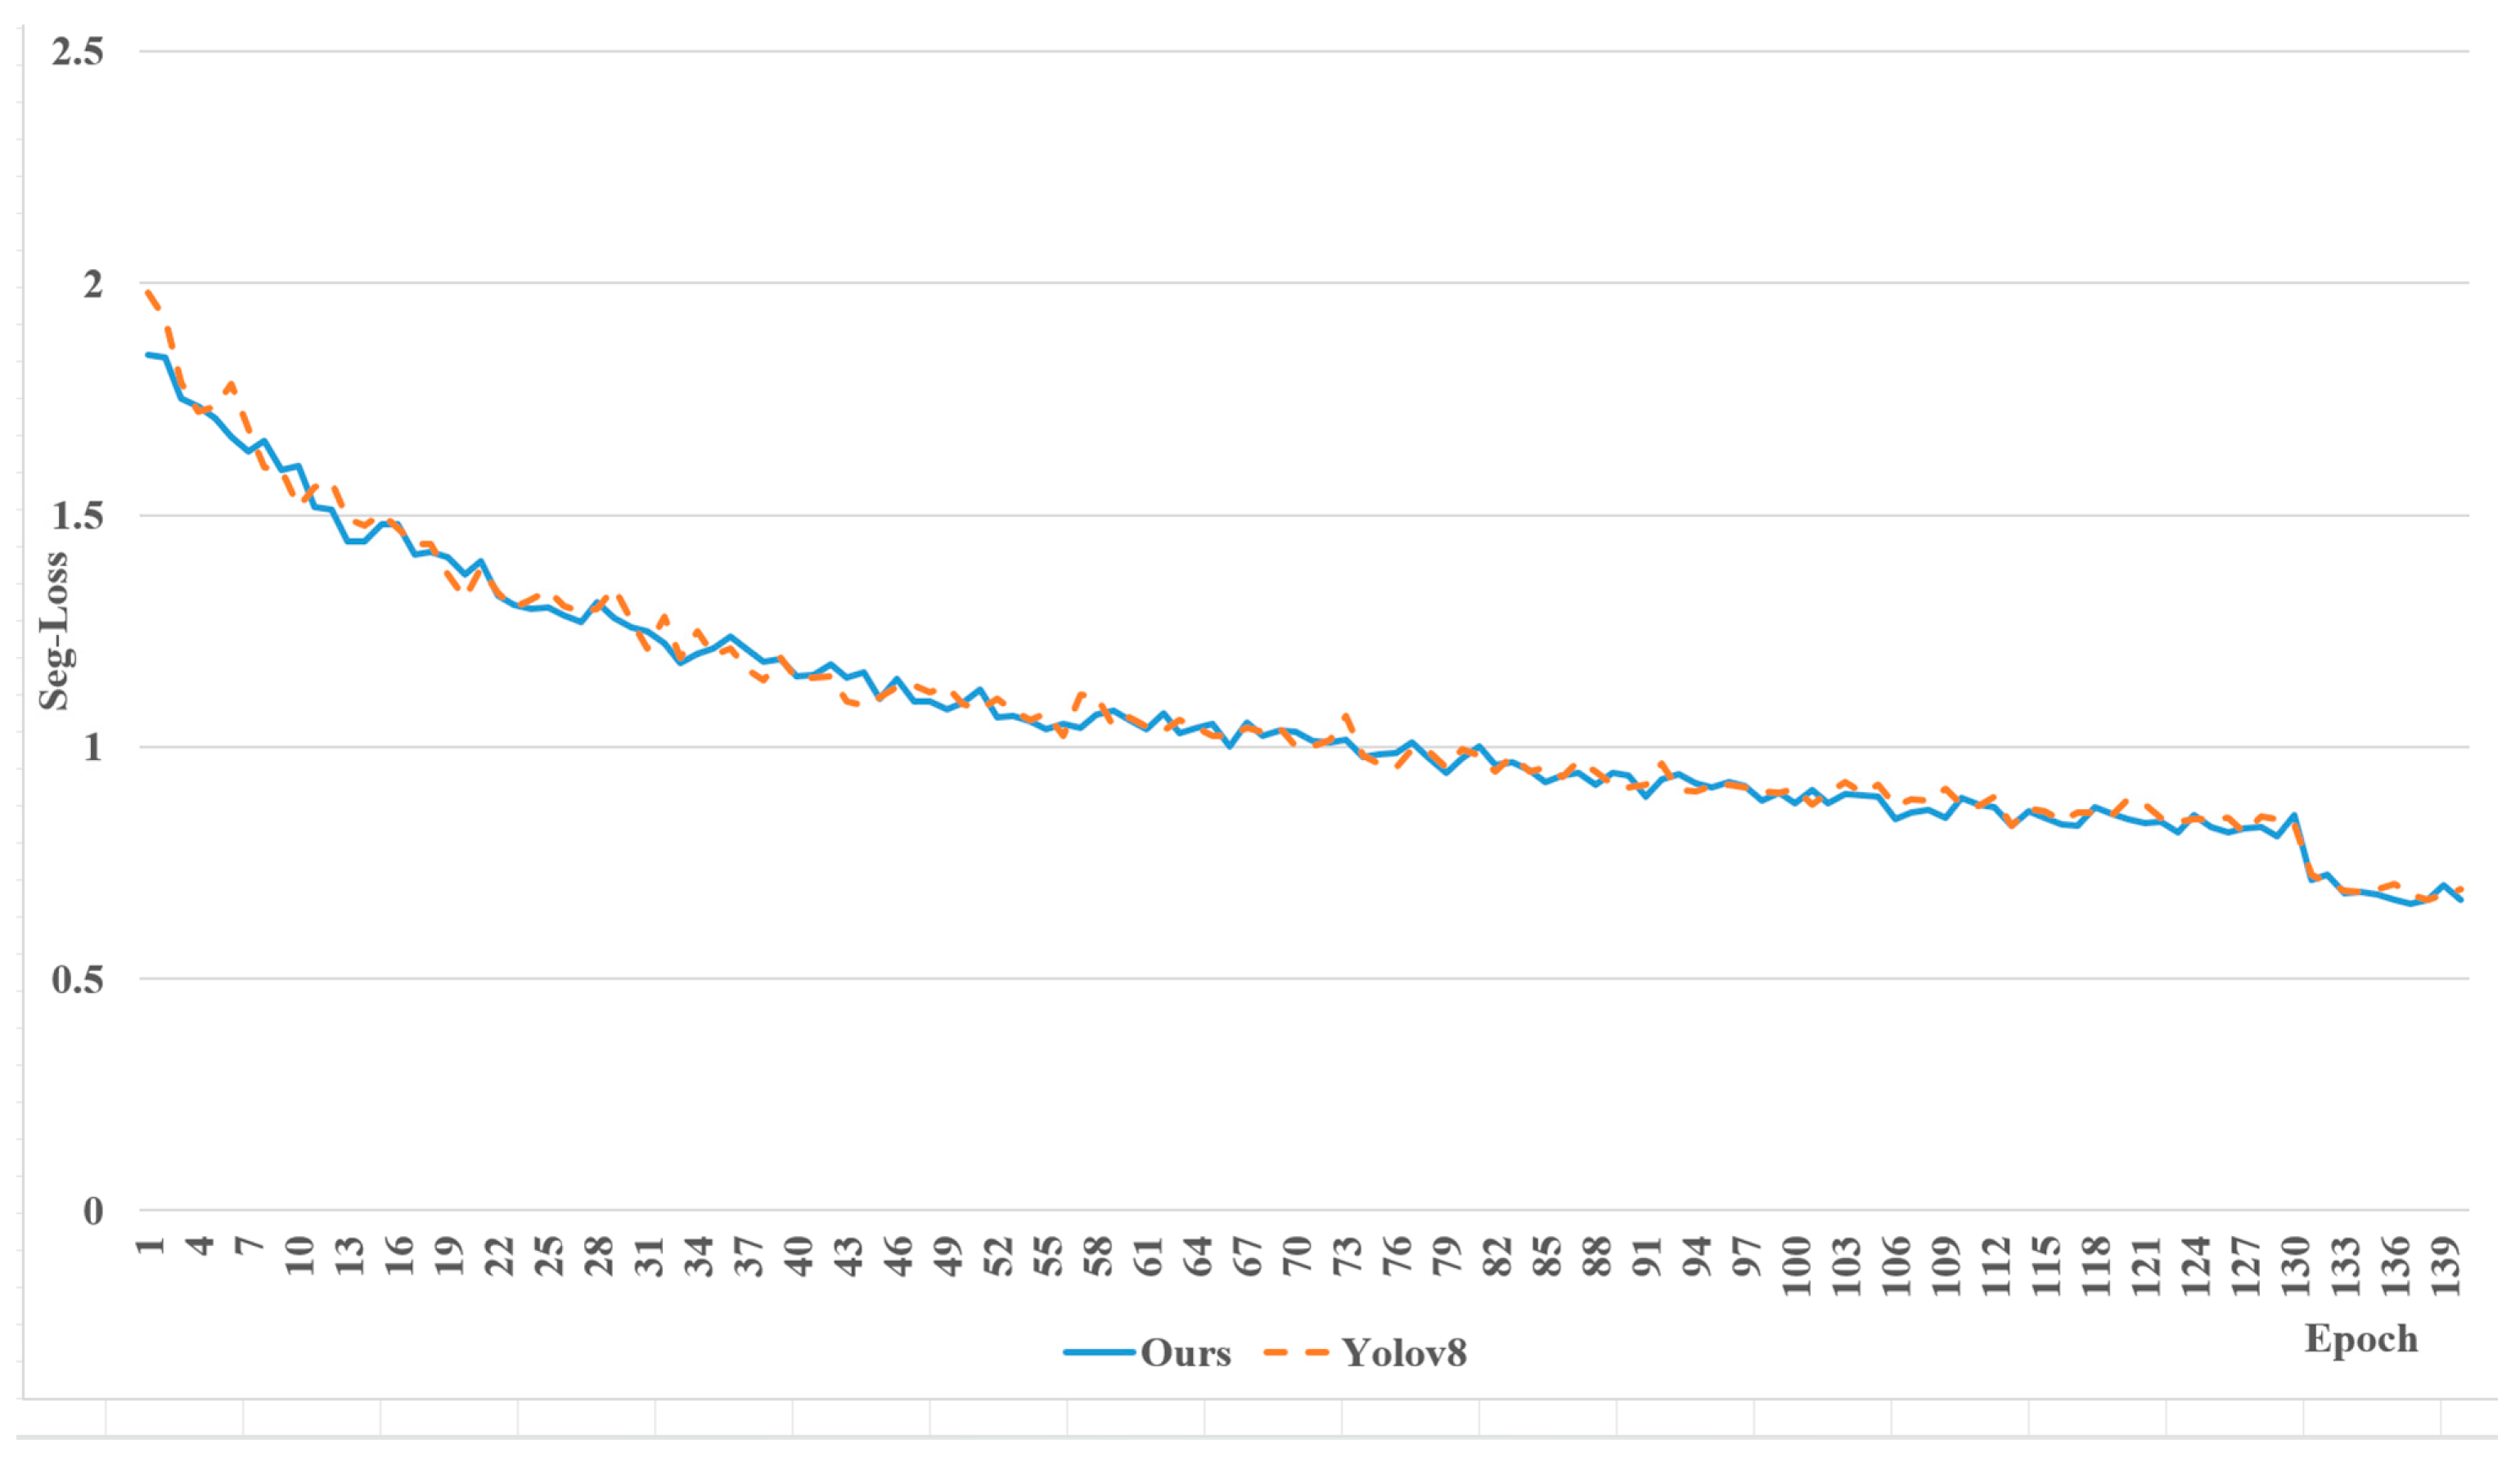
Figure 9 compares the instance segmentation loss between the YOLOV8 model and its improved version. The data shows that the original SPPF module in the YOLOV8 model was inadequate for extracting multi-scale feature information, leading to insufficient global information for effective training and lower precision in instance segmentation tasks. Therefore, the YOLOV8 model exhibited higher instance segmentation loss than the improved version, highlighting its low accuracy. The proposed CSPPF module effectively addresses this issue.
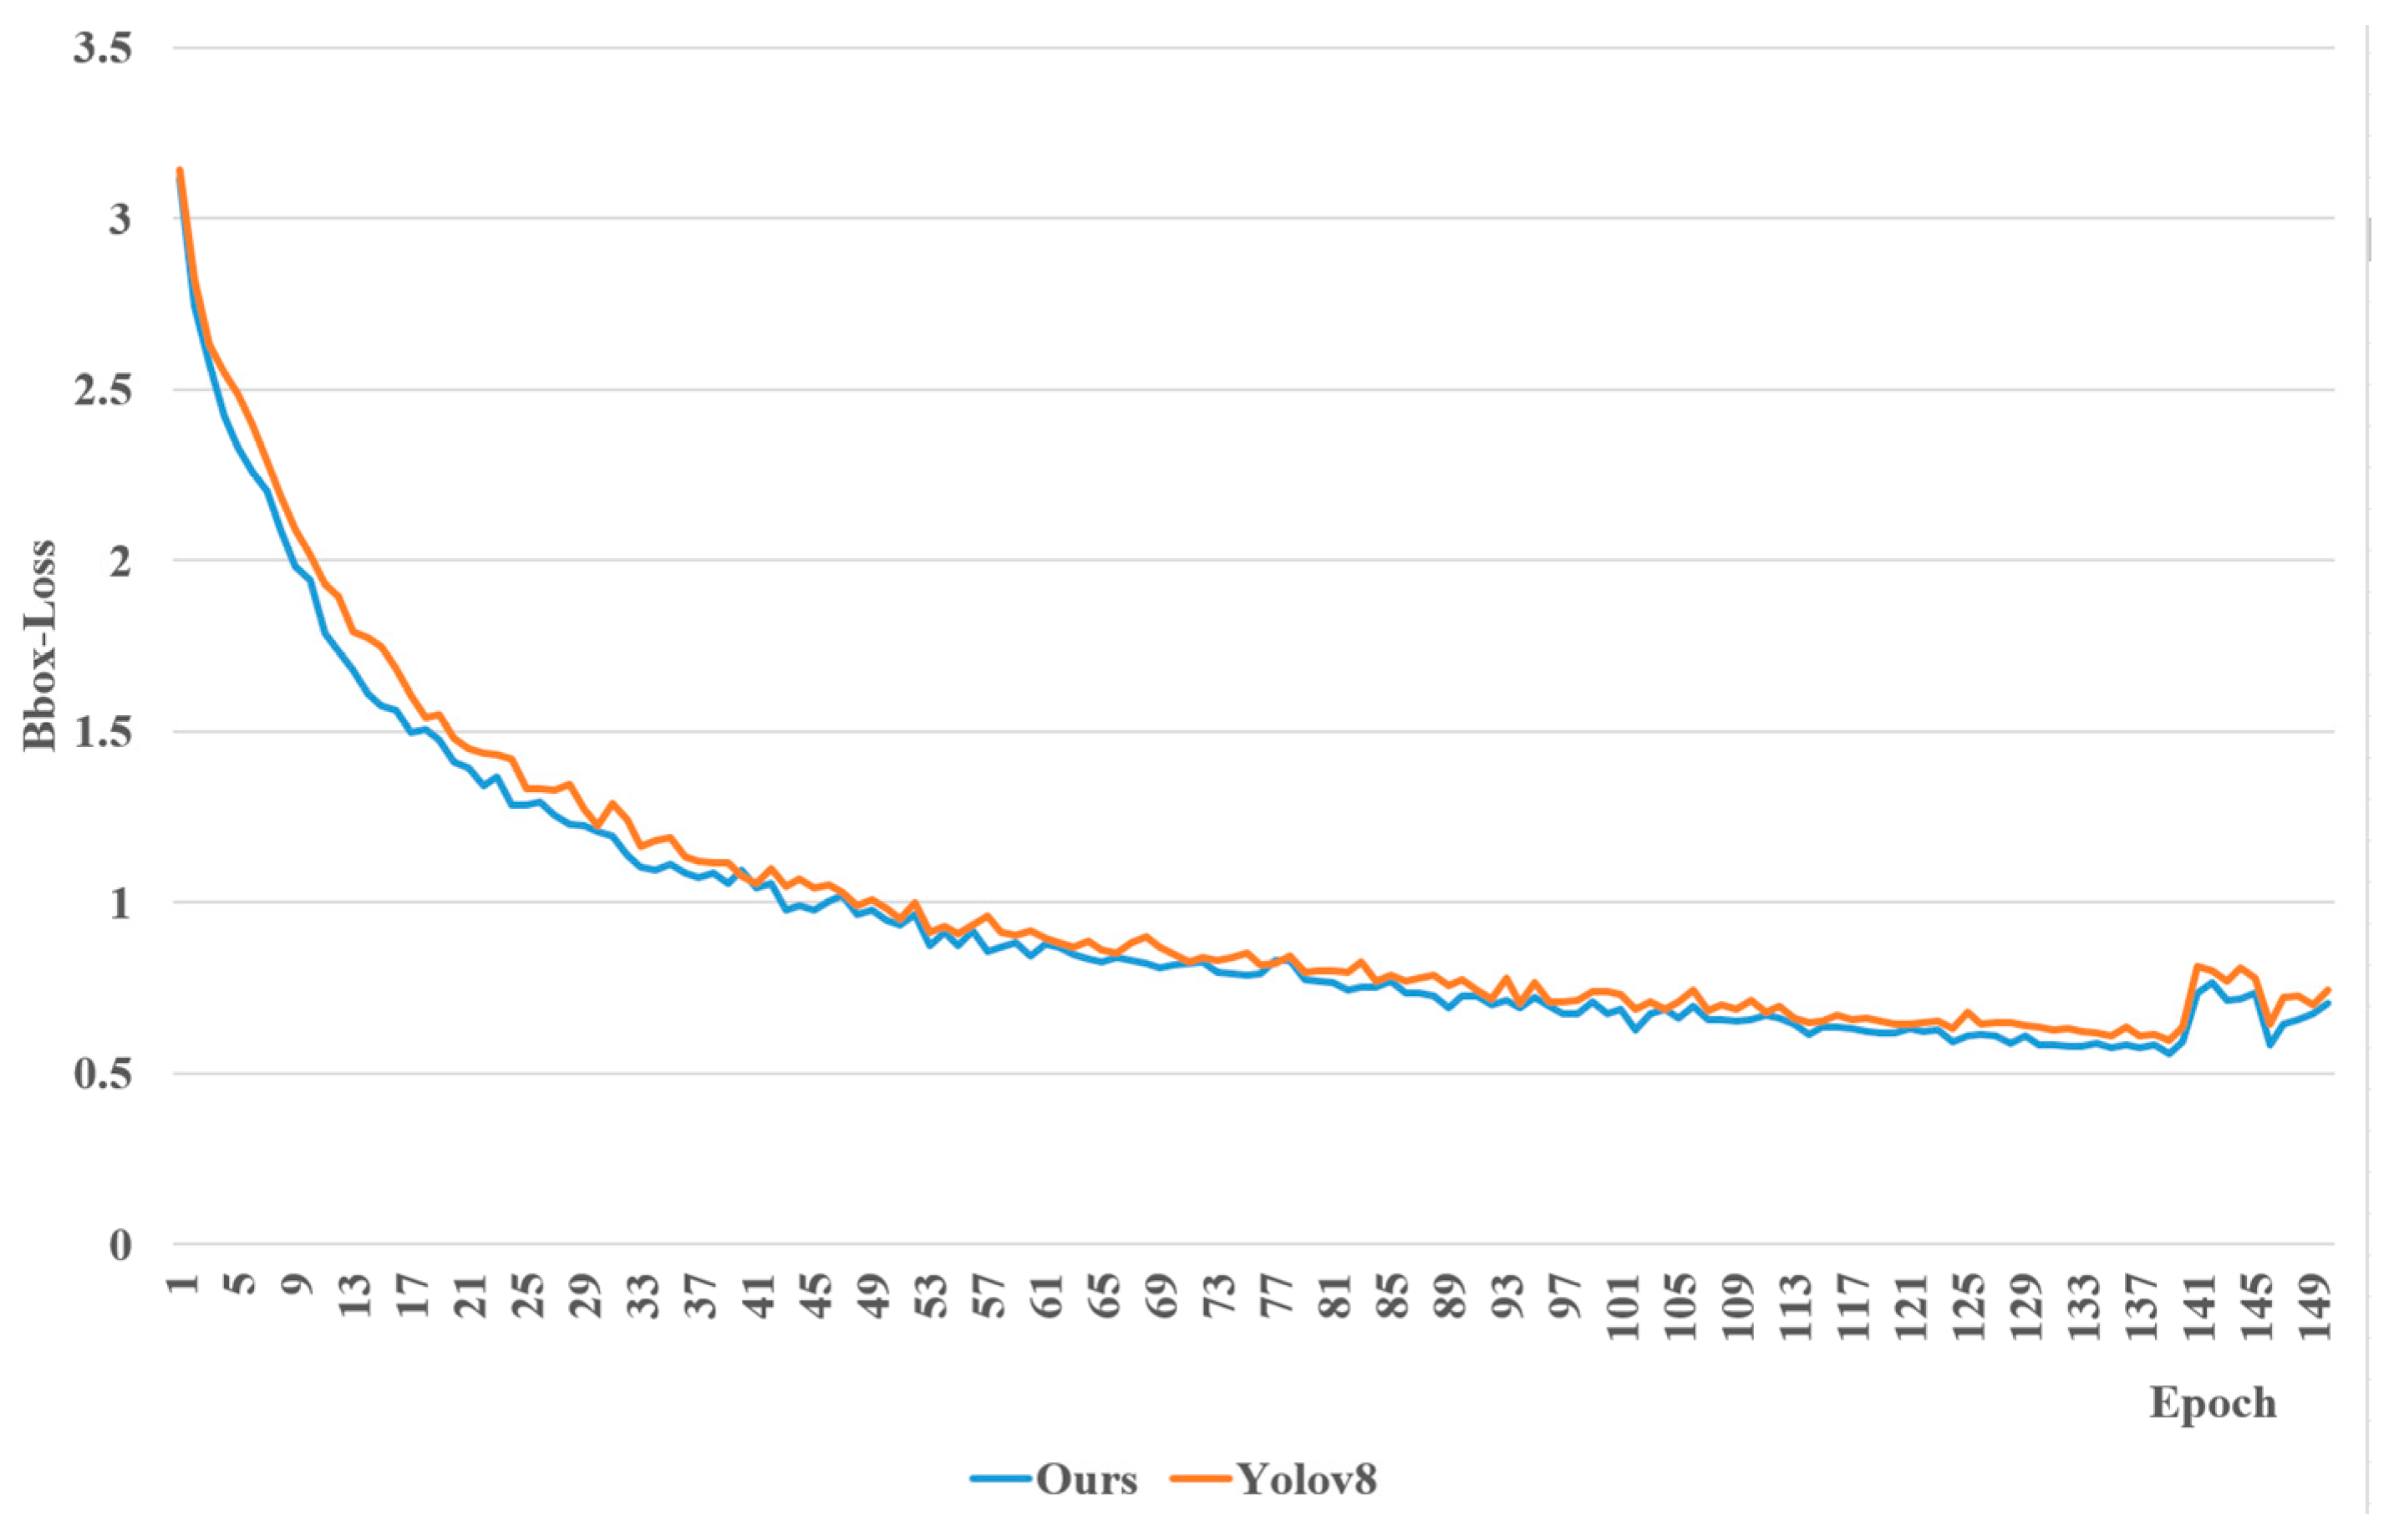
Figure 10 compares the bounding box loss of the improved YOLOV8 model with the original YOLOV8 model. Results showed that incorporating WDIOU loss as a new box regression loss function significantly enhanced the accuracy of the improved model in generating positioning boxes for target objects and its instance segmentation capabilities. After 150 epochs, the bounding box loss of this improved YOLOV8 was significantly lower, and the swift reduction in loss values further underscored the effectiveness of the training process.

4.8. Simulation Results and Analysis Based on EdgeCloudSim

4.8.1. Simulation Environment Configuration

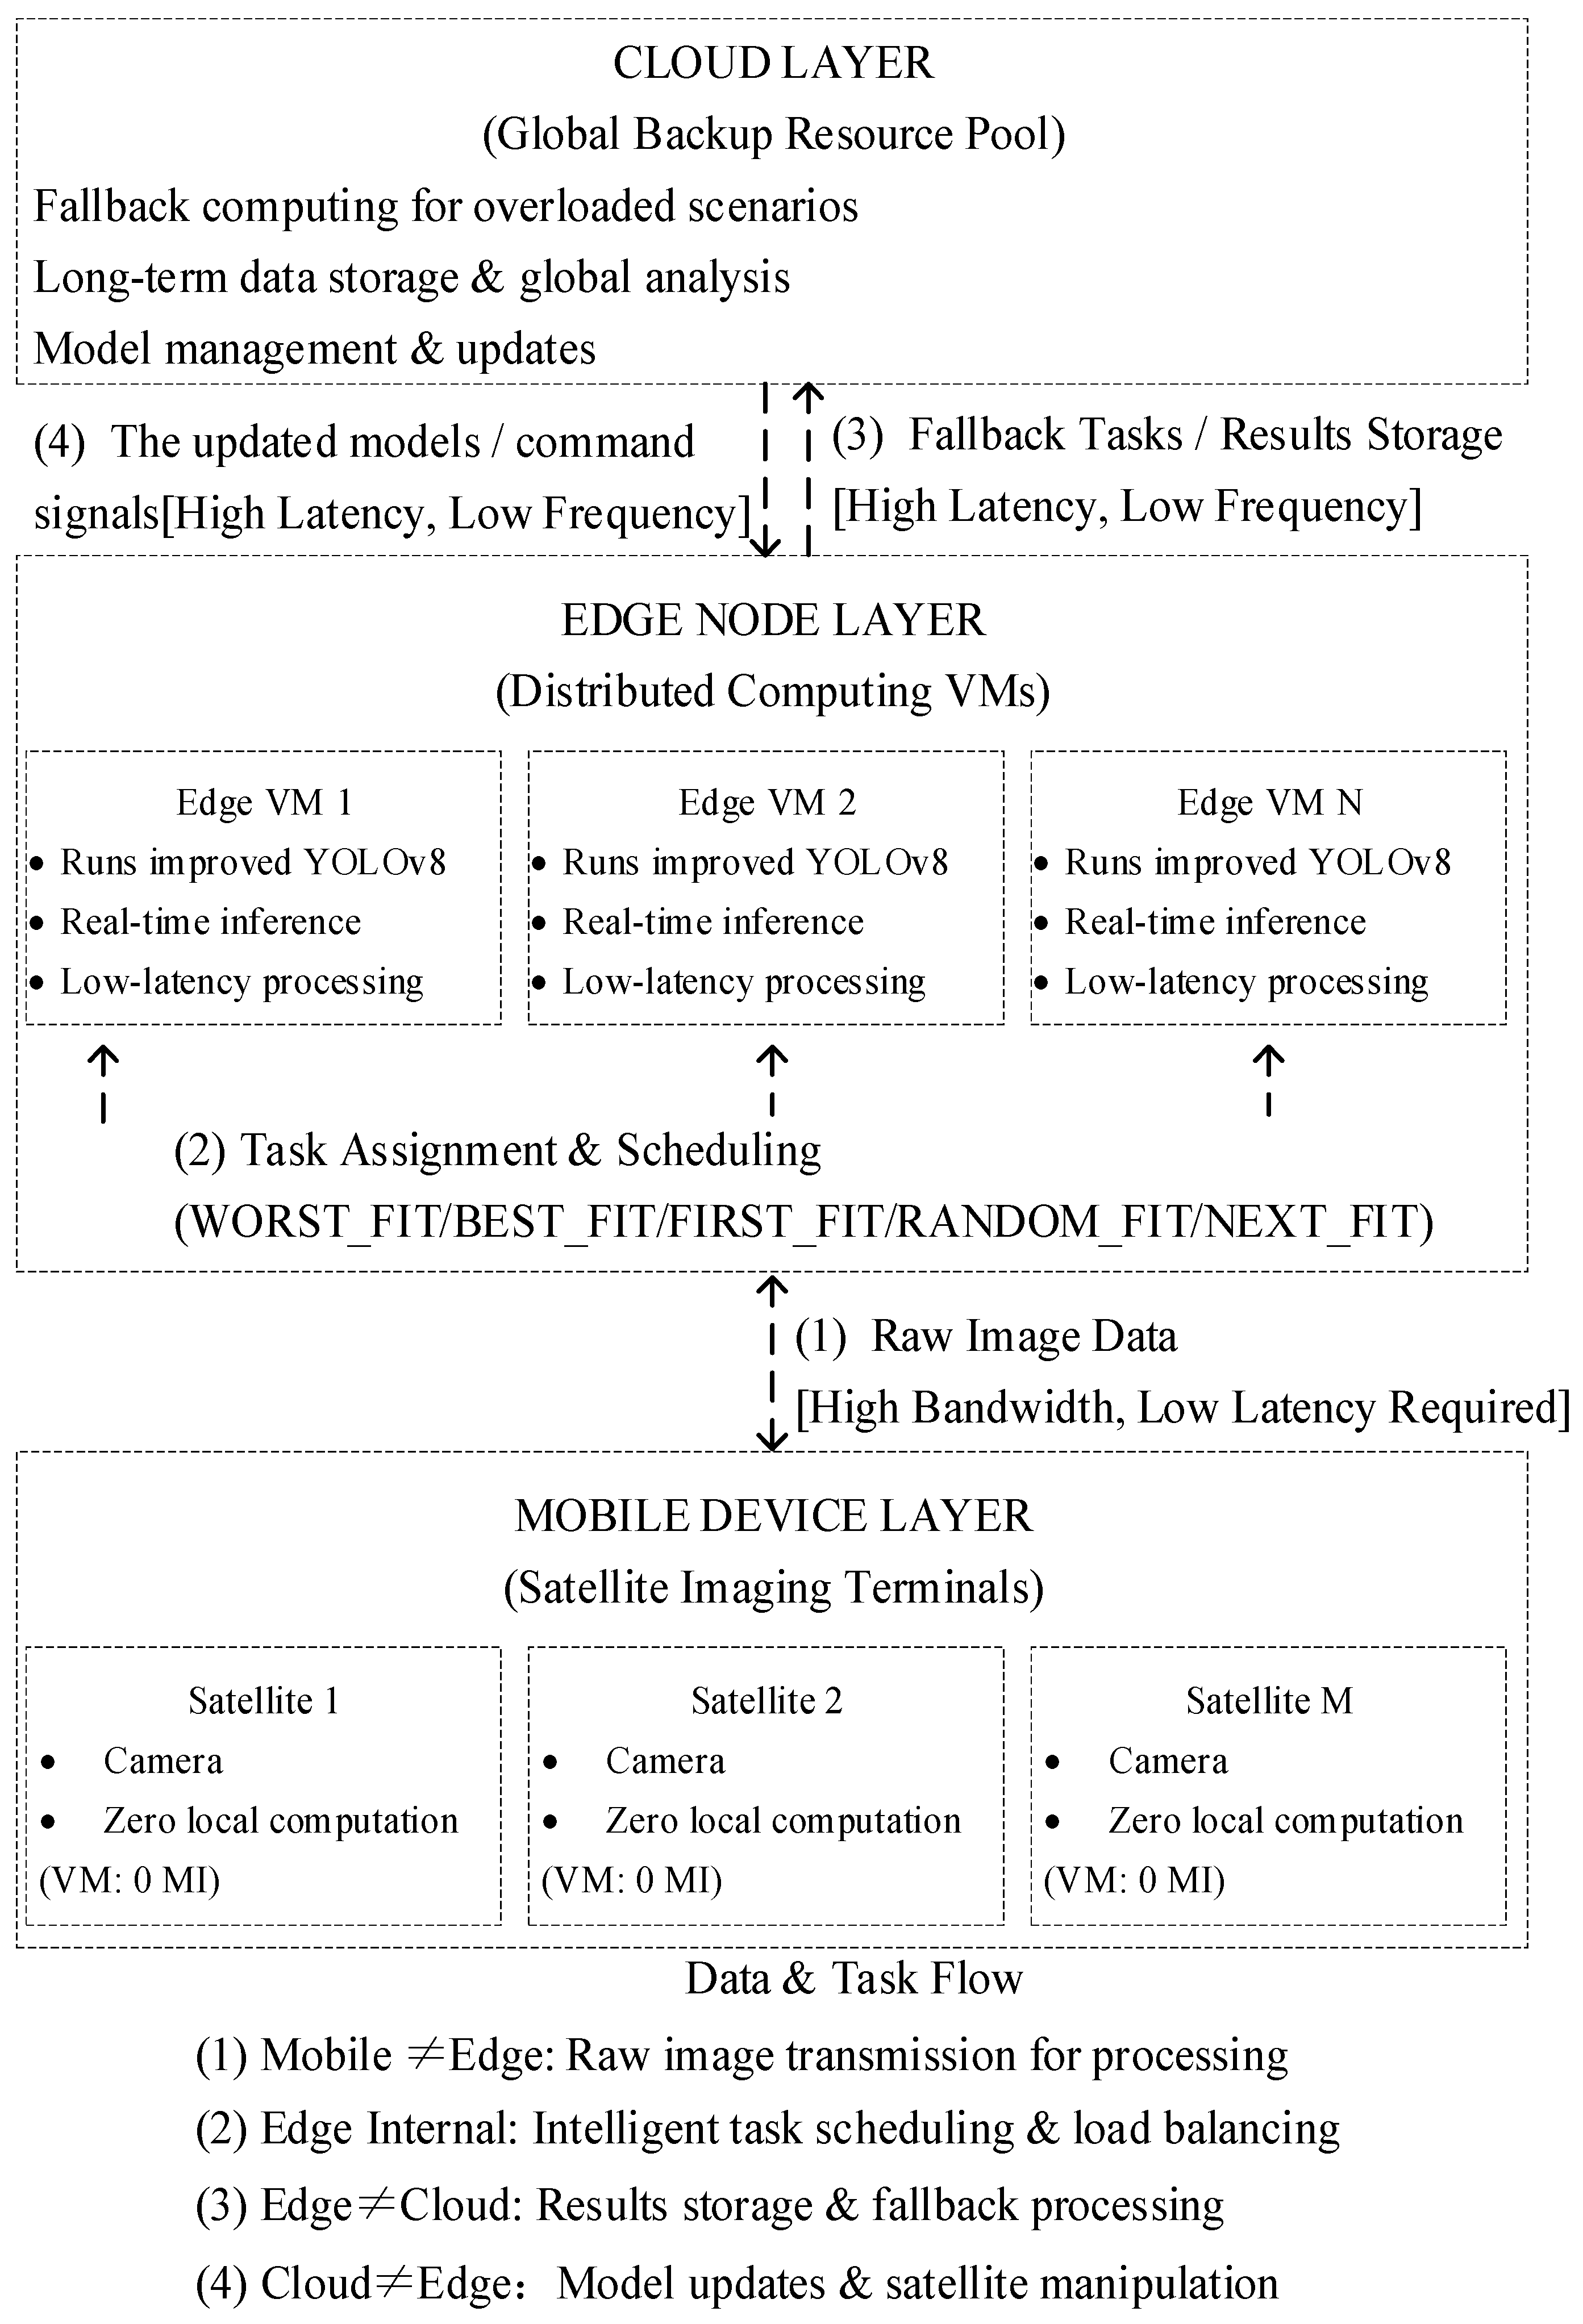
To validate the proposed Cloud-Edge IoT System Architecture, this paper utilized EdgeCloudSim to construct a three-layer edge computing architecture comprising “mobile device—edge node—cloud”. And Figure 11 presented the three-layer framework diagram of Cloud-Edge IoT system architecture:
Mobile Device Layer: This layer consisted of front-end modules deployed on the terminal, responsible for image acquisition for visual tasks. The mobile virtual machine (VM) had zero computing resources and dides not provide local inference computing power, serving primarily as the data acquisition interface.
Edge Node Layer: This layer comprises virtual machines (VMs) distributed at the network edge, specifically handling the inference tasks of the proposed model. Its core objective was low-latency response, providing near-end computing support for the mobile device. In this paper, it executed the improved YOLOv8-based instance segmentation model in real-time. Only the processed results—compressed segmentation masks (e.g., run-length encoded binary masks) and metadata (class labels, confidence scores, bounding boxes, and timestamps)—were generated for transmission. And it employed space-qualified communication protocols (e.g., CCSDS) to transmit the processed data from the edge to the cloud. By transmitting semantic results instead of raw images, bandwidth consumption and uplink latency were significantly reduced.
Cloud Layer: This layer served as a global backup resource pool for the system, providing fallback computing services when edge node resources were insufficient or overloaded, ensuring task execution availability and system robustness. And it could aggregate data from multiple edge nodes, performed deep analysis, long-term archiving, model retraining, and global mission planning. Updated models and control signals can be periodically pushed back to edge devices via the communication protocols.
The communication flows in this architecture were: (1) Image Acquisition Flow: Mobile devices captured images and sended them to edge nodes; (2) Result Transmission Flow: Edge nodes processed images and transmitted segmentation results to the cloud for storage and further analysis; (3) Fallback Flow: When edge nodes were overloaded, tasks can be offloaded to the cloud layer. (4) Control Flow: The updated models and command signals from the cloud were sent to the edge nodes for satellite manipulation. This architecture effectively supports the IoT-based spacecraft monitoring scenario by embedding intelligence at the edge while leveraging the cloud for scalability and management.
In EdgeCloudSim, to ensure the simulation task and the inference task environment of the algorithm presented in this paper were as consistent as possible, the following two-stage environment configuration was adopted:
(1)
Based on the actual inference process of the algorithm presented in this paper, key computational characteristic indicators were collected and quantified, including the computational load required for a single inference (in millions of instructions, MI), memory usage (in megabytes, MB), and inference time (in milliseconds, ms).
(2)
The task generator and related configuration files in the EdgeCloudSim simulation platform were modified, and the key computational characteristics indicators in the previous step were injected as parameters into the simulation task model, thereby ensuring that the computational load of the task in the simulation environment was numerically aligned with the actual algorithm behavior.
The key parameters of the EdgeCloudSim configuration file were configured as follows: the task computation load was set to an average of 7171.84 MI and a standard deviation of 358.59 MI (5% of the average); the resource configuration was 640 MB of mobile memory (with 100 MB reserved for redundancy) and 740 MB of edge node memory (with 200 MB reserved for redundancy); the local inference latency was 26.32 ms; the number of devices was 200–300; and the scheduling policies were RANDOM_FIT (randomly select an edge node that can carry the task), WORST_FIT (select the edge node with the most sufficient resources), BEST_FIT (select the edge node with the best matching resources), FIRST_FIT (select the first suitable node), and NEXT_FIT (sequentially search for the first edge node that can meet the resource requirements starting from the last allocated position), and 7 rounds of iteration were performed.

4.8.2. Core Metrics Analysis

(1)
The impact of the number of devices on the simulation results
Task Scale: The number of edge devices increased from 200 to 300, and the total number of tasks increased from 80,000 to 200,000, showing a linear overall increase in task scale.
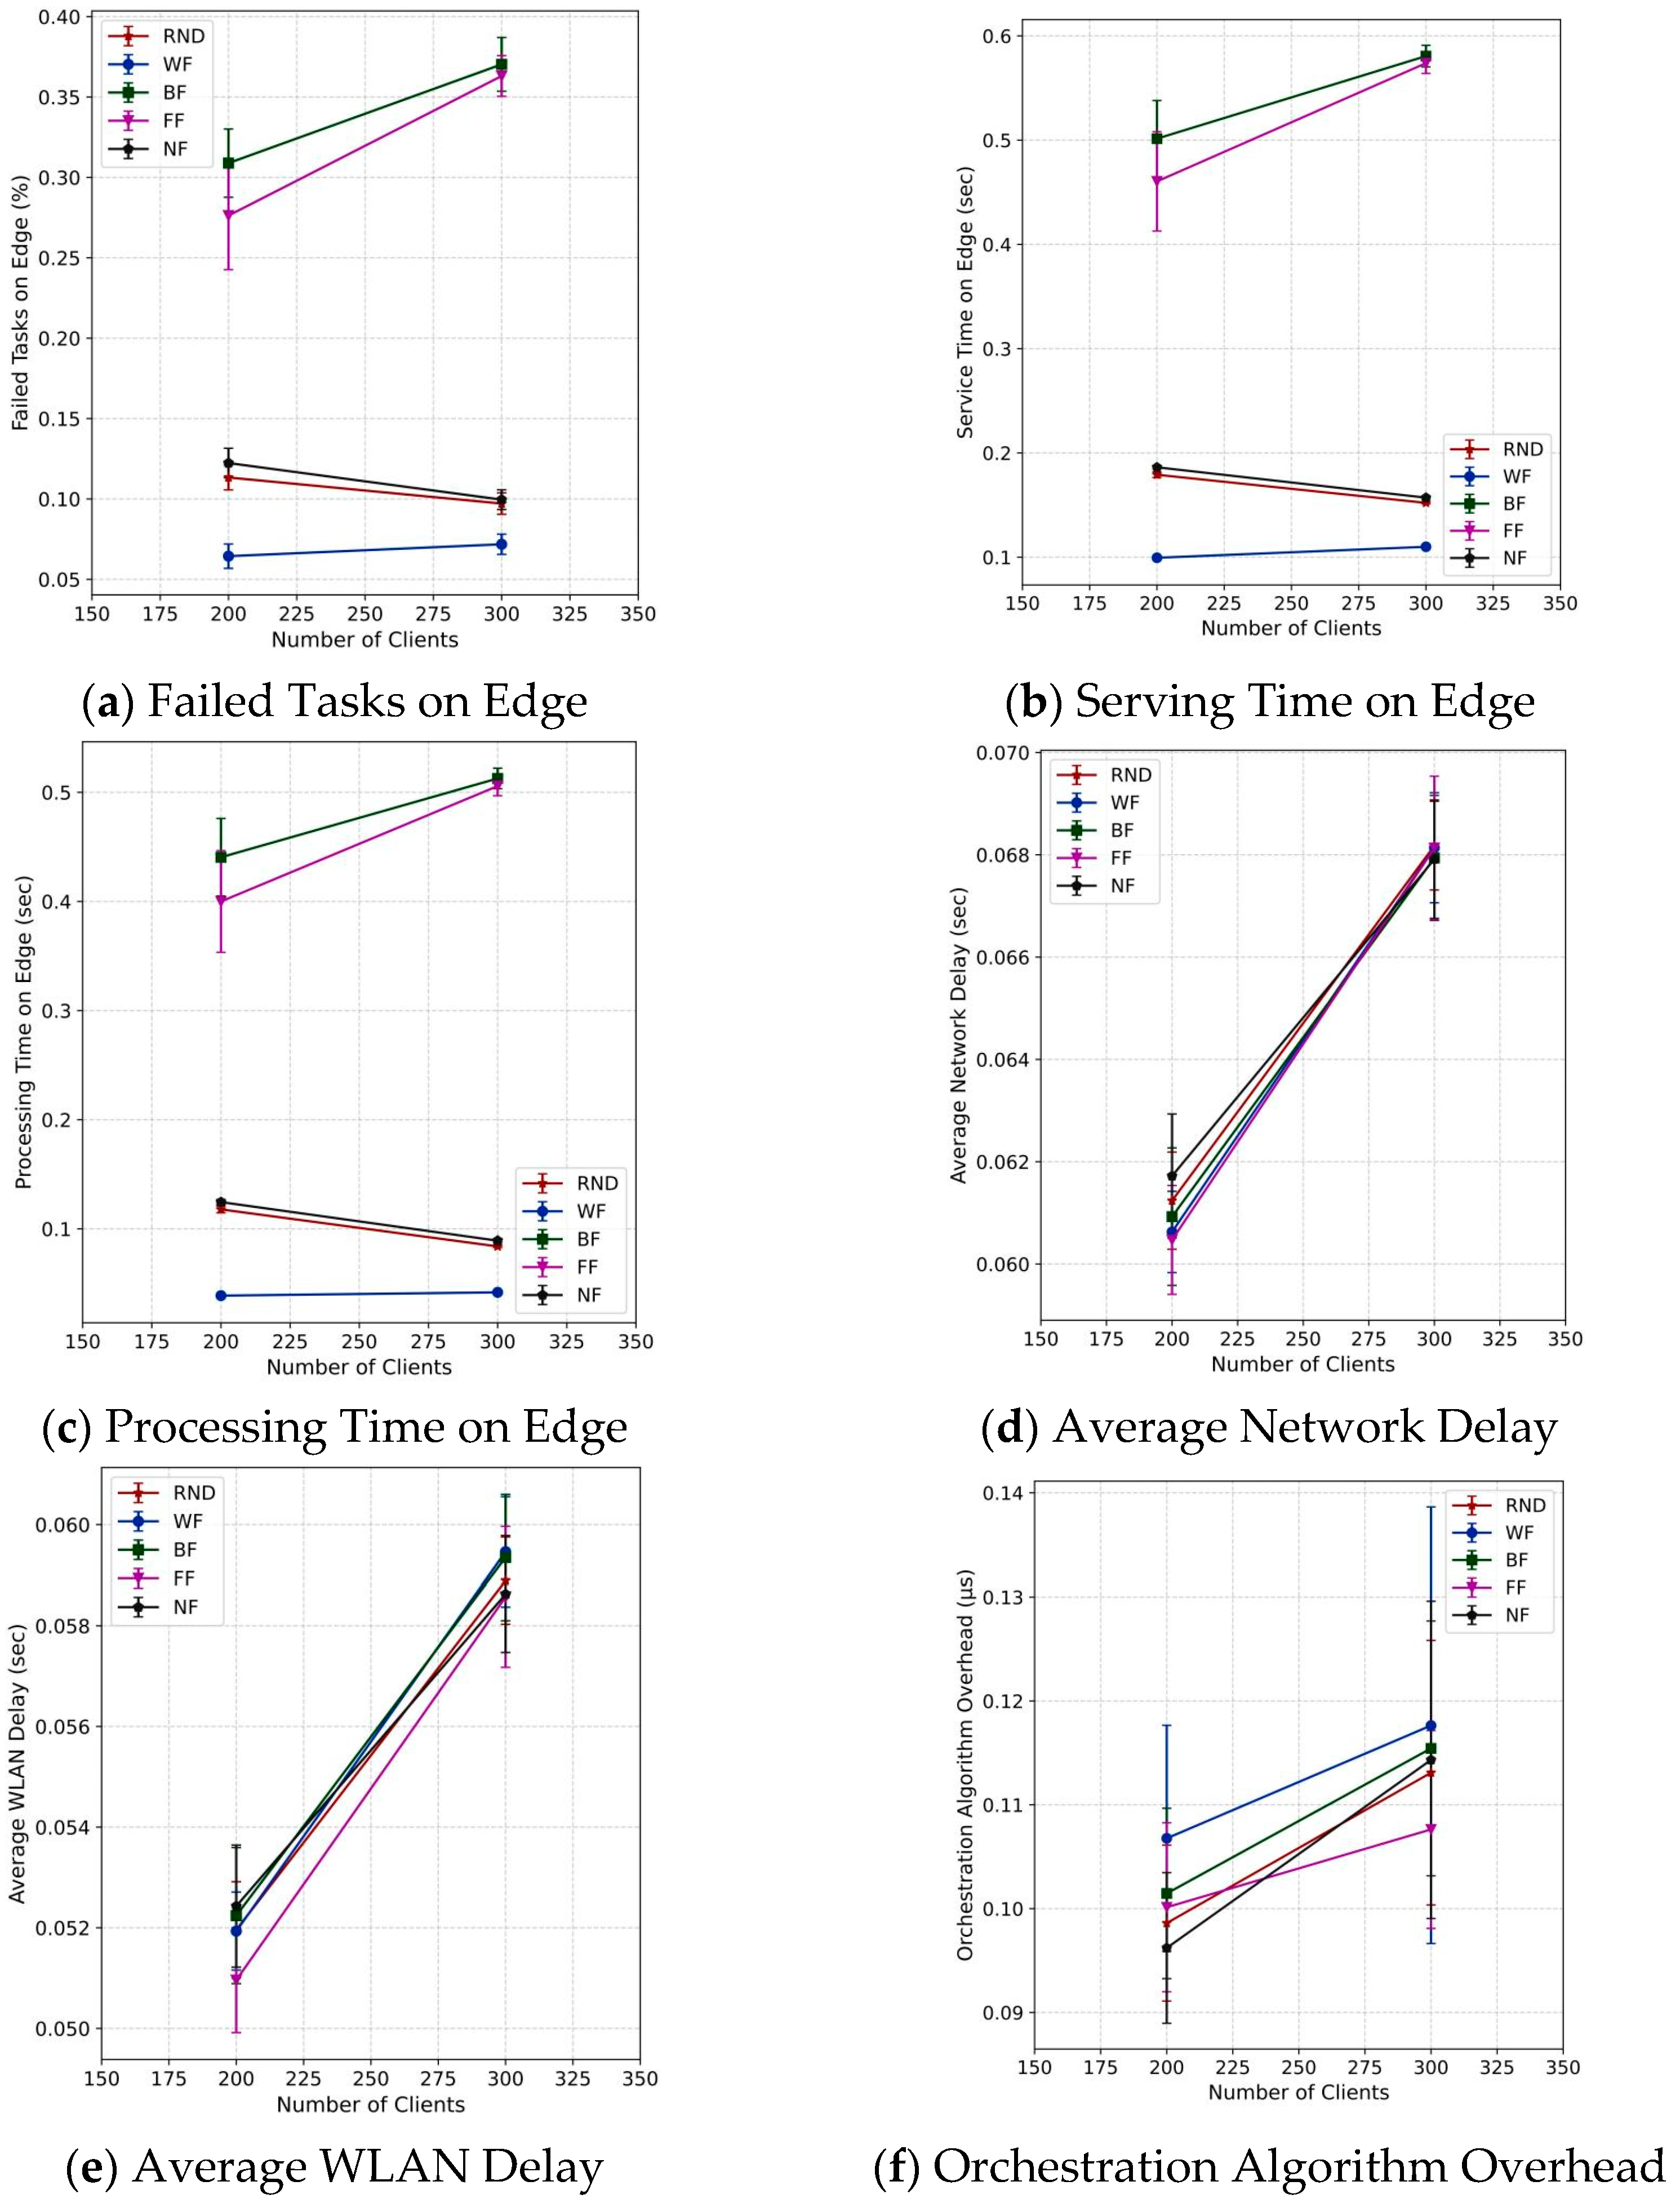
Failure Rate: As shown in Figure 12a, across all edge device counts, the failure rate of the core policy (WORST_FIT) was below 0.1%. Logs showed no failures due to insufficient VM capacity (sufficient memory redundancy in the configuration).
Latency Variation: As shown in Figure 12b–d, service time, processing time, and average network latency fluctuated slightly with the increase in the number of devices. As shown in Figure 12e, network latency was mainly dominated by WLAN latency (accounting for 80%+). Here’s an interesting phenomenon: as the number of devices increased, RANDOM_FIT and NEXT_FIT, due to their “low decision overhead” and “implicit load balancing characteristics,” could exhibit more stable and sometimes better average performance (service time, processing time) in high-concurrency scenarios.
Server Utilization: Steadily increased with the increase in the number of devices. Logs showed that BEST_FIT/FIRST_FIT had the highest utilization (reaching 1.5), while WORST_FIT had the lowest (0.098).
Orchestration Algorithm Overhead: As shown in Figure 12f, steadily increased with the increase in the number of devices. The WORST_FIT policy, due to its need for global resource sorting to select the node with the ‘most abundant resources,’ indeed had the highest decision-making overhead in its scheduling algorithm. However, this additional overhead was only on the microsecond (μs) level, while the end-to-end latency of tasks in the edge network was typically on the millisecond (ms) level. Therefore, this overhead was completely negligible in actual business latency. The trade-off for this small decision cost was better global load balancing and long-term system stability—a highly valuable engineering trade-off.
Conclusion: Increasing the number of devices does not affect core performance stability, and resource allocation was sufficient.
(2)
Performance comparison of scheduling strategies
Strategy performance analysis: As shown in Table 4, (1) Optimal strategy: WORST_FIT had the lowest failure rate (only 0.072%, this was because WORST_FIT had the largest resource redundancy and the least contention, so the failure rate was the lowest), which was much lower than other strategies. The average service time (0.112 s) and processing time (0.043 s) were the shortest, which was much close to the local inference latency of 26.32 ms (0.02632 s). The edge inference efficiency was close to that of local. (2) Worst strategy: BEST_FIT/FIRST_FIT had a failure rate of about 0.4%, which was more than 5 times that of WORST_FIT. The service time and processing time were 5–10 times that of WORST_FIT. This was because BEST_FIT was prone to fragmentation, which made the nodes fully loaded and caused subsequent tasks to fail. FIRST_FIT had concentrated node load, which increased the queuing latency. (3) Medium Strategy: RANDOM_FIT/NEXT_FIT performed well, with failure rates and latency falling between the two. However, some issues existed. While RANDOM_FIT distributed the load, randomness might lead to high loads. NEXT_FIT tended to cause resource utilization to exhibit a “wave-like” distribution over time, with some nodes experiencing short-term overload (increasing queuing latency) while other nodes remained idle.
Table 4. Performance comparison of scheduling strategies.
StrategyFailure Rate (%)Service Time (s)Processing Time (s)Average Network Latency (s)Server Utilization
WORST_FIT0.0720.1120.0430.06810.098
NEXT_FIT0.1050.1580.0810.06790.156
RANDOM_FIT0.0980.1530.0800.06830.148
FIRST_FIT0.3650.5740.5100.06821.387
BEST_FIT0.3780.5820.5220.06801.453
(3)
Verification of Key Configuration Rationality
Memory Configuration: The number of tasks failing due to VM capacity was 0 in all scenarios, indicating that the reserved redundancy of 640 MB for mobile devices and 740 MB for edge nodes (100 MB/200 MB) was sufficient, with no memory resource bottleneck.
Computational Load Configuration: The standard deviation of task computational load was 358.59 MI (mean 5%). Task load fluctuations were reasonable, and no processing timeouts occurred due to sudden increases in computational load.
Latency comparison: The average processing time of edge nodes was 0.043–0.522 s. Among them, WORST_FIT’s 0.043 s was close to the local inference latency of 0.02632 s. Edge inference remained efficient when multiple devices were connected.

4.8.3. Bottleneck Analysis and Mitigation Strategies for the Three-Layer Architecture

Based on the EdgeCloudSim simulation of the “mobile device—edge node—cloud” architecture, we identify the following key bottlenecks and propose corresponding mitigation strategies:
(1)
Edge Node Resource Saturation Bottleneck
Issue: Edge nodes had limited computational capacity. Under high concurrent task loads, nodes might become saturated, leading to increased processing time and higher task failure rates.
Mitigation: Our simulation identified WORST_FIT as the optimal scheduling strategy, which selected the edge node with the most abundant resources, effectively distributing load and minimizing saturation. Additionally, our improved YOLOv8 model design reduced individual task computational requirements, allowing more tasks to be processed per node.
(2)
Mobile-Edge Network Congestion Bottleneck
Issue: When multiple mobile devices transmitted image data simultaneously to edge nodes, network congestion could occur, increasing transmission latency.
Mitigation: The architecture could inherently reduce this bottleneck by transmitting only essential data. In practical deployment, implementing Quality of Service (QoS) mechanisms and adaptive transmission scheduling based on network conditions could further alleviate congestion.
(3)
Cloud Fallback Latency Bottleneck
Issue: When edge nodes were overloaded and tasks were offloaded to the cloud, the increased physical distance introduced significant latency, compromising real-time performance.
Mitigation: Proactive load balancing (using strategies like WORST_FIT) minimized the need for cloud fallback. For unavoidable fallbacks, implementing predictive pre-computation at the cloud layer for anticipated tasks could reduce processing latency.
(4)
Control Flow Latency and Reliability Bottleneck
Issue: The control flow, which transmits updated models and command signals from the cloud to edge nodes, can suffer from high latency, packet loss, or security vulnerabilities, especially over long-distance space communication links. Delays or failures in receiving updated models or control commands can hinder the system’s ability to adapt to new scenarios, execute time-sensitive maneuvers, or respond to anomalies in a timely manner.
Mitigation: To ensure robust and timely control flow, several strategies can be adopted:
(a)
Prioritized and Predictable Scheduling: Implement priority-based transmission scheduling for control messages to ensure they are delivered ahead of routine data traffic.
(b)
Reliable Transmission Protocols: Utilize reliable transport protocols (e.g., CCSDS with retransmission mechanisms) or forward error correction (FEC) to enhance delivery reliability over lossy channels.
(c)
Incremental and Compressed Updates: Instead of transmitting full model weights, employ incremental updates, model patching, or delta compression to reduce the size of control packets, thereby lowering transmission time and bandwidth consumption.
(d)
Edge-side Model Validation and Rollback: Implement versioning and validation mechanisms at the edge to safely integrate new models or commands, with the ability to rollback to a previous stable state if an update causes instability.
(5)
Memory Resource Fragmentation Bottleneck
Issue: As shown in the simulation, BEST_FIT and FIRST_FIT strategies, while maximizing resource utilization, could lead to memory fragmentation, making it difficult to allocate resources for larger subsequent tasks.
Mitigation: The WORST_FIT strategy naturally reduced fragmentation by allocating tasks to nodes with the most available resources. Periodic resource defragmentation algorithms can also be implemented at the edge node management level.
These bottleneck analyses and mitigation strategies demonstrate that the proposed three-layer architecture, when combined with intelligent scheduling and lightweight algorithms, can effectively support scalable spacecraft monitoring in cloud-edge IoT environments.

4.8.4. Summary

Reasonable resource allocation: The memory redundancy design of mobile terminals and edge nodes was effective, and the computational load parameters were set in accordance with actual load fluctuations, preventing task failures due to insufficient resources.
Optimal scheduling strategy: The WORST_FIT strategy performed optimally across all device counts, balancing low failure rate and low latency, making it suitable for edge computing scheduling in this scenario.
Good scalability: With the number of devices increasing from 200 to 300 and the task load increasing by 150%, core performance indicators (failure rate, latency) did not significantly deteriorate, indicating that edge node resources could support the expansion of device scale.
Advantages of edge inference: The average processing time of edge nodes (especially with the WORST_FIT strategy) was close to the latency of local inference, and it supported concurrent access from multiple devices, making it more scalable than local inference.

4.9. Limitations, Open Questions and Future Directions

Despite the demonstrated advantages in multi-target and cluttered scenarios, our model exhibited a slight performance trade-off in extremely simple scenes (e.g., single, isolated spacecraft against a clean background). This was attributed to the CSPPF module’s inherent design: its multi-layer contextual fusion mechanism, while excellent for integrating diverse features in complex environments, could introduce a degree of information redundancy or distraction when processing minimalistic targets. This observation underscored a fundamental challenge in edge-AI for aerospace: the tension between a model’s expressive power (for robustness) and its scene adaptability (for efficiency).
(1)
This limitation reveals several open questions for the research community:
(a)
Dynamic Feature Extraction: How can we design lightweight, adaptive neural modules that dynamically adjust their receptive fields and fusion strategies based on real-time scene complexity (e.g., target count, background clutter)?
(b)
Edge-Scene Awareness: Is it feasible to deploy an ultra-lightweight scene classifier on edge devices to guide the selection or reconfiguration of downstream vision models, optimizing the accuracy-efficiency balance on a per-input basis?
(c)
Quantifying Scene Complexity for Space: How can we rigorously define and quantify “scene complexity” in orbital imagery? Metrics based on target density, texture entropy, or semantic clutter could form the basis for adaptive algorithms.
(d)
Task-Aware Loss Functions: Can loss functions be designed to dynamically weight learning objectives based on inferred scene characteristics, focusing more on localization in simple scenes and on discrimination in complex ones?
(2)
Towards Deployment on Space-Qualified Hardware
The promising efficiency metrics and accuracy obtained on a constrained edge-GPU (RTX 4060) establish a strong foundation for the next logical step: assessing the feasibility of deployment on lightweight, space-qualified embedded hardware. Future work must transition from algorithmic validation to system-level implementation studies. This involves:
(a)
Hardware Selection and Profiling: Benchmarking the model on representative aerospace processors (e.g., radiation-hardened GPUs, FPGAs, or SoCs like NVIDIA Jetson Orin variants) to measure real-time throughput, power consumption, and thermal profiles under simulated orbital conditions.
(b)
Model Co-optimization: Applying further deployment-oriented optimizations such as int8 quantization, pruning, and knowledge distillation to meet stringent memory and latency budgets without compromising critical accuracy.
(c)
System Integration and Testing: Evaluating the model within a hardware-in-the-loop (HIL) simulation framework that includes sensor inputs (e.g., camera feeds), downstream tasks (e.g., pose estimation), and the spaceborne edge computing stack. Success in this endeavor would bridge the gap between a high-performance algorithm and a field-deployable, intelligent component for autonomous on-orbit services, ultimately testing the core hypothesis of cloud-edge IoT in the most demanding operational environment.

5. Conclusions

This study proposes an improved YOLOV8-Based spacecraft instance segmentation model. By incorporating the CSPPF module into the backbone network, this model efficiently tackles the issues of missed and incorrect target object detection. Additionally, WDIOU loss function is used by the model to assess the box regression loss, thereby tackling the inaccuracies in the prediction of target object coordinate boxes. This model effectively achieves instance segmentation.
Future work will explore dynamic neural network architectures and resource-aware inference strategies to create vision systems that are not only accurate but also context-efficient—a key step toward truly autonomous and resilient spaceborne IoT systems.

Author Contributions

Conceptualization, M.C.; methodology, Y.N.; software, W.C.; validation, P.Q.; investigation, F.W.; resources, Y.N.; writing—original draft preparation, M.C.; writing—review and editing, M.C. and W.C.; visualization, Y.N.; project administration, W.C.; funding acquisition, M.C., P.Q. and F.W. All authors have read and agreed to the published version of the manuscript.

Funding

This research was funded by Anhui Province University Key Science and Technology Project (grant number: 2024AH053415), Anhui Province University Major Science and Technology Project (grant number: 2024AH040229), Talent Research Initiation Fund Project of Tongling University (grant number: 2024tlxyrc019), Tongling University School-Level Scientific Research Project (grant number: 2024tlxyptZD07), Tongling University School-Level Scientific Research Plan Project (grant number: 2023tlxyptZD04), The University Synergy Innovation Program of Anhui Province (grant number: GXXT-2023-050), Tongling City Science and Technology Major Special Project (Unveiling and Commanding Model) (grant number: 200401JB004). And The APC was funded by Anhui Province University Key Science and Technology Project (grant number: 2024AH053415).

Data Availability Statement

The dataset presented in this study are available in https://github.com/cehndashuai/yolov8_pro_cssp.git (accessed on 13 January 2026).

Conflicts of Interest

The authors declare no conflict of interest.

References

  1. Chu, G.L. Study on the Key Technologies of Automatic Identification for Cooperative Target on Spacecraft. Ph.D. Thesis, University of Chinese Academy of Sciences (Changchun Institute of Optics, Fine Mechanics and Physics), Changchun, China, 2015. [Google Scholar]
  2. Cui, N.G.; Wang, P.; Guo, J.F. A Review of On-Orbit Servicing. J. Astronaut. 2007, 28, 805–811. [Google Scholar]
  3. Ling, L.X. Development of Space Rendezvous and Docking Technology in Past 40 Years. Spacecr. Eng. 2007, 16, 70–77. [Google Scholar]
  4. Yaseen, M. What is YOLOv8: An In-Depth Exploration of the Internal Features of the Next-Generation Object Detector. arXiv 2023, arXiv:2409.07813. [Google Scholar]
  5. Shi, W.; Cao, J.; Zhang, Q.; Li, Y.; Xu, L. Edge computing: Vision and challenges. IEEE Internet Things J. 2016, 3, 637–646. [Google Scholar] [CrossRef]
  6. Mao, Y.; You, C.; Zhang, J.; Huang, K.; Letaief, K.B. A survey on mobile edge computing: The communication perspective. IEEE Commun. Surv. Tutor. 2017, 19, 2322–2358. [Google Scholar] [CrossRef]
  7. Zhou, Z.; Chen, X.; Li, E.; Zeng, L.; Luo, K.; Zhang, J. Edge intelligence: Paving the last mile of artificial intelligence with edge computing. Proc. IEEE 2019, 107, 1738–1762. [Google Scholar] [CrossRef]
  8. Huang, T.; Li, H.; Zhou, G.; Li, S.B.; Wang, Y. Survey of Research on Instance Segmentation Methods. J. Front. Comput. Sci. Technol. 2023, 17, 810–825. [Google Scholar]
  9. Wu, T.; Yang, X.; Song, B.; Wang, N.; Gao, X.; Kuang, L.; Nan, X.; Chen, Y.; Yang, D. T-SCNN: A two-stage convolutional neural network for space target recognition. In IGARSS 2019—2019 IEEE International Geoscience and Remote Sensing Symposium; IEEE: New York, NY, USA, 2019; pp. 1334–1337. [Google Scholar]
  10. Armstrong, W.; Draktontaidis, S.; Lui, N. Semantic Image Segmentation of Imagery of Unmanned Spacecraft Using Synthetic Data; Technical Report; IEEE: New York, NY, USA, 2021. [Google Scholar]
  11. Hariharan, B.; Arbeláez, P.; Girshick, R.; Malik, J. Simultaneous detection and segmentation. In Computer Vision–ECCV 2014: 13th European Conference, Proceedings, Part VII 13, Zurich, Switzerland, 6–12 September 2014; Springer International Publishing: Berlin/Heidelberg, Germany, 2014; pp. 297–312. [Google Scholar]
  12. Arbeláez, P.; Pont-Tuset, J.; Barron, J.T.; Marques, F.; Malik, J. Multiscale combinatorial grouping. In Proceedings of the IEEE Conference on Computer Vision and Pattern Recognition, Columbus, OH, USA, 23–28 June 2014; pp. 328–335. [Google Scholar]
  13. Dai, J.; He, K.; Li, Y.; Ren, S.; Sun, J. Instance-sensitive fully convolutional networks. In Computer Vision–ECCV 2016: 14th European Conference, Proceedings, Part VI 14, Amsterdam, The Netherlands, 11–14 October 2016; Springer International Publishing: Berlin/Heidelberg, Germany, 2016; pp. 534–549. [Google Scholar]
  14. Chang, C.C.; Lin, C.J. LIBSVM: A library for support vector machines. ACM Trans. Intell. Syst. Technol. (TIST) 2011, 2, 1–27. [Google Scholar] [CrossRef]
  15. Girshick, R.; Donahue, J.; Darrell, T.; Malik, J. Rich feature hierarchies for accurate object detection and semantic segmentation. In Proceedings of the IEEE Conference on Computer Vision and Pattern Recognition, Columbus, OH, USA, 23–28 June 2014; pp. 580–587. [Google Scholar]
  16. Krizhevsky, A.; Sutskever, I.; Hinton, G.E. Imagenet classification with deep convolutional neural networks. Adv. Neural Inf. Process. Syst. 2012, 25, 1097–1105. [Google Scholar] [CrossRef]
  17. He, K.; Gkioxari, G.; Dollár, P.; Girshick, R. Mask R-CNN. In IEEE International Conference on Computer Vision (ICCV); IEEE: Piscataway, NJ, USA, 2017; pp. 2961–2969. [Google Scholar]
  18. Ren, S.; He, K.; Girshick, R.; Sun, J. Faster R-CNN: Towards Real-Time Object Detection with Region Proposal Networks. In Advances in Neural Information Processing Systems (NIPS); Neural Information Processing Systems Foundation, Inc.: San Diego, CA, USA, 2015; p. 28. [Google Scholar]
  19. Gao, N.; Shan, Y.; Wang, Y.; Zhao, X.; Yu, Y.; Yang, M.; Huang, K. Ssap: Single-shot instance segmentation with affinity pyramid. In Proceedings of the IEEE/CVF International Conference on Computer Vision, Seoul, Republic of Korea, 27 October–2 November 2019; pp. 642–651. [Google Scholar]
  20. Ke, L.; Danelljan, M.; Li, X.; Tai, Y.W.; Tang, C.K.; Yu, F. Mask transfiner for high-quality instance segmentation. In Proceedings of the IEEE/CVF Conference on Computer Vision and Pattern Recognition, New Orleans, LA, USA, 18–24 June 2022; pp. 4412–4421. [Google Scholar]
  21. Bolya, D.; Zhou, C.; Xiao, F.; Lee, Y.J. Yolact: Real-time instance segmentation. In Proceedings of the IEEE/CVF International Conference on Computer Vision, Seoul, Republic of Korea, 27 October–2 November 2019; pp. 9157–9166. [Google Scholar]
  22. Hurtik, P.; Molek, V.; Hula, J.; Vajgl, M.; Vlasanek, P.; Nejezchleba, T. Poly-YOLO: Higher speed, more precise detection and instance segmentation for YOLOv3. Neural Comput. Appl. 2022, 34, 8275–8290. [Google Scholar] [CrossRef]
  23. He, J.; Li, P.; Geng, Y.; Xie, X. Fastinst: A simple query-based model for real-time instance segmentation. In Proceedings of the IEEE/CVF Conference on Computer Vision and Pattern Recognition, Vancouver, BC, Canada, 17–24 June 2023; pp. 23663–23672. [Google Scholar]
  24. Wang, A.; Chen, H.; Liu, L.; Chen, K.; Lin, Z.; Han, J.; Ding, G. YOLOv10: Real-Time End-to-End Object Detection. In Proceedings of the 38th International Conference on Neural Information Processing Systems, Vancouver, BC, Canada, 9–15 December 2024; pp. 107984–108011. [Google Scholar]
  25. Zhao, F.; Shao, X.L.; Wang, J.Q.; Chen, Y.J.; Xi, D.H.; Liu, Y.Y.; Chen, J.D.; Sasaki, J.; Mizuno, K. A novel underwater Holothurians monitoring system using consumer-grade amphibious UAV with Mamba-based Super-Resolution Reconstruction and enhanced YOLOv10. Mar. Environ. Res. 2025, 212, 107510. [Google Scholar] [CrossRef] [PubMed]
  26. Wang, S. Automated non-PPE detection on construction sites using YOLOv10 and transformer architectures for surveillance and body worn cameras with benchmark datasets. Sci. Rep. 2025, 15, 27043. [Google Scholar] [CrossRef] [PubMed]
  27. Ammar, M. Enhancing real-time instance segmentation for plant disease detection with improved YOLOv8-Seg algorithm. Int. J. Inf. Technol. Secur. 2024, 16, 27–38. [Google Scholar] [CrossRef]
  28. Ma, J.; Li, F.F.; Wang, B. U-Mamba: Enhancing Long-range Dependency for Biomedical Image Segmentation. arXiv 2024, arXiv:2401.04722. [Google Scholar] [CrossRef]
  29. Zhao, F.; Xu, D.; Ren, Z.; Shao, X.; Wu, Q.; Liu, Y.; Mizuno, K. Mamba-based super-resolution and semi-supervised YOLOv10 for freshwater mussel detection using acoustic video camera: A case study at Lake Izunuma, Japan. Ecol. Inform. 2025, 90, 103324. [Google Scholar] [CrossRef]
  30. You, S.; Li, B.; Chen, Y.; Ren, Z.; Liu, Y.; Wu, Q.; Zhao, F. Rose-Mamba-YOLO: An enhanced framework for efficient and accurate greenhouse rose monitoring. Front. Plant Sci. 2025, 16, 1607582. [Google Scholar] [CrossRef] [PubMed]
  31. Chen, M.; Chen, W.J.; Niu, Y.F.; Qi, P.; Wang, F.C. Yolov8_Pro_Cssp. [Computer Software, GitHub Repository]. 2025. Available online: https://github.com/cehndashuai/yolov8_pro_cssp.git (accessed on 13 January 2026).
  32. Dung, H.A.; Chen, B.; Chin, T.J. A spacecraft dataset for detection, segmentation and parts recognition. In Proceedings of the IEEE/CVF Conference on Computer Vision and Pattern Recognition, Nashville, TN, USA, 19–25 June 2021; pp. 2012–2019. [Google Scholar]
  33. Bolya, D.; Zhou, C.; Xiao, F.Y. YOLACT++: Better Real-time Instance Segmentation. IEEE Trans. Pattern Anal. Mach. Intell. 2022, 44, 1108–1121. [Google Scholar] [CrossRef] [PubMed]
  34. Ultralytics. 2020. Available online: https://github.com/ultralytics/yolov5 (accessed on 13 January 2026).
  35. Wang, C.Y.; Yeh, I.H.; Mark Liao, H.Y. YOLOv9: Learning What You Want to Learn Using Programmable Gradient Information. In European Conference on Computer Vision; Springer Nature: Cham, Switzerland, 2024; pp. 1–21. [Google Scholar]
  36. Tian, Y.; Ye, Q.; Doermann, D. YOLOv12: Attention-Centric Real-Time Object Detectors. arXiv 2025, arXiv:2502.12524. [Google Scholar]
Figure 1. Cloud-Edge IoT System Architecture.
Futureinternet 18 00059 g001
Figure 2. The overall architecture of the model.
Futureinternet 18 00059 g002
Figure 3. Comparison of image fusion strategies.
Futureinternet 18 00059 g003
Figure 4. The specific architecture of CSPPF.
Futureinternet 18 00059 g004
Figure 5. Comparison of the segmentation effect of a single target spacecraft instance with background.
Futureinternet 18 00059 g005
Figure 6. Comparison of the segmentation effect of multi-target spacecraft instance with background.
Futureinternet 18 00059 g006
Figure 7. Comparison of the segmentation effect of a single target spacecraft instance without the background.
Futureinternet 18 00059 g007
Figure 8. Comparison of accuracy between original and improved YOLOV8 models.
Futureinternet 18 00059 g008
Figure 9. Comparison of instance segmentation loss between original and improved YOLOV8 models.
Futureinternet 18 00059 g009
Figure 10. Comparison of training bounding box loss between original and improved YOLOV8 models.
Futureinternet 18 00059 g010
Figure 11. The three-layer framework diagram and data flow of Cloud-Edge IoT system architecture.
Futureinternet 18 00059 g011
Figure 12. The impact of the number of devices on core metrics.
Futureinternet 18 00059 g012
Disclaimer/Publisher’s Note: The statements, opinions and data contained in all publications are solely those of the individual author(s) and contributor(s) and not of MDPI and/or the editor(s). MDPI and/or the editor(s) disclaim responsibility for any injury to people or property resulting from any ideas, methods, instructions or products referred to in the content.