1. Introduction
The deployment of Internet of Things (IoT) technologies has grown rapidly in multiple areas, particularly in Smart City initiatives, where dense digital infrastructure, stable connectivity, and centralized or cloud-based services enable advanced automation and real-time data analysis. Inspired by these models, the Smart Village [
1,
2] concept was proposed to adapt Smart City principles to rural areas. However, these approaches typically focus on populated areas, ignoring uninhabited or low-population areas, such as remote agricultural lands, cultural heritage sites, and decentralized energy systems, where AI-assisted monitoring, anomaly detection, and asset protection are equally crucial. To expand the scope of rural innovation, the concept of Smart Rural Development has emerged. This emphasizes the integration of smart technologies into all types of rural environments, with or without inhabitants, with the goal of achieving inclusive, sustainable, and secure development [
3]. Despite their potential in fields such as agriculture, heritage conservation, and environmental monitoring, rural areas often suffer from poor Internet coverage, limited access to skilled personnel, limited energy supplies, and poor infrastructure. Therefore, unlike smart cities, Smart Rural deployments must operate under more restrictive conditions. These constraints impact the choice of communication protocols and challenge the applicability of existing tools and datasets for performance testing and cybersecurity evaluation.
Cybersecurity is especially critical in rural contexts, due to the increasing digitization of essential services such as irrigation, heritage conservation, wildfire detection, energy microgrids, and livestock monitoring. Security breaches can impact these critical services, causing significant economic losses, environmental damage, and even risks to human safety. These systems are often unmonitored and usually lack on-site technical staff, making it difficult to detect and respond to cyber threats. Various risks and vulnerabilities in smart farming environments have already been identified [
4], including attacks that can lead to crop losses or equipment damage. This was further illustrated by [
5], who showed how Denial of Service (DoS) attacks can disrupt smart agriculture by targeting ground sensors and autonomous vehicles, reinforcing the need for cybersecurity awareness in these ecosystems. Therefore, improving the responsiveness of IoT networks through context-aware intrusion-detection mechanisms and robust security architectures is not only relevant but essential for smart and sustainable rural development.
Table 1 summarizes key differences between typical urban and rural IoT deployments, showing why distinct approaches are required to ensure effective design, testing, and security in rural deployments.
The Smart Rural IoT Lab addresses this gap by providing a low-cost, modular, and autonomous platform capable of simulating realistic rural IoT deployments and generating real-world network traffic datasets. Additionally, the laboratory facilitates the exploration of use cases such as remote environmental monitoring, livestock and agricultural machinery tracking, control of access to facilities, and the protection of cultural heritage sites, offering a practical foundation for future developments in rural IoT applications and cybersecurity research.
The primary objective of the Smart Rural IoT Lab is to provide a reproducible research infrastructure for experimenting with IoT technologies in Smart Rural environments. The platform enables the evaluation of communication protocols and security mechanisms, and supports the generation of datasets composed of both raw network traffic and preprocessed logs suitable for further analysis.
The remainder of this work is structured as follows:
Section 2 reviews relevant work on rural IoT testbeds, datasets, and cybersecurity.
Section 3 and
Section 4 describe the architecture of the Smart Rural IoT Lab, the experimental scenarios, and the methodology used for traffic capture and preprocessing.
Section 5 presents the results of the experimental evaluation of the implemented scenarios and dataset generation.
Section 6 analyzes the implications of these results. Finally,
Section 7 concludes the paper by summarizing the main contributions of the laboratory and outlining future research directions.
2. Related Work
In recent years, various experimental platforms and datasets have been proposed to support IoT and cybersecurity research. However, most of them focused on industrial or urban environments, often assuming stable connectivity, abundant energy sources, and access to data centers. Simulation tools such as GNS3 [
6] and CupCarbon [
7] offer flexibility for designing wireless sensor networks, but they do not integrate real hardware and fail to reflect the unpredictability of wireless communication.
While AI-based Intrusion-Detection Systems (IDS) have shown promise in adapting to evolving threat landscapes [
8,
9], these tools are typically trained on datasets generated in controlled, urban-like environments, ignoring the specific conditions of rural deployments [
10,
11,
12]. In addition, existing research laboratories in IoT, cybersecurity, and AI are mostly designed for urban or industrial settings [
13,
14], with access to high-speed networks and data centers. This gap highlights the need for an experimental environment that mimics real-world rural conditions, especially when using AI algorithms [
15].
One of the most significant gaps is the lack of datasets that represent real traffic in rural IoT networks. Most datasets commonly used for intrusion detection, such as CIC-IDS2017 [
14] and UNSW-NB15 [
16], were created in enterprise environments and do not consider the unique conditions of rural deployments. Other datasets, such as ToN-IoT [
12] or Edge-IIoTset [
17], were developed for industrial contexts and still lack the characteristics that make rural environments unique, such as long communication distances, sporadic connectivity or limited power supply. Several documents, such as the LoRaWAN Security Whitepaper [
18], explore vulnerabilities and security measures in LoRaWAN but do not provide real datasets for evaluating attacks in rural networks. While LoRaWAN offers solutions for low-power and long-range transmission, these networks are highly affected by environmental conditions, terrain, and interference.
In addition, several simulation tools [
19,
20] have been developed to facilitate IoT experimentation. Tools for generating IoT network traffic can be categorized into three types: hardware-based, simulation-based, and hybrid. Hardware-based solutions use real IoT devices, offering a high level of realism. Simulation-based tools, such as CupCarbon-Lab [
7] and GNS3 [
6], use device virtualization, simulating their behavior, but these tools sacrifice some degree of realism. Hybrid approaches, such as GothX [
21] (an evolution of the Gotham Testbed [
22]), combine real and virtual devices to balance the advantages and limitations of previous approaches. However, the literature lacks comprehensive reviews focused exclusively on rural IoT traffic generation, indicating a shortage of specialized tools for this purpose.
3. Materials
The technologies, hardware, and software components selected for this work were chosen with the specific goal of ensuring viability, replicability, and resilience in rural environments. The Smart Rural IoT Lab relies exclusively on low-cost commercial devices and open-source tools, to demonstrate that IoT and cybersecurity research can be conducted without the need for high-end infrastructure.
All devices and tools were selected for their low power consumption, compatibility with open-source ecosystems, and support for various communication protocols. By integrating modular and widely compatible hardware, such as ESP32 microcontrollers, sensors, and Dragino gateways, with containerized software platforms such as Node-RED, InfluxDB, and Grafana, the laboratory provides a solid foundation for experimentation in IoT, cybersecurity, and AI in real-world rural conditions.
This section describes the components of the laboratory, including the sensors, gateways, computing devices, and software stack implemented to manage the data acquisition, communication, storage, and visualization.
To ensure the system reflects the challenges of rural environments, the laboratory was designed with devices that have limited computational power and energy consumption, and it uses robust protocols under constrained network conditions. The system prioritizes edge computing and local data storage. Although the laboratory is currently deployed indoors, its modular and portable design allows for future deployment in real rural settings.
3.1. WiFi and Mesh Networks in Rural IoT
One of the main challenges in rural IoT deployments is the lack of reliable connectivity. Unlike urban areas with high-speed networks and stable WiFi coverage, rural regions often lack even basic infrastructure. This directly impacts the implementation of monitoring systems, smart agriculture applications, and environmental sensing networks that depend on stable data transmission.
In these scenarios, WiFi and mesh networks emerge as viable alternatives. WiFi, which uses the IEEE 802.11 standard [
23], is characterized by its wide availability, low latency, and high data rates. However, in practice, it has some important limitations in rural environments. Its range is usually limited between 30 and 100 m [
24] and the need for a continuous power supply can become a problem in areas that rely on solar or battery power [
25]. Even with these limitations, WiFi can be a viable option in rural contexts where devices are concentrated in a well-managed area with access to power and network infrastructure.
To extend the effective range of WiFi networks and improve resilience, mesh networks distribute communication across multiple nodes, allowing dynamic routing and broader coverage in hard-to-reach areas. This architecture is especially valuable in rural scenarios where infrastructure is sparse or geographically dispersed. Additionally, mesh networks support incremental expansion with minimal reconfiguration and are often compatible with low-power devices [
26].
Furthermore, hybrid approaches are becoming increasingly relevant. Integrating mesh networks with LoRaWAN [
27,
28] or Zigbee [
29,
30] enables connectivity across different distances and power constraints, combining the reliability of local mesh infrastructure with the range and efficiency of long-range and low-power technologies.
Overall, while WiFi alone may not be optimal for all rural IoT scenarios, combining it with mesh topologies and other communication protocols provides a solid foundation for practical and scalable IoT deployments in these environments.
3.2. IoT Communication Protocols
In every IoT implementation, especially in rural environments, selecting an appropriate communication protocol is a crucial design decision [
31]. These systems often face constraints such as limited bandwidth, limited energy resources, and poor connectivity. Therefore, the communication layer must be efficient and robust.
Several protocols are particularly relevant for such conditions, each offering a different balance between energy consumption, data reliability, latency, and security features. Among the long-range options, LoRaWAN stands out for its low-power operation and star topology, where end devices transmit to central gateways [
27,
32]. It supports both public and private infrastructures, incorporates AES-128 encryption [
18], and offers flexible communication modes through device classes A, B, and C [
33].
For short-range communication, MQTT (Message Queue Telemetry Transport) is a publish–subscribe protocol that allows multiple devices to communicate asynchronously through an MQTT broker, optimizing communication in systems with multiple sensors. However, it lacks native security and depends on external solutions like TLS (Transport Layer Security) for encryption and access control [
34,
35,
36,
37,
38]. Another protocol widely used in IoT implementations is HTTP. It is used in IoT due to its broad compatibility and ease of integration with web services [
39]. However, its request–response architecture requires a stable and permanent connection to a server for data transmission, making it less suitable for battery powered or intermittently connected devices [
40]. The User Datagram Protocol (UDP) is often chosen for use cases that prioritize speed and minimal latency. This protocol is useful in applications with limited response times or where occasional data loss is acceptable [
24,
25]. However, UDP lacks native security and delivery guarantees, so it requires the implementation of complementary security measures [
40]. Lastly, the Constrained Application Protocol (CoAP) offers an attractive option for resource-constrained devices. It mirrors HTTP’s model but is optimized for constrained devices over UDP, reducing overhead and supporting DTLS (Datagram Transport Layer Security) for secure transmissions [
39,
40,
41].
Table 2 summarizes the main characteristics of IoT communication protocols used in this work: MQTT, CoAP, HTTP, UDP, and LoRaWAN. Each protocol is analyzed across several key dimensions relevant to rural IoT deployments, such as communication model and security support.
3.3. Data Management, Storage, and Visualization Tools
Efficient data management is essential in any IoT implementation, particularly in rural settings, where cloud connectivity may be limited. To ensure autonomy and resilience, the Smart Rural IoT Lab integrates open-source tools covering the entire data lifecycle.
The core of the system is Node-RED v4.0.9, a flow-based programming tool that simplifies the integration of IoT devices and services through a visual interface [
42], which allows users to define the system logic by connecting functional nodes. In the laboratory infrastructure, Node-RED acts as the control layer, managing the data flow between sensors and storage systems.
Sensor data are stored in two databases. InfluxDB v2.7.6 is used for time-series data, due to its high performance in storing timestamped records, such as environmental measurements and motion detections [
43,
44]. The laboratory also uses MongoDB v7.0.9, a document-oriented NoSQL database [
45]. In rural IoT applications, where data structures may evolve over time, MongoDB provides schema flexibility, allowing IoT systems to store sensor metadata, configuration settings, and historical records in a way that is easily adaptable to changing requirements.
To make sensor data accessible and interpretable, the laboratory includes Grafana v11.0.0 [
46], an open-source visualization platform widely used in IoT projects, allowing the creation of interactive dashboards. Through these dashboards, users can explore sensor data such as temperature trends and motion sensor activity.
All services are deployed in Docker [
47] containers on a Debian-based virtual machine, for modularity and reproducibility. This setup ensures that the laboratory can be replicated in other environments, supporting collaborative research.
By combining these tools, the Smart Rural IoT Laboratory demonstrates that it is possible to implement robust data infrastructure in low-resource environments.
3.4. IoT Hardware and Devices
The effectiveness of any IoT deployment does not only depend on the software and communication protocols. In rural environments, hardware selection becomes an important decision. The success of IoT deployments in rural environments relies heavily on robust and scalable hardware solutions.
For long-range communications, the laboratory uses Dragino devices (Dragino Technology Co., Shenzhen, China) compatible with LoRaWAN such as the Dragino sensors, LHT65 (temperature and humidity), LGT-92 (GPS tracking), and LDS02 (door status monitoring). These devices offer reliable performance in low-power scenarios and are suitable for deployment in open fields, and remote or off-grid infrastructure. In addition, the Mikrotik LR8 Kit (SIA Mikrotīkls, Riga, Latvia) and Dragino LPS8 gateways (Dragino Technology Co., Shenzhen, China) are used as bridges between end devices and backend services. The laboratory supports both public infrastructure via The Things Network and private, offline deployments, thus eliminating the dependence on cloud services.
Complementing the LoRaWAN scenarios, WiFi-based scenarios use ESP32 Arduino microcontrollers (Espressif Systems, Shanghai, China), known for their low cost, energy efficiency, and compatibility with various sensors and communication modules [
48,
49]. The low-cost sensors employed in this work were purchased through online retailers, as they correspond to generic modules commonly available from multiple suppliers. In WiFi-based scenarios, the Dragino LPS8 router acts as an access point and a Raspberry Pi 3 (Raspberry Pi Foundation, Cambridge, UK) captures network traffic, enabling dataset generation and protocol analysis.
The entire backend runs on a Debian Linux virtual machine, where the services are deployed in Docker containers. A Windows 11 workstation is also used, serving as a development platform for programming the ESP32 microcontrollers and managing configurations.
Table 3 and
Table 4 list all hardware, operating systems, and software tools used. These components were selected not only for their performance and compatibility, but also for their relevance to real-world deployments, prioritizing low-cost, reliable devices suitable for long-term operation in these types of environments.
In short, the laboratory demonstrates that it is possible to build and maintain a research platform using affordable hardware. This approach reinforces the idea that rural innovation does not require expensive infrastructure and can be implemented through the use of open technologies.
3.5. Cybersecurity in IoT
As IoT technologies become more integrated into daily life, cybersecurity has become a central concern, specially in rural areas, where connectivity is limited and devices are often found in isolated or unattended environments. These conditions make it more difficult to monitor and react to incidents, increasing the risk of data breaches, unauthorized access, and service interruptions.
The Smart Rural IoT Lab addresses this by incorporating secure communication protocols. LoRaWAN includes AES-128 encryption for long-range transmissions [
18], while MQTT [
38] and CoAP can be secured using TLS or DTLS, enabling both secure and non-secure network configurations for experimentation.
In addition to communications security, anomaly detection is essential for identifying attacks or system failures. In this context, artificial intelligence models trained on network traffic datasets, such as ToN-IoT and UNSW-NB15, have shown they can support automated anomaly detection, identifying patterns associated with intrusion attempts or system anomalies [
12,
52]. While the current work does not implement specific AI models, the infrastructure has been designed to facilitate future research in AI-assisted intrusion detection based on real traffic data by capturing network traffic and processing it with tools like Zeek, thereby generating datasets that will be useful in these types of tasks.
Finally, securing the IoT in rural environments requires an approach that integrates secure communication, access control, and anomaly detection, among others.
In summary, the laboratory is composed of affordable, energy-efficient devices and open-source tools. The combination of WiFi, LoRaWAN, and mesh technologies provides flexibility for a wide range of rural IoT applications, while the modular software and hardware design ensures replicability and future expansion.
4. Methods
This section describes the methodology followed for the implementation of the laboratory. It includes the deployment of the physical and logical infrastructure, the definition of six experimental scenarios based on different IoT protocols and sensor types, and the procedures followed to capture and process network traffic for further analysis.
One limitation of the current laboratory is the lack of the environmental variability typical of real-world rural outdoor conditions. All experiments were conducted indoors under stable conditions, meaning the platform does not yet account for the signal degradation caused by distance, geographic obstacles, vegetation, or weather effects. These physical layer dynamics can significantly impact performance in rural environments. Outdoor testing is planned for future phases, to evaluate the system’s robustness under realistic physical conditions.
4.1. Infrastructure
The physical architecture of the laboratory combines long-range and short-range communication systems to reflect the diversity of technologies found in rural deployments. As illustrated in
Figure 1, the laboratory integrates LoRaWAN and WiFi devices, allowing for simultaneous testing of different configurations and use cases.
As mentioned before, LoRaWAN scenarios include commercial sensors such as Dragino LHT65, LGT-92, and LDS02, which communicate using long-range, low-power transmissions with Mikrotik LR8 kit and Dragino LPS8 gateways. Depending on the scenario, sensor data can be sent to The Things Network [
53] or processed locally using Eclipse Mosquitto MQTT broker v2.0.18 [
37], installed on the laboratory’s backend.
To complement this setup, WiFi-based scenarios employ ESP32 microcontrollers connected to various sensors (motion, temperature/humidity, vibration, and distance) using MQTT, HTTP, UDP, or CoAP for communication.
Figure 2 presents the logical topology of the network, detailing how data flow between devices and storage systems. This diagram is essential for understanding the integration between communication technologies and the software stack.
The laboratory operates within a dedicated virtualized environment with Docker [
47], hosting core IoT services such as Mosquitto MQTT Broker, Node-RED, InfluxDB, MongoDB, and Grafana for data handling and visualization. A Raspberry Pi 3 Model B is also deployed as a gateway and passive traffic capture node, playing a key role in WiFi scenarios by enabling passive monitoring, without interfering with normal operations. In addition, a Windows 11 workstation was used to flash firmware on ESP32 devices and also to interact with the backend through web interfaces and file transfer tools.
4.2. Experimental Scenarios
The laboratory is structured around six scenarios, designed to generate representative network traffic. Additionally, the collected data will serve as a foundation for AI-driven research in areas such as alert triage, root cause analysis, and collaborative threat response strategies.
The first scenario emulates a rural deployment using a public LoRaWAN infrastructure, The Things Network, which is commonly adopted in smart agriculture, cultural heritage monitoring, and wildfire detection. These use cases typically require remote acquisition of environmental data, such as temperature, humidity, or livestock location, without the need for on-site infrastructure. Two commercial LoRaWAN Dragino sensors are used: the LHT65, designed for measuring temperature and humidity and the LGT-92, a device for geolocation tracking, which were configured using Over The Air Activation. The data are received by a Mikrotik LR8 gateway and forwarded to The Things Network servers, where data are made accessible through an MQTT broker. A Node-RED flow (
Figure 3) subscribes to this MQTT broker, decodes the incoming payloads, and transforms them into readable data structures, which are then stored in InfluxDB and MongoDB.
The second scenario, LoRaWAN with Activation by Personalization (ABP), explores an alternative deployment of LoRaWAN that does not rely on Internet connectivity or external cloud services. This scenario implements a fully local LoRaWAN infrastructure using a Dragino LDS02 sensor (Dragino Technology Co., Shenzhen, China), designed for detecting the open and closed status of doors or gates, useful for monitoring facilities like barns or livestock enclosures, where door status and access control are essential for safety and intrusion detection. The sensor is configured in ABP mode with predefined authentication parameters and transmits data to a Dragino LPS8 gateway, which is set up in private mode to manage the LoRaWAN network autonomously. The LPS8 gateway is configured to forward all incoming data directly to a local Mosquitto MQTT broker, hosted on the same dockerized virtual machine as used in Scenario 1. Then, the data are processed using Node-RED (
Figure 4), which manages topic subscriptions, payload decoding, and routing of messages to the data storage systems.
The third experimental scenario in the laboratory explores the integration of WiFi connectivity with the MQTT protocol to enable efficient short-range communication between IoT devices. This configuration simulates real-time alert systems in enclosed rural infrastructures, such as animal sheds or machinery rooms, where motion detection can help monitor unauthorized access, animal movement, or equipment usage. The experimental setup consists of an Arduino ESP32 development board connected to a PIR motion sensor (HC-SR501), which is capable of detecting movement within a specific coverage area. The ESP32 device is programmed to connect to a WiFi network managed locally via a Dragino LPS8 router and publishes motion detection events in JSON format to a designated topic on a Mosquitto MQTT broker. Then, sensor readings are processed through Node-RED (
Figure 5) and directed to the appropriate storage systems.
The fourth experimental scenario in the Smart Rural IoT Laboratory explores an IoT communication system based on HTTP over WiFi. The hardware setup includes an Arduino ESP32 microcontroller connected to two sensors: a DHT11 for measuring temperature and humidity, and a KY-038 sound sensor for detecting ambient noise. The ESP32 is programmed to collect data at regular intervals and send them via HTTP POST requests to a server hosted on the backend of the laboratory. Network connectivity is provided by a Dragino LPS8 router, functioning as a local WiFi access point.
On the software side, as
Figure 6 shows, Node-RED flow represents an HTTP endpoint capable of handling incoming POST requests. Once data have been received, a switch node is used to differentiate between the two sensor types, so their data can be decoded, cleaned, and directed to InfluxDB and MongoDB.
This scenario addresses environmental control in agricultural buildings, such as greenhouses or storage areas, where monitoring temperature, humidity, and sound levels is key to maintaining crops, livestock health, and infrastructure conditions.
The fifth experimental scenario investigates the use of UDP for IoT communication over WiFi networks. This setup targets applications requiring fast, low-latency communication, such as vibration monitoring in silos or livestock scales, as well as detecting rainfall or water levels in tanks for irrigation or water resource management. An ESP32 microcontroller is used in conjunction with two sensors: a KY-002 vibration sensor, which detects physical motion, and a water level sensor, which can monitor the presence or height of liquid. The ESP32 is programmed to send sensor readings via UDP in real time, using JSON-formatted payloads. For every UDP packet received, Node-RED parses the incoming data through a dedicated UDP-IN node, which feeds the messages into a processing flow (
Figure 7), where they are categorized based on sensor type. The decoded sensor data are then stored in our two databases, InfluxDB and MongoDB.
The sixth and final experimental scenario explores the use of CoAP over WiFi networks. CoAP is a lightweight protocol designed specifically for resource-limited systems and follows a request–response model similar to HTTP but optimized to run over UDP, significantly reducing overhead and energy consumption. This configuration reflects lightweight, power-efficient sensing for measurement tasks in rural facilities, such as detecting the presence or movement in milking stations or measuring distance to verify occupancy or equipment positioning. In this deployment, the ESP32 microcontroller is connected to an HC-SR04 ultrasonic sensor, which measures distance by emitting sound waves and detecting their reflection. The ESP32 device is configured to perform regular measurements and sends the sensor readings to a CoAP server hosted on the dockerized Node-RED instance.
Figure 8 shows Node-RED flow equipped with a CoAP-IN node configured to listen for PUT requests on a specified endpoint. Once a message has been received, its payload is parsed using a JSON conversion node and then forwarded for further processing, to be finally stored in InfluxDB and MongoDB.
Grafana dashboards were configured for each scenario to support data analysis. Each dashboard is customized to display the data collected in each scenario: monitoring temperature, sound levels, analyzing door status logs, or water level variations. This visualization layer facilitates anomaly detection, pattern recognition, and manual data inspection. Together, these interfaces help contextualize the sensor behavior and validate system performance across scenarios.
Most tests were performed in a controlled indoor environment, including sensor activation, communication tests, and data capture validation. The GPS-based scenario was verified outdoors to confirm signal acquisition and location accuracy. Future iterations will consider more extensive outdoor field testing.
Each scenario can be executed independently, with a focus on verifying functionality and the persistence of sensor data. For each test, the same sequence of steps was followed, using a repeatable procedure:
Sensor Setup: The corresponding end device was programmed and configured with specific parameters.
Network Configuration: Network setup was different depending on the type of connectivity. LoRaWAN scenarios used gateways linked to The Things Network or operating in stand-alone mode. WiFi scenarios used a local access point provided by a Dragino LPS8 router.
Transmission Phase: Once the network had been established, the devices began transmitting data, including temperature, motion, and distance measurements, at regular intervals.
Processing and Storage: Incoming data were processed using Node-RED flows adapted for each protocol. Messages were then decoded and stored in InfluxDB and MongoDB for later processing.
Verification: Grafana dashboards were used to monitor the data and confirm correct parsing and storage. Database entries were manually checked to confirm completeness and structure.
Together, these scenarios cover various protocols and use cases relevant to rural IoT. They not only validate the technical viability of smart rural infrastructures but also enable the generation of datasets. Although the platform is capable of supporting AI-based analytics, this work focuses solely on validating the infrastructure and generating datasets to enable such research in future phases.
Table 5 summarizes the six experimental scenarios, highlighting their protocols and representative rural use cases.
4.3. WiFi Traffic Capture and Dataset Generation
An essential goal of the laboratory is the generation of structured and realistic datasets that reflect the actual behavior of IoT devices in rural conditions. Unlike many simulation-based datasets, the laboratory focuses on capturing real network traffic generated by physical devices operating in a live network environment.
Traffic capture focuses on the four WiFi-based configurations (MQTT, HTTP, UDP, and CoAP), selected for their full observability, without encryption or third-party infrastructure. A Raspberry Pi 3 Model B, positioned as a passive gateway between sensors and backend systems, intercepts all communication, without interfering with sensor operations or altering transmissions.
Network traffic is captured in Packet CAPture (PCAP) format using the Tcpdump [
54] tool, which records raw network packets with full headers and payloads. Once the PCAP files have been generated, they are processed using Zeek [
55], a network traffic analysis tool that processes the captured traffic and produces a collection of structured log files in plain text formats such as .log or JSON.
The volume of captured data varied across scenarios, depending on the communication protocol, sensor activity, and duration of execution, which ranged from 1 to 5 h per session.
This dataset generation is one of the core contributions of the laboratory. By focusing on real data captured in controlled and realistic setups, the laboratory helps to close a significant gap in the current cybersecurity and IoT research landscape. These datasets can support a wide range of research activities, including the development of AI-driven models for anomaly detection and cybersecurity, particularly in IoT environments that operate under the typical conditions of rural areas.
5. Results
This section presents the results obtained from the deployment and validation of the laboratory, with emphasis on the experimental execution of the six independent scenarios described in the previous section.
5.1. Functional Validation
The functional validation phase focused on verifying that each scenario described in this work was capable of operating autonomously and generating reliable data flows.
In the LoRaWAN + The Things Network scenario, communication between Dragino sensors and The Things Network was tested. The Mikrotik LR8 gateway forwarded sensor data to TTN, where it was made available via MQTT. The experiment validated that
Data packets were transmitted successfully and without loss.
The Things Network dashboard confirmed regular reception of messages.
Node-RED flows subscribed to The Things Network MQTT topics, and parsed and routed the data to InfluxDB and MongoDB.
Grafana dashboards updated in real time.
The system maintained stable transmission, with low packet loss. Messages sent by Dragino sensors were successfully forwarded through the Mikrotik gateway to The Things Network and retrieved via MQTT. The integration with Node-RED and the data processing pipeline functioned without error.
In the LoRaWAN + ABP scenario, a fully autonomous LoRaWAN network was configured using Activation by Personalization. The Dragino LDS02 sensor sent data directly to a private Dragino LPS8 gateway, which forwarded the data to a local Mosquitto MQTT broker. The following elements were verified:
The gateway received and published sensor data on the expected topic.
Node-RED correctly decoded the payloads and stored them locally.
No Internet connection was needed at any stage of the experiment.
Local visualization via Grafana worked independently of external services.
In this scenario, all devices operated locally, without requiring Internet access. The Dragino LPS8 gateway forwarded packets to the Mosquitto MQTT broker and the messages were successfully processed by Node-RED. Payloads were correctly decoded and stored in the local databases. No connectivity interruptions were observed.
These two experiments confirmed the feasibility of deploying LoRaWAN in cloud-connected and fully offline rural environments.
In addition, in each of the four WiFi scenarios, ESP32 devices were programmed to send periodic sensor data using one of the following protocols: MQTT, HTTP, UDP, or CoAP. In all cases,
Devices successfully connected to a local access point.
Sensor data were transmitted at regular intervals and received by the backend.
Node-RED flows were configured to handle data based on the protocol used, and messages were parsed as expected.
InfluxDB and MongoDB stored all records, without loss or corruption.
Grafana dashboards visualized the incoming data in real time.
In all four WiFi scenarios, the system demonstrated correct operation of the communication protocol and reliable interaction with the backend services. However, during the CoAP-based experiment, minor limitations were observed due to the CoAP libraries available for the Arduino ecosystem. In particular, the absence of the CoAP POST method was noted. While basic functionality was achieved, this indicates the need for careful library selection and testing when implementing on embedded platforms.
Each scenario demonstrated correct and stable behavior. Moreover, traffic capture using a Raspberry Pi and Tcpdump confirmed that communication packets were visible on the network and could be collected for further analysis.
In addition, the system successfully stored a total of 97,914 records in MongoDB collections during the experiments, including sensor readings from all six scenarios. This confirmed the stability and completeness of the data flow, from transmission to storage.
Table 6 details the key characteristics of each experimental scenario, including the connectivity type, protocol used, whether traffic was captured, and the main contribution of each configuration.
Although this study focused on a fixed configuration for each experimental scenario, the laboratory was intentionally designed to support alternative setups. Thanks to its modular architecture, it is possible to reconfigure the network topology, change the communication protocols, and redistribute data processing tasks between edge nodes and centralized services. This flexibility enables future experiments to evaluate the performance, energy consumption, and security implications of different rural IoT system designs.
5.2. Dataset Generation
To transform raw packet data into an analyzable structure, the captured network .pcap files were processed using Zeek v6.0.0, producing .log files. The number of .log files generated will depend on the characteristics of the captured network traffic. These logs contain rich metadata describing each network session, including protocol types, session durations, endpoints (IP and port), packet sizes, request and response times, and many others. The logs also include detailed application-layer information where protocols permit this, for example, MQTT topics and payload lengths, HTTP URIs and status codes, or CoAP request methods.
Between February and March 2025, sixteen data collection sessions were conducted, with durations ranging from 32 min to nearly 5 h. The total runtime was approximately 54 h and 15 min, with an average of 3 h and 36 min per session. This resulted in 16 PCAP files, which were preprocessed using Zeek to generate 103 .log files, totaling 33 MB. In total, 164,133 packets were captured, with an average size of 189 bytes and a transmission rate of approximately 7 bytes per second.
This process ensured a clean and high-fidelity dataset, making it a useful resource for researchers who wish to work with realistic data, rather than using datasets generated by simulations. These logs include metadata such as
Protocol type and ports.
Transport- and application-layer metadata.
Session duration, payload sizes, and message lengths, among others.
Protocol-specific details (e.g., MQTT topics, HTTP URIs, CoAP methods).
Table 7 provides a summary of the most relevant .log files, highlighting their purpose and the key fields they contain.
The resulting dataset was organized into structured directories that included raw PCAP files, Zeek-generated log outputs, and supporting documentation. Each directory corresponded to a specific capture date when all experimental scenarios were run simultaneously.
While the dataset includes detailed network-level information captured using Zeek, it currently does not include logs extracted directly from LoRaWAN gateways or backend devices, such as authentication events or other system metrics. Future iterations of the laboratory will incorporate these logs, to enrich the dataset and support AI studies and anomaly detection. In addition, the laboratory is designed to support adversarial experiments in future work, allowing the introduction of spoofing, DoS, or replay attacks in a controlled manner, to enrich the dataset for intrusion detection benchmarking.
5.3. Statistical Characterization of Network Traffic
To strengthen the descriptive foundation of the dataset, we conducted a statistical analysis of the captured traffic. Over the course of approximately 54 h, the system recorded a total of 2326 network flows. The mean connection duration was 354.33 s, with a standard deviation of 2253.69 s. Notably, approximately 76.48% of the flows were unacknowledged (Zeek conn_state = S0), but that may have resulted not only from network loss or unreachable endpoints, but also from the inherent behavior of many IoT protocols that rely on UDP or transmit data without expecting responses. These include services such as CoAP, UDP, and DNS, where unidirectional exchanges are common and not indicative of an anomaly. These metrics provide a first view of the characteristics of the generated traffic, highlighting the heterogeneity of IoT communications in terms of payload size and session activity.
To evaluate the overall activity of the experimental sessions,
Figure 9 illustrates the network throughput measured over 15 min intervals, computed as the average number of bytes transmitted per second within each time window. The shaded area around the throughput represents the 95% confidence interval based on the standard deviation of each 15 min sample. This representation offers a granular view of the data transmission patterns across the experiments.
The figure reveals clear traffic bursts corresponding to periods of active sensor communication, interleaved with quieter intervals. These fluctuations reflect the natural operation of the IoT devices under the various configurations. The use of 15 min intervals balanced temporal resolution with statistical stability, allowing the identification of trends and low-activity periods, without overemphasizing transient variations.
To further characterize the network traffic generated in the laboratory, two aggregated analyses were conducted on the captured flows. First, the total payload size of each session, computed as the sum of origin and responder bytes, was evaluated to estimate the volume of information exchanged by the devices during each session. A statistical summary of payload sizes grouped by session is presented in
Table 8, confirming a consistent traffic generation behavior across sessions, although with variable dispersion due to the dynamic nature of the protocols.
To quantify the temporal regularity of the captured network traffic, we computed the inter-arrival time (IAT) between flows and derived the coefficient of variation (CV =
) for each experimental session, where
is the standard deviation and
is the mean of the sample. As shown in
Table 9, the CV values ranged between 1.12 and 1.59 across all sessions, indicating a moderate-to-high degree of burstiness in traffic patterns. A CV greater than 1 suggests that flows are not evenly spaced in time, but instead tend to arrive in clusters, a common behavior in IoT scenarios where data are often generated in response to physical events or time-triggered batches.
These results confirm the suitability of the testbed to emulate realistic traffic conditions in constrained environments, and provide a baseline for detecting temporal anomalies in future experiments. Temporal variability is an important feature in anomaly detection models, as deviations from typical burstiness patterns can indicate malfunctioning nodes, denial-of-service conditions, or unexpected external interactions.
This analysis helped characterize baseline activity patterns in rural IoT scenarios, providing a reference for detecting anomalies or evaluating the impact of protocol and scheduling strategies in future work.
5.4. Temporal and Channel Variability Analysis
Although the experiments were conducted in a controlled indoor environment, the collected data exhibited natural fluctuations in throughput and flow characteristics that provide insight into the performance of wireless communication channels, even under nominally stable conditions.
Figure 9 shows the average throughput observed during all capture sessions, computed over 15-min intervals. This representation reveals spontaneous throughput variation, highlighting the system’s sensitivity to dynamic conditions, even in controlled scenarios.
To further quantify the flow-level performance,
Figure 10 presents the distribution of TCP/UDP flow durations grouped by hour of the day.
Despite stable configuration parameters, temporal variability emerged due to the environmental and network stack behavior. This highlights the importance of accounting for temporal factors when evaluating the stability and robustness of IoT communications.
5.5. Passive Security Indicators in Benign Traffic
Although the dataset captured only benign traffic, several indicators of potential security relevance were extracted and analyzed using Zeek. The weird log recorded various protocol inconsistencies, retransmissions, and unexpected connection terminations. These events were categorized by type and tracked over time, revealing patterns that could guide anomaly detection.
Table 10 summarizes these event types.
In addition, analysis of SSH sessions revealed a diversity of client and server banners, potentially useful for identifying vulnerable software versions. DNS query strings were evaluated for Shannon entropy, enabling future correlation with domain-generation algorithms (DGAs). Finally, log entries related to file transfers included MIME types and cryptographic hashes (MD5, SHA1, SHA256), which can serve as features for malware signature correlation.
Additionally, we computed the Shannon entropy of DNS query strings extracted from dns.log. As shown in
Table 11, the average entropy per query was 3.42 bits per character, with a standard deviation of 0.19. These values are consistent with legitimate DNS traffic, where domain names tend to follow human-readable or structured patterns. The maximum entropy observed (4.17) indicates the presence of some compact or less predictable domains, while the minimum value (1.5) corresponds to repetitive or simple names. Entropy analysis is a standard technique in anomaly detection, particularly for identifying the algorithmically generated domains (DGAs) used in botnets or malware communications. Although this dataset contains only benign traffic, this analysis illustrates the laboratory’s ability to extract behavioral features relevant for future cybersecurity applications.
SSH session logs were also analyzed to extract passive security indicators from connection metadata. Additionally, the dataset includes information on SSH negotiation parameters.
Figure 11,
Figure 12,
Figure 13 and
Figure 14 show the most frequently observed cryptographic algorithms and client versions. These features provide visibility of encryption practices and protocol usage, and can help identify legacy clients, weak ciphers, or unsupported negotiation algorithms, which are often used in cyberattacks.
This analysis also reinforces the laboratory’s ability to extract technical metadata from benign traffic for future comparative or forensic tasks.
In addition to data capture, the laboratory implements a data processing pipeline that covers the entire process from data ingestion to visualization. Using open-source tools like Node-RED v4.0.9, InfluxDB v2.7.6, MongoDB v7.0.9, and Grafana v11.0.0, the system can manage the entire data lifecycle, without depending on external cloud services.
6. Discussion
The experimental results presented in this work demonstrate that the Smart Rural IoT Lab provides a functional, reproducible, and low-cost environment for research on rural IoT deployments. The six implemented scenarios validated the laboratory’s ability to simulate representative applications such as environmental monitoring, livestock management, facility access control, and infrastructure monitoring, use cases that are highly relevant in Smart Rural contexts. By using low-cost hardware, open-source software, and both long-range (LoRaWAN) and short-range (WiFi) communication protocols, the laboratory replicates realistic configurations commonly found in rural environments.
The results obtained in the six experimental scenarios highlight the adaptability of IoT communication protocols to rural environments and underscore the importance of selecting an appropriate approach based on local constraints and operational objectives.
One of the most relevant findings is that there is no universally optimal protocol for rural IoT systems. Each technology tested in the laboratory showed distinct advantages and disadvantages. LoRaWAN, for example, offered long-range coverage with minimal power consumption, ideal for dispersed deployments. However, the use of The Things Network introduced a dependency on external cloud infrastructure, which may be problematic in areas with unreliable connectivity. The alternative ABP-based LoRaWAN configuration, which operated fully offline, proved more suitable for autonomous deployments without Internet access. In WiFi-based scenarios, the results demonstrate the effectiveness and flexibility of using local wireless networks for short-range IoT communication in rural environments. WiFi enables efficient data exchange between devices when localized access points are available, particularly in centralized infrastructures such as barns, machinery sheds, or rural processing facilities.
An important contribution of this work is the demonstration of a complete, modular architecture supporting the full IoT data lifecycle, from acquisition to processing, storage, and visualization, without reliance on commercial services.
Furthermore, a dataset of real network traffic was generated using tools such as Tcpdump and Zeek. Unlike simulation-based alternatives, this dataset reflects actual protocol usage and device behavior, including metadata such as payload sizes, protocol-specific fields (e.g., MQTT topics, CoAP methods), and connection anomalies, making it valuable for cybersecurity and AI-based research.
Several limitations must be acknowledged. All experiments were conducted in a controlled indoor environment. While this facilitated reproducibility, it limits the ecological validity of the results with respect to outdoor conditions such as terrain variability, weather effects, or long-distance signal degradation, but the captured traffic still exhibited temporal fluctuations and behaviors that are commonly observed in outdoor wireless deployments. Specifically, the analysis of network throughput over time (
Figure 9) revealed patterns of activity that do not follow strict periodicity or uniformity.
Furthermore, a high percentage of flows (76.48%) were classified with Zeek’s conn_state = S0, indicating either unresponsive endpoints or unacknowledged UDP-based exchanges. This suggests eventual loss or one-way communications, both typical in rural IoT networks.
Future work will focus on extending the testbed to real outdoor, rural locations and capturing the physical-layer dynamics of such environments under various topological and climatic conditions.
Future research will involve the injection of synthetic adversarial traffic into the testbed to simulate typical cyberattack scenarios encountered in rural IoT environments. This includes spoofing, replay attacks, and denial-of-service (DoS) conditions, which are common threats to resource-constrained deployments. These attack traces will be generated using reproducible tools and integrated into the existing dataset with appropriate labeling.
The analyses conducted on benign traffic demonstrated that the laboratory infrastructure can extract detailed behavioral and protocol-level features that are critical for cybersecurity research. Logs generated by Zeek revealed passive indicators such as protocol anomalies, abnormal termination states, and entropy-based domain analysis, all of which are foundational elements in intrusion detection. These capabilities confirm that the system is technically equipped to monitor and capture relevant patterns when adversarial traffic is introduced. This confirms that the laboratory is ready to support the controlled injection and evaluation of attack vectors in future research.
Despite these limitations, the Smart Rural IoT Lab provides a solid foundation for experimentation, validation, and future research. Its modularity allows for adaptation to various rural use cases, and the generated dataset contributes to addressing the lack of realistic traffic datasets in the field of rural cybersecurity.
7. Conclusions
This work presented the Smart Rural IoT Lab, a reproducible and cost-effective laboratory specifically designed to support research on IoT communication, cybersecurity, and artificial intelligence in rural environments. Unlike many existing research platforms that focus on urban or industrial settings, the laboratory validates the operational viability of low-power, modular infrastructures based on open-source tools and affordable commercial hardware such as low-cost sensors, gateways, and Arduino boards.
The six experimental scenarios demonstrated that effective IoT deployments are feasible, even in environments with limited or no Internet connectivity, supporting use cases such as environmental monitoring, livestock tracking, wildfire detection, and facility access control.
A key contribution of this work is the generation of a dataset built from real network traffic, captured through passive monitoring using tools such as Tcpdump and Zeek. This dataset reflects protocol usage and device behavior, making it valuable for future research in AI-based intrusion detection and anomaly analysis. The complete data lifecycle (acquisition, storage, and visualization) is implemented using open-source software and does not rely on cloud infrastructure, enabling fully local operation.
Despite these achievements, several limitations remain. Experiments were conducted in a controlled indoor environment, which did not replicate the physical challenges of rural outdoor deployments. Additionally, the dataset currently only includes benign traffic. In future work, the platform will be extended to include the controlled injection of malicious traffic. This will simulate common threat scenarios in IoT environments, such as spoofing, replay, and denial-of-service (DoS) attacks. Tools like hping3, kali linux, scapy, and tcpreplay will be used to generate reproducible adversarial flows. Each trace will be labeled accordingly and integrated into the existing dataset to support supervised machine learning methods and facilitate reproducible intrusion-detection experiments. Another pending enhancement is node-level energy profiling to evaluate energy efficiency, particularly for battery-powered devices.
The modular architecture of the laboratory allows for easy reconfiguration, making it suitable for exploring alternative network topologies or new communication protocols. Future plans include expanding the range and diversity of sensors, developing new rural application scenarios, and integrating machine learning models for real-time threat detection. The infrastructure is well suited to support lightweight AI models, including federated learning.
In summary, the Smart Rural IoT Lab provides a flexible and realistic foundation for experimentation in digitally underserved environments. It contributes to reducing the gap between urban and rural technology adoption and supports the development of secure, sustainable, and autonomous IoT solutions for Smart Rural environments.
Author Contributions
Conceptualization, D.S.-I., R.P.-V. and A.R.-G.; methodology, D.S.-I., R.P.-V. and A.R.-G.; software, D.S.-I. and P.V.-B.; validation, R.P.-V. and A.R.-G.; formal analysis, D.S.-I., R.P.-V. and A.R.-G.; investigation, D.S.-I., R.P.-V. and A.R.-G.; resources, D.S.-I., L.T., R.P.-V., A.R.-G., P.V.-B. and J.S.; data curation, D.S.-I., L.T., R.P.-V. and A.R.-G.; writing—original draft preparation, D.S.-I.; writing—review and editing, R.P.-V. and A.R.-G.; visualization, D.S.-I., L.T., R.P.-V. and A.R.-G.; supervision, R.P.-V. and A.R.-G.; project administration, R.P.-V. and A.R.-G.; funding acquisition, R.P.-V. and A.R.-G. All authors have read and agreed to the published version of the manuscript.
Funding
The Spanish Government (through the Cybersecurity Institute of Spain, INCIBE) with the International Chair “Smart Rural IoT and Secured Environments”, within the context of the Recovery, Transformation and Resilience Plan financed by the European Union (NextGenerationEU/PRTR).
Data Availability Statement
The resulting dataset presented in this work is currently not publicly available. Access may be granted in the future, either publicly or upon reasonable request to the corresponding authors.
Acknowledgments
Authors would like to acknowledge the support of the Spanish Government (through the Cybersecurity Institute of Spain, INCIBE), with the Strategic Research Project “Analysis of mobile applications from the perspective of data protection: Cyber-protection and Cyber-risks of citizen information” and the International Chair “Smart Rural IoT and Secured Environments”, within the context of the Recovery, Transformation and Resilience Plan financed by the European Union (NextGenerationEU/PRTR). The authors also thank the support of the UNED Associated Center Consortium in Ponferrada, INTECCA, as well as the UNED CiberCSI research group and the UNED CiberGID innovation group.
Conflicts of Interest
The authors declare no conflicts of interest. The funders had no role in the design of the study; in the collection, analyses, or interpretation of data; in the writing of the manuscript; or in the decision to publish the results.
References
- Cvar, N.; Trilar, J.; Kos, A.; Volk, M.; Duh, E.S. The Use of IoT Technology in Smart Cities and Smart Villages: Similarities, Differences, and Future Prospects. Sensors 2020, 20, 3897. [Google Scholar] [CrossRef] [PubMed]
- Singh, K.B.; Sengar, N.; Das, D.; Misra, S. Village 5.0: Enabling Technologies and its Applications in Development of Smart Village. In Proceedings of the 2022 IEEE International Symposium on Smart Electronic Systems (iSES), Warangal, India, 18–22 December 2022; pp. 556–561. [Google Scholar] [CrossRef]
- Alabdali, S.A.; Pileggi, S.F.; Cetindamar, D. Influential Factors, Enablers, and Barriers to Adopting Smart Technology in Rural Regions: A Literature Review. Sustainability 2023, 15, 7908. [Google Scholar] [CrossRef]
- Gupta, M.; Abdelsalam, M.; Khorsandroo, S.; Mittal, S. Security and Privacy in Smart Farming: Challenges and Opportunities. IEEE Access 2020, 8, 34564–34584. [Google Scholar] [CrossRef]
- Sontowski, S.; Gupta, M.; Chukkapalli, S.S.L.; Abdelsalam, M.; Mittal, S.; Joshi, A.; Sandhu, R. Cyber Attacks on Smart Farming Infrastructure. In Proceedings of the 2020 IEEE 6th International Conference on Collaboration and Internet Computing (CIC), Atlanta, GA, USA, 1–3 December 2020; pp. 135–143. [Google Scholar] [CrossRef]
- GNS3. 2025. Available online: https://docs.gns3.com/docs/ (accessed on 3 March 2025).
- Bounceur, A.; Marc, O.; Lounis, M.; Soler, J.; Clavier, L.; Combeau, P.; Vauzelle, R.; Lagadec, L.; Euler, R.; Bezoui, M.; et al. CupCarbon-Lab: An IoT Emulator. In Proceedings of the 2018 15th IEEE Annual Consumer Communications & Networking Conference, Las Vegas, NV, USA, 12–15 January 2018; Institute of Electrical and Electronics Engineers: Piscataway, NJ, USA, 2018; p. 172. [Google Scholar]
- Thakkar, A.; Lohiya, R. A Review on Machine Learning and Deep Learning Perspectives of IDS for IoT: Recent Updates, Security Issues, and Challenges. Arch. Comput. Methods Eng. 2020, 28, 3211–3243. [Google Scholar] [CrossRef]
- Khraisat, A.; Alazab, A. A critical review of intrusion detection systems in the internet of things: Techniques, deployment strategy, validation strategy, attacks, public datasets and challenges. Cybersecurity 2021, 4, 18. [Google Scholar] [CrossRef]
- Prazeres, N.; de Carvalho Costa, R.L.; Santos, L.; Rabadão, C. Engineering the application of machine learning in an IDS based on IoT traffic flow. Intell. Syst. Appl. 2023, 17, 200189. [Google Scholar] [CrossRef]
- Ashraf, J.; Keshk, M.; Moustafa, N.; Abdel-Basset, M.; Khurshid, H.; Bakhshi, A.D.; Mostafa, R.R. IoTBoT-IDS: A novel statistical learning-enabled botnet detection framework for protecting networks of smart cities. Sustain. Cities Soc. 2021, 72, 103041. [Google Scholar] [CrossRef]
- Tareq, I.; Elbagoury, B.M.; El-Regaily, S.; El-Horbaty, E.S.M. Analysis of ToN-IoT, UNW-NB15, and Edge-IIoT Datasets Using DL in Cybersecurity for IoT. Appl. Sci. 2022, 12, 9572. [Google Scholar] [CrossRef]
- Goebel, K.; Rane, S. AI in Industrial IoT Cybersecurity [Industrial and Governmental Activities]. IEEE Comput. Intell. Mag. 2024, 19, 14–15. [Google Scholar] [CrossRef]
- Sharafaldin, I.; Lashkari, A.H.; Ghorbani, A.A. Toward generating a new intrusion detection dataset and intrusion traffic characterization. In Proceedings of the ICISSP 2018—4th International Conference on Information Systems Security and Privacy, Funchal, Portugal, 22–24 January 2018; SciTePress: Setúbal, Portugal, 2018; Volume 2018, pp. 108–116. [Google Scholar] [CrossRef]
- Bourechak, A.; Zedadra, O.; Kouahla, M.N.; Guerrieri, A.; Seridi, H.; Fortino, G. At the Confluence of Artificial Intelligence and Edge Computing in IoT-Based Applications: A Review and New Perspectives. Sensors 2023, 23, 1639. [Google Scholar] [CrossRef] [PubMed]
- Moustafa, N.; Slay, J. UNSW-NB15: A Comprehensive Data set for Network Intrusion Detection systems (UNSW-NB15 Network Data Set). In Proceedings of the 2015 Military Communications and Information Systems Conference (MilCIS), Canberra, Australia, 10–12 November 2015. Technical Report. [Google Scholar]
- Ferrag, M.A.; Friha, O.; Hamouda, D.; Maglaras, L.; Janicke, H. Edge-IIoTset: A New Comprehensive Realistic Cyber Security Dataset of IoT and IIoT Applications for Centralized and Federated Learning. IEEE Access 2022, 10, 40281–40306. [Google Scholar] [CrossRef]
- Gemalto, A.; Semtech. LoRaWAN ™ Security a White Paper Prepared for the LoRa Alliance™ Full End-to-End Encryption for IoT Application Providers; Technical Report; LoRa Alliance: Fremont, CA, USA, 2017. [Google Scholar]
- Patel, N.D.; Mehtre, B.M.; Wankar, R. Simulators, Emulators, and Test-beds for Internet of Things: A Comparison. In Proceedings of the 3rd International Conference on loT in Social, Mobile, Analytics and Cloud (ISMAC 2019), Palladam, India, 12–14 December 2019; IEEE: Piscataway, NJ, USA, 2019. [Google Scholar]
- Singh, A.; Nandanwar, H.; Chauhan, A. Simulation Tools and Testbeds for Internet of Things(IoT): ‘Comparative Insight’. In Proceedings of the 2022 2nd International Conference on Computer Science, Engineering and Applications, ICCSEA 2022, Gunupur, India, 8 September 2022; Institute of Electrical and Electronics Engineers Inc.: Piscataway, NJ, USA, 2022. [Google Scholar] [CrossRef]
- Poisson, M.; Carnier, R.; Fukuda, K. GothX: A generator of customizable, legitimate and malicious IoT network traffic. In Proceedings of the ACM International Conference Proceeding Series. Association for Computing Machinery, Philadelphia, PA, USA, 13 August 2024; pp. 65–73. [Google Scholar] [CrossRef]
- Saez-De-Camara, X.; Flores, J.L.; Arellano, C.; Urbieta, A.; Zurutuza, U. Gotham Testbed: A Reproducible IoT Testbed for Security Experiments and Dataset Generation. IEEE Trans. Dependable Secur. Comput. 2024, 21, 186–203. [Google Scholar] [CrossRef]
- IEEE Xplore. Part 11: Wireless LAN Medium Access Control (MAC) and Physical Layer (PHY) Specifications. Revision of IEEE Std 802.11-2012; IEEE: New York, NY, USA, 2016. [Google Scholar] [CrossRef]
- Imran, M.A.; Zennaro, M.; Popoola, O.R.; Chiaraviglio, L.; Zhang, H.; Manzoni, P.; van de Beek, J.; Stewart, R.; Cox, M.A.; Mendes, L.L.; et al. Exploring the Boundaries of Connected Systems: Communications for Hard-to-Reach Areas and Extreme Conditions. Proc. IEEE 2024, 112, 912–945. [Google Scholar] [CrossRef]
- Alobaidy, H.A.; Singh, M.J.; Behjati, M.; Nordin, R.; Abdullah, N.F. Wireless Transmissions, Propagation and Channel Modelling for IoT Technologies: Applications and Challenges. IEEE Access 2022, 10, 24095–24131. [Google Scholar] [CrossRef]
- Aldhaheri, L.; Alshehhi, N.; Manzil, I.I.J.; Khalil, R.A.; Javaid, S.; Saeed, N.; Alouini, M.S. LoRa Communication for Agriculture 4.0: Opportunities, Challenges, and Future Directions. IEEE Internet Things J. 2024, 12, 1380–1407. [Google Scholar] [CrossRef]
- LoRa Alliance. What is LoRaWAN®? 2025. Available online: https://lora-alliance.org/about-lorawan/ (accessed on 20 October 2024).
- Torres, A.V. LoRaWAN Protocol: Everything You Need to Know. 2023. Available online: https://www.wattsense.com/blog/communication-protocols/what-is-lorawan/ (accessed on 20 October 2024).
- C.S.A. Zigbee: The Full-Stack Solution for All Smart Devices. 2025. Available online: https://csa-iot.org/all-solutions/zigbee/ (accessed on 25 October 2024).
- Rudresh, V. ZigBee Security: Basics (Part 1). 2017. Available online: https://research.kudelskisecurity.com/2017/11/01/zigbee-security-basics-part-1/ (accessed on 25 October 2024).
- Mitra, D.; Goswami, S.; Hati, D.; Roy, S. Comparative Study of IOT Protocols. PJAEE 2020, 17, 12527–12537. [Google Scholar]
- Jouhari, M.; Saeed, N.; Alouini, M.S.; Amhoud, E.M. A Survey on Scalable LoRaWAN for Massive IoT: Recent Advances, Potentials, and Challenges. IEEE Commun. Surv. Tutor. 2023, 25, 1841–1876. [Google Scholar] [CrossRef]
- The Things Network. LoRaWAN Device Classes. 2025. Available online: https://www.thethingsnetwork.org/docs/lorawan/classes/ (accessed on 20 October 2024).
- Prokosch, T. MQTT Protocol Guide: Everything You Need to Know. 2023. Available online: https://cedalo.com/blog/complete-mqtt-protocol-guide/ (accessed on 4 November 2024).
- EMQX Team. The Easiest Guide to getting started with MQTT. 2025. Available online: https://www.emqx.com/en/blog/the-easiest-guide-to-getting-started-with-mqtt (accessed on 4 November 2024).
- Beginners Guide To The MQTT Protocol. 2018. Available online: http://www.steves-internet-guide.com/mqtt/ (accessed on 4 November 2024).
- Eclipse Foundation. Mosquitto MQTT Broker. 2025. Available online: https://mosquitto.org/ (accessed on 20 November 2024).
- Atilgan, E.; Ozcelik, I.; Yolacan, E.N. MQTT Security at a Glance. In Proceedings of the 14th International Conference on Information Security and Cryptology, ISCTURKEY 2021, Ankara, Turkey, 2–3 December 2021; Institute of Electrical and Electronics Engineers Inc.: Piscataway, NJ, USA, 2021; pp. 138–142. [Google Scholar] [CrossRef]
- Gemirter, C.B.; Şagatay, Ç.; Şebnem, B. A Comparative Evaluation of AMQP, MQTT and HTTP Protocols Using Real-Time Public Smart City Data. In Proceedings of the 6th International Conference on Computer Science and Engineering, UBMK 2021, Ankara, Turkey, 15–17 September 2021; Institute of Electrical and Electronics Engineers Inc.: Piscataway, NJ, USA, 2021; pp. 542–547. [Google Scholar] [CrossRef]
- Upadhyay, V.; Vaish, D.A.; Kokila, D.J. Internet of Things(IoT) Security: Approaches and Existing Solutions. In Proceedings of the 2023 TRON Symposium (TRONSHOW), Tokyo, Japan, 6–8 December 2023. [Google Scholar]
- Kaskatiiski, N.; Boyanov, L. Efficiency of data exchange of IoT communication protocols. In Proceedings of the International Conference Automatics and Informatics, ICAI 2021 Proceedings, Varna, Bulgaria, 30 September–2 October 2021; Institute of Electrical and Electronics Engineers Inc.: Piscataway, NJ, USA, 2021; pp. 358–361. [Google Scholar] [CrossRef]
- OpenJS Foundation; Node-RED Contributors. Node-RED. 2025. Available online: https://nodered.org (accessed on 18 November 2024).
- Poongothai, M.; Subramanian, P.M.; Rajeswari, A. Design and Implementation of IoT Based Smart Laboratory. In Proceedings of the 5th International Conference on Industrial Engineering and Applications, Singapore, 26–28 April 2018; IEEE Press: Piscataway, NJ, USA, 2018. [Google Scholar]
- InfluxData Inc. InfluxDB. 2025. Available online: https://www.influxdata.com/ (accessed on 20 November 2024).
- MongoDB Inc. MongoDB. 2025. Available online: https://www.mongodb.com/ (accessed on 20 November 2024).
- Grafana Labs. Grafana. 2025. Available online: https://grafana.com/ (accessed on 25 November 2024).
- Docker Inc. Docker. 2025. Available online: https://www.docker.com/ (accessed on 15 December 2024).
- Arduino. Arduino. 2025. Available online: https://www.arduino.cc/ (accessed on 2 December 2024).
- Arduino. Arduino IDE. 2025. Available online: https://www.arduino.cc/en/software (accessed on 2 December 2024).
- Wireshark Foundation. Wireshark. 2025. Available online: https://www.wireshark.org (accessed on 16 December 2024).
- WinSCP.net. WinSCP. 2025. Available online: https://winscp.net/eng/index.php (accessed on 20 January 2025).
- Zachos, G.; Essop, I.; Mantas, G.; Porfyrakis, K.; Ribeiro, J.C.; Rodriguez, J. Generating IoT Edge Network Datasets based on the TON_IoT Telemetry Dataset. In Proceedings of the IEEE International Workshop on Computer Aided Modeling and Design of Communication Links and Networks, CAMAD, Porto, Portugal, 25–27 October 2021; Institute of Electrical and Electronics Engineers Inc.: Piscataway, NJ, USA, 2021; Volume 2021. [Google Scholar] [CrossRef]
- The Things Network. The Things Network. 2025. Available online: https://www.thethingsnetwork.org/ (accessed on 15 December 2024).
- The Tcpdump Group. Tcpdump. 2025. Available online: https://www.tcpdump.org/ (accessed on 16 December 2024).
- Zeek. 2025. Available online: https://www.zeek.org (accessed on 16 December 2024).
Figure 1.
IoT lab physical network topology.
Figure 1.
IoT lab physical network topology.
Figure 2.
IoT lab logical network topology.
Figure 2.
IoT lab logical network topology.
Figure 3.
Scenario 1: LoRaWAN TTN Node-RED Flow.
Figure 3.
Scenario 1: LoRaWAN TTN Node-RED Flow.
Figure 4.
Scenario 2: LoRaWAN ABP Node-RED Flow.
Figure 4.
Scenario 2: LoRaWAN ABP Node-RED Flow.
Figure 5.
Scenario 3-Wifi-MQTT Node-RED Flow.
Figure 5.
Scenario 3-Wifi-MQTT Node-RED Flow.
Figure 6.
Scenario 4-Wifi-HTTP Node-RED Flow.
Figure 6.
Scenario 4-Wifi-HTTP Node-RED Flow.
Figure 7.
Scenario 5-Wifi-UDP Node-RED Flow.
Figure 7.
Scenario 5-Wifi-UDP Node-RED Flow.
Figure 8.
Scenario 6-Wifi-CoAP Node-RED Flow.
Figure 8.
Scenario 6-Wifi-CoAP Node-RED Flow.
Figure 9.
Aggregate network throughput per 15 min (Bytes/s). The shaded area represents the variability band, calculated as times the standard deviation of the throughput, providing an approximate 95% confidence interval around the observed values.
Figure 9.
Aggregate network throughput per 15 min (Bytes/s). The shaded area represents the variability band, calculated as times the standard deviation of the throughput, providing an approximate 95% confidence interval around the observed values.
Figure 10.
Distribution of flow durations grouped by hour. The green line marks the median.
Figure 10.
Distribution of flow durations grouped by hour. The green line marks the median.
Figure 11.
Most used SSH cipher algorithms (from ssh.log).
Figure 11.
Most used SSH cipher algorithms (from ssh.log).
Figure 12.
Most used SSH key exchange algorithms.
Figure 12.
Most used SSH key exchange algorithms.
Figure 13.
Most used SSH MAC (Message Authentication Code) algorithms.
Figure 13.
Most used SSH MAC (Message Authentication Code) algorithms.
Figure 14.
Most common SSH protocol versions.
Figure 14.
Most common SSH protocol versions.
Table 1.
Urban vs. rural IoT environments: key differences.
Table 1.
Urban vs. rural IoT environments: key differences.
| Aspect | Urban IoT Environments | Rural IoT Environments |
|---|
| Connectivity | High bandwidth, low latency | Intermittent, low bandwidth, high latency |
| Power supply | Stable and continuous | Often limited, solar or battery-powered |
| Infrastructure | Dense, centralized | Sparse, decentralized |
| Physical access | Regular maintenance possible | Remote, infrequent access |
| Cybersecurity support | Managed networks, centralized monitoring | Limited supervision, distributed and offline nodes |
| Environmental factors | Controlled (indoor, urban) | Unpredictable (terrain, weather, obstacles) |
Table 2.
IoT protocol feature comparison review.
Table 2.
IoT protocol feature comparison review.
| Protocol | Communication Model | Energy Consumption | Latency | Native Security | Reliability |
|---|
| MQTT | Publish–Subscribe | Low | Low | No (requires TLS) | Medium |
| HTTP | Request–Response | High | High | Yes (HTTPS/TLS) | High |
| UDP | Connectionless | Very low | Very low | No | Low |
| CoAP | Request-Response | Very low | Very low | Yes (DTLS) | Medium |
| LoRaWAN | LPWAN (low power) | Optimized for batteries | High | Yes (AES-128) | High |
Table 3.
Hardware and operating systems used in the laboratory.
Table 3.
Hardware and operating systems used in the laboratory.
| Name | Description |
|---|
| TP-Link Archer C20 | WiFi router that deploys the IoT Lab private network and provides access to the corporate network |
| Mikrotik LR8 Kit | LoRaWAN gateway that enables the connection of LoRa devices to long-range IoT networks |
| Dragino LHT65 | Temperature and humidity sensor with LoRaWAN connectivity |
| Dragino LGT-92 | GPS tracker with LoRaWAN connectivity |
| Dragino LPS8 | LoRaWAN Gateway |
| Dragino LDS02 | Door sensor with LoRaWAN communication for detecting openings and closings |
| ESP32 WiFi | WiFi/Bluetooth microcontroller widely used in IoT applications |
| DHT11 | Low-cost temperature and humidity sensor for environmental applications |
| KY-038 | Sound sensor with a condenser microphone |
| HC-SR501 | PIR motion sensor for presence detection |
| Raspberry Pi 3 Model B | Used as a gateway for ESP32 devices to capture network traffic |
| Raspberry Pi OS | Optimized operating system for Raspberry Pi |
| Linux Virtual Machine | Virtual machine with Docker for application management and deployment |
| Debian 12 | Linux Debian operating system installed on the virtual machine |
| PC | Used for writing code and uploading it to Arduino boards |
| Windows 11 | Operating system for the PC |
Table 4.
Software used in the laboratory.
Table 4.
Software used in the laboratory.
Table 5.
Experimental scenarios designed.
Table 5.
Experimental scenarios designed.
| Scenario | Protocol | Practical Application |
|---|
| LoRaWAN + TTN | LoRaWAN + MQTT | Remote sensing of livestock and environmental conditions (public infrastructure) |
| LoRaWAN + ABP | LoRaWAN + MQTT | Local monitoring of facility access (e.g., barn doors) without cloud dependency |
| WiFi + MQTT | MQTT | Motion detection in livestock housing or machinery rooms |
| WiFi + HTTP | HTTP | Environmental monitoring in greenhouses or storage |
| WiFi + UDP | UDP | Vibration/water level monitoring in tanks or silos |
| WiFi + CoAP | CoAP | Distance sensing in milking stations or rural facilities |
Table 6.
Characteristics of experimental scenarios (connectivity, protocol type, data capture, main contribution).
Table 6.
Characteristics of experimental scenarios (connectivity, protocol type, data capture, main contribution).
| Scenario | Connectivity | Protocol Type | Data Capture | Main Contribution |
|---|
| LoRaWAN TTN | Long-range, cloud-based | LoRaWAN + MQTT | No | Cloud integration with TTN |
| LoRaWAN ABP | Long-range, local/offline | LoRaWAN + MQTT | No | Fully autonomous LoRaWAN deployment |
| WiFi + MQTT | Short-range, local | MQTT over TCP | PCAP + Zeek | Lightweight publish/subscribe messaging |
| WiFi + HTTP | Short-range, local | HTTP over TCP | PCAP + Zeek | Standard request/response communication |
| WiFi + UDP | Short-range, local | UDP (no session) | PCAP + Zeek | Low-latency packet transmission |
| WiFi + CoAP | Short-range, local | CoAP over UDP | PCAP + Zeek | Efficient protocol for constrained devices |
Table 7.
Main Zeek log file summary.
Table 7.
Main Zeek log file summary.
| Filename | Description | Relevant Fields and Metadata |
|---|
| conn.log | Registers all network connections | Protocol, source/destination IPs and ports, connection state, duration, bytes sent/received |
| dns.log | DNS queries and responses | Queried domain, query type, response codes, returned IP addresses, transaction ID, DNS class |
| http.log | HTTP requests | HTTP method, URI, host, referrer, user-agent, status code, MIME type, request/response body size |
| files.log | Transferred or detected files | File name, MIME type, SHA1/MD5/SHA256 hashes, source connection UID, total bytes |
| ftp.log | FTP activity | FTP commands issued, responses received, usernames, file operations, command/response payload sizes |
| ssl.log | TLS/SSL sessions | SSL version, cipher suite, server name (SNI), certificate chain UID, validation status |
| smtp.log | SMTP activity | Mail from/to, message ID, subject, headers, delivery status, number of recipients |
| ssh.log | SSH connections | Client and server banners, authentication method, success/failure, negotiated encryption algorithms |
| dhcp.log | DHCP IP address assignments | Assigned IP address, MAC address, hostname, lease time, DHCP message type |
| rdp.log | RDP connections | Client IP, screen resolution, keyboard layout, encryption level, connection result |
| weird.log | Anomalous behaviors or unexpected errors | Event description, connection UID, source script, severity level |
| packet_filter.log | Filters applied when processing the trace | List of fields used in filter |
Table 8.
Payload distribution (bytes).
Table 8.
Payload distribution (bytes).
| Session | Flows | Mean | Std | Min | Max | Median |
|---|
| 1 | 38 | 3035 | 14,001.63 | 84.0 | 86,184.0 | 128.0 |
| 2 | 95 | 14,471.41 | 117,323.18 | 1.0 | 1,138,103.0 | 86.0 |
| 3 | 82 | 23,923.40 | 148,302.42 | 2.0 | 1,138,112.0 | 86.0 |
| 4 | 38 | 1289.05 | 4590.80 | 86.0 | 23,858.0 | 86.0 |
| 5 | 144 | 16,665.53 | 114,018.47 | 1.0 | 1,139,957.0 | 86.0 |
| 6 | 115 | 19,581.75 | 124,462.67 | 2.0 | 1,147,051.0 | 86.0 |
| 7 | 154 | 38,948.31 | 304,693.03 | 2.0 | 3,530,678.0 | 86.0 |
| 8 | 87 | 24,760.83 | 145,785.03 | 1.0 | 1,147,041.0 | 86.0 |
| 9 | 21 | 80,373.57 | 256,965.51 | 96.0 | 1,147,055.0 | 344.0 |
| 10 | 135 | 4886.79 | 42,429.40 | 1.0 | 487,032.0 | 86.0 |
| 11 | 115 | 5414.64 | 43,812.40 | 1.0 | 460,128.0 | 86.0 |
| 12 | 101 | 5515.85 | 41,928.94 | 2.0 | 412,812.0 | 86.0 |
| 13 | 151 | 12,638.07 | 99,475.79 | 1.0 | 1,104,883.0 | 86.0 |
| 14 | 35 | 16,538.82 | 73,637.35 | 1.0 | 429,804.0 | 200.0 |
| 15 | 105 | 4852.41 | 37,277.29 | 1.0 | 374,196.0 | 86.0 |
| 16 | 316 | 2353.20 | 30,005.28 | 1.0 | 521,388.0 | 126.0 |
Table 9.
Daily coefficient of variation (CV) of flow inter-arrival times.
Table 9.
Daily coefficient of variation (CV) of flow inter-arrival times.
| Session | CV (Unitless) | Flows |
|---|
| 1 | 1.59 | 58 |
| 2 | 1.17 | 131 |
| 3 | 1.26 | 102 |
| 4 | 1.25 | 52 |
| 5 | 1.25 | 192 |
| 6 | 1.29 | 154 |
| 7 | 1.18 | 193 |
| 8 | 1.38 | 126 |
| 9 | 1.49 | 33 |
| 10 | 1.17 | 185 |
| 11 | 1.22 | 167 |
| 12 | 1.22 | 142 |
| 13 | 1.16 | 197 |
| 14 | 1.12 | 67 |
| 15 | 1.18 | 140 |
| 16 | 1.29 | 371 |
Table 10.
Top categories of Zeek weird events.
Table 10.
Top categories of Zeek weird events.
| Event Type | Count |
|---|
| possible split routing | 132 |
| data before established | 132 |
| inappropriate FIN | 132 |
Table 11.
Shannon entropy metrics calculated on DNS query strings.
Table 11.
Shannon entropy metrics calculated on DNS query strings.
| Metric | Value | Units/Interpretation |
|---|
| n_queries | 2,918 | Count of DNS queries analyzed |
| mean_entropy | 3.4198 | Average entropy per query (bits/character) |
| std_entropy | 0.1894 | Standard deviation (bits/character) |
| max_entropy | 4.1776 | Highest observed entropy (bits/character) |
| min_entropy | 1.5000 | Lowest observed entropy (bits/character) |
| Disclaimer/Publisher’s Note: The statements, opinions and data contained in all publications are solely those of the individual author(s) and contributor(s) and not of MDPI and/or the editor(s). MDPI and/or the editor(s) disclaim responsibility for any injury to people or property resulting from any ideas, methods, instructions or products referred to in the content. |
© 2025 by the authors. Licensee MDPI, Basel, Switzerland. This article is an open access article distributed under the terms and conditions of the Creative Commons Attribution (CC BY) license (https://creativecommons.org/licenses/by/4.0/).


 ,
, 


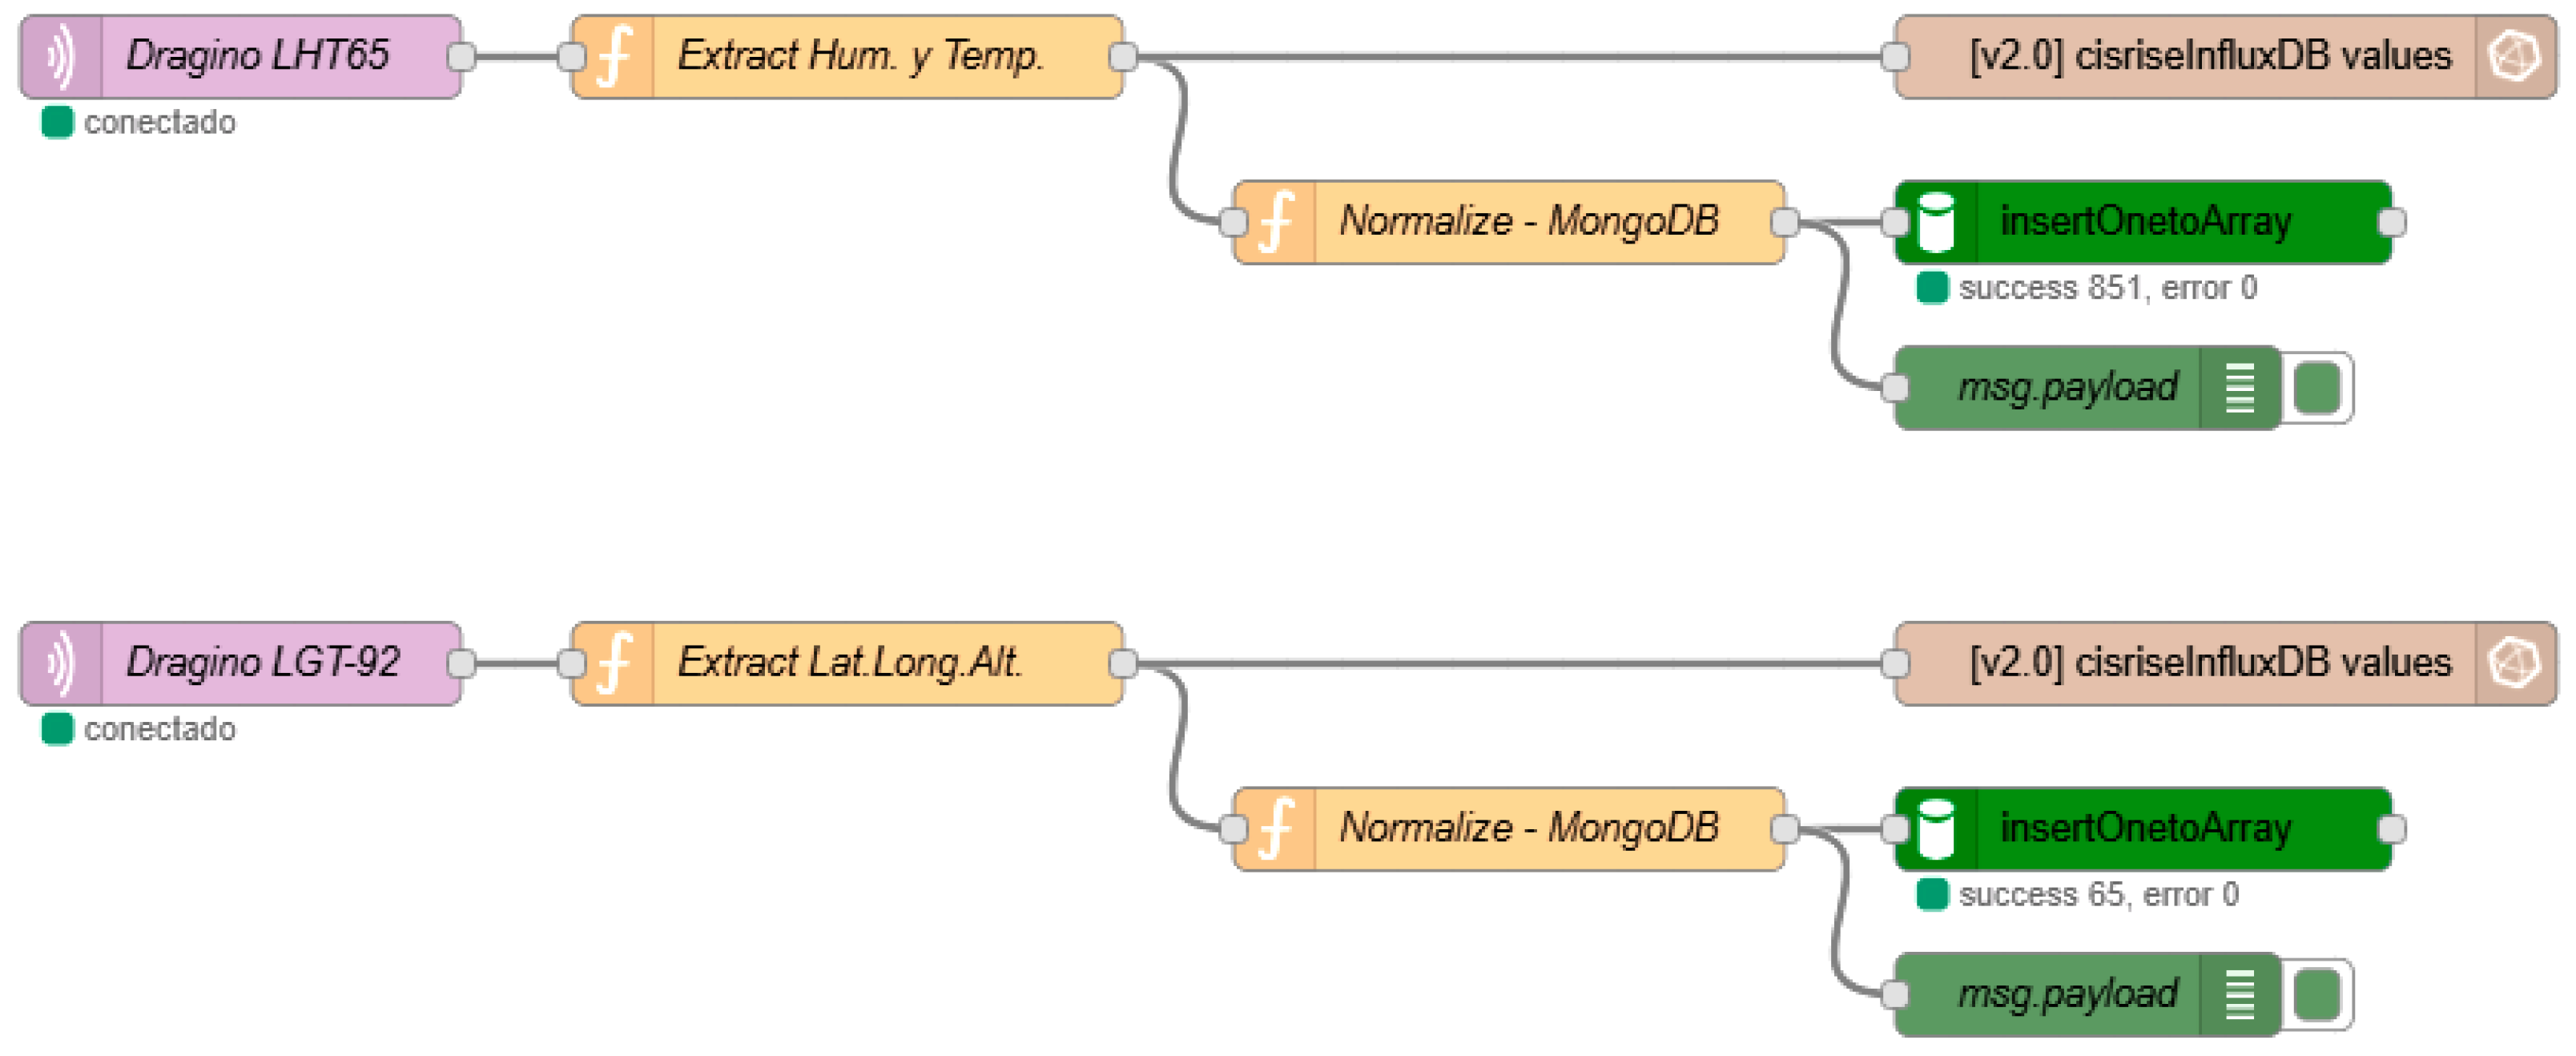


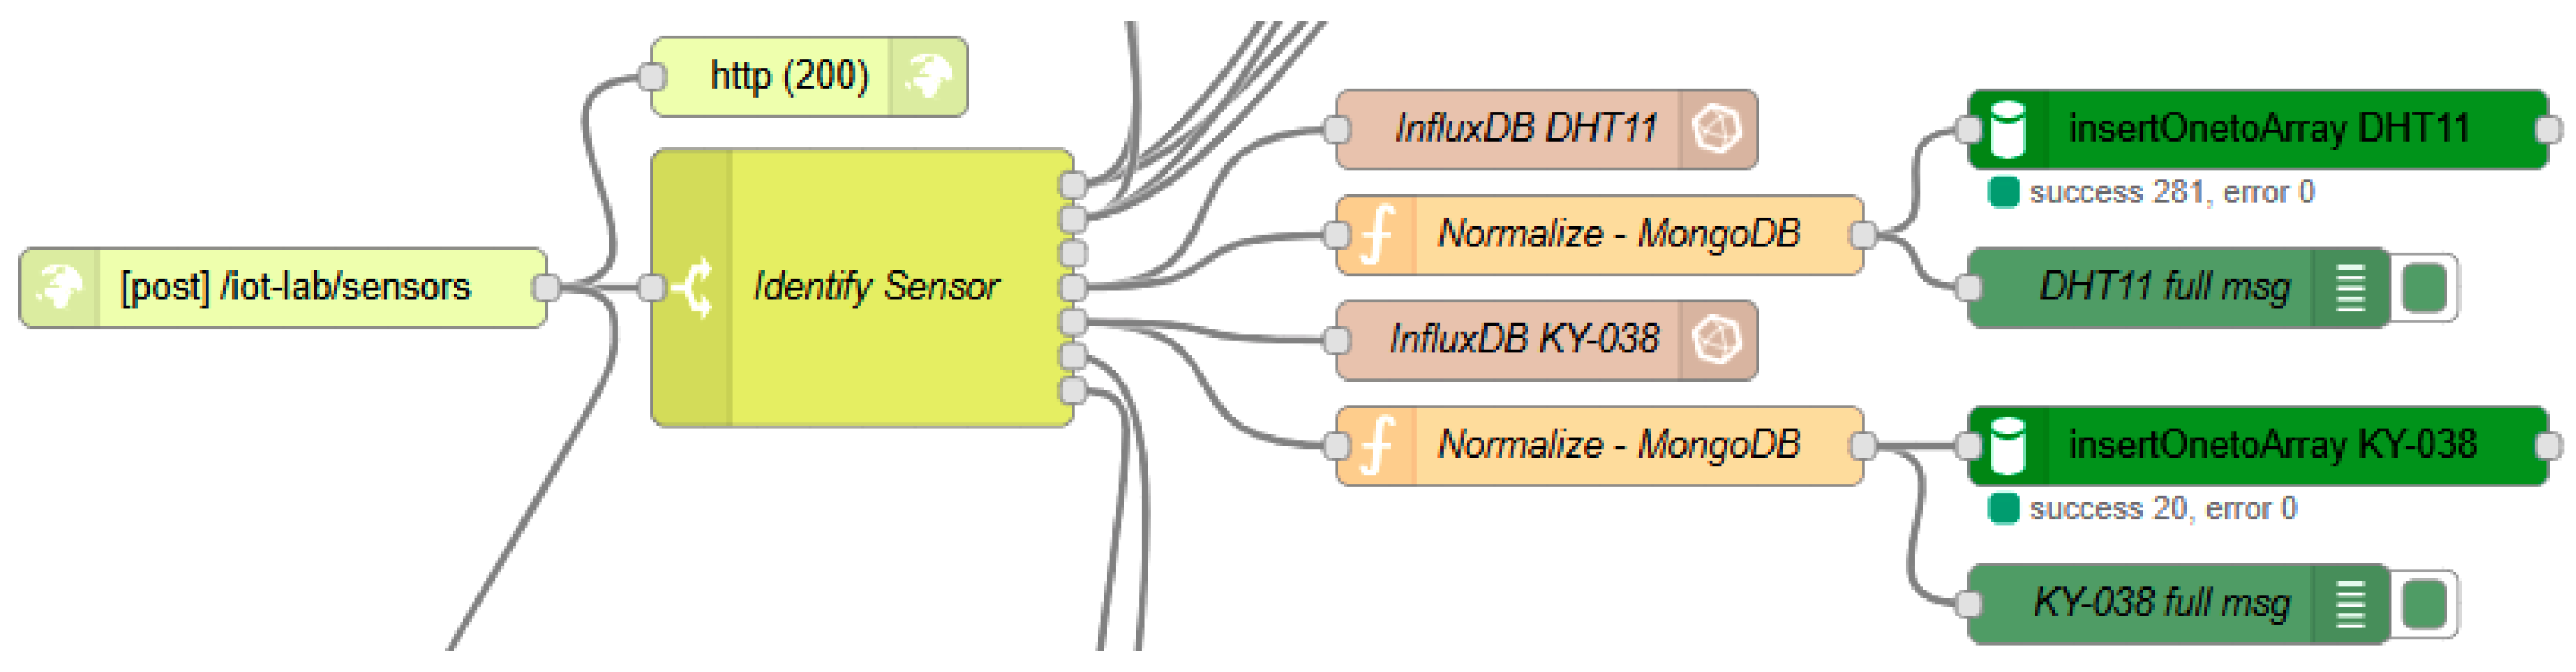
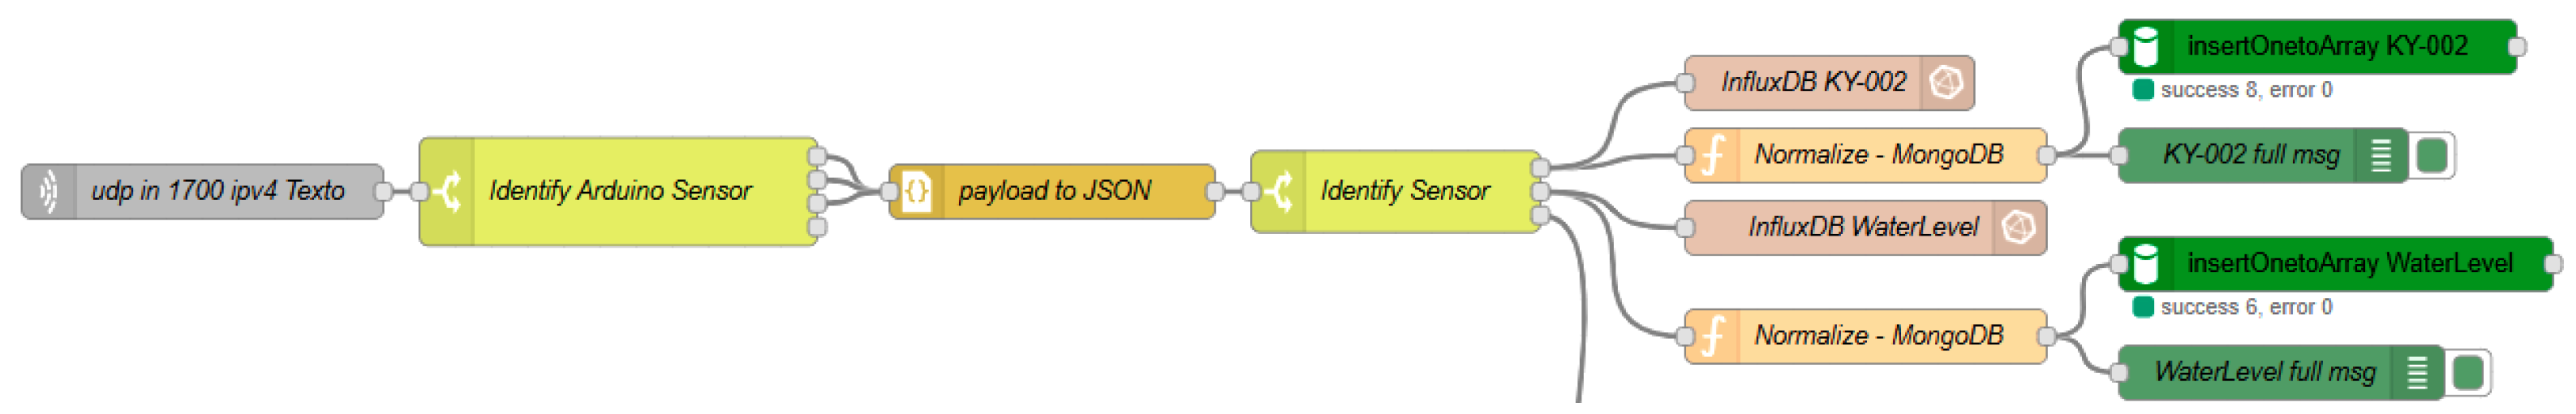
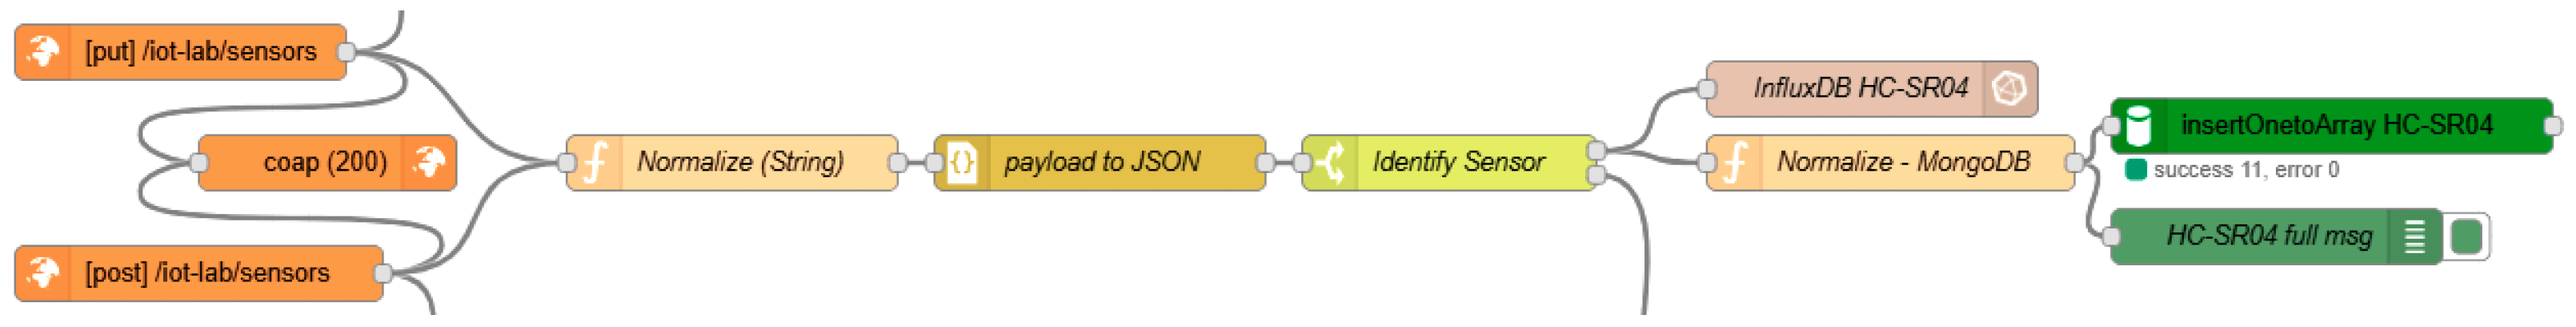
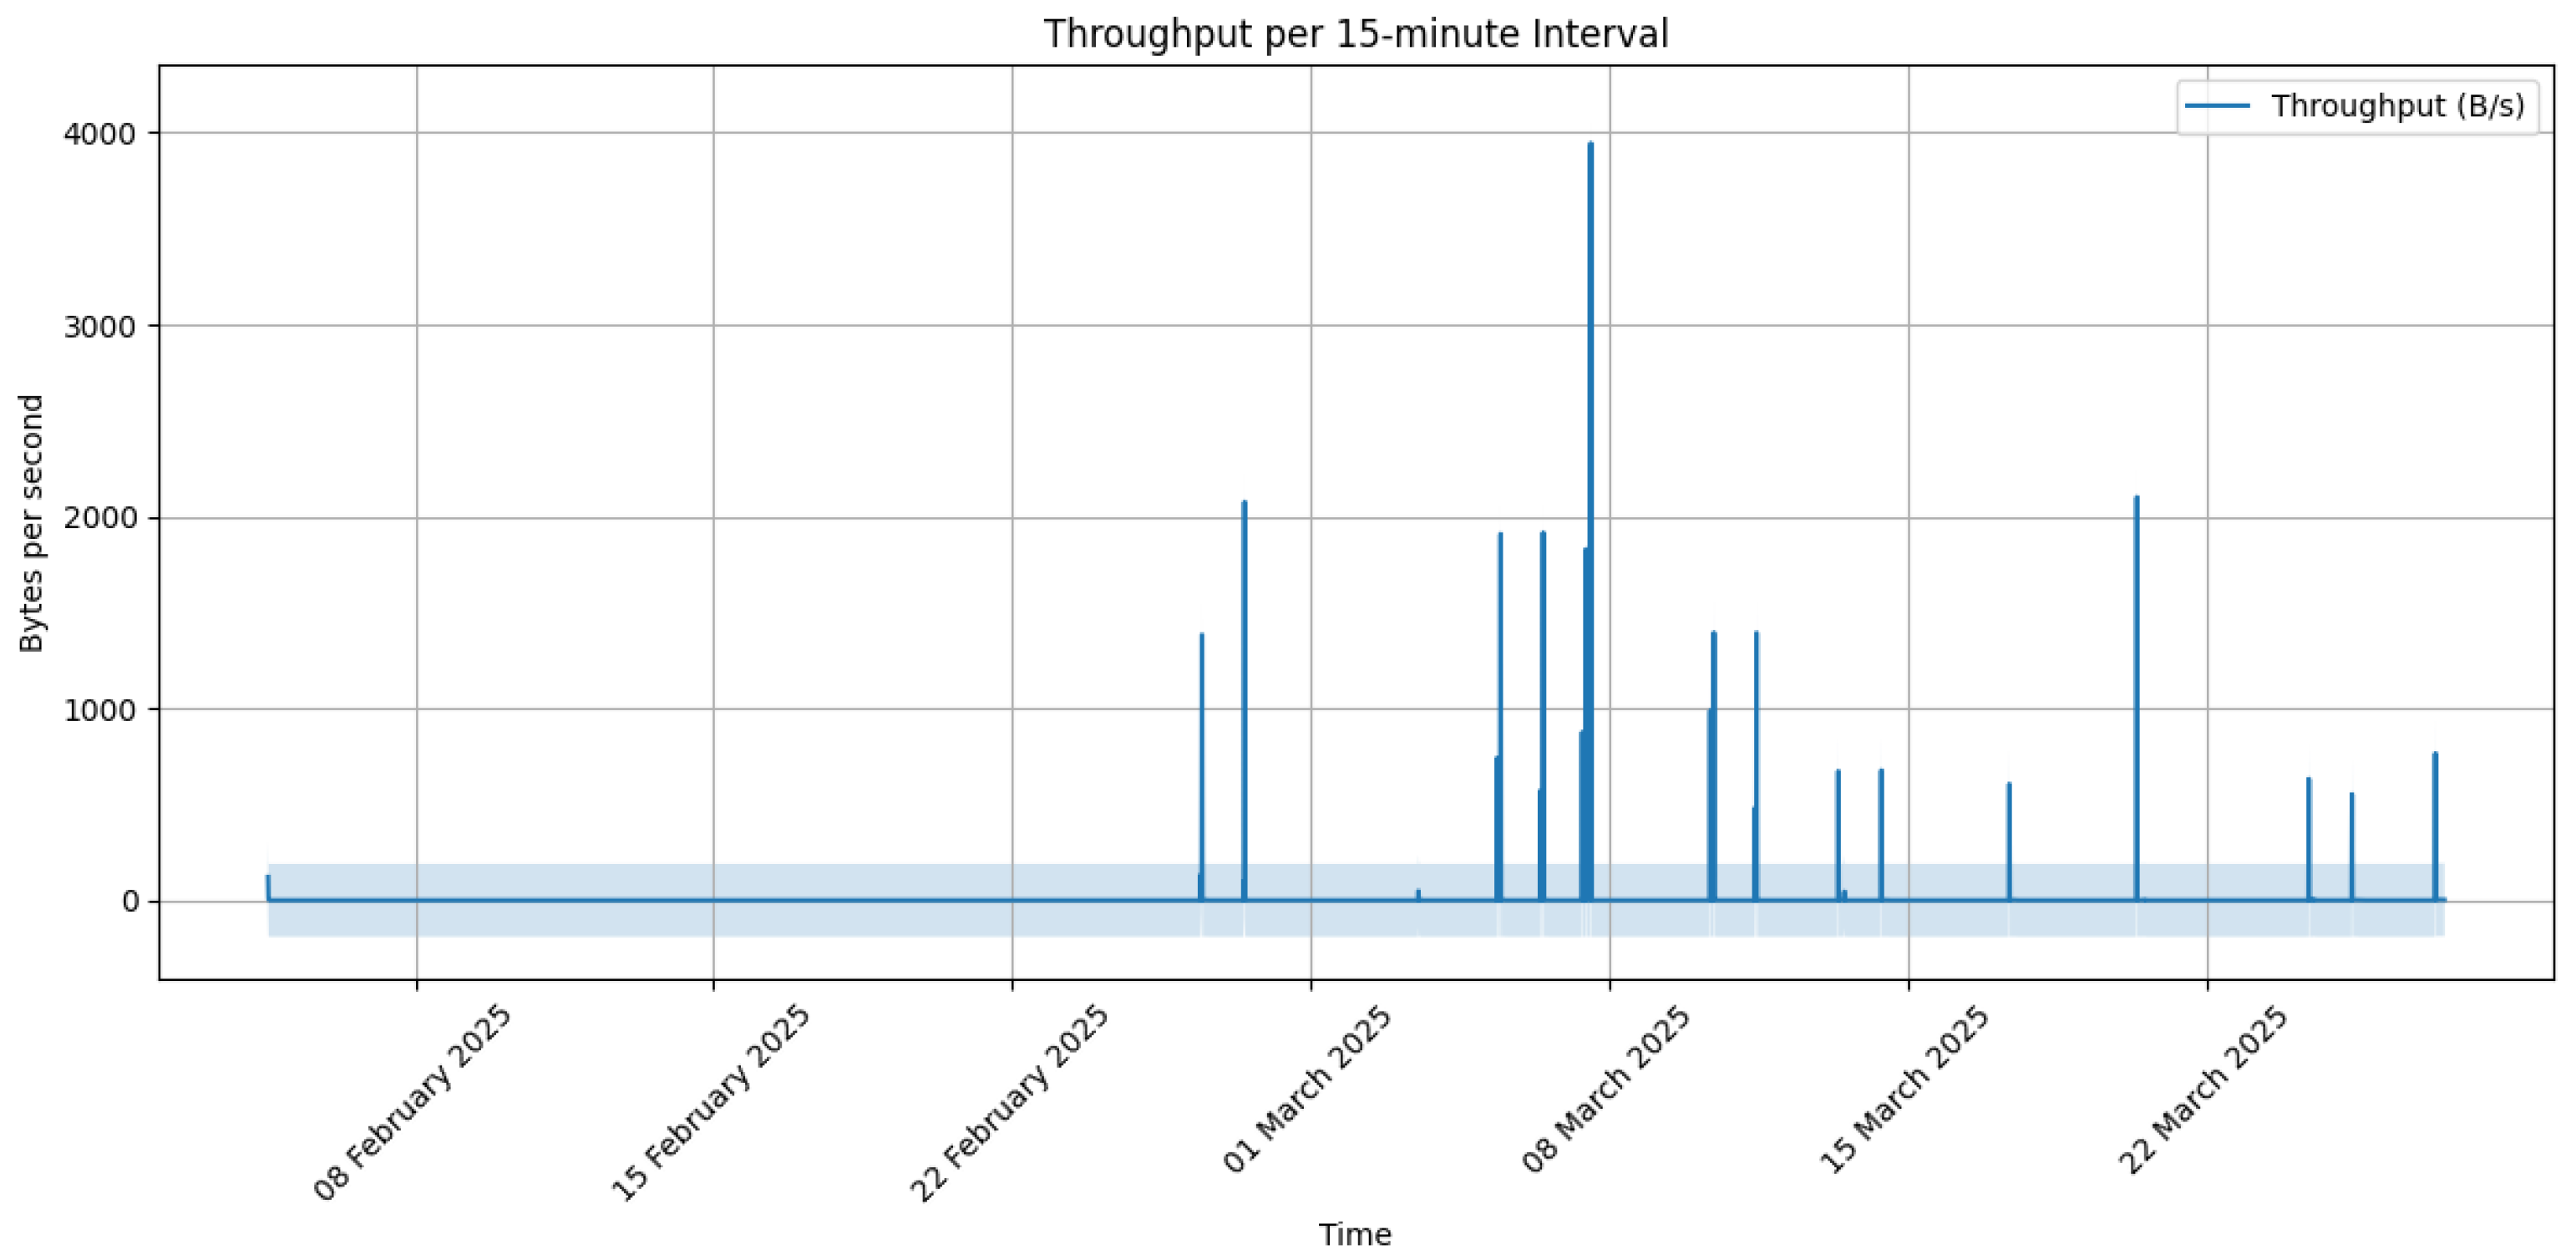
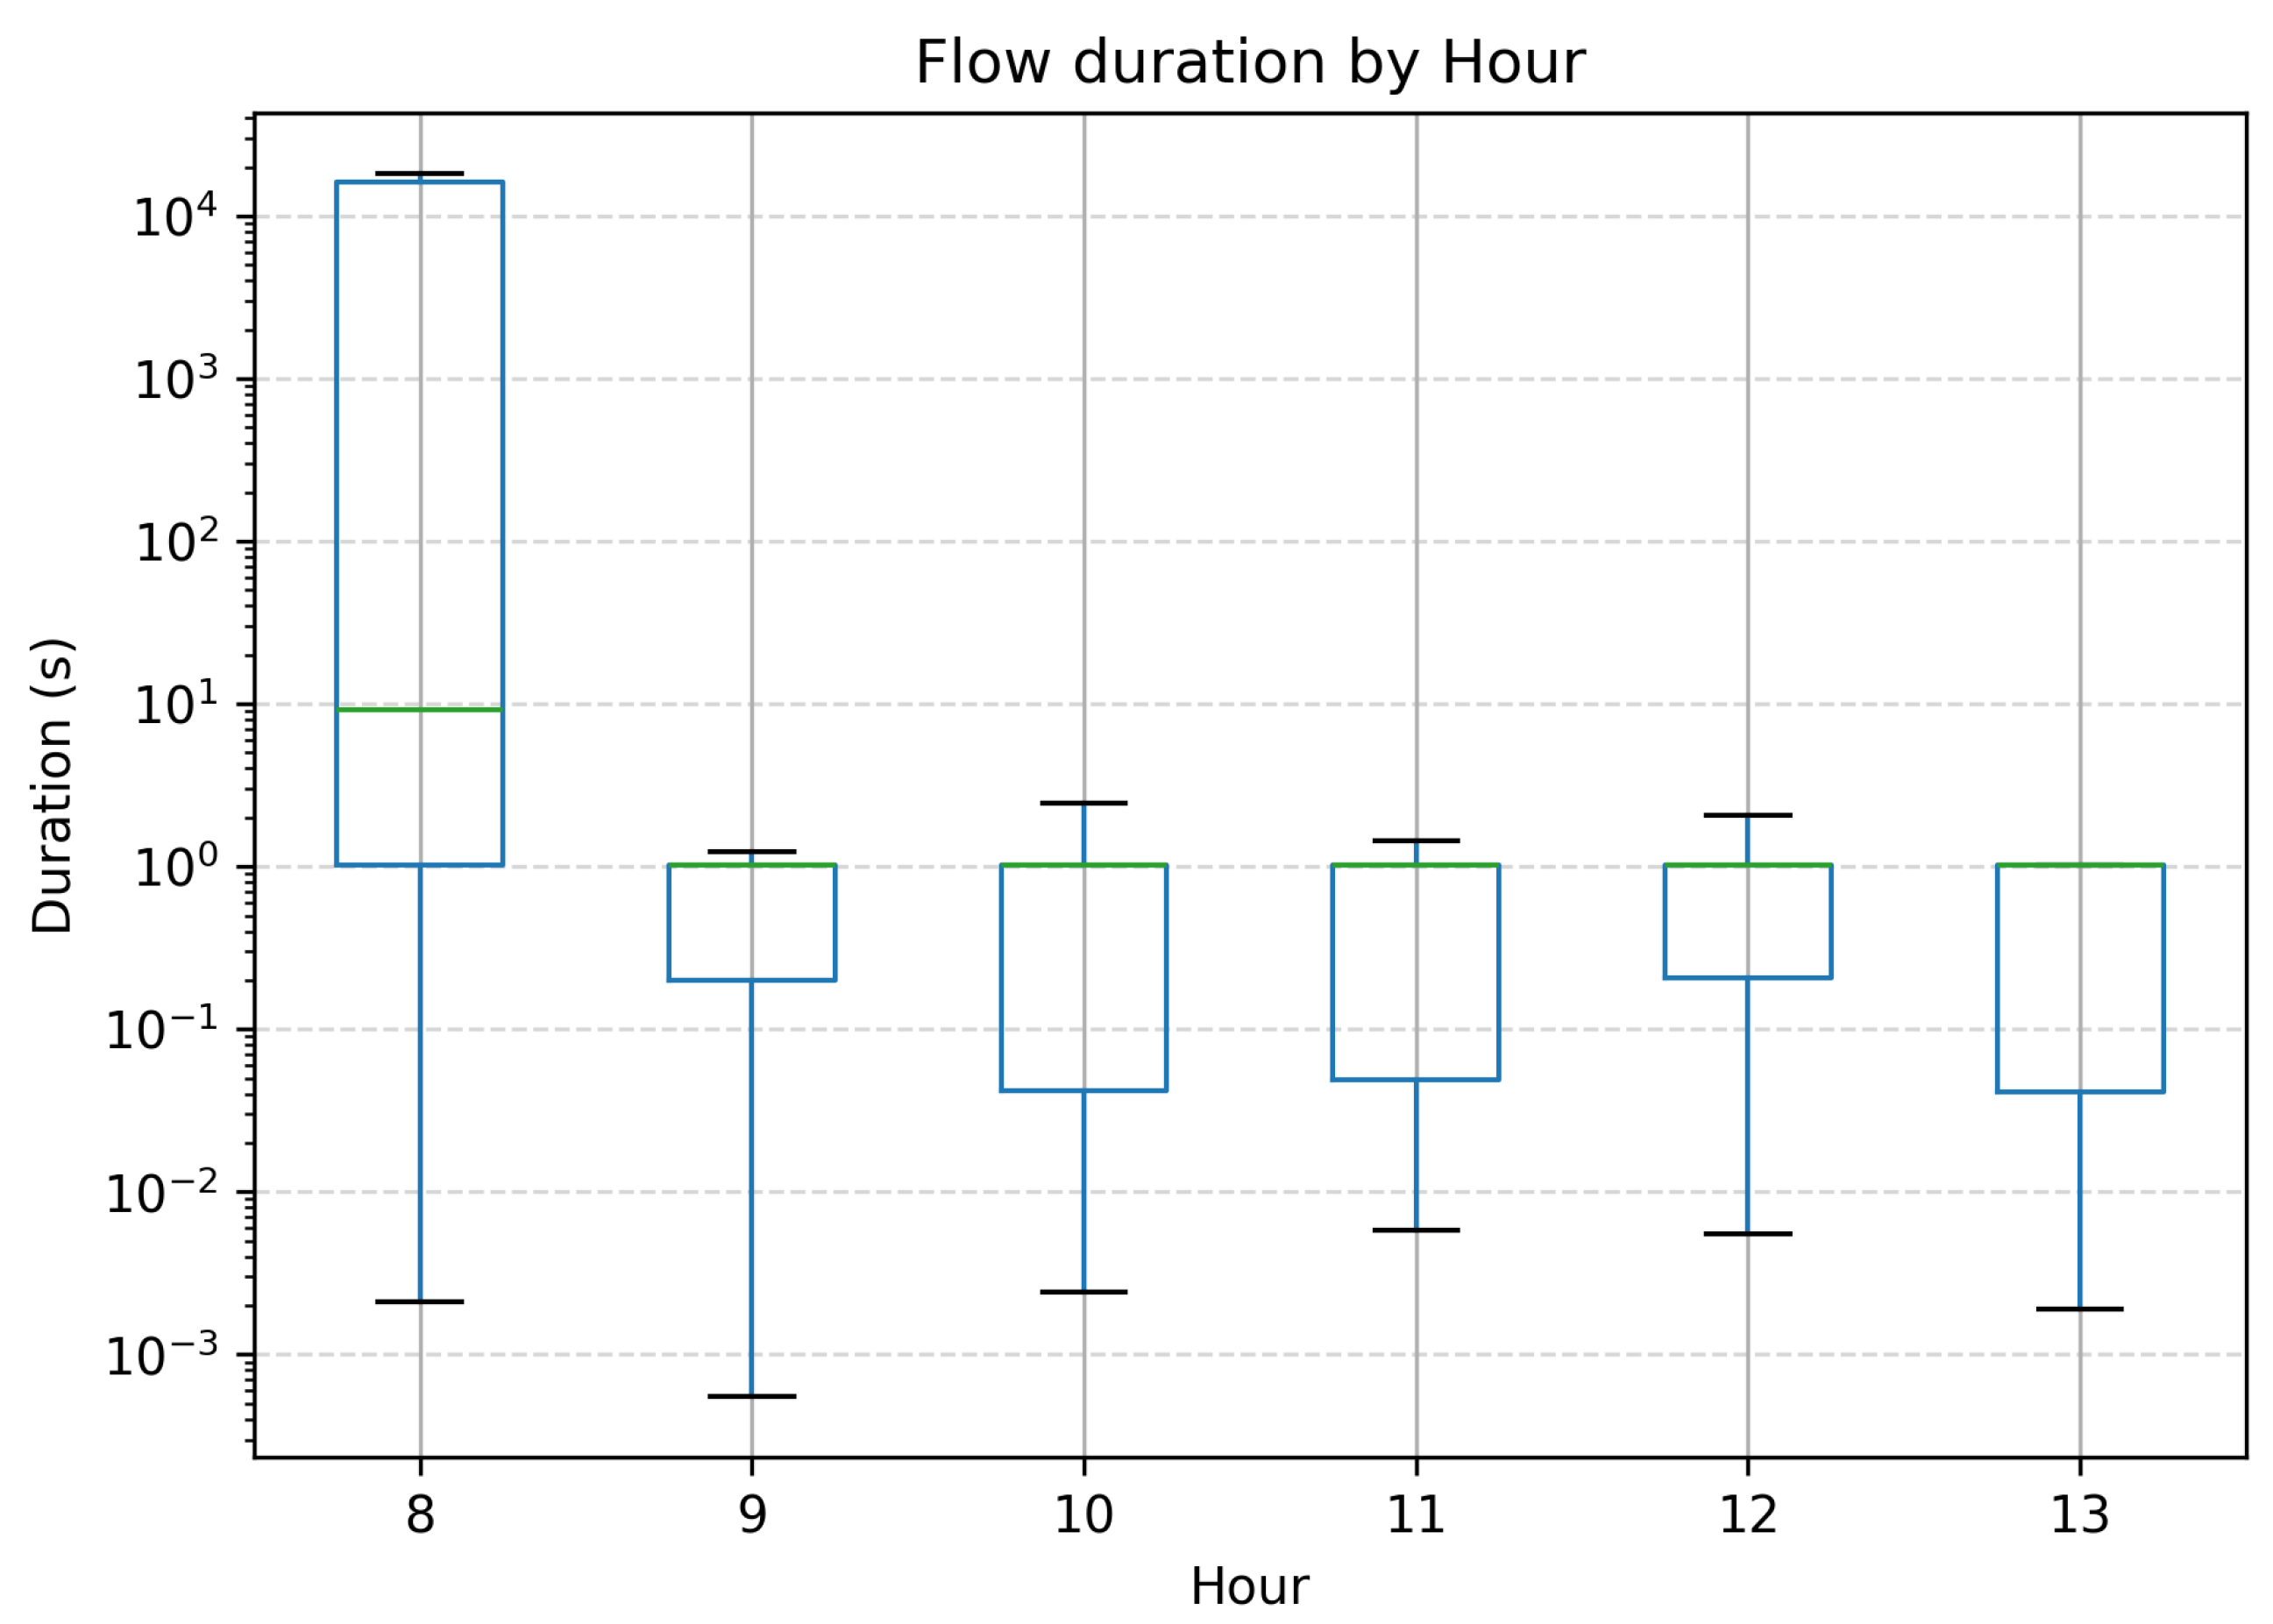
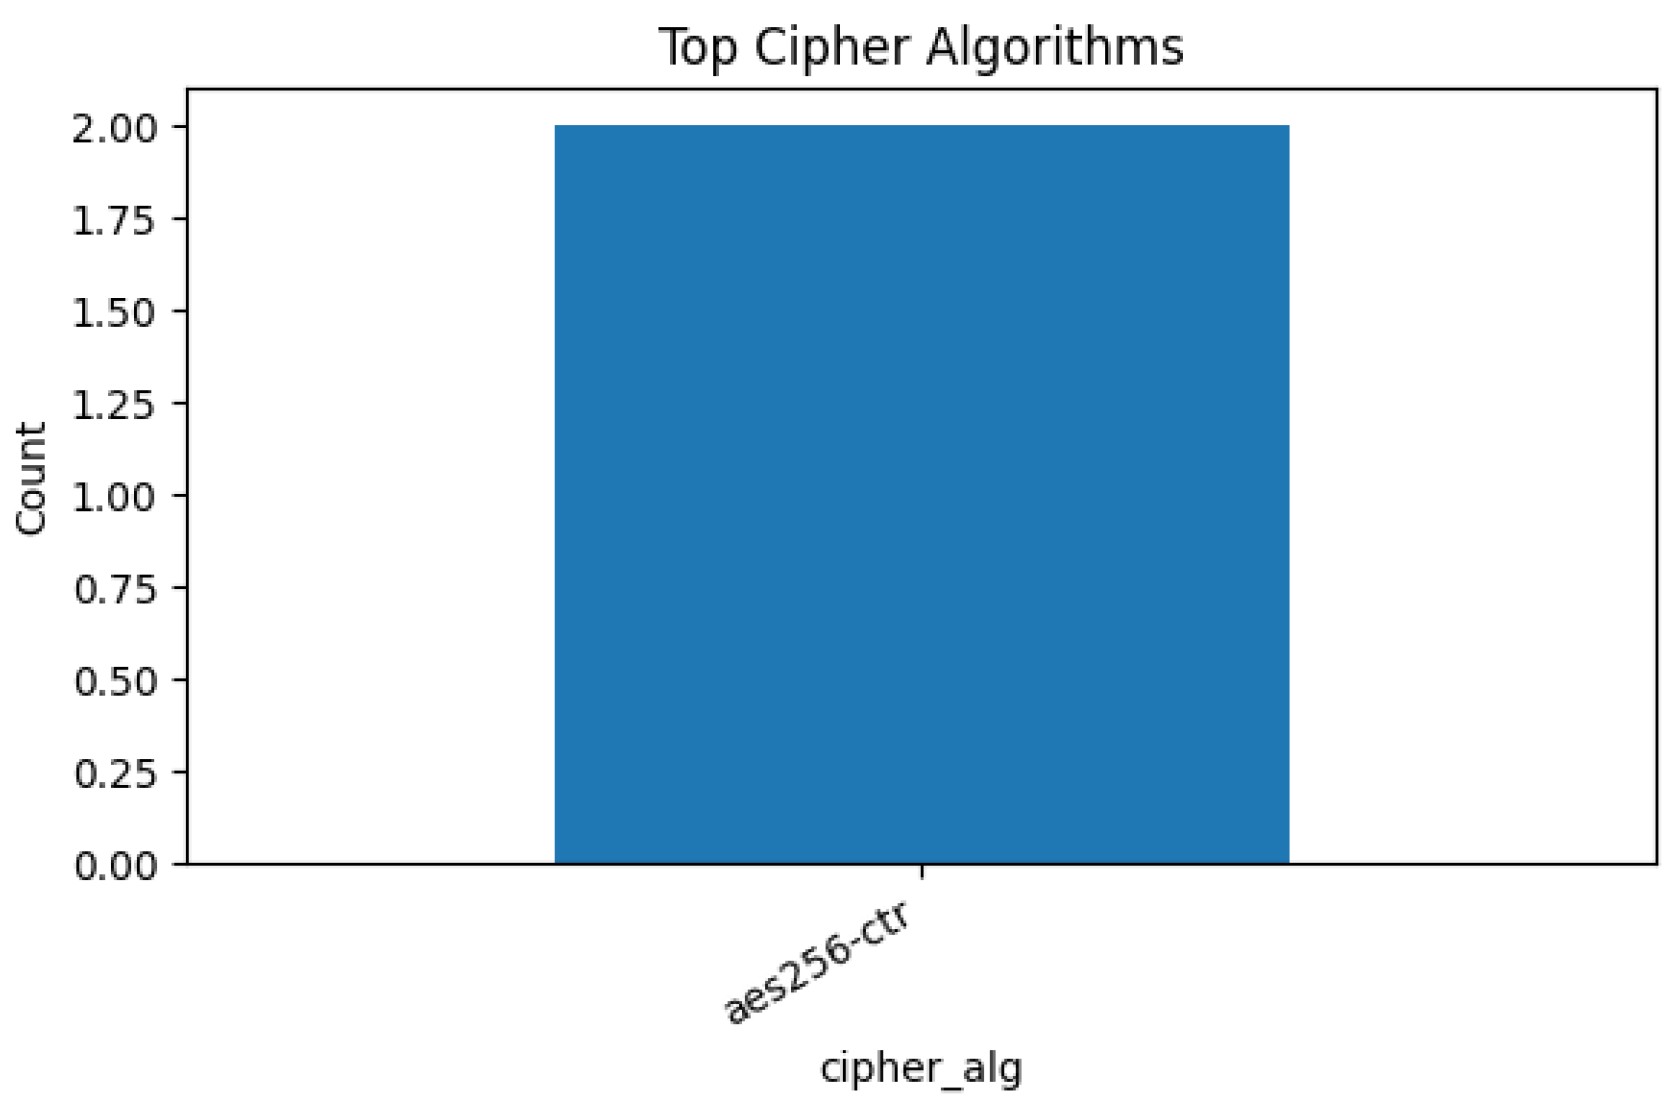
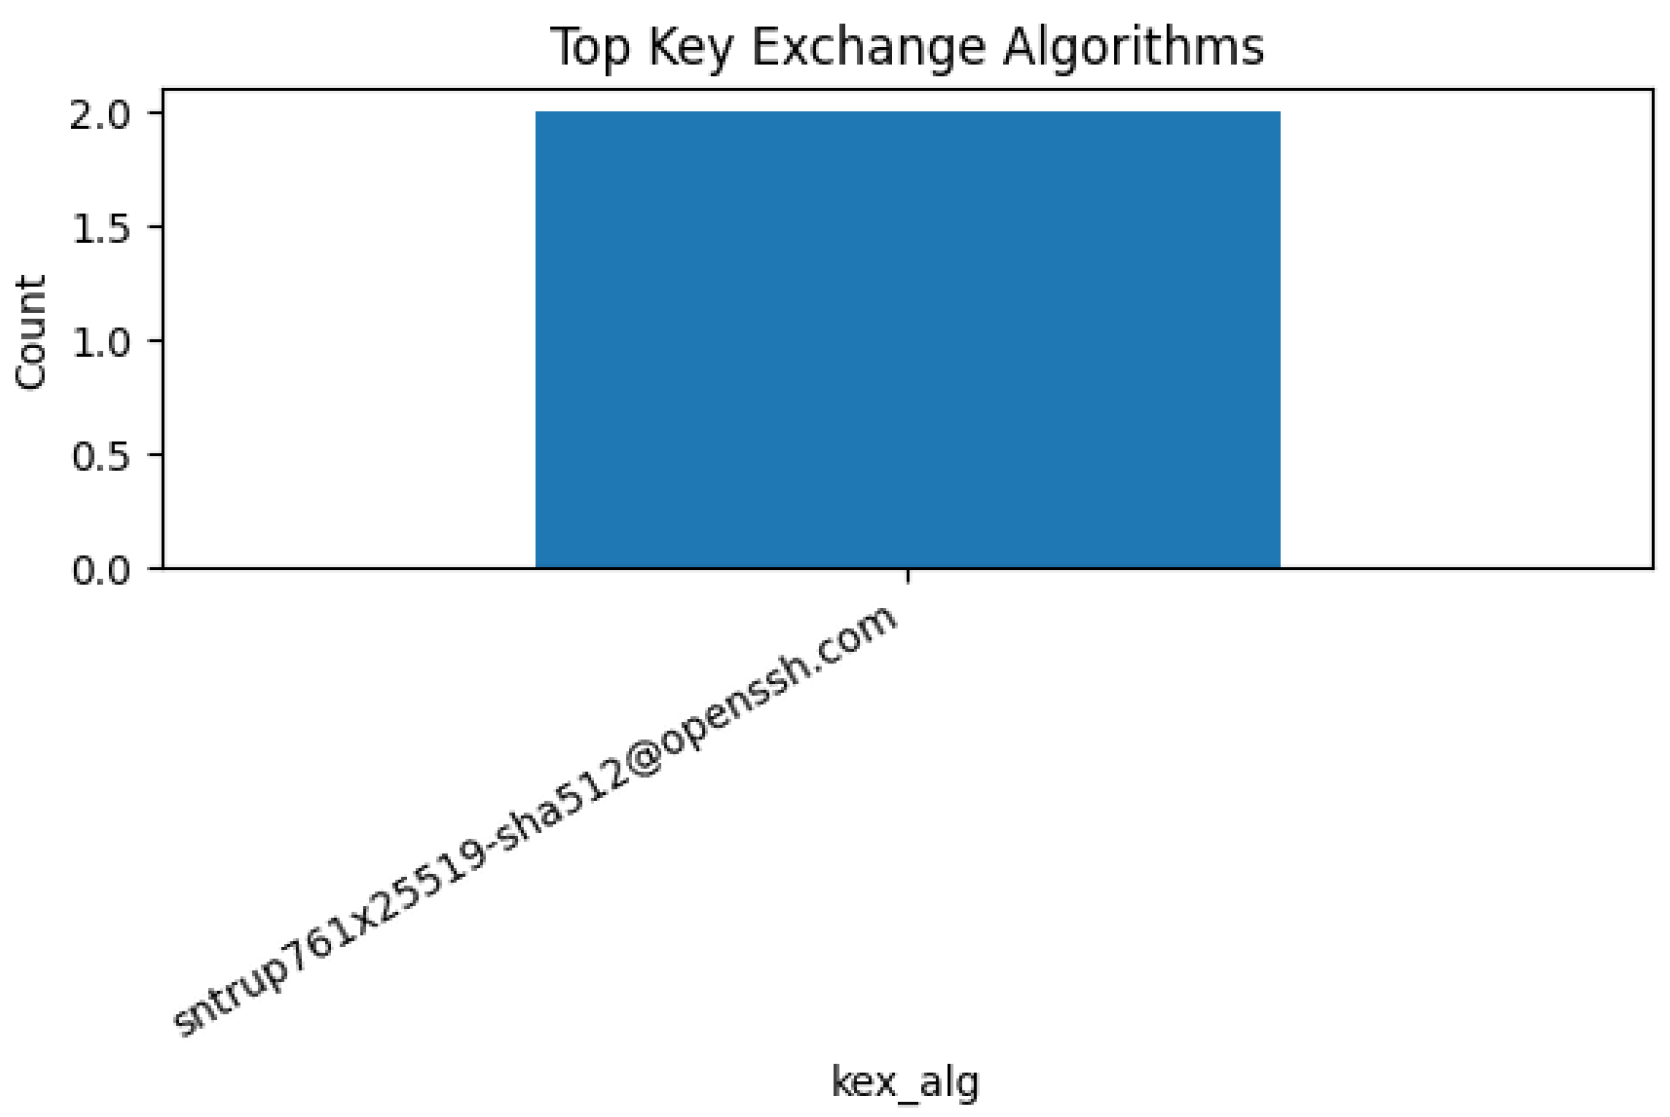

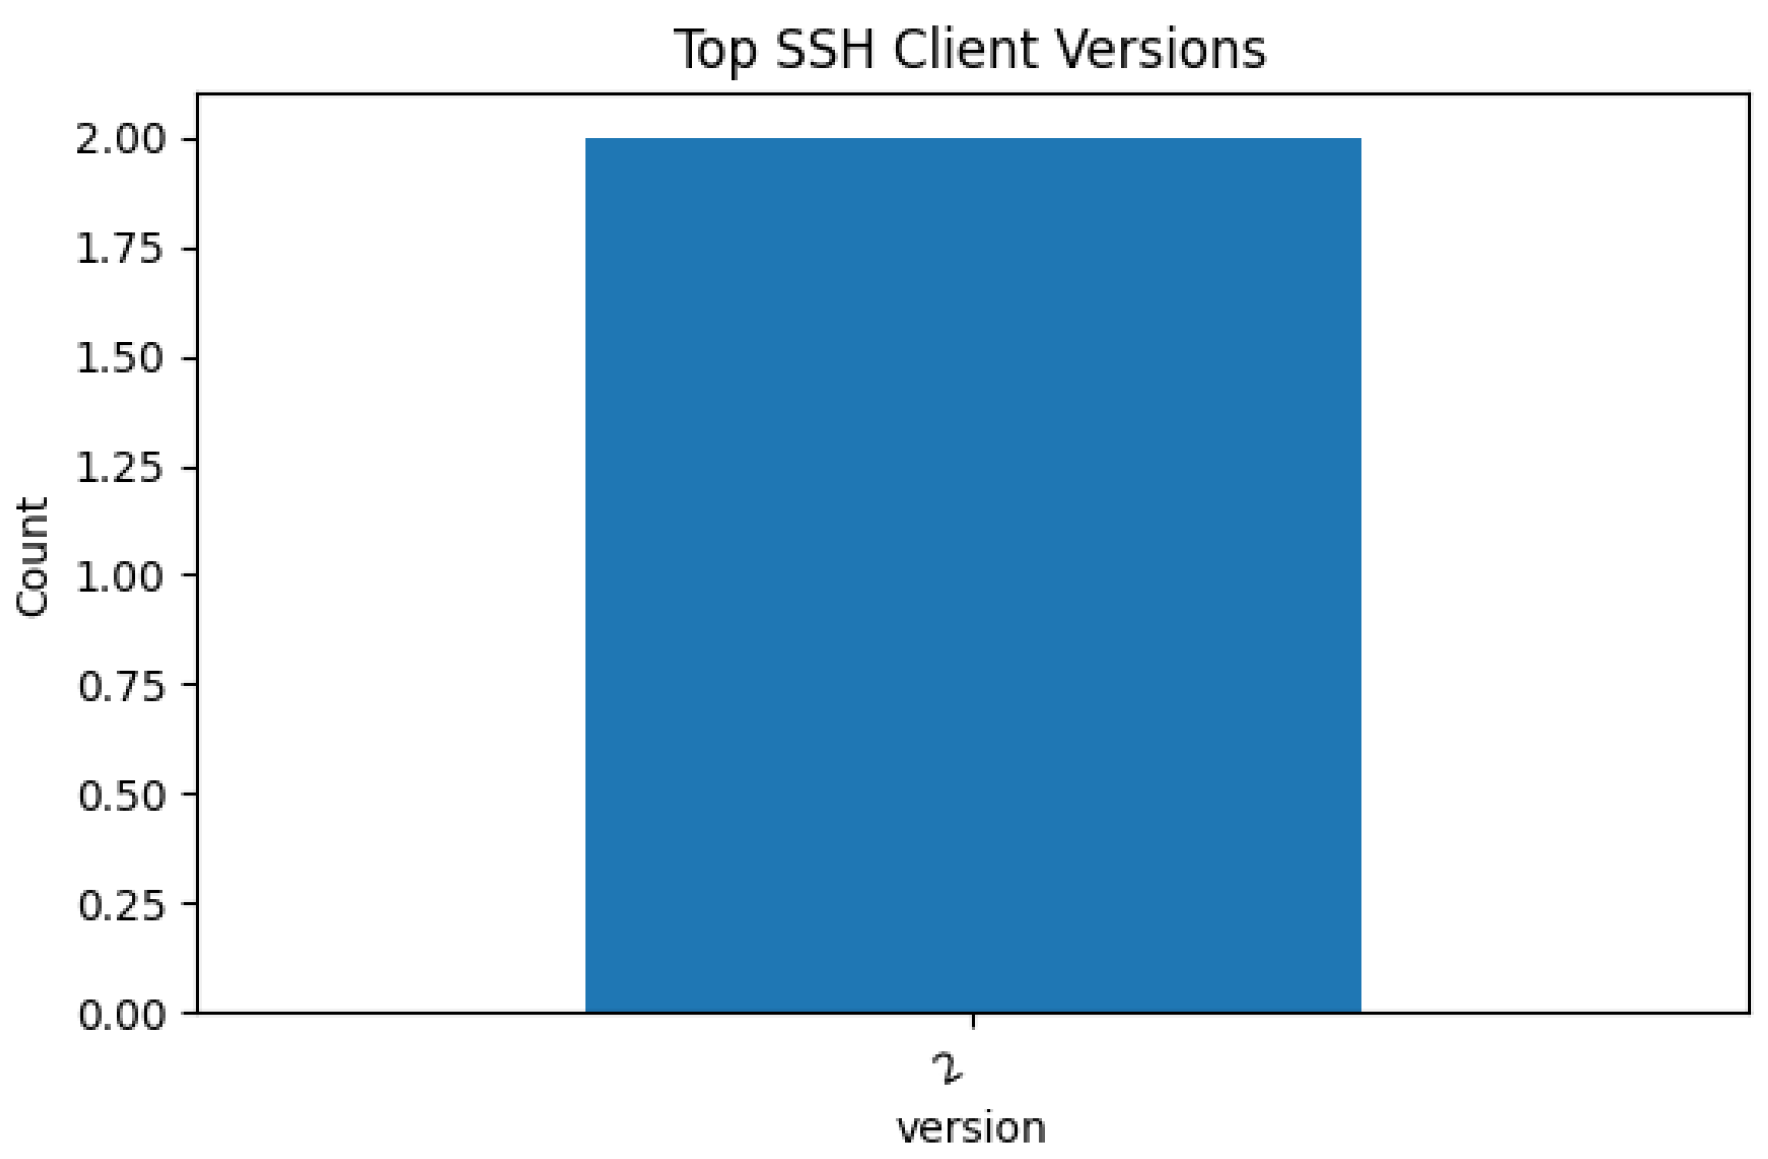
