Article

A QoS-Aware IoT Edge Network for Mobile Telemedicine Enabling In-Transit Monitoring of Emergency Patients

by
Adwitiya Mukhopadhyay
1,2,*,
Aryadevi Remanidevi Devidas
1,
Venkat P. Rangan
1 and
Maneesha Vinodini Ramesh
1
1
Center for Wireless Networks & Applications (WNA), Amrita Vishwa Vidyapeetham, Amritapuri 690525, India
2
Department of Computer Science, Amrita School of Computing, Mysuru Campus, Amrita Vishwa Vidyapeetham, Bhogadi 570026, India
*
Author to whom correspondence should be addressed.
Future Internet 2024, 16(2), 52; https://doi.org/10.3390/fi16020052
Submission received: 23 December 2023 / Revised: 28 January 2024 / Accepted: 29 January 2024 / Published: 6 February 2024
(This article belongs to the Special Issue Novel 5G Deployment Experience and Performance Results)

Abstract

:
Addressing the inadequacy of medical facilities in rural communities and the high number of patients affected by ailments that need to be treated immediately is of prime importance for all countries. The various recent healthcare emergency situations bring out the importance of telemedicine and demand rapid transportation of patients to nearby hospitals with available resources to provide the required medical care. Many current healthcare facilities and ambulances are not equipped to provide real-time risk assessment for each patient and dynamically provide the required medical interventions. This work proposes an IoT-based mobile medical edge (IM2E) node to be integrated with wearable and portable devices for the continuous monitoring of emergency patients transported via ambulances and it delves deeper into the existing challenges, such as (a) a lack of a simplified patient risk scoring system, (b) the need for architecture that enables seamless communication for dynamically varying QoS requirements, and (c)the need for context-aware knowledge regarding the effect of end-to-end delay and the packet loss ratio (PLR) on the real-time monitoring of health risks in emergency patients. The proposed work builds a data path selection model to identify the most effective path through which to route the data packets in an effective manner. The signal-to-noise interference ratio and the fading in the path are chosen to analyze the suitable path for data transmission.

1. Introduction

The year 2020 was a very difficult time for human civilization, with the new challenge of COVID-19 staring the world in its face [1,2]. The challenge of COVID-19 management was felt by the whole world, especially by developing countries across the globe.
Healthcare facilities handled the humongous rush of patients all across the world by delivering remote health services through telemedicine wherever appropriate [3]. Telemedicine primarily concerns extending healthcare to people who are in locations where expert medical care is difficult to provide. Developing countries require an efficient telemedicine system to fill the gap between the nonavailability of proper healthcare in rural or suburban areas and multispeciality hospitals in urban areas [4,5]. In most of these instances, an ambulance is employed. The ambulance used in these scenarios must be equipped with multiple pieces healthcare equipment that are normally available in a hospital’s emergency ward. Most of the present telemedicine ambulances are only equipped with devices to monitor vital signs. However, in addition, the monitoring of the real-time health status of critical patients and reliable transmission of the same data to doctors when en route to reference hospitals might prevent the occurrence of an increase in the risk levels and even loss of life. Ambulances equipped for telemedicine need to be capable of transmitting a variety of time-critical and temporally varying biosignal elements with varying QoS requirements, apart from the possible transmission of multimedia data. This makes seamless network connectivity indispensable. Thus, the transition to telehealth has been unprecedented but can help shape and configure post-pandemic well-being.
In this work, we consider a scenario where a mobile ambulance carrying a critically ill patient needs to reach a hospital, and the vital signs of the patient need to be transmitted to the hospital in the meantime from the ambulance. We have studied the transmission of biosignals such as pulse rate (PR) and electrocardiogram (ECG) along with voice signals in a vehicular ad hoc network (VANET) environment. A spatio-temporal study was conducted in Mysuru City, India, by dividing the day into seven temporal parts, and a 6 km stretch of a four-way highway road network was considered. However, the architectures, frameworks, and algorithms proposed in this manuscript are applicable across most geographical regions. In the literature, a comparison of various wireless protocols which are used in healthcare scenarios has been provided [6,7]. Niyato et al. explore the usefulness of WiMAX in an e-health context [8].

1.1. Key Contributions of the Paper

Our contributions to the field are as follows:
  • To address the needs of the resource-constrained environment, this work proposes an IoT edge algorithm integrated with a wearable-device-based monitoring algorithm for edge (WDMA-Edge).
  • Currently, a standardized health score to assess patients’ risk levels is lacking. We propose an on-the-fly emergency health score (OFEHS) to monitor emergency patients during transit.
  • An adaptive QoS-aware packet transmission for fog (AQPT-Fog) algorithm is designed and implemented to prioritize patient mobilization.
  • A simulation study is performed based on real-world traffic data collected from the stretch of road in Mysuru, India. The results showcase the need to have a dynamic communication architecture integrating V2I and show that deploying stationary units greatly improves QoS.

1.2. Paper Outline

The rest of this paper is organized as follows. Section 2 presents a review of the existing literature related to healthcare service provisioning and Section 3 presents our research objectives and contributions. An IoT-Enabled Traffic-Aware Telemedicine Architecture (ITTA), IoT-based Telemedicine Services Framework (ITSF), and an algorithm which includes a novel mechanism for risk scoring of patients are also proposed in Section 4, along with a fog computing mechanism as an algorithm. Section 5 presents the details of our simulation study and the performance analysis. Finally, Section 6 concludes the paper.

2. Literature Review

During the years 2020 and 2021, more than 1 million humans across the world were infected with the COVID-19 virus [9]. This exponential increase in the disease spread led to a surge in global demand for intensive care unit (ICU) wards. In order to reduce the strain on already overburdened hospitals, adopting telemedicine would be great help.
Based on a study performed in England, Richard et al. provide a model for a telemedicine scenario [10]. The paper highlights how the healthcare infrastructure in England mitigated the morbidity rate in the country during the COVID-19 pandemic. In contrast, in most developing countries, due to a lack of enough healthcare access in rural communities, COVID-19 patients need to be transported by ambulances to urban locations to receive the required healthcare support [11,12].
This introduces the new challenge of monitoring the patients while they are transported in mobile ambulances. During the transit of COVID-19 patients, dynamic monitoring of their vital parameters is important. It is also important that the patient’s risk levels be monitored continuously, as the healthcare dissemination plan might change according to the varying risk levels. The existing literature [13,14,15] details multiple scoring systems for determining the critical level of a patient. During emergencies, the lack of a common standard leads to ambiguity and misunderstandings in information exchange during inter-hospital transfers. However, existing scoring mechanisms consider pathological parameters that would be challenging to measure in a moving ambulance and would require a dedicated laboratory setup available only in hospitals. In order to enable the ambulance operator and doctors to categorize the patient easily and facilitate the healthcare practitioners to function smoothly, we have proposed our monitoring algorithm WDMA-Edge and scoring mechanism OFEHS.
In order to keep the doctor informed about the patient’s vital signs and the risk level, this information needs to be transmitted to the remote hospital during the transit of the ambulance. Insufficient network access in rural areas, which is as little as 18%, is observed as one of the major challenges in data dissemination [16,17,18]. The authors of [19] showcase vehicular-based network access using the 802.11p standard and the authors of [20] present a health monitoring system utilizing heterogeneous communication based on 6LoWPAN and the cellular network. However, both the solutions lack seamless continuous connectivity. The degradation of the signal strength of communication technologies during high-speed traversal of mobile vehicles poses another major challenge to mobile telemedicine services [21,22]. Storing the data in a telemedicine scenario yields several concerns with respect to the interoperability and privacy of healthcare devices and data while using cloud-based technologies [23]. Therefore, most of the existing solutions are not acceptable for solving the specific requirements for mobile telemedicine solutions and are also very expensive, leading to non-affordability for wide deployments in mobile ambulances.
Achieving stringent QoS requirements for seamless data transmission from mobile ambulances under different traffic scenarios is considered another challenge. The existing studies do not detail the impacts due to each and every factor such as varying vehicular density and velocity along with spatio-temporal variations, and do not propose an integrated solution for meeting the stringent QoS requirement [24,25,26,27,28]. This paper addresses the lacuna by proposing novel algorithms and methods such as ITTA and ITSF.
Multiple architectures for telemedicine can be found in the existing literature. For instance, Ref. [29] presents an IoT-based architecture which can have remote access to a patient’s vital signs, such as heartbeat and BP. The measured vital signs are further transmitted over the communication network to a doctor’s mobile phone. The authors of [30] have come up with a novel embedded platform for the analysis of ECG signals of patients when being treated remotely. However, their analysis takes place locally, and improvement is possible by implementing cloud processing and storage. In the proposed work, Refs. [31,32] propose a smart health-based solution for remote monitoring of patients. The work addresses important aspects such as accessibility and affordability along with availability. However, the proposed system does not consider remote monitoring of patients who are currently in transit in a mobile vehicle.
As observed in the research papers discussed above, the lack of healthcare access to many portions of the population affected timely assistance during the COVID-19 pandemic. Even though multiple implementations and research regarding the monitoring of patients can be found in the literature, very little research is found towards the continuous monitoring of patients’ vital signs and criticality levels during transit in an ambulance. Moreover, most existing medical risk scoring mechanisms require a pathological lab setup and are challenging to implement on a moving ambulance. Some literature work addresses the major issue of telemedicine and the solutions with IoT [33]. IoT-based edge traffic offloading is proposed with a secured cloud environment [34].
Each data packet with patients’ vital signs has its own QoS requirement, and the telemedicine system needs to adaptively select the communication protocol for reliable data transmission from the ambulance to the remote hospitals or doctors based on the available communication infrastructure. However, the same has not been explored in the existing literature.
This paper proposes a telemedicine system that continuously monitors a patient’s vital signs and presents OFEHS, a novel risk-scoring mechanism that can be implemented in moving ambulances. Furthermore, the paper’s algorithm, AQPT-Fog, adaptively selects the routing mode based on required QoS parameters and available infrastructure. We have assumed that the healthcare workers present in the ambulance, as well as the hospitals, are trained for information collection in real time and interpret the same as required.

3. Proposed Research Framework

The key research objectives considered in this work are given below:
  • RO1: Designing a common standard for patient risk scoring during traversal to the hospital;
  • RO2: Hybrid communication architecture for transmitting delay-intolerant health risk data;
  • RO3: Traffic-aware real-time routing of health risk data to the selected hospital.
The proposed method enables the assurance of the QoS of the network with topology and ensures that the ambulance travels in a route which reaches the hospital as soon as possible. This work ensures the shortest path along with the tele-assistance to be given to the patient in the ambulance.

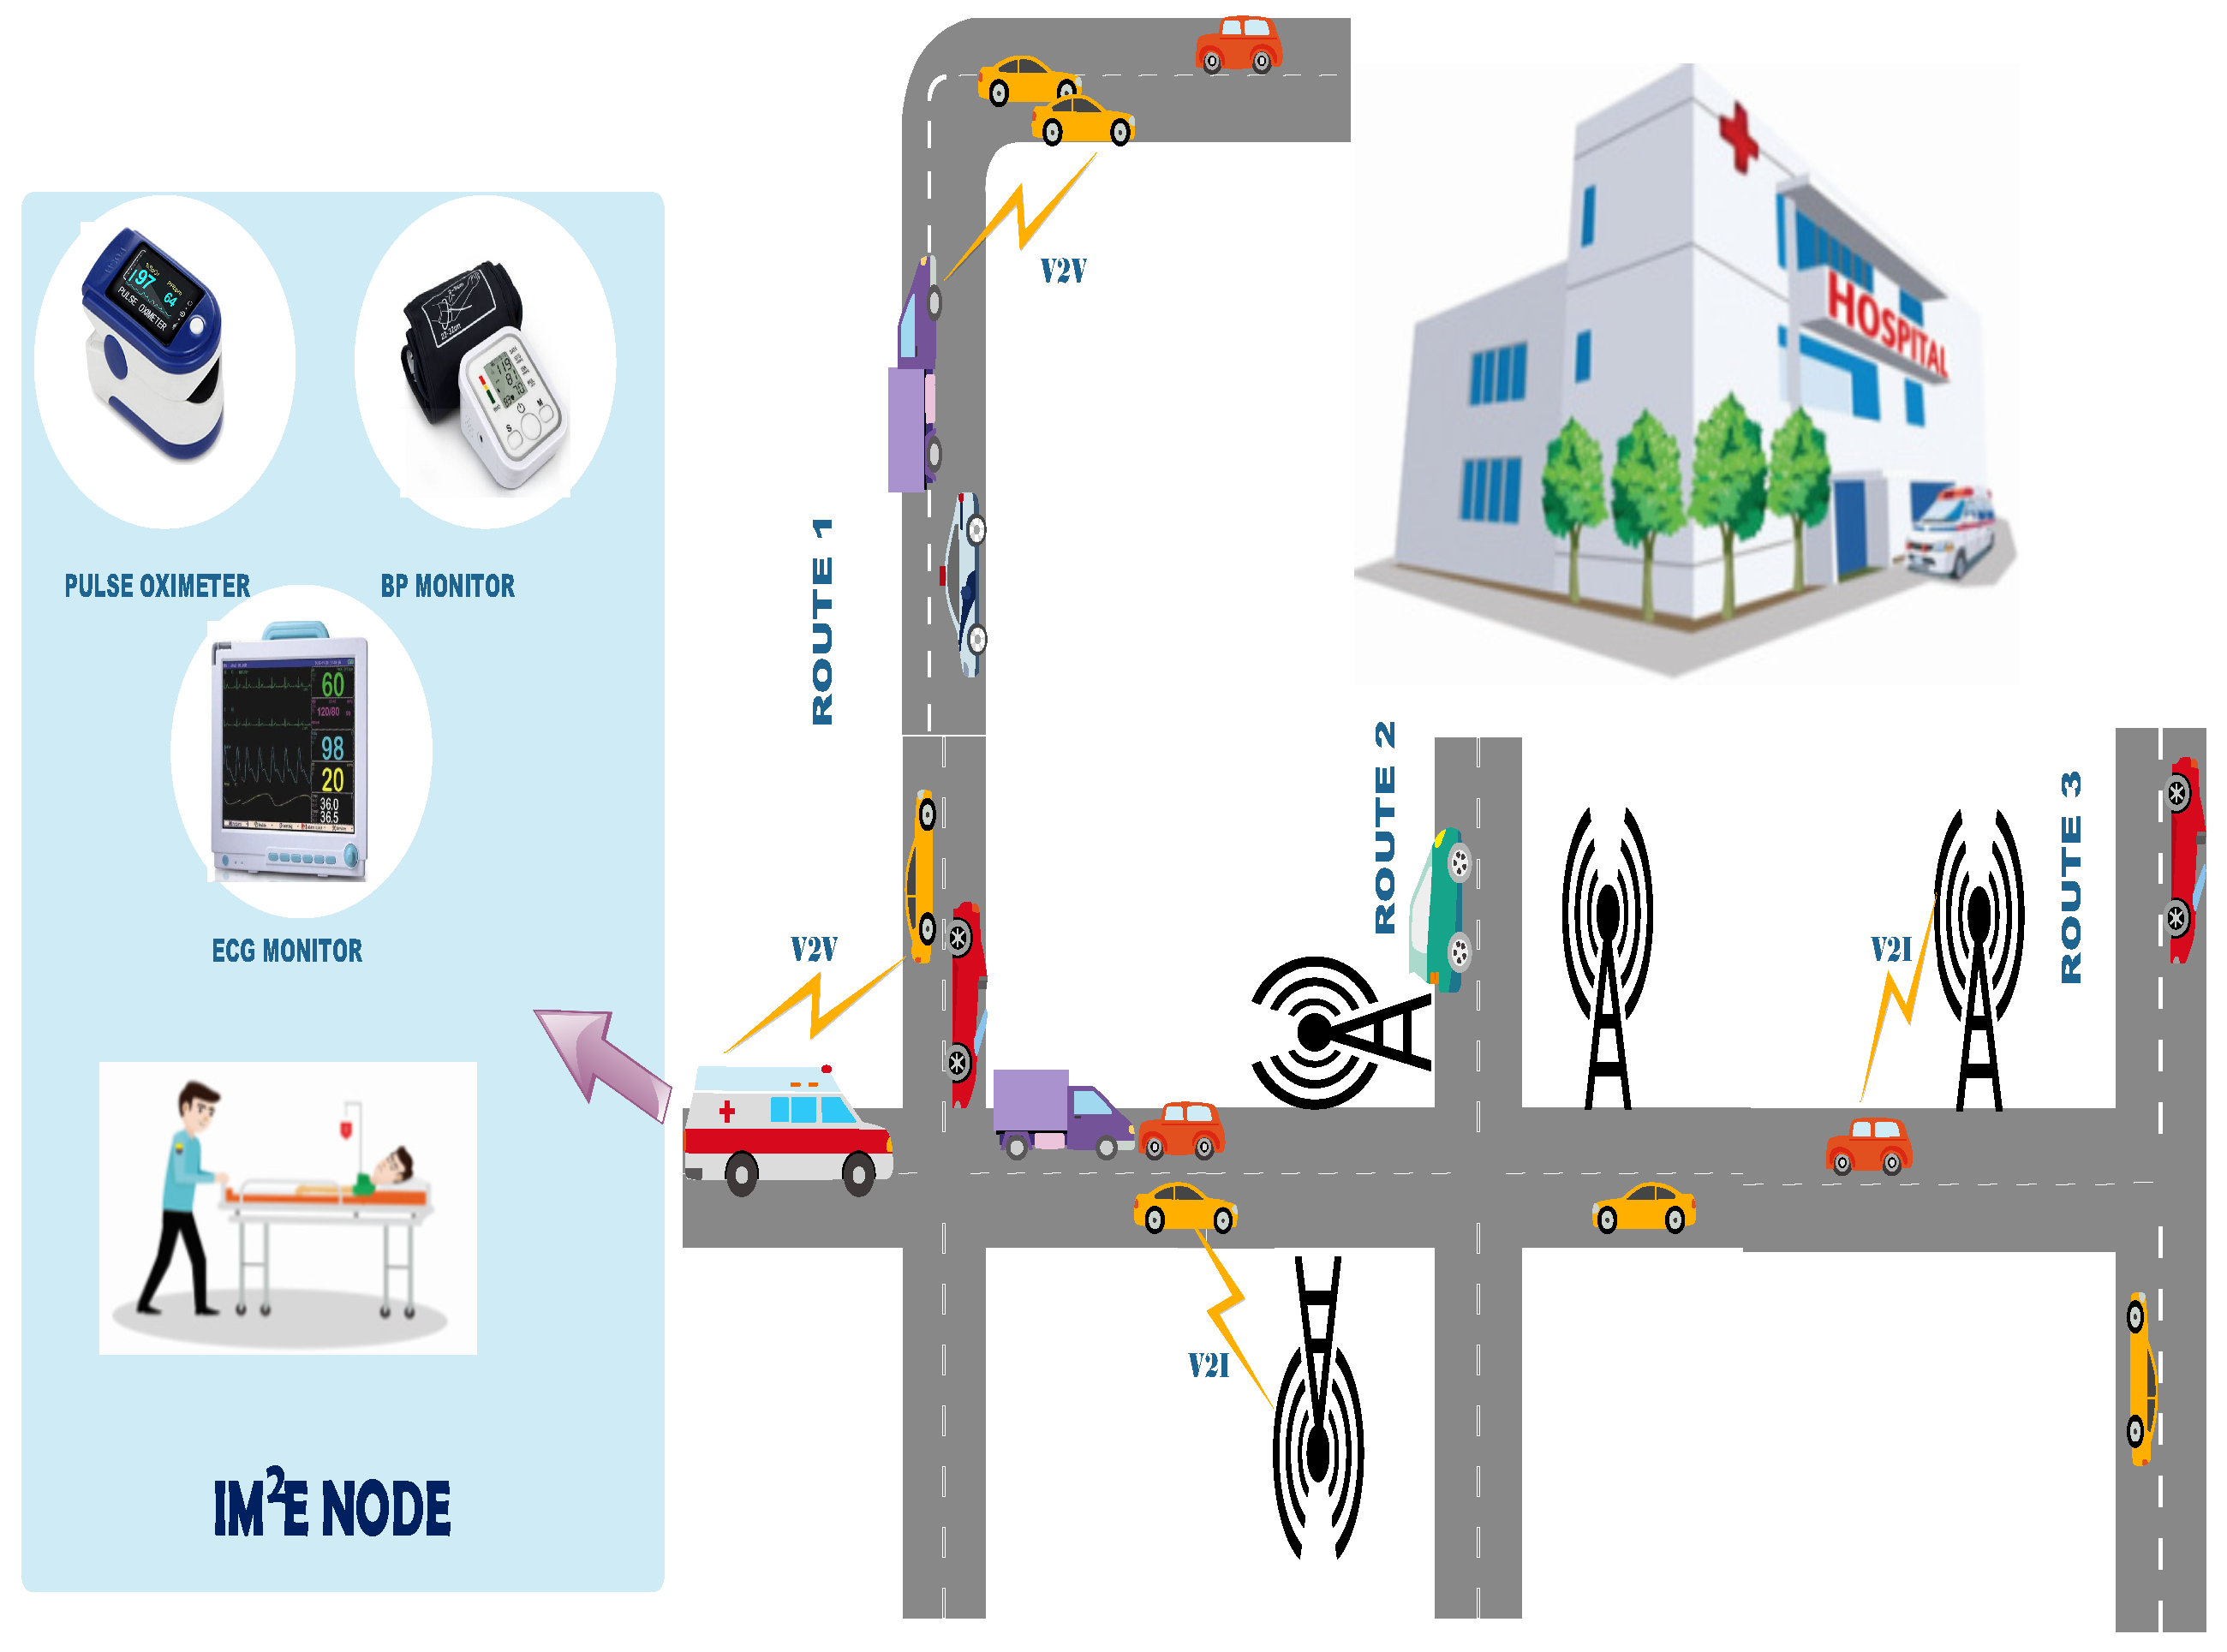
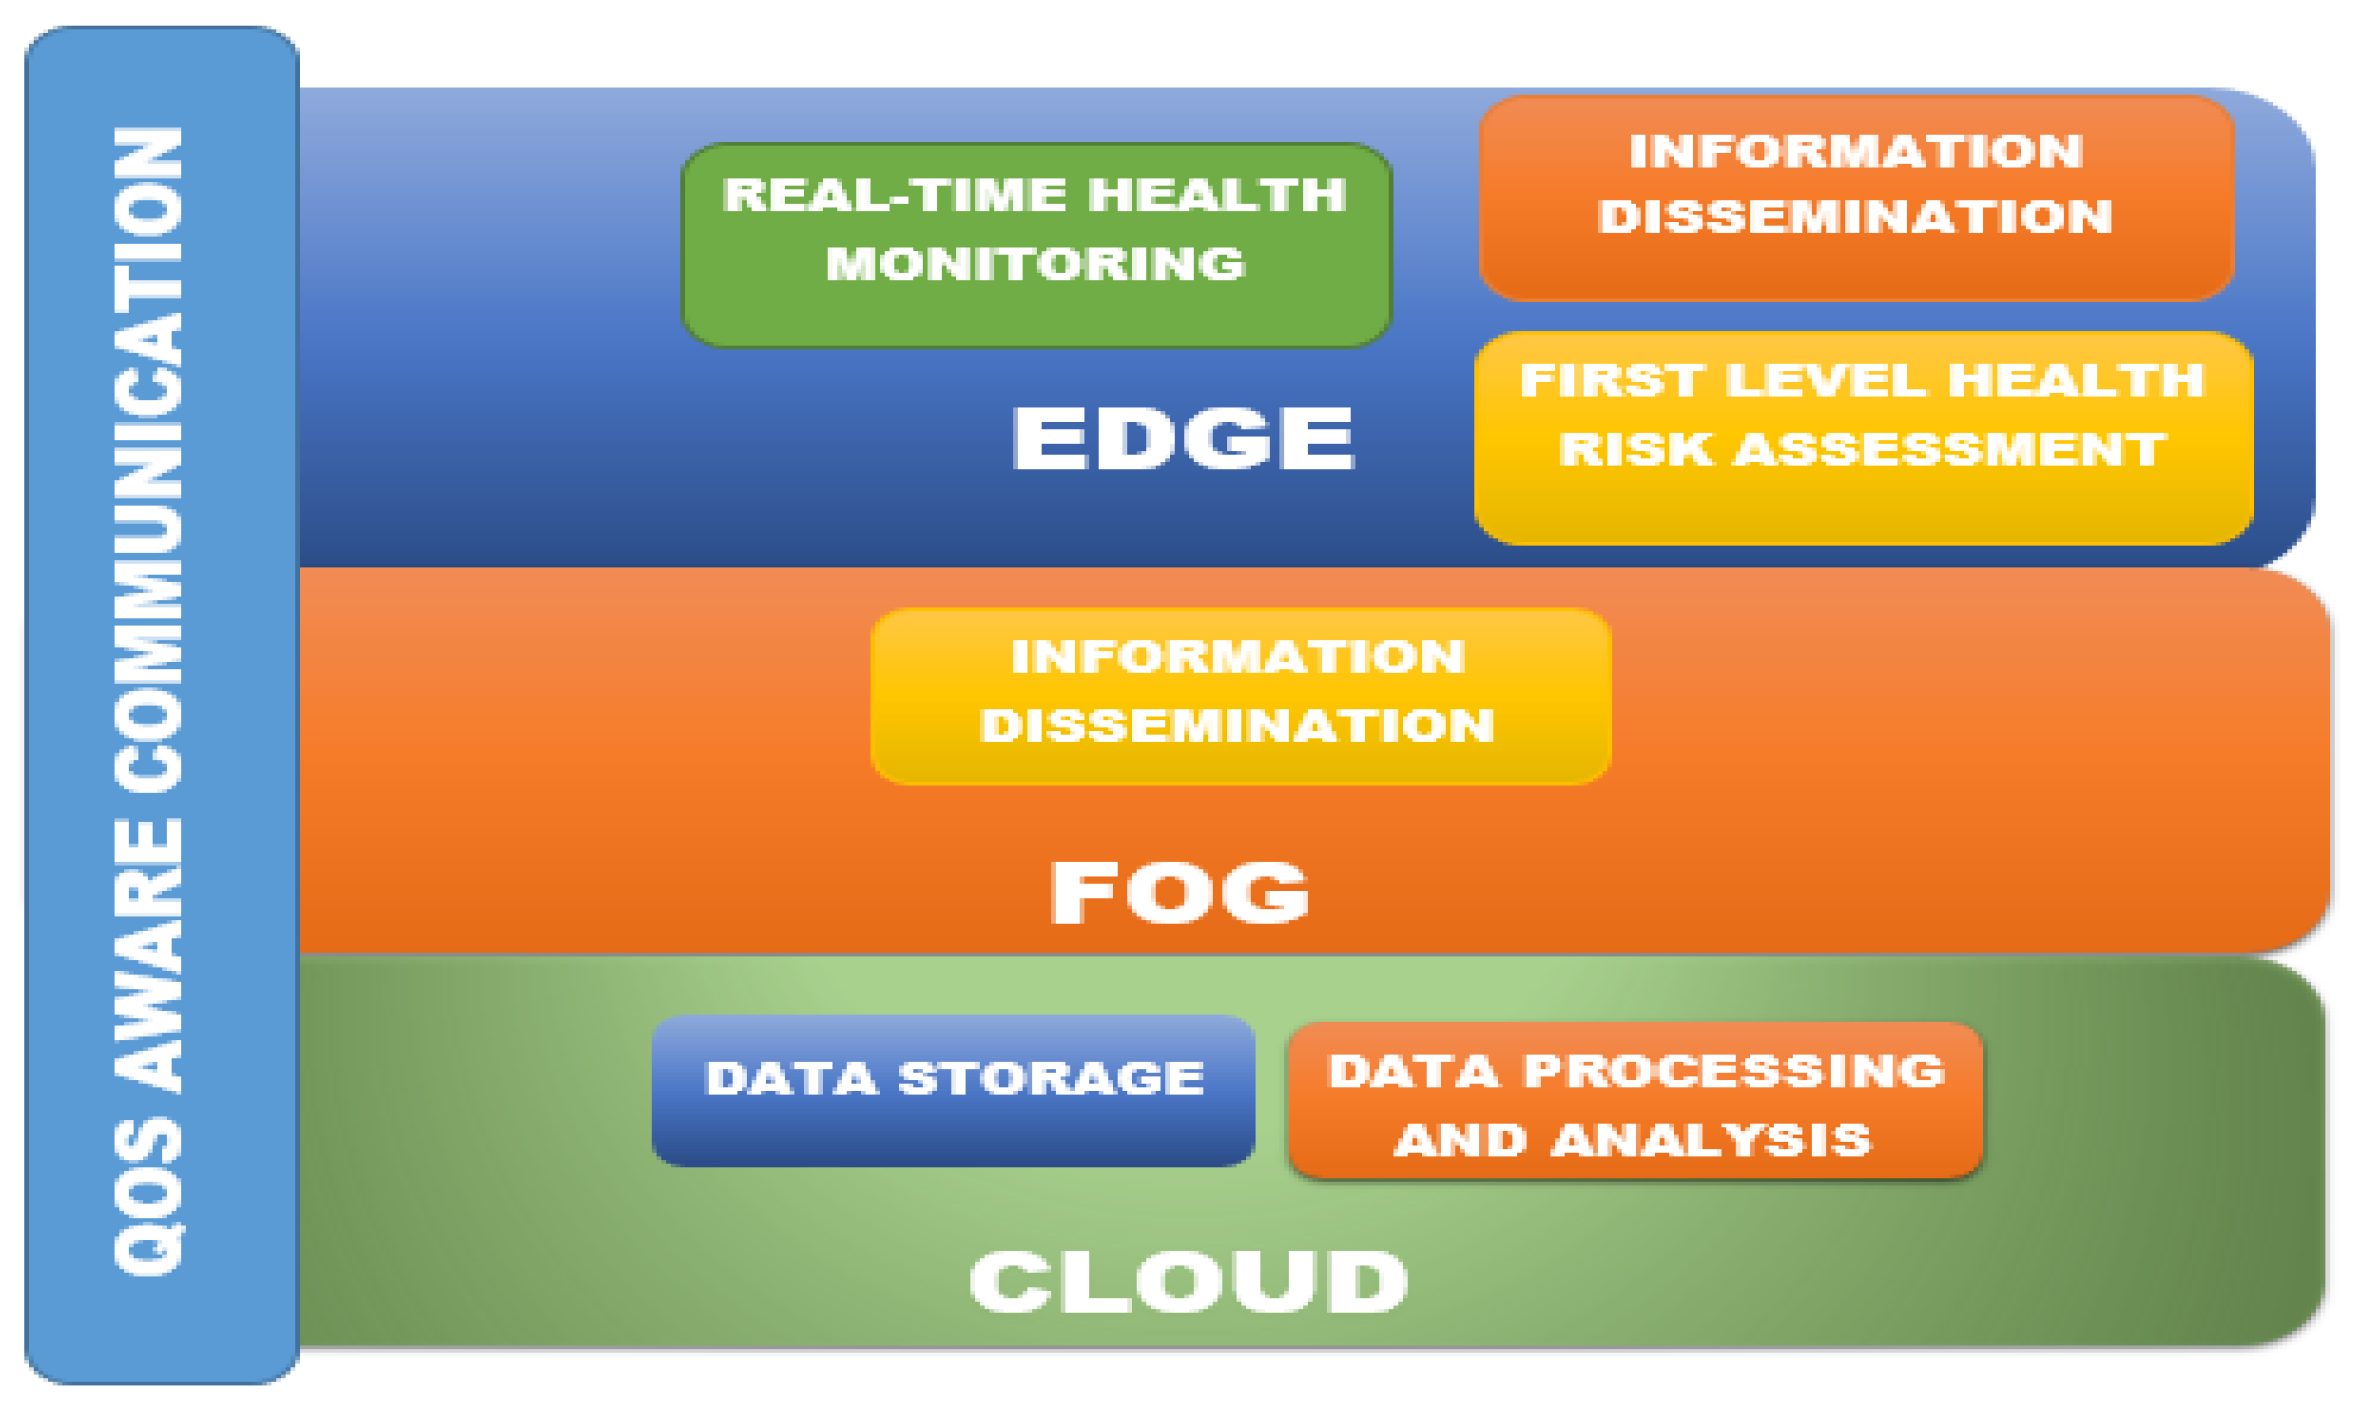
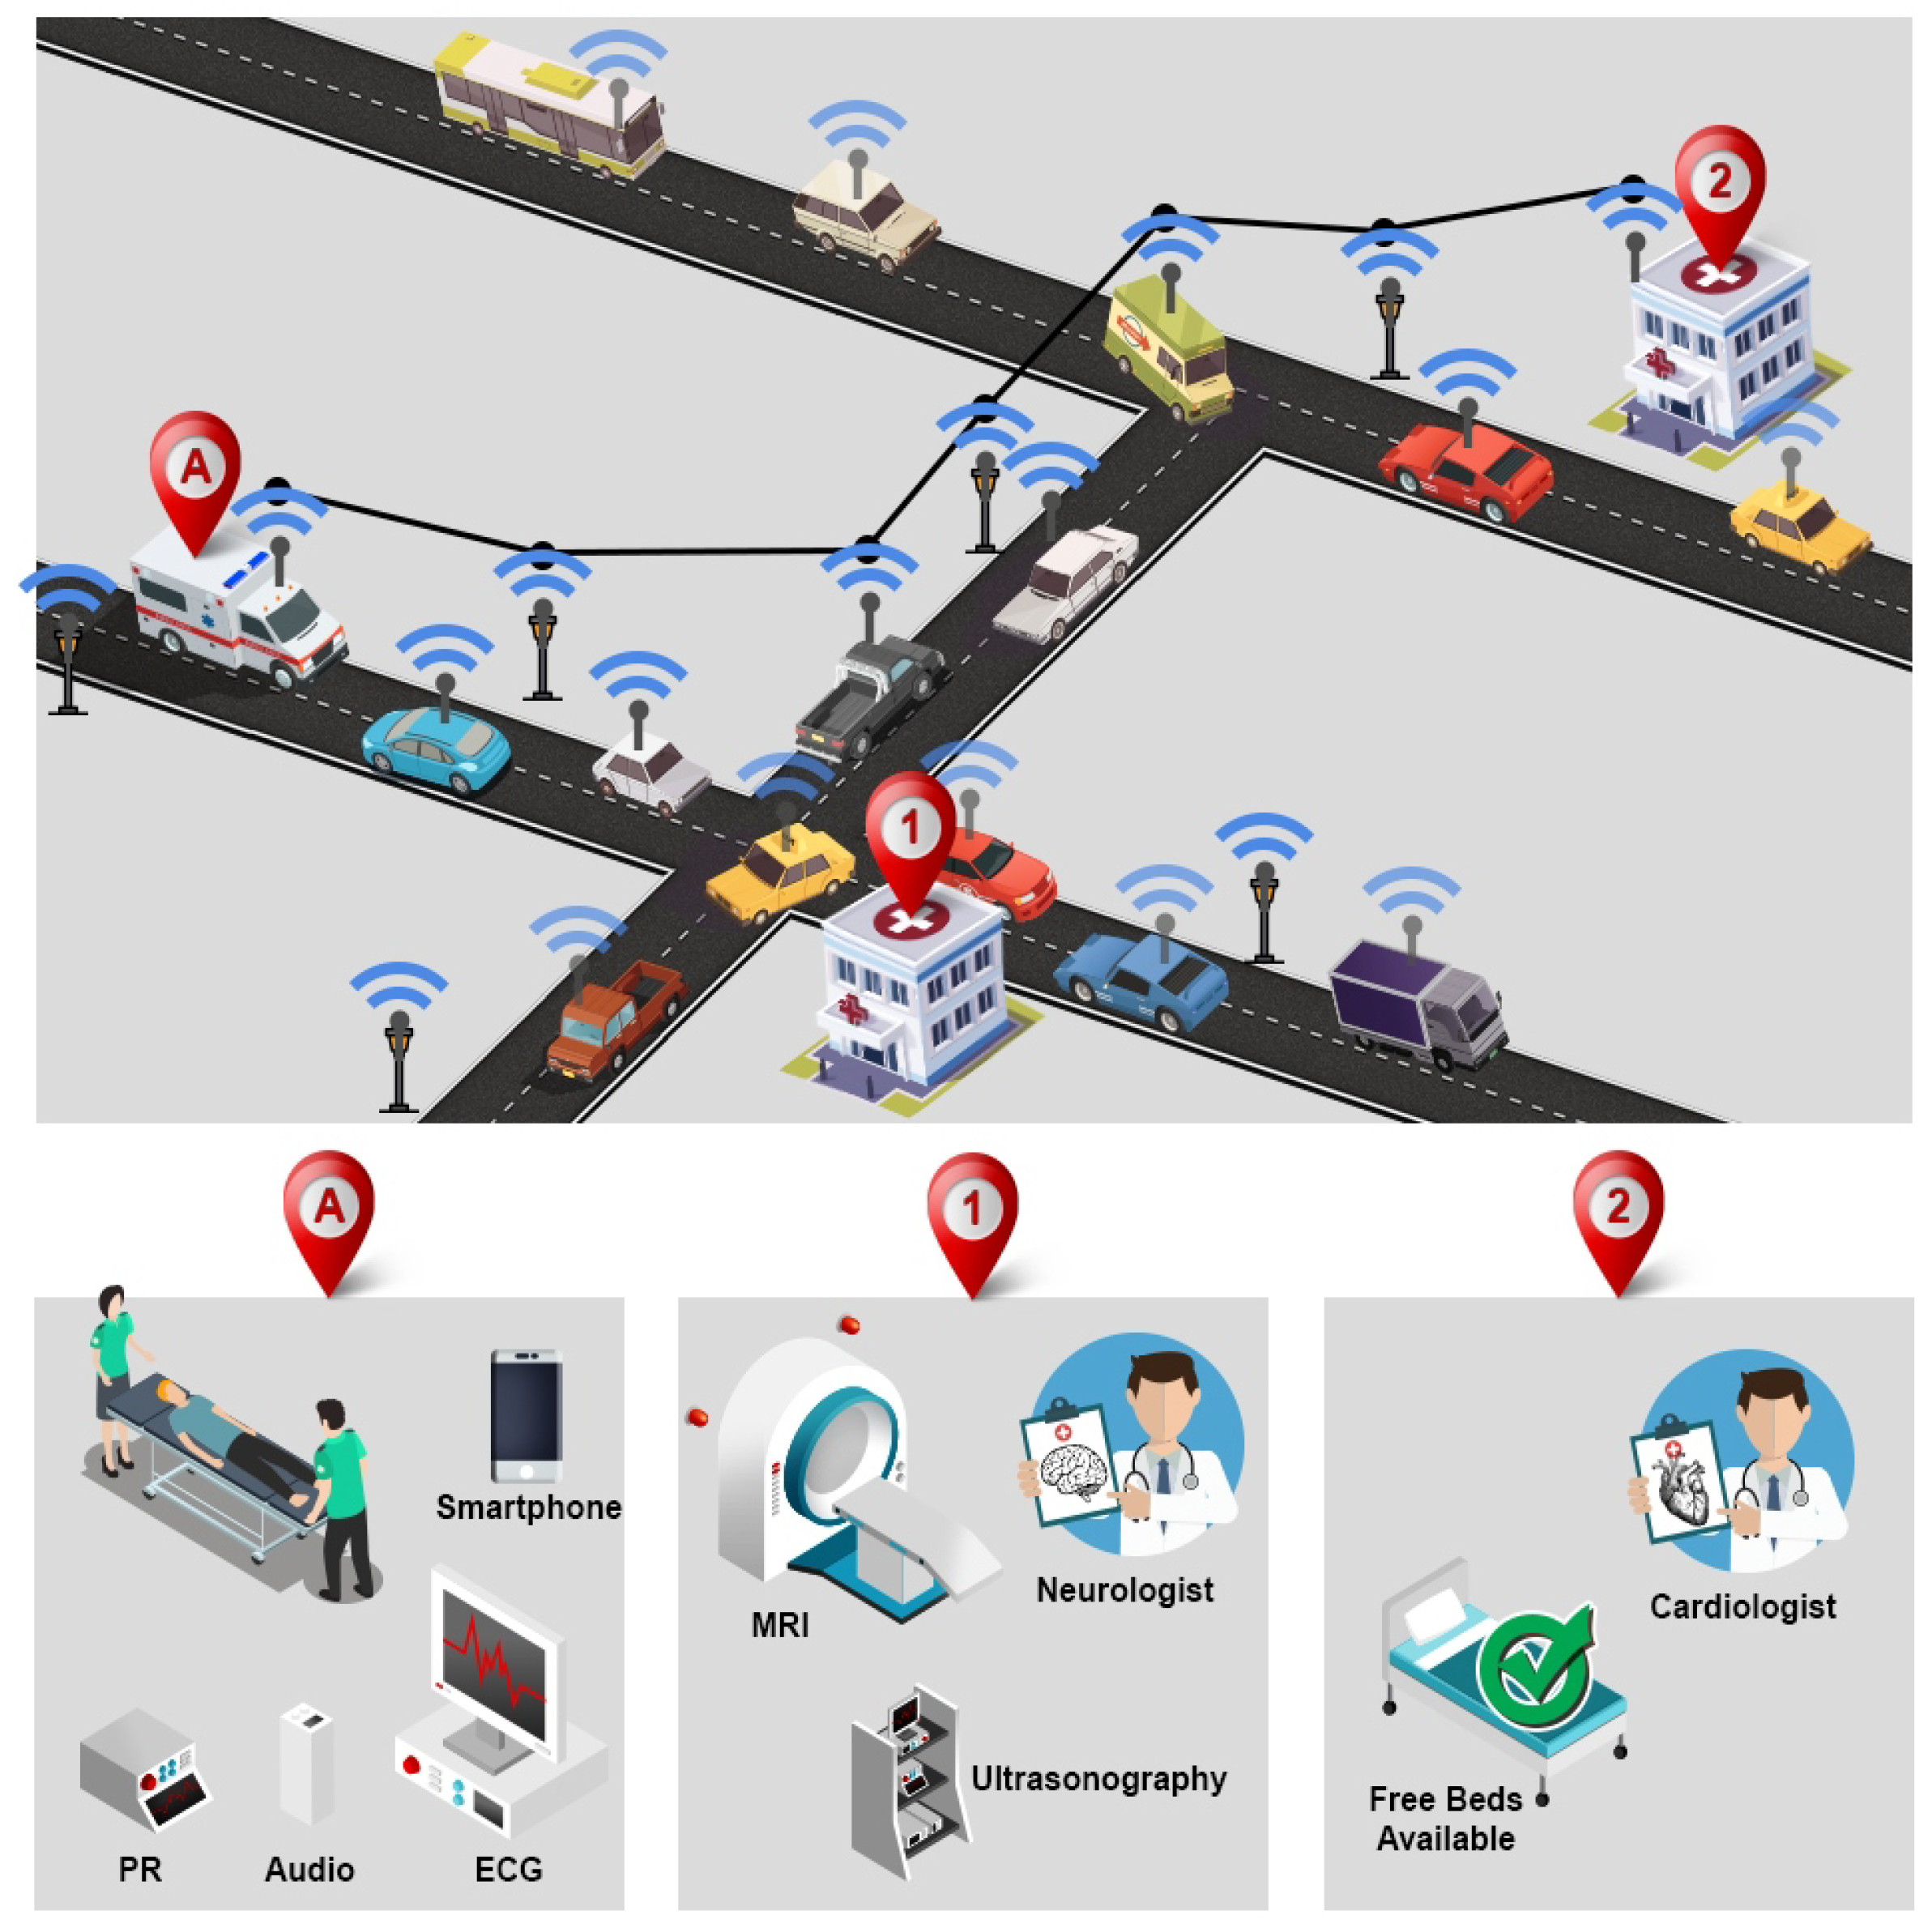
4. IoT-Enabled Traffic-Aware Telemedicine Architecture (ITTA)

The existing mobile telemedicine architectures in the literature have not addressed some of the key challenges faced by mobile telemedicine networks, such as high delay sensitivity, very low tolerance of packet loss, traversal of the vehicle across geographically varied regions, transmission of heterogeneous data with different QoS requirements, and so on [35]. Since the requirements of a telemedicine system are highly stringent, our proposed architecture, ITTA, as represented in Figure 1, integrates the concepts of IoT network architecture with vehicular network architecture.

4.1. IoT-Based Telemedicine Services Framework (ITSF)

The architecture ITTA provides multi-tier IoT services for reliable mobile telemedicine networks in the form of edge, fog, and cloud services. For such service provisioning, we have proposed a multilayer IoT-based Telemedicine Services Framework (ITSF), as shown in Figure 2. Each of these layers is envisioned as a service layer to provide multiple services, which can be assumed to be the sub-components of the respective layers. The real-time health monitoring service enables the continuous monitoring of the vital biosignals of the patients. First-level health risk assessment service takes the data provided by the real-time health monitoring service to yield a better understanding of the patient’s current condition. At the edge layer, the information dissemination service coordinates with the other services to ensure that relevant alerts reach the concerned doctor and the paramedics in real time. The fog layer provides the dissemination of patient-level health risk service, which enables the reception of the first-level health assessment from IM2E and reliably transmits the same to the cloud. The cloud layer provides the services of data storage and data processing with analysis, which aids in the diagnosis of the disease/issue with the patient. Since it is important to deliver emergency patients’ vital biosignals within the QoS requirements of the medical data, all the layers provide QoS-aware communication service.

4.2. Wearable-Device-Based Monitoring Algorithm for Edge Device (WDMA-Edge)

The IM2E node consists of a telemedicine ambulance integrated with healthcare equipment and wearable devices for continuous monitoring of the patients. Such an integrated approach in edge nodes is required for handling COVID-19 pandemic situations [36].
Secondary transfers are intra- or inter-hospital transfers required for the survival of almost all critical cases in the emergency department (ED) and can sometimes lead to adverse risk levels of patients [14,37]. All these clearly indicate risk scoring, real-time monitoring, and risk assessment of emergency patients. Vital parameters such as pulse rate (PR), blood pressure (BP), blood oxygen saturation level (SpO2), breathing rate, and body temperature are some of the most important vital parameters that can reflect patients’ health conditions and risk levels. Many IoT-based systems for health monitoring are proposed in the literature [38]. AI-enabled autonomous devices employ a route source recommendation protocol [39], while blockchain-based solutions integrate lightweight advanced identity management systems [40]. Additionally, traffic congestion is addressed through rule-based management systems for the Internet of Vehicles in smart cities [41].
Therefore, considering the importance of monitoring patients during transit, it has been realized that the health risk level of a patient needs to be quantified on the fly, in order to make better decisions. This has led to the development of various risk-scoring mechanisms over time. A few of the relevant ones are Rapid Emergency Medicine Score (REMS), Revised Trauma Score (RTS), Trauma Score (TS), Acute Physiology and Chronic Health Evaluation (APACHE) II, Simplified Acute Physiology Score (SAPS), and Rapid Acute Physiology Score (RAPS) [42]. However, these risk-scoring mechanisms consider parameters which require a lab environment, which is challenging in an ambulance.
After analyzing the existing scoring mechanisms and integrating the suggestions provided by doctors practicing emergency medicine, a modified scoring mechanism, On Fly Emergency Health Score (OFEHS), has been proposed. The focus of this scoring mechanism is on the analysis of patients during transit from the patient location to the hospital location, keeping in mind the requirement for faster first-level decision making. The scoring chart for the same is provided in Table 1. To monitor the patient’s vital signs and to determine the first-level risk analysis using OFEHS, a wearable-device-based monitoring algorithm for edge device (WDMA-Edge) is proposed, as shown in Algorithm 1. The details of hardware components and devices required for the same, as well as their functioning, have been discussed in [43,44,45].
Algorithm 1 Wearable- device-based monitoring algorithm for edge device (WDMA-Edge)
  1:
Activate sensing module
  2:
Initiate value of time instance i = 1
  3:
Record BP
  4:
switch  s y s t o l i c  do
  5:
    case (>=119 <=123): syscore = 0
  6:
    case ((>=109 <=118)||(>=124 <=129)): syscore = 1
  7:
    case ((>=99 <=108)||(>=130 <=139)): syscore = 2
  8:
    case ((>=79 <=98)||(>=140 <=149)): syscore = 3
  9:
    case ((>=70 <=78)||(>=150 <=159)): syscore = 4
10:
    case ((>=60 <=69)||(>=160 <=169)): syscore = 5
11:
    case ((>=50 <=59)||(>=170)): syscore = 6
12:
switch  d i a s t o l i c  do
13:
    case (>=75 <=79): diascore = 0
14:
    case ((>=70 <=74)|| (>=80 <=89)): diascore = 1
15:
    case ((>=50 <=69)|| (>=90 <=99)): diascore = 2
16:
    case ((>=40 <=49)|| (>=100 <=109)): diascore = 3
17:
    case ((>=30 <=39)|| (>=110 <=119)): diascore = 4
18:
    case ((>=20 <=29)|| (>=120 <=129)): diascore = 5
19:
    case ((<=20)|| (>=130)): diascore = 6
20:
Record BP
21:
if PR > 0 then
22:
    switch  P R  do
23:
        case (>=70 <=99): prscore = 0
24:
        case ((>=100 <=119)|| (>=55 <=69)): prscore = 2
25:
        case ((>=120 <=139)|| (>=40 <=54)): prscore = 3
26:
        case ((>=140 <=159)||(<40)): prscore = 4
27:
        case ((>=160 <=200)): prscore = 5
28:
else
29:
    alert: “Check the equipment status”
30:
end if
31:
Record S p O 2
32:
switch  O x y g e n  do
33:
    case (>=95): oxygen = 0
34:
    case (>=91 <=94): oxygen = 1
35:
    case (>=84 <=90): oxygen = 3
36:
    case (<84): oxygen = 4
37:
syscore = S y s i
38:
diascore = D i a i
39:
prscore = P R i
40:
oxygen = O x y i
41:
i = i + 1
42:
R S t o t i = S y s i + D i a i + P R i + O x y i
43:
Transmit R S t o t i to hospital
44:
Record the next set of values: GOTO step 3
45:
R S t o t = i = 1 j R S t o t i
46:
R S t o t ¯ = R S t o t j

4.3. Algorithm

Table 2 provides the list of notations used in the Algorithm 1. The patient’s risk score in the ambulance is recorded at every instance of time and the mean risk score of all the instances is transmitted to the hospital where the ambulance is headed. The risk scores are judged by the hospital as (a) 0–1 is low risk, (b) 2–4 is medium risk, and (c) 5 and above is high risk.

4.4. Adaptive QoS-Aware Packet Transmission for Fog (AQPT-Fog)

In mobile telemedicine systems, prime importance is given to delivering emergency patients’ vital biosignals within the QoS requirements of the medical data. Based on the detailed study and interviews with doctors and technicians from multiple hospitals QoS requirements as shown in Table 3 [46,47] have been framed. The vital signs such as BP, PR and ECG, along with voice, which are important in the case of COVID-affected patients, have been considered. For each of these data types, packet data rate, end-to-end latency and packet loss ratio are considered as major QoS parameters.
Algorithm 2, AQPT-Fog, was established with respect to the bit error rate in the transmission of the packets. Each packet is inspected for the data flow rate and the error that occurs during transmission. A denotes the received power and I approximates the fading effect of each transmission channel. The power required to transmit each packet is given by C. Each data instance is denoted by i. A i j , C j denotes the received signal strength. To approximate the data transmission in a channel, the total received signal strength is estimated per transmission channel.
V A i j I i j C j = A i j C j
Algorithm 2 Adaptive QoS-Aware Packet Transmission for fog (AQPT-Fog)
     Input: data, route, link
     Output: packet
  • d a t a g e t d a t a f r o m I M 2 E n o d e
  • hospital selection function(data):
  • p a c k e t p a c k e t s i z e d a t a ( d a t a )
  • if network is not available then
  •      w a i t
  • else
  •     transmit packet(packet)
  • end if
  • check qos parameters()
  • r o u t e s e l e c t r o u t e r 1 , r 2 , , r m
  • l i n k s e l e c t l i n k l 1 , l 2 , , l n
  • if v2i is not available then
  •     if v2v is not available then
  •         go back to l i n k s e l e c t l i n k l 1 , l 2 , , l n
  •     else
  •          p r o t o c o l c h o o s e r o u t i n g p r o t o c o l ( r o u t e )
  •         transmit packet(packet)
  •     end if
  • end if
  • if destination reached then
  •     Stop
  • else
  •     go back to l i n k s e l e c t l i n k l 1 , l 2 , , l n
  • end if
Once the packet is analyzed, the signal-to-noise interference ratio is measured using the formula in Equation (2), where N denotes the maximum nodes in the topology of the selected path. S I R i is directly proportional to the signal strength and inversely proportional to the total data loss.
S I R i = C i A i i j i N C j A i j + n i
The increase in the probability of the data rate P is shown in Equation (3). The system throughput T always relies on the signal strength of each instance and the noise measure in each path. The noise measure is one of the factors deciding the data path that needs to be taken or not. S denotes the path selection parameter, which assists in finalizing which data path needs to be adopted.
Equation (5) denotes the total path metric with respect to the probability of that particular path. The fading of that path is given in Equation (6). The mean signal-to-interference and noise ratio (MSINR) is the accumulated path jitter that is generated in the ad hoc network and needs to be reduced.
T i = P S I R i S I R t h = P A i j I i j C j S I R t h k i A i k I i k C k
T i = 1 k i 1 1 + S I R t h A i k C k A i i C i
S = 1 + 1.5 l n 5 B E R T S I R
F i = 1 / T l o g 2 i 1 + M S I R i
To ensure QoS during data transmission of vital signals, we have proposed an algorithm called Adaptive QoS-aware Packet Transmission for fog (AQPT-Fog), which, as shown in Algorithm 2, has packet formation and packet transmission modules. The packet formation module includes retrieval of aggregated data from the the IM2E node followed by packetization of the aggregated data. The hospital selection function runs a resource-aware algorithm and retrieves an appropriate hospital destination. For AQPT-Fog we are assuming that the destination hospital is received as output from this module. After this, the packet formation takes place, following the reception of both data from the IM2E node and the hospital selection function. Once a packet is formed, AQPT-Fog checks for network availability to transmit packets.
After packet transmission from the IM2E node, adaptive QoS-aware packet traversal ensues. First, the QoS parameters based on Table 3 are checked, followed by route selection from ‘n’ routes and subsequent selection of links based on the road divisions (urban, suburban, or rural). The algorithm first checks for the availability of the vehicle-to-infrastructure (V2I) mode of transmission. If it is not available, then it checks for vehicle-to-vehicle (V2V) mode. After deciding for V2I or V2V, it selects an appropriate routing protocol from an existing pool, thereby transmitting through the selected route until it reaches the destination hospital. QoS based on the network availability and dynamic link selection is thus ensured.
A comprehensive comparison of various existing telemedicine architectures is performed and the results are tabulated in Table 4. Parameters such as the following have been considered to compare existing telemedicine architectures ([29,30,31,48,49,50,51,52]) in the literature:
  • Location-based services (LBS): GPS-based tracking and navigation assistance for ambulances can be of immense assistance to both ambulance operators as well as healthcare practitioners.
  • Real-time health monitoring: Monitoring the dynamically changing health parameters of the patients being transported is necessary since the risk level of the patient will vary with the change in the level of vital parameters.
  • Multi-level health risk assessments: Just as monitoring the vital parameters is important, it is equally important to ensure that the criticality or risk level of the patient is monitored.
  • Data transmission from mobile ambulance: After measuring the level of vital parameters, it is necessary to transmit the same to the doctor at the remote hospital.
  • QoS: While transmitting the data to the remote hospital, it is important to ensure that requisite QoS parameters are considered. Healthcare data, being very critical in nature, have stringent QoS parameters.
  • Availability of V2V/V2I communication: During the data communication, as VANETs are considered in the current work, we verify what type of network topology is possible/available in the respective road link.
  • Adaptive routing: Based on the type of network topology found on the road link, the routing protocol is selected dynamically.
  • Cloud storage or processing: All the data need to be transmitted to the doctor in the remote hospital. However, since the doctor is not present on the same network, cloud storage is required as an intermediary. The processing of the criticality analysis is also performed on the cloud.
  • Medical scoring for patients during transit: Categorizing the risk level of the patients cannot happen randomly and requires a methodical analysis. The same is also required for triaging of the patient.
Table 4. Comparison of existing telemedicine architectures with ITTA.
Research WorksLBSABCQoSV2V/ V2IDEF
[29]
[48]
[49]
[50]
[30]
[31]
[51]
[52]
ITTA
A Real-time health monitoring; B Multi-level health risk assessment; C Data transmission from mobile ambulance; D Adaptive routing; E Cloud storage/processing; F Medical scoring for patients in transit.

5. Simulation Study for Edge-to-Fog Communication Service Analysis

5.1. Simulation Scenarios

Two major scenarios in which V2V is utilized for data dissemination from mobile medical edges through mobile vehicles or stationary relay nodes are considered for this feasibility study/analysis. The simulation parameters used for designing the experimental setup and the scenarios are mentioned in Table 5.
Scenario 1—Edge Node Peer-to-Peer Communication (V2V): Here, the density of the vehicles is varied on a spatio-temporal basis based on the chosen time slots and the expected region of the traversal, as presented in Table 6. In this scenario, IM2E transmits data via vehicular ad hoc network based on the density of vehicles. Scenario 1 is represented in Figure 3.
Scenario 2—Ad Hoc Networking with Vehicles and Stationary Relay Nodes (V2I): Here, to compensate for the non-availability of the required density of vehicles in specific regions, additional stationary relay nodes are provided in specific regions, along with vehicles in the road stretch. The densities of these nodes are varied on a spatio-temporal basis based on the time slot and the expected region of the traversal, as represented in Table 6. Scenario 2 is represented in Figure 4.
A new approach of machine learning modelling for establishing the communication through VANETs is presented [53]. The communication system architecture considered for this simulation caters to both of the above-mentioned scenarios. The simulation gives the provision to choose sender, receiver, intermediate nodes and their communication technology. Ambulances are chosen as the sender for this simulation study along with a VANET-based telemedicine architecture, with IEEE 802.11 as the radio access technology (RAT) [54,55,56]. The mobile ambulances are simulated to traverse through different types of traffic scenarios experienced in rural, suburban, and urban areas, totalling a 6km road stretch. The key parameters chosen for the simulation are shown in Table 5.

5.2. Experimental Design and Performance Analysis

To derive the dynamic variability in vehicular density, a field survey was conducted for a stretch of 15 km highway road network in Mysore, India. The road stretch was chosen to provide the insights of traffic experiences in rural, suburban, and urban areas. The survey was performed at multiple selected locations across the road network. The total number of vehicles traversing through those locations for a specific time period, a period of several days, was collected. Based on the survey, a unique set of seven temporal durations and the corresponding vehicular density for a two-kilometer road stretch for different regions were derived. These details, presented in Table 6, are used for the simulation experimentation. Nevertheless, the architectures, frameworks, and algorithms suggested in the manuscript are relevant across a wide range of geographical regions.
In the simulation, the vehicles are modelled to move at different velocities [57,58] in different regions, such as 60 kmph in rural regions, 40 kmph in suburban regions, and 20 kmph in urban regions, based on the field survey. The ambulance was simulated to move at a velocity of 80 kmph, since an emergency vehicle is allowed to traverse at higher velocities. The geographical area considered for this simulation is mapped and edited using JOSM and SUMO for generating the node mobility. The VEINS simulator was used for building the simulations.
The simulation parameters used have been provided in Table 5. The number of stationary nodes has been varied, compensating for low vehicular-density.

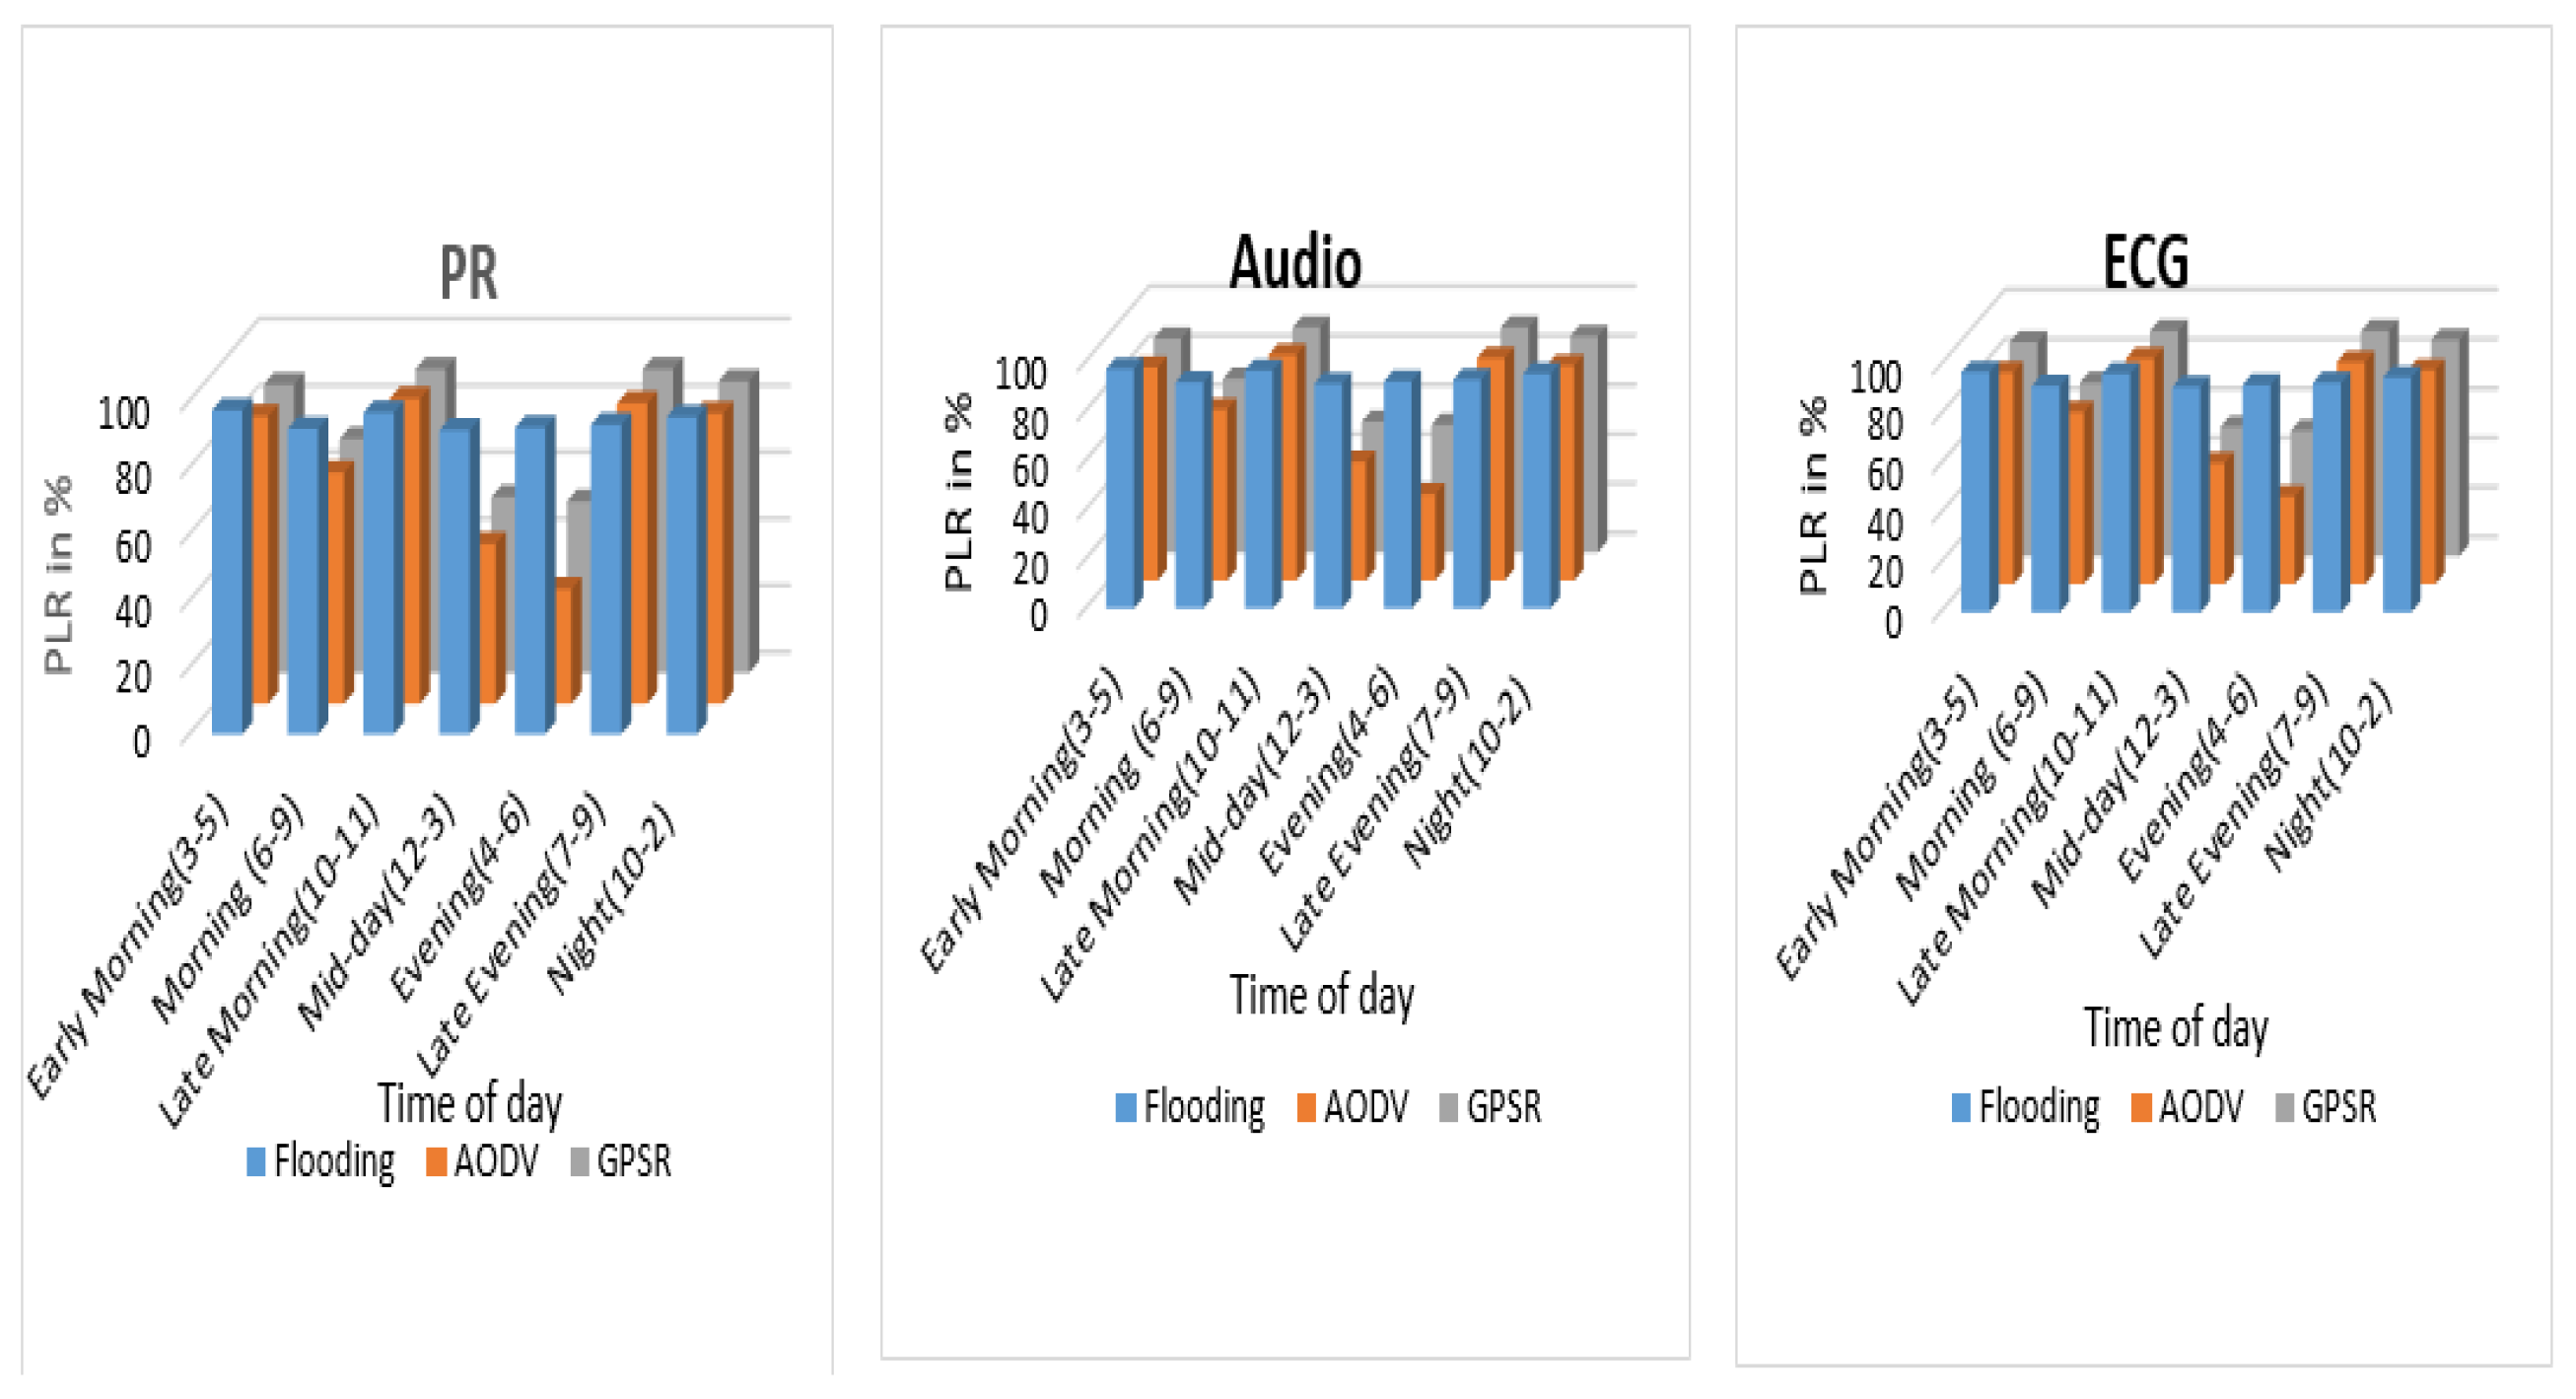
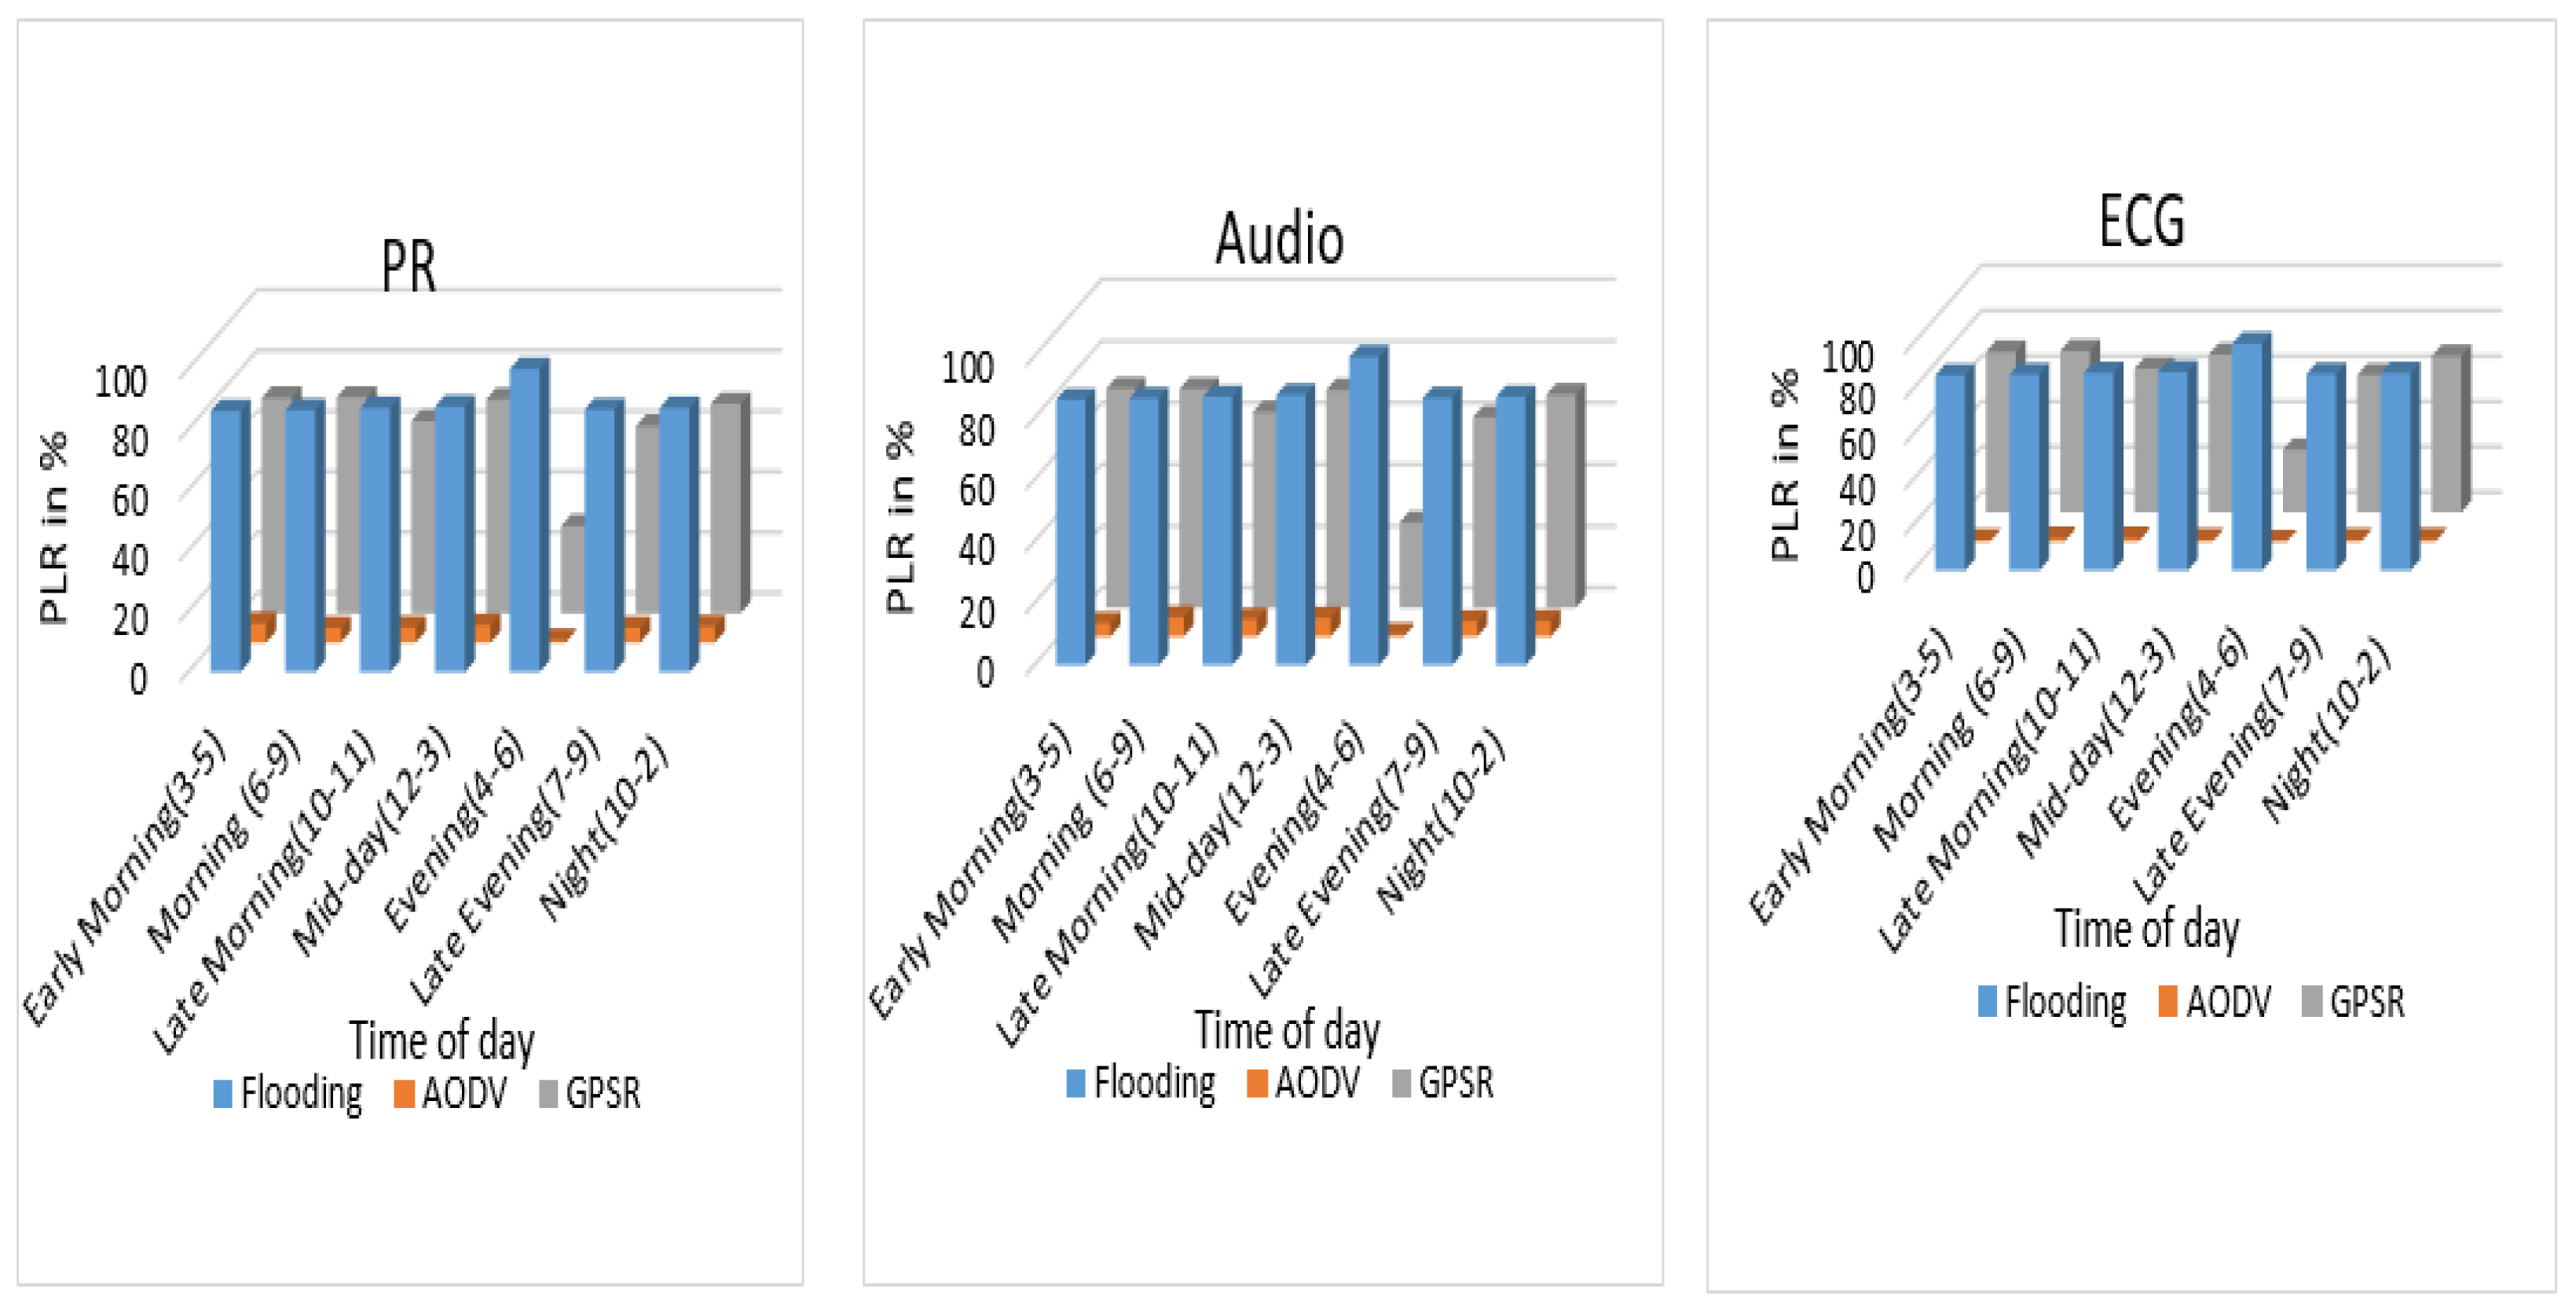
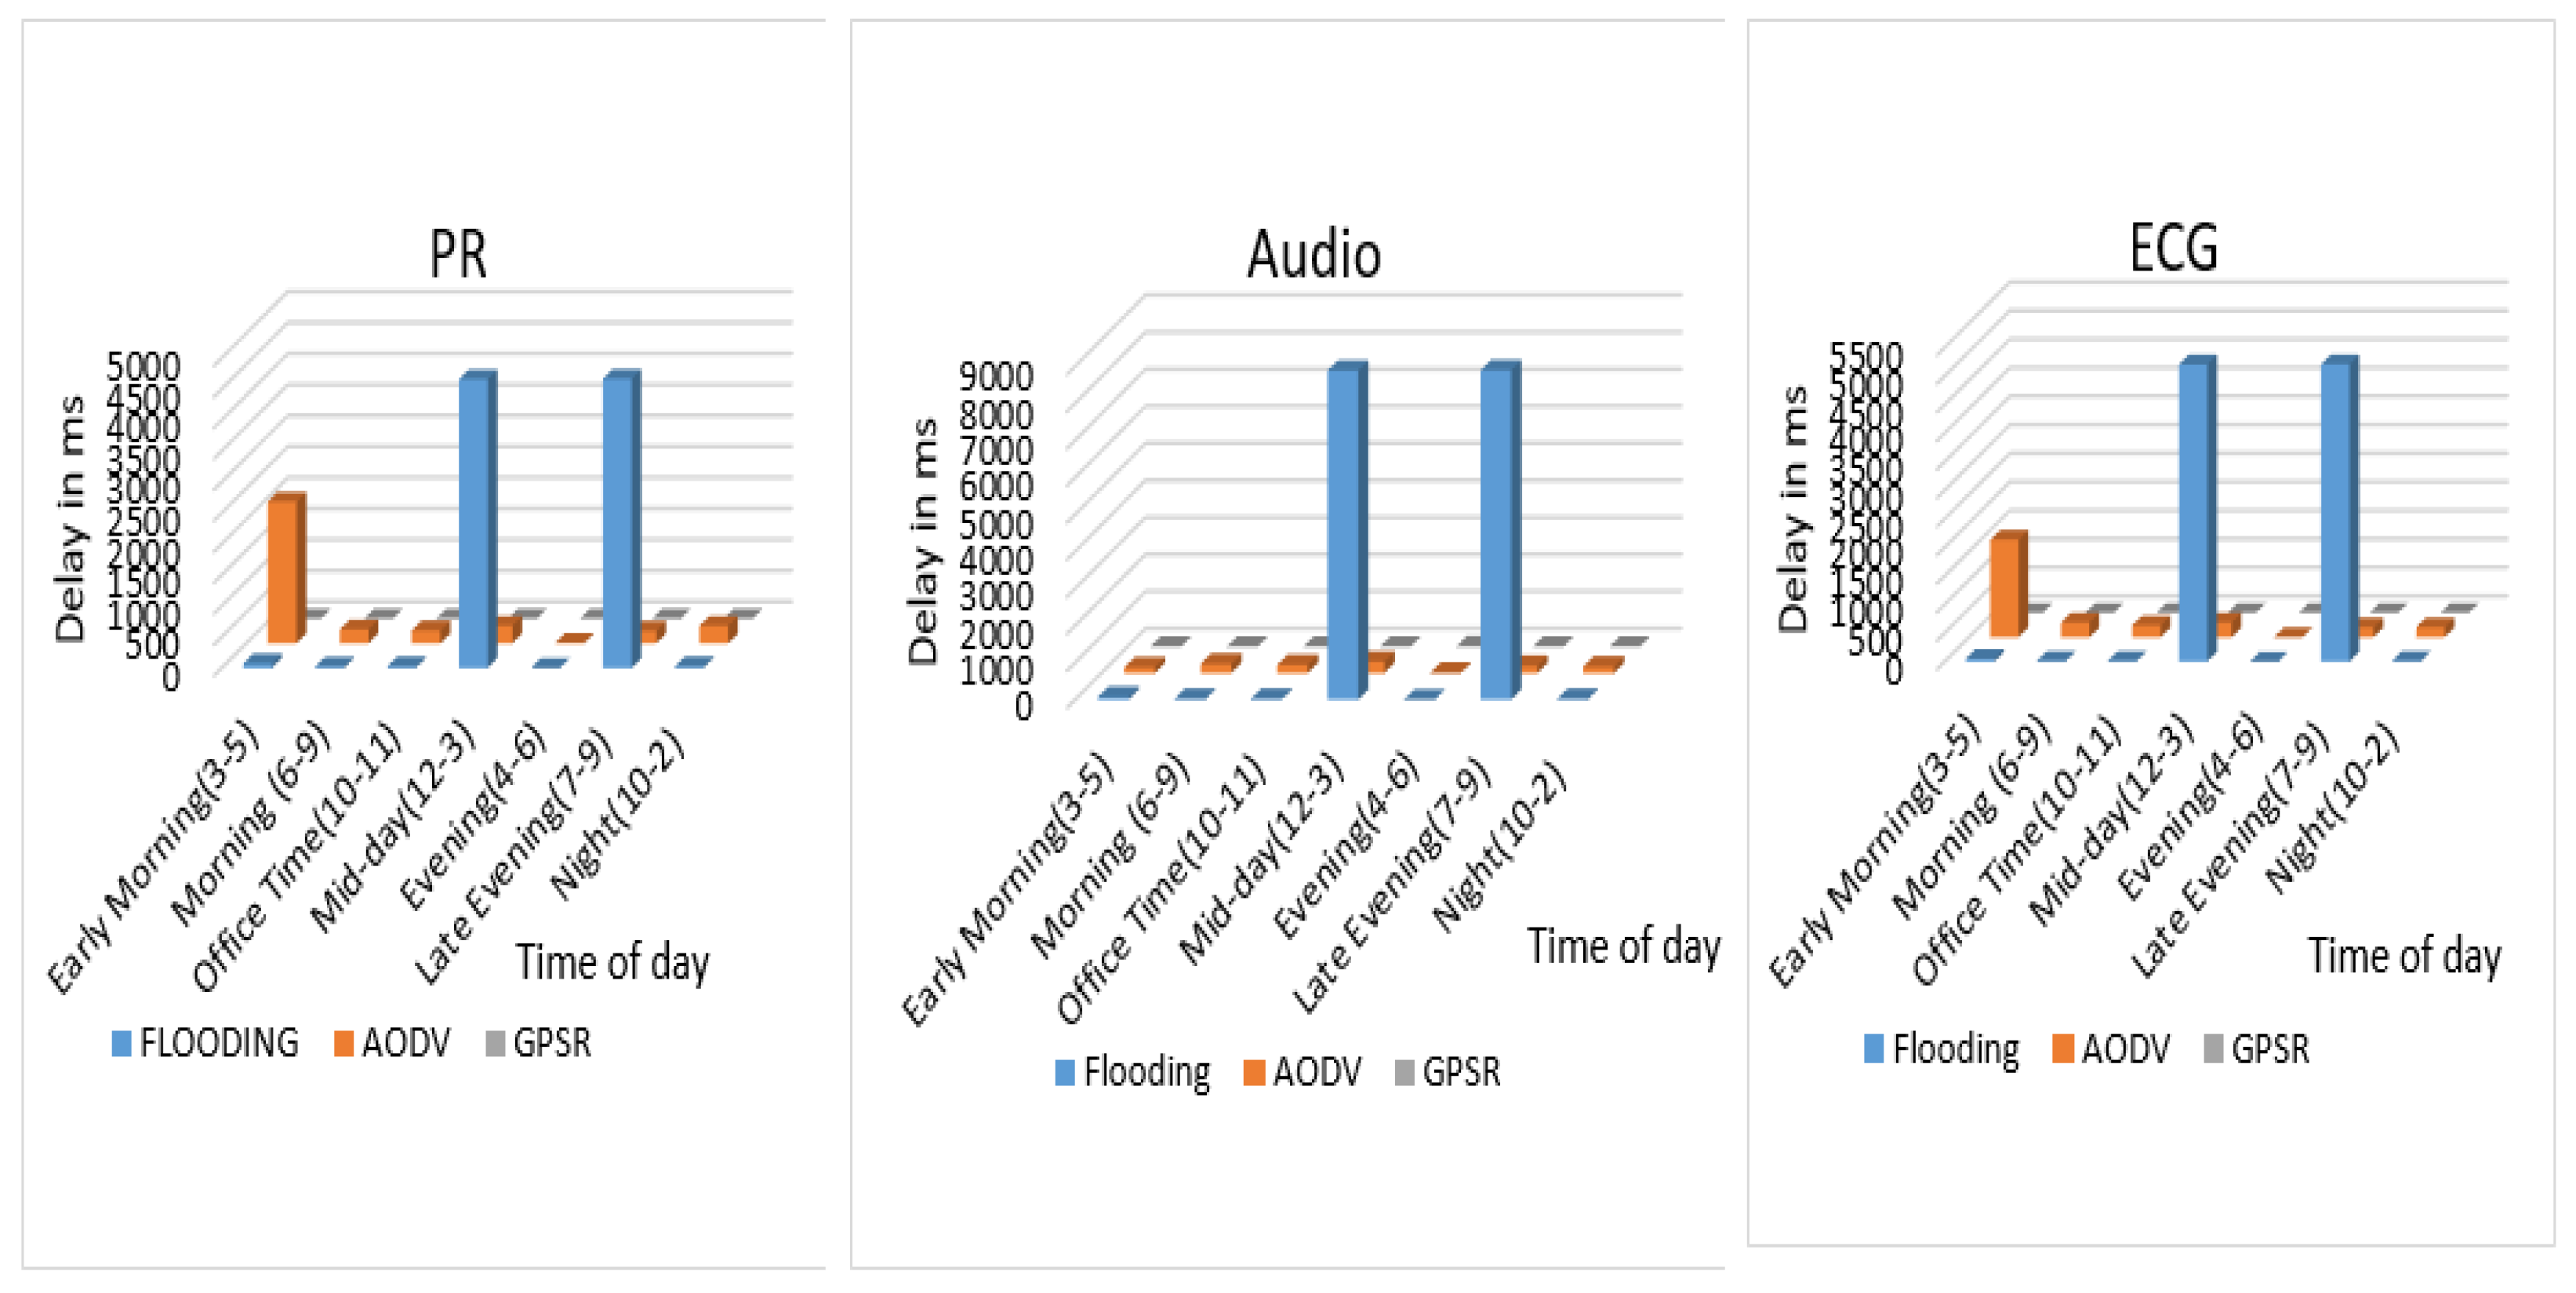
5.2.1. Performance Analysis of Healthcare VANET

Based on the simulations that were performed according to the experimental design discussed above, the results were recorded and graphical representations of the same are shown in the following sub-sections given below.
Scenario 1Variability of Packet Loss Ratio with respect to different routing protocols and message types.
The detailed simulation results have shown that the packet loss rate (PLR) is highest for the classic routing protocol—flooding. It does not demonstrate an impact of variability in PLR with respect to time slots or density of vehicles, nor with respect to the geographic divisions, whereas the other two routing protocols, that is, ad hoc on-demand distance vector (AODV) and greedy perimeter stateless routing (GPSR), show variability in PLR with respect to time slots or density of vehicles, and with respect to the geographic divisions.
In Scenario 1, it can be observed in Table 7 and Figure 5 that as density increases, the PLR decreases in the case of AODV. When flooding is used, it is seen that the PLR is always higher than 90%. In the case of GPSR, we observe that the performance is similar to AODV. It is clear that the PLR is always high and greater than 80% on average for all the routing protocols. The reason for this is that even though the nodes are high in density during certain time slots, the ambulance moves at a rate up to 4 times faster compared to the other nodes (which is also true in reality). Owing to this, the ambulance is unable to stay connected to a single node for a sufficiently long period of time in order to result in a proper route. Hence, for every routing mechanism, an efficient transmission of data is below the expected quality. When viewed from the angle of vehicular density, we observe that during mid-day and evening, when the density is highest, at 664 and 726, the performance of AODV and GPSR improves a lot, with AODV being comparatively lower, as shown in Table 7. A similar behavior is also seen in the case of flooding.
When viewed from the perspective of data type, our experiments demonstrate that in the case of PR, AODV faces much lower loss compared to GPSR during late evening as well as night. Ironically, when the density is lowest (104 vehicles), during early morning, the loss increases again. Such a pattern is not observed for other data types, where lower loss is seen only during high vehicular density. The reason for this may be the difference in the traffic model. PR traffic has a packet size of 250 bytes per sec, whereas audio has 500 bytes per sec and ECG has 3000 bytes per sec (300 bytes every 0.1 s). These experiments demonstrate that for lesser packet size, AODV performs better than GPSR, provided that the inter-packet interval is less than a second.
Scenario 1: Variability of delay with respect to different routing protocols and message types.
Considering the delay experienced in Scenario 1, we observe that GPSR gives the best performance throughout the day, except during late evening when, ironically, all the other routing mechanisms provide a much better performance compared to GPSR. During late evening, GPSR results in higher delay for PR and ECG. The delay with AODV is also within acceptable limits, as per the QoS requirements in Table 3, except during evening, when it becomes very high for ECG. This might be due to the fact that even though the size of the ECG packet is 300 bytes, the frequency of transmission is very high. As can be seen from Table 8 and Figure 6, on average, GPSR gives the lowest delay in this scenario amongst the three routing mechanisms. From the perspective of node density, it can be noted that AODV does not perform well in the case of higher densities, such as 664 (mid-day) and 726 (evening). The reason for this might be the high network overhead created due to control messages when a very high number of nodes are present. Flooding shows the worst performance on average and GPSR shows a consistently low delay, except during late evening, when the delay is seen to increase by 500 times, as seen in Table 8, Table 9 and Table 10. From the perspective of data type, flooding always shows a spike in the delay (more than 500 times) during morning and mid-day, when the vehicular density is on the higher side (517 and 664). At the same time, for the highest density of 726 during evening, flooding does not record much difference in performance, whereas AODV does show an increase. In the case of ECG, this increase is 15 times more than audio and 577 times more than PR. In fact, in the case of ECG, AODV shows an increase in delay 40% of the time compared to the other data types. This happens most when the density is either very low (104) or very high (726). The reason for this increase is the high frequency of sending ECG data.
Scenario 2: Variability of packet loss ratio with respect to different routing protocols and message types.
In this scenario, AODV provides very good results throughout and the packet loss using the protocol is extremely low and almost non-existent. Especially in the case of ECG, the loss ratio is very low, recording a maximum of 1% in most cases. Figure 7 shows the PLR throughout the whole day in the case of Scenario 2. Based on Figure 7 and Table 9, it is clear that when the vehicular density is very high, during evening (726), the PLR faced by AODV is the lowest. GPSR also shows an improvement in the PLR during this time of the day. In fact, except for evening, GPSR faces very high packet loss during all other times. It is observed that the placement of stationary nodes in the scenario has immensely helped in improving the PLR.
From the perspective of data type, if the inter-packet interval is low and packet size is low, then the PLR is also low. PR packets have a lower size compared to ECG (250 and 300 bytes). However, the PLR of ECG is much lower, since the interval is one-tenth of PR when AODV is used.
Scenario 2: Variability of delay with respect to different routing protocols and message types.
Here, GPSR provides a better performance compared to the other mechanisms. However, AODV’s performance is also well within the limit required for maintaining acceptable QoS, except during early morning. During early morning, the delay increases to 2.2 s, which is more than twice the accepted limit. If the other times of the day are considered, then AODV is noticed to be a good performer.
From the delay results, a pattern is observed in AODV, which corresponds with the vehicular density. It might seem that AODV fares well in conditions of higher density. Figure 8 shows the delay throughout the whole day in the case of Scenario 2 and Table 10 shows a detailed view of delay in this scenario. ECG shows a lower delay 66% of the time compared to PR and audio.

5.2.2. Summary of Performance Analysis of Healthcare VANET

Table 7, Table 8, Table 9 and Table 10 show the time slot-based results recorded during the simulations. The PLR and delay observed during both scenarios are shown. As discussed earlier, AODV presents a much better PLR during Scenario 2, where additional nodes are present on the road in the form of stationary nodes. The presence of these stationary nodes handles the challenges due to insufficient density of vehicles in many areas. While this helps in improving the PLR, the delay is affected negatively. However, it may be noted that the delay when using AODV is well within the required QoS limit of 1 s (1000 ms), except during the early morning period. Some of our key observations related to PLR and delay in the two scenarios are as follows:
Scenario 1 (V2V) PLR: None of the routing mechanisms provide a satisfactory result. This may be attributed to the fact that the ambulance moves at a higher speed, and since vehicles move in both directions, a satisfactory route is not found by the ambulance every time.
DELAY: GPSR and AODV give a much better performance compared to flooding. In fact, the performance of GPSR is consistently very good, except during late evening. The delay faced by flooding is at least 50–60 times higher than GPSR throughout the day. AODV also shows around 10 times lower delay than flooding on average.
Scenario 2 (V2I) PLR: The performance of AODV is found to be much closer to the acceptance limits compared to that of the other two routing mechanisms studied.
DELAY: The delay observed with GPSR is 200 times lower compared to AODV. The results observed with AODV are as per the QoS requirement, with GPSR performing better. AODV has consistency in its performance and may be considered if stationary nodes are present as compensation to the mobile nodes.

5.2.3. Performance Analysis of AQPT-Fog

The risk score of 10 patients was calculated by considering their vital signs and OFEHS. The same is presented in Table 11. The biosignal data considered for the experimentation were derived from the open datasets available at [59,60,61]. Four different routes were considered, with multiple links each. As shown in Table 12, each link is assumed to have a communication facility of V2V or V2I or both. Based on the simulation results achieved earlier, the routing protocol used varies dynamically for each link. Table 13 is obtained as a result of the experimentation performed based on input from Table 11 and Table 12.
From the results, it is visible that the mechanisms, such as AQPT-Fog, function satisfactorily, with an acceptable level of efficiency (100%).

6. Conclusions

In this paper, we have presented a novel multi-layered architecture for telemedicine networks, ITTA. The objective of this research work has been to design a system that is capable of transmitting the biosignals of critical COVID patients in real time based on the QoS requirement and also by the optimal selection of routes to the destination hospital. WDMA-Edge, which includes a risk scoring mechanism, OFEHS, for aiding ambulance operators in monitoring the criticality level of patients in the ambulance, has been presented in this work. To ensure QoS and reliability of vital data transmission, we have presented and evaluated an algorithm, AQPT-Fog. Performance analysis of the same is performed by considering data from multiple patients and road link data of multiple routes. Along with these, we have also performed a simulation-based study of multiple routing algorithms for gauging the feasibility of applying them during the transmission of vital biosignals from ambulances. For this simulation, we have considered a real case study of Mysuru City, India. Based on the observations of PLR and delay in the two different scenarios of the simulation, we may conclude that AODV is the better-suited routing protocol out of the ones compared.
However, a network involving only vehicles is not the correct approach for the transmission of data in highway roads and needs a deployment of stationary units. Alternative communication technologies such as 4G, 5G, WiMAX, LoRa, etc., have not been explored in our work and can be performed in the future. The proposed methods will be used in future ad hoc networks and the communication can be established with the basic mobile networks with the highest latency and the system throughput. The framework proposed can be pivoted to ensure the effectiveness of tele-assistance in a pandemic situation. All experimentation performed in this manuscript is based on simulation study, and future work with real-time implementation can be thought of to observe issues that may be faced in the real world.

Author Contributions

Conceptualization, A.M. and M.V.R.; methodology, A.M., A.R.D. and M.V.R.; software, A.M.; validation, A.M. and A.R.D.; formal analysis, A.M. and A.R.D.; investigation, A.M., A.R.D. and M.V.R.; resources, M.V.R. and V.P.R.; data curation, A.M. and A.R.D.; writing—original draft preparation, A.M.; writing—review and editing, A.R.D., M.V.R. and V.P.R.; visualization, A.M., A.R.D. and M.V.R.; supervision, M.V.R. and V.P.R. All authors have read and agreed to the published version of the manuscript.

Funding

This research work has no external funding.

Data Availability Statement

The data presented in this study are available on request from the corresponding author. The data are not publicly available due to privacy or ethical restrictions.

Acknowledgments

We would like to pay our gratitude to our Chancellor, Sri. Mata Amritanandamayi Devi, who is the guiding light and inspiration behind all our works towards societal benefit. This work would not have been possible without the infrastructure and support provided by the Discovery Labs, Department of Computer Science, Amrita Vishwa Vidyapeetham, Mysuru Campus.

Conflicts of Interest

The authors declare no conflicts of interest.

Abbreviations

The following abbreviations are used in this manuscript:
IoTInternet of Things
AODVAd Hoc On-demand Distance Vector
GPSRGreedy Perimeter Stateless Routing
VANETVehicular Ad Hoc Network
QoSQuality of Service
PLRPacket Loss Ratio

References

  1. Ting, D.S.W.; Carin, L.; Dzau, V.; Wong, T.Y. Digital technology and COVID-19. Nat. Med. 2020, 26, 459–461. [Google Scholar] [CrossRef]
  2. Arabi, Y.M.; Murthy, S.; Webb, S. COVID-19: A novel coronavirus and a novel challenge for critical care. Intensive Care Med. 2020, 46, 833–836. [Google Scholar] [CrossRef]
  3. Smith, A.C.; Thomas, E.; Snoswell, C.L.; Haydon, H.; Mehrotra, A.; Clemensen, J.; Caffery, L.J. Telehealth for global emergencies: Implications for coronavirus disease 2019 (COVID-19). J. Telemed. Telecare 2020, 26, 309–313. [Google Scholar] [CrossRef]
  4. Istepanian, R.S.; Lacal, J.C. Emerging mobile communication technologies for health: Some imperative notes on m-health. In Proceedings of the 25th Annual International Conference of the IEEE Engineering in Medicine and Biology Society (IEEE Cat. No. 03CH37439), Cancun, Mexico, 17–21 September 2003; IEEE: New York, NY, USA, 2003; Volume 2, pp. 1414–1416. [Google Scholar]
  5. Chandwani, R.K.; Dwivedi, Y.K. Telemedicine in India: Current state, challenges and opportunities. Transform. Gov. People Process. Policy 2015, 9, 393–400. [Google Scholar] [CrossRef]
  6. Lee, J.S.; Su, Y.W.; Shen, C.C. A Comparative Study of Wireless Protocols: Bluetooth, UWB, ZigBee, and Wi-Fi. In Proceedings of the IECON 2007—33rd Annual Conference of the IEEE Industrial Electronics Society, Taipei, Taiwan, 5–8 November 2007; IEEE: New York, NY, USA, 2007; pp. 46–51. [Google Scholar] [CrossRef]
  7. Batistatos, M.C.; Tsoulos, G.V.; Athanasiadou, G.E.; Science, T. Mobile Telemedicine for Moving Vehicle Scenarios: Wireless Technology Options and Challenges. J. Netw. Comput. Appl. 2012, 35, 1140–1150. [Google Scholar] [CrossRef]
  8. Niyato, D.; Hossain, E.; Diamond, J. IEEE 802.16/WiMAX-based broadband wireless access and its application for telemedicine/e-health services. IEEE Wirel. Commun. 2007, 14, 72–83. [Google Scholar] [CrossRef]
  9. Mercer, T.R.; Salit, M. Testing at scale during the COVID-19 pandemic. Nat. Rev. Genet. 2021, 22, 415–426. [Google Scholar] [CrossRef]
  10. Wood, R.M.; McWilliams, C.J.; Thomas, M.J.; Bourdeaux, C.P.; Vasilakis, C. COVID-19 scenario modelling for the mitigation of capacity-dependent deaths in intensive care. Health Care Manag. Sci. 2020, 23, 315–324. [Google Scholar] [CrossRef]
  11. Subhan, I.; Jain, A. Emergency care in India: The building blocks. Int. J. Emerg. Med. 2010, 3, 207–211. [Google Scholar] [CrossRef]
  12. Das, S.; Desai, R. Emergence of {EMS} in India. Available online: https://www.jems.com/international/emergence-of-ems-in-india/ (accessed on 25 January 2024).
  13. Williams, T.A.; Tohira, H.; Finn, J.; Perkins, G.D.; Ho, K.M. The ability of early warning scores (EWS) to detect critical illness in the prehospital setting: A systematic review. Resuscitation 2016, 102, 35–43. [Google Scholar] [CrossRef]
  14. Droogh, J.M.; Smit, M.; Absalom, A.R.; Ligtenberg, J.; Zijlstra, J.G. Transferring the critically ill patient: Are we there yet? Crit. Care 2015, 19, 62. [Google Scholar] [CrossRef]
  15. Nasiri, S.; Sadoughi, F.; Tadayon, M.H.; Dehnad, A. Security requirements of internet of things-based healthcare system: A survey study. Acta Inform. Med. 2019, 27, 253. [Google Scholar] [CrossRef]
  16. Gupta, K. Mobile Internet Penetration in Rural India Is Just 18%: Report. 2004. Available online: https://www.livemint.com/Technology/OBZOWMvu6CXHMPCdplDYfM/Mobile-internet-penetration-in-rural-India-is-just-18-repo.html (accessed on 2 November 2022).
  17. Agarwal, S. Internet and Mobile Association of India: Internet Users in India Expected to Reach 500 Million by June: IAMAI—The Economic Times. 2018. Available online: https://economictimes.indiatimes.com/tech/internet/internet-users-in-india-expected-to-reach-500-million-by-june-iamai/articleshow/63000198.cms?from=mdr (accessed on 2 November 2022).
  18. Firstpost. Rural India Has a Mere 17 Percent Internet Penetration due to Challenges in Deployment of Fixed Broadband Networks: Report-Technology News, Firstpost. 2018. Available online: https://www.firstpost.com/tech/news-analysis/rural-india-has-a-mere-17-percent-internet-penetration-due-to-challenges-in-deployment-of-fixed-broadband-networks-report-4306853.html (accessed on 2 November 2022).
  19. Sondi, P.; Wahl, M.; Rivoirard, L.; Cohin, O. Performance Evaluation of 802.11p-Based Ad Hoc Vehicle-to-Vehicle Communications for Usual Applications Under Realistic Urban Mobility. Int. J. Adv. Comput. Sci. Appl. 2016, 7, 221–230. [Google Scholar] [CrossRef]
  20. Nedungadi, P.; Jayakumar, A.; Raman, R. Personalized Health Monitoring System for Managing Well-Being in Rural Areas. J. Med. Syst. 2018, 42, 22. [Google Scholar] [CrossRef]
  21. Misic, J.; Misic, V. Bridge performance in a multitier wireless network for healthcare monitoring. IEEE Wirel. Commun. 2010, 17, 90–95. [Google Scholar] [CrossRef]
  22. Pavlopoulos, S.; Kyriacou, E.; Berler, A.; Dembeyiotis, S.; Koutsouris, D. A novel emergency telemedicine system based on wireless communication technology—AMBULANCE. IEEE Trans. Inf. Technol. Biomed. 1998, 2, 261–267. [Google Scholar] [CrossRef]
  23. Jin, Z.; Chen, Y. Telemedicine in the cloud era: Prospects and challenges. arXiv 2015, arXiv:1011.1669v3. [Google Scholar] [CrossRef]
  24. Lee, S.; Lim, A. Reliability and performance of IEEE 802.11n for vehicle networks with multiple nodes. In Proceedings of the 2012 International Conference on Computing, Networking and Communications (ICNC), Maui, HI, USA, 30 January–2 February 2012; IEEE: New York, NY, USA, 2012; pp. 252–256. [Google Scholar] [CrossRef]
  25. Shivaldova, V.; Mecklenbrauker, C.F. Real-world measurements-based evaluation of IEEE 802.11p system performance. In Proceedings of the 2013 IEEE 5th International Symposium on Wireless Vehicular Communications (WiVeC), Dresden, Germany, 2–3 June 2013; IEEE: New York, NY, USA, 2013; pp. 1–5. [Google Scholar] [CrossRef]
  26. Bala, R.; Krishna, C.R. Scenario Based Performance Analysis of AODV and GPSR Routing Protocols in a VANET. In Proceedings of the 2015 IEEE International Conference on Computational Intelligence & Communication Technology, Ghaziabad, India, 13–14 February 2015; IEEE: New York, NY, USA, 2015; pp. 432–437. [Google Scholar] [CrossRef]
  27. Goel, N.; Sharma, G.; Dhyani, I. A study of position based VANET routing protocols. In Proceedings of the 2016 International Conference on Computing, Communication and Automation (ICCCA), Greater Noida, India, 29–30 April 2016; IEEE: New York, NY, USA, 2016; pp. 655–660. [Google Scholar] [CrossRef]
  28. Dinu, R.; Veeraragavan, A. Random parameter models for accident prediction on two-lane undivided highways in India. J. Saf. Res. 2011, 42, 39–42. [Google Scholar] [CrossRef]
  29. Sonnis, O.; Sunka, A.; Singh, R.; Agarkar, T. IoT based telemedicine system. In Proceedings of the 2017 IEEE International Conference on Power, Control, Signals and Instrumentation Engineering (ICPCSI), Chennai, India, 21–22 September 2017; IEEE: New York, NY, USA, 2017; pp. 2840–2842. [Google Scholar]
  30. Raj, S. An efficient IoT-based platform for remote real-time cardiac activity monitoring. IEEE Trans. Consum. Electron. 2020, 66, 106–114. [Google Scholar] [CrossRef]
  31. Pathinarupothi, R.K.; Durga, P.; Rangan, E.S. IoT-based smart edge for global health: Remote monitoring with severity detection and alerts transmission. IEEE Internet Things J. 2018, 6, 2449–2462. [Google Scholar] [CrossRef]
  32. Ghazal, T.M.; Hasan, M.K.; Alshurideh, M.T.; Alzoubi, H.M.; Ahmad, M.; Akbar, S.S.; Al Kurdi, B.; Akour, I.A. IoT for smart cities: Machine learning approaches in smart healthcare—A review. Future Internet 2021, 13, 218. [Google Scholar] [CrossRef]
  33. Selvaraj, S.; Sundaravaradhan, S. Challenges and opportunities in IoT healthcare systems: A systematic review. Appl. Sci. 2020, 2, 139. [Google Scholar] [CrossRef]
  34. Saeik, F.; Avgeris, M.; Spatharakis, D.; Santi, N.; Dechouniotis, D.; Violos, J.; Leivadeas, A.; Athanasopoulos, N.; Mitton, N.; Papavassiliou, S. Task offloading in Edge and Cloud Computing: A survey on mathematical, artificial intelligence and control theory solutions. Comput. Netw. 2021, 195, 108177. [Google Scholar] [CrossRef]
  35. Khaliq, K.A.; Chughtai, O.; Qayyum, A.; Pannek, J. An emergency alert system for elderly/special people using VANET and WBAN. In Proceedings of the 2017 13th International Conference on Emerging Technologies (ICET), Islamabad, Pakistan, 27–28 December 2017; IEEE: New York, NY, USA, 2017; pp. 1–6. [Google Scholar] [CrossRef]
  36. Nasajpour, M.; Pouriyeh, S.; Parizi, R.M.; Dorodchi, M.; Valero, M.; Arabnia, H.R. Internet of Things for current COVID-19 and future pandemics: An exploratory study. J. Healthc. Inform. Res. 2020, 4, 325–364. [Google Scholar] [CrossRef]
  37. Kelly, J.T.; Campbell, K.L.; Gong, E.; Scuffham, P. The Internet of Things: Impact and implications for health care delivery. J. Med. Internet Res. 2020, 22, e20135. [Google Scholar] [CrossRef]
  38. Tamilselvi, V.; Sribalaji, S.; Vigneshwaran, P.; Vinu, P.; GeethaRamani, J. IoT based health monitoring system. In Proceedings of the 2020 6th International Conference on Advanced Computing and Communication Systems (ICACCS), Coimbatore, India, 6–7 March 2020; IEEE: New York, NY, USA, 2020; pp. 386–389. [Google Scholar]
  39. Ahmed, S.T.; Basha, S.M.; Ramachandran, M.; Daneshmand, M.; Gandomi, A.H. An Edge-AI enabled Autonomous Connected Ambulance Route Resource Recommendation Protocol (ACA-R3) for eHealth in Smart Cities. IEEE Internet Things J. 2023, 10, 11497–11506. [Google Scholar] [CrossRef]
  40. Bouras, M.A.; Lu, Q.; Dhelim, S.; Ning, H. A lightweight blockchain-based IoT identity management approach. Future Internet 2021, 13, 24. [Google Scholar] [CrossRef]
  41. Aung, N.; Zhang, W.; Dhelim, S.; Ai, Y. T-Coin: Dynamic traffic congestion pricing system for the Internet of Vehicles in smart cities. Information 2020, 11, 149. [Google Scholar] [CrossRef]
  42. Imhoff, B.F.; Thompson, N.J.; Hastings, M.A.; Nazir, N.; Moncure, M.; Cannon, C.M. Rapid Emergency Medicine Score (REMS) in the trauma population: A retrospective study. BMJ Open 2014, 4, e004738. [Google Scholar] [CrossRef]
  43. Mukhopadhyay, A.; Sreekumar, S.; Xavier, B.; Suraj, M. A cloud-based smartphone solution for transmitting bio-signals from an emergency response vehicle. In Research Anthology on Telemedicine Efficacy, Adoption, and Impact on Healthcare Delivery; IGI Global: Pennsylvania, PA, USA, 2021; pp. 429–446. [Google Scholar]
  44. Mukhopadhyay, A.; Nishin, S. An IoT and Smartphone-Based Real-Time Analysis on Pulse Rate and Spo2 using Fog-to-cloud Architecture. In Proceedings of the 2021 International Conference on Computer Communication and Informatics (ICCCI), Coimbatore, India, 27–29 January 2021; IEEE: New York, NY, USA, 2021; pp. 1–7. [Google Scholar]
  45. Mukhopadhyay, A.; Xavier, B.; Sreekumar, S.; Suraj, M. Real-time ecg monitoring over multi-tiered telemedicine environment using firebase. In Proceedings of the 2018 International Conference on Advances in Computing, Communications and Informatics (ICACCI), Bangalore, India, 19–22 September 2018; IEEE: New York, NY, USA, 2018; pp. 631–637. [Google Scholar]
  46. Mukhopadhyay, A. QoS based telemedicine technologies for rural healthcare emergencies. In Proceedings of the 2017 IEEE Global Humanitarian Technology Conference (GHTC), San Jose, CA, USA, 19–22 October 2017; IEEE: New York, NY, USA, 2017; pp. 1–7. [Google Scholar] [CrossRef]
  47. Skorin-Kapov, L.; Matijasevic, M. Analysis of QoS requirements for e-health services and mapping to evolved packet system QoS classes. Int. J. Telemed. Appl. 2010, 2010, 628086. [Google Scholar] [CrossRef]
  48. Devigayathri, P.; Varshini, R.A.; Pooja, M.; Subbulakshmi, S. Mobile ambulance management application for critical needs. In Proceedings of the 2020 Fourth International Conference on Computing Methodologies and Communication (ICCMC), Erode, India, 11–13 March 2020; IEEE: New York, NY, USA, 2020; pp. 319–323. [Google Scholar]
  49. Usman, M.A.; Philip, N.Y.; Politis, C. 5G enabled mobile healthcare for ambulances. In Proceedings of the 2019 IEEE Globecom Workshops (GC Wkshps), Waikoloa, HI, USA, 9–13 December 2019; IEEE: New York, NY, USA, 2019; pp. 1–6. [Google Scholar]
  50. Albahri, A.S.; Alwan, J.K.; Taha, Z.K.; Ismail, S.F.; Hamid, R.A.; Zaidan, A.; Albahri, O.S.; Zaidan, B.; Alamoodi, A.H.; Alsalem, M. IoT-based telemedicine for disease prevention and health promotion: State-of-the-Art. J. Netw. Comput. Appl. 2021, 173, 102873. [Google Scholar] [CrossRef]
  51. Cancela, J.; Pastorino, M.; Arredondo, M.T.; Hurtado, O. A telehealth system for Parkinson’s disease remote monitoring. The PERFORM approach. In Proceedings of the 2013 35th Annual International Conference of the IEEE Engineering in Medicine and Biology Society (EMBC), Osaka, Japan, 3–7 July 2013; IEEE: New York, NY, USA, 2013; pp. 7492–7495. [Google Scholar]
  52. Lehocki, F.; Kossaczky, I.; Homola, M.; Skalicky, D.; Mydliar, M.; Thurzo, A. Yet another hypertension telehealth solution? The rules will tell you. In Proceedings of the 2014 IEEE Conference on Biomedical Engineering and Sciences (IECBES), Miri, Malaysia, 8–10 December 2014; IEEE: New York, NY, USA, 2014; pp. 510–515. [Google Scholar]
  53. Ftaimi, S.; Mazri, T. A comparative study of Machine learning algorithms for VANET networks. In Proceedings of the 3rd International Conference on Networking, Information Systems & Security, Marrakech, Morocco, 31 March–2 April 2020; pp. 1–8. [Google Scholar]
  54. Zhang, D.; Yu, F.R.; Yang, R. A machine learning approach for software-defined vehicular ad hoc networks with trust management. In Proceedings of the 2018 IEEE Global Communications Conference (GLOBECOM), Abu Dhabi, United Arab Emirates, 9–13 December 2018; IEEE: New York, NY, USA, 2018; pp. 1–6. [Google Scholar]
  55. Phull, N.; Singh, P.; Shabaz, M.; Sammy, F. Enhancing vehicular ad hoc networks’ dynamic behavior by integrating game theory and machine learning techniques for reliable and stable routing. Secur. Commun. Netw. 2022, 2022, 4108231. [Google Scholar] [CrossRef]
  56. Kandali, K.; Bennis, L.; El Bannay, O.; Bennis, H. An Intelligent Machine Learning Based Routing Scheme for VANET. IEEE Access 2022, 10, 74318–74333. [Google Scholar] [CrossRef]
  57. Dawood, A. Cars in Delhi Move at Highest Speed as Bengaluru and Kolkata Remain Slowest Moving Metros. Available online: https://www.scoopwhoop.com/news/cars-in-delhi-move-at-highest-speed-as-bengaluru-and-kolkata-remain-slowest-moving-metros/ (accessed on 6 February 2023).
  58. Yona, M.; Klein, I. Compensating for Partial Doppler Velocity Log Outages by Using Deep- Learning Approaches. In Proceedings of the 2021 IEEE International Symposium on Robotic and Sensors Environments (ROSE), Virtual, 28–29 October 2021; pp. 1–5. [Google Scholar] [CrossRef]
  59. Pulse Transit Time PPG Dataset v1.1.0. Available online: https://physionet.org/content/pulse-transit-time-ppg/1.1.0/ (accessed on 2 November 2022).
  60. Simultaneous Physiological Measurements with Five Devices at Different Cognitive and Physical Loads v1.0.2. Available online: https://physionet.org/content/simultaneous-measurements/1.0.2/ (accessed on 2 November 2022).
  61. Pattern Analysis of Oxygen Saturation Variability v1.0.0. Available online: https://physionet.org/content/osv/1.0.0/ (accessed on 2 November 2022).
Figure 1. IoT-Enabled Traffic-Aware Telemedicine Architecture (ITTA).
Futureinternet 16 00052 g001
Figure 2. IoT-based Telemedicine Services Framework (ITSF).
Futureinternet 16 00052 g002
Figure 3. Representation of Scenario 1.
Futureinternet 16 00052 g003
Figure 4. Representation of Scenario 2.
Futureinternet 16 00052 g004
Figure 5. Packet loss ratio (PLR) experienced by each data type in Scenario 1.
Futureinternet 16 00052 g005
Figure 6. Delay experienced by each data type in Scenario 1.
Futureinternet 16 00052 g006
Figure 7. Packet loss ratio (PLR) experienced by each data type in Scenario 2.
Futureinternet 16 00052 g007
Figure 8. Delay experienced by each data type in Scenario 2.
Futureinternet 16 00052 g008
Table 1. On Fly Emergency Health Score (OFEHS).
6543210123456
Systolic (mmHg)≥170160–169150–159140–149130–139124–129119–123109–11899–10879–9870–7860–6950–59
Diastolic (mmHg)>130120–129110–119100–10990–9980–8975–7970–7450–6940–4930–3920–29<20
Heart rate 160–200140–159120–139100–119 70–99
SPO2 (%) <8484–90 91–94≥ 95
Table 2. Notations used.
NotationMeaning
SysiSystolic score at ith instance
DiaiDiastolic score at ith instance
PRiPR score at ith instance
OxyiOxygen Saturation score at ith instance
RStotiTotal risk score at ith instance
RStotTotal risk score
RStotMean risk score
jTotal time instances of measuring values
Adenotes the received power
Iapproximates the fading effect of each transmission channel
CThe power required to transmit each packet.
iData instance
A i j , C j Received signal strength
NMaximum nodes in the topology of the selected path
TSystem throughput
SPath selection parameter
Table 3. List of QoS requirements.
Data TypeRequired Data RateMax Delay AllowedMaximum Packet Loss Allowed (%)
Voice4–25 Kbps150–400 ms3
ECG24 Kbps1 s0
PR2–5 Kbps1 s0
BP2–5 Kbps1 s0
Table 5. Simulation parameters.
FeaturesSimulation Parameter Specifics
Communication TechnologyWiFi (802.11)
Length of Road Stretch6 km
Geographic and Spatial Division (km)Rural-2, Sub Urban-2, Urban-2
Temporal SlotsDetails in Table 6
Speed60 kmph (rural), 40 kmph (suburban), 20 kmph (urban)
QoS ParametersDetails in Table 3
Inter-packet interval1 s/0.1 s
Data type and Packet Size in BytesPR—250; Audio—500; ECG—300
Routing mechanismsFlooding, AODV, GPSR
Table 6. Number of vehicles used in simulation with 2 km stretch in each segment.
Time of DayRuralSuburbanUrbanTotal (in 6 km)
Early Morning (3–5)82868104
Morning (6–9)36205276517
Late Morning (10–11)28164176368
Mid-day (12–3)50302312664
Evening (4–6)60324342726
Late Evening (7–9)3094170294
Night (10–2)144684144
Table 7. Low and high PLR based on data type and routing protocol in Scenario 1.
TimingsVehicular DensityPRAudioECGTotal
LowHighLowHighLowHighLowHigh
Early Morning104AODV (86%)Flooding (97%)AODV (86%)Flooding (97% )GPSR (85%)Flooding (97%)AODV (86%)Flooding (97%)
Morning517AODV (69%)Flooding (91%)AODV (69%)Flooding (91%)AODV (69%)Flooding (91%)AODV (69%)Flooding (91%)
Late Morning368GPSR (91%)Flooding (96%)GPSR (91%)Flooding (96%)GPSR (91%)Flooding (96%)AODV and GPSR (91%)Flooding (96%)
Mid-day664AODV (47%)Flooding (91%)AODV (48%)Flooding (91%)AODV (49%)Flooding (91%)AODV (47%)Flooding (91%)
Evening726AODV (34%)Flooding (92%)AODV (34%)Flooding (92%)AODV (35%)Flooding (92%)AODV (34%)Flooding (92%)
Late Evening294AODV (90%)Flooding (92%)AODV (90%)Flooding (92%)AODV (89%)Flooding (92%)AODV (90%)Flooding (90%)
Night144AODV (87%)Flooding (95%)AODV (87%)Flooding (95%)AODV (86%)Flooding (95%)AODV (41%)Flooding (89%)
Table 8. Low and high delay based on data type and routing protocol in Scenario 1.
TimingsVehicular DensityPRAudioECGTotal
LowHighLowHighLowHighLowHigh
Early Morning104GPSR (1 ms)Flooding (36 ms)GPSR (1 ms)Flooding (36 ms)GPSR (1 ms)Flooding (20 ms)GPSR (1 ms)Flooding (36 ms)
Morning517GPSR (1 ms)Flooding (4653 ms)GPSR (2 ms)Flooding (8881 ms)GPSR (1 ms)Flooding (5209 ms)GPSR (1 ms)Flooding (4653 ms)
Late Morning368GPSR (1 ms)Flooding (136 ms)GPSR (1 ms)Flooding (137 ms)GPSR (1 ms)Flooding (96 ms)GPSR (1 ms)Flooding (136 ms)
Mid-day664GPSR (15 ms)Flooding (4632 ms)GPSR (4 ms)Flooding (8857 ms)GPSR (13 ms)Flooding (5206 ms)GPSR (15 ms)Flooding (4632 ms)
Evening726GPSR (3 ms)AODV (343 ms)GPSR (9 ms)AODV (459 ms)GPSR (5 ms)AODV (5355 ms)GPSR (3 ms)AODV (343 ms)
Late Evening294AODV (16)GPSR (7560 ms)GPSR (1 ms)Flooding (22 ms)Flooding (12 ms)GPSR (8252 ms)GPSR (1 ms)GPSR (8252 ms)
Night144GPSR (1 ms)Flooding (65 ms)GPSR (2 ms)Flooding (66 ms)GPSR (1 ms)Flooding (46 ms)GPSR (1 ms)Flooding (65 ms)
Table 9. Low and high PLR based on data type and routing protocol in Scenario 2.
TimingsVehicular DensityPRAudioECGTotal
LowHighLowHighLowHighLowHigh
Early Morning104AODV (6%)Flooding (86%)AODV (4%)Flooding (86%)AODV (0.5%)Flooding (86%)AODV (0.5%)Flooding (86%)
Morning517AODV (4%)Flooding (86%)AODV (6%)Flooding (86%)AODV (1%)Flooding (86%)AODV (1%)Flooding (86%)
Late Morning368AODV (4%)Flooding (87%)AODV (5%)Flooding (87%)AODV (1%)Flooding (87%)AODV (1%)Flooding (87%)
Mid-day664AODV (5%)Flooding (87%)AODV (6%)Flooding (87%)AODV (0.7%)Flooding (87%)AODV (0.7%)Flooding (87%)
Evening726AODV (0.7%)Flooding (100%)AODV (0.7%)Flooding (100%)AODV (0.07%)Flooding (100%)AODV (0.07%)Flooding (100%)
Late Evening294AODV (4%)Flooding (86%)AODV (4%)Flooding (86%)AODV (0.6%)Flooding (86%)AODV (0.6%)Flooding (86%)
Night144AODV (5%)Flooding (87%)AODV (4%)Flooding (87%)AODV (0.8%)Flooding (87%)AODV (0.8%)Flooding (87%)
Table 10. Low and high delay based on data type and routing protocol in Scenario 2.
TimingsVehicular DensityPRAudioECGTotal
LowHighLowHighLowHighLowHigh
Early Morning104GPSR (1 ms)AODV (2287 ms)GPSR (2 ms)AODV (158 ms)GPSR (1 ms)AODV (1707 ms)GPSR (1 ms)AODV (2287 ms)
Morning517GPSR (1 ms)AODV (224 ms)GPSR (2 ms)AODV (252 ms)GPSR (1 ms)AODV (258 ms)GPSR (1 ms)AODV (258 ms)
Late Morning368GPSR (2 ms)AODV (207ms)GPSR (3 ms)AODV (224 ms)GPSR (1 ms)AODV (209 ms)GPSR (1 ms)AODV (224 ms)
Mid-Day664GPSR (1 ms)Flooding (4661 ms)GPSR (2 ms)Flooding (8887 ms)GPSR (1 ms)Flooding (5206 ms)GPSR (1 ms)Flooding (4661 ms)
Evening726GPSR (1 ms)AODV (11 ms)GPSR (8 ms)AODV (12 ms)GPSR (1 ms)AODV (8 ms)GPSR (1 ms)AODV (12 ms)
Late Evening294GPSR (2 ms)Flooding (4668 ms)GPSR (3 ms)Flooding (8891 ms)GPSR (1 ms)Flooding (5207 ms)GPSR (1 ms)Flooding (8891 ms)
Night144GPSR (1 ms)AODV (282 ms)GPSR (2 ms)AODV (176 ms)GPSR (1 ms)AODV (175 ms)GPSR (1 ms)AODV (282 ms)
Table 11. Patient vital signs as input parameters.
PatientSystolicDiastolicHRSpO2Patient Risk Score
patient11209272982
patient21227374963
patient31337680962
patient41359374994
patient5805575985
patient6925681965
patient71007385953
patient81217675922
patient913275112964
patient1012078122855
Table 12. List of routes and links as input parameters.
RouteLinksV2V/V2I
r1l1.1, l1.3, l1.4V2V
l1.2V2V/V2I
r2l2.1, l2.2V2V
l2.3V2V/V2I
r3l3.1, l3.4, l3.5V2V
l3.2, l3.3, l3.6V2I
r4l4.1V2I
l4.2V2V
Table 13. Dynamic routing based on patient risk level.
Patient IDRouteLinksV2V/V2IRouting Protocol
patient1r3l3.1, l3.4, l3.5V2VGPSR
l3.2, l3.3, l3.6V2IAODV
patient2r1l1.1, l1.3, l1.4V2VGPSR
l1.2V2IAODV
patient3r3l3.1, l3.4, l3.5V2VGPSR
l3.2, l3.3, l3.6V2IAODV
patient4r1l1.1, l1.3, l1.4V2VGPSR
l1.2V2IAODV
patient5r4l4.1V2IAODV
l4.2V2VGPSR
patient6r4l4.1V2IAODV
l4.2V2VGPSR
patient7r1l1.1, l1.3, l1.4V2VGPSR
l1.2V2IAODV
patient8r3l l3.1, l3.4, l3.5V2VGPSR
l3.2, l3.3, l3.6V2IAODV
patient9r2l2.1, l2.2V2VGPSR
l2.3V2IAODV
patient10r4l4.1V2IAODV
l4.2V2VGPSR
Disclaimer/Publisher’s Note: The statements, opinions and data contained in all publications are solely those of the individual author(s) and contributor(s) and not of MDPI and/or the editor(s). MDPI and/or the editor(s) disclaim responsibility for any injury to people or property resulting from any ideas, methods, instructions or products referred to in the content.

