Article

Optimal Meshing Degree Performance Analysis in a mmWave FWA 5G Network Deployment

School of Computer Science and Mathematics, Liverpool John Moores University, Byrom Street, Liverpool L3 3AF, UK
*
Author to whom correspondence should be addressed.
Future Internet 2023, 15(6), 218; https://doi.org/10.3390/fi15060218
Submission received: 13 April 2023 / Revised: 8 June 2023 / Accepted: 15 June 2023 / Published: 20 June 2023
(This article belongs to the Special Issue Novel 5G Deployment Experience and Performance Results)

Abstract

:
Fifth-generation technologies have reached a stage where it is now feasible to consider deployments that extend beyond traditional public networks. Central to this process is the application of Fixed Wireless Access (FWA) in 5G Non-public Networks (NPNs) that can utilise a novel combination of radio technologies to deploy an infrastructure on top of 5G NR or entirely from scratch. However, the use of FWA backhaul faces many challenges in relation to the trade-offs for reduced costs and a relatively simple deployment. Specifically, the use of meshed deployments is critical as it provides resilience against a temporary loss of connectivity due to link errors. In this paper, we examine the use of meshing in a FWA backhaul to determine if an optimal trade-off exists between the deployment of more nodes/links to provide multiple paths to the nearest Point of Presence (POP) and the performance of the network. Using a real 5G NPN deployment as a basis, we have conducted a simulated analysis of increasing network densities to determine the optimal configuration. Our results show a clear advantage for meshing in general, but there is also a performance trade-off to consider between overall network throughput and stability.

1. Introduction

Fifth-generation (5G) technologies have reached a stage where it is now feasible to consider operational deployments that extend beyond traditional Mobile Network Operators (MNOs). This allows for a range of new operators to enter the market or for public institutions and large enterprises to deploy bespoke 5G networks for their own purposes. Central to these affordances is the application of Fixed Wireless Access (FWA) in the context of 5G Non-public Networks (NPNs) that utilise a novel combination of radio technologies to meet their specific requirements.
Moreover, as a result of many of these deployments occurring in areas where a traditional wired core is not feasible, such as in predominantly rural environments, wireless backhauling has become an important challenge with respect to operators’ ability to provide multi-gigabit capacity while using cost-efficient technologies. High-capacity backhauling is also a key enabler for upcoming 6th Generation (6G) technologies and will help handle the corresponding tremendous volumes of data to support the expected high-data-rate 6G user services [1]. Millimetre-wave (mmWave) technologies, including those operating in the V-band (60 GHz) and the E-band (70/80 GHz), have become a feasible enabler of this process, and backhaul links using these bands may be well suited to supporting 5G and 6G due to their high-throughput and low-latency characteristics [2]. Indeed, several such 5G deployments using these technologies have already taken place.
Unfortunately, as a trade-off for reduced costs and relatively simple deployment, there are many challenges involved in the use of FWA backhaul, such as the potential need to contend with interference and carefully consider the physical environment in each case. One particular issue is the need for robustness in the backhaul core, as losses of connectivity are not unheard of, and error-prone connections are more commonplace. Specifically, the use of meshed deployments is critical in this context as it provides resilience against the temporary loss of links due to these errors [3]. However, as discussed above, a trade-off exists in terms of the deployment and operational costs of a fully meshed configuration vs. the need for coverage, performance, and resilience.
In this paper, we examine the use of meshing in a mobile network backhaul deployment. To this end, we consider the use case of Fixed Wireless Access (FWA) backhaul in the context of 5G NPNs that utilise a novel combination of radio technologies to meet their specific requirements. While there has been some work on the evaluation of 5G performance [4], there are comparatively few studies on this topic [5] as 5G NPNs have only been deployed in limited numbers to date and this specific aspect of the backhaul has not been considered in a practical deployment scenario. Specifically, we discuss the trade-offs that exist between the need for more nodes/links to provide multiple paths to the nearest Point of Presence (POP) and, therefore, better resilience but also the higher cost of the network. Our aim is to determine the optimal degree of meshing that is needed for a specific backhaul network, i.e., a 5G FWA deployment, based on the deployment environment, networking requirements, and technologies used, and we will draw from a rich range of previous research in Wireless Meshed Networks (WMNs) and our own experiences to do so. We believe this work can significantly contribute to both the research community and those planning future 5G NPN deployments as more are deployed over time. The main novel contributions of this work can be summarised as follows:
  • The presentation of the quantifiable performance improvements to be gained when employing increasingly dense next-generation meshed backhaul networks;
  • The delineation of the performance trade-offs that must be considered in such a 5G FWA meshed network in terms of throughput vs. stability.
The remainder of the paper is structured as follows. Section 2 provides an overview of private 5G deployment efforts to date along with a literature review of meshed FWA. Then, Section 3 presents the problem we aim to address and our deployment model. Section 4 describes our meshing experiments, and Section 5 presents the evaluation results. Finally, we provide our conclusions and further work in Section 6.

2. Literature Review

There are many studies on the topic of meshing in wireless networks for different wireless deployments such as Mobile Networks [6], WLANs [7], Wireless Sensor Networks (WSNs) [8], and others. However, there is still limited research regarding the specific application domain of FWA, specifically with respect to 5G NPNs. In this section, we will first describe the current state of the art in FWA deployments and 5G NPNs specifically before reviewing previous research in this area to highlight its applicability to our work.

2.1. 5G Non-Public Networks and Fixed Wireless Access Deployments

The use of 5G technologies to support deployments beyond traditional MNO networks opens a wide range of applications and scenarios for wireless technologies that can benefit from reduced costs and complexity while still providing good bandwidth and responsiveness. In the 3GPP scope, these deployments are called private or non-public networks (NPNs) [9]. These deployments can, for example, make use of a combination of shared and private base stations and backend infrastructure through slicing to provide network capacity solely provisioned to a given use case.
In order to support 5G NPNs, various scenarios have been envisioned wherein the 5G Core (5GC) can be provisioned and controlled locally or remotely or through some combination of the above [10,11]. Essentially, both the Control Plane (CP), which provides device and network control such as access control and management, session management, mobility management, and policy management, and the User Plane Functions (UPF), which deals with data routing and forwarding, need to be provisioned for the user in order to provide a 5G service [12]. Moreover, the heterogeneous nature of available RAN technologies in 5G provides a powerful mechanism with which to support a range of devices and applications ranging from LoRa sensor devices to 4K streaming or VR-type applications. In addition to 5G NR, an operator might also make use of some version of LTE in addition to Wi-Fi, mmWave, and other WLAN technologies to provide appropriate coverage [13].
An interesting deployment area for 5G is in public networks deployed by and for a community [13]. Such networks can, for example, be setup by a local government or organisation and provided to members in locations where MNO coverage is not available or suitable or can be tailored to a specific use case that meets a public need. In this case, there are, again, a wide range of potential deployment models that could be adopted depending on the specific circumstances. An organisation might apply for a specific portion of the available spectrum in their area to deploy their own base stations or adopt another unlicensed solution. For example, a town/city with an available fibre infrastructure (perhaps to support a CCTV platform) could simply look to extend it into the necessary areas using a Wi-Fi mesh or use more specialized and higher-capacity technologies as needed. It is in this context that we introduce the Liverpool 5G, which is an 802.11ad based mesh backhaul network that was deployed as part of the DCMS 5G Testbeds and Trials Programme [14].

2.1.1. FWA Trials

FWA trials have been taking place in numerous locations around the world since before 2016. For example, Facebook’s current Terregraph project [15] connects over 100 homes in and around Mikebuda, Hungary, and provides up to 1 Gbps in the area, for which there is over 99.5% coverage. Before this project, Intel and Ericsson deployed their first 5G FWA network with AT&T in 2017 [16]; since then, many trials have taken place in various contexts, such as the recent Orange trials in Romania, which demonstrated a 5G virtual packet core [17]. Other trials have been conducted recently by vendors such as Samsung, Huawei, and Nokia in addition to operators like Telefonica. In the UK, recent government-funded 5G testbed projects have deployed different networks in over 30 areas [18] based on a wide range of rural [19] or urban [20] scenarios, in addition to considering specific use cases such as transport and industry.
Accordingly, there is now a growing field of knowledge related to a wide range of 5G FWA deployments that consider a mix of heterogeneous technologies and extend beyond typical MNO-led public wireless networks. However, when we consider the performance optimisation of such networks, much of the research to date has not been underpinned by practical experience or does not directly impact our research. We describe this work in the section below.

2.1.2. Performance Analysis and Optimisation in 5G NPN FWA Backhaul

Based on the efforts outlined above, there is now a limited body of work discussing practical performance measurement and optimisation in the scope of 5G NPN FWA networks. Previous work in the context of 5G link performance outlined how mmWave mesh networks perform in a range of deployment scenarios, including both urban and rural environments [19,21]. There has also been some work that characterised the uplink and downlink performance of these networks in practice [5,22]. However, to the best of our knowledge, there are currently no studies that have characterised the practical deployment and organisation of the network as a whole. There have, however, been some studies that discussed 5G NPN networks in this context. Recently, a number of such studies have focused on the use of 5G in an industrial environment to support Industry 4.0 [23]. There have also been good economic analyses of these deployments that provide cost models for cellular 5G NPNs and highlight the likely benefits based on Capex and Opex savings [24].
Beyond the practical analysis above, there are also a number of studies that explore FWA backhaul networks from a theoretical perspective [25,26,27,28]. In particular, Ref. [25] explored the energy optimisation of mmWave backhaul networks using a mixed integer model. In addition, Ref. [26] provided a comparison of 802.11 routing performance in ad hoc networks and found significant performance differences based on the use of static or mobile nodes. Moreover, the work by Seppänen et al. [27] presented an interesting analysis of multipath routing for mmWave backhaul in order to provide robust connectivity. Finally, there is a good discussion of QoS-aware scheduling in meshed backhauls in [28]. However, in many cases, these studies draw on a wider body of previous research on Wireless Mesh Networks (WMNs) that have established much of the fundamental knowledge in this field. Thus, we next outline past research on WMNs and highlight the areas that are most relevant to the work presented in this paper.

2.2. WMN Node Placement and Routing

WMN node placement is known to be an NP-hard problem, and many of the main issues are still relevant and being actively researched [29]. In this section, we will summarise previous research on WMN optimisation in order to describe the work that is relevant to our study on meshing before examining the current approaches to routing and again highlighting related work.

2.2.1. Node Placement and Optimisation

We can consider the work in this paper to be a specific application of the Mobile Gateway (MG)/Mobile Router (MR) placement problem. Many approaches have been considered for this in the past, for which both fixed and dynamic topologies have been taken into account [30], with the former being more relevant given our focus on 5G FWA. Due to the more general nature of the field, this research traditionally attempts to minimise interference between nodes and balance link utilisation to ensure fairness and load distribution [31].
Research on fixed topologies typically focusses on joint routing/channel allocation strategies as these increase the flexibility and utilisation of links to optimise throughput or aggregate load, while others aim to minimise hop count [32]. No general consensus has been reached on the optimal approach given the wide range of applicable deployment scenarios, but most research favours simplicity based on the complexity of multi-objective problems [33]. Additionally, while FWA topologies are fixed by definition, some research on dynamic topologies is also relevant in our case as we do consider the number of nodes and meshing configuration. These approaches are defined by the constraints imposed on the problem, such as the presence and number of fixed gateways or if the network is completely unfixed [30]. As above, this research aims to minimise the cost of multi-hop deployments or maximise profit.
In our case, interference can be mitigated effectively through the limited number of links, the 802.11ad orthogonal channel options, and link transmission characteristics. Accordingly, one of the key metrics that must be specifically considered in our work on MR placement and configuration is reliability, as we aim to establish a realistic threshold between performance and resilience through meshing. Some previous work also exists in this area. Beljadid et al. [34] defined a reliability cost function that allows for the maximization of the reliability of the whole WMN. However, it is important to note the additional overheads introduced to the optimisation problem when reliability is elevated and the trade-off with respect to cost that this introduces.

2.2.2. Topology Optimisation

Most recent work [29] on WMN topologies tends to focus on approximate optimisations and has delivered improvements using heuristics, meta-heuristics, and hybrids. Heuristic systems tend to be more historic, and although recent work was carried out on clustering algorithms for MRs [35] and in tree-based approaches [36], it otherwise tends to focus on gateway placement. Meta-heuristics-based techniques have proven the most popular, and recent studies [37,38] have focused on using hill-climbing and simulated annealing (SA), respectively, for MR router placement through various environments. Approaches that utilise hybrid techniques are still quite limited, but the recent work presented in [39] examined the use of particle swarm optimisation and genetic algorithms for node placement.
Overall, the problem concerns determining the optimal number of nodes required to provide connectivity and their link and meshing configuration, while also considering the physical and financial constraints of the deployment. However, as the metrics become more numerous, we also see multi-objective approaches introduced that consider the trade-offs between competing requirements, such as cost and complexity, coverage and connectivity, and load balancing and interference management, and performance characteristics such as throughput, delay, and overall capacity [40].

2.2.3. Wireless Mesh Routing

As noted above, routing protocols for wireless meshed networks generally emphasise minimising the hop count of any route to the gateway in order to limit delays and optimise load. However, given the tight bond between the configuration of the network itself and how it is utilised to maximise capacity, many protocols have been developed to allow for adaptation to dynamic environments.
In fully dynamic meshes, routing must consider the nature of the nodes themselves, which may move or leave the network over time. In such cases, a great deal of research has been performed to actively build and maintain routing infrastructures. The main metrics used, beyond hop count, include some variations of Expected Transmission Count (ETX) and Expected Transmission Time (ETT) [41], and a range of protocols have been developed based on proactive, reactive, or hybrid techniques. These include ad hoc algorithms like LQSR, flooding-based techniques such as OLSR and MMRP, or traffic-aware mechanisms such as AODV and DSR, among others [42]. There are also variations of the above that consider multi-path approaches or that emphasise load balancing. More recently, routing has also moved to consider centralised SDN-based approaches [6].
However, in the case of FWA networks wherein routes can be considered relatively stable, many of these protocols are simply unnecessary. As with any wireless medium, there is always the potential for some intermittent interruption or interference on specific links, but this can largely be mitigated through the implementation of resilience measures such as denser meshing. Accordingly, routing in this space typically reverts to shortest path or distance vector algorithms such as some form of the Distributed Bellman–Ford or Dijkstra algorithms [26,43].

3. Problem Description

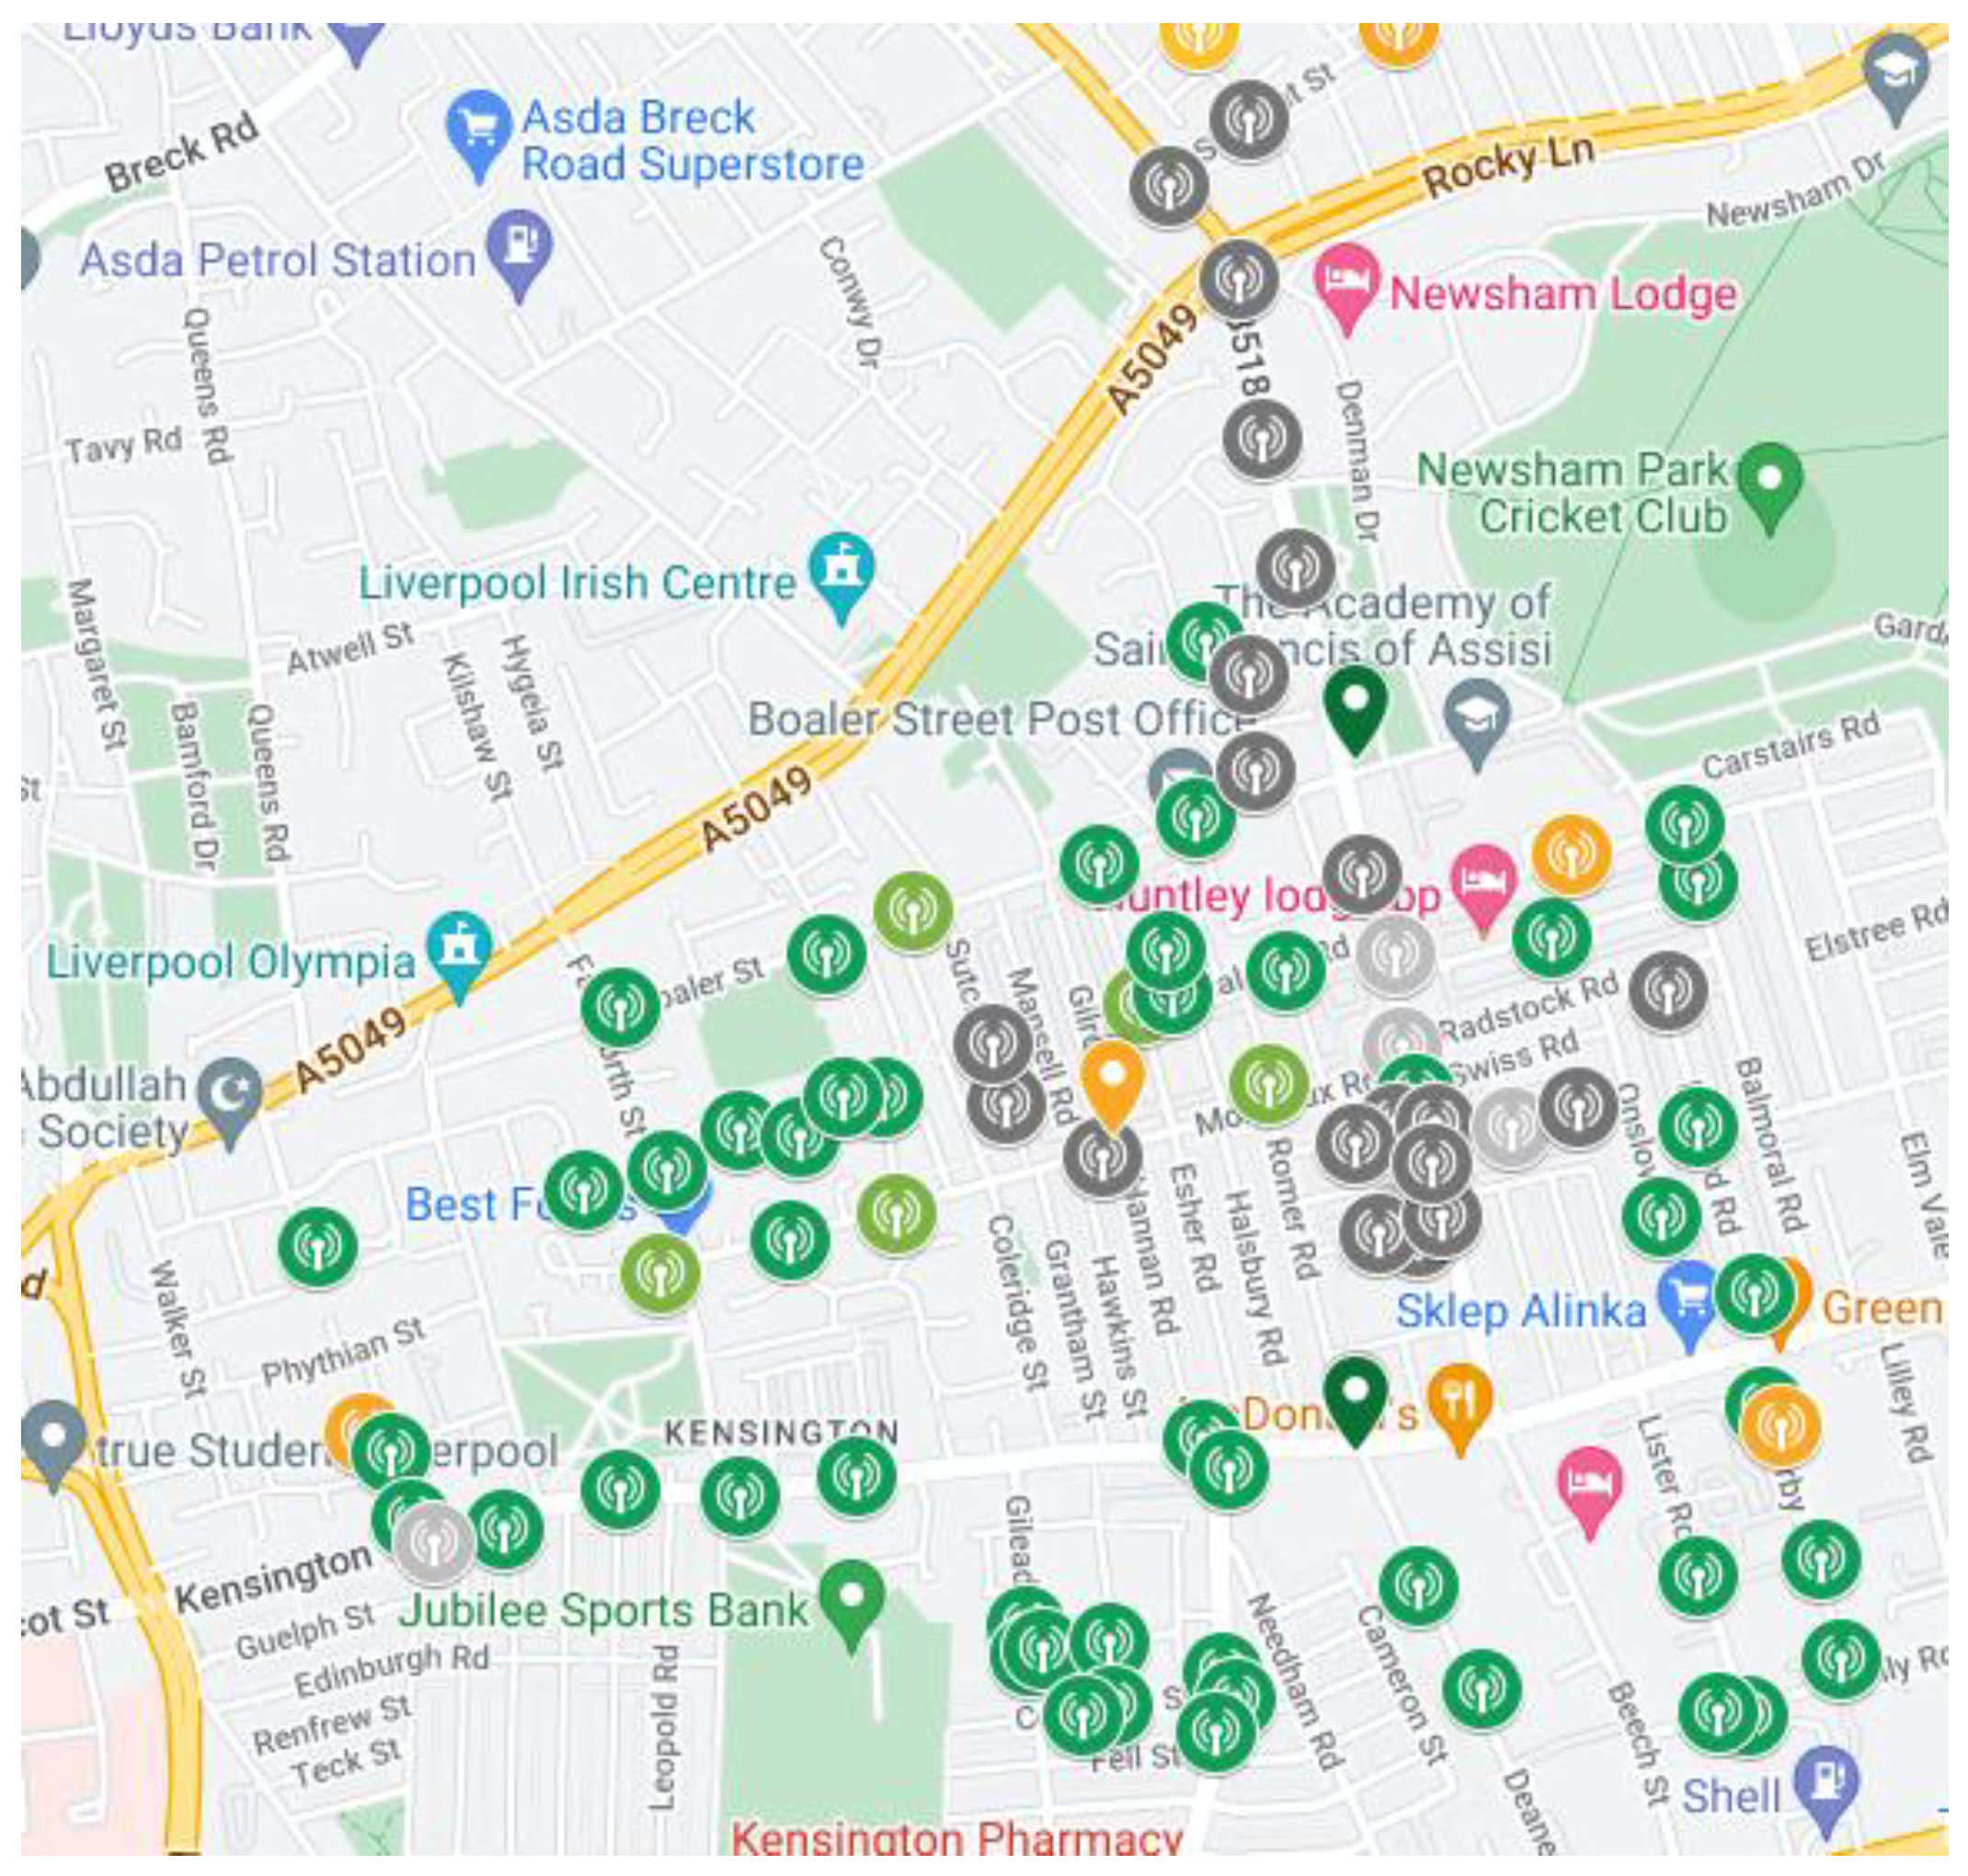
3.1. Liverpool 5G Deployment

The infrastructure deployed in the Liverpool 5G project is illustrated in Figure 1. In the second phase of the project (from 2020 to 2022), the network topology consisted of 220 nodes and 6 gateways (POPs) installed in the Kensington area of the city, making it among the largest standalone 5G mmWave networks in the UK and Europe. Each node in the backhaul mesh was collocated with a Wi-Fi AP to provide WLAN connectivity, with many nodes also supporting 5G small cells operating in the N77 band. The network was designed such that there is line-of-sight link along any of the roads between deployed nodes, and the connection was based on IEEE 802.11ad mmWave links. The nodes are a mix of Blu-Wireless DN101LC and DN201SC stations and are attached to streetlights or other street furniture at a consistent elevation. The nodes have 90-degree azimuth coverage, one independent beam, and a maximum capacity of 5 Gbps (MAC layer). The POP nodes are connected to the gateway through a fibre link, and backhauling is then handled via a local cloud service provider. Furthermore, due to the widely deployed nodes and the high path and penetration loss at 60 GHz, some links required relays (multi-hop transmissions) to facilitate backhauling, and nodes were clustered around the nearest POP.
The aim of this deployment is to support a range of social and healthcare applications for the Liverpool community, ranging from simple health sensor and monitoring services to VoIP, full HD or 4K streaming for remote consultations, and low-latency VR/AR tools.
However, in the second phase of the project, many of the deployments focused primarily on providing connectivity to a small set of end user sites and, at least initially, consisted of a single POP and a number of intermediate nodes reaching toward the specific site in question, as shown in Figure 2 below. In this example, the deployment starts with the MG at node 1 (orange point in the figure) that provides POP connectivity and then extends through MRs at nodes 2 and 3 towards the end site that is connected through node 4 (blue points in the figure). Moreover, the figure illustrates the maximum Modulation Coding Scheme (MCS) and the corresponding maximum data rate that can be achieved in each link (yellow line in the figure) based on the radio environment conditions, such as path loss and transmission power, together with the corresponding maximum data rate.
These deployments were largely governed by practical limitations, ranging from restrictions in terms of equipment and access imposed through the COVID-19 pandemic to the practical limitations of node placement around street furniture and vegetation and the 60 GHz link performance. Thus, the project represented a pragmatic solution for the project consortium and, therefore, a realistic deployment scenario for many operators in this space. However, a significant shortcoming of this approach is that each link in this deployment represents a single point of failure; moreover, each node can itself introduce traffic to the backhaul such that links closer to the POP run the risk of being overwhelmed through cumulative network load.

3.2. Meshed FWA Deployment

Given this context, the work presented herein aims to assess the optimal degree of meshing for a FWA 5G NPN as exemplified in the Liverpool 5G deployment. We will consider a trade-off between the number of additional nodes/links introduced to a deployment and the improvements in terms of efficiency and routing that can be achieved as a result. Thus, we cannot realistically consider a fully meshed configuration due to cost and physical deployment (e.g., LOS) issues. In this section, we first introduce the physical deployment and then describe the constraints (in the context of the previous literature) that we considered.

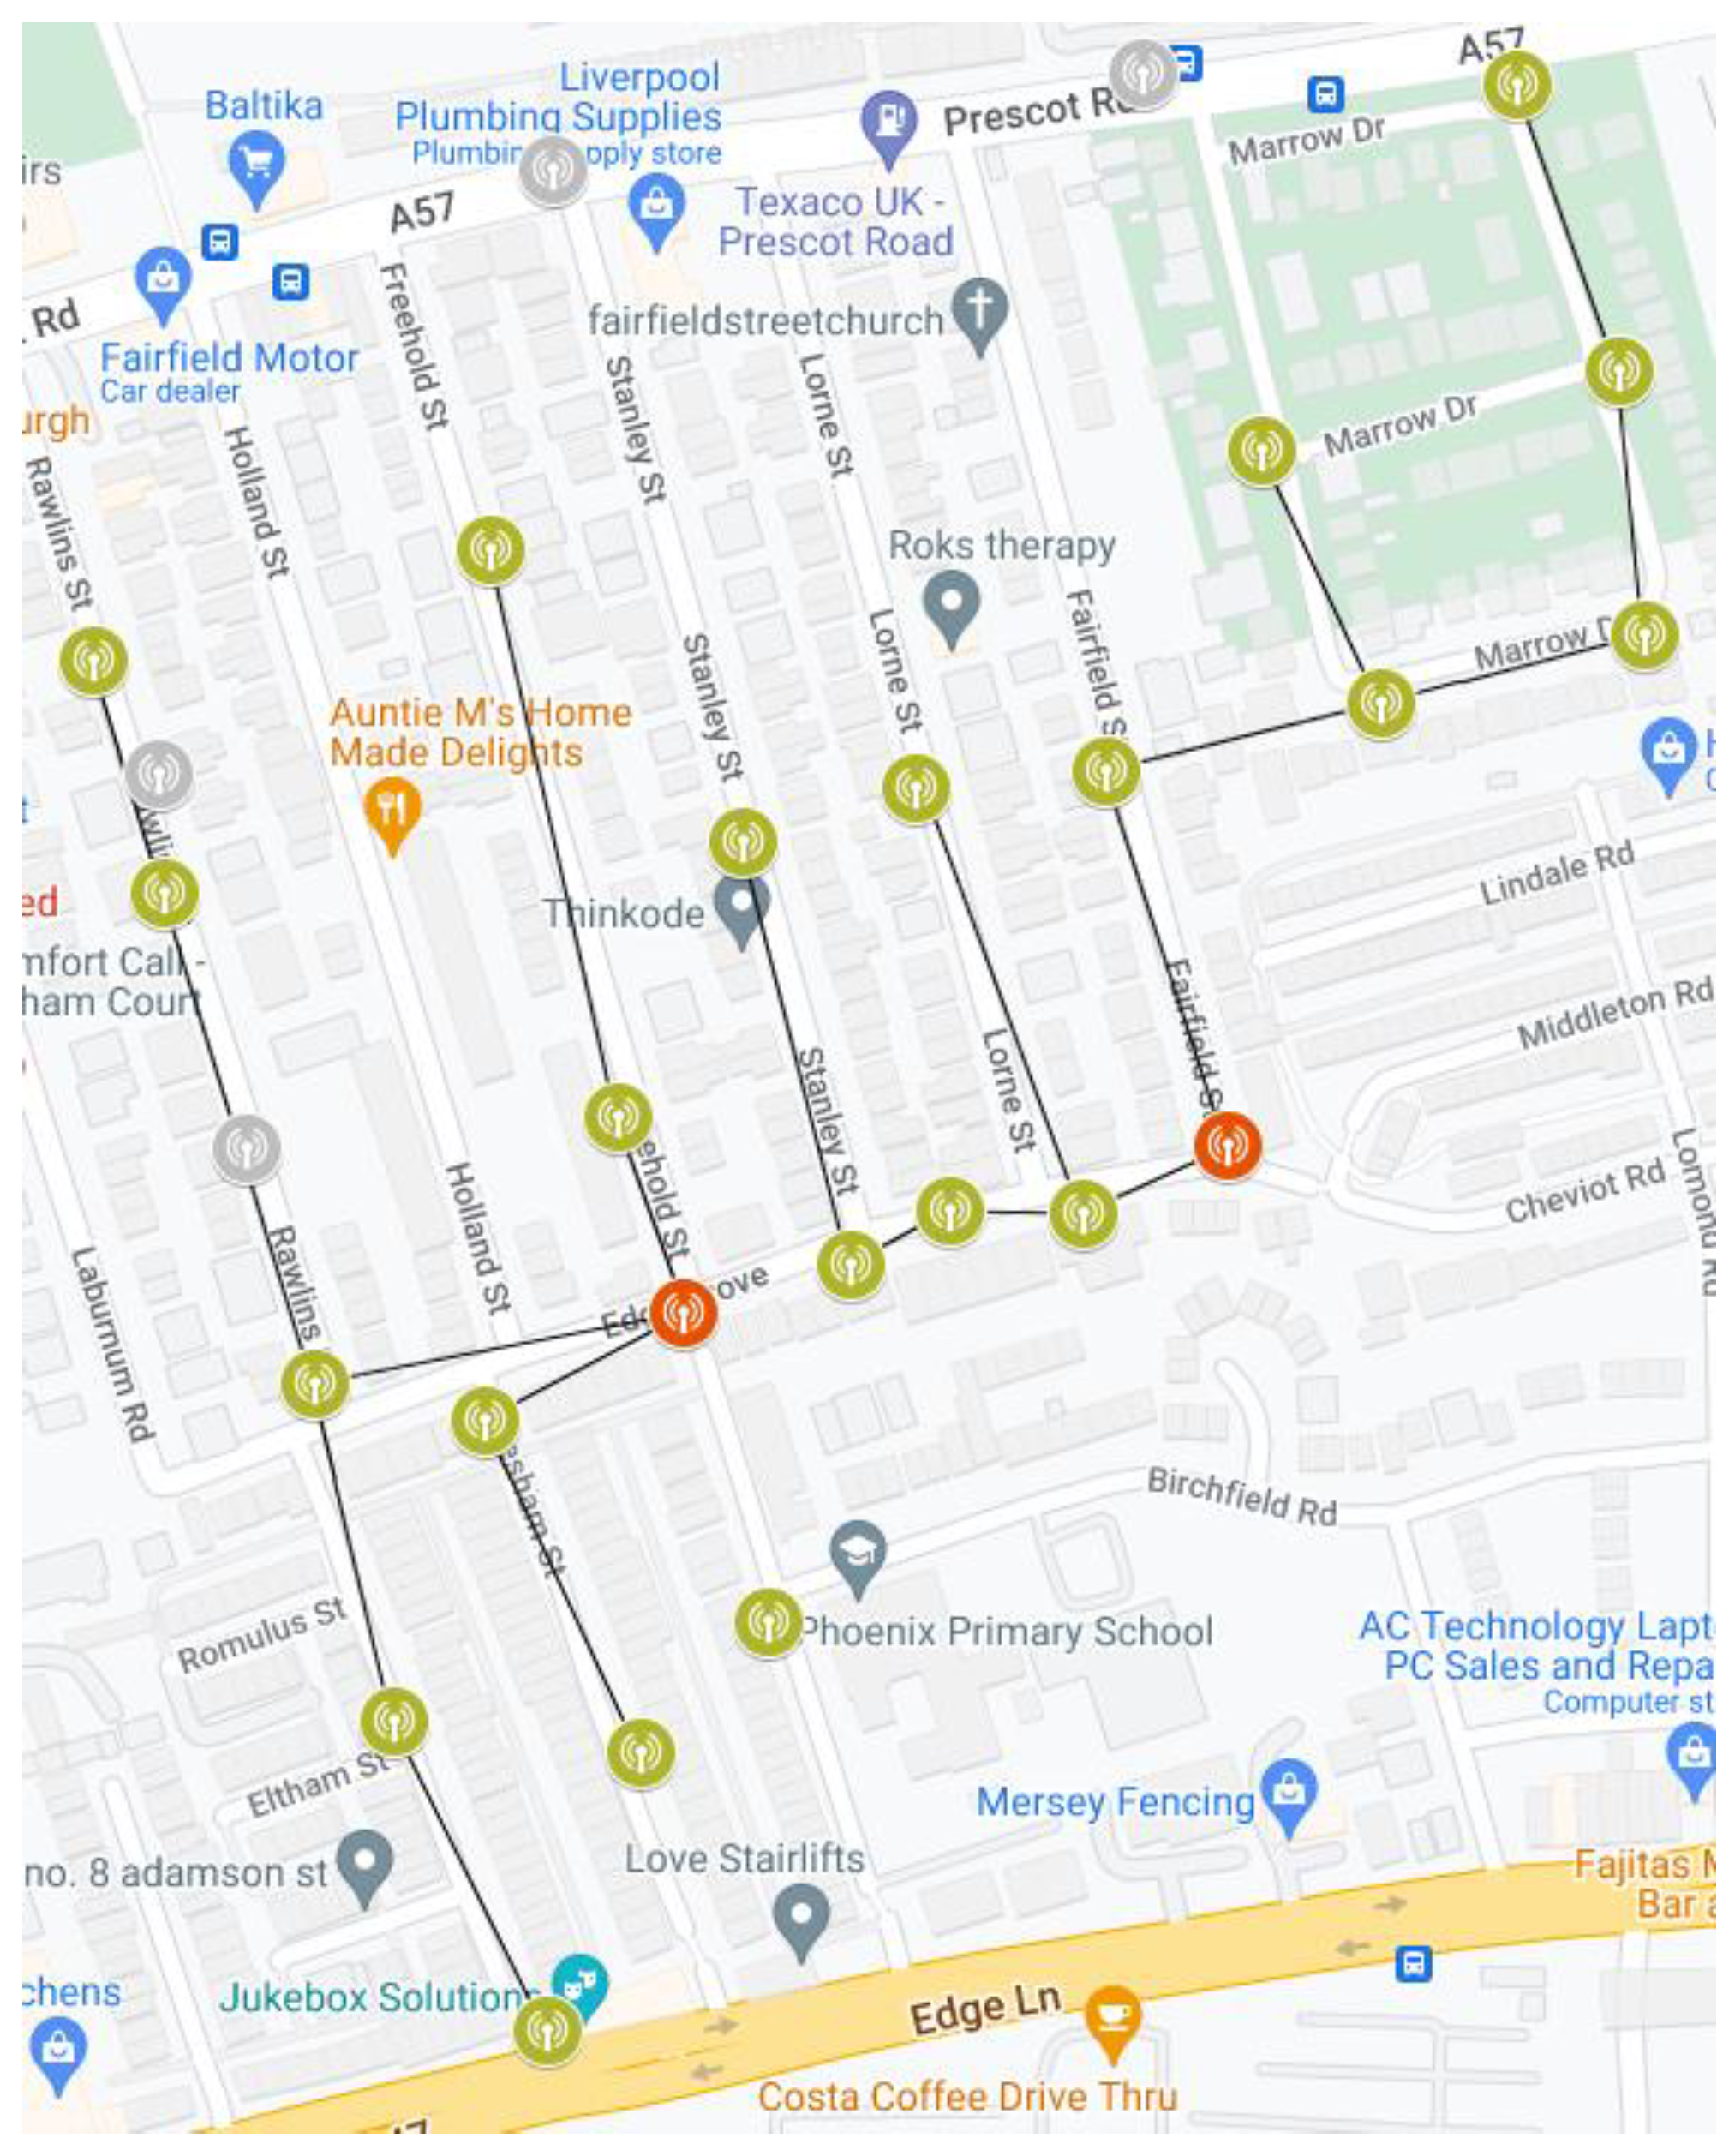
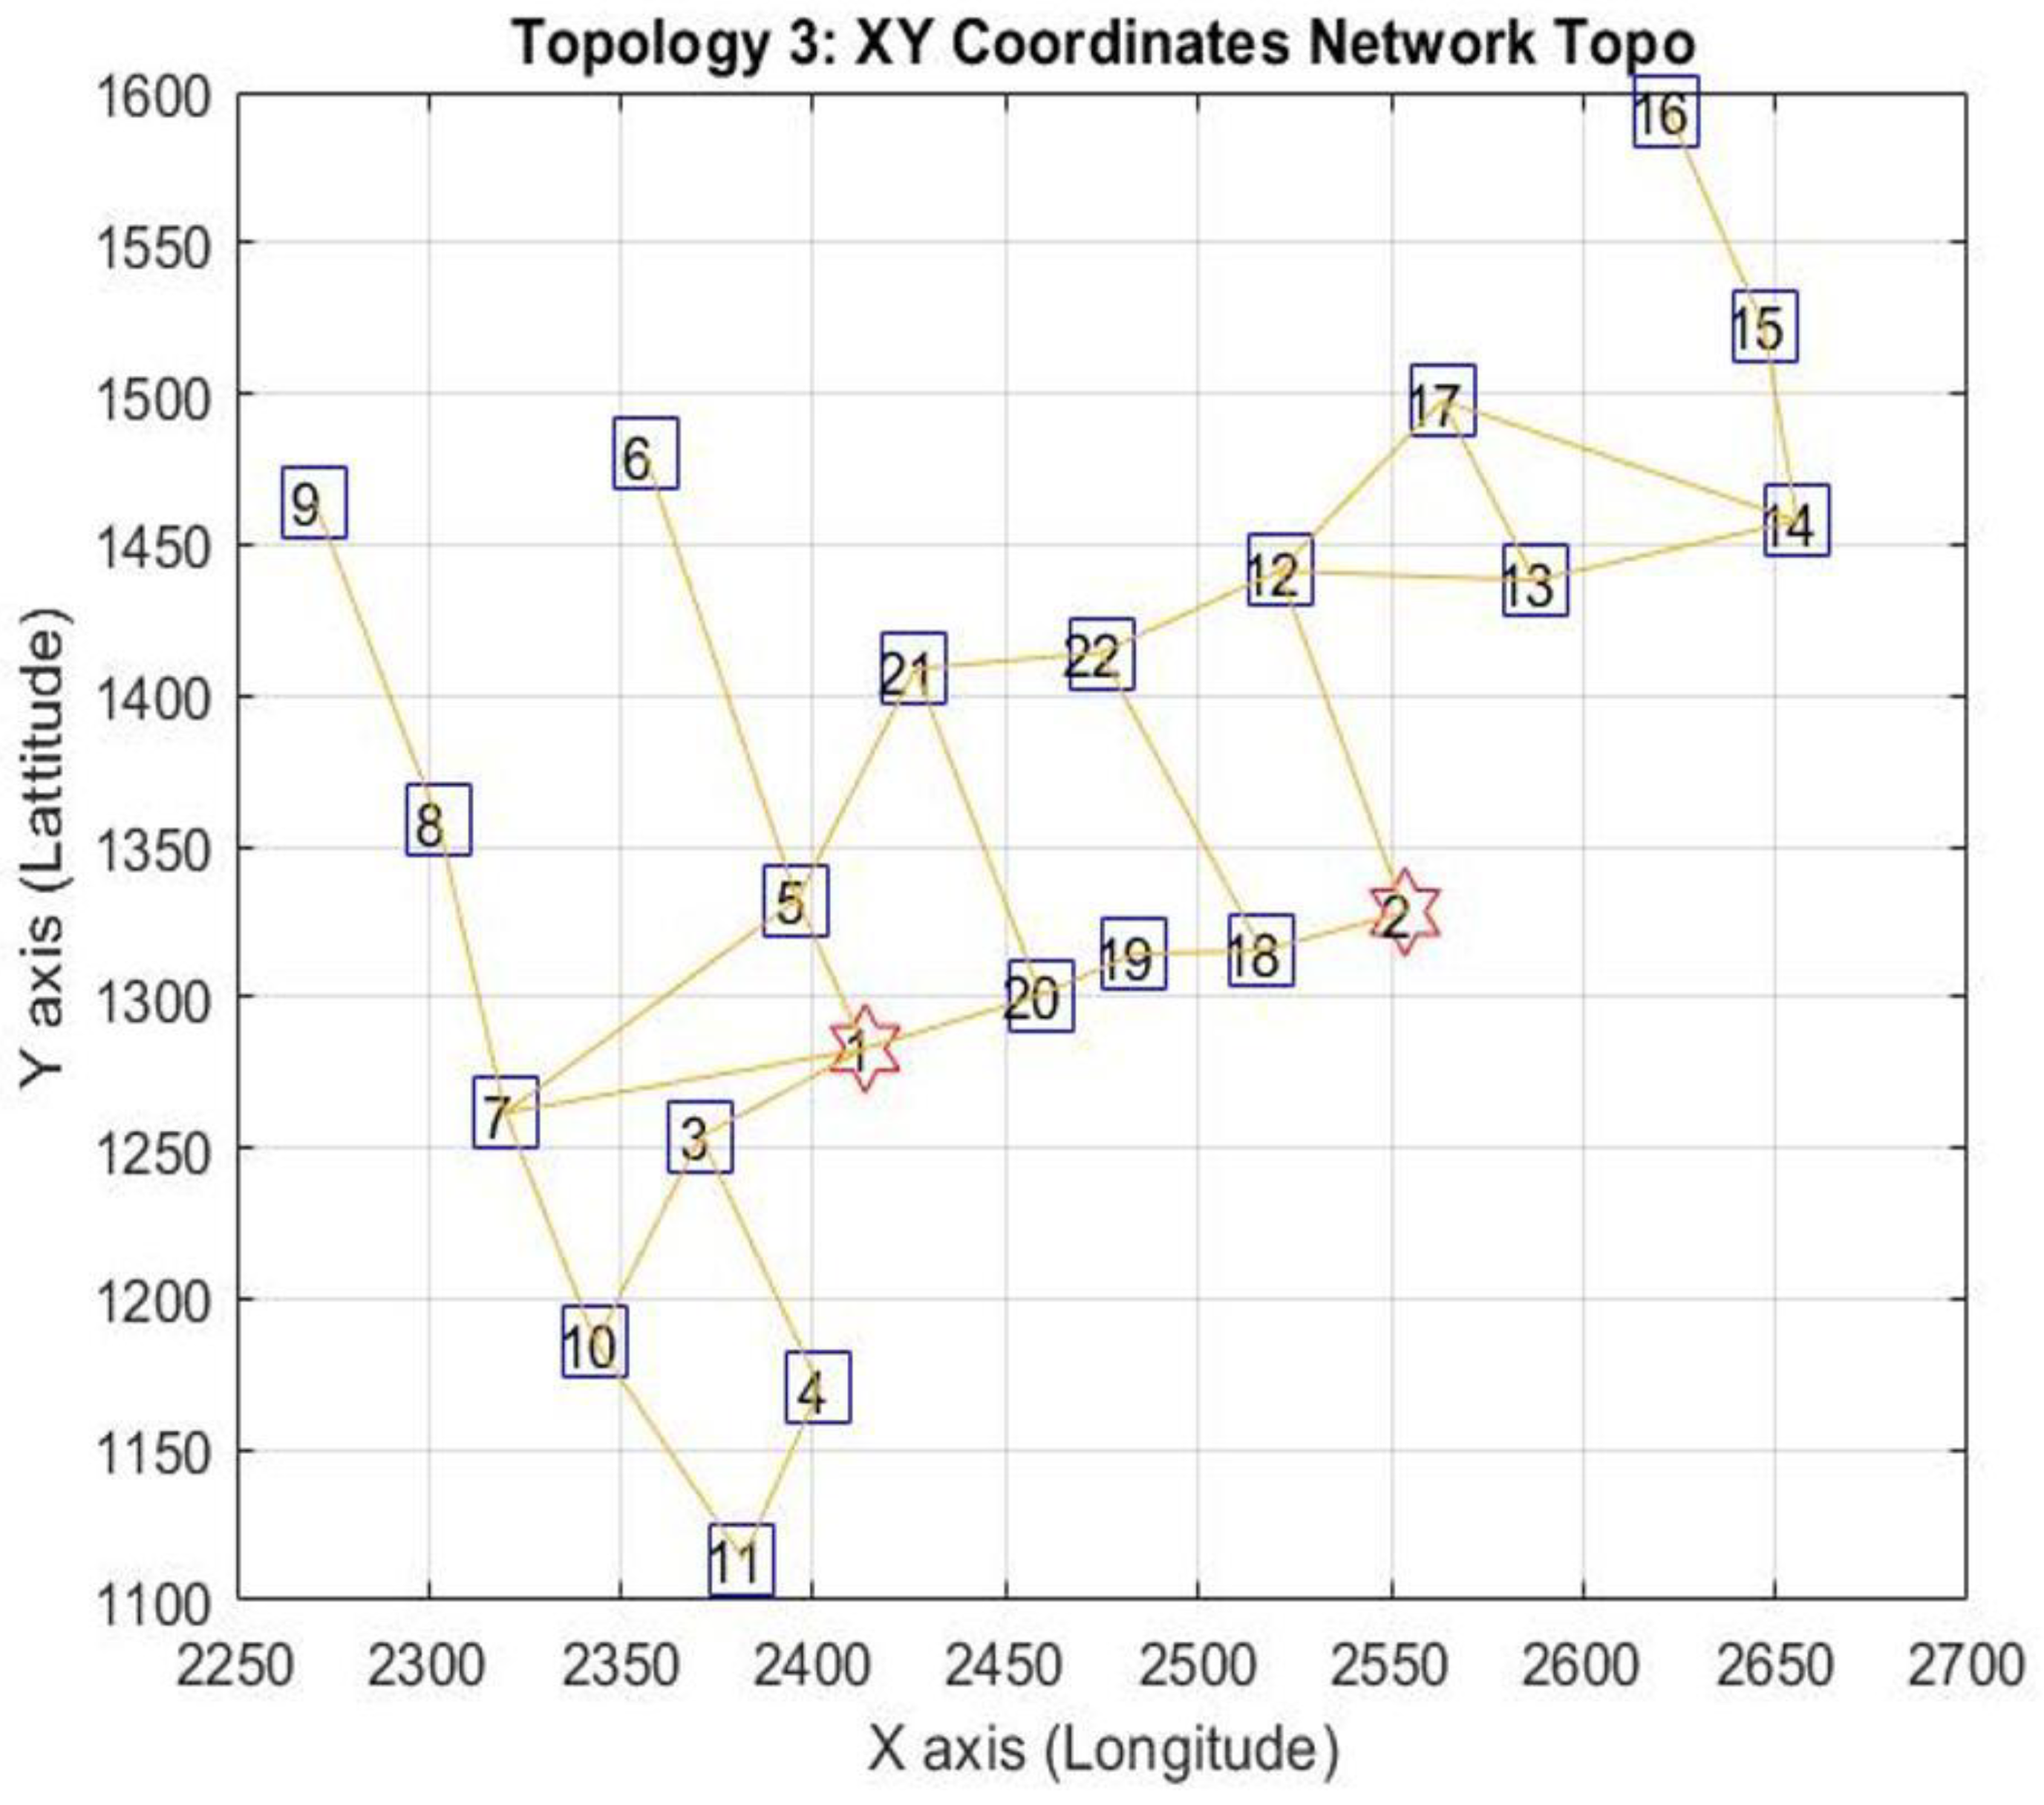
3.2.1. Phoenix Road Deployment

For our experiment, we selected a portion of the Liverpool 5G network that was deployed around Phoenix Primary School to support various educational use cases and applications. A physical map of the area is shown in Figure 3 below.
As shown in the figure, there are 2 MG POPs in the network (the orange points) and a total of 20 further MR core nodes that serve the area. The nodes are deployed on streets where a line of sight is available, with intermediate nodes both providing connectivity and relaying traffic back to a single POP. We have modelled this deployment more clearly in our MATLAB-based simulator implemented in the context of the Liverpool 5G project [21] (shown in Figure 4).
This clearly shows the potential issue with this configuration, as some edge nodes (e.g., #16 in the top right) must traverse up to five hops in order to reach the POP. This potentially introduces significant issues in terms of performance and reliability as traffic is aggregated around the core links, like 2–12, and any failure in an intermediate node will result in the loss of connectivity to any interconnected points.

3.2.2. WMN Optimisation Constraints

Thus, we modelled our experiment using this physical deployment as a starting point, allowing us to measure performance characteristics and then consider optimisations. First, however, we use this section to set out the constraints that our experiment must respect, as far as possible, to maintain the realistic nature of the test. In summary, our constraints can be listed as follows:
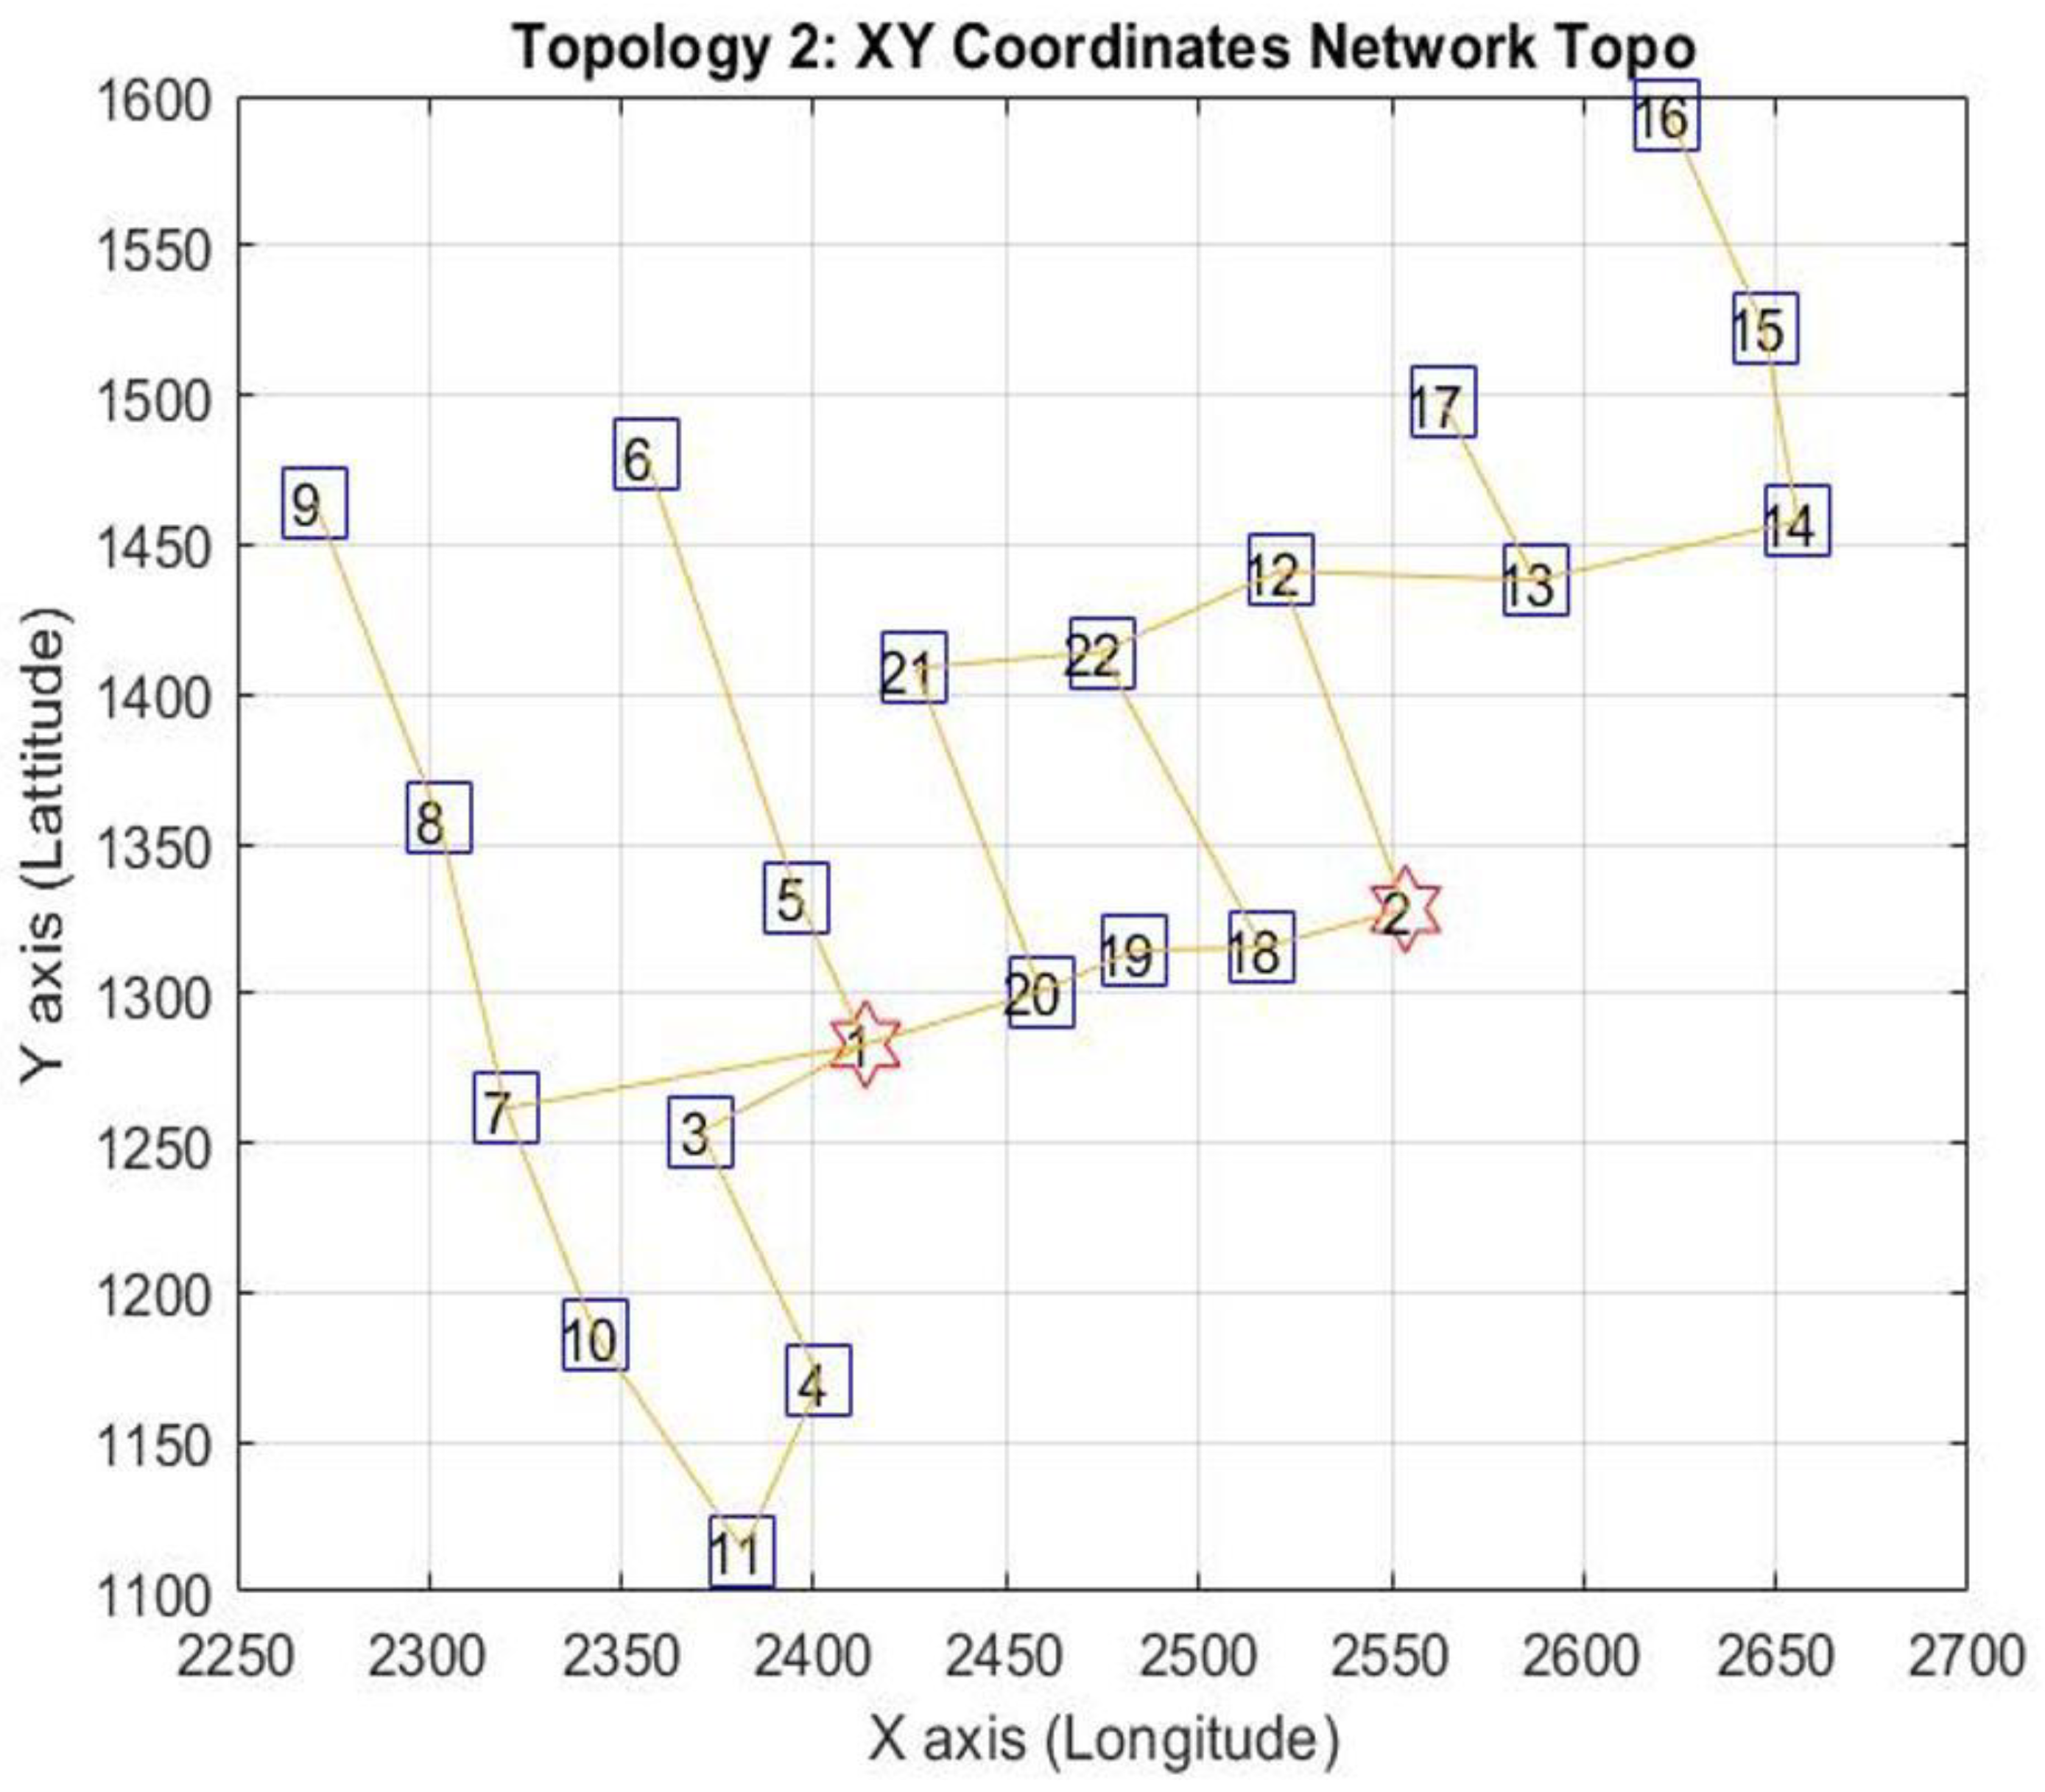
  • All nodes (MG and MR) in the deployment are fixed and cannot move.
  • Each node has a fixed degree of interconnectedness with the surrounding nodes, which are predetermined in advance based on LOS restrictions.
  • However, we assume that nodes may have multiple interfaces that are not always active based on the clustering configuration.
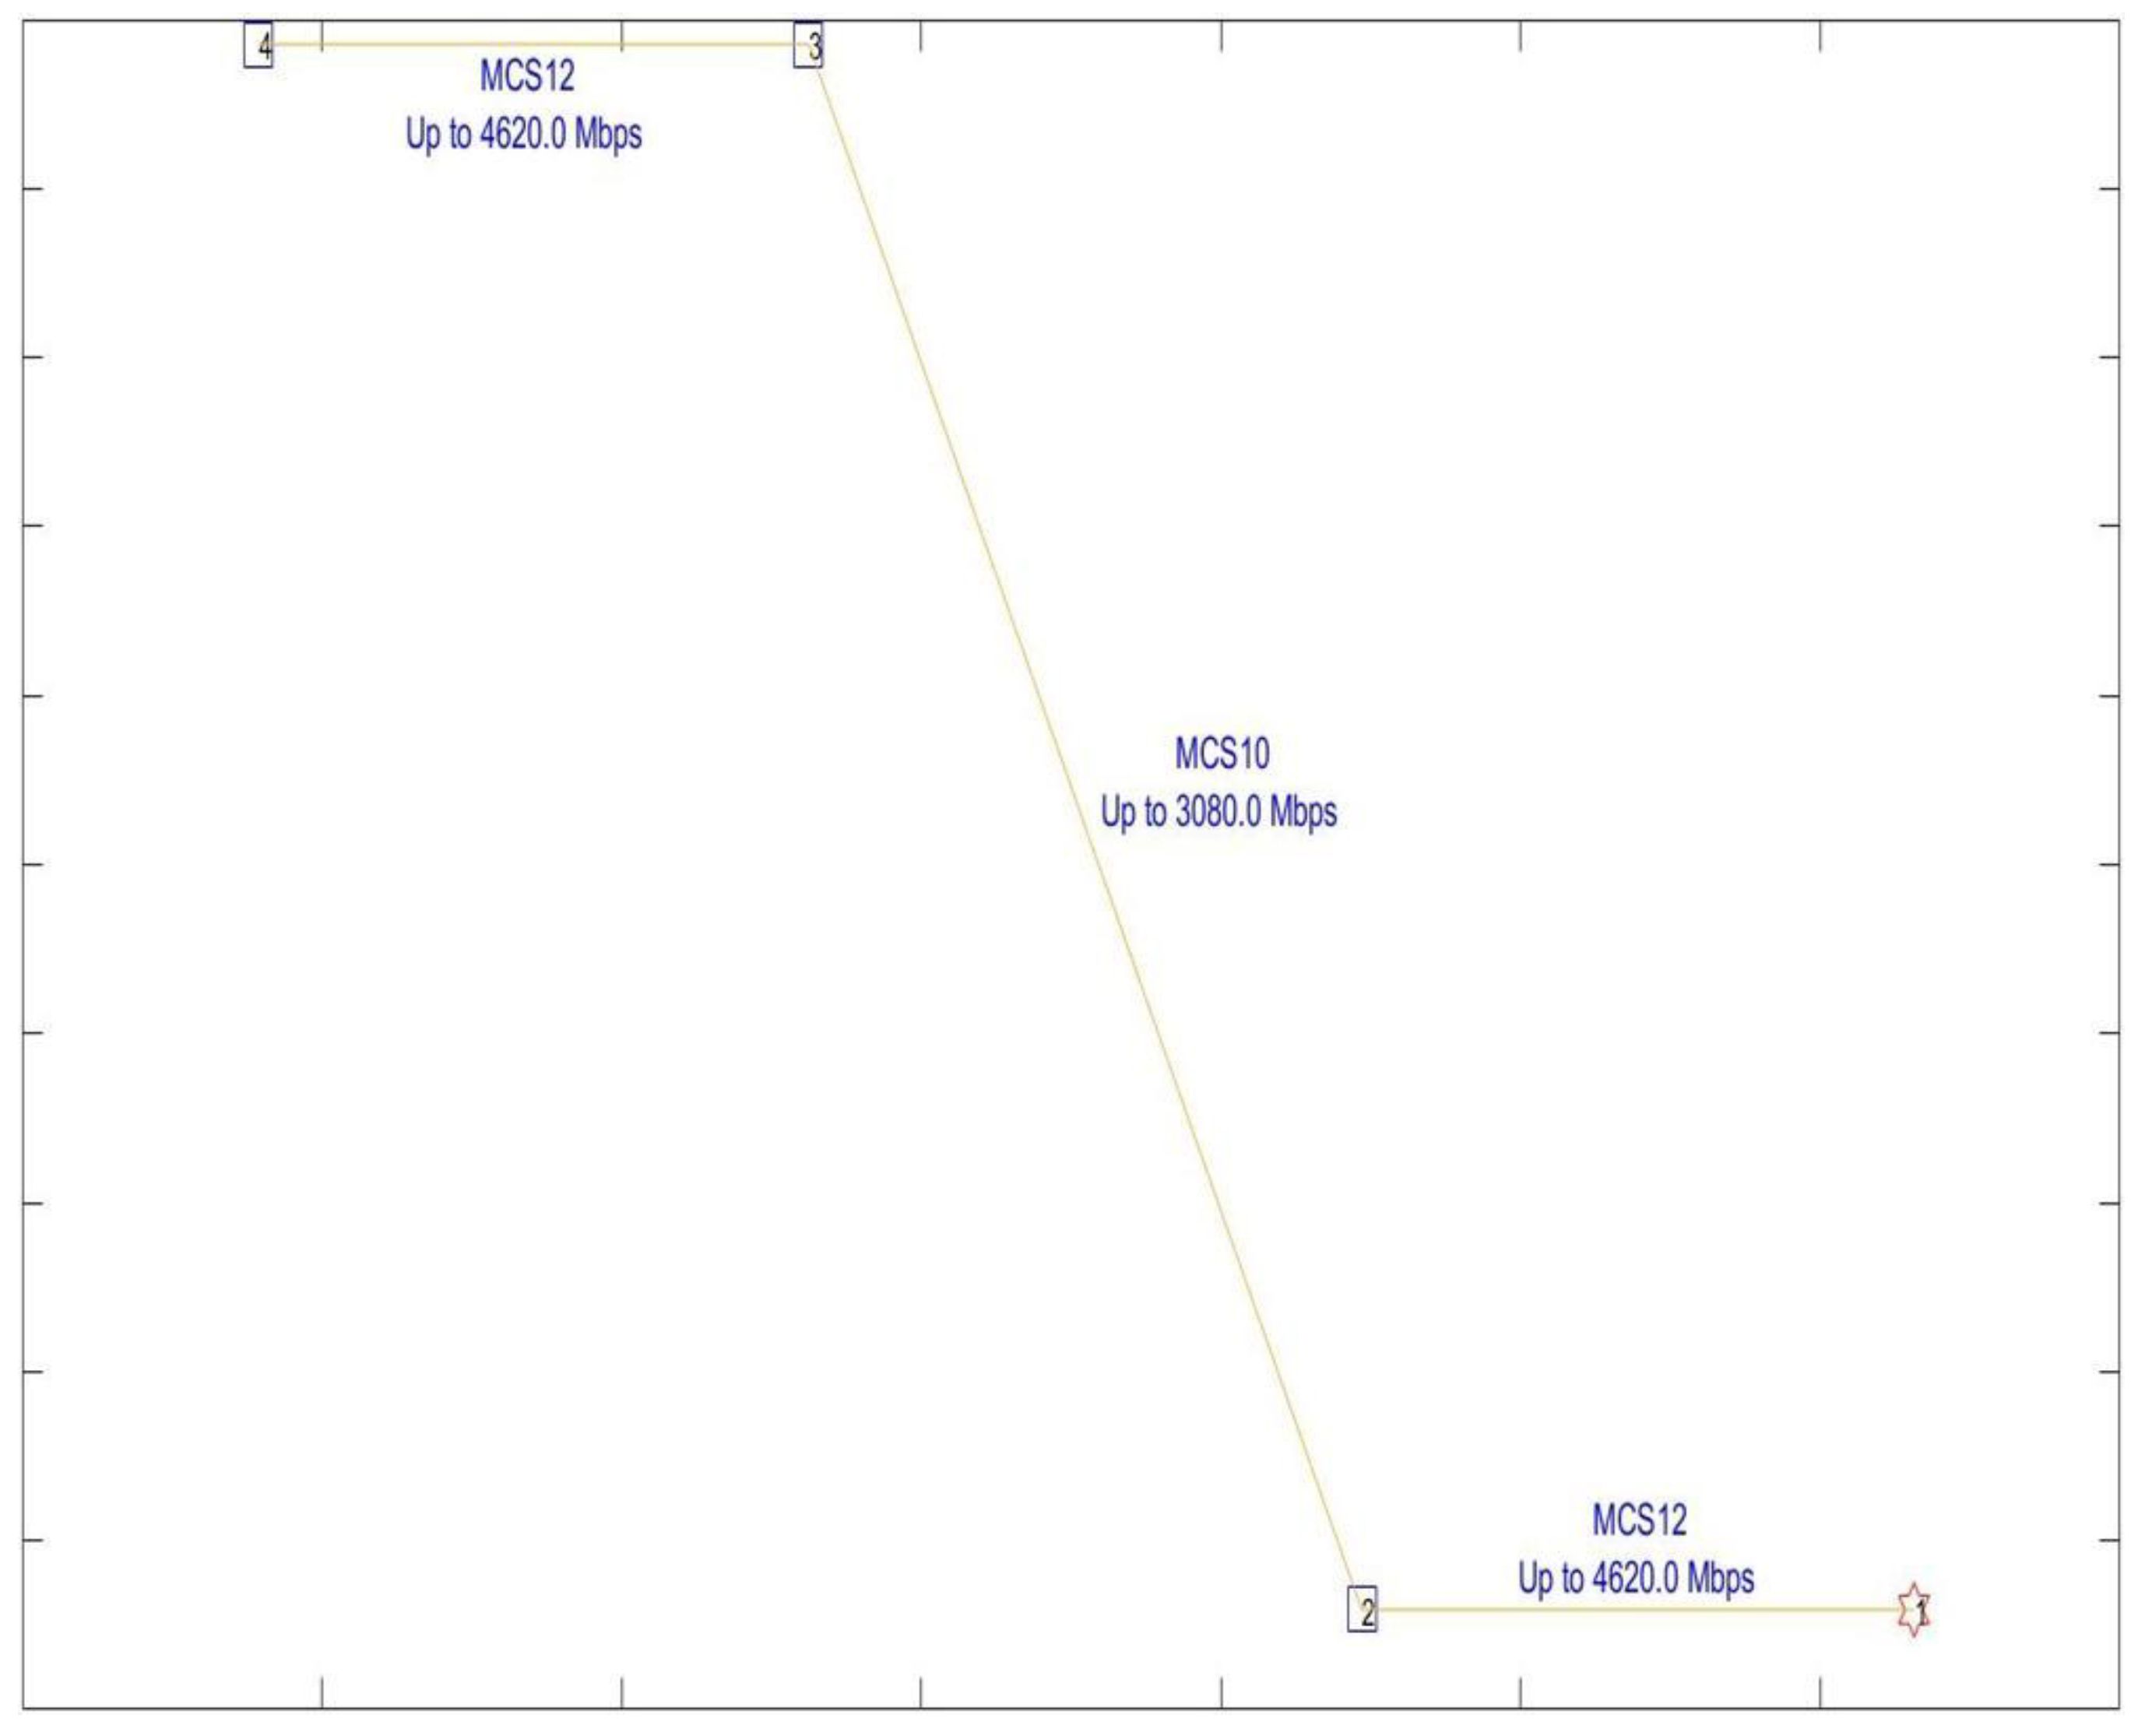
  • The deployment uses 802.11ad 60 GHz links that are optimised using beamforming to provide point-to-point connectivity as provided by the vendor’s equipment [44].
  • The deployment is configured such that neighbouring links use separate channels so that interference is not a realistic consideration; for example, link 18–19 will not interfere with link 19–20. The considered channels are centred at 60.48 GHz and 62.64 GHz.
  • The links’ performance is bounded by the constraints we have modelled through our ongoing network-modelling research, which is reported in [21].
  • For the purposes of our experiment, new links may be added between nodes where physical LOS is not currently possible. In each case, we assume the link will exhibit similar properties based on technology and the link distance in a street canyon path loss model [45]. This model allows us to represent the typical urban scenario in Liverpool: a city street with pedestrian sidewalks alongside long tall buildings. In the street canyon channel model, there are two dominant reflected rays, in addition to the direct link, that are considered: the ground-reflected ray and the wall-reflected ray. Furthermore, the random components that represent reflection scattering are considered in the link simulation. The reflection from the distant walls and second-order reflection are taken into account as random components.
Using this problem description as a basis, in the next section we introduce our experiment with incrementally additional degrees of meshing.

4. Meshed Network Deployments

In the first case, we considered the actual network deployment around Phoenix Street, which is shown in Figure 4 and is labelled Topology 1. To build upon this, we then developed two further configurations that were increasingly meshed, yielding more routes between nodes and towards the POPs, i.e., nodes 1 and 2 in Figure 4. The first configuration is illustrated in Figure 5 (labelled Topology 2), while the second is shown in Figure 6 (labelled Topology 3). Then, we compared the above three topologies composed of 22 nodes but an increasing number of links, namely, Topology1 with 40 links (interfaces), Topology 2 with 48 links, and Topology 3 with 58 links, to determine if the network performs better when it is more densely meshed and, if so, to what degree.
At this stage, we acknowledge that additional deployment and operation overheads would be incurred as a result of this scheme but expect that the benefits in terms of improved resilience, capacity, and performance will ultimately prove that densification is worthwhile (up to a point). The additional links in Topologies 2 and 3 were selected as they represented reasonable meshing opportunities, e.g., at the end of streets, if new interfaces could be added to the nodes. Note that this was performed simply as a proof of concept for this paper and does not benefit from an analysis based on site surveys, power requirements, physical access, etc., which go beyond the scope of the paper.
In order to determine the optimal degree of meshing for the Liverpool 5G network, we considered a standard version of Dijkstra’s shortest path algorithm [46], for which the pseudocode implemented for this study is illustrated in Figure 7. In the figure, T is a graph made up of the nodes in the deployment which serve as vertices, while the links that connect them serve as edges; S represents a set for each link i including the source node si and the destination node di; pi is the selected shortest path from si to di; and R is the output of the algorithm, i.e., a tuple including pi, si, and di for each link i.

5. Experimental Simulation and Results

In this section, we analyse the risk–return trade-off that exists between increasing the number of links to provide multiple paths to the nearest POP and the performance of the network. Specifically, we consider the following parameters: (1) gross return, which is a popular metric that measures the return (i.e., gain) attributed to a particular change [47] (in this paper, we consider gross return to be the gain in terms of a set of metrics described below that we achieve when we change the topology from Topology 1 to either Topology 2 or Topology 3), and (2) risk of investment, which is defined as the chance that an investment’s actual gain will differ from its expected gain [48].
To this end, each topology was modelled in MATLAB and simulated over 20,000 time steps. At every step, each node randomly decides whether it will generate data packets (based on either an interactive HD-video (1920 × 1080 at 24 fps)-streaming session or reported sensor data (an upload of a few KB)), which are sent to the closest POP. There was no further sophistication added at this stage to represent ongoing sessions or other types of traffic in order to maintain the fairness of the tests. The topologies were then compared in terms of the following metrics:
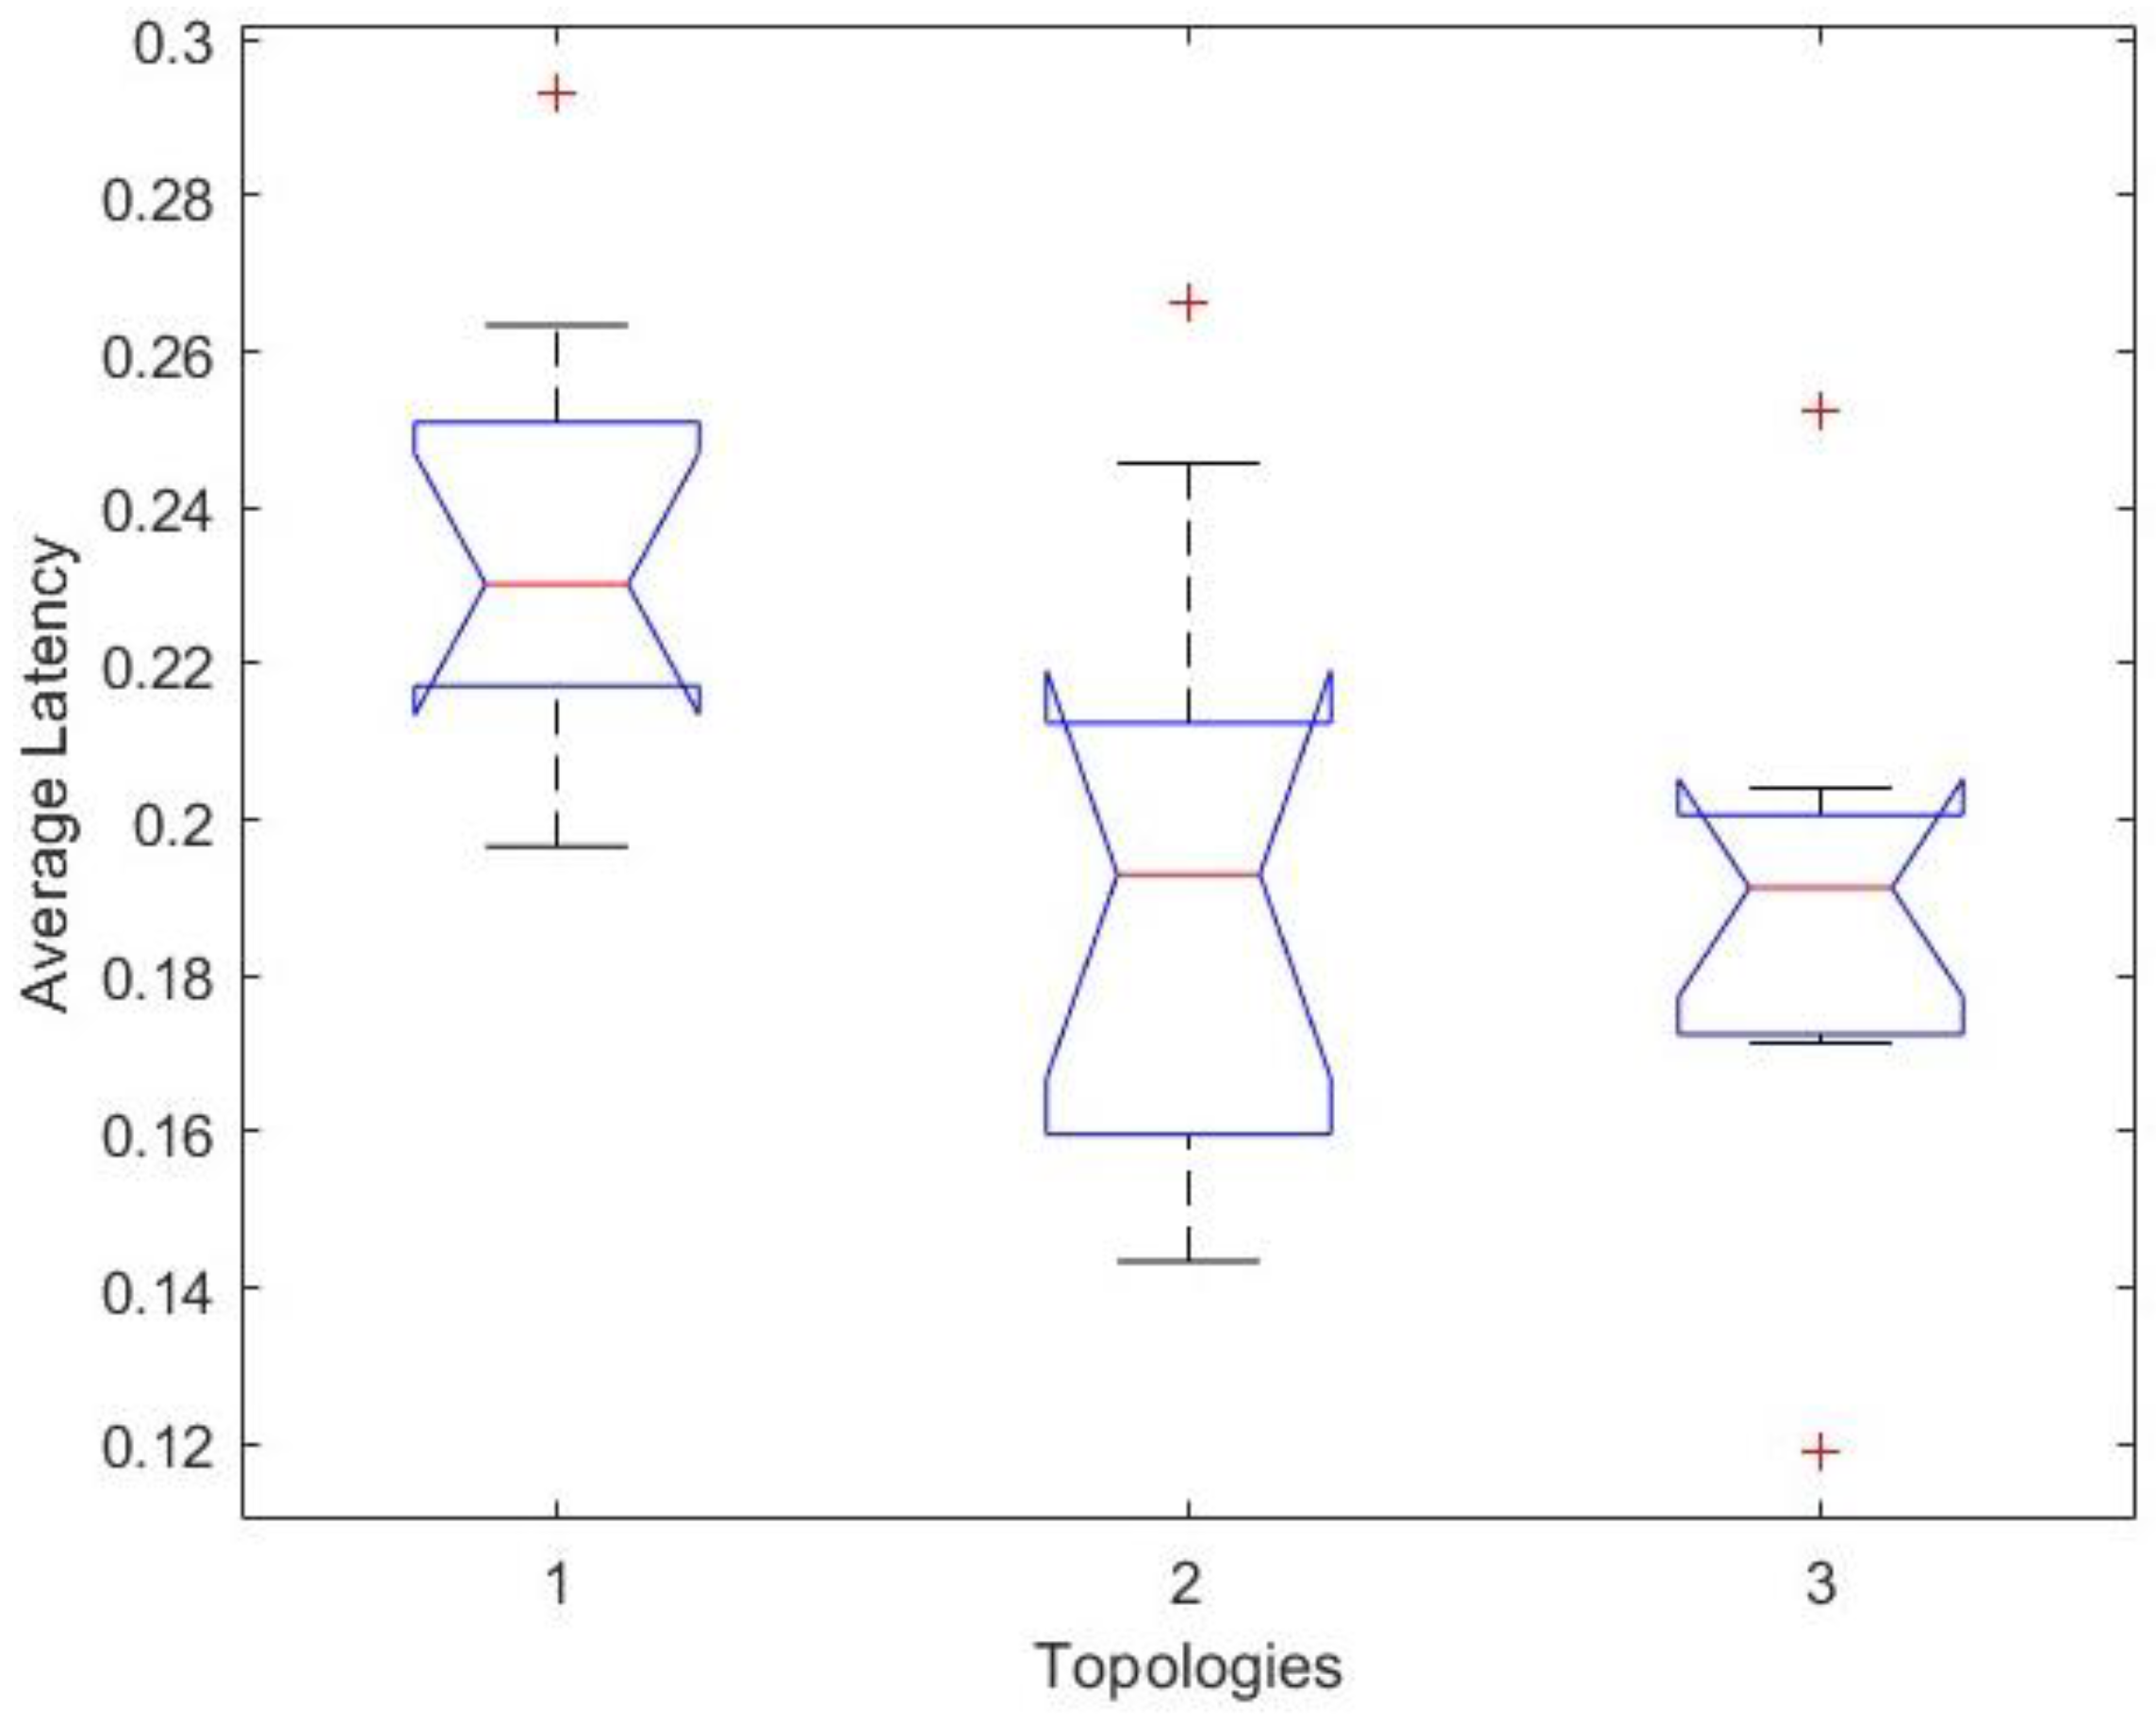
  • Average Latency—This is defined as the average time from when the packet transmission departs from the source node to when the data packet is successfully received by the POP. Latency is set to 1 ms per hop. This value is specified based on real-life measurements.
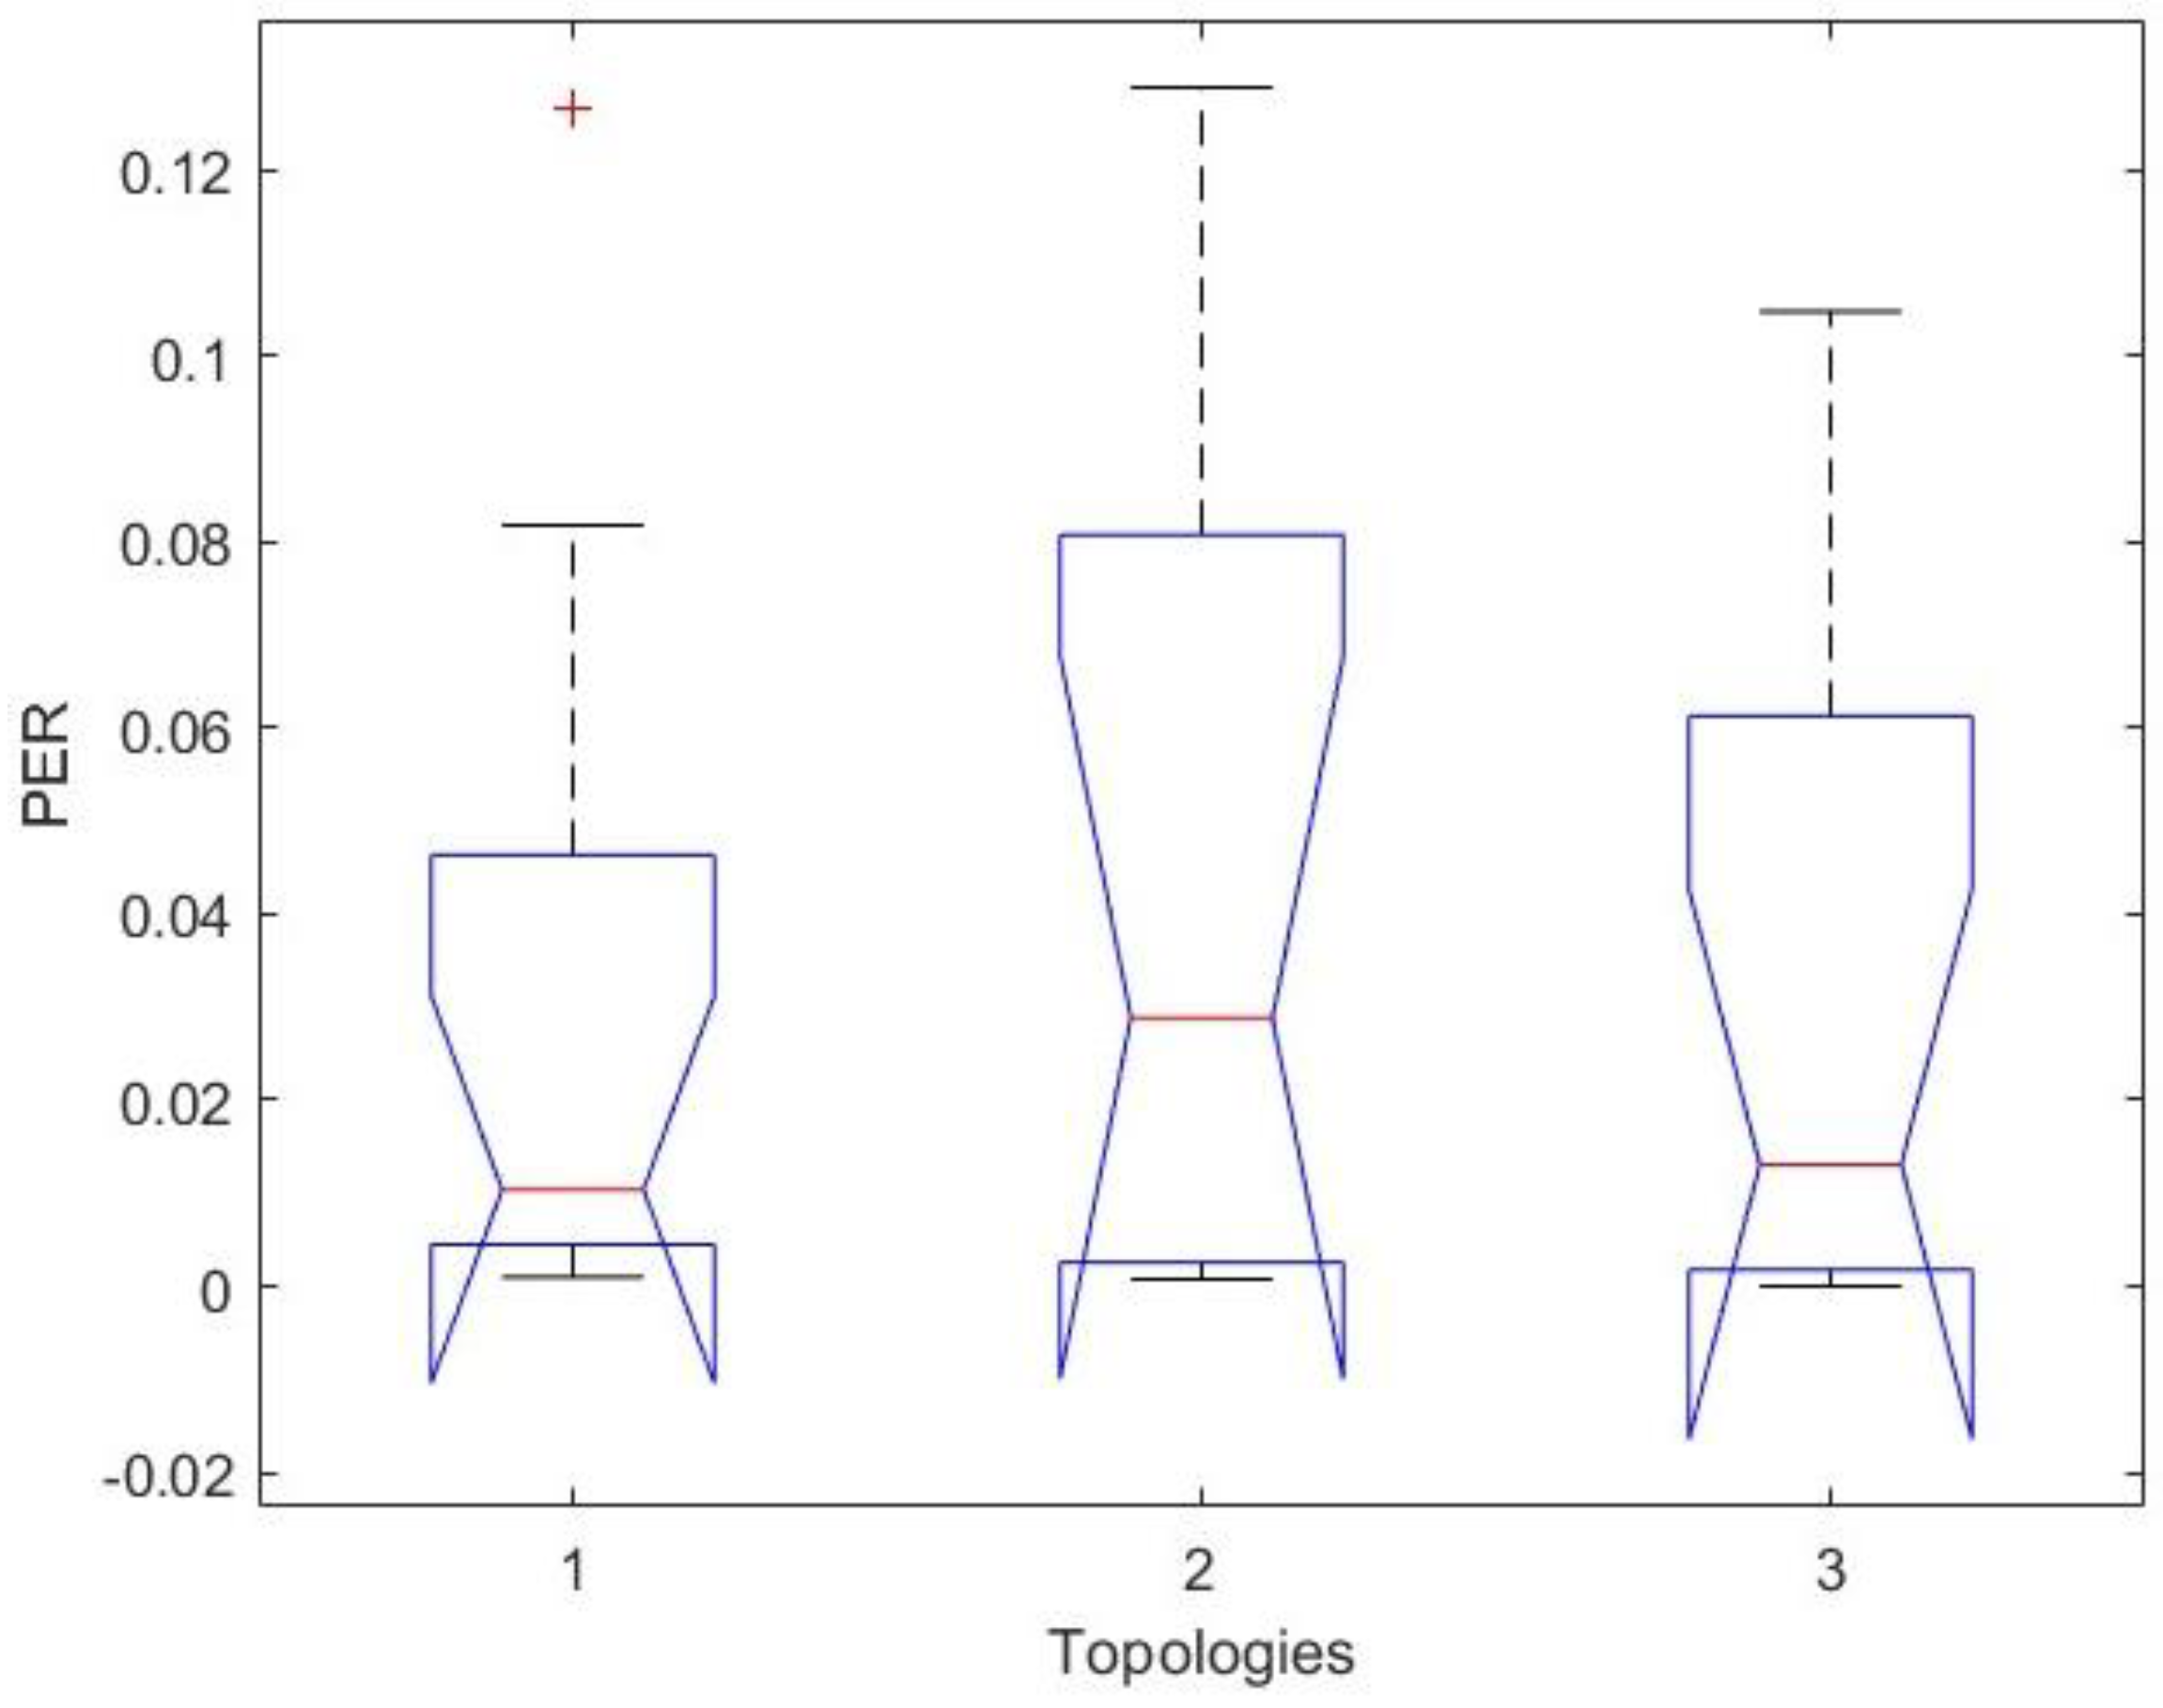
  • Packet Error Rate (PER)—This is defined as the ratio between the erroneous data packets received at the POP to the total transmitted data packets.
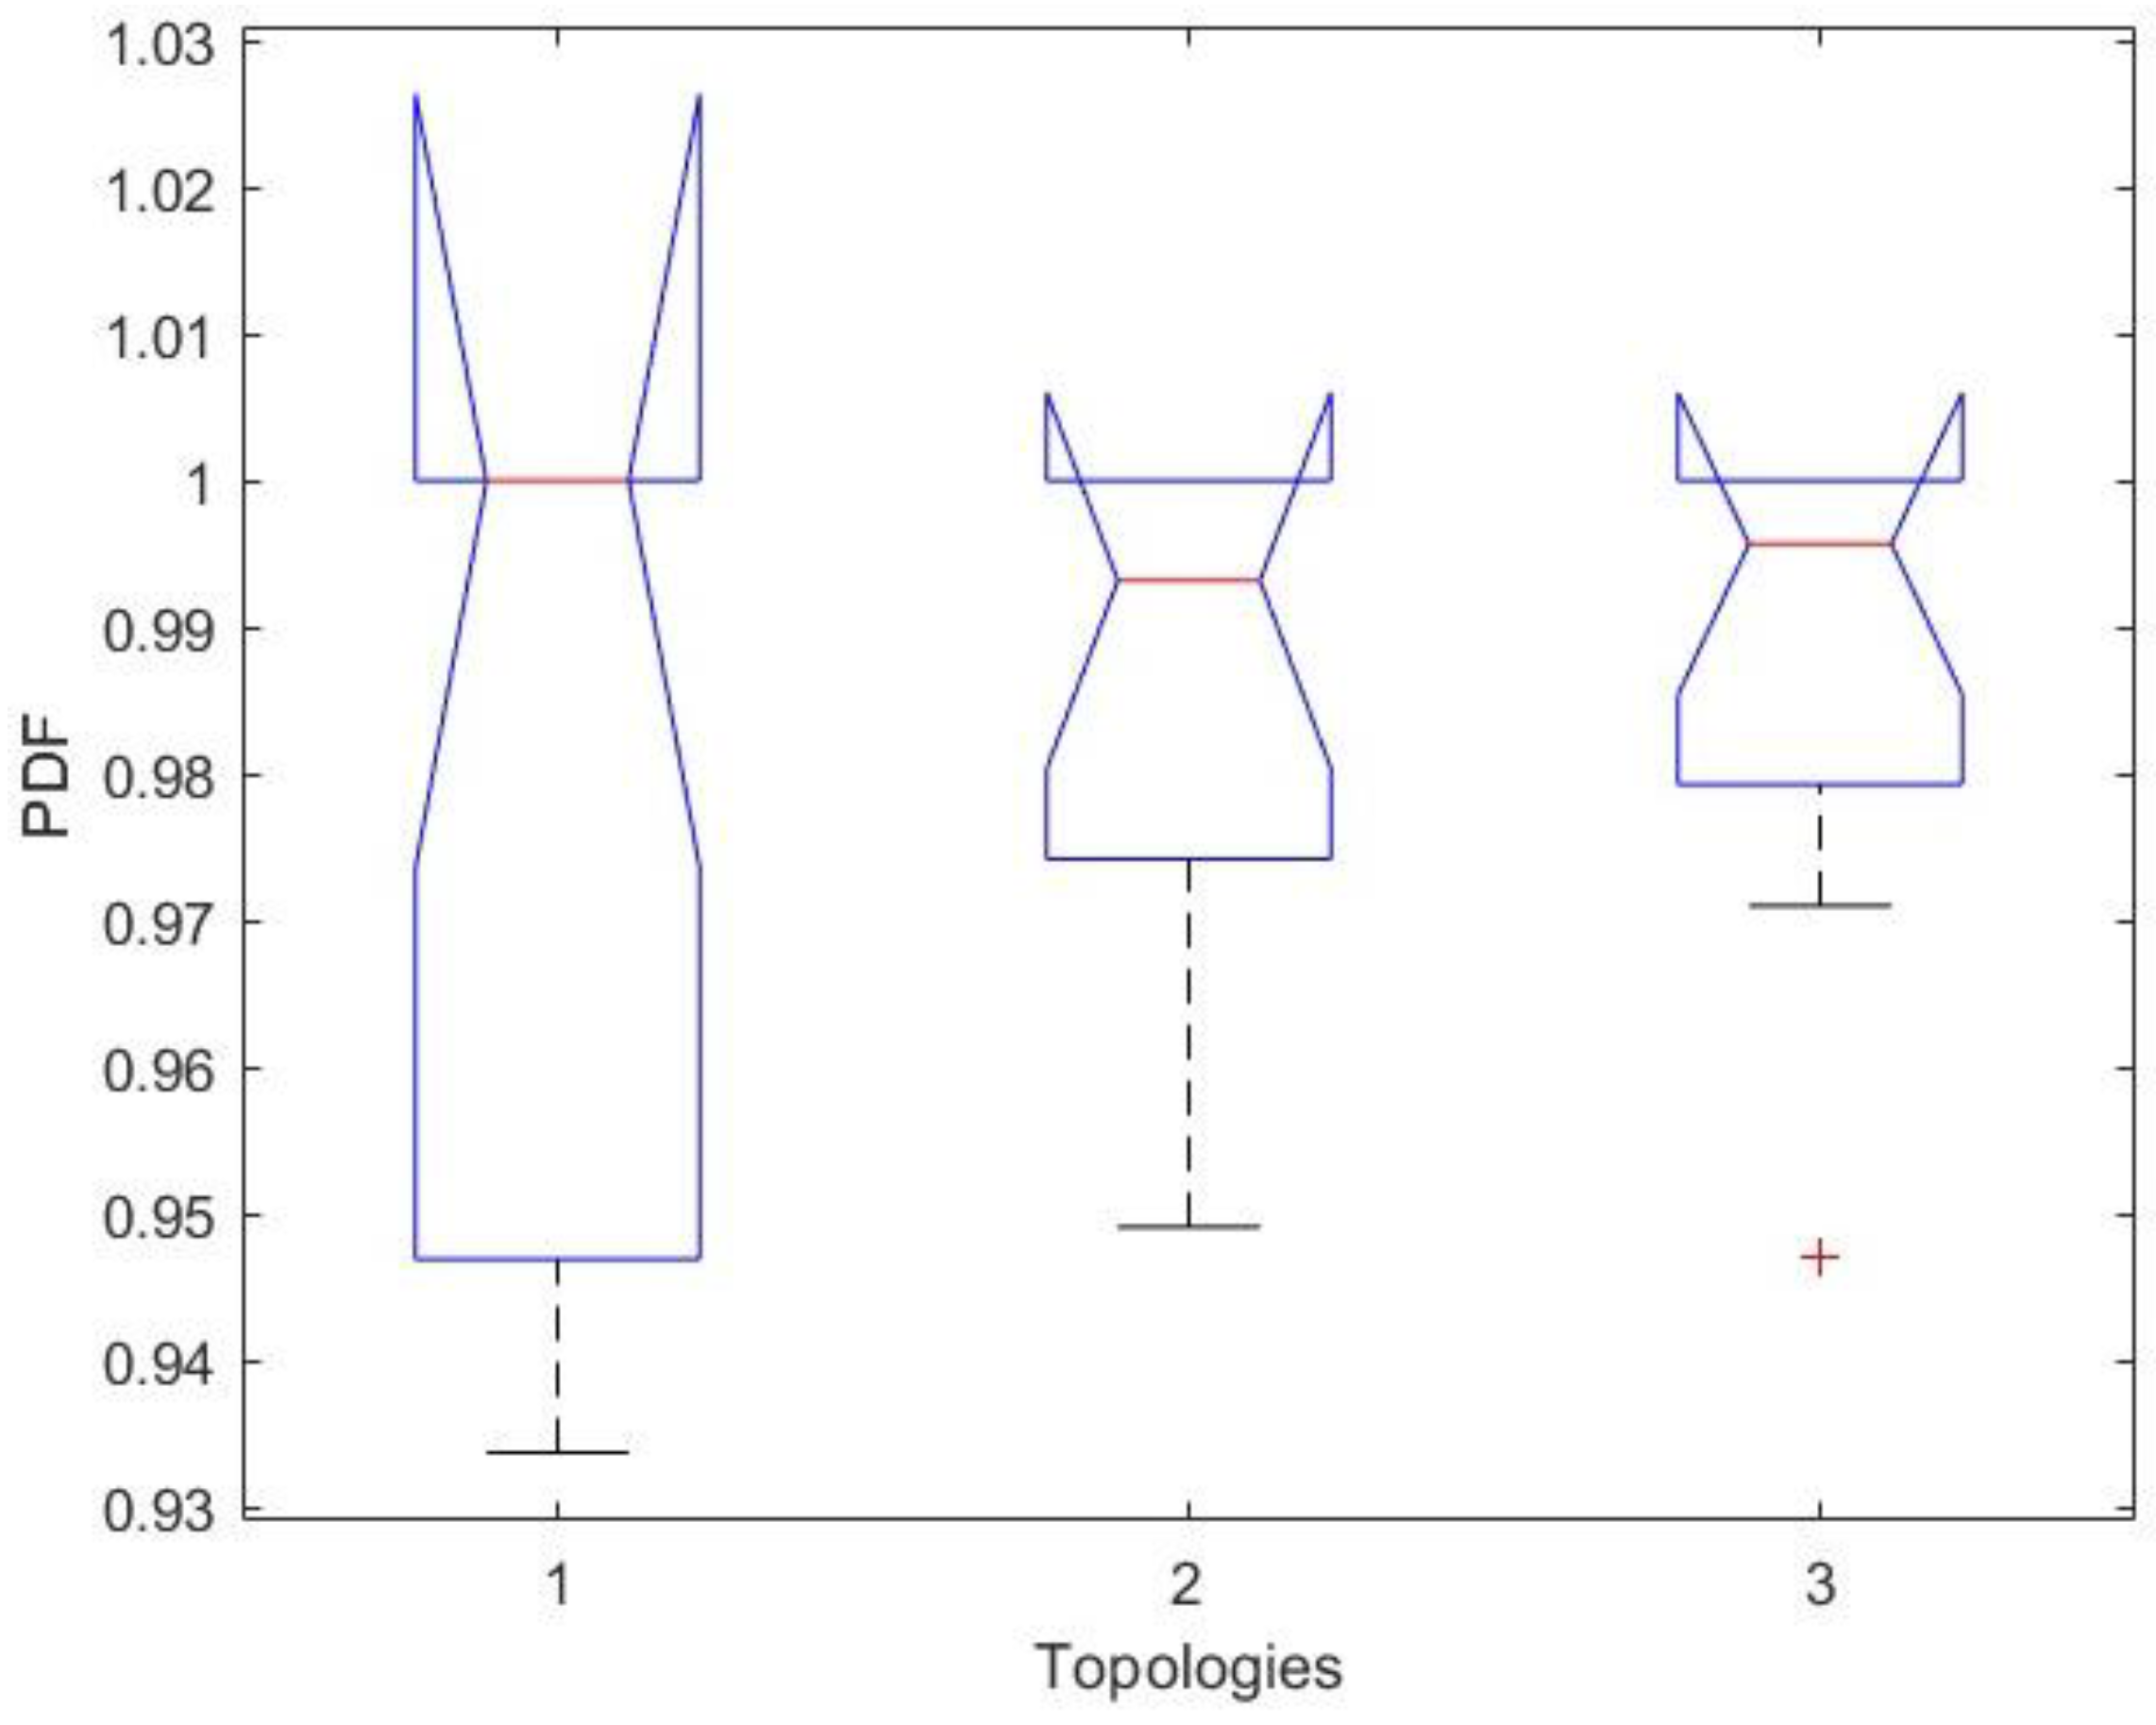
  • Packet Delivery Fraction (PDF)—This is defined as the ratio of the number of data packets correctly received by the POP to the total number of data packets generated by the source.
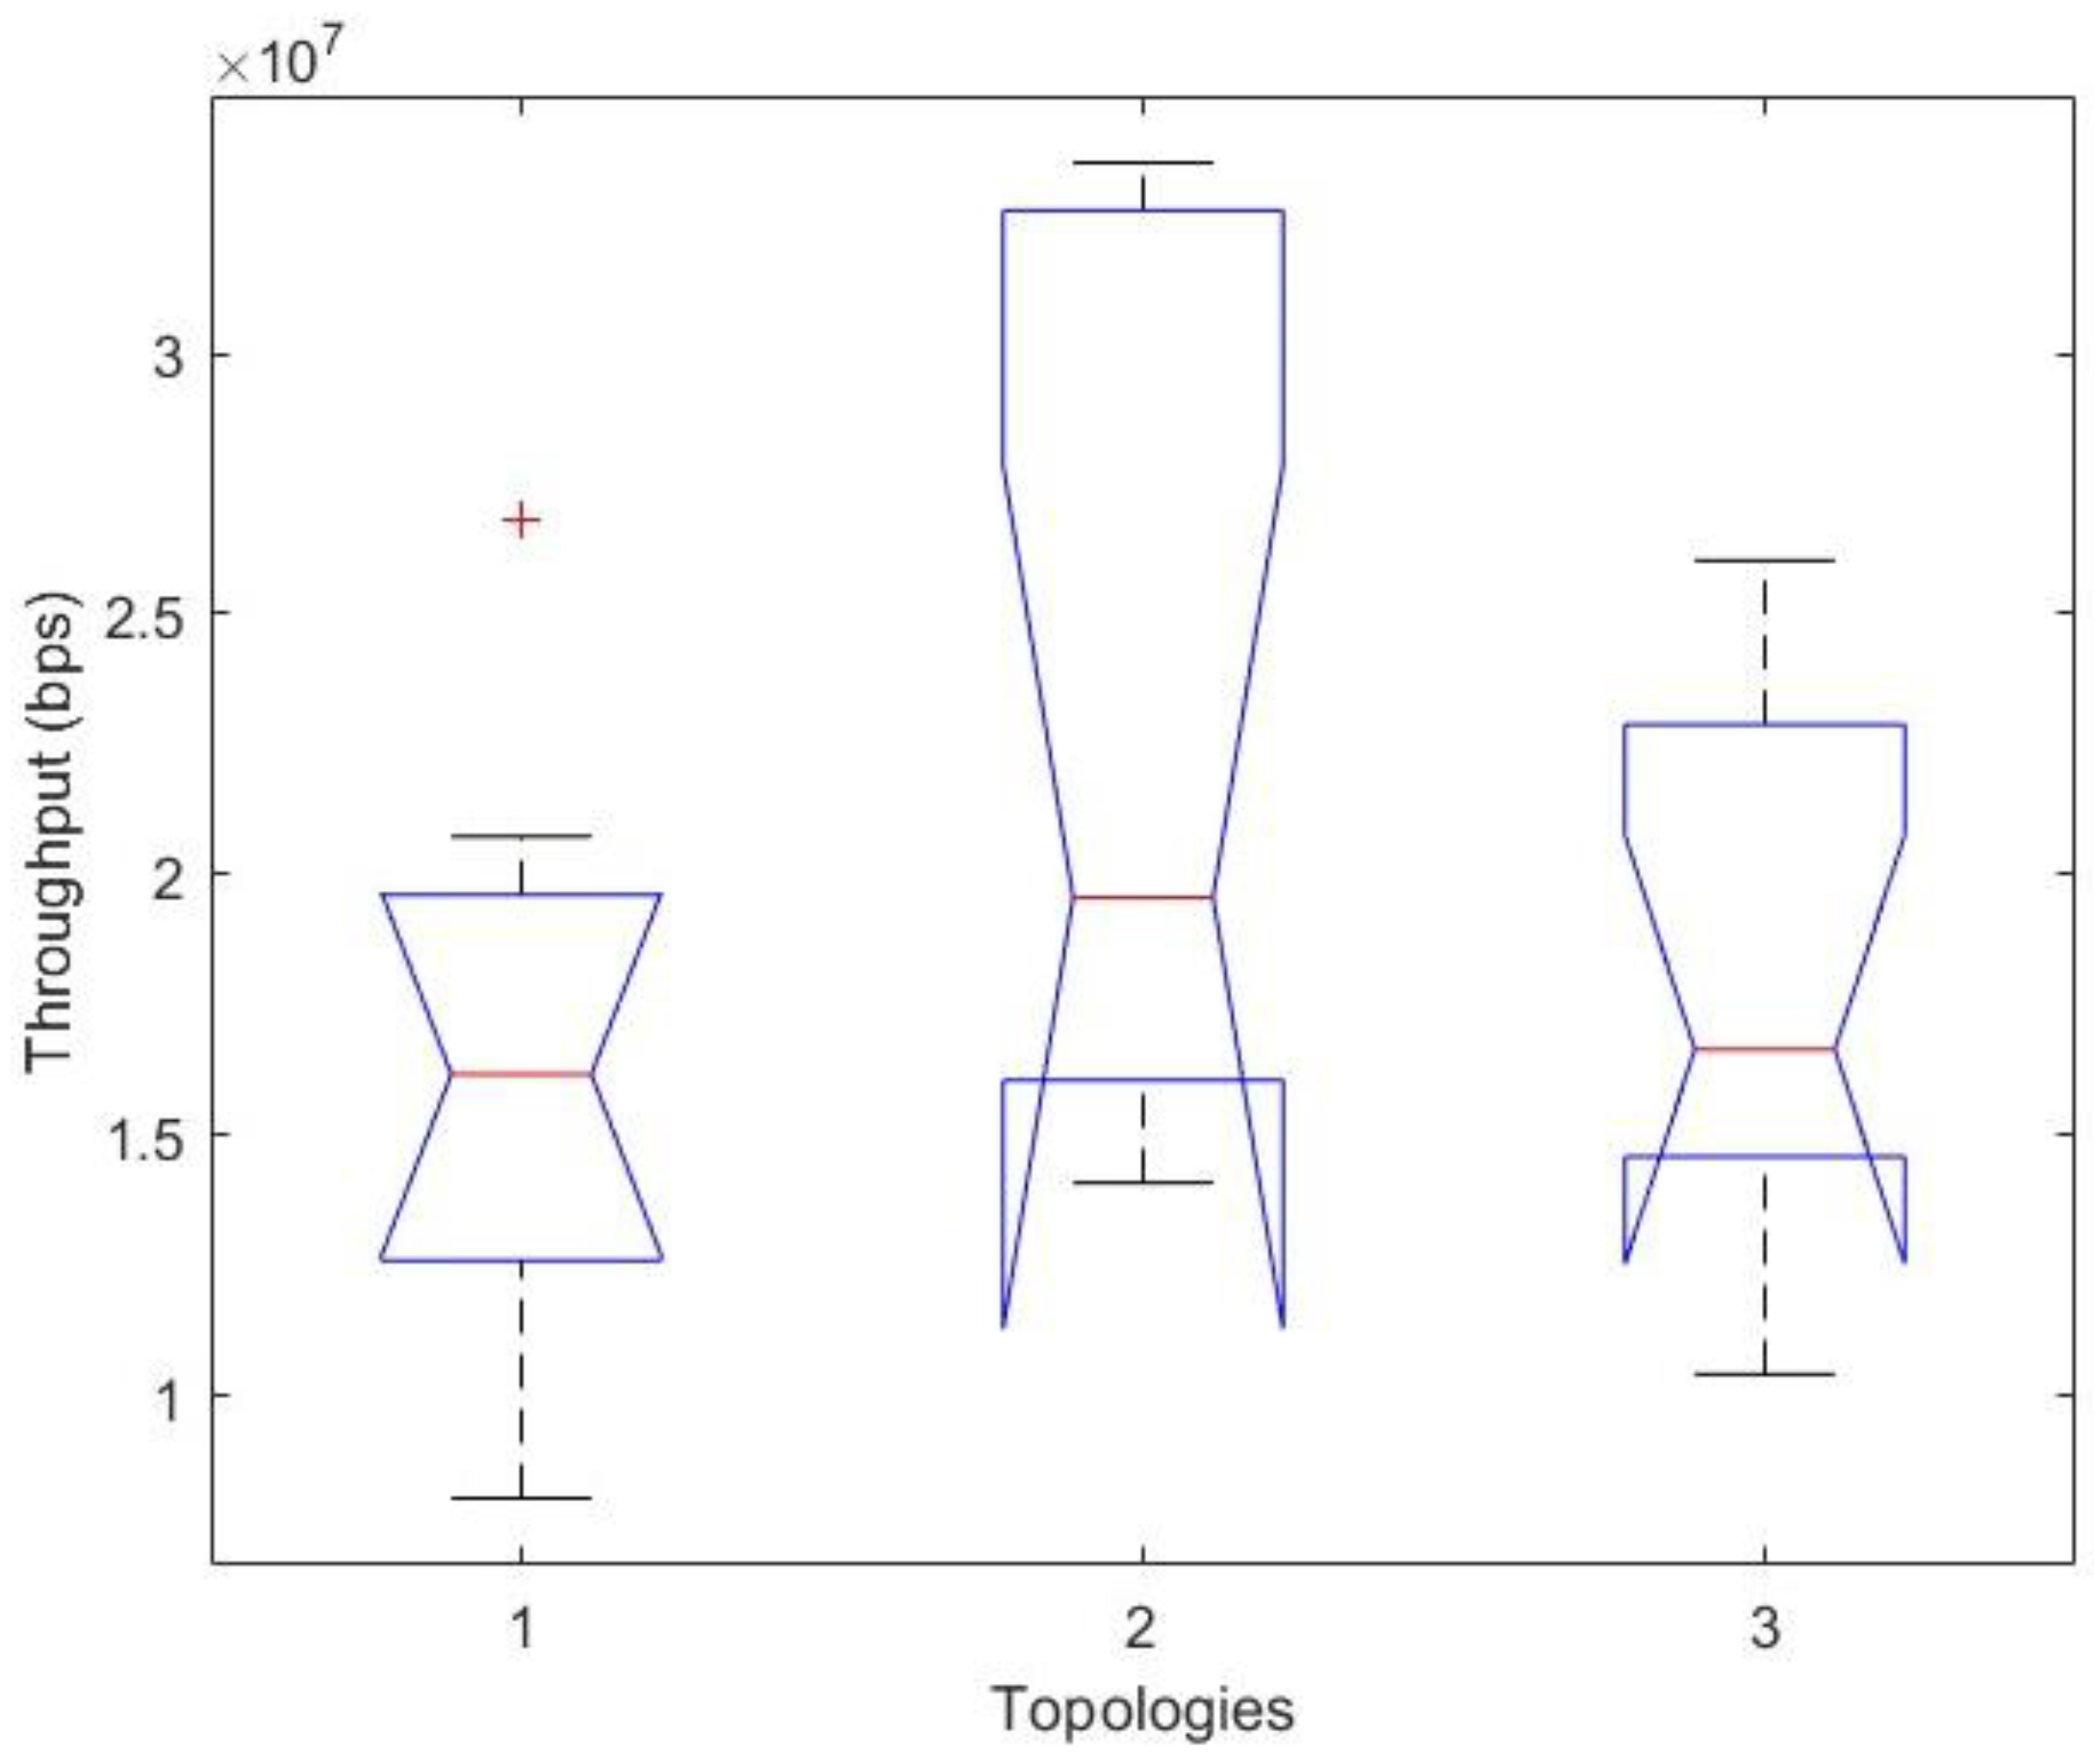
  • Throughput—This is defined as the total amount of information received at the POP divided by the total session time in bits per second (bps).
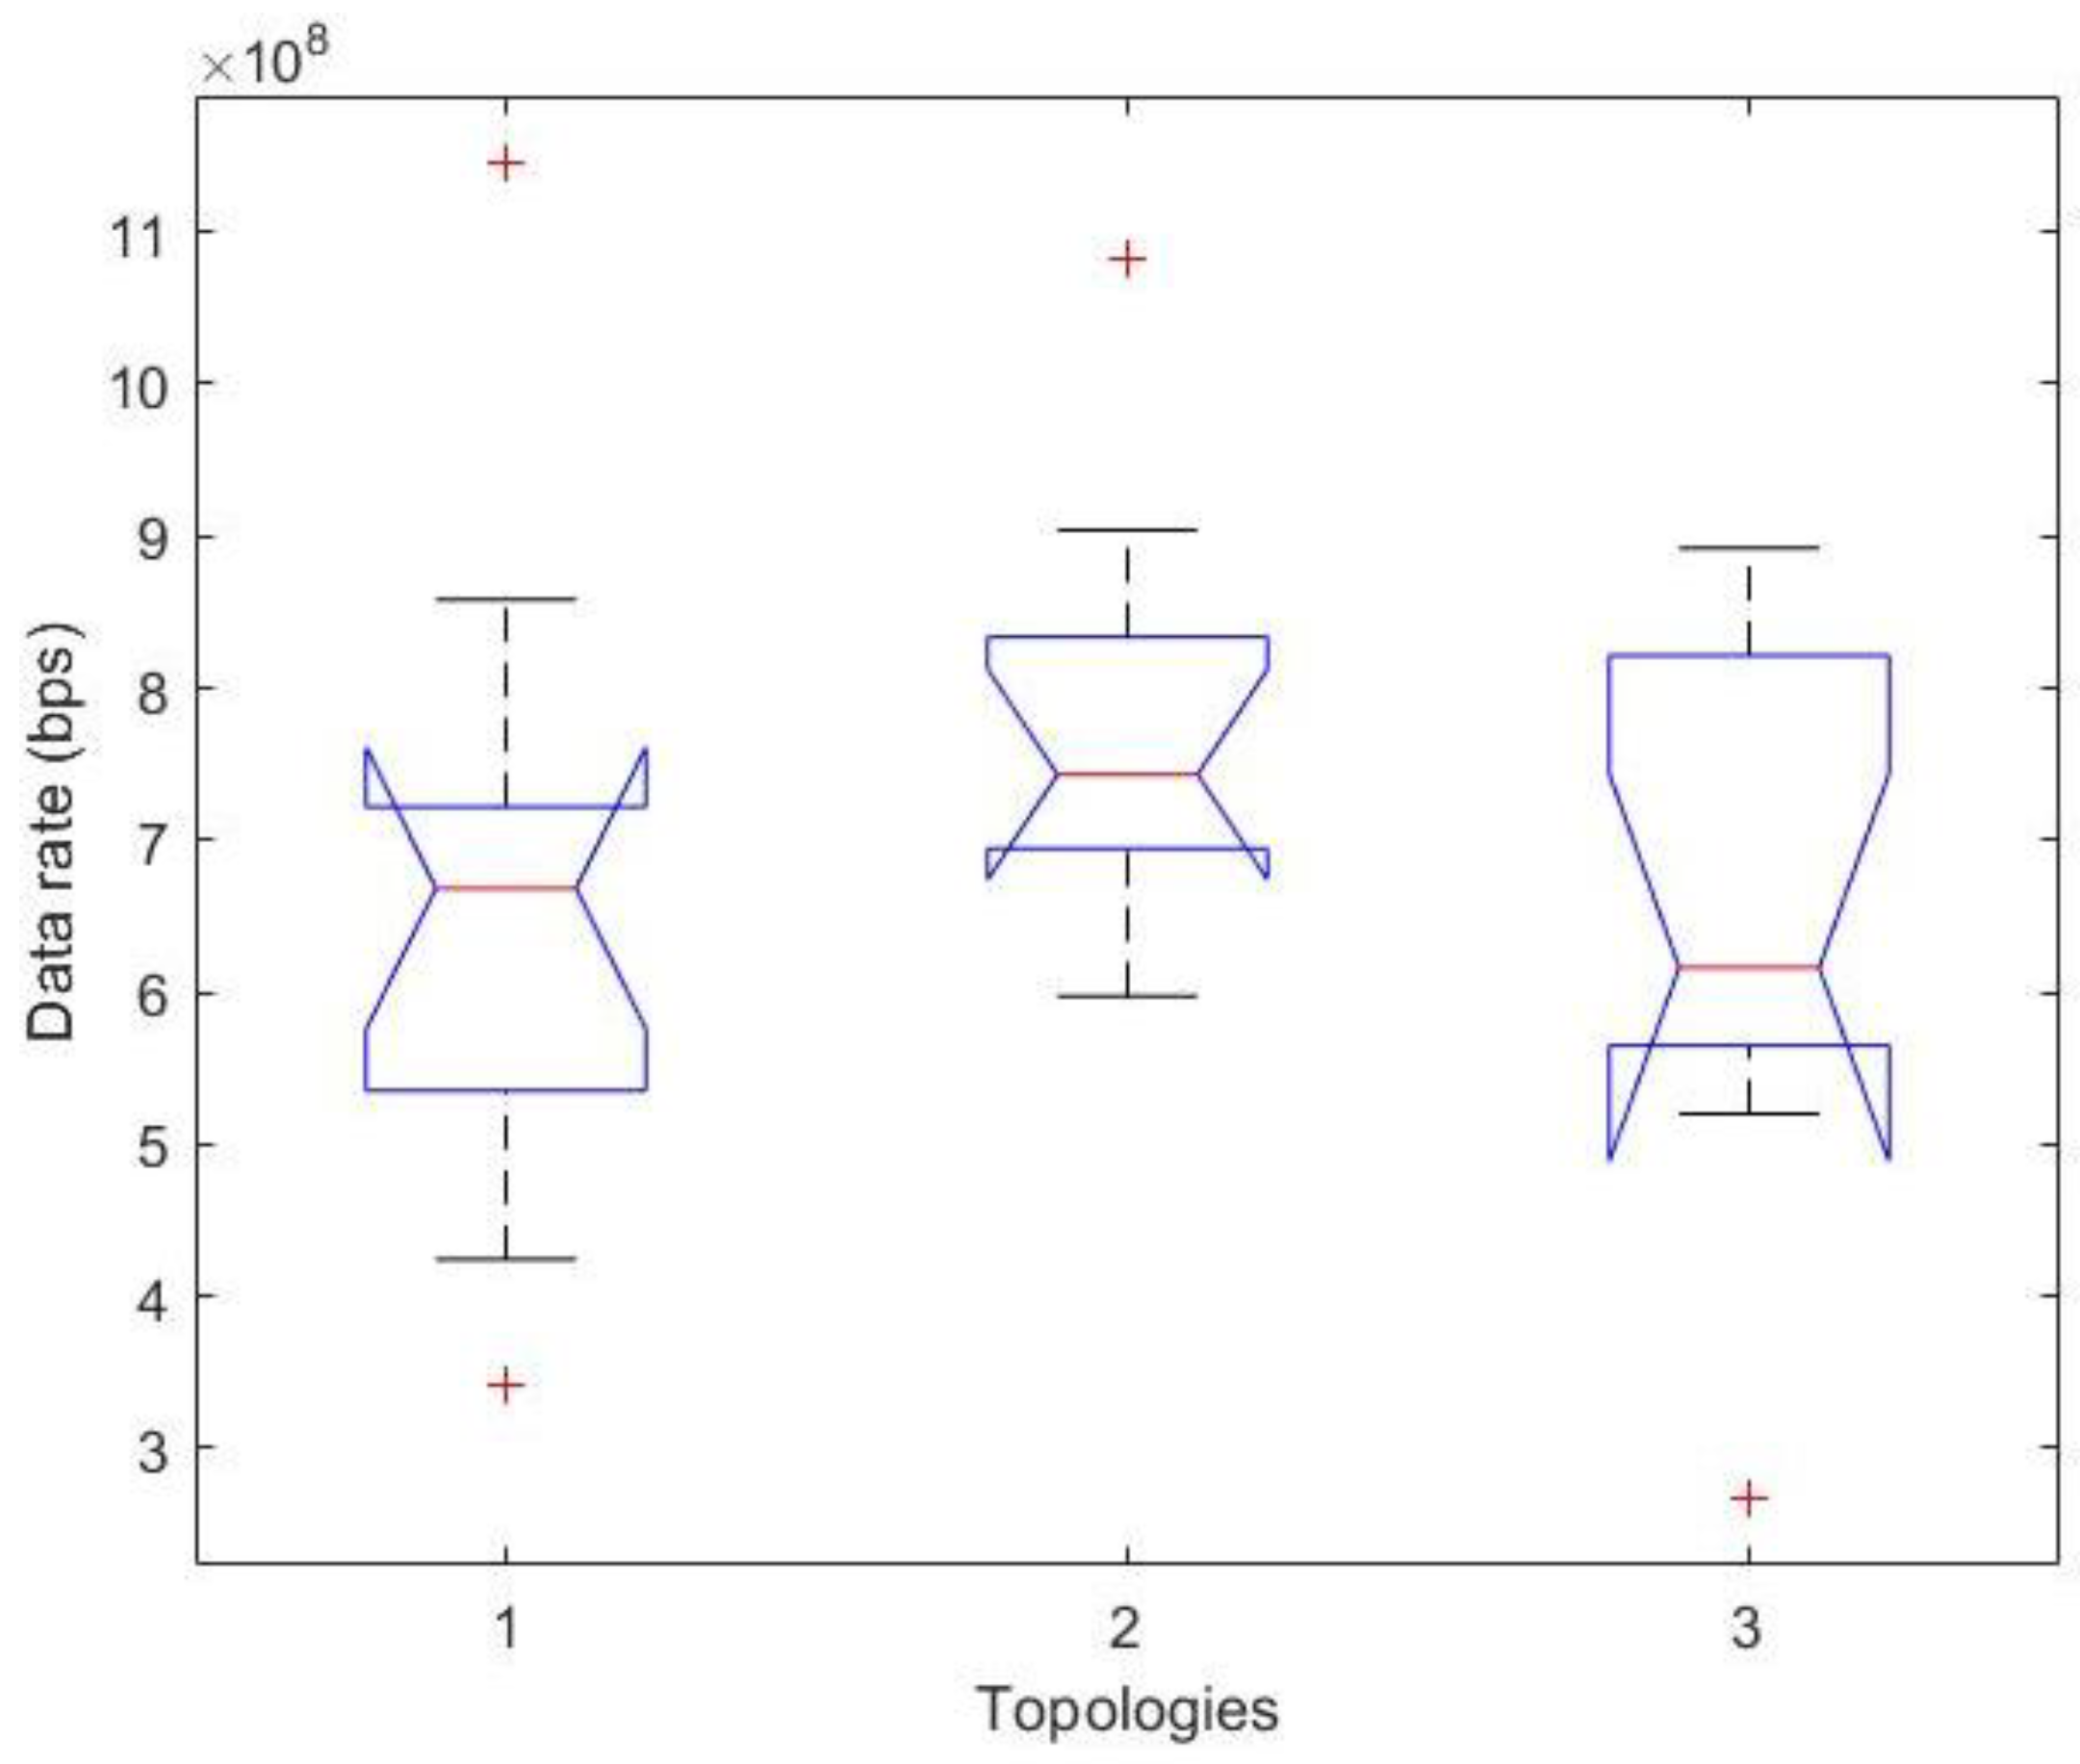
  • Data Rate—This is defined as the total amount of received information at the POP, which is also represented in bps.
Note that these metrics were chosen because they are commonly used by researchers to evaluate network performance and are well understood in the context of network modelling [49]. In terms of gross return, throughputs, data rate, and PDF are considered positive gains from an investment, whereas latency and PER are considered negative gains. Furthermore, the computation of the data rate was based on the link capacity represented by the maximum Modulation and Coding Scheme (MCS) index achieved at the receiver’s end, which summarizes the modulation type and the coding rate. Importantly, the higher the MCS index, the higher the available data rate at the receiver. All the details on the connection between the MCS indexes and the corresponding available data rates can be found in [21]. Finally, the computation of the MCS index was based on the Shannon–Hartley theorem that considers the bandwidth assigned at the receiver node and the received power, which takes into account the transmission power, the attenuation of the signal due to path loss, and antenna gain. Therefore, the results pertaining to the data rate also provide an insight in terms of link budget, which represents the received power, accounting for the radio environment conditions and transmitter/receiver nodes, and can be evaluated through the corresponding available data rate at the receiver node [50]. The risk of investment in this context is measured using the Coefficient of Variation (CV) [51]. The CV represents the variation per unit of median, which was computed using Equation (1) below and is generally expressed as a percentage. In this context, a low CV is better because it means the volatility (i.e., risk) of measurements is low relative to the median. In Equation (1), MAD is the median absolute deviation defined by Equation (2), where xi is the set with the simulated values of a performance metric and m is its median value.
C V = 1.4826 × M A D m × 100
M A D = m e d i a n x i m
Each network topology was simulated 10 times, and we calculated the median (i.e., median gain) and the CV (risk) of each metric for each topology across all the iterations. Note that the performance of 10 independent iterations was sufficient for obtaining realistic and statistically meaningful values for the scenario considered in this paper. The results in Table 1 summarize the medians and CVs, denoted as M and C, respectively, for each metric and in each topology, denoted as T, in the table. Moreover, in the next subsections, we use box plots to show the distribution of the resulting values over all simulations for each metric, where the bottom and top edges of the plotted boxes (representing the metric distributions) indicate the 25th and 75th percentiles, respectively, whereas the central marks are the medians. The outliers were plotted individually and represented with the ‘+’ symbol.

5.1. Comparative Performance Analysis of Topologies in Terms of Latency

Figure 8 presents a boxplot of the results in terms of latency. As we can observe in Table 1 and Figure 8, Topology 3 has the lowest median network latency (i.e., expected negative gain), followed by Topology 2 and Topology 1. Specifically, the median latency in Topology 3 is around 1% lower than that in Topology 2, and the median latency in Topology 2 is 16% lower than that in Topology 1. Furthermore, the CVs of Topology 1, Topology 2, and Topology 3 are 74%, 79%, and 23%, respectively, which means that Topology 2 has the highest risk in terms of the volatility of latency and Topology 3 has the lowest. This can be better noted in Figure 8, where most of the latency values are concentrated around the median in the case of Topology 3. Therefore, Topology 3 is slightly better than Topology 2 since it reduces the median latency by about 1% and the risk by approximately 56%. Switching from Topology 1 to Topology 2 still reduces the median latency by approximately 16% but increases the risk by 5%. Therefore, Topology 2 is superior to Topology 1 since the reduction in median latency is higher than the increase in risk.

5.2. Comparative Performance Analysis of Topologies in Terms of Packet Error Rate (PER)

Figure 9 presents a boxplot of the results in terms of PER. As we can observe in Table 1 and Figure 9, the median of PER is highest in Topology 2, followed by Topologies 3 and 1. Specifically, the median PER (the negative gain) is 50% higher in Topology 2 than in Topology 3 and 20% higher in Topology 3 than in Topology 1. Therefore, in terms of PER, switching from Topology 2 to Topology 3 reduces network performance by around 50%, and switching from Topology 1 to Topology 3 decreases it by 20%. However, any CV values above 100% indicates extreme volatility, and the CVs of each topology are 108%, 144%, and 138%, respectively. Therefore, the PER volatility in all three topologies is extremely high, which can also be observed in Figure 9, in which the PER values are sparse around the median, especially in Topology 2. The CV figures also imply that switching from Topology 2 to Topology 3 decreases risk by 6% but that switching from Topology 1 to Topology 3 increases the risk in terms of the PER volatility by up to 30%. In summary, Topology 1 is better than Topology 3 in terms of PER since the reduction in expected gain (about 20%) is lower than the reduction in risk (30%). Topology 3 is better than Topology 2 since it offers an expected gain of 50% with less risk (6%).

5.3. Comparative Performance Analysis of Topologies in Terms of Packet Delivery Fraction (PDF)

Figure 10 presents a boxplot of the results in terms of the PDF. As we can observe in Table 1 and Figure 10, the median PDF (i.e., the expected gain) is the highest in Topology 1, followed by Topology 3 and Topology 2. The median PDF is 0.43% higher in Topology 1 than it is in Topology 3 and 0.25% higher in Topology 3 than it is in Topology 2. Therefore, switching from Topology 1 to Topology 3 actually decreases network performance by just 0.43%, but switching from Topology 2 to Topology 3 increases performance by 0.25% in terms of the PDF. However, there appears to be no substantial overall change in the expected PDF gain (less than 1%) after switching topologies.
Moreover, the CVs of each topology are 0%, 23%, and 13%, respectively. In other words, switching from Topology 1 to Topology 3 increases risk by 13% and switching from Topology 3 to Topology 2 further increases risk by about 10%. Therefore, Topology 1 performed best again since it carried almost no risk (0%), and this performance was followed by Topology 3.

5.4. Comparative Performance Analysis of Topologies in Terms of Throughput

Next, Figure 11 illustrates the results of the throughput analysis across the topologies shown in Table 1.
In this case, the median throughput (the positive gain) is the highest in Topology 2, followed by Topologies 3 and, finally, 1. The median throughput is approximately 19% higher in Topology 2 than in it is Topology 3 and 12% higher in Topology 3 than it is in Topology 1. However, the CVs of Topologies 1, 2, and 3 are 64%, 107%, and 73%, respectively. In other words, in terms of throughput, switching from Topology 2 to Topology 3 decreases the risk by about 43% and switching from Topology 1 to Topology 3 increases it by 9%.
As a result, the throughput rate is the highest for Topology 2, as shown in Figure 11, but it also has a much taller box plot, which indicates its CV underestimates the real level of volatility. However, the distance between the median (red) and the upper end of the upper whisker is much longer than the distance between the median and the lower end of the lower whisker. That means the higher throughput values are mainly contributing to the resulting volatility and, therefore, risk. Topology 3 is the second-best topology since it offers better performance with lower risk than Topology 1.

5.5. Comparative Performance Analysis of Topologies in Terms of Data Rate

Finally, Figure 12 illustrates the results of the data rate analysis across Topologies 1, 2, and 3 as shown in Table 1.
The graph shows that the median data rate (i.e., the expected positive gain) is the highest in Topology 2, followed by Topologies 1 and 3. Specifically, the median data rate is around 15% higher in Topology 2 than in Topology1 and 3% higher in Topology 3 than in Topology 1. Thus, in terms of data rates, switching from Topology 1 to Topology 2 increases network performance, but switching from Topology 1 to Topology 3 decreases it by about 3%.
The CVs of Topologies 1, 2, and 3 are 55%, 55%, and 41%, respectively. In other words, Topology 1 and Topology 2 are equally volatile in terms of data rate but switching from Topology 1 to Topology 3 decreases this risk by 14%. Therefore, Topology 2 is the best in terms of data rate and corresponding link budget since it has the highest expected gain and the lowest risk compared to the other topologies. Topology 3 is the second-best option since the reduction in the expected return (3%) is lower than the reduction in risk (6%) after switching from Topology 1.
The simulation results show that there is clearly a trade-off between the objectives of low network latency and packet error rate on the one hand and high network throughput and high data rate on the other. Based on latency and PER, Topology 3 performs best, but Topology 2 delivers the better throughput and data rate, albeit with high volatility. More broadly, however, our results do not demonstrate a clear network performance advantage simply from increasing the density of links. This could be due to different reasons. Specifically, the increase in the number of the links might increase the probability of the occurrence of bottlenecks that reduce the overall network capacity due to a highest simultaneous transmission towards the POPs [52]. Other reasons include the limited load introduced during our tests (we expect some further improvements from denser deployments in saturated networks), or the nature of wireless mesh deployments. In any case, it is difficult to justify the additional investment required to realise such configurations given the limited expected returns seen here.

6. Conclusions

In this paper we have explored the optimal degree of meshing in FWA meshed network backhauls as analysed via the Liverpool 5G deployment. The specific context of this network involves a core made up of 60 Ghz 802.11ad links deployed in a street canyon model approximately 80–100 m in length. We have examined the existing literature on this type of deployment and in the broader context of WMNs and found that it most closely conforms to a static deployment, which benefits most from a simplistic, exact optimisation approach. We also highlighted the need for resilience and meshing in this context.
Based on this, we considered a specific sub-network of the Liverpool 5G deployment, which is currently composed of a single available path to a POP for most nodes. Thus, we then introduced two further extensions to this physical deployment, which benefit from incrementally denser meshing for the nodes and links. We then simulated the performance of each topology using realistic link characteristics and a simple shortest path routing protocol in an attempt to determine the optimal degree of connectedness.
Our results show that increasing the meshing degree in the network brings minor incremental improvements in overall network latency but limited improvements in stability. There are also substantial potential gains in terms of throughput and data rate, but these come at the expense of increased volatility. The improvements in terms of the Packet Delivery Fraction (PDF) were largely inconclusive but showed some improvements from greater meshing. However, the results regarding Packet Error Rate (PER) did not show a significant improvement across the three topologies, and there was a large amount of variation in the results we obtained for this metric. Thus, the quantification of the performance improvement is not straightforward in this case, and a trade-off is clearly needed between outright network throughput and stability. Nevertheless, a clear improvement over the unmeshed topology was delivered in each case.
This research offers a number of useful insights in both research and practical contexts. The real-world analysis of 5G NPN FWA deployments provides useful insights into new types of mmWave network optimisation, which can fuel the planning and development of Beyond 5G and 6G technologies. Moreover, our results can immediately be fed back to new network operators who are planning 5G NPN deployments in order to help them optimize their backhaul network in terms of the trade-off of cost vs. performance. This has already been performed in the context of Liverpool 5G, and our results have been disseminated back into the UK5G community and beyond.
Our next steps in this area include further analysis of our results to fine-tune the performance improvements identified and then the consideration of more sophisticated multi-path routing algorithms to further improve the advantages offered by meshing. In addition, we will further quantify these gains against the cost of denser deployments using a Return on Investment (ROI) calculation to understand this trade-off in more detail.

Author Contributions

Conceptualisation, M.M. and A.R.; methodology, M.M., A.R. and I.G.; software, A.R. and I.G.; validation, I.G. and A.R.; formal analysis, I.G. and A.R.; investigation, M.M. and A.R.; writing—original draft preparation, A.R., M.M. and I.G.; writing—review and editing, M.M. and A.R.; visualisation, I.G.; supervision, A.R. and M.M. All authors have read and agreed to the published version of the manuscript.

Funding

This research was partly funded through the UK DCMS Liverpool 5G Create project (https://uk5g.org/discover/5G-projects/testbeds-and-trials/liverpool-5g-create/, accessed on 14 June 2023).

Data Availability Statement

Not applicable, the study does not report any data.

Conflicts of Interest

The authors declare no conflict of interest.

References

  1. Chowdhury, M.Z.; Shahjalal, M.; Ahmed, S.; Jang, Y.M. 6G Wireless Communication Systems: Applications, Requirements, Technologies, Challenges, and Research Directions. IEEE Open J. Commun. Soc. 2020, 1, 957–975. [Google Scholar] [CrossRef]
  2. Tripathi, S.; Sabu, N.V.; Gupta, A.K.; Dhillon, H.S. Millimeter-Wave and Terahertz Spectrum for 6G Wireless. In 6G Mobile Wireless Networks; Computer Communications and Networks; Springer: Berlin/Heidelberg, Germany, 2021. [Google Scholar] [CrossRef]
  3. Legg, P.; McConnell, R. Meshed Backhauling of Small Cells Using IEEE802.11ad at 60 GHz. In Proceedings of the European Conference on Networks and Communications (EuCNC), Ljubljana, Slovenia, 18–21 June 2018; pp. 393–397. [Google Scholar] [CrossRef]
  4. Kousias, K.; Rajiullah, M.; Caso, G.; Alay, O.; Brunstorm, A.; De Nardis, L.; Neri, M.; Ali, U.; Di Benedetto, M.-G. Coverage and performance analysis of 5G non-standalone deployments. In WiNTECH ’22, Proceedings of the 16th ACM Workshop on Wireless Network Testbeds, Experimental Evaluation & CHaracterization, Sydney, Australia, 17 October 2022; Association for Computing Machinery: New York, NY, USA, 2022; pp. 61–68. [Google Scholar] [CrossRef]
  5. Ghoshal, M.; Jonny Kong, Z.; Xu, Q.; Lu, Z.; Aggarwal, S.; Khan, I.; Li, Y.; Hu, Y.C.; Koutsonikolas, D. An in-depth study of uplink performance of 5G mmWave networks. In 5G-MeMU ’22, Proceedings of the ACM SIGCOMM Workshop on 5G and Beyond Network Measurements, Modeling, and Use Cases, Amsterdam, The Netherlands, 22 August 2022; Association for Computing Machinery: New York, NY, USA, 2022; pp. 29–35. [Google Scholar] [CrossRef]
  6. Tran, G.K.; Santos, R.; Ogawa, H.; Nakamura, M.; Sakaguchi, K.; Kassler, A. Context-Based Dynamic Meshed Backhaul Construction for 5G Heterogeneous Networks. J. Sens. Actuator Netw. 2018, 7, 43. [Google Scholar] [CrossRef] [Green Version]
  7. Hiertz, G.R.; Denteneer, D.; Max, S.; Taori, R.; Cardona, J.; Berlemann, L.; Walke, B. IEEE 802.11s: The WLAN Mesh Standard. IEEE Wirel. Commun. 2010, 17, 104–111. [Google Scholar] [CrossRef]
  8. Ometov, A.; Bezzateev, S.; Voloshina, N.; Masek, P.; Komarov, M. Environmental monitoring with distributed mesh networks: An overview and practical implementation perspective for urban scenario. Sensors 2019, 19, 5548. [Google Scholar] [CrossRef] [PubMed] [Green Version]
  9. Trakadas, P.; Sarakis, L.; Giannopoulos, A.; Spantideas, S.; Capsalis, N.; Gkonis, P.; Karkazis, P.; Rigazzi, G.; Antonopoulos, A.; Cambeiro, M.A.; et al. A Cost-Efficient 5G Non-Public Network Architectural Approach: Key Concepts and Enablers, Building Blocks and Potential Use Cases. Sensors 2021, 21, 5578. [Google Scholar] [CrossRef] [PubMed]
  10. Rostami, A. Private 5G Networks for Vertical Industries: Deployment and Operation Models. In Proceedings of the IEEE 2nd 5G World Forum (5GWF), Dresden, Germany, 30 September–2 October 2019; pp. 433–439. [Google Scholar] [CrossRef]
  11. Poe, W.Y.; Ordonez-Lucena, J.; Mahmood, K. Provisioning Private 5G Networks by Means of Network Slicing: Architectures and Challenges. In Proceedings of the IEEE International Conference on Communications Workshops (ICC Workshops), Dublin, Ireland, 7–11 June 2020; pp. 1–6. [Google Scholar] [CrossRef]
  12. Aijaz, A. Private 5G: The Future of Industrial Wireless. IEEE Ind. Electron. Mag. 2020, 14, 136–145. [Google Scholar] [CrossRef]
  13. Patwary, M.N.; Junaid Nawaz, S.; Rahman, M.A.; Sharma, S.K.; Rashid, M.M.; Barnes, S.J. The Potential Short- and Long-Term Disruptions and Transformative Impacts of 5G and Beyond Wireless Networks: Lessons Learnt from the Development of a 5G Testbed Environment. IEEE Access 2020, 8, 11352–11379. [Google Scholar] [CrossRef]
  14. Liverpool 5G Health and Social Care Testbed, Overview, January 2020. Available online: https://liverpool5g.org.uk/wp-content/uploads/2021/07/Liverpool-5G-Heath-and-Social-Care-Testbed-Overview.pdf (accessed on 14 June 2023).
  15. Meta Terragraph Project Overview. Available online: https://terragraph.com/docs/runbook/Overview (accessed on 14 June 2023).
  16. Fixed Wireless Access (FWA): On a Massive Scale with 5G. Available online: https://www.linkedin.com/pulse/fixed-wireless-access-fwa-massive-scale-5g-animesh-jain/ (accessed on 14 June 2023).
  17. Orange 5G FWA Trial Hits Tech Targets—Now for the Business Case. Available online: https://the-mobile-network.com/2018/07/orange-5g-fwa-trial-hits-tech-targets-but-leaves-business-case-questions-unanswered/ (accessed on 14 June 2023).
  18. 5G Testbeds and Trials Programme: Complete List of 5G Projects. Available online: https://www.gov.uk/guidance/5g-testbeds-and-trials-programme-complete-list-of-5g-projects (accessed on 14 June 2023).
  19. Davies, E.; Chung, A.; Broadbent, M.; Macleod, A.; Race, N. 5G in the Wild: Performance of C-Band 5G-NR in Rural Low-Power Fixed Wireless Access. In Proceedings of the IEEE Future Networks World Forum 2022, Montreal, QC, Canada, 12–14 October 2022. [Google Scholar]
  20. West Midlands 5G. Available online: https://www.wm5g.org.uk/ (accessed on 14 June 2023).
  21. Mackay, M.; Raschella, A.; Toma, O. Modelling and Analysis of Performance Characteristics in a 60 Ghz 802.11ad Wireless Mesh Backhaul Network for an Urban 5G Deployment. Future Internet 2022, 14, 34. [Google Scholar] [CrossRef]
  22. Narayanan, A.; Rochman, M.I.; Hassan, A.; Firmansyah, B.S.; Sathya, V.; Ghosh, M.; Qian, F.; Zhang, Z.-L. A Comparative Measurement Study of Commercial 5G mmWave Deployments. In Proceedings of the IEEE INFOCOM 2022—IEEE Conference on Computer Communications, London, UK, 2–5 May 2022; pp. 800–809. [Google Scholar] [CrossRef]
  23. Lyczkowski, E.; Junkes, K.; Kiess, W.; Frey, H. Performance of a 5G NPN in industry: Statistical analysis and application to black channel protocols. In Proceedings of the 26th IEEE International Conference on Emerging Technologies and Factory Automation (ETFA), Vasteras, Sweden, 7–10 September 2021; pp. 01–08. [Google Scholar] [CrossRef]
  24. Frank, H.; Colman-Meixner, C.; Assis, K.D.R.; Yan, S.; Simeonidou, D. Techno-Economic Analysis of 5G Non-Public Network Architectures. IEEE Access 2022, 10, 70204–70218. [Google Scholar] [CrossRef]
  25. Mesodiakaki, A.; Zola, E.; Santos, R.; Kassler, A. Optimal user association, backhaul routing and switching off in 5G heterogeneous networks with mesh millimeter wave backhaul links. Ad Hoc Netw. 2018, 78, 99–114. [Google Scholar] [CrossRef]
  26. Chatzistavros, E.; Stamatelos, G. Comparative performance evaluation of routing algorithms in IEEE 802.11 Ad Hoc networks. In Proceedings of the 2009 International Conference on Telecommunications, Marrakech, Morroco, 25–27 May 2009; pp. 19–24. [Google Scholar] [CrossRef] [Green Version]
  27. Seppänen, K.; Kilpi, J.; Paananen, J.; Suihko, T.; Wainio, P.; Kapanen, J. Multipath routing for mmWave WMN backhaul. In Proceedings of the IEEE International Conference on Communications Workshops (ICC), Kuala Lumpur, Malaysia, 22–27 May 2016; pp. 246–253. [Google Scholar] [CrossRef]
  28. Zhu, Y.; Niu, Y.; Li, J.; Wu, D.O.; Li, Y.; Jin, D. QoS-aware scheduling for small cell millimeter wave mesh backhaul. In Proceedings of the IEEE International Conference on Communications (ICC), Kuala Lumpur, Malaysia, 22–27 May 2016; pp. 1–6. [Google Scholar] [CrossRef]
  29. Taleb, S.M.; Meraihi, Y.; Gabis, A.B.; Mirjalili, S.; Ramdane-Cherif, A. Nodes placement in wireless mesh networks using optimization approaches: A survey. Neural Comput. Appl. 2022, 34, 5283–5319. [Google Scholar] [CrossRef]
  30. Benyamina, D.; Hafid, A.; Gendreau, M. Wireless Mesh Networks Design—A Survey. IEEE Commun. Surv. Tutor. 2012, 14, 299–310. [Google Scholar] [CrossRef]
  31. Jain, K.; Padhye, J.; Padmanabhan, V.N.; Qiu, L. Impact of interference on multi-hop wireless network performance. In MobiCom ’03, Proceedings of the 9th Annual International Conference on Mobile Computing and Networking, San Diego, CA, USA, 14–19 September 2003; Association for Computing Machinery: New York, NY, USA, 2003; pp. 66–80. [Google Scholar] [CrossRef] [Green Version]
  32. Raniwala, A.; Chiuch, T. Architecture and algorithms for an IEEE 802.11-based multi-channel WMN. In Proceedings of the IEEE International Conference on Computer Communications (INFOCOM), Miami, FL, USA, 13–17 March 2005. [Google Scholar]
  33. Alicherry, M.; Bhatia, R.; Li, L.E. Joint Channel Assignment and Routing for Throughput Optimization in Multiradio Wireless Mesh Networks. IEEE J. Sel. Areas Commun. 2006, 24, 1960–1971. [Google Scholar] [CrossRef]
  34. Beljadid, A.; Hafid, A.S.; Gendreau, M. Design of Wireless Mesh Networks: Expansion and Reliability Studies. In Proceedings of the IEEE GLOBECOM 2008—2008 IEEE Global Telecommunications Conference, New Orleans, LA, USA, 30 November–4 December 2008; pp. 1–6. [Google Scholar] [CrossRef]
  35. Yanjun, Y.; Aimin, L.; Hongwei, X.; Jianguo, W.; Xin, Y.; Wen, Z. Deployment optimization of wireless mesh networks in wind turbine condition monitoring system. Wirel. Netw. 2021, 27, 1459–1476. [Google Scholar] [CrossRef]
  36. Wzorek, M.; Berger, C.; Doherty, P. Router and gateway node placement in wireless mesh networks for emergency rescue scenarios. Auton. Intell. Syst. 2021, 1, 14. [Google Scholar] [CrossRef]
  37. Hirata, A.; Oda, T.; Saito, N.; Nagai, Y.; Hirota, M.; Katayama, K.; Barolli, L. A coverage construction and hill climbing approach for mesh router placement optimization: Simulation results for different number of mesh routers and instances considering normal distribution of mesh clients. In Proceedings of the Conference on Complex, Intelligent, and Software Intensive Systems, Asan, Republic of Korea, 1–3 July 2021; pp. 161–171. [Google Scholar] [CrossRef]
  38. Fendji, J.L.E.K.; Thron, C.; Förster, A. A Multi-objective Approach for Wireless Heterogeneous Router Placement in Rural Wireless Mesh Networks. In AFRICOMM 2020, Proceedings of the Towards New e-Infrastructure and e-Services for Developing Countries, Ebène City, Mauritius, 2–4 December 2020; Lecture Notes of the Institute for Computer Sciences, Social Informatics and Telecommunications Engineering; Zitouni, R., Phokeer, A., Chavula, J., Elmokashfi, A., Gueye, A., Benamar, N., Eds.; Springer: Cham, Switzerland, 2020; Volume 361. [Google Scholar] [CrossRef]
  39. Ohara, S.; Barolli, A.; Ampririt, P.; Matsuo, K.; Barolli, L.; Takizawa, M. A Hybrid Intelligent Simulation System for Node Placement in WMNs Considering Chi-Square Distribution of Mesh Clients and Different Router Replacement Methods. In EIDWT 2021, Proceedings of the Advances in Internet, Data and Web Technologies, Chiang Mai, Thailand, 25–27 February 2021; Lecture Notes on Data Engineering and Communications Technologies; Barolli, L., Natwichai, J., Enokido, T., Eds.; Springer: Cham, Switzerland, 2021; Volume 65. [Google Scholar] [CrossRef]
  40. De Marco, G. MOGAMESH: A multi-objective algorithm for node placement in wireless mesh networks based on genetic algorithms. In Proceedings of the 6th International Symposium on Wireless Communication Systems, Siena, Italy, 10–11 September 2009; pp. 388–392. [Google Scholar] [CrossRef]
  41. Campista, M.E.M.; Esposito, P.M.; Moraes, I.M.; Costa, L.H.M.k.; Duarte, O.C.M.b.; Passos, D.G.; De Albuquerque, C.V.N.; Saade, D.C.M.; Rubinstein, M.G. Routing Metrics and Protocols for Wireless Mesh Networks. IEEE Netw. 2008, 22, 6–12. [Google Scholar] [CrossRef]
  42. Singh, A.; Kumar, S.; Walia, S. Routing Protocols for WMNs: A Survey. Int. J. Adv. Res. Comput. Sci. Softw. Eng. 2017, 11, 445–495. [Google Scholar] [CrossRef]
  43. Nuha, A.; Alwan, S. Performance Analysis of Dijkstra-Based Weighted Sum Minimization Routing Algorithm for Wireless Mesh Networks. Model. Simul. Eng. 2014, 2014, 658408. [Google Scholar] [CrossRef] [Green Version]
  44. Nitsche, T.; Cordeiro, C.; Flores, A.B.; Knightly, E.W.; Perahia, E.; Widmer, J.C. IEEE 802.11 ad: Directional 60 GHz communication for multi-Gigabit-per-second Wi-Fi. IEEE Commun. Mag. 2014, 52, 132–141. [Google Scholar] [CrossRef]
  45. Maltsev, A.; Erceg, V.; Perahia, E.; Hansen, C.; Maslennikov, R.; Lomayev, A.; Sevastyanov, A.; Khoryaev, A.; Morozov, G.; Jacob, M.; et al. Channel models for 60 GHz WLAN systems. Available online: https://mentor.ieee.org/802.11/dcn/09/11-09-0334-08-00adchannel-models-for-60-ghz-wlan-systems.doc. (accessed on 14 June 2023).
  46. Soltani, A.R.; Tawfik, H.; Goulermas, J.Y.; Fernando, T. Path planning in construction sites: Performance evaluation of the Dijkstra, A∗, and GA search algorithms. Adv. Eng. Inform. 2002, 16, 291–303. [Google Scholar] [CrossRef]
  47. Otchkarev, A.; Andru, P. A Return on Investment as a Metric for Evaluating Information Systems: Taxonomy and Application. Interdiscip. J. Inf. Knowl. Manag. 2011, 6, 245–269. [Google Scholar] [CrossRef] [Green Version]
  48. Kim, S.; Kim, H.A. A new metric of absolute percentage error for intermittent demand forecasts. Int. J. Forecast. 2016, 32, 669–679. [Google Scholar] [CrossRef]
  49. Rohal, P.; Dahiya, R.; Dahiya, P. Study and analysis of throughput, delay and packet delivery ratio in MANET for topology based routing protocols (AODV, DSR and DSDV). Int. J. Adv. Res. Eng. Technol. 2013, 1, 54–58. [Google Scholar]
  50. Kim, J.; Xian, L.; Sadri, A.S. 60 GHz Modular Antenna Array Link Budget Estimation with WiGig Baseband and Millimeter-Wave Specific Attenuation. Int. J. Antennas Propag. 2017, 2017, 9073465. [Google Scholar] [CrossRef] [Green Version]
  51. Campecino, J.O. Portfolio Theory and Risk Analysis Using Coefficient of Variation: An Alternative to the Modern Portfolio Theory. 2021. Available online: https://arxiv.org/ftp/arxiv/papers/2109/2109.03977.pdf (accessed on 14 June 2023).
  52. Jun, J.; Sichitiu, M.L. The nominal capacity of wireless mesh networks. IEEE Wirel. Commun. 2003, 10, 8–14. [Google Scholar] [CrossRef] [Green Version]
Figure 1. Overview of Liverpool 5G backhaul deployment.
Futureinternet 15 00218 g001
Figure 2. Point-to-point deployment.
Futureinternet 15 00218 g002
Figure 3. Liverpool 5G Phoenix physical deployment.
Futureinternet 15 00218 g003
Figure 4. Liverpool 5G Phoenix logical deployment.
Futureinternet 15 00218 g004
Figure 5. Liverpool 5G Phoenix deployment Topology 2.
Futureinternet 15 00218 g005
Figure 6. Liverpool 5G Phoenix deployment Topology 3.
Futureinternet 15 00218 g006
Figure 7. Pseudo-code for the shortest path algorithm.
Futureinternet 15 00218 g007
Figure 8. Latency performance results.
Futureinternet 15 00218 g008
Figure 9. PER performance results.
Futureinternet 15 00218 g009
Figure 10. PDF performance results.
Futureinternet 15 00218 g010
Figure 11. Throughput performance results.
Futureinternet 15 00218 g011
Figure 12. Data rate performance results.
Futureinternet 15 00218 g012
Table 1. Summary of results over 10 simulations in terms of median (M) and CV (C).
T Latency (ms)PERPDFThroughput (bps)Data Rate (Bytes per Sec)
1M0.23020.01041.000016,167,00083,538,000
C74%108%0%64%55%
2M0.19300.02890.993219,562,50092,896,000
C79%144%23%107%55%
3M0.19130.01310.995716,643,50077,029,000
C23%138%13%73%41%
Disclaimer/Publisher’s Note: The statements, opinions and data contained in all publications are solely those of the individual author(s) and contributor(s) and not of MDPI and/or the editor(s). MDPI and/or the editor(s) disclaim responsibility for any injury to people or property resulting from any ideas, methods, instructions or products referred to in the content.

