Article

IoT-Based LPG Level Sensor for Domestic Stationary Tanks with Data Sharing to a Filling Plant to Optimize Distribution Routes

by
Roberto Morales-Caporal
1,*,
Rodolfo Eleazar Pérez-Loaiza
1,
Edmundo Bonilla-Huerta
1,
Julio Hernández-Pérez
2 and
José de Jesús Rangel-Magdaleno
2
1
Instituto Tecnológico de Apizaco, Tecnológico Nacional de México, Av. Instituto Tecnológico s/n, Apizaco C.P. 90300, Mexico
2
Instituto Nacional de Astrofísica, Óptica y Electrónica (INAOE), Luis Enrique Erro No. 1, San Andrés Cholula C.P. 72840, Mexico
*
Author to whom correspondence should be addressed.
Future Internet 2024, 16(12), 479; https://doi.org/10.3390/fi16120479
Submission received: 21 October 2024 / Revised: 13 December 2024 / Accepted: 17 December 2024 / Published: 21 December 2024

Abstract

:
This research presents the design and implementation of an Internet of Things (IoT)-based solution to measure the percentage of Liquefied Petroleum Gas (LPG) inside domestic stationary tanks. The IoT-based sensor, in addition to displaying the percentage of the LPG level in the tank to the user through a mobile application (app), has the advantage of simultaneously sharing the acquired data with an LPG filling plant via the Internet. The design process and calculations for the selection of the electronic components of the IoT-based sensor are presented. The methodology for obtaining and calibrating the measurement of the tank filling percentage from the magnetic level measurement system is explained in detail. The operation of the developed software, and the communication protocols used are also explained so that the data can be queried both in the user’s app and on the gas company’s web platform safely. The use of the Clark and Wright savings algorithm is proposed to sufficiently optimize the distribution routes that tank trucks should follow when serving different home refill requests from customers located in different places in a city. The experimental results confirm the functionality and viability of the hardware and software developed. In addition, by having the precise location of the tank, the generation of optimized gas refill routes for thirty customers using the heuristic algorithm and a visualization of them on Google Maps is demonstrated. This can lead to competitive advantages for home gas distribution companies.

1. Introduction

1.1. Background

Liquefied petroleum gas (LPG) is a flammable gaseous hydrocarbon widely used around the world, as it is a non-toxic and sulfur-free fuel. It can be easily stored in liquid form under moderate pressure, making it a very portable fuel and a versatile energy source for consumers located in areas where pipe gas supply is not available [1].
In Latin America, unlike other more developed regions of the world, LPG demand is driven by residential and commercial customers, who consume around 80% of the region’s LPG. In Mexico, for example, residential and commercial consumption accounts for almost 90% of the domestic market [2]. In the region, LPG distribution for residential and commercial use can be divided into two categories: (1) distribution of LPG in portable cylindrical tanks and (2) refilling LPG distributed by tanker trucks to domestic stationary tanks. Portable cylindrical tanks are widely used, especially in rural or remote areas, where it is complicated or expensive to refill a stationary tank. On the other hand, stationary tanks are more popular in urban areas and offer a more practical way to store LPG on the property [3].
Both forms of distribution are operationally inefficient and susceptible to theft in their current state [4,5,6], since: (1) in the case of returnable portable cylinders, less gas might be supplied than what was paid for (which is a form of theft), (2) the truck that transports the cylinders might not be circulating near or at the time when consumers require it, and (3) usually, domestic stationary tanks are installed on the roofs of buildings, which makes it difficult for consumers to check the dial gauge of LPG on the tank.
Thus, to try to alleviate these inconveniences, mainly in the case of refilling stationary tanks at home, different wired and wireless solutions have already been developed. For comparison purposes, this work only considers existing wireless solutions in the Latin American market.

1.2. A Review of Existing Wireless LPG Level Sensors for Domestic Stationary Tanks

All LPG stationary tanks are fitted with a mechanical gauging system (sometimes called a dial gauge) to measure the percentage of LPG in liquid state inside the tank (see Figure 1a). The mechanical float inside the tank rests on the liquid gas and transmits a rotary motion to the stem by means of gears. The float and the stem vary in size (see Figure 1b), as they depend on the capacity (in liters) of the stationary tank [7]. The stem transmits the rotary motion to a diametrically magnetized magnet placed at the end of it and where the external dial gauge is located (see Figure 1c). The magnetic field of the magnet moves the dial needle, indicating the percentage of the LPG level in the tank.
Float gauges have numerous moving parts that are subject to wear and can become ineffective at any part of the assembly. The mechanical measurement system only provides an approximate tank percentage and cannot be considered 100% reliable [7].
All proposed electronic solutions for measuring the percentage of LPG level in domestic stationary tanks are based on detecting the direction of the magnetic field produced by the diametric magnet located under the needle dial. This is mainly due to: (1) taking advantage of the mechanical measurement system that all stationary tanks have, (2) no invasive (internal) measurement system being added, nor modifying the existing measurement system, (3) being as accurate as the mechanical measurement system, and (4) when it is small enough, being easy to install under the dial.
The different solutions available to estimate the percentage of LPG level in domestic stationary tanks are studied below. Then, a qualitative comparison of them vs. the developed wireless sensor is shown.
  • Levelgas® [8]: This device measures the level of LPG in the stationary tank and displays the data through a mobile application (app). It sends a notification when it detects a low gas level and has the ability to display the battery charge level. It uses Sigfox connectivity, so it only has coverage in major cities. After a trial period, a subscription to the app must be paid for. The sensor displays the data only to the tank user and cannot be shared with the gas refilling plant. It is not specified (N/S) if it uses any cybersecurity strategy. The device performs one measurement per day and uses three AAA-size alkaline batteries (Zn-MnO2) with a lifespan of up to one year. Manufacturer: Edison Effect, S.A. of C.V., San Luis Potosí, Mexico. Price: 77.50 USD.
  • El gaaas® [9]: Wireless gas meter for stationary tank. It uses Sigfox wireless connection, so it only has coverage in major cities. It uses the same app as the Levelgas device, so after a trial period, you have to pay a monthly fee to get the app services. The device displays the data only to the tank owner and cannot be shared with the gas refilling plant. It is not mentioned if it uses any cybersecurity strategy. Compatible with stationary tanks from 100 to 3000 L. The sensor performs one measurement per day and uses three AAA-size alkaline batteries (Zn-MnO2) with a life span of up to one year. Manufacturer: Logística Aplicada Tugas, S.A. de C.V., Mexico City, México. Price: 78.00 USD.
  • iSentinel® [10]: With this wireless device, you can measure the level of LPG in your stationary tank from your smartphone. In addition, you can also know how many liters of gas you have refilled. It can look more than one tank in a single app. It uses a Wi-Fi connection and the app is free. The device displays the data only to the tank user and cannot be shared with the gas refilling plant. It is not specified (N/S) if it uses any cybersecurity strategy. The sensor takes one measurement per day and is powered by non-rechargeable AA-size lithium/iron disulfide (Li/FeS2) batteries (not included), with an estimated lifespan of two years. Manufacturer: Cosas Web, S.A. de C.V., Jalisco, Mexico. Price: 80.30 USD.
  • Redgas Touch® [11]: It is a sensor to wirelessly measure the gas level in stationary tanks autonomously through Wi-Fi communication. It informs you directly on your phone how much gas you have and warns you when you are going to run out of gas. It sends alerts if it detects a low gas level in the tank. The device displays the data only to the tank owner and cannot be shared with the gas refilling plant. It is not mentioned if it uses any cybersecurity strategy. The sensor makes one measurement per day and uses a rechargeable Li-ion (Rechg.-Li-ion) battery (size not specified) and a small photovoltaic (PV) cell. However, according to the product’s reviews and ratings, it stops working after five months because the small PV cell is not able to recharge the battery. Manufacturer: Redtapp S. de R.L. de C.V., San Luis Potosí, Mexico. Price: 85.00 USD.
  • SensiGas® [12]: This is a device designed with a sensor that sends the gas level of your tank remotely to an app. It works with 4G connectivity, so coverage must be checked to be able to use the device. The app is free. The device displays the data only to the tank owner and cannot be shared with the gas refilling plant. It is not specified (N/S) if it uses any cybersecurity strategy. The Rechg.-Li-ion battery (size not specified) can have a lifespan of up to five years, transmitting once a day in excellent signal conditions. However, if the tank is located in an area with poor signal or if it has a lot of activity and there are more transmissions due to low level alerts, the battery life will decrease significantly. Manufacturer: Mobile IoT Latam, S.A.P.I. DE C.V., Jalisco, Mexico. Price: 98.50 USD.
  • Gaszen® (Discontinued since 2020 [13]): This used Wi-Fi connectivity and an app to indicating the LPG level in the tank. The device showed the data only to the tank user, which could not be shared with the gas refilling plant. It did not use any cybersecurity strategy. The business model consisted of charging a commission to the gas distribution company every time users requested a refill service through their app, and there was the option of rating the service of the filling plant. Manufacturer: Gaszen Tech S.A.P.I., Guanajuato, México. Price: 100.35 USD.
It is worth mentioning that the information presented above was obtained from the website of each device and neither in these nor in the available literature of each have technical data been found, such as energy consumption levels, specifications of main electronic components, or electronic design diagrams.

1.3. Contributions and Organization of the Article

From Table 1, it can be seen that existing wireless gas level sensors display gas level data only to tank owners. However, for several reasons, LPG distribution companies are interested in knowing the LPG level data of users’ tanks. In this way, in addition to having captive customers, they can avoid unfair competition, as in the case of illegal distribution of stolen gas [4,5,6]. Furthermore, if the exact location of each tank is known, the company can schedule optimized LPG refill routes, among other benefits.
Therefore, this work has focused on the development of a wireless LPG level sensor for domestic stationary tanks with the ability to share gas level data with a remote server over the Internet. In summary, the main contributions of this development are as follows.
  • IoT-based sensor with the ability to display data of percentage of LPG level in a stationary tank to the user and to the refilling plant of a gas company;
  • The investigated solution estimates the percentage of the LPG level in the tank in relation to the position of the magnetic field of the magnet located under the dial;
  • The sensor is more precise than the existing ones in the market;
  • The device is much cheaper than the ones currently on the market;
  • A mobile application (app) is implemented for the developed electronic device;
  • The data are shared securely, unlike the devices in Table 1, where no security strategy is specified;
  • A heuristic strategy is used to sufficiently optimize the distribution routes that the distribution tanker trucks should follow;
  • Using this hardware solution, the company can perform business intelligence (BI).
The rest of the article is organized as follows. Section 2 shows the business concept required by a gas company and the requirements considered for the development of the IoT-based LPG level sensor. Section 3 describes the researched strategy to determine the percentage of liquid LPG in the tank based on the magnetic field position angle of the magnetic float meter system, considering the non-linearity of the tank volume at different levels. The design process and selection of electronic components to develop the IoT-based sensor are also presented. Section 4 explains the operation of the developed software, i.e., the app, and communication protocols of the IoT-sensor. Section 5 describes the proposed Clarke and Wright savings algorithm to optimize the distribution routes that tanker trucks should follow when serving home refill requests. Section 6 shows the experimental results of the developed device and the generation of optimal filling routes with the savings algorithm. Finally, Section 7 presents the conclusions.

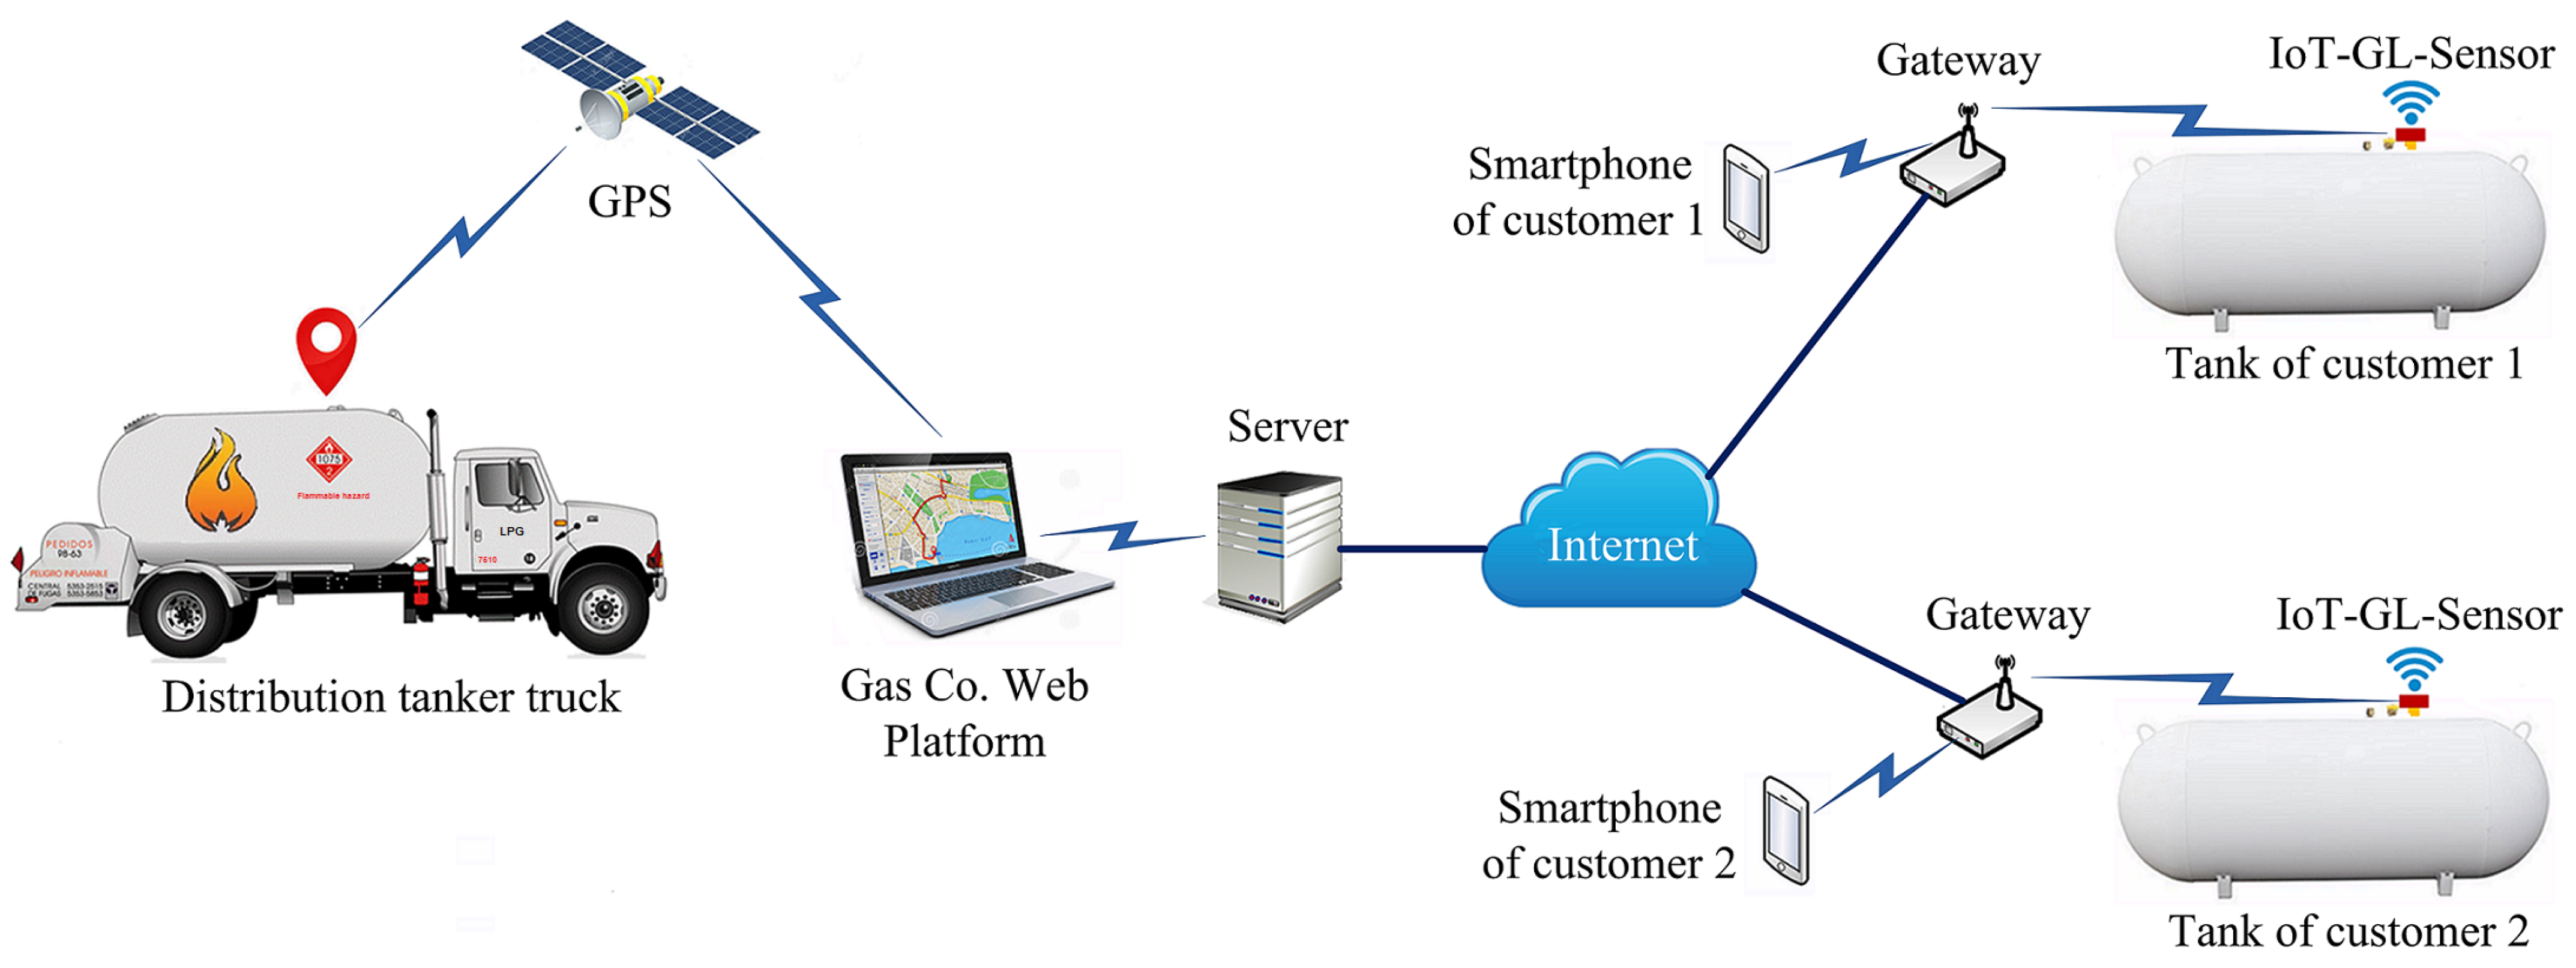
2. Business Concept with the Developed IoT-Based Gas Level Sensor

2.1. Conceptualization

This solution is based on the needs of an LPG distribution company. According to the company, the developed IoT-based gas level sensor (from now on, this will be referred to as IoT-GL-Sensor for simplicity) will be delivered to customers free of charge, so they have no problems installing it in their tanks.
The philosophy of “design thinking” was followed during the conceptualization of the device, which consists of taking into account the experiences of the company and understanding the problem to be solved. In joint meetings, considerations were presented and the functions of the electronic device were determined in order to obtain a product that meets the needs of the gas distribution company. The considerations and functions that the IoT-GL-Sensor must have are summarized below.
  • Based on the experience acquired by the gas company with residential users, it is known that 85% of them have stationary LPG tanks in a horizontal position with a capacity between 100 and 500 L, another 10% of residential customers have stationary tanks with a capacity between 1000 and 2200 L, and the remaining 5% of users have tanks with a larger capacity.
  • Domestic stationary tanks are filled to a maximum of 80% for safety reasons.
  • The period between recharges depends on the level of use and the size of the stationary tank. However, according to the company’s experience, the average minimum time is around 7 weeks.
  • The IoT-GL-Sensor will be provided free of charge to customers so that they do not object to its use.
  • It is desirable that the device uses Wi-Fi communication, as 100% of customers use Internet connectivity.
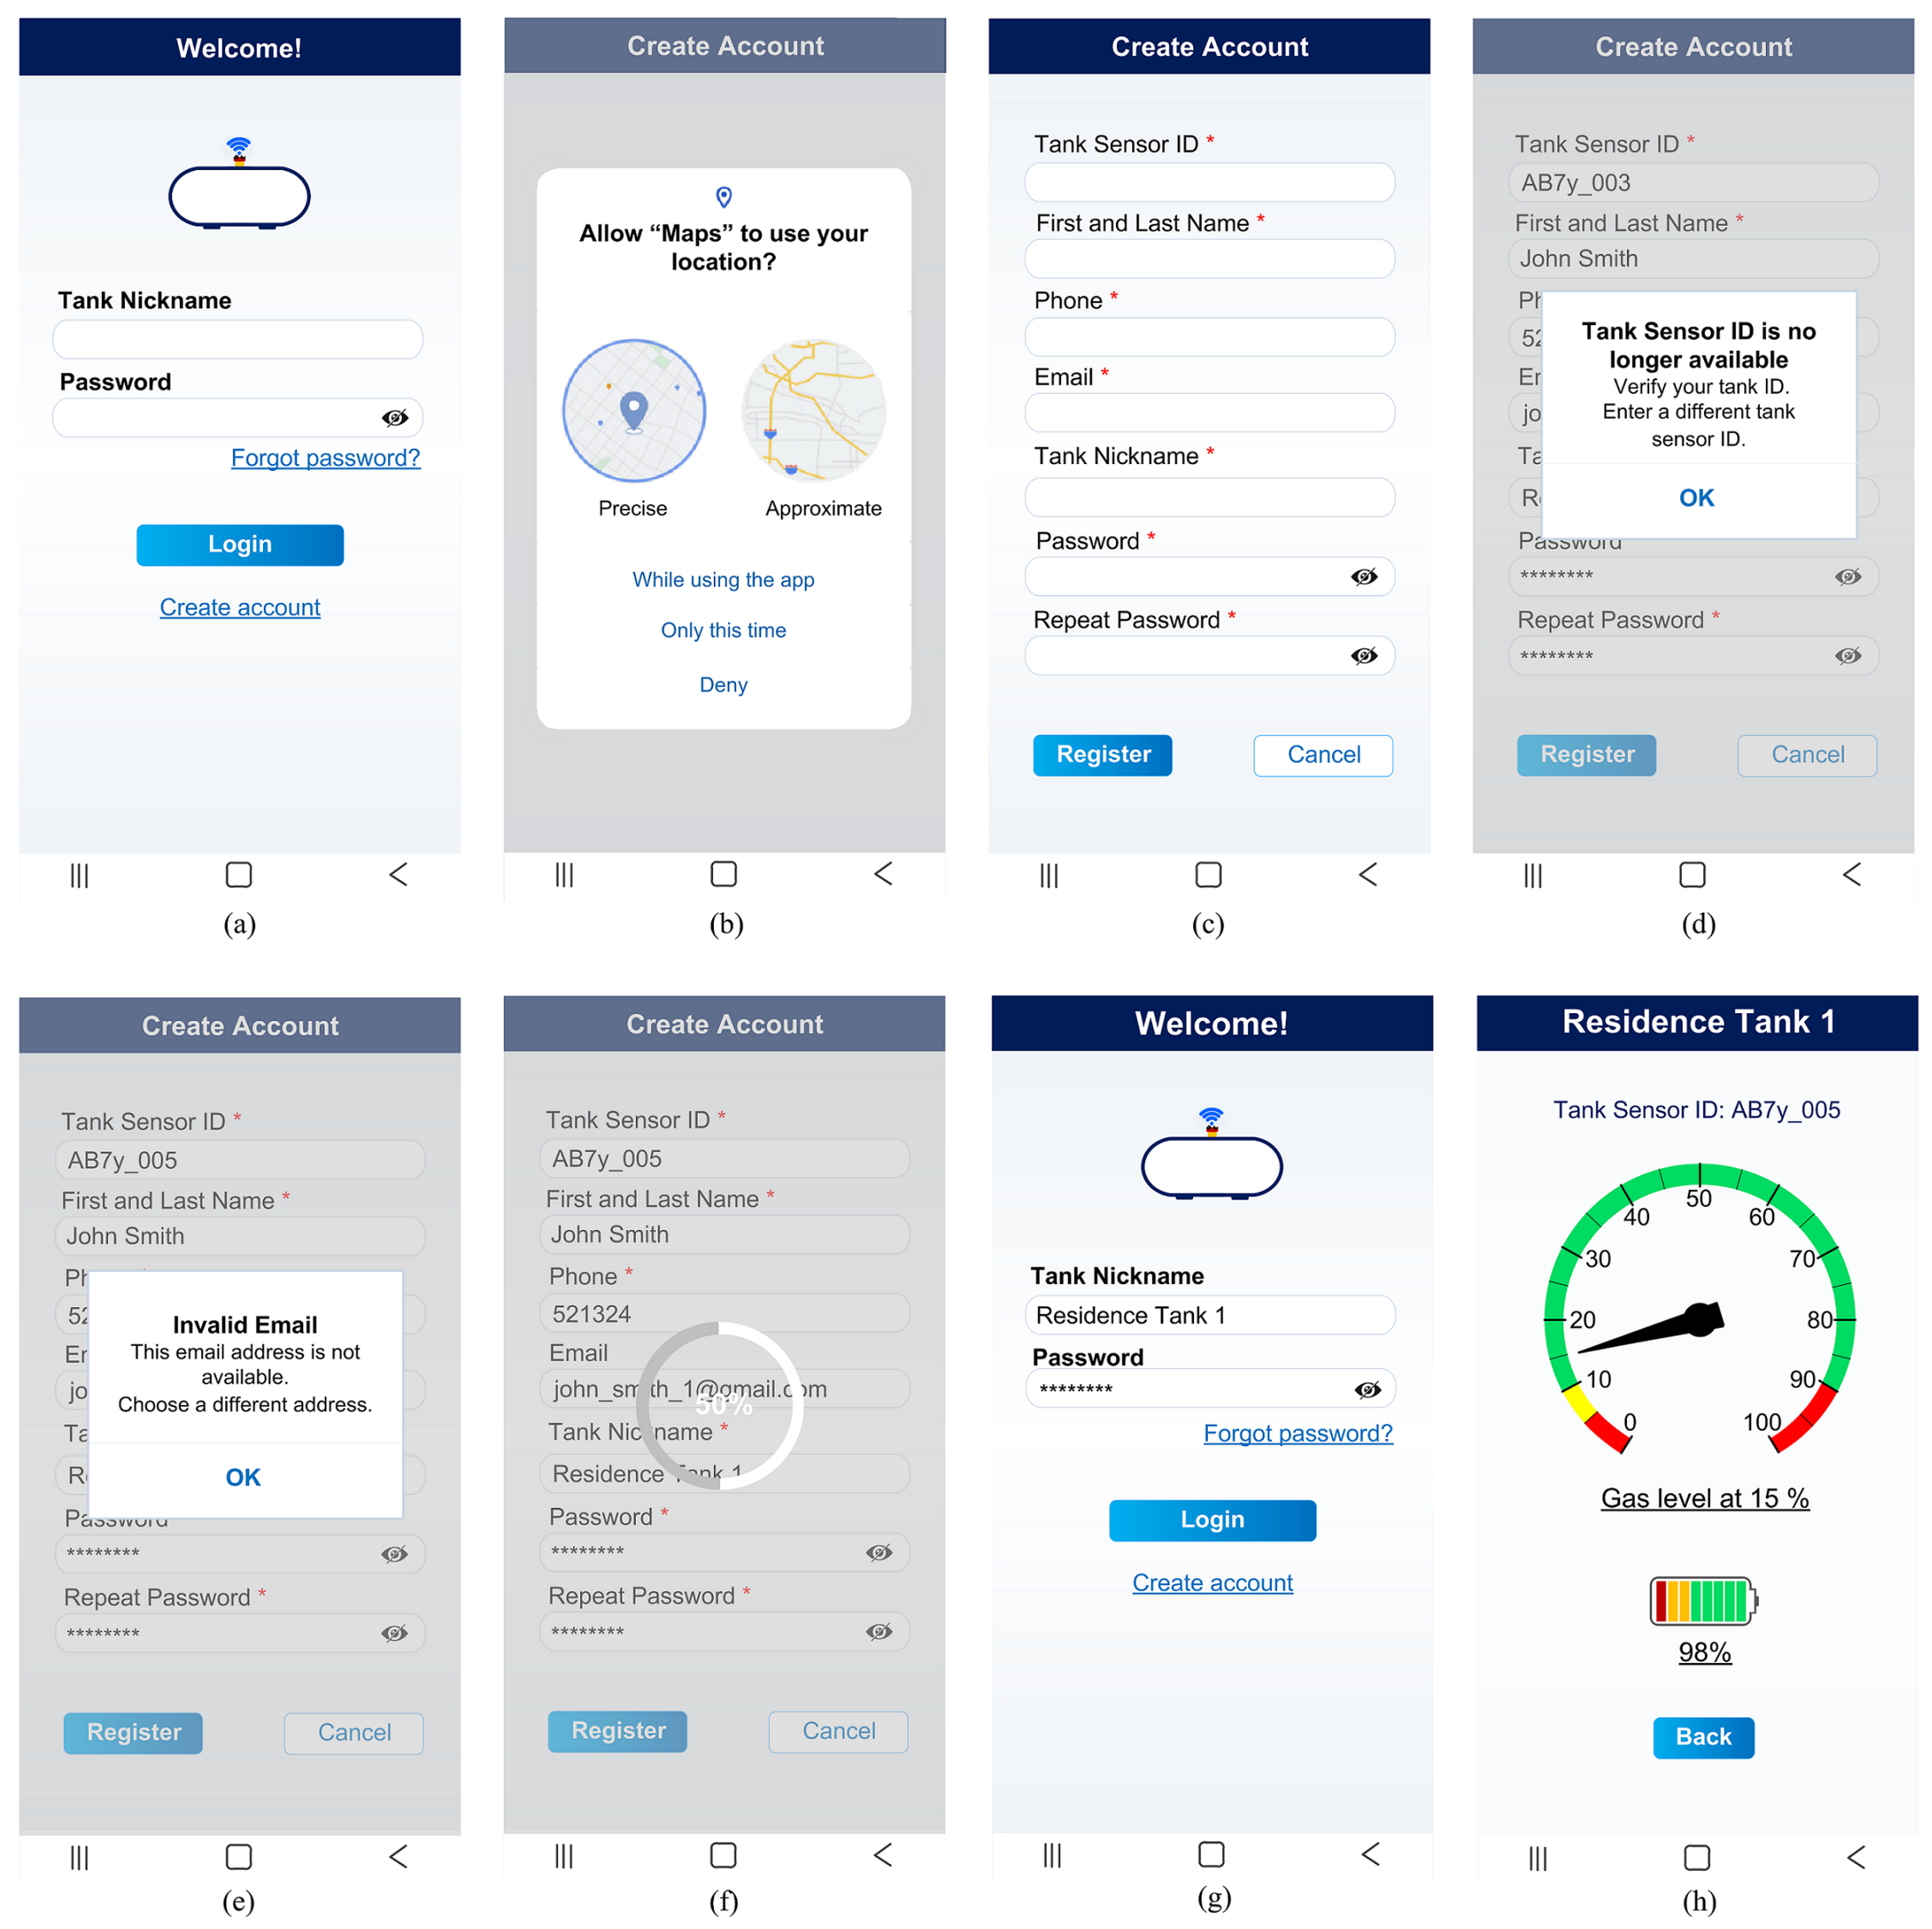
  • The IoT-GL-Sensor displays both the user and the gas company the percentage of the LPG level in the tank, through an app and a web platform, respectively.
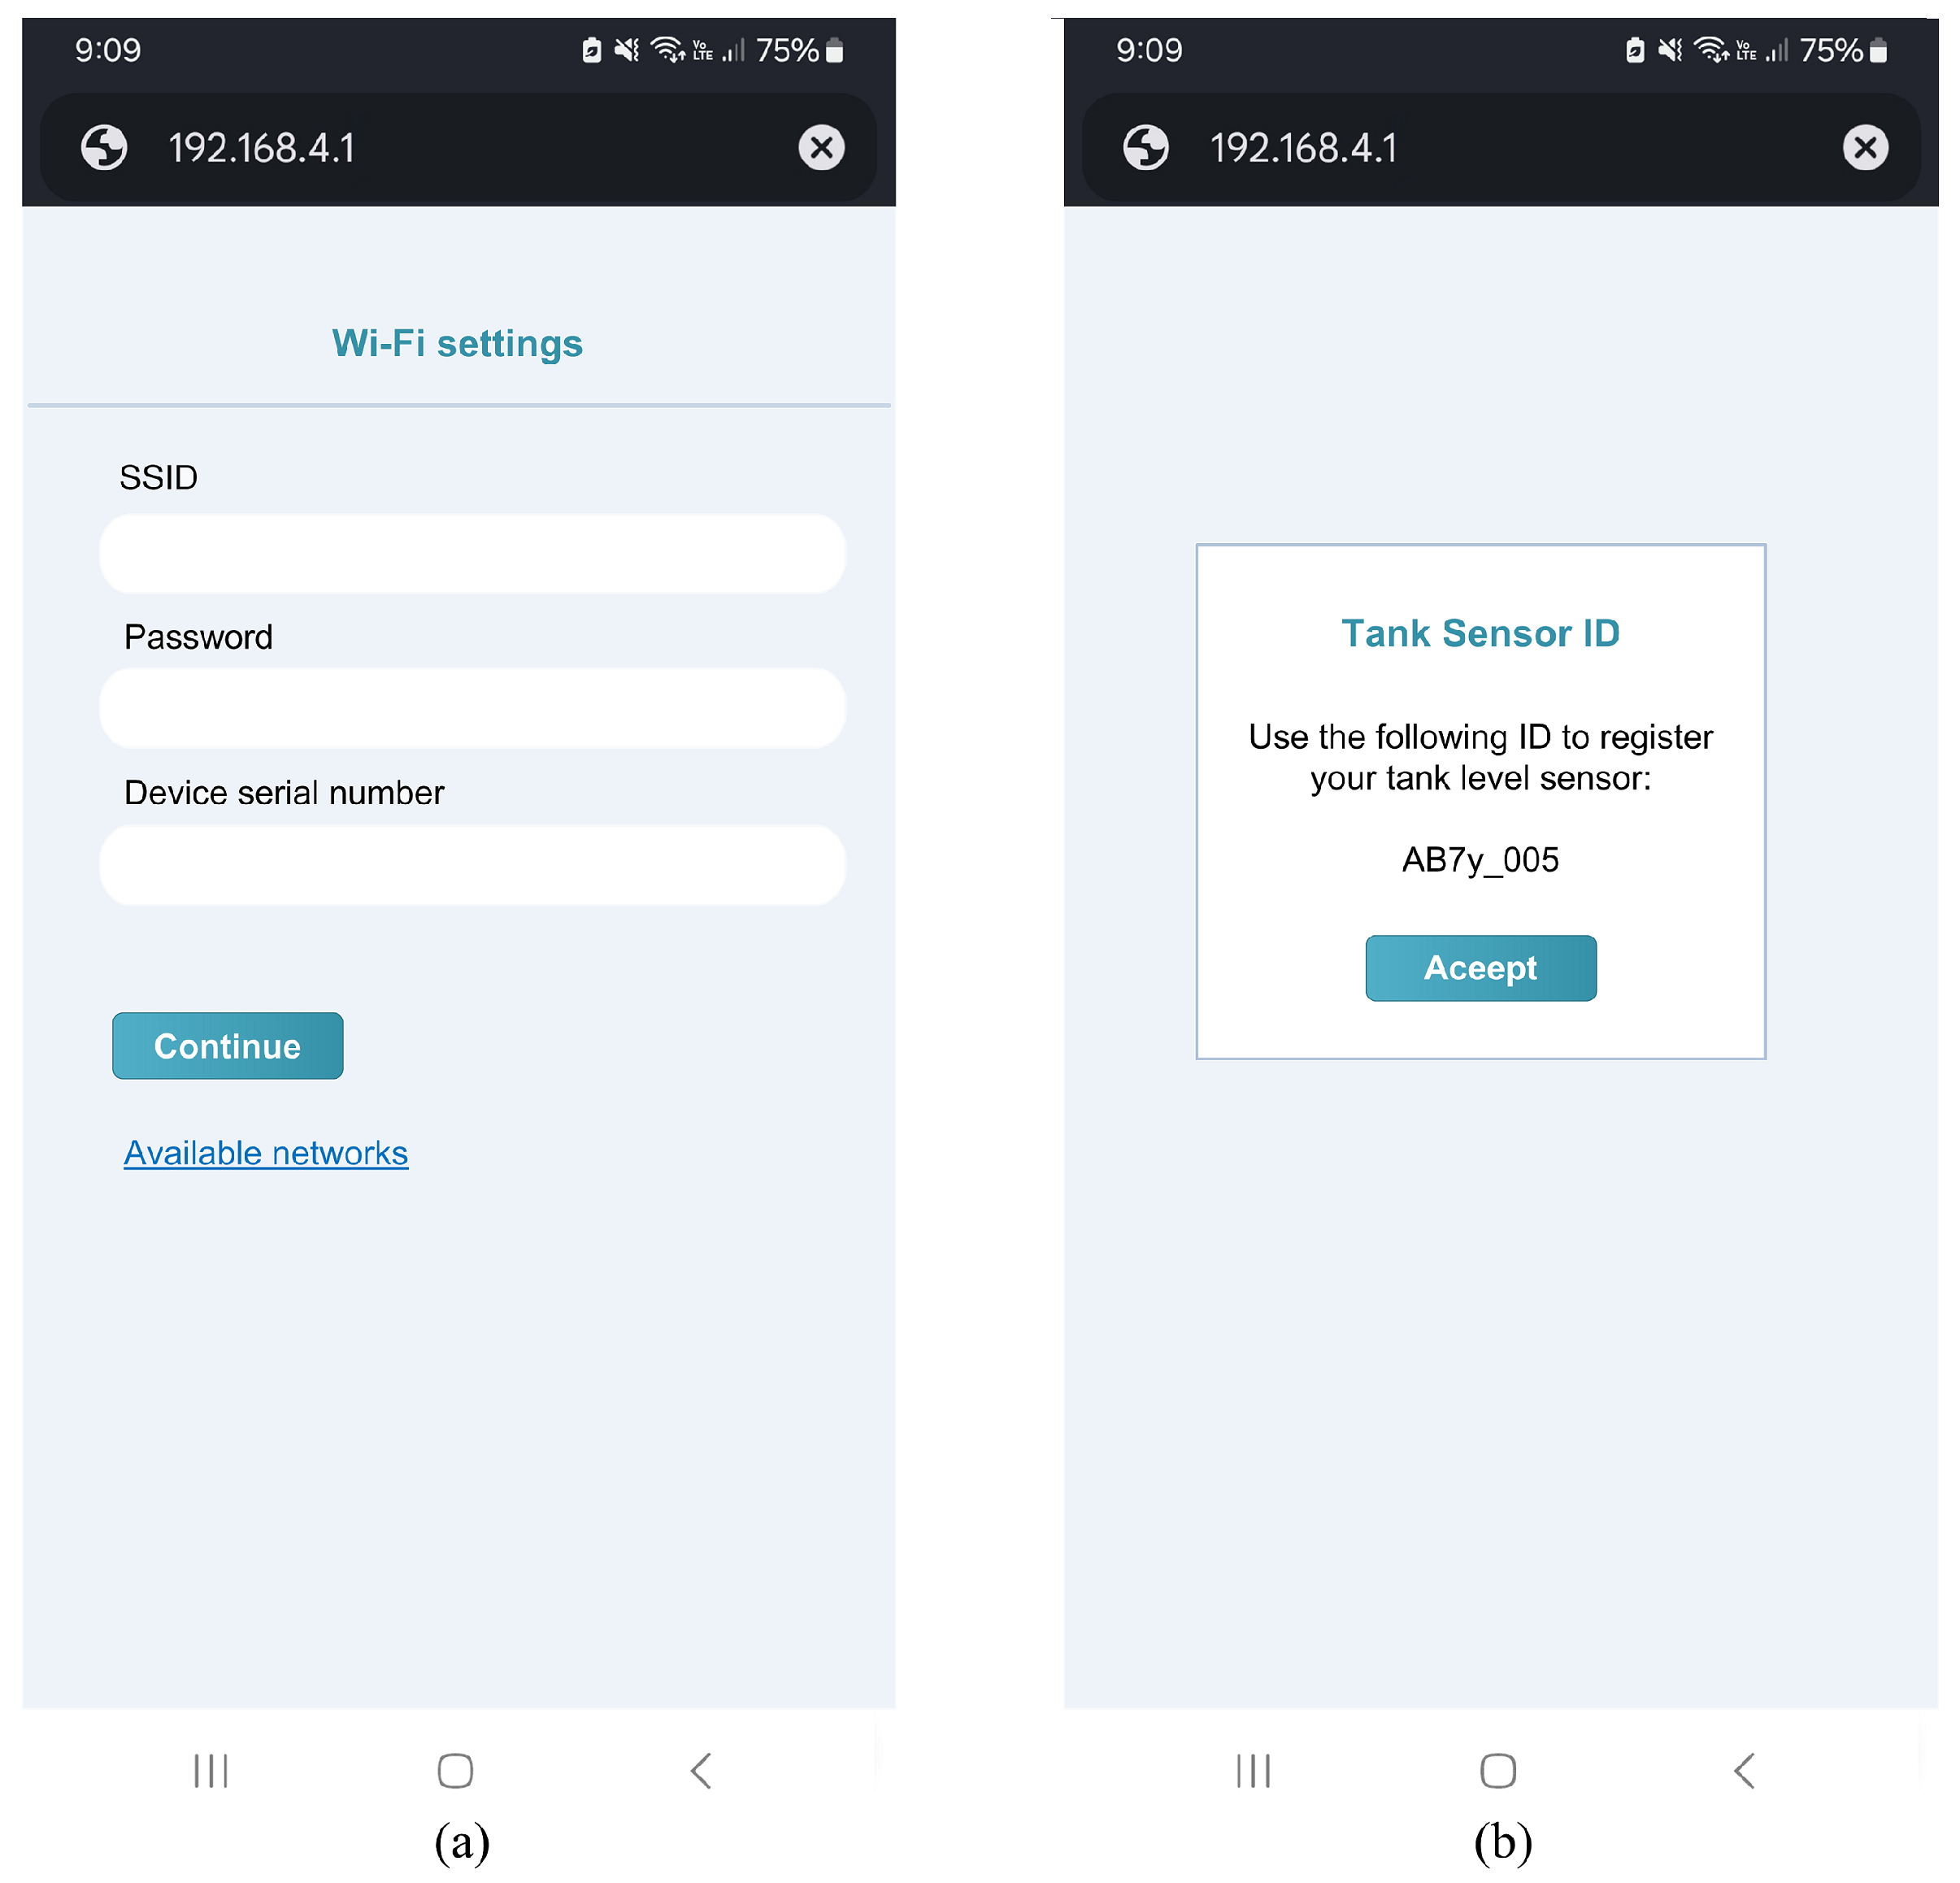
  • When installing and configuring the sensor for the first time, the user will be prompted to provide the exact location of the stationary tank using Google Maps on a mobile device. The tank location is stored in the server warehouse. In this way, the gas company can offer the filling service and reduce unfair competition, such as the illegal distribution of stolen gas [4,5,6].
  • LPG distribution tanker trucks must be equipped with a GPS system, as shown in Figure 2. The GPS system tracks the trucks in real time, to verify the distribution route and eventually prevent vehicle theft [4,14].

2.2. Requirements

The following requirements were considered, among others:
  • Low price;
  • Wi-Fi communication;
  • The sensor must perform two measurements per day (to improve data quality);
  • Powered by non-rechargeable AA-size lithium/iron disulfide (Li/FeS2) batteries;
  • Operating temperature range from −10 °C to 50 °C;
  • Possibility of use and installation in stationary tanks from 100 to 3400 L;
  • Easy installation and configuration;
  • IP65 housing;
  • The location and ID of each IoT-based sensor must be known;
  • It must be developed taking into account Mexican standards;
  • The international standards for electronic design must be considered.
Figure 3 shows the block diagram of the IoT-GL-Sensor. This consists of four main blocks.
The general description of each block is listed below:
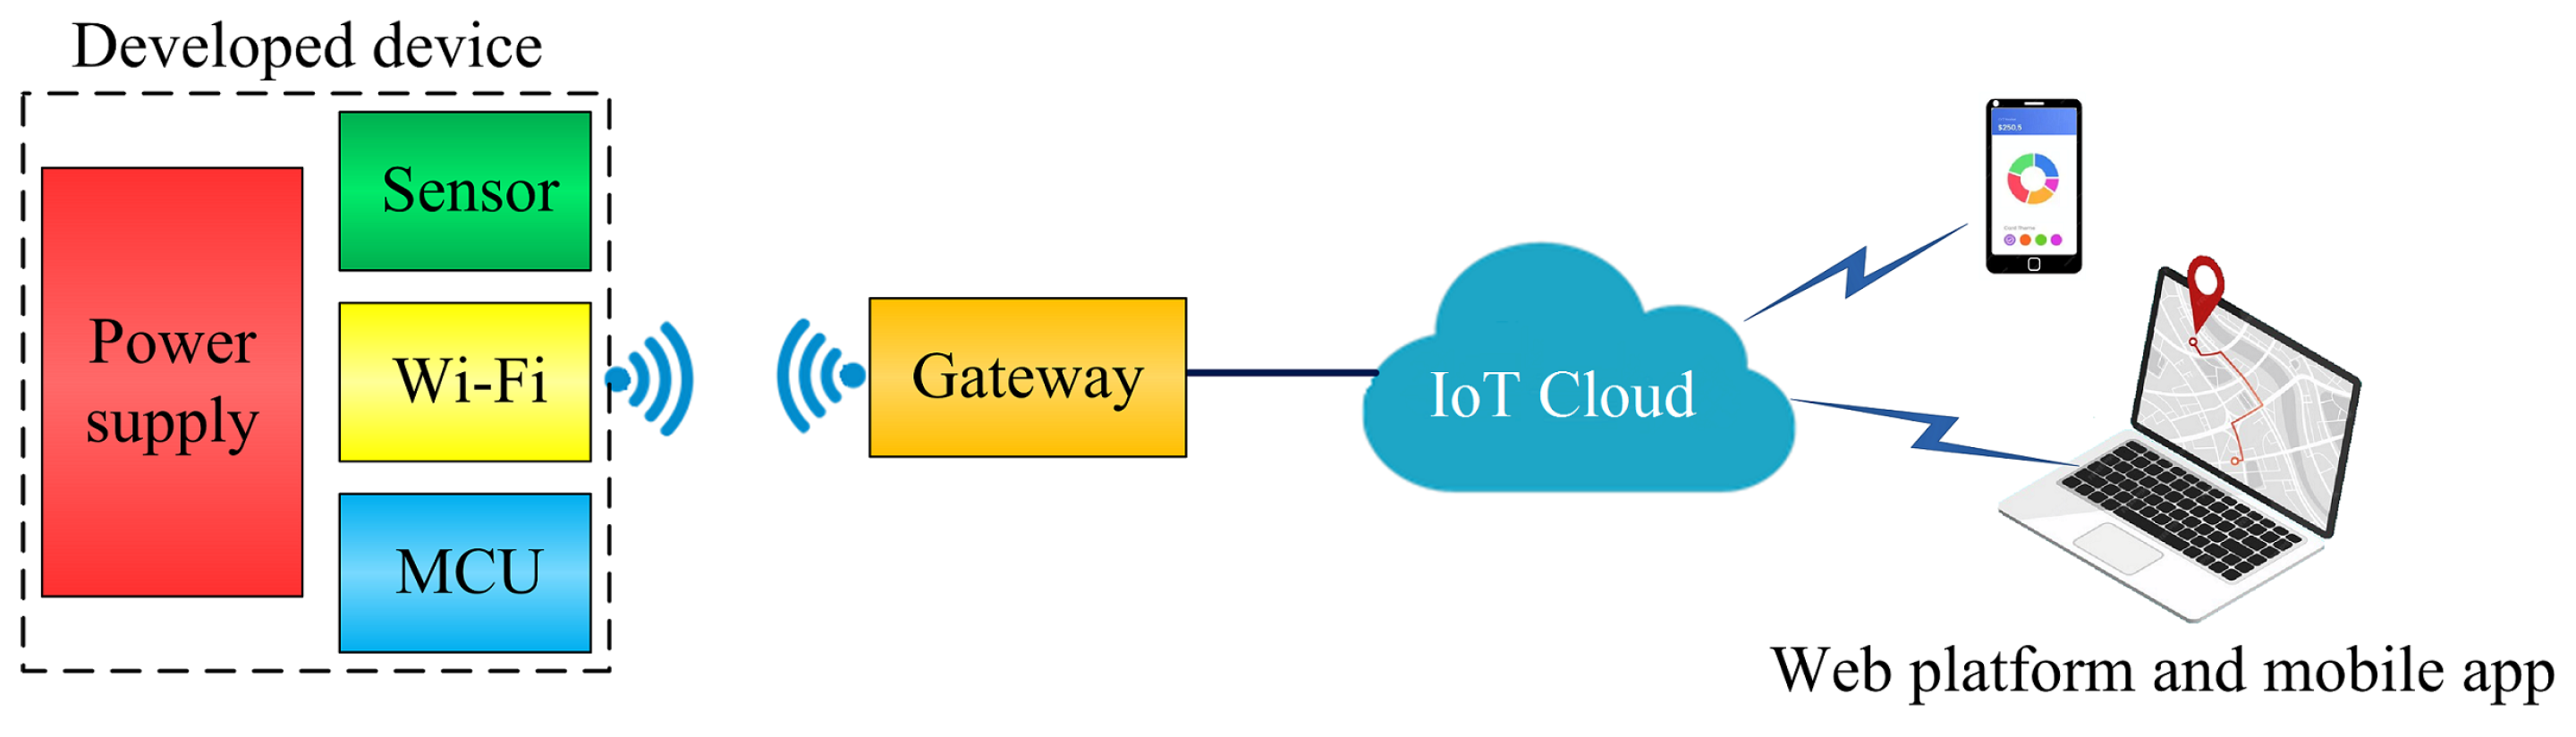
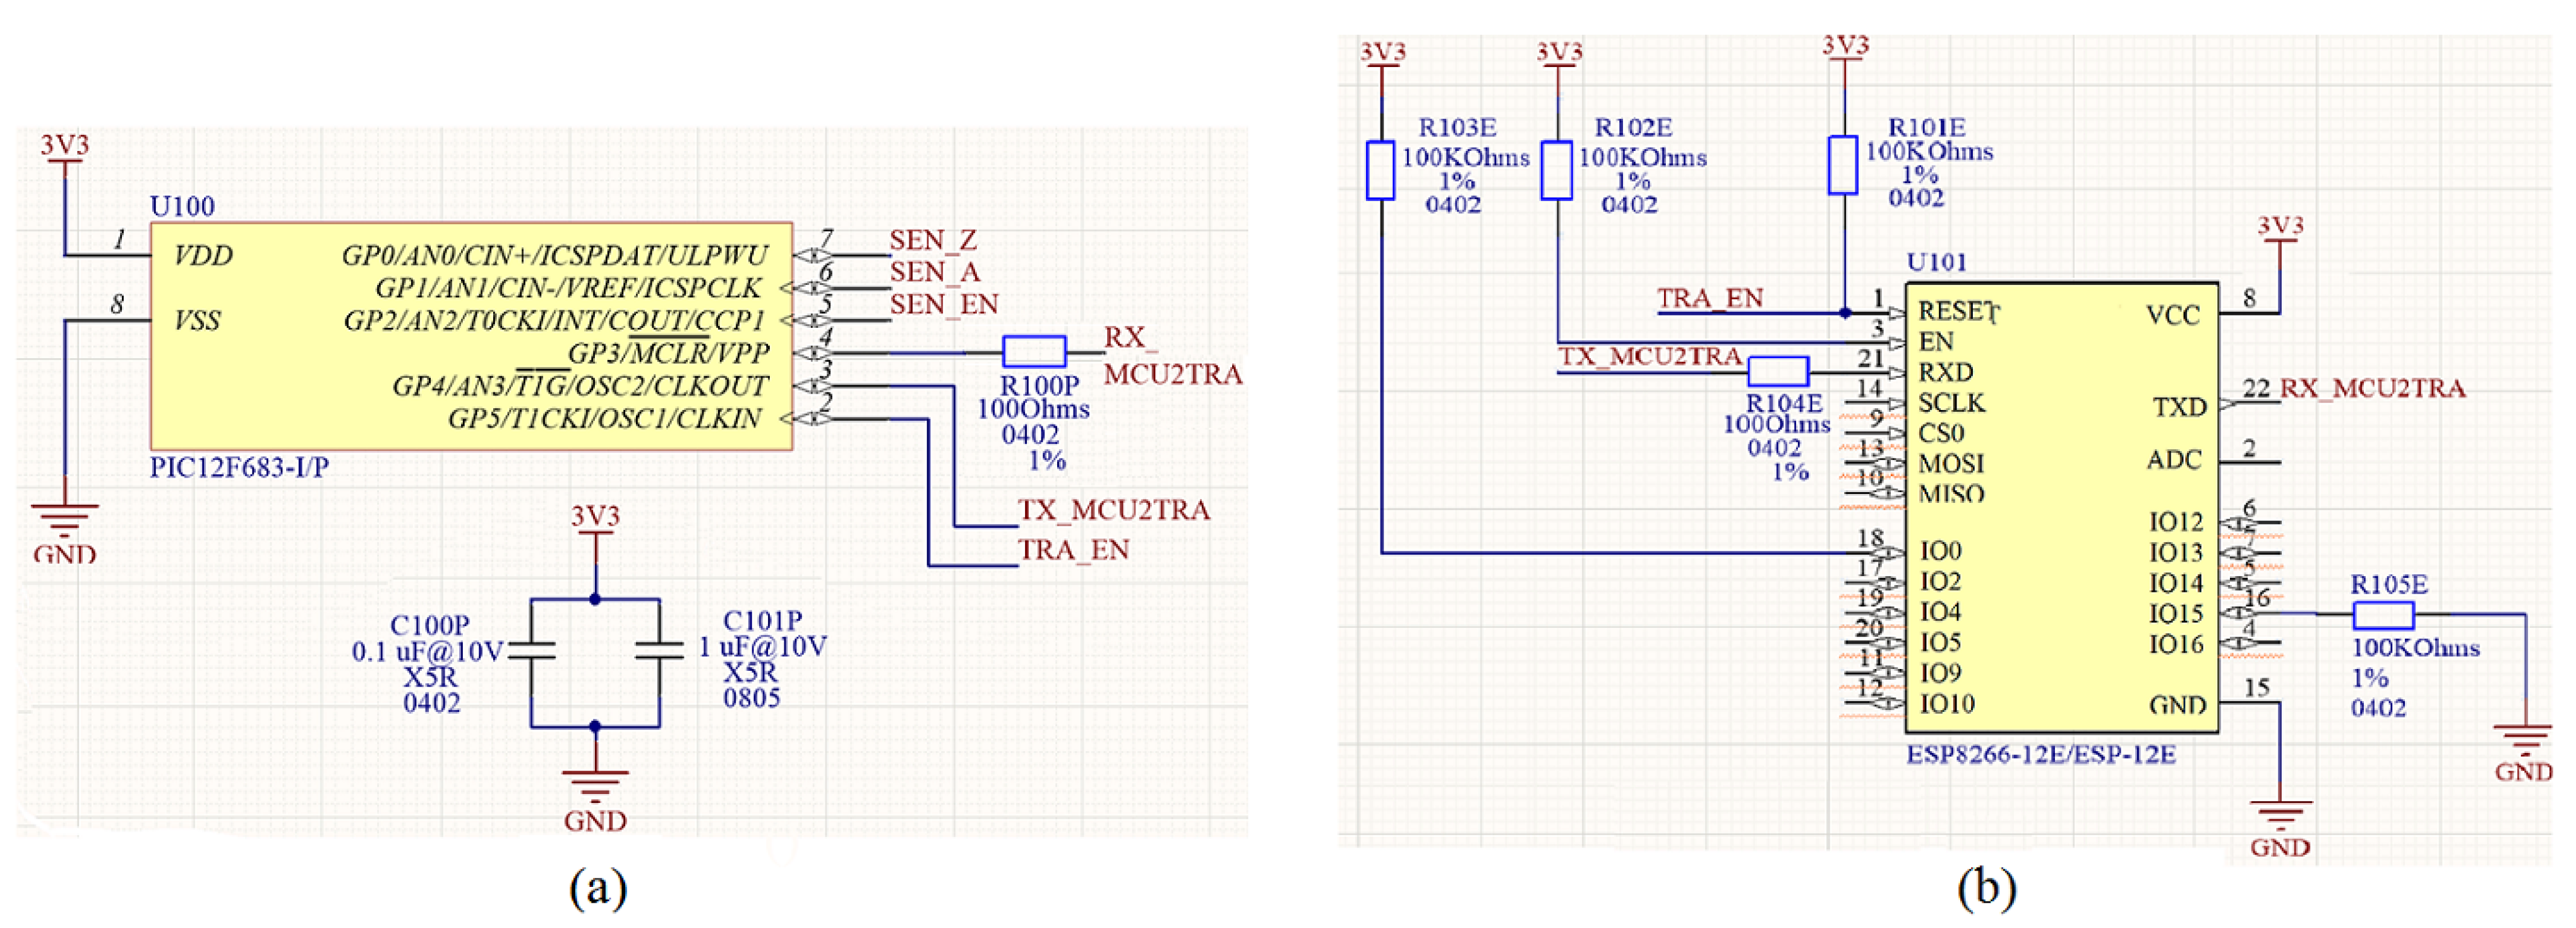
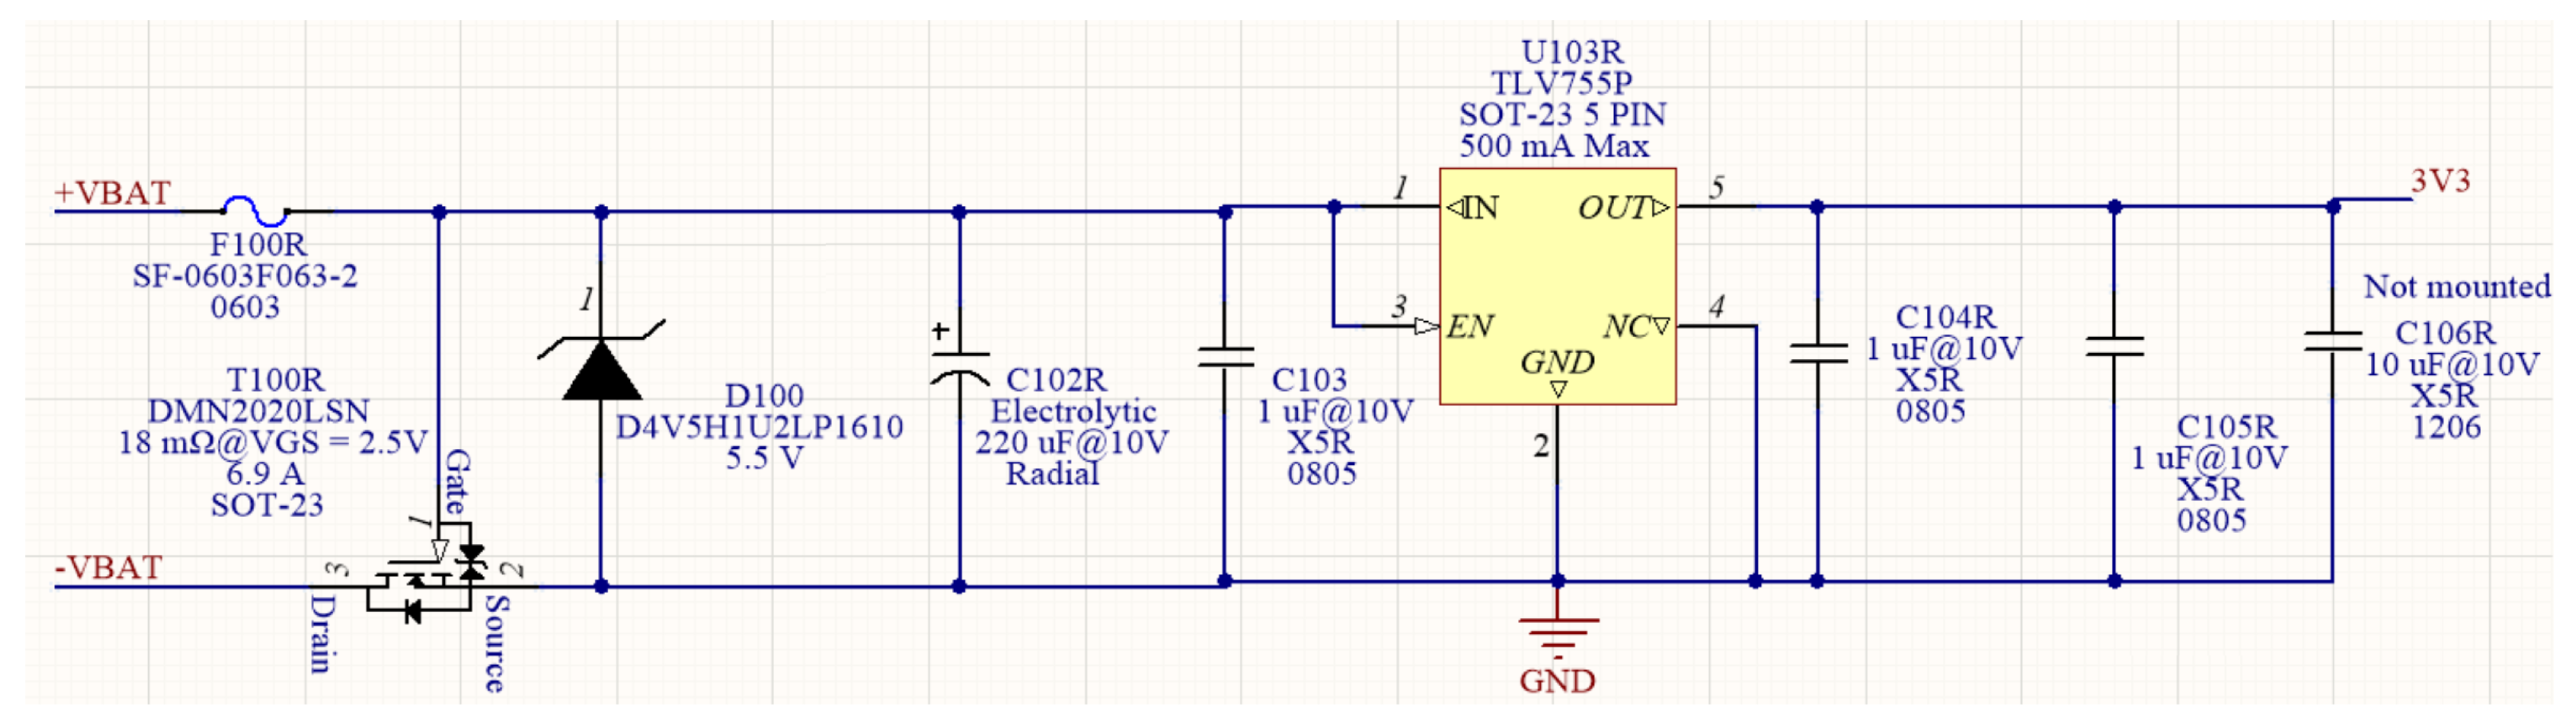
  • Power supply: provides the power needed for the operation of the electronic device;
  • Sensor: measures the position of the magnetic field of the dial gauge magnet, and the analog signals are shared with the MCU;
  • MCU: converts the analog signal to a digital signal and processes it to determine the percentage of LPG level in the tank. Afterward, it uploads the data to the Wi-Fi;
  • Wi-Fi: used to send data to the gateway, which in turn sends it to a server over the Internet.
The data generated by the device can be consulted remotely at any time. However, the value of the last reading sent to the server will be displayed in the app and on the gas company’s web platform, as shown in Table 2. Seven percent of the LPG in the tank has been selected as the percentage from which the alert starts, as according to the gas company, this percentage lasts on average between 4 and 7 days. This time is enough for the user and the company to schedule the refill. Nevertheless, this minimum percentage can be programmed according to the client’s needs.
When the IoT-GL-Sensor does not perform any activity, it goes into sleep mode, to reduce power consumption and increase battery lifespan.

3. Hardware Development

The methodology under which the hardware was designed and developed is the “V” model. This methodology is used to ensure the probability of success in embedded systems and consists of seven main stages [15]. The development of the PCB was carried out considering some international electronic design standards [16]:, which are listed below
  • IPC-2221A [17]: This defines the requirements for PCB design and establishes design principles and recommendations, including component mounting (Through-Hole Technology (THT) or Surface Mount Technology (SMT)), material selection, and thermal management, among others.
  • IPC-2231 [18]: This provides guidelines for establishing a best practice methodology for use in developing a formal DFX (design for manufacturing, assembly, reliability, etc.) process for layout of printed board assemblies that utilize THT and SMT devices.
  • IPC-A 610 [19]: Pictorial interpretive document that indicates various characteristics of the board and/or assembly as appropriate relating to desirable conditions that exceed the minimum acceptable characteristics indicated by the final item performance standard.
  • IPC-D-325A [20]: This establishes requirements and other considerations for the documentation of printed boards and printed board assemblies.
In addition, the developed device takes into account the following Mexican standards:
  • NOM-259-SE-2022 [21]: Systems for measuring and dispensing LP gas. Requirements and specifications.
  • NMX-I-1362-NYCE-2021 [22]: Simple encryption procedure for Internet of Things (IoT) environments.
  • NMX-I-4903-NYCE-2021 [23]: Key performance indicators related to smart and sustainable cities, to assess the achievement of sustainable development goals.
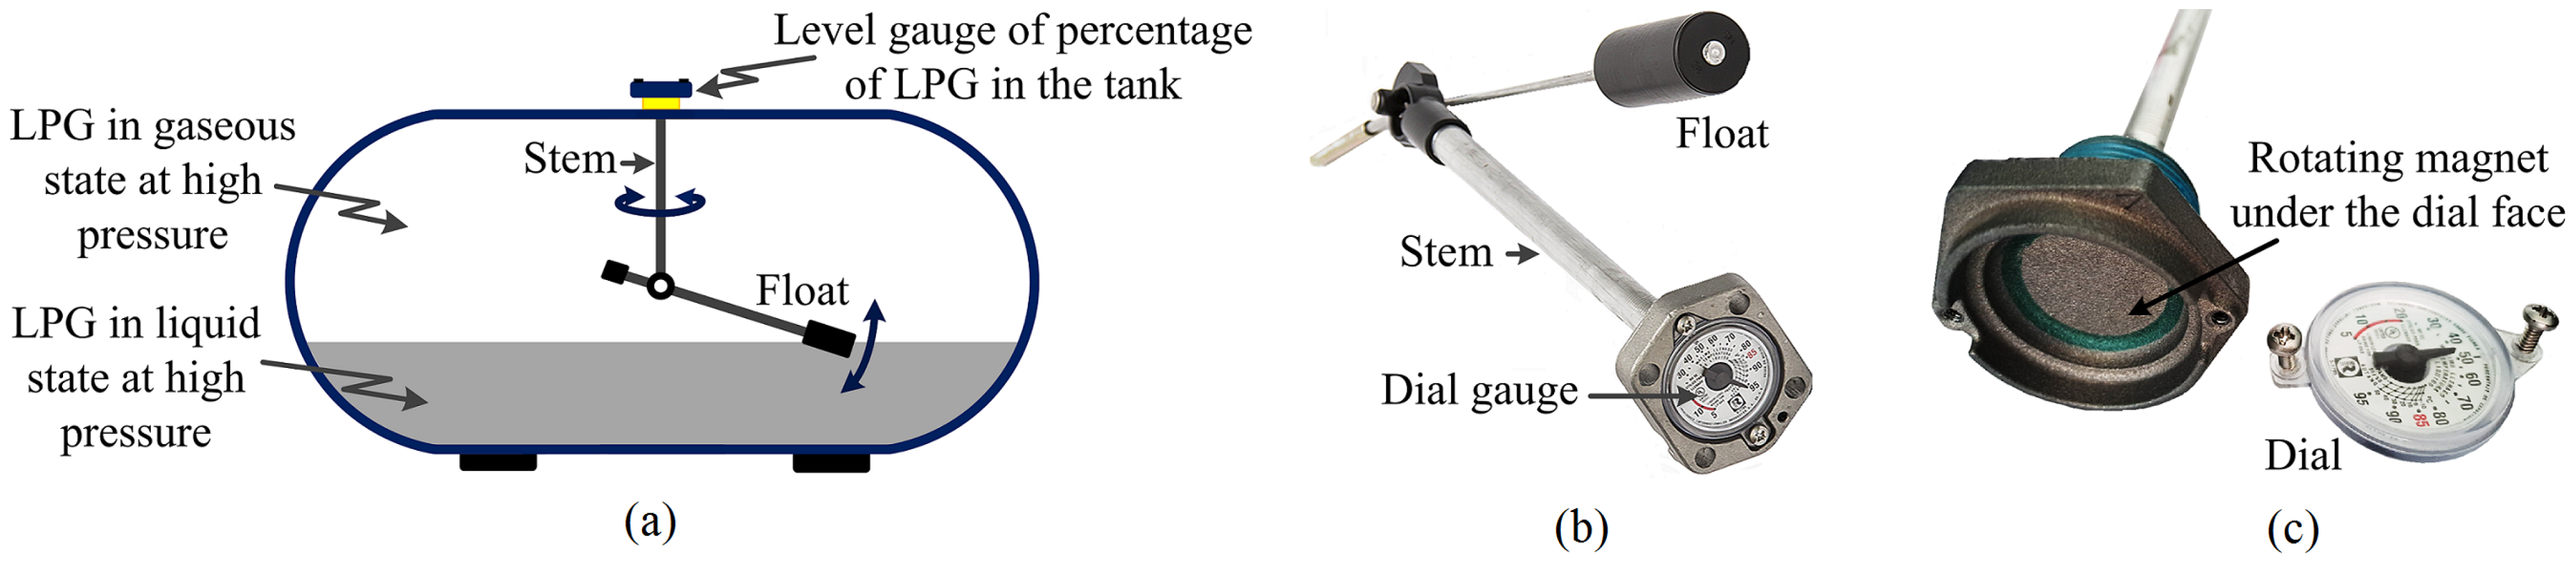
3.1. Sensors

3.1.1. Sensor Selection

A key aspect of this development is the ability to identify the angular position of the magnetic field of the diametric magnet located under the removable dial. Thus, after several experimental evaluations with different affordable linear Hall-effect sensors, it was decided to use TI’s DRV5055 linear Hall-effect sensors [24]. The DRV5055 responds proportionally to the magnetic flux density. It has two recommended operating voltage ranges: 3.0 V to 3.6 V and 4.5 V to 5.5 V, and it consumes 4 mA.
The small size of the selected Hall-effect sensors (SOT-23 package) allows them to be placed under the dial, and this does not interfere with its function. It is proposed to use two Hall-effect sensors in quadrature, i.e., they form an angle of 90° with each other, as depicted in Figure 4a. As the magnet rotates, the analog outputs produce coincident sine and cosine waveforms with a phase shift of 90°, as shown in Figure 4b.
The analog output signals of the two linear Hall-effect sensors (A and Z) shown in Figure 4b have been obtained using a mechanical LPG tank gauging system (see Figure 1b). Both sensors were supplied with 4.0 V and the mechanical float was moved manually, initially considering the tank empty and gradually moving the float upwards until simulating a full tank, and vice versa.
Sensor A located at the bottom of the dial records the magnetic field that decays sinusoidally from 1220 mV to 840 mV as the dial needle rotates clockwise from 0% to 50%. Furthermore, again it starts to increase sinusoidally from 50% to 100%, where it again displays an analog output of 1220 mV for a full tank.
On the other hand, sensor Z located on one side of the dial, at the beginning (empty tank) registers an output of 970 mV. Then, as the magnet rotates clockwise, it shows a minimum value of 870 mV when the tank is at 15% of liquid LPG. As the magnet continues to rotate, it increases sinusoidally to a maximum output of 1165 mV, when the dial gauge indicates 85%. Finally, the magnet continues to rotate until the dial gauge indicates 100% (full tank) and an output of 1040 mV is recorded.
Figure 4b also shows the analog signals for counterclockwise rotation of the dial needle, that is, from a full tank to an empty tank.

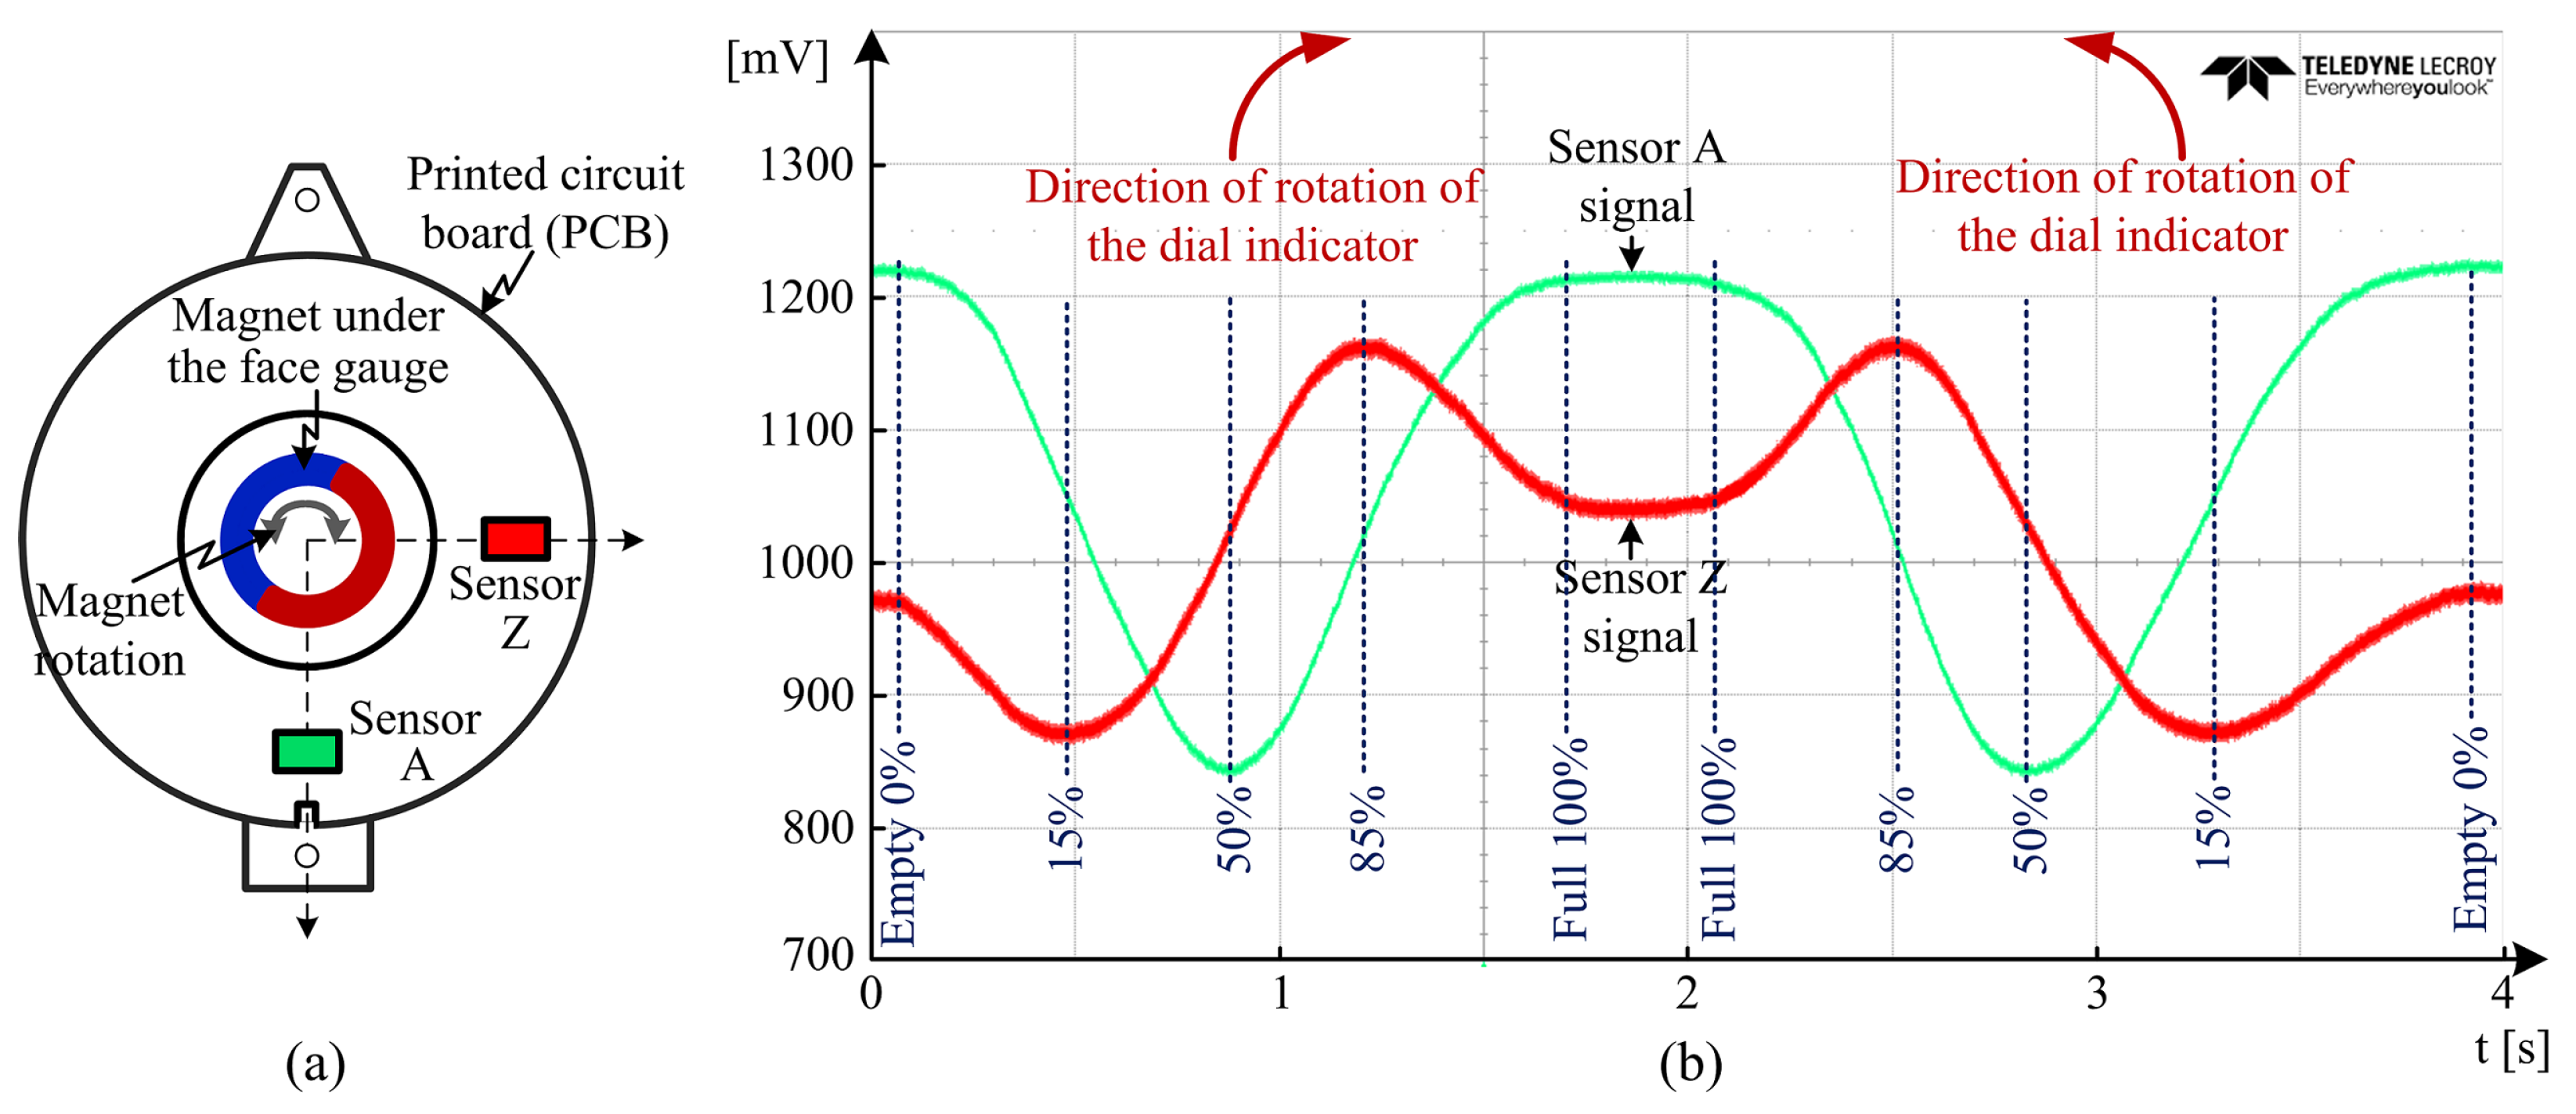
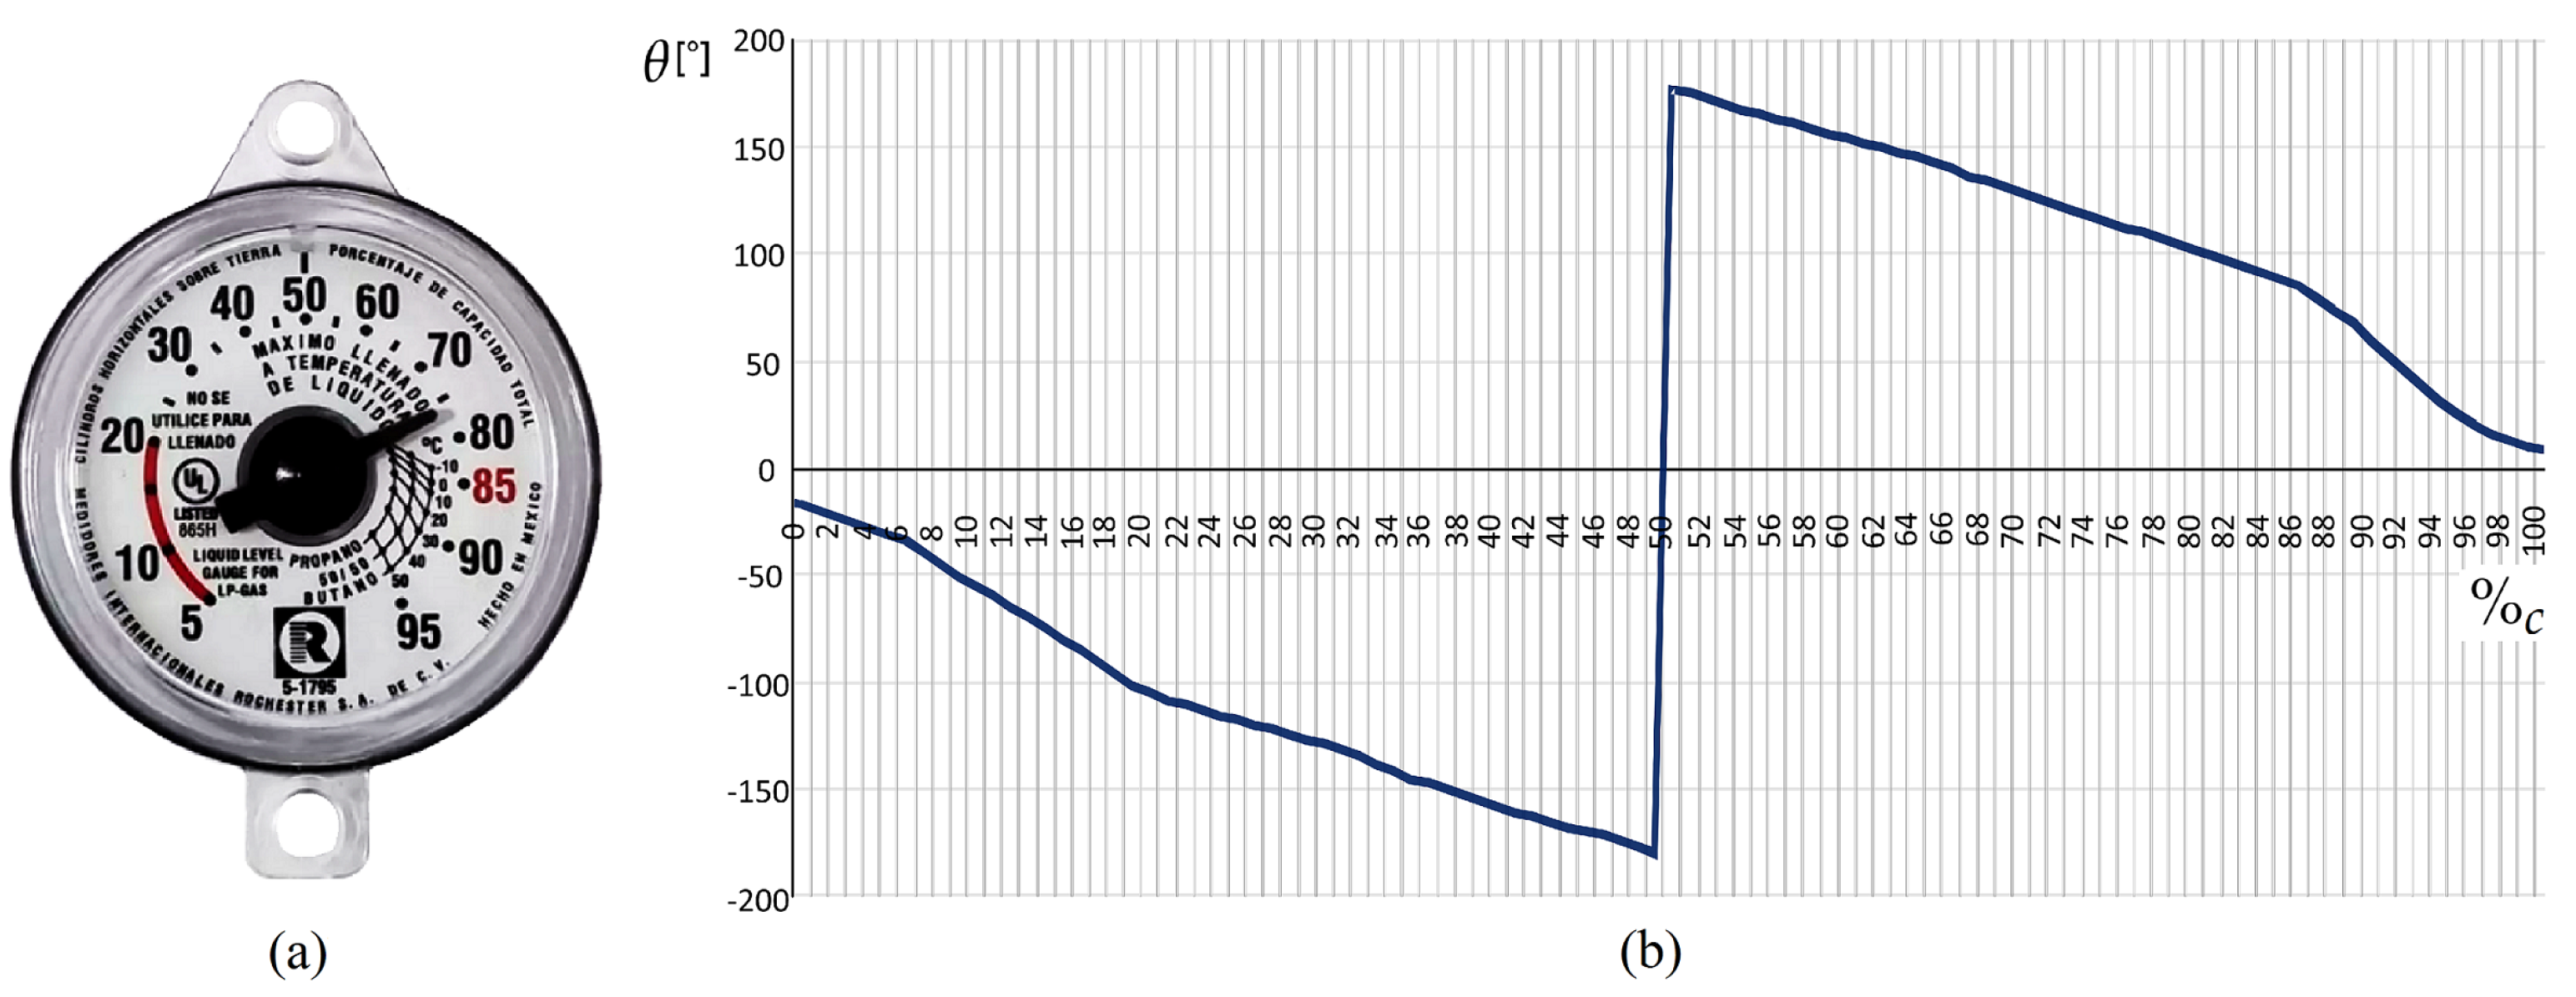
3.1.2. Obtaining the Position of the Magnetic Field

Given the sine and cosine waveform outputs, the angular position of the magnetic field can be calculated using the atan2 function [25]. Nevertheless, for correct operation of the trigonometric function in a digital system, the signals acquired by the analog to digital converter (ADC) must be normalized to maximum values of ±1.
The minimum and maximum values of the analog signals are determined by continuously reading voltages while rotating the magnet from 0° to 360° and vice versa. Performing multiple rotations ensures that the min and max values are more accurate. Then, during normal operation, each new measured voltage is normalized to ±1 as follows [26]:
Y n o r m = V m e a s u r e d V m i n V m a x V m i n 2 V m a x V m i n 2
where Y A , Z . After that, the angle in degrees is calculated as:
θ = a t a n 2 A n o r m , Z n o r m · 180 π

3.1.3. Calibration of the Position vs. Percentage Relationship

At this point, it should be noted that the dial gauge does not display a linear scale, i.e., the percentage values are not evenly distributed, as can be seen in Figure 5a. This is to compensate for the hemispherical cylindrical shape of the tank, which has a greater capacity in the middle part of its body.
Therefore, to determine the percentage of LPG level in the tank as a function of θ and considering the non-linearity of the volume at different levels, it has been proposed to use a lookup table. Then, the fill level percentage is determined from θ and by using a linear interpolation between the angles previously recorded in the lookup table. With this method, it is possible to achieve high accuracy, but it will depend on the number of calibration points used. To estimate the spacing (in degrees) required between calibration points, Equation (3) is used, which is based on experimental data collected with the DRV5055 [26]:
S p a c i n g A c c u r a c y · 8
The spacing between calibration points must not be greater than 30°, or the error can be unpredictable. The lookup table calibrated system is generated as follows.
  • For each calibration percentage, the magnet is rotated to the desired percentage and the measured voltages and the calculated θ are recorded. Several measurements are made for the same percentage (shown on the dial gauge). Then, a type A uncertainty assessment is performed [27]. Therefore, for each calibration percentage, an angle is recorded, which is the mean value of the different estimates.
  • During normal operation, θ has a value between two of the angles assigned to the calibration percentages recorded previously, designated as θ b e l o w and θ a b o v e .
  • Then, the calculated percentage ( % c ) is determined from the calculated θ and by linear interpolation between the angles assigned to the previously recorded percentages, as: 
    % c = θ θ b e l o w θ a b o v e θ b e l o w · % a b o v e % b e l o w + % b e l o w
Figure 5b shows the graph obtained from the calculated θ (Equation (2)) vs. the calculated percentage ( % c ) (Equation (4)), when the mechanical float is manually moved from an empty tank (0%) to a full tank (100%).
Table 3 shows the lookup table calibration, which is used to evaluate Equation (4) in each measurement. It can be seen that θ b e l o w and θ a b o v e have a space of 5°; thus, according to Equation (3), there is an accuracy of 0.625°.
The first column shows the percentage displayed by the dial gauge. Columns two and three show the normalized voltage level at the output of sensors A and Z, respectively. Column four records the value of the calculated θ . The fifth column shows the % c . The sixth column shows the error between the calibration percentage and the calculated one.
For convenience, percentage precision for the mobile app is rounded to +0.5%. That is, values with decimals greater than 0.1 are rounded to 0.5 and decimal values greater than 0.5 are rounded to the next higher value, as shown in column seven of Table 3.
This measurement process is valid for all horizontal stationary tanks of different capacities (100 to 3400 L) that use the same magnetic level gauge system (see Figure 1b).

3.2. MCU

To perform ADC of sensor signals and corresponding calculations to determine the LPG level in the tank, a Microchip PIC12F683 Microcontroller unit (MCU) is used [28]. Processing speed, memory, and cost were taken into account when selecting it.
The PIC12F683 is a miniature 8-pin 8-bit PIC MCU, it has a total of 6 I/O pins with direction control and four channel 10-bit accuracy ADC. Power features: power-saving sleep mode, wide operating voltage range (2.0 V to 5.5 V), deep sleep current: 50 nA. Operating current: 1 μA to 20 μA. Program memory comes with 3.5 KB memory space, and RAM and EEPROM data memories are 128 bytes and 256 bytes, respectively.
Figure 6a shows the schematic connection diagram that was designed with the help of the MCU’s datasheet. In Figure 6a, the signals labeled SEN_Z and SEN_A are the signals coming from both Hall-effect sensors, and the SEN_EN signal is their reference.

3.3. Wi-Fi

Although nowadays, there are several wireless devices for sending data through low-power wide area networks (LPWAN), in Latin America, not all wireless technologies have coverage due to a lack of infrastructure, as is the case for Sigfox [29,30], or wide-range communication, such as LoraWAN, which in urban areas has a maximum range of 500 m [31]. It is also worth noting that during conceptualization, the gas company proposed to use Wi-Fi communication for the reasons mentioned above, among others.
Then, according to the gas company’s requirements, an ESP-12E module [32] is selected for wireless data communication. It presents the following features: Wi-Fi 2.4 GHz, support WPA/WPA2, 802.11b protocol, Wi-Fi Direct (P2P), soft-AP, Integrated TCP/IP protocol stack, +19.5 dBm output power in 802.11b mode, and  integrated low power 32-bit MCU.
The ESP-12E module and its GPIOs operate at 3.3 V. This consumes an operating current of 80 mA, in light sleep mode 0.20 mA, and in deep sleep mode 10 μA. Without data transmission, the Wi-Fi Modem circuit can be turned off and CPU is suspended to save power according to the 802.11 standard [33]. The schematic connection diagram of the Wi-Fi device is shown in Figure 6b [34].

3.4. Power Supply

Stationary domestic LPG tanks are commonly installed on the roof of houses without access to it, and since it is not common to have power outlets on roofs, considering powering the device through a fixed electrical outlet is not feasible. It has been proposed to use a small PV cell to power a similar device [11]; however, according to user feedback, the device stops working after 5 or 6 months. This is because the PV cell is unable to recharge the batteries, and the use of a higher-capacity PV cell makes the system more expensive.
In this case, Rechg.-Li-ion batteries are not used, since a recharging circuit is not considered in this development. In addition, it is convenient to use batteries of acceptable cost with a minimum lifespan of up to one year. Considering the above, and since voltage levels of 4.0 V and 3.3 V are required for the MCU, sensors, and ESP module, respectively, it is proposed to use three 1.5 V AA-size batteries, connected in a series circuit.

3.4.1. Battery Lifetime Estimation

The energy consumption of the IoT-GL-Sensor can be divided for analysis into two modes: sleep mode and active mode. Sleep mode is the period in which the device does not perform any tasks. In the same context, the device enters active mode when it acquires, processes, and transmits data. Therefore, the total energy consumed by the IoT-based device is composed of the energy consumed during the sleep period and the energy consumed during the active period [35].
In this application, the light sleep mode is used, as this turns off the CPU and system clock, but keeps the memory powered. This mode also follows the delivery traffic indication message heartbeat in order to appear to be still associated with the gateway. Unlike deep sleep mode, which shuts down everything except the RTC memory, in this mode, the association with the gateway is lost and must be re-established.
Table 4 shows the voltage and current consumed when the main devices are in sleep modes. These parameters were obtained from the respective datasheets.
From Table 4, it is determined that the device in light sleep mode requires i S l e e p = 0.201  mA. That is, the current consumption per hour in this mode is i S l e e p h = ( 0.201 ) · ( 3600 ) = 723.6 mAs.
Additionally, the current required in active mode can be calculated as follows [35,36]:
i A c t i v e = i W u M C U + i M e a s u r e + i P r o c D a t a + i W u W i F i + i D a t a T r a n s
where i W u M C U is the current required to wake up the MCU, i M e a s u r e is the current used to activate sensors and perform the measurement, i P r o c D a t a is the current used for data processing, i W u W i F i represents the current needed to wake up and connect the Wi-Fi to the network, and  i D a t a T r a n s is the current required to transmit the data to the gateway.
Table 5 shows the time, voltage, and current parameters in active mode. The current required for each action is provided by the datasheet of each device. The active times of each action were measured with an oscilloscope.
Substituting the values from Table 5 into Equation (5) results in i A c t i v e = 0.01 + ( 8 + 0.01 + 0.01 ) + 16 + 120 = 144.03 mA. Since two measurements are made per day, the daily current consumption in active mode is i A c t i v e = 288.06 mA.
Two data transfers occur per day, with an average of 2 24 = 0.08333 data in one hour. Considering that the total time to transfer the two measurements in active mode (from Table 5) is t A c t i v e = 8.4 s, per day, this averages to 8.4 24 = 0.35 s per hour. So, in one hour, it consumes on average a current of i A c t i v e h = ( 0.08333 ) · ( 0.35 ) · ( 288.06 ) = 8.4017 mAs [37].
After calculating the average power consumption, the battery capacity (B.C. ) required to power the device can be selected. In this case, it is proposed to use three (1.5 V, 3000 mAh) AA-size batteries (Li-FeS2) connected in series, so the capacity is the same but with a voltage level of 4.5 V. Therefore, the lifespan (B.L.) of the battery bank can be evaluated as follows:
B . L = B . C ( i S l e e p h + i A c t i v e h ) = 3000   mAh · 3600   s ( 723.6   m A s + 8.4017   m A s ) = 14 , 754.0641   h = 1.688   y e a r s
factors such as temperature and humidity can have an impact on the battery capacity and leakage current of the electronic components used. So, considering all the practical difficulties, it could be reduced to about 1.5 years. Alternatively, it is possible to double the battery life by taking only one measurement per day.
From Equation (6) and counting the number of measurements and data transmissions, it is possible to estimate the remaining percentage of the battery charge and display the data graphically in the app.

3.4.2. Voltage Regulator

The output voltage (4.5 V) of the battery bank is higher than the 4.0 V set to power the MCU and sensors and much higher than the 3.6 V which is the tolerable limit of the ESP module. Moreover, the current spikes demanded mainly by the ESP module can damage components. Therefore, two linear regulators have been used to adjust these voltage levels and to absorb the current spikes, as follows.
(1) To obtain constant 4.0 V, the Microchip’s MIC5205 regulator is used. It is designed especially for hand-held, battery-powered devices, and it includes a CMOS or TTL compatible enable/shutdown control pin. When shut down, power consumption drops nearly to zero. This regulator ensures 150 mA output, ultra-low noise output, high output voltage accuracy, and reverse battery protection, among other features. In addition, it has been very useful to turn “on” and turn “off” the sensors while they are not in operation by forcing the EN (enable/disable) pin [38].
The MIC5205 is available in fixed and adjustable output voltage versions in a small SOT-23-5 package. The schematic connection diagram of this regulator, as well as the expressions and circuits for calculating and connecting the peripheral components, can be found in the datasheet.
(2) To obtain a fixed voltage of 3.3 V to power the ESP, TI’s TLV755P voltage regulator has been used. This is an ultra-small, low quiescent current, low-dropout regulator (LDO) that sources 500 mA. The TLV755P requires a 1 μF or greater capacitor on the input pin of the LDO. The input capacitor counteracts reactive input sources and improves transient response and PSRR. This also requires an output capacitance of 0.47 μF or larger for stability. Adding capacitance to the output also achieves the voltage filtering effect [39]. In addition, the use of short-circuit and reverse voltage protection using a N-channel MOSFET circuits were considered. The schematic connection diagram of this circuit is shown in Figure 7.
Since the two main devices (MCU and Wi-Fi) use different voltage levels, there may be a communication problem as the output signals are of different logic levels. To overcome this, a signal coupling circuit has been implemented using two transistors. One transistor is used as a switch by stepping down the 4.0 V of the MCU to 3.3 V, which is acquired by the ESP module. Similarly, the 3.3 V is stepped up by means of another transistor so that the ESP can communicate with the MCU.
It is worth mentioning that while the MCU can transmit data both synchronously and asynchronously, the ESP module can only do so asynchronously, and hence, the MCU has been forced to operate in asynchronous mode.

3.5. PCB Design

Table 6 summarizes the list of main electronic components used to manufacture the IoT-based sensor PCB and their commercial cost per unit. To calculate the approximate unit cost, considering the manufacture of 5000 pieces, manufacturing costs, testing costs, payment of certifications, housing cost, and development management, among others, had to be taken into account. This gave a rounded cost of 40.00 USD per unit.
Once all the components were selected and the circuit diagrams designed, the PCB concept was created with the help of a CAD tool [15]. It is worth mentioning that a design methodology must be followed to reduce the size and decrease losses and power consumption [40]. Likewise, one must avoid designing a PCB that is difficult to assemble and expensive to produce.
The footprint of the Hall-effect sensors PCB is shown in Figure 8a and its 3D model is shown in Figure 8b. When designing the host card, it was considered to avoid placing devices or traces in the vicinity of the wireless communication antenna to avoid noise. In addition, it was also considered that the MCU would be placed in a socket for quick replacement. The footprint of the host card PCB is displayed in Figure 8c, and its 3D model in Figure 8d.
Once the correct operation of the electronic designs was verified by prototyping, the PCBs were manufactured.

4. Software

4.1. Communication Protocols

The communication sequence is carried out as follows:
  • The IoT-GL-Sensor generates the data, i.e., the percentage of the LPG level in the tank and the remaining percentage of the battery charge, and sends them to the Internet gateway using MQTT protocol [41]. MQTT is a lightweight, publish–subscribe-based messaging protocol. This means that clients, such as individual devices or gateways, publish their data to a centralized MQTT broker. In addition, the ESP maintains stable connections over MQTT that it offers smooth performance even in environments with unreliable and fluctuating network coverage and MQTT’s low bandwidth requirements help the ESP to ensure reduced power consumption. Using libraries such as OpenSSL, the ESP handles safe transfer of data over MQTT (FTPS, HTTPS). It is essential for IoT applications as data privacy is a priority. As a consequence, MQTT is widely used in IoT applications.
  • The Internet gateway acts as a communication bridge between the IoT-GL-Sensor and the remote server or IoT cloud. For secure data transfer, it uses the HTTPS protocol. HTTP is a protocol to transfer data over the internet. When that data are encrypted with SSL/TLS, it is called HTTPS [42]. The HTTPS protocol encrypts the data transmitted between the client and the server using SSL/TLS encryption to ensure that it cannot be compromised or stolen by unauthorized parties, such as a hacker or cybercriminals [43].
  • The server warehouse stores the data and provides an API. The API_REST uses the HTTP protocol and uses the JSON format for data transfer. It allows the mobile app or gas company’s web platform to make requests over the Internet to access the data. The interface uses security mechanisms such as authentication using a username and password. The authentication system consults a user directory, which is stored on the server. If the credentials match, the user is allowed to access the data.

4.2. Firmware

The developed IoT-GL-Sensor operates in two modes, as follows.
Configuration Mode: when the IoT-GL-Sensor is turned “on” for the first time, it generates a local access network to establish an initial pairing with a mobile device for setting. Once the initial pairing with the mobile device is established, it is accessed to a Wi-Fi setting screen, as displayed in Figure 9a. This screen requests the Wi-Fi network name (service set identifier), network password, and the serial number of the IoT-GL-Sensor.
After completing the requested fields, an IoT-GL-Sensor ID is generated, as can be seen in Figure 9b. The generated ID is stored in a fixed memory location of the developed device and will be used later during registration to use the app.
In case the IoT-GL-Sensor cannot establish connection with the selected network, it waits 5 s and will try again. After three attempts, an error message is generated.
Sensor Mode: this mode operates once the IoT-GL-Sensor is configured and is responsible for: (1) processing the output signals from the Hall-effect sensors and determining the percentage of the LPG level inside the stationary tank, (2) calculating the battery life percentage, and (3) sending the data to the remote server via the Internet.

4.3. The App

An app has been developed to make the hardware functional, which is the so-called “Digi Gas Gauge”. At the moment, it has only been developed for the Android operating system and allows you to remotely view the percentage of LPG level inside a domestic stationary tank, and displays a battery level icon. For the app to work, the mobile device where it is installed must have an Internet connection, otherwise it will not be possible to consult the data measured by the IoT-GL-Sensor.
The main instructions for using the “Digi Gas Gauge” app are described below.
(1) The app home screen (see Figure 10a) requests a tank nickname and the registered password to display the percentage of LPG level in the tank. A valid tank nickname and password are required to access the system, so that only registered users can enter.
(2) When the app is accessed for the first time, the user must create an account. Clicking on “create account” will open a new screen (see Figure 10b), which requests access to the precise location where the IoT-GL-Sensor is installed so that the gas company will be able to assign its nearest filling plant to provide the home refilling service. If the necessary permission is not granted, the app cannot be used.
It should be noted that the exact location where the IoT-GL-Sensor has been installed is set by the location of the mobile device, so the tank user’s mobile device must be very close to the IoT-GL-Sensor to be registered, since these data will be stored in the server warehouse.
(3) Once the app is allowed to establish the exact location of the mobile device, a registration screen will open (see Figure 10c), where the requested data must be entered to register the IoT-GL-Sensor and have access to the app. It is worth mentioning that all fields are required, that is, if any of them are missing, then you will not be able to continue with the registration process.
(4) Validations have been included during registration that allow the user to visually confirm that the data entered are correct. For example, if a user tries to register a sensor ID that is already in use or has not yet been generated, then a warning message will be displayed, as shown in Figure 10d. Likewise, if an invalid phone number or email is entered, warning messages will also be displayed, as shown in Figure 10e. The password must have at least one uppercase letter, one lowercase letter, one number, and a minimum length of eight characters. Otherwise, the application will not allow user registration and will display an error message.
(5) When all entered data are valid and the “Register” button is pressed, a waiting screen is displayed as shown in Figure 10f. Once the IoT-GL-Sensor is registered, the app returns to its home screen.
(6) By accessing the “Digi Gas Gauge” app with a valid tank nickname and password (see Figure 10g), a screen opens showing the percentage of the LPG level in the stationary tank in a graphic and understandable way for the user, as shown in Figure 10h. In addition, this screen displays the battery charge level of the IoT-GL-Sensor.
In the case of the gas company’s web platform, to access the gas level data of each tank, a username and the ID sensor to be displayed are requested.

4.4. Gas Company Web Platform

The gas company web platform was developed by a software development company and will not be explained in this work.
On the Google Maps platform, developers can access an SDK and API that they can integrate into the gas company’s web platform. This is especially useful for locating customers’ tanks or for tracking the location of tanker trucks in real time.
The GPS system of each tanker truck sends data (longitude and latitude) to the server in real time. The backend processes and stores the data in the server warehouse, which in turn responds to requests from the web platform by displaying it in the web interface. All notifications about GPS events are sent using WebSocket [44,45].
With the help of the developed IoT-GL-Sensor, the gas company identifies the stationary domestic tanks with a low gas level (equal to or less than 8%) and notifies customers to avoid unexpected shortages and advise them to refill their tank. Once customer refill requests have been confirmed, and since the location of each stationary tank is known, it is possible to plan the distribution routes. The backend processes distribution route planning using an optimization algorithm, which is explained in the next section.

5. Optimization of LPG Distribution Routes Using Clark and Wright Heuristics
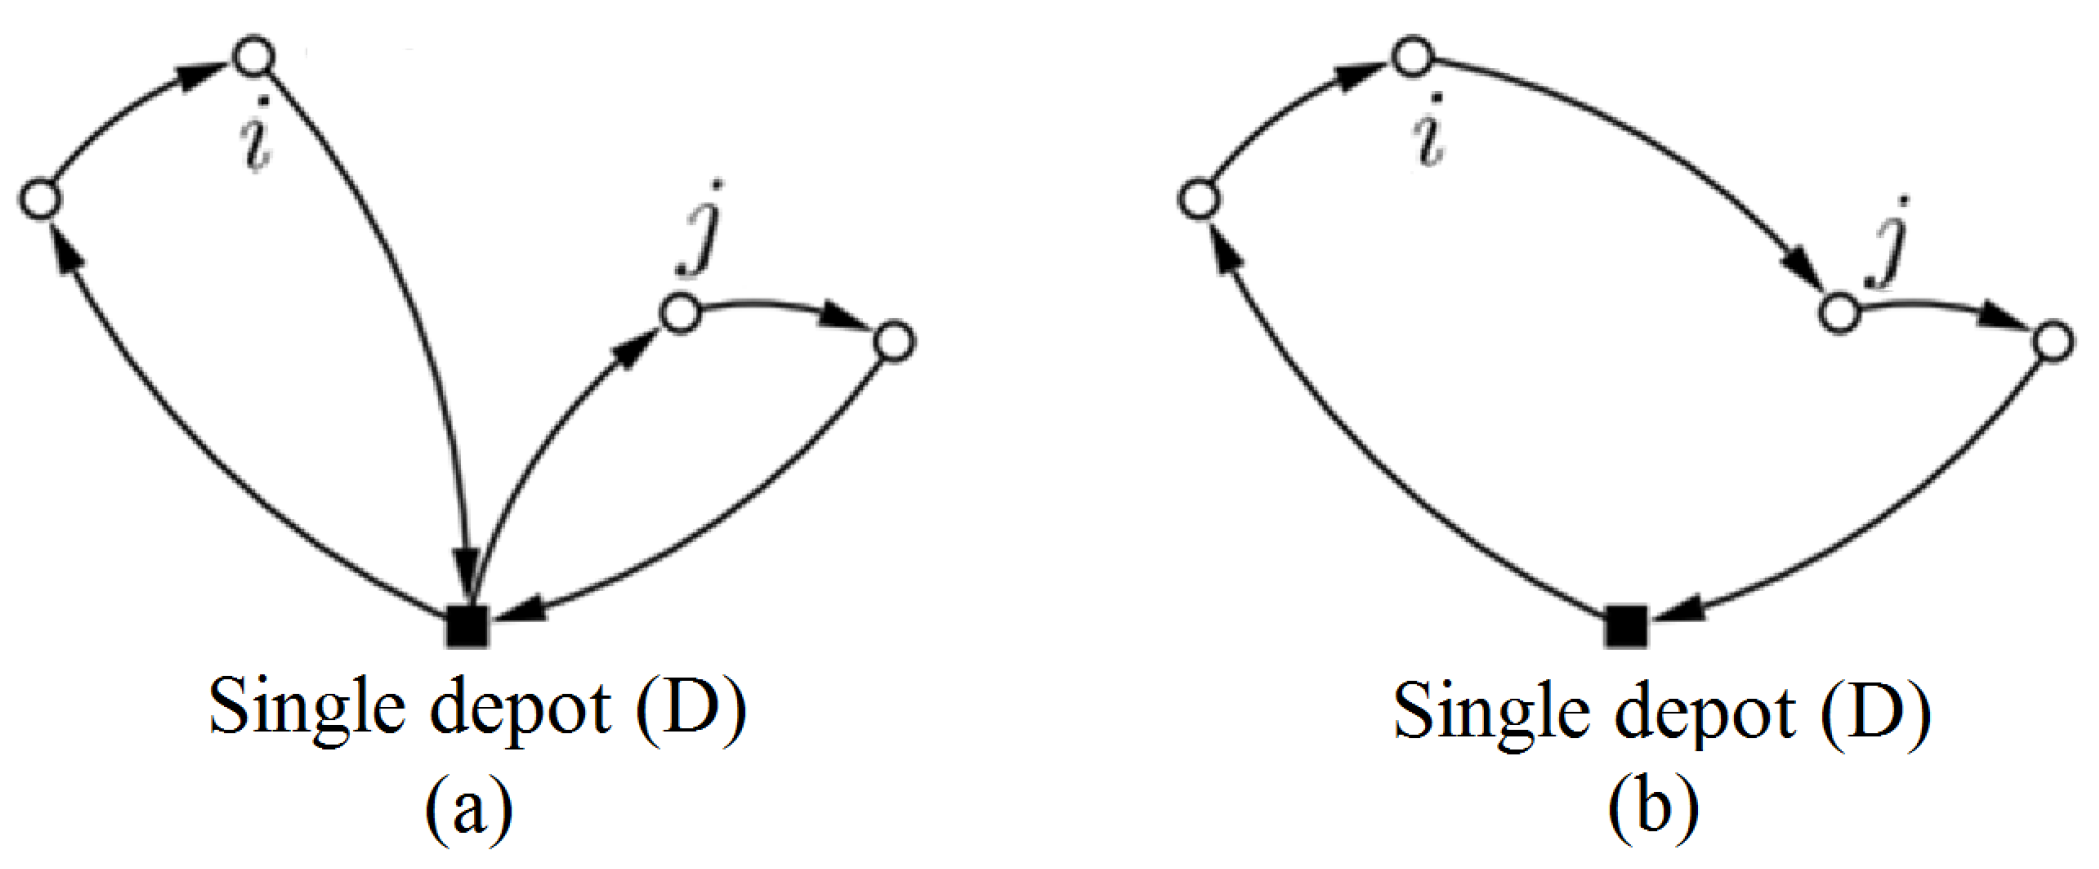
5.1. VRP

The vehicle routing problem (VRP) is a powerful tool for solving logistics problems, as it allows improving the sequence of visits to different locations, minimizing the distance or travel time, while including constraints such as vehicle capacity, traveled distance, or delivery time windows [46]. This type of optimization problems is of the combinatorial type and usually belongs to the NP-Hard class (Non-deterministic Polynomial-Hard), which means that it is not possible to solve them in polynomial time [47].
Heuristics and metaheuristic methods have been proposed to solve VRP problems [48]. Metaheuristic algorithms are the combination of different heuristic techniques to perform the search domain exploration in a more efficient way; these include particle swarm optimization [49,50], simulated annealing [51], genetic [52,53], and neural networks [54].
On the other hand, heuristics algorithms find an optimal solution from the total set of feasible solutions, but they do not guarantee that the selected solution is the most optimal. They use iterative techniques that gradually create a solution, where at each step, a new element is added, which is evaluated and discarded when it is not better than another. These include the Fisher and Jaikumar [55] and Clark and Wright [56,57,58] algorithms.
The use of a heuristics in any NP-Complex problem is justified by searching for local solution spaces and trying to find optimal solutions in reasonable times and avoiding stagnation in the universe of solutions. In issues with very large search spaces, it is essential to use this type of technique, since this formulation discriminates unpromising search paths, which, if objectively posed, will always yield optimal solutions. It is worth mentioning that these models sacrifice the validation of the universe of solutions and the detection of the most optimal solution, in order to generate one in a reasonable time.
By far the best-known heuristic approach to the VRP problem is the “savings” algorithm by Clark and Wright. This algorithm involves a single depot, a homogeneous fleet of vehicles, and a set of customers who require delivery of goods from the single depot. The basic concept is to find a feasible set of vehicle routes that minimizes the total travel distance and the total number of vehicles used, taking into account some constraints such as vehicle capacity, delivery time windows, or distance traveled. This makes it ideal for solving the optimal route selection problem for home delivery of LPG by tanker trucks.
For the reasons stated above, in this development, it is proposed to use the Clarke and Wright savings algorithm. The algorithm, in addition to providing a reasonably optimized solution for the VRP, is much simpler and less computationally intensive than the metaheuristic algorithms [59].

5.2. Clark and Wright Savings Algorithm

The Clark and Wright savings algorithm operates on a graph where the vertices correspond to individual customers. The algorithm starts with the initial solution, which consists of elementary routes. An elementary route, in the form of single depot (D) → served point → single depot (D), is created for each served point, e.g., in Figure 11a, the generation of two different routes (D→ , , i →D) and (D→ j , , →D) is shown. This initial solution is then modified, and the routes are merged to form a new route (D→ , , i j , , →D), as shown in Figure 11b, to achieve maximum savings in total cost.
   The distance or time saving obtained by such a joining can be expressed as:
s i j = c i 0 + c 0 j c i j
since the new solution will no longer use the arcs ( i , 0 ) and ( 0 , j ) , the arc ( i , j ) will be added. Thus, in this algorithm, we start from an initial solution and make the unions that generate the greatest savings, provided that the problem restrictions are not violated.
Since this algorithm is well known, it will not be discussed further in this article; however, a complete description of single depot VRP can be found in [60]. Furthermore, a simplified listing of Clark and Wright Heuristics for VRP is shown in Algorithm 1.
Algorithm 1 Clark and Wright algorithm for VRP
  1:
Begin
  2:
Define the LPG filling plant d = 0 and the set of customers C = { 1 , 2 , , n }
  3:
Assign demand q i for each customer i C
  4:
Generate initial routes R i = { 0 i 0 } , i C
  5:
Savings calculation
  6:
for each pair of customers i , j C , with  i j  do
  7:
    Calculate s i j = c i 0 + c 0 j c i j
  8:
end for
  9:
Sort out savings s i j in descending order  
10:
Join routes
11:
while there are savings s i j  do
12:
    Select the pair ( i , j ) with greater savings
13:
    if R i R j and Σ q k Q , join R i and R j
14:
end while
15:
End
16:
Return the remaining routes to the set R l a s t

6. Results

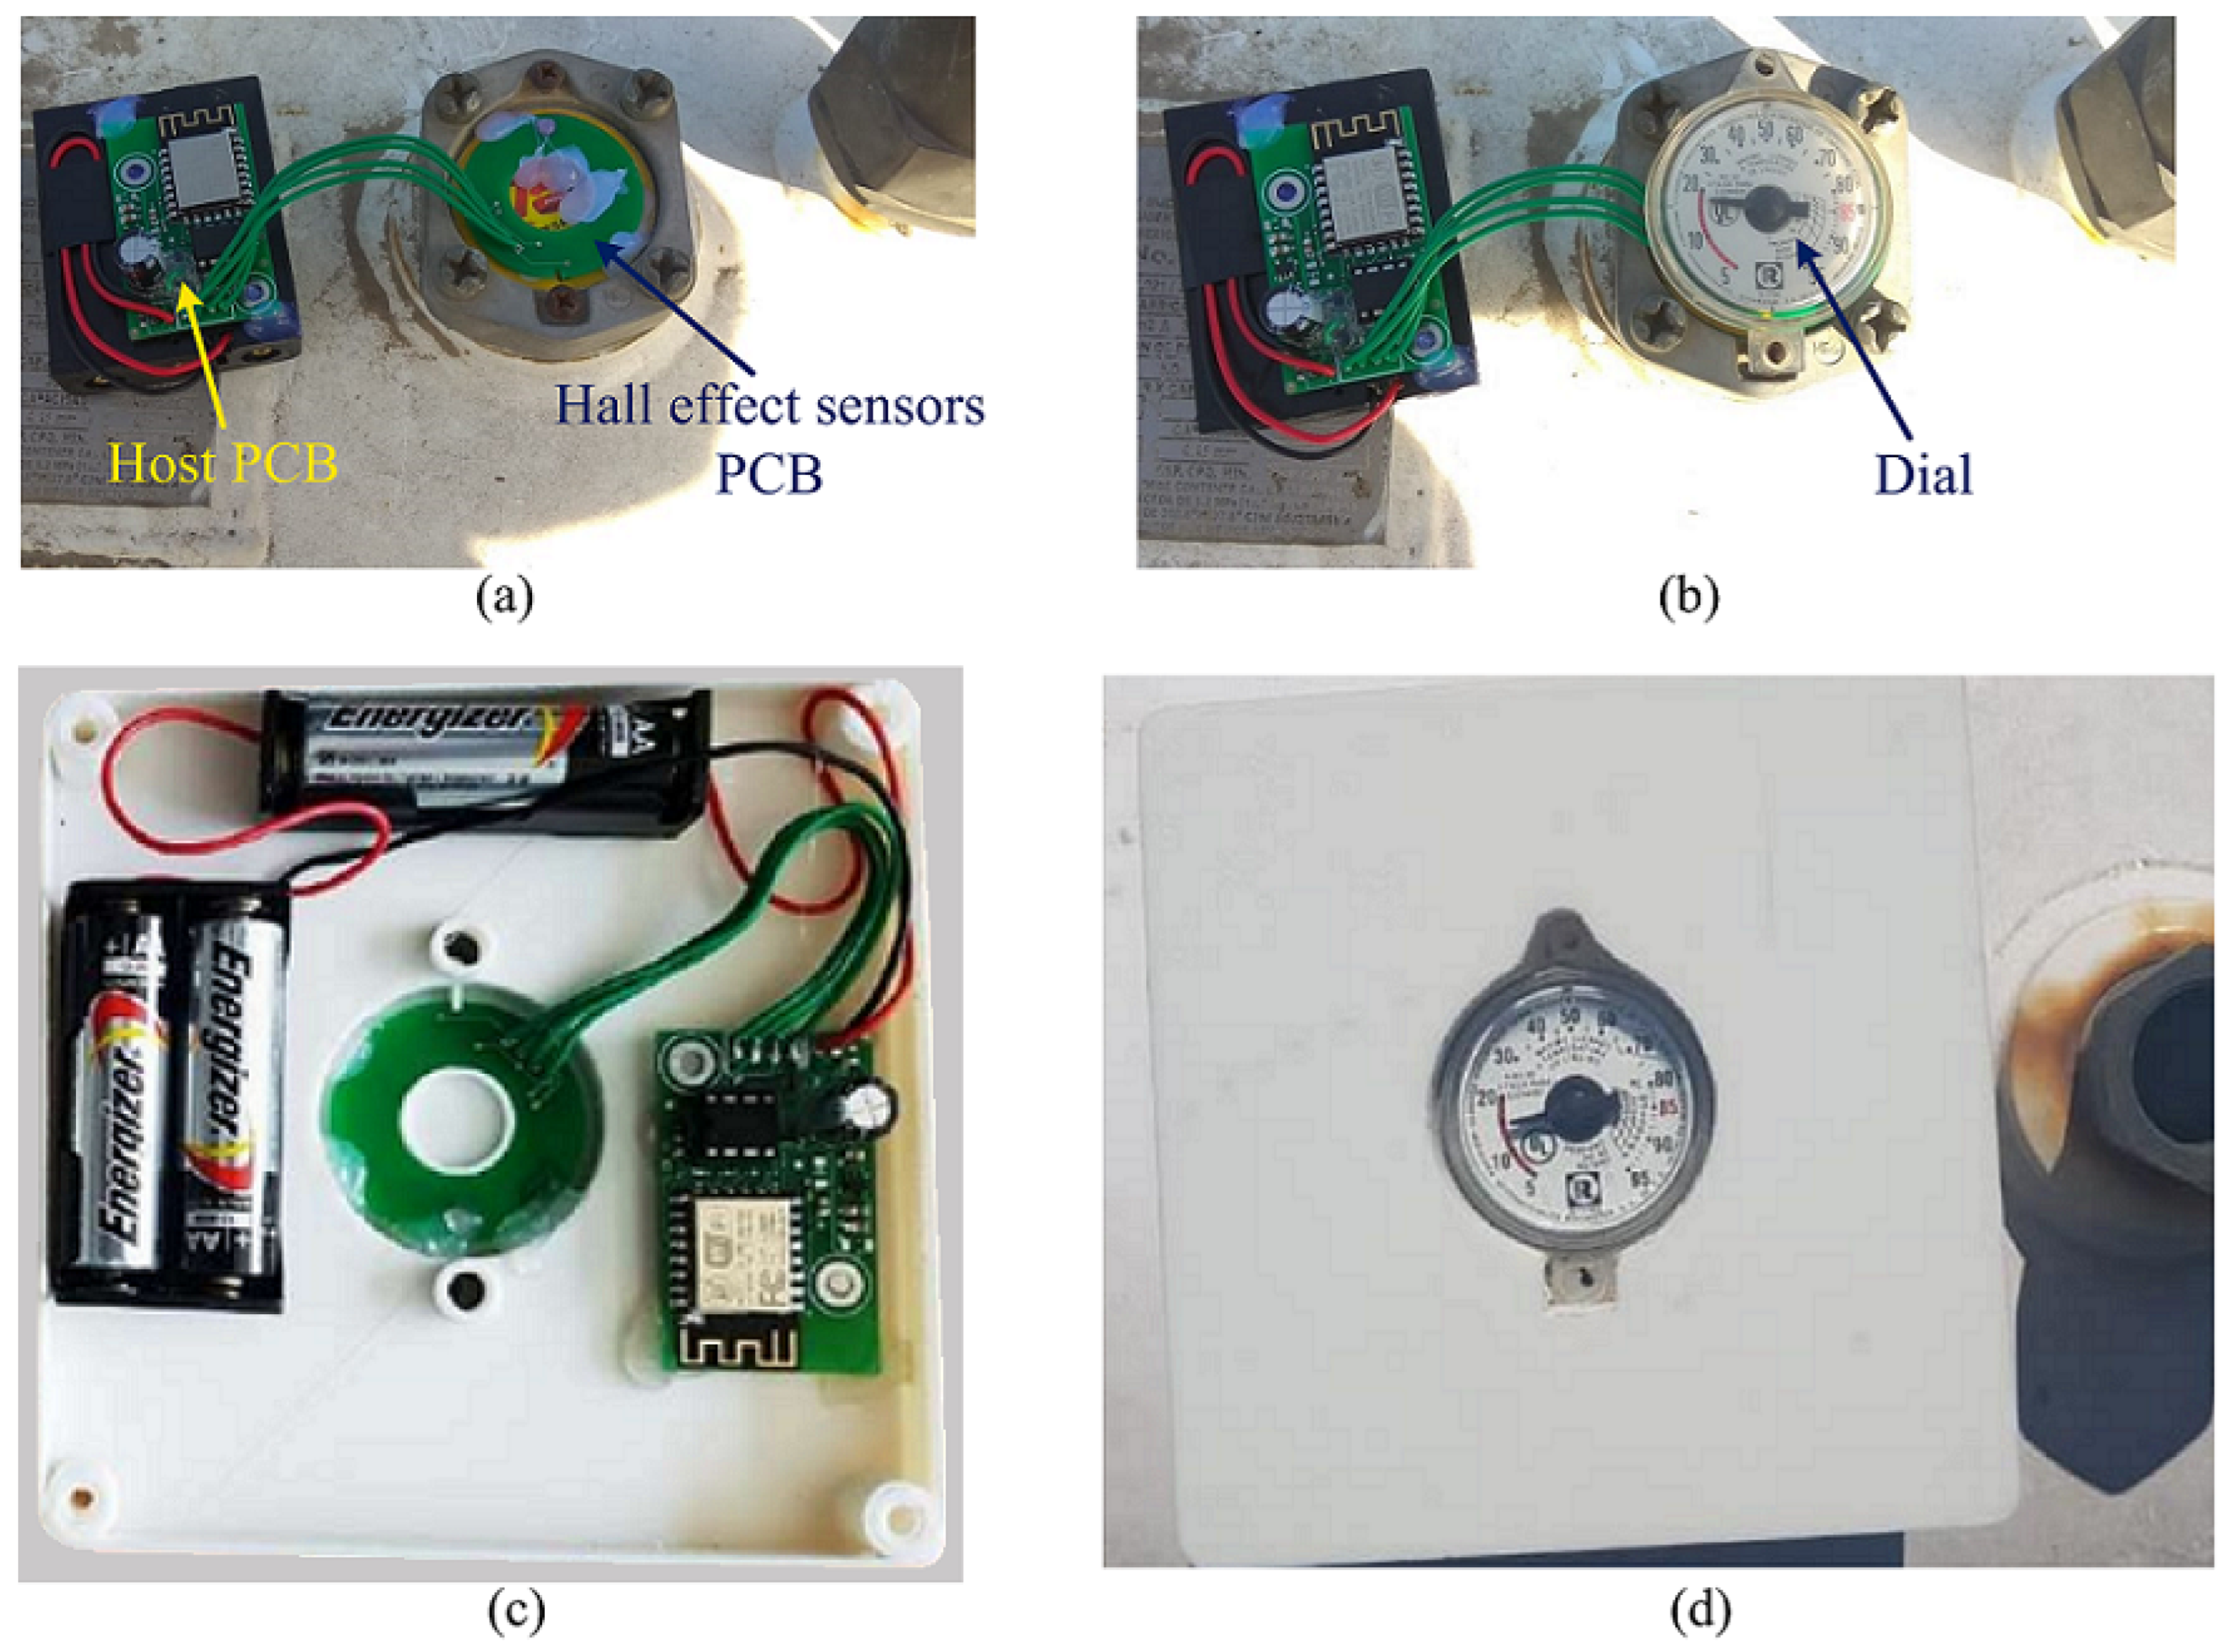
6.1. Hardware Implementation

Figure 12 shows the IoT-GL-Sensor already implemented and working, which consists of two interconnected boards (sensors PCB and host PCB). The sensor PCB is placed under the dial, as can be seen in Figure 12a. The dial can be placed back on the sensor PCB, as shown in Figure 12b, since this does not interfere with its correct functioning.
Considering the dimensions of the IoT-GL-Sensor, including batteries, and the shape of the tank gauging system, a polypropylene housing (IP65 protection grade) has been designed and manufactured to protect the hardware. Figure 12c shows the IoT-GL-Sensor installed inside the bottom of its housing. On the other hand, in the upper part of the housing, a suitable space has been left to place the dial face again once the wireless LPG level sensor is installed, as shown in Figure 12d.
In the experimental test shown in Figure 12d, it can be observed that the dial needle marks 15% of liquid LPG inside the stationary tank, which coincides with the measurement displayed by the app in Figure 10h.

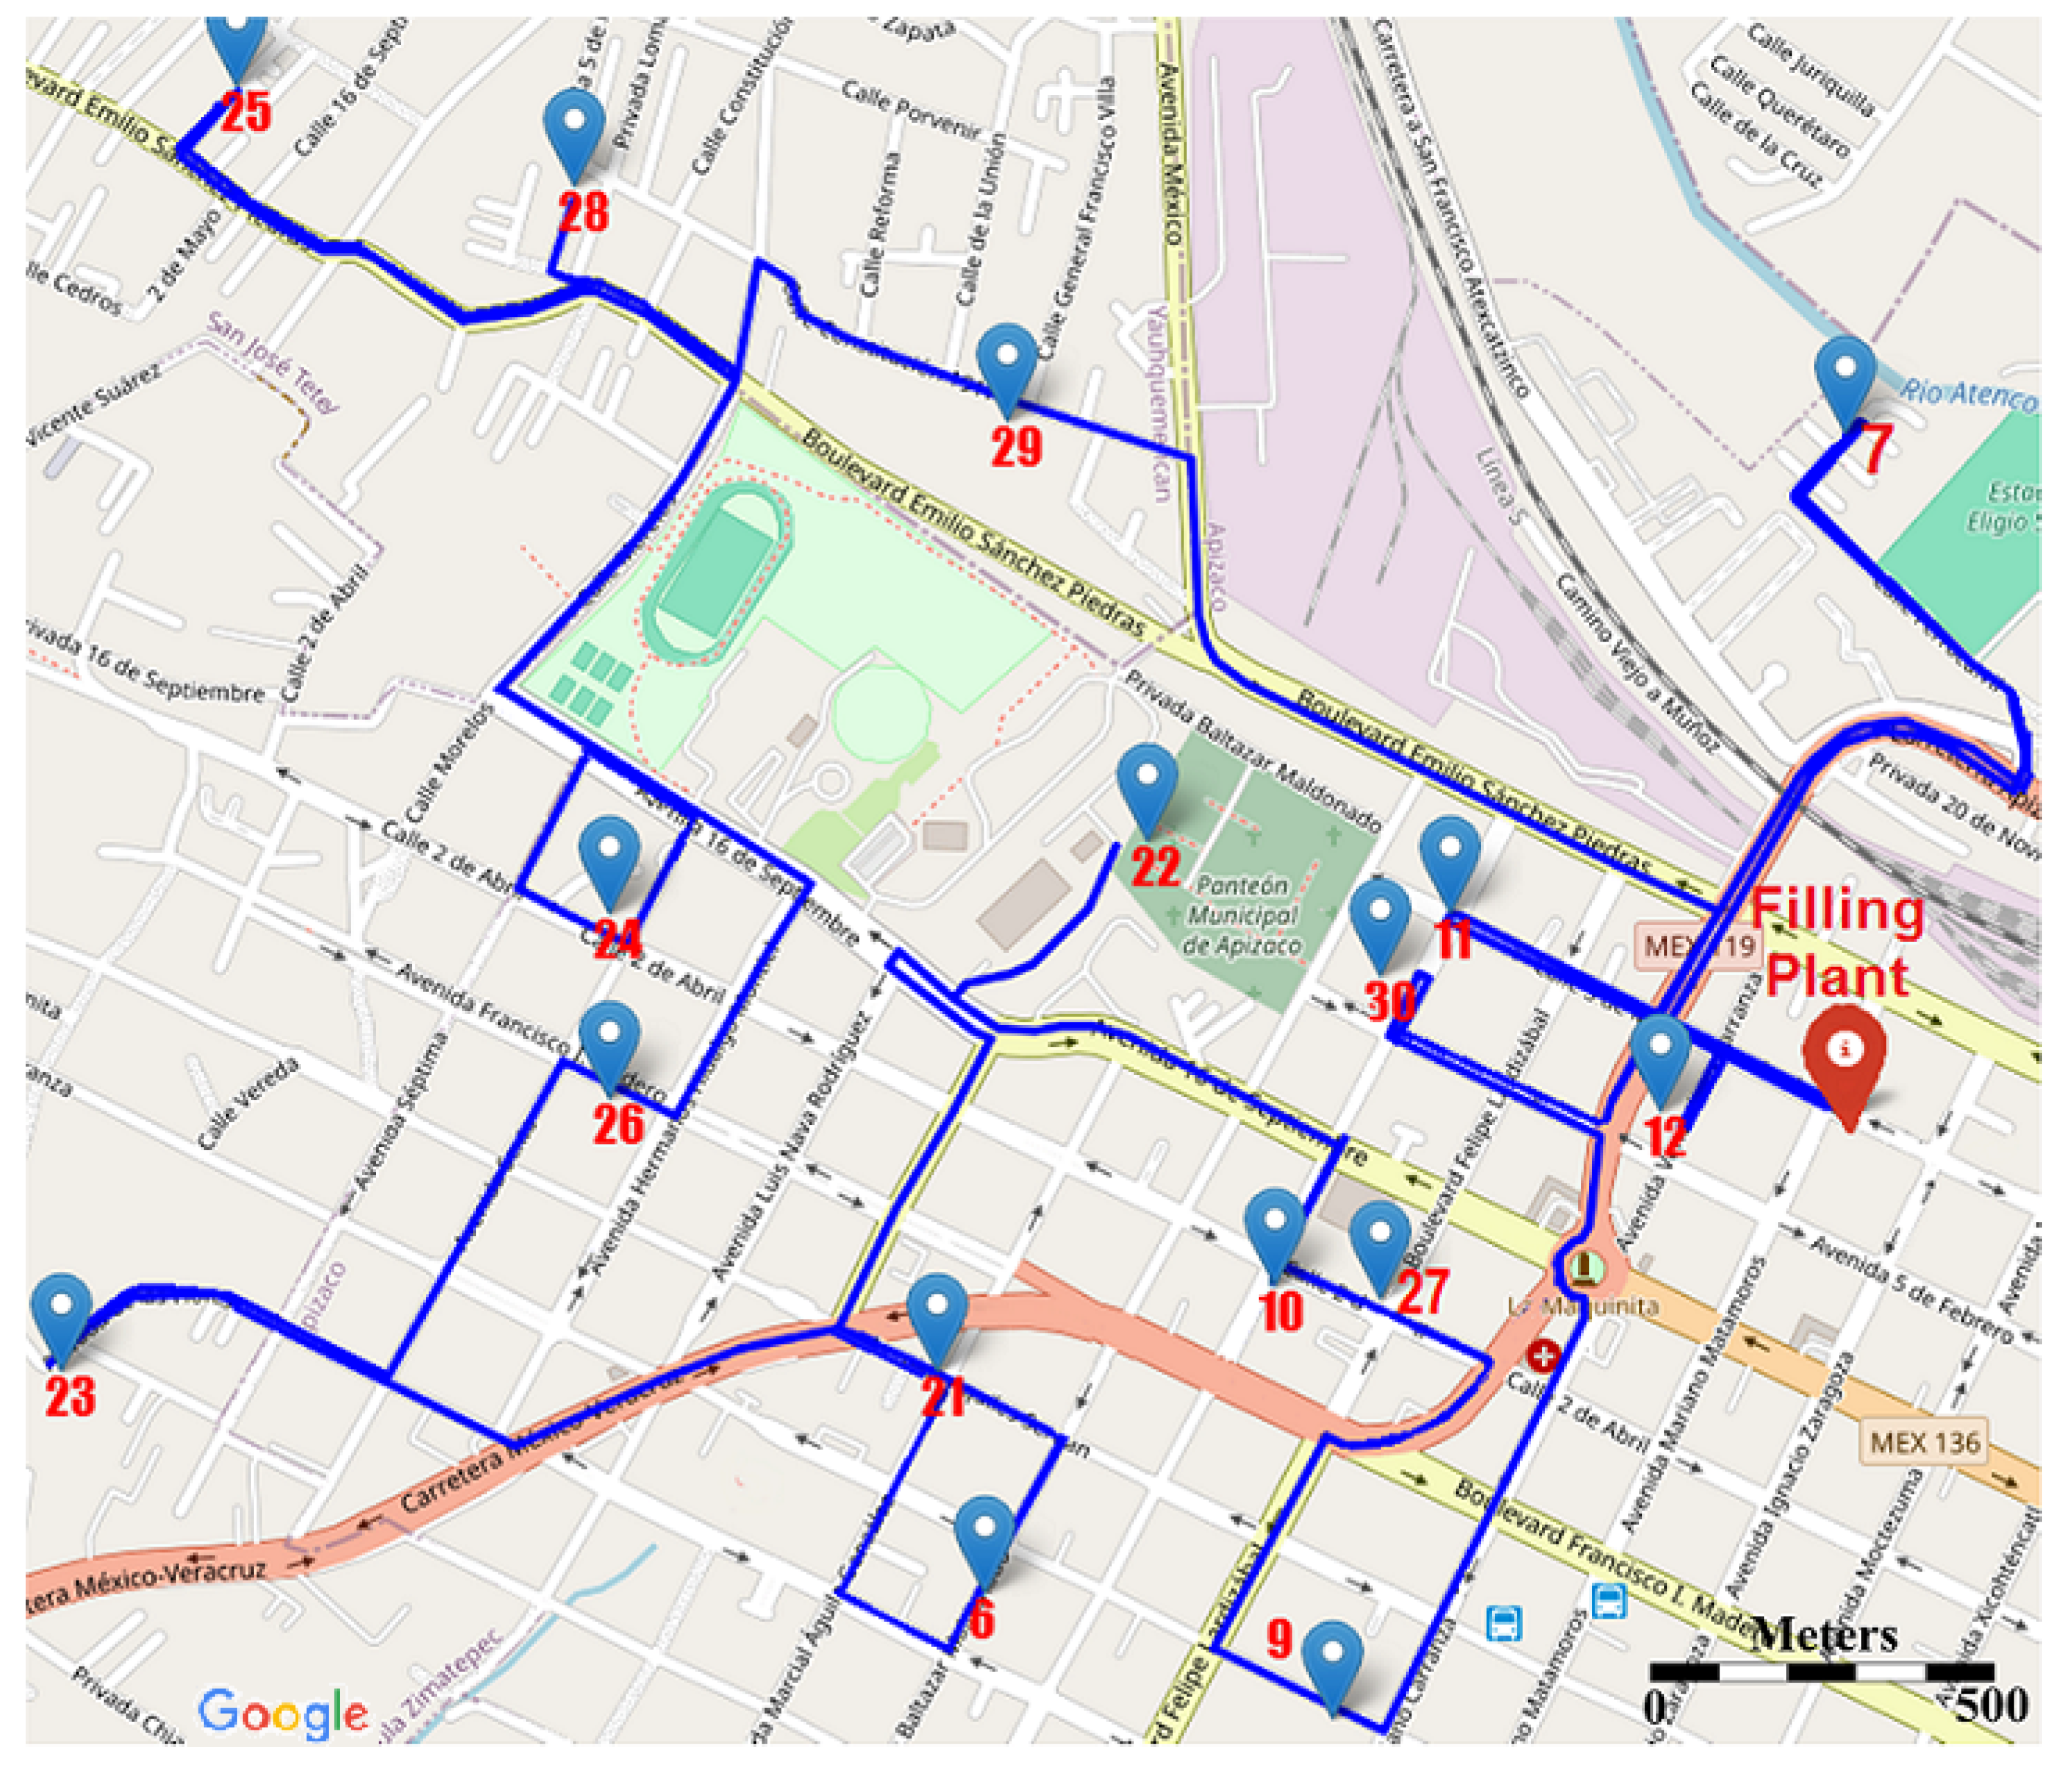
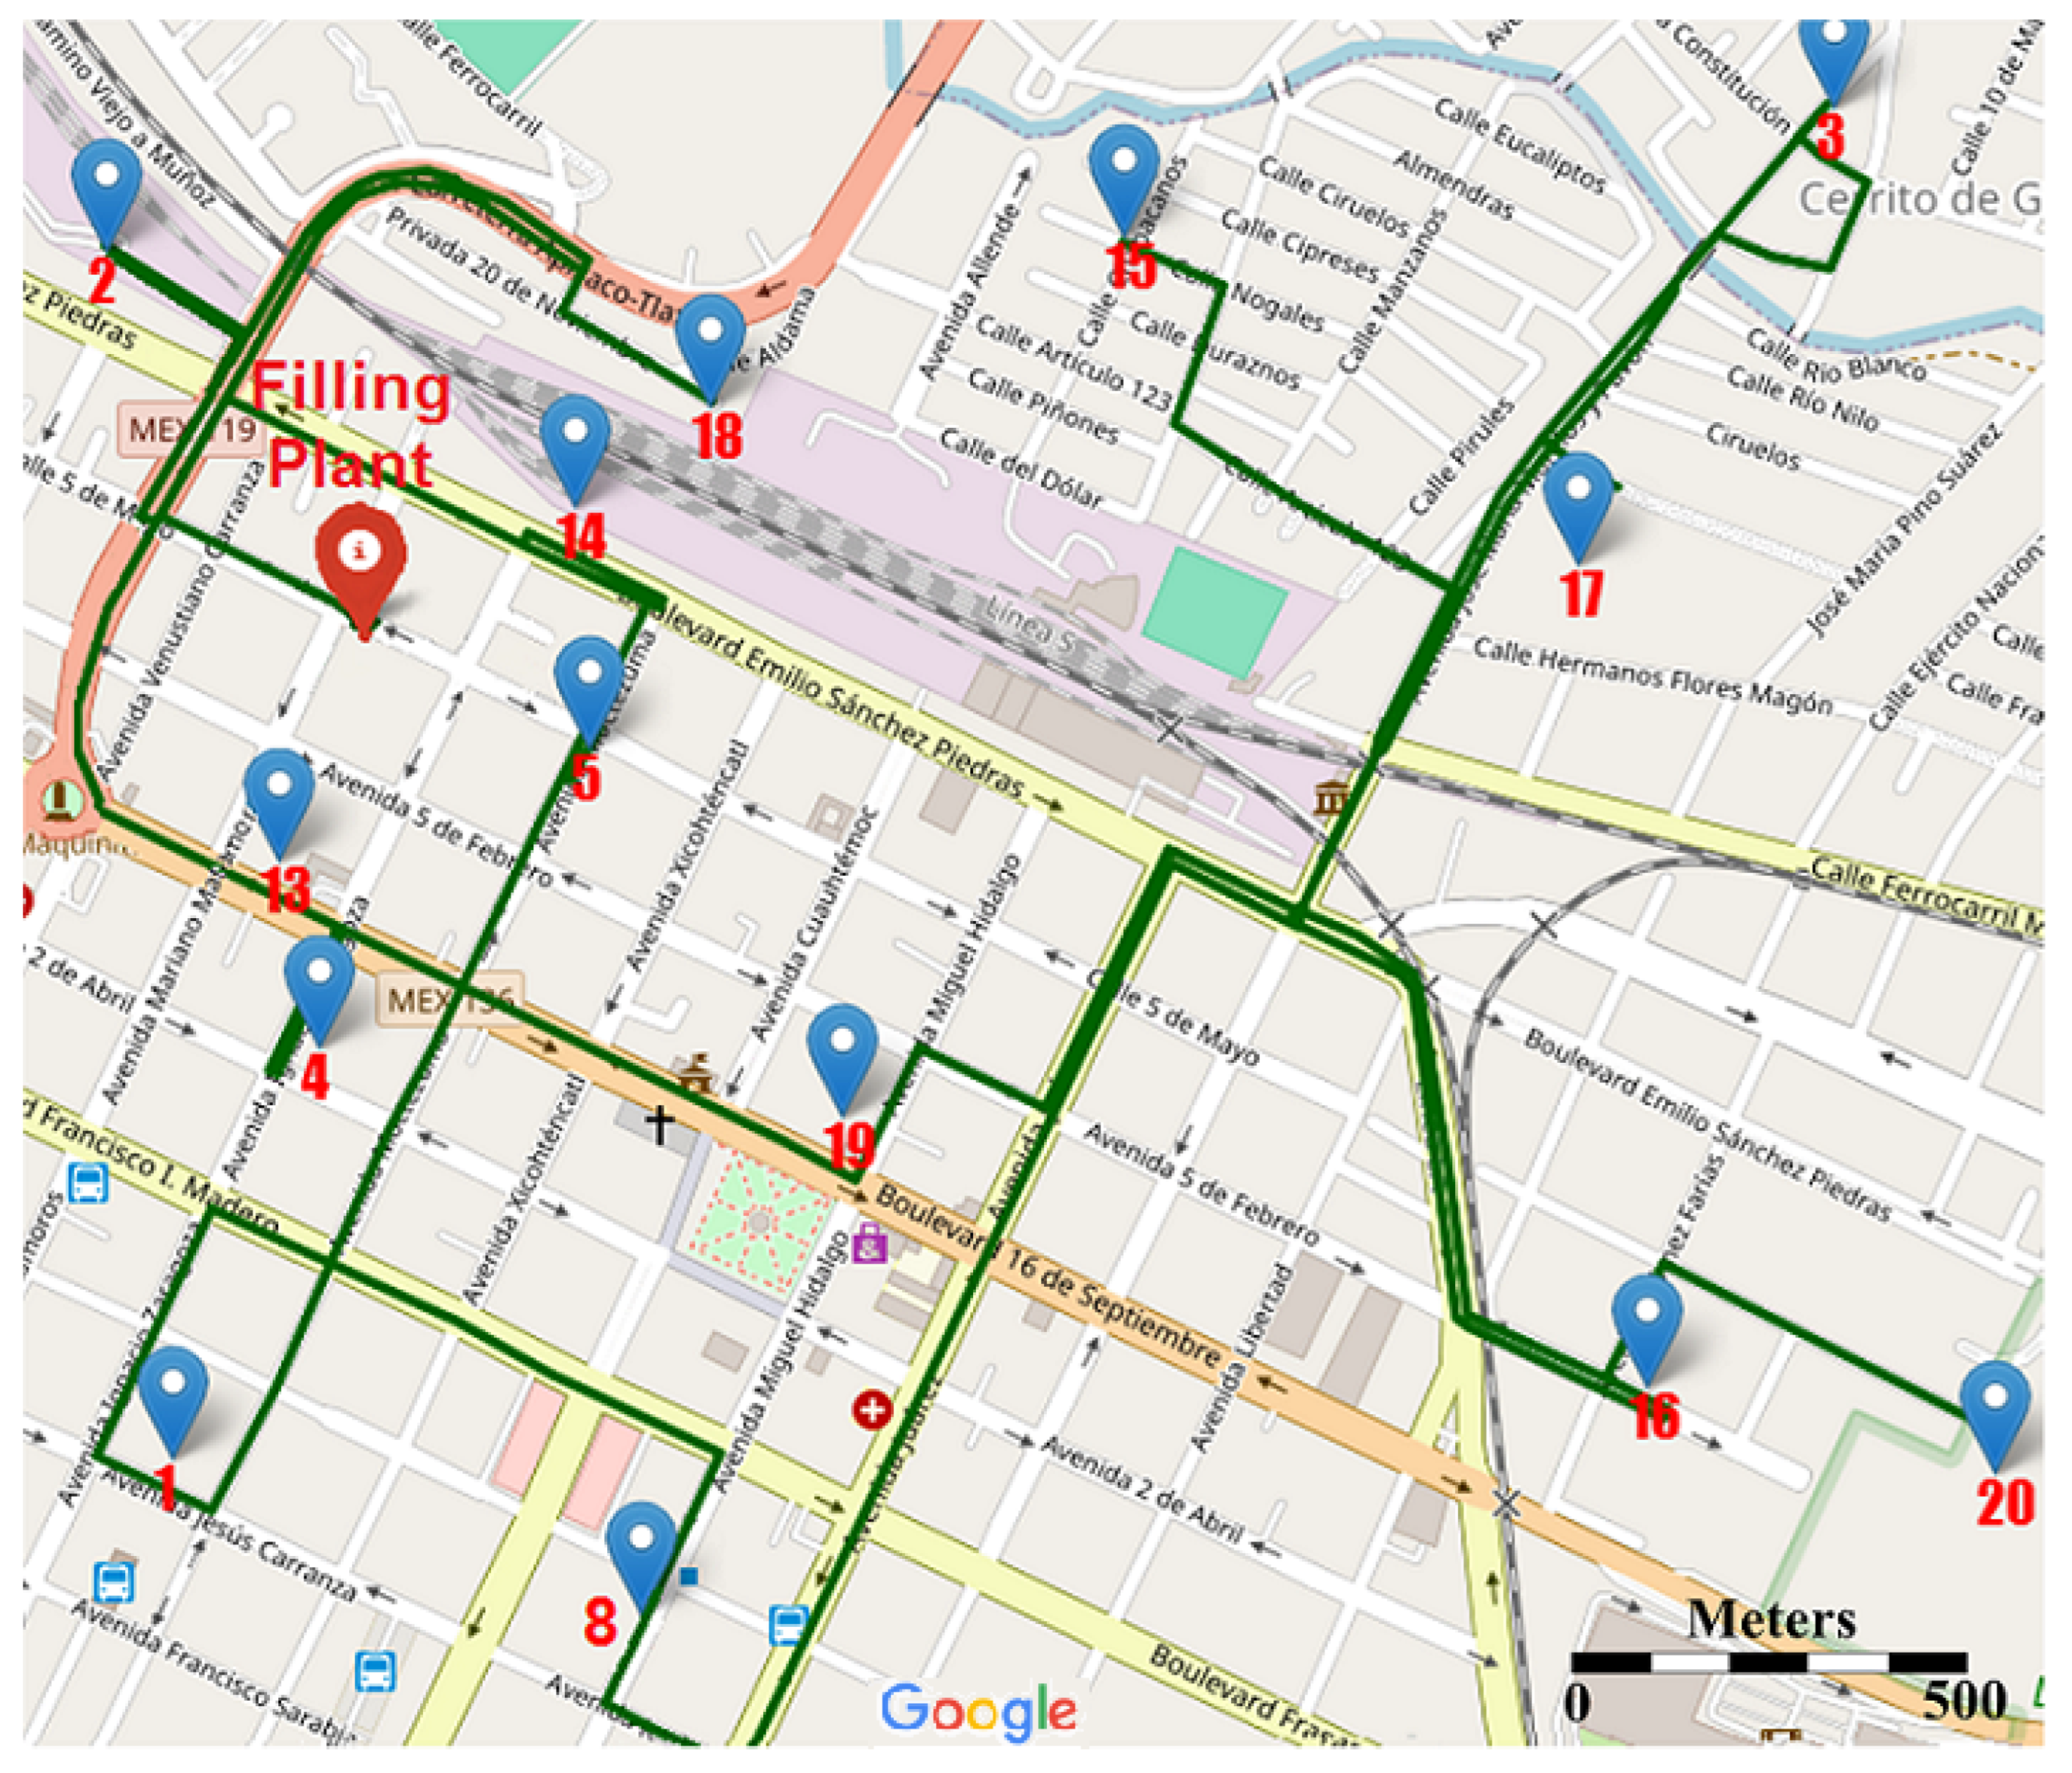
6.2. Generation of Optimized Routes with the Clark and Wright Savings Algorithm

The Clark and Wright savings algorithm for home gas distribution has been evaluated considering 30 customers, who need to refill their tanks. These are located at different points in an area of the city, as shown in Figure 13 and Table 7. Each customer has a specific request, and these vary depending on the needs of each customer and the capacity of the domestic stationary tank.
The filling plant of the distribution gas company is located at the coordinates (19° 41 95 , 98 ° 14 32 ). Since distribution tanker trucks are supplied here, this is the point where the journey of the different routes begins and ends. It is assumed that each distribution tanker truck has a maximum capacity of 5000 L of LPG. Thus, two tanker trucks are assigned to serve the 30 requests, respecting capacity restrictions, direction of circulation, and a maximum travel distance of 15 km.
In real life, it is common to make route changes due to vehicular traffic density, accidents, and so on. However, suggesting route changes in real time due to incidents is outside the scope of this work.
The actual distances between the locations are obtained using the Geopy library in Python considering geographic coordinates (longitude and latitude). The heuristic algorithm was coded in Python 3.11 and the numpy, itertools, geopy, and folium.m libraries were used with the data from Table 7.
Figure 14 shows the route generated for distribution tanker 1 (route 1), which delivers LPG to 16 of the 30 customers, in the following order:
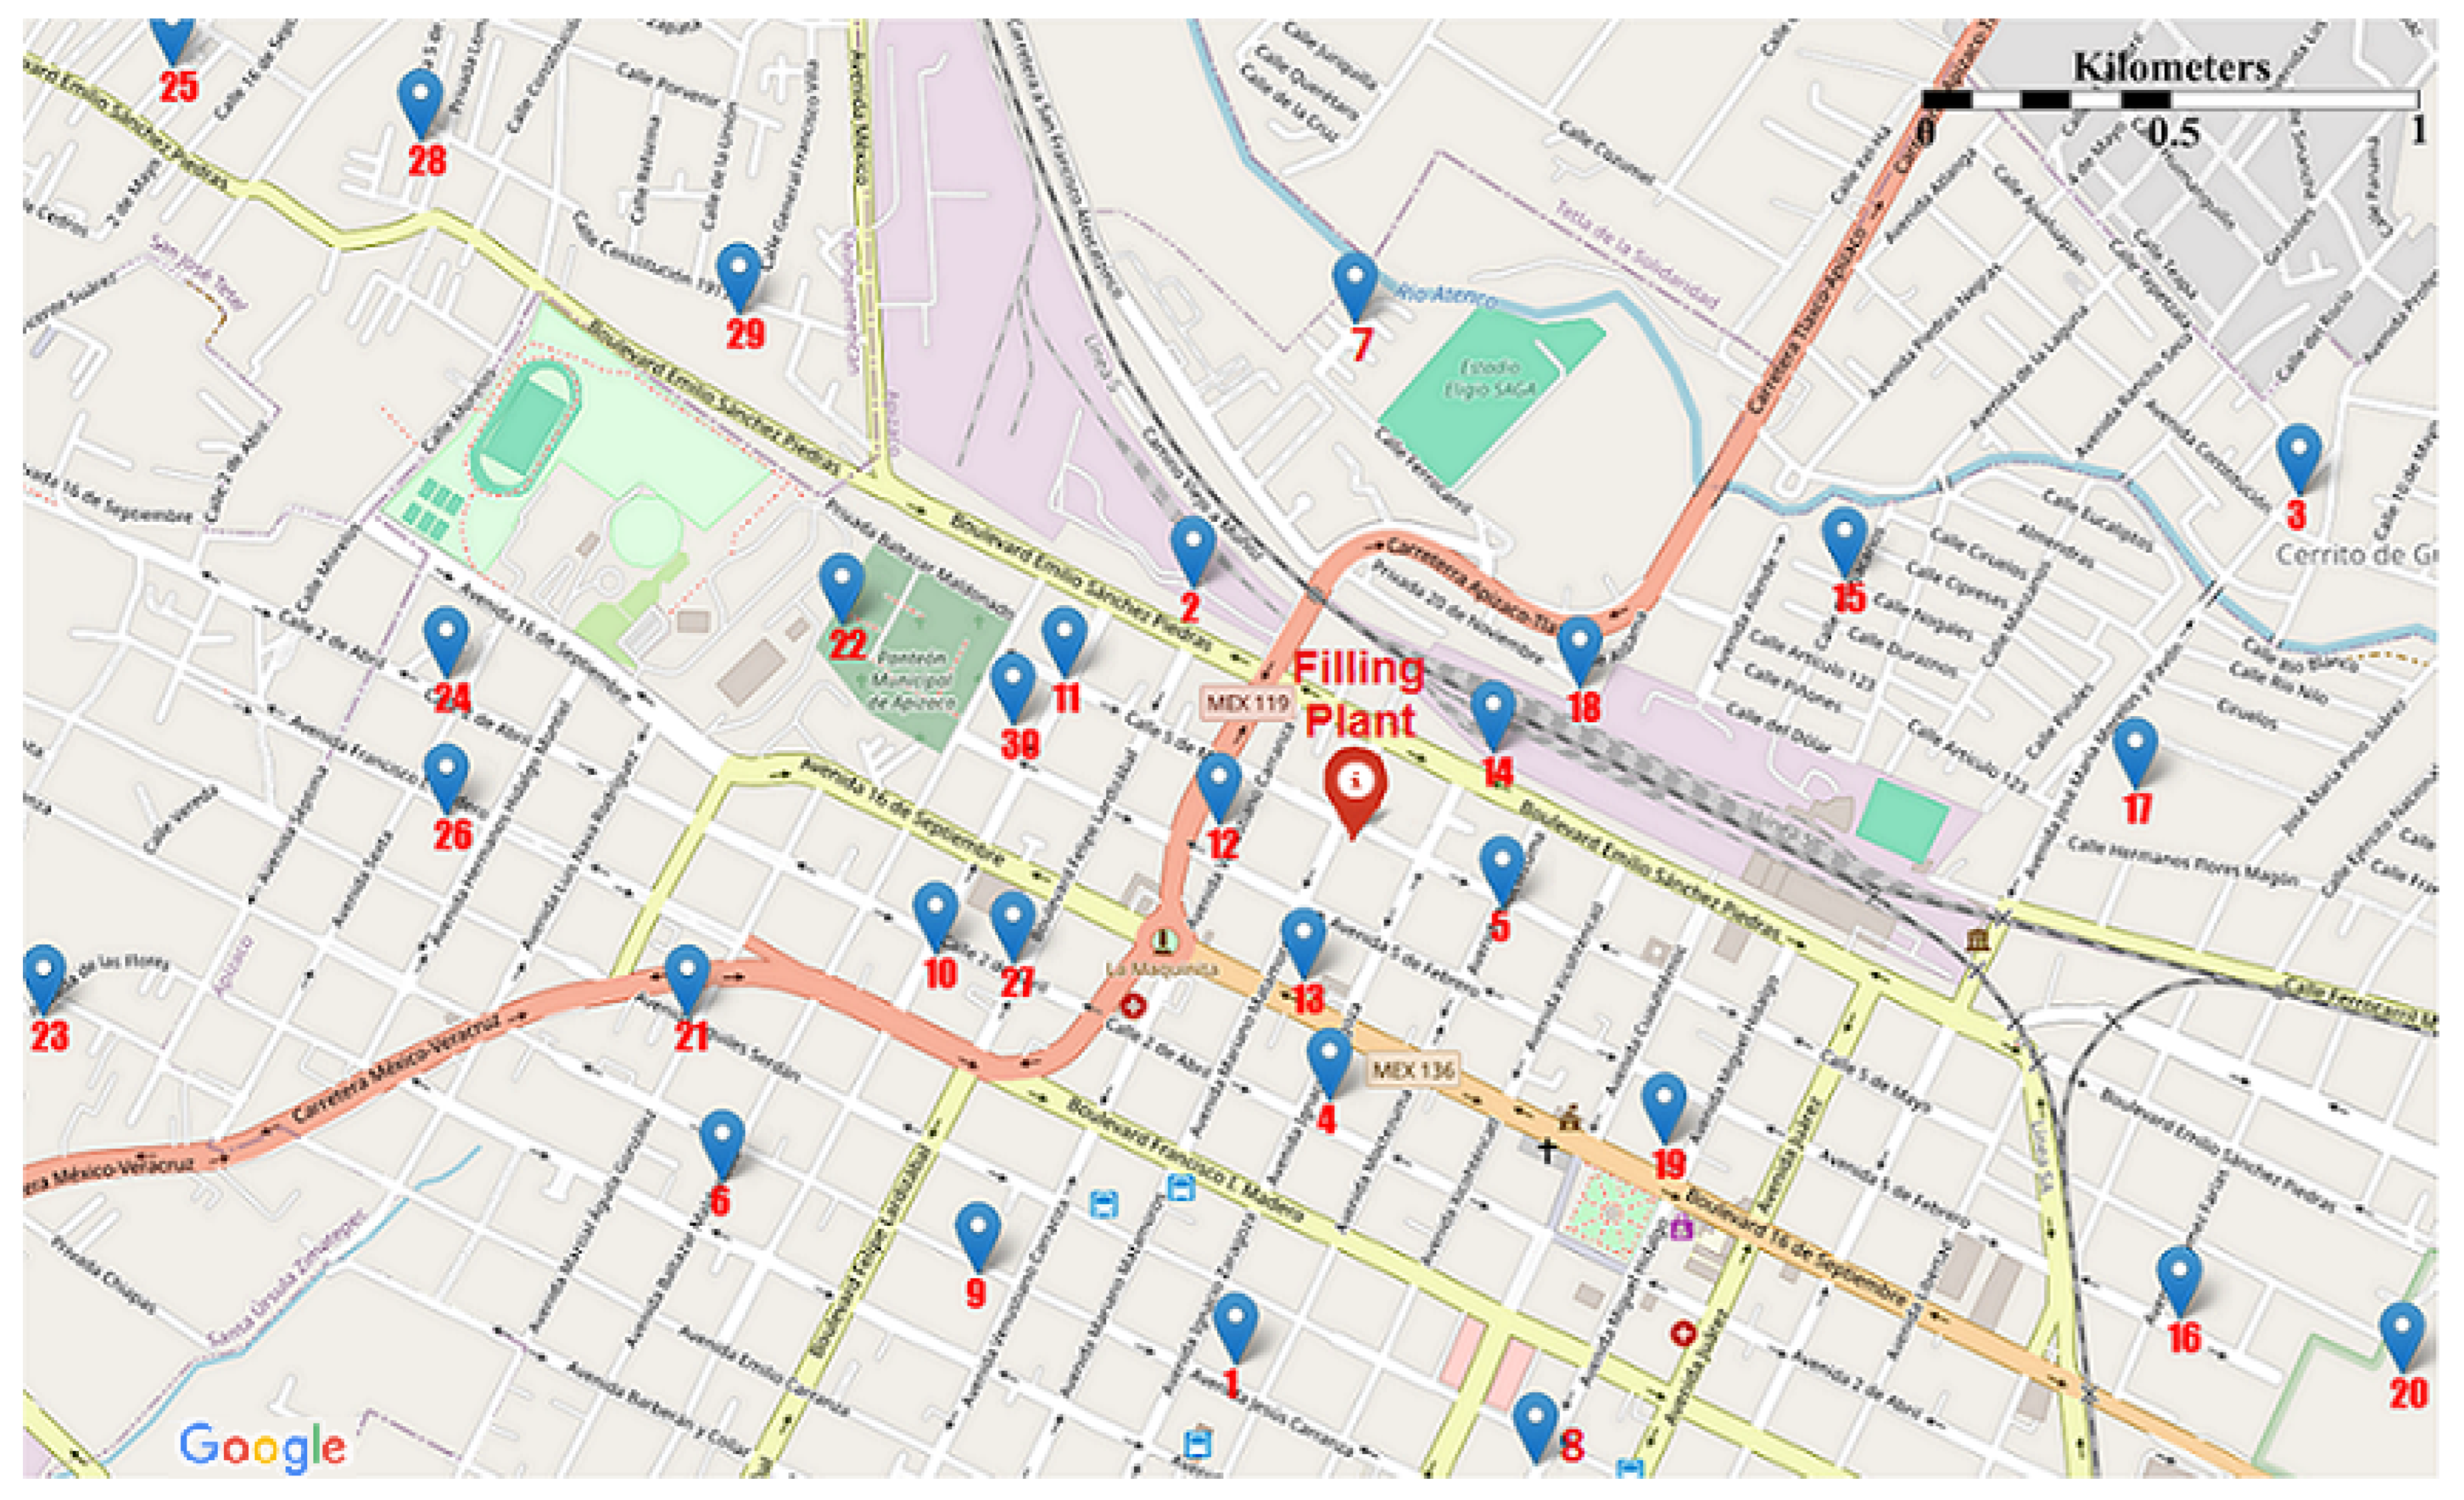
  • Route 1: Filling plant → 12 → 11 → 30 → 9 → 27 → 10 → 22 → 6 → 21 → 23 → 26 → 24 → 25 → 28 → 29 → 7 → Filling plant.
Figure 15 shows the second route generated for distribution tanker 2 (route 2), which delivers LPG to the other 14 customers, in the following order:
  • Route 2: Filling plant → 18 → 2 → 14 → 5 → 1 → 8 → 3 → 17 → 15 → 20 → 16 → 19 → 4 → 13 → Filling plant.
In this way, it is demonstrated that the Clark and Wright algorithm is very useful for optimizing LPG distribution routes for tanker trucks. Linking delivery points through optimized routes can reduce operating costs.

7. Conclusions

This paper shows the design and development of a IoT-GL-Sensor for domestic stationary tanks of different capacities, based on IoT technology. Hardware design has been key, as it must be functional and reliable. It must be easy to install and operate. It is worth mentioning that during the development process, national and international design and functionality standards must be taken into account; otherwise, the certification necessary for distribution of the wireless sensor to customers would not be obtained.
The developed GL-Sensor presents three main differentiators with respect to other IoT-based sensors on the market: (1) the ability to share gas level data in customers’ tanks with a gas company’s filling plant, (2) greater precision, and (3) lower cost. In addition, a secure communication protocol between the wireless gas sensor and the server has been considered, something that other wireless sensors for measuring the LPG level in tanks do not specify or do not require.
The communication process between the developed IoT-GL-Sensor and the cloud server via the Internet has been explained, as well as the developed smart mobile tool for the electronic device. With the help of gas level data in tanks and their precise location, it has been shown that it is possible to optimize the distribution routes that tanker trucks should follow. The optimization is performed using a heuristic algorithm of low computational burden and acceptable efficiency. In this way, LPG is distributed to the different filling requests in reduced time and costs.
The developed IoT-GL-Sensor opens up the possibility of offering customers additional services, such as analyzing their LPG consumption history, offering them energy saving plans, payments, etc. On the other hand, with its customers’ consumption data, the gas company can also perform business intelligence (BI), opening up a range of possibilities, which will be the next research topics undertaken.

Author Contributions

Conceptualization, R.M.-C., R.E.P.-L., and J.H.-P.; methodology, R.M.-C., R.E.P.-L., and J.H.-P.; software, R.E.P.-L., E.B.-H., and J.d.J.R.-M.; validation, R.M.-C., J.H.-P., and J.d.J.R.-M.; formal analysis, R.E.P.-L., E.B.-H., and J.d.J.R.-M.; investigation, R.M.-C., R.E.P.-L., and J.H.-P.; resources, R.M.-C., R.E.P.-L., and E.B.-H.; writing—original draft preparation, R.M.-C.; writing—review and editing, E.B.-H. and J.d.J.R.-M.; project administration, R.M.-C. and J.H.-P. All authors have read and agreed to the published version of the manuscript.

Funding

This research received no external funding.

Data Availability Statement

The original contributions presented in the study are included in the article, further inquiries can be directed to the corresponding author.

Conflicts of Interest

The authors declare no conflicts of interest.

References

  1. LPG Market Size, Share & Industry Analysis. Available online: https://www.fortunebusinessinsights.com/lpg-liquefied-petroleum-gas-market-106373 (accessed on 7 July 2024).
  2. Latin American LPG Markets in Global Context. Available online: https://www.spglobal.com/commodityinsights/en/ci/research-analysis/lpg-is-king-in-latin-america.html (accessed on 7 July 2024).
  3. Managing the Gas Supply at Your Home in Mexico. Available online: https://www.mexperience.com/managing-the-gas-supply-at-your-home-in-mexico/ (accessed on 10 July 2024).
  4. Mexican LPG Association Denounces Multi-Million Dollar Thefts. Available online: https://www.bnamericas.com/en/news/mexican-lpg-association-denounces-multi-million-dollar-thefts (accessed on 10 July 2024).
  5. LP Gas: Monopolies, Theft, and Corruption. Available online: https://www.eluniversal.com.mx/english/lp-gas-monopolies-theft-and-corruption/ (accessed on 21 July 2024).
  6. Gas Theft—Mexico’s Latest Criminal Conundrum. Available online: https://insightcrime.org/news/brief/gas-theft-mexico-criminal-conundrum/ (accessed on 21 July 2024).
  7. A Guide to Home Propane Tank Components, from Gauges to Regulators. Available online: https://www.amerigas.com/amerigas-blog/residential-propane/home-propane-tank-components (accessed on 29 July 2024).
  8. Levelgas. Available online: https://levelgas.com.mx/ (accessed on 12 August 2024).
  9. El gaaas. Available online: https://www.facebook.com/elgaaasmx/ (accessed on 12 August 2024).
  10. Isentinel. Available online: https://www.isentinel.com.mx/ (accessed on 12 August 2024).
  11. Redgas. Available online: https://www.redtapp.com/redgas (accessed on 17 August 2024).
  12. Sensigas. Available online: https://sensigas.com/ (accessed on 20 August 2024).
  13. Gaszen. Available online: https://jennifer-reyna.medium.com/gaszencierraen2020-58a98d8ce55c (accessed on 20 August 2024).
  14. Mexico Theft Makes Fuel Truck Insurance Costly. Available online: https://www.argusmedia.com/zh/news-and-insights/latest-market-news/1511807-mexico-theft-makes-fuel-truck-insurance-costly (accessed on 22 August 2024).
  15. Morales-Caporal, R.; Reyes-Galaviz, A.S.; Casco-Vásquez, J.F.; Martínez-Hernández, H.P. Development and implementation of a relay switch based on WiFi technology. In Proceedings of the International Conference on Electrical Engineering, Computing Science and Automatic Control (CCE), Mexico City, Mexico, 11–13 November 2020; pp. 1–6. [Google Scholar]
  16. IPC International, Inc. Available online: https://www.ipc.org/solutions/ipc-design (accessed on 10 October 2024).
  17. IPC-2221A; Generic Standard on Printed Board Design. Institute for Printed Circuits: Bannockburn, IL, USA, 2003.
  18. IPC-2231; Standard Only: DFX Guidelines. Institute for Printed Circuits: Bannockburn, IL, USA, 2019.
  19. IPC-A 610; Acceptability of Electronic Assemblies. Institute for Printed Circuits: Bannockburn, IL, USA, 2019.
  20. IPC-D-325A; Documentation Requirements for Printed Boards. Institute for Printed Circuits: Bannockburn, IL, USA, 1995.
  21. NOM-259-SE-2022; LP Gas Measurement and Dispatch Systems, Requirements, and Specifications. Gobierno de México: Mexico City, Mexico, 2024. Available online: https://platiica.economia.gob.mx/normalizacion/nom-259-se-2022/ (accessed on 10 October 2024).
  22. NMX-I-1362-NYCE-2021; Telecommunications–Simple Encryption Procedure for Internet of Things (IoT) Environments. Gobierno de México: Mexico City, Mexico, 2022. Available online: https://platiica.economia.gob.mx/normalizacion/nmx-i-1362-nyce-2021/ (accessed on 10 October 2024).
  23. NMX-I-4903-NYCE-2021; Telecommunications–Key Performance Indicators Related to Smart and Sustainable Cities, to Assess the Achievement of Sustainable Development Goals. Gobierno de México: Mexico City, Mexico, 2022. Available online: https://platiica.economia.gob.mx/normalizacion/nmx-i-4903-nyce-2021/ (accessed on 10 October 2024).
  24. DRV5055 Ratiometric Linear Hall Effect Sensor; Datasheet. Available online: https://www.ti.com/lit/ds/symlink/drv5055.pdf?ts=1729108442645&ref_url=https%253A%252F%252Fwww.ti.com%252Fproduct%252FDRV5055%252Fpart-details%252FDRV5055A2QLPGM (accessed on 7 June 2024).
  25. Angle Measurement With Multi-Axis Linear Hall-Effect Sensors; Application Note. Available online: https://www.ti.com/lit/an/sbaa463a/sbaa463a.pdf?ts=1734635270634&ref_url=https%253A%252F%252Fwww.google.com%252F (accessed on 10 June 2024).
  26. Morse, M. Linear Hall-Effect Sensor Angle Measurement Theory, Implementation, and Calibration; Application Note. Available online: https://www.ti.com/lit/an/slya036b/slya036b.pdf?ts=1734572638607 (accessed on 10 June 2024).
  27. Ferrero, A.; Salicone, S. Measurement uncertainty. IEEE Instrum. Meas. Mag. 2006, 9, 44–51. [Google Scholar] [CrossRef]
  28. PIC12F683; Datasheet. Available online: https://ww1.microchip.com/downloads/en/devicedoc/41211d_.pdf (accessed on 12 June 2024).
  29. SigFox Global Network in Mexico. Available online: https://partners.sigfox.com/companies/wnd-mexico (accessed on 17 June 2024).
  30. Giral-Salas, J.E.; Morales-Caporal, R.; Bonilla-Huerta, E.; Rodriguez-Rivas, J.J.; Rangel-Magdaleno, J.J. A smart switch to connect and disconnect electrical devices at home by using Internet. IEEE Lat. Am. Trans. 2016, 14, 1575–1581. [Google Scholar]
  31. Acosta, J.P.C.; Mojica, R.A.U.; Mosquera, L.C.D.B.; Paez-Rueda, C.; Fajardo, A. Design and implementation of a cost-effective object tracking system based on LoRa, Firebase, and Mapbox. IEEE Lat. Am. Trans. 2022, 20, 1075–1084. [Google Scholar]
  32. ESP-12E WiFi Module; Datasheet. Available online: https://components101.com/sites/default/files/2021-09/ESP12E-Datasheet.pdf (accessed on 21 June 2024).
  33. 802.11 Wireless Standards Explained. Available online: https://cdn.blackbox.com/bbcms/docs/whitepapers/802-11-mobility_whitepaper_v6.pdf (accessed on 22 June 2024).
  34. ESP8266: Pinout, Minimal Circuit and Technical Specifications. Available online: https://blog.hirnschall.net/esp8266-reference/? (accessed on 23 June 2024).
  35. Singh, R.K.; Puluckul, P.P.; Berkvens, R.; Weyn, M. Energy consumption analysis of LPWAN technologies and lifetime estimation for IoT application. Sensors 2020, 20, 4794. [Google Scholar] [CrossRef]
  36. Rajab, H.; Al-Amaireh, H.; Bouguera, T.; Cinkler, T. Evaluation of energy consumption of LPWAN technologies. J. Wirel. Commun. Netw. 2023, 118. [Google Scholar] [CrossRef]
  37. Seven Pro Tips for ESP8266. Available online: https://www.instructables.com/ESP8266-Pro-Tips/ (accessed on 10 July 2024).
  38. MIC5205, 150 mA low-noise LDO regulator; Datasheet. Available online: https://ww1.microchip.com/downloads/en/DeviceDoc/20005785A.pdf (accessed on 15 July 2024).
  39. TLV755P, 500mA, Low-IQ, Small-Size, Low-Dropout Regulator; Datasheet. Available online: https://www.ti.com/lit/ds/symlink/tlv755p.pdf (accessed on 21 July 2024).
  40. Morales-Caporal, R.; Pérez-Cuapio, J.F.; Martínez-Hernández, H.P.; Cortés-Maldonado, R. Design and hardware implementation of an IGBT-based half-bridge cell for modular voltage source inverters. Electronics 2021, 10, 2549. [Google Scholar] [CrossRef]
  41. Basic ESP8266 MQTT Example. Available online: https://github.com/internetofhomethings/ESP8266-MQTT-HTTP-Server/blob/master/PubSubClient/examples/mqtt_esp8266/mqtt_esp8266.ino (accessed on 5 August 2024).
  42. ESP32/ESP8266 with HTTPS and SSL/TLS Encryption. Available online: https://randomnerdtutorials.com/esp32-esp8266-https-ssl-tls/ (accessed on 7 August 2024).
  43. Oppliger, R. SSL and TLS: Theory and Practice, 3rd ed.; Artech: Norwood, MA, USA, 2023. [Google Scholar]
  44. Morales-Caporal, R.; Ramírez-Alva, M.A.; Pérez-Cuapio, J.F.; Rangel-Magdaleno, J.d.J.; Sandre-Hernández, O. A remote immobilization system with GSM and GPS technologies for cargo trailers. In Proceedings of the International Conference on Electrical Engineering, Computing Science and Automatic Control (CCE), Mexico City, Mexico, 11–13 November 2020; pp. 1–6. [Google Scholar]
  45. Tsindeliani, D.; Povstyana, Y.; Lishchyna, N.; Yashchuk, A. Latency reduction in real-time GPS tracking in Android and the web-based GPS monitoring system. In Proceedings of the International Conference on Dependable Systems, Services and Technologies (DESSERT), Athens, Greece, 9–11 December 2022; pp. 1–7. [Google Scholar]
  46. Bogyrbayeva, A.; Meraliyev, M.; Mustakhov, T.; Dauletbayev, B. Machine learning to solve vehicle routing problems: A survey. IEEE Trans. Intell. Transp. Syst. 2024, 25, 4754–4772. [Google Scholar] [CrossRef]
  47. Ascencio-Laguna, J.A.; Bustos-Rosales, A.; Jimenez-Sanchez, J.E.; Balbuena-Cruz, J.A.; Zamora-Dominguez, A.R. Automatic assistant for the design of distribution routes. In Publicación Técnica No. 538; Ministry of Communications and Transportation. Mexican Institute of Transport. San Fandila: Queretaro, Mexico, 2018. (In Spanish) [Google Scholar]
  48. Tan, S.-Y.; Yeh, W.-C. The vehicle routing problem: State-of-the-art classification and review. Appl. Sci. 2021, 11, 10295. [Google Scholar] [CrossRef]
  49. Lo, S.-C. A particle swarm optimization approach to solve the vehicle routing problem with cross-docking and carbon emissions reduction in logistics management. Logistics 2022, 6, 62. [Google Scholar] [CrossRef]
  50. Kourepinis, V.; Iliopoulou, C.; Tassopoulos, I.X.; Aroniadi, C.; Beligiannis, G.N. An improved particle swarm optimization algorithm for the urban transit routing problem. Electronics 2023, 12, 3358. [Google Scholar] [CrossRef]
  51. Amer, H.; Salman, N.; Hawes, M.; Chaqfeh, M.; Mihaylova, L.; Mayfield, M. An improved simulated annealing technique for enhanced mobility in smart cities. Sensors 2016, 16, 1013. [Google Scholar] [CrossRef] [PubMed]
  52. Jakobović, D.; Đurasević, M.; Brkić, K.; Fosin, J.; Carić, T.; Davidović, D. Evolving dispatching rules for dynamic vehicle routing with genetic programming. Algorithms 2023, 16, 285. [Google Scholar] [CrossRef]
  53. Qi, D.; Zhao, Y.; Wang, Z.; Wang, W.; Pi, L.; Li, L. Joint approach for vehicle routing problems based on genetic algorithm and graph convolutional network. Mathematics 2024, 12, 3144. [Google Scholar] [CrossRef]
  54. Lee, K.; Chae, J. Estimation of travel cost between geographic coordinates using artificial neural network: Potential application in vehicle routing problems. ISPRS Int. J. Geo-Inf. 2023, 12, 57. [Google Scholar] [CrossRef]
  55. Sultana, T.; Akhand, M.A.H.; Hafizur-Rahman, M.M. A variant Fisher and Jaikumar algorithm to solve capacitated vehicle routing problem. In Proceedings of the 8th International Conference on Information Technology (ICIT), Amman, Jordan, 17–18 May 2017; pp. 710–716. [Google Scholar]
  56. Herdianto, B.; Komarudin. Guided Clarke and Wright algorithm to solve large scale of capacitated vehicle routing problem. In Proceedings of the International Conference on Industrial Engineering and Applications (ICIEA), Chengdu, China, 23–26 April 2021; pp. 449–453. [Google Scholar]
  57. Cengiz Toklu, M. A fuzzy multi-criteria approach based on Clarke and Wright savings algorithm for vehicle routing problem in humanitarian aid distribution. J. Intell. Manuf. 2023, 34, 2241–2261. [Google Scholar] [CrossRef]
  58. Tunnisaki, F. Clarke and Wright savings algorithm as solutions vehicle routing problem with simultaneous pickup delivery. J. Phys. Conf. Ser. 2023, 2421, 1–8. [Google Scholar] [CrossRef]
  59. Mamoun, K.A.; Hammadiet, L.; Ballouti, A.E.; Novaes, A.G.; De Cursi, E.S. Vehicle routing optimization algorithms for pharmaceutical supply chain: A systematic comparison. Transp. Telecommun. J. 2024, 25, 161–173. [Google Scholar] [CrossRef]
  60. Single-Depot VRP. Available online: https://web.mit.edu/urban_or_book/www/book/chapter6/6.4.12.html (accessed on 17 August 2024).
Figure 1. Mechanical LPG level measurement system in stationary tank: (a) the mechanical tank gauging system; (b) float gauge assembly; and (c) removable, magnetically driven needle dial.
Futureinternet 16 00479 g001
Figure 2. Business concept with the developed IoT-GL-Sensor.
Futureinternet 16 00479 g002
Figure 3. Block diagram of the IoT-GL-Sensor.
Futureinternet 16 00479 g003
Figure 4. (a) Physical position of the Hall-effect sensors. (b) Analog output signals when the mechanical float was moved manually, initially considering the tank empty and gradually moving the float upwards until simulating a full tank, and vice versa.
Futureinternet 16 00479 g004
Figure 5. (a) Dial. (b) θ vs. % c . When the mechanical float was manually moved from an empty tank (0%) to a full tank (100%).
Futureinternet 16 00479 g005
Figure 6. Schematic connection diagrams: (a) the MCU device; (b) the Wi-Fi device.
Futureinternet 16 00479 g006
Figure 7. Schematic connection diagram of the TLV755P voltage regulator.
Futureinternet 16 00479 g007
Figure 8. Hardware conceptual design: (a) sensors PCB footprint, (b) 3D model of the sensors PCB, (c) host PCB footprint, and (d) 3D model of the host PCB.
Futureinternet 16 00479 g008
Figure 9. (a) Wi-Fi settings screen; (b) sensor ID generation.
Futureinternet 16 00479 g009
Figure 10. Mobile application developed for the IoT-GL-Sensor: (a) app home screen; (b) request for permission to share the location of the mobile device; (c) registration screen; (d,e) warning messages; (f) waiting screen; (g) app home screen with valid data; and (h) screen with the graph of the percentage of LPG level in the tank and the battery level icon.
Futureinternet 16 00479 g010
Figure 11. Basic principle of the Clarke and Wright algorithm. Two different routes before and after being joined.
Futureinternet 16 00479 g011
Figure 12. Installed IoT-GL-Sensor: (a) without the dial; (b) with the dial; (c) inside the bottom of its housing; and (d) inside the closed housing and with the dial.
Futureinternet 16 00479 g012
Figure 13. Location of the filling plant and 30 customers in a specific area of the city.
Futureinternet 16 00479 g013
Figure 14. Distribution route 1 (distribution tanker 1).
Futureinternet 16 00479 g014
Figure 15. Distribution route 2 (distribution tanker 2).
Futureinternet 16 00479 g015
Table 1. Qualitative comparison of existing wireless sensors vs. the developed wireless sensor.
DesignationRef.Comm. ProtocolCoverageCyber-SecurityBattery LifespanMeasur. DailyData to User 1/Plant 2PrecisionPrice (USD)
Levelgas[8]SigFoxOnly in big citiesN/S1 year Zn-MnO21✓/x ± 2 % 77.50
El gaaas[9]SigFoxOnly in big citiesN/S1 year Zn-MnO21✓/x ± 2 % 78.00
iSentinel[10]Wi-FiRequires internetN/S2 years Li-FeS21✓/x ± 2 % 80.30
Redgas[11]Wi-FiLimited coverageN/SN/S    PV and Rechg.-Li-ion1✓/xN/S85.00
SensiGas[12]4GLimited coverageN/S5 years Rechg.-Li-ion1✓/xN/S98.50
Gaszen[13]Wi-FiRequires internetN/SN/S1✓/x ± 1 % 100.35
DevelopedWi-FiRequires internetSSL/TLS protocol1.5 years Li-FeS22✓/✓ ± 0.5 % 40.00
1 Data shared with user: yes (✓), no (x). 2 Data shared with LPG filling plant: yes (✓), no (x).
Table 2. Sensor data reading by tank fill percentage.
Percentage of Gas in Tank [%]Data Reading Periods [h]
100—812
7—08
Table 3. Lookup table calibration implementation.
% A norm [V] Z norm [V] θ [Grads] % c Error [Grads]% in App
11.0201 0.3505 19.3463 0.66660.3331.0
50.9354 0.5782 31.7205 4.66660.3335.0
100.6021 0.8775 55.5431 10.1851 0.1851 10.5
150.1720 1.001 80.2382 14.81480.185115.0
20 0.2580 0.9319 105.4774 19.77270.227220.0
25 0.4408 0.8503 117.4045 24.54540.454525.0
30 0.6236 0.7619 129.3019 30.0030.0
35 0.7956 0.5510 145.2974 34.72220.277735.0
40 0.9032 0.3537 158.6125 40.0040.0
45 0.9784 0.1768 169.7539 45.0045.0
50 1.001 0.0476177.273649.28570.714249.5
55 0.9784 0.2585165.201454.64280.357155.0
60 0.9032 0.4285154.616160.4166 0.4166 60.5
65 0.7956 0.5918143.358365.0065.0
70 0.6344 0.7755129.284470.0070.0
75 0.4193 0.9047114.867675.3571 0.3571 75.5
80 0.2150 0.9659102.550879.64280.357180.0
850.03761.014087.844785.0085.0
900.48380.829959.756790.0090.0
950.89240.414924.936695.6923 0.6923 96.0
990.98920.183710.518398.750.2599.0
Table 4. Power consumption in sleep mode.
DeviceVoltage [V]Current in Light Sleep Mode [μA]Current in Deep Sleep Mode [μA]
Sensor 4.0 00
MCU 4.0 1 0.050
Wi-Fi 3.3 20010
Table 5. Power consumption in active mode.
DeviceTime Duration [s]Voltage [V]Current [mA]
Sensor 0.3 4.0 4 · ( 2 sensors)
MCUWuMCU 0.1 4.0 0.01
MCUMeasure 0.3 4.0 0.01
MCUProcData 0.5 4.0 0.01
Wi-FiWuWiFi 2.0 3.3 16
Wi-FiDataTrans 1.0 3.3 120
Table 6. Main electronic components used for the IoT-GL-Sensor.
DevicePCB DesignationPrice (USD)Quantity
Sensors 1
DRV5055Sen_A, Sen_Z 0.418 2
GRM152R61A104KE19DC100-C103 0.029 4
RC0402FR-0710KLR100, R101 0.012 2
Host 2
PIC12F683-I/PU100 1.62 1
ESP8266-12E/ESP-12EU101 0.80 1
TLV755PU10R 0.123 1
MIC5205U11R 0.410 2
RES-402R000 0.044 1
RES-402R100P - R104E 0.0680 6
SF-0603F063-2F100R 0.55200 1
GRM31MR61A106MFC103E, C106R 0.2439 2
D4V5H1U2LP161D100 0.102 1
DMN2020LSN-7D101 0.230 1
D4V5H1U2LP1610-7D103 0.102 1
640456-2CON101,CON102 0.0973 2
GRM152R61A104KE19DC100P - C101E 0.029 4
GRM219R61A105MA19DC101P - C105R 0.1196 1
C1206C106M8PACTUC102P 0.170 1
UKL1A221MPDANAC200E 0.3560 1
1 Sensors PCB: has the two Hall-effect sensors. 2 Host PCB: has the voltage regulators, the MCU and the Wi-Fi.
Table 7. Location and requests for refilling of the 30 customers.
Tank IDCoordinates (Lat. and Lon.)Request (L)Tank IDCoordinates (Lat. and Lon.)Request (L)
119° 41 36 ,   98 ° 14 46 3001619° 41 41 ,   98 ° 13 36 120
219° 42 21 ,   98 ° 14 51 4701719° 41 99″,   98 ° 13 41 260
319° 42 31 ,   98 ° 13 22 3801819° 42 10 ,   98 ° 14 06 190
419° 41 65 ,   98 ° 14 35 4601919° 41 60 ,   98 ° 13 96 200
519° 41 86 ,   98 ° 14 15 2402019° 41 35 ,   98 ° 13 10 480
619° 41 56 ,   98 ° 15 06 3902119° 41 74 ,   98 ° 15 10 240
719° 42 50 ,   98 ° 14 32 4202219° 42 17 ,   98 ° 14 92 350
819° 41 25 ,   98 ° 14 11 3702319° 41 74 ,   98 ° 15 85 230
919° 41 46 ,   98 ° 14 76 4002419° 42 11 ,   98 ° 15 38 190
1019° 41 81 ,   98 ° 14 81 4502519° 42 78 ,   98 ° 15 70 420
1119° 42 11 ,   98 ° 14 66 2802619° 41 96 ,   98 ° 15 38 370
1219° 41 95 ,   98 ° 14 48 3802719° 41 80 ,   98 ° 14 72 260
1319° 41 78 ,   98 ° 14 38 3702819° 42 70 ,   98 ° 15 41 420
1419° 42 03 ,   98 ° 14 16 4502919° 42 51 ,   98 ° 15 04 330
1519° 42 22 ,   98 ° 13 75 2403019° 42 06 ,   98 ° 14 72 190
Disclaimer/Publisher’s Note: The statements, opinions and data contained in all publications are solely those of the individual author(s) and contributor(s) and not of MDPI and/or the editor(s). MDPI and/or the editor(s) disclaim responsibility for any injury to people or property resulting from any ideas, methods, instructions or products referred to in the content.

