1. Introduction
The swift advancement of technology has propelled the widespread adoption of microservice architectures, which highlight key aspects like availability, resilience, fault tolerance, and enhanced collaboration among teams. In such an architecture, each component operates independently and communicates through efficient, lightweight protocols. These architectures are highly favored due to their facilitation of collaborative efforts and their capability to meet modern challenges in application design, development, maintenance, and deployment [
1]. They bolster the system’s resilience, effectively manage failures, and seamlessly adapt to scaling requirements. Nonetheless, these advantages come with certain challenges, particularly due to the heterogeneity of the components, issues in service allocation, and notably, concerns regarding overall system performance [
2].
Debugging issues in microservice architectures poses significant difficulties. System malfunctions can compromise the user experience, and identifying the root cause of these issues can be difficult based on the information at hand. Even with error indications from protocol headers like HTTP, the process of diagnosing issues can be challenging. Additionally, arranging the components in a way that maintains system attributes such as availability and low latency introduces intricacies [
3,
4]. The challenges of debugging [
5,
6,
7,
8,
9] and component arrangement [
10] have been addressed through the implementation of distributed tracing techniques [
11,
12,
13,
14,
15,
16,
17,
18]. However, applying these methods necessitates instrumenting the application’s source code, which brings additional overhead and the risk of altering the application’s behavior. Other strategies extend instrumentation to dependencies to minimize changes at the application level.
Transparent tracing, in contrast to distributed tracing, allows for the collection of system telemetry data without the need for a prior instrumentation phase. Therefore, developers are not required to modify the application’s source code to insert trace points. On the other hand, tracing a system incurs an additional cost, which must be considered by any collection approach. Developing tracing methods that have a minimal impact on the system is necessary for applications where performance is a primary requirement. Although overhead issues have partly been addressed through sampling methods [
19,
20], both approaches to instrumentation present challenges. Instrumenting at the dependency level may fail to capture internal application logic issues like bugs, whereas instrumenting the application’s source code could potentially alter its functioning. Both methods entail modifications to the application, necessitating human effort and incurring extra costs.
The burden of instrumentation efforts has led to the development of strategies aimed at reducing these costs across several research domains [
21,
22]. In the context of microservices, this issue has recently been addressed by advocating for the use of proxies Santana et al. [
23] as an intermediary layer for transparent tracing. However, while this spares the application from source code modifications, it shifts the burden to setting up and configuring the proxies. Additionally, their operation involves intercepting system calls to insert trace contexts into requests, which can be problematic in public clouds where kernel access might be restricted. We propose an innovative approach for tracing and debugging microservices in the
Node.js environment, which is designed to address the limitations of existing methods while ensuring full transparency.
This approach distinguishes itself in two key areas: (1) it obviates the need for developers to invest effort in establishing a collection infrastructure that includes instrumentation, and (2) it transparently analyzes collected traces, leading to visualization tools that map the interactions among microservices, thereby enabling the debugging of performance issues in a completely transparent manner. The focus on Node.js stems from its complex, asynchronous environment. However, this approach could potentially be extended to other environments such as Java, Golang, and more.
The remainder of this paper is organized as follows.
Section 2 introduces the basic concepts of the study.
Section 3 discusses related works on the subject.
Section 4 presents the proposed approach for tracing and analysis.
Section 5.1 presents the results of our work, leveraging some use cases to highlight its pertinence and relevance. An evaluation of our tool is conducted in
Section 5.2. In
Section 5.3, we discuss the results obtained, whereas in
Section 6, we draw some conclusions.
2. Basic Concepts
2.1. Microservice Architecture
The microservice architecture is recognized as an application development strategy that involves breaking down applications into a series of loosely interconnected components. Its growing popularity can be attributed to the ease it brings to continuous delivery and its ability to enhance the scalability of applications [
22]. Within this architectural framework, each component operates independently, managing a distinct function of the application. Communication between these components is facilitated through clearly established, lightweight protocols, typically using APIs. A key advantage of the microservice architecture is the autonomy of its components, which grants development teams the flexibility to update and deploy individual services without impacting the overall application. This approach leads to a more streamlined development process and greater agility in software development [
23].
While microservices offer numerous benefits, they also pose challenges in debugging. With an architecture comprising multiple heterogeneous components, performance monitoring tools must take this diversity into account. Typically, instrumentation is carried out on each component using tracing libraries specific to the component’s environment. To gain a comprehensive view of the system’s health, it is crucial to use distributed tracers. A benefit of microservice architectures is that the instrumentation phase can be treated as an application update, allowing for its flexible integration into the application deployment pipelines. The health of microservices can also be monitored using logs, but the cost of this strategy becomes prohibitively high when the application consists of multiple nodes. The challenge lies not only in interpreting the inter-causalities among nodes but also in managing the large volume of data, which quickly becomes unmanageable. Tracing remains the best way to address this problem, as it enables understanding the system’s operation as a whole and, if necessary, identifying bottlenecks.
2.2. Distributed Tracing
Distributed tracing is a strategy for collecting execution data from modern systems, particularly microservice architectures. It traces the lifecycle of a request as it passes through all the nodes in the system. Distributed tracing provides a hierarchical view of the trace, where one can observe the time a request spends on each service [
7]. Distributed tracing was introduced to address the complexities of distributed architectures, which are not suited to traditional debugging and tracing methods. In microservice environments, components need to interact to produce a result. In other words, when a request is issued from a particular node, it may need to interact with several other services in the infrastructure to return the result. In this context, when an issue arises along its path, it is necessary to identify where the bottleneck occurs to resolve the problem.
Traditional tracing techniques are not suitable because they are generally used for debugging monolithic applications. In the case of microservices, tracing involves injecting a trace context into the request headers to identify it throughout its lifecycle. In this way, the request can be properly aligned and hierarchized according to the service level it invokes over time. The various calls made by microservices during their interactions can thus be traced to understand the overall performance of the system [
6].
Distributed tracers such as Google Dapper [
7] and Zipkin [
24] have revolutionized technology by offering the ability to collect data from each request, their execution times, and the causalities between services in the infrastructure. Furthermore, analyzing the collected trace data can be complex. Distributed tracing systems generate a large amount of data, and interpreting these data often requires advanced data analysis skills and a deep understanding of the system’s architecture [
13]. Distributed tracing continues to evolve, with new improvements and integration into increasingly sophisticated tools and platforms. Therefore, it is necessary to propose tools that address shortcomings and bring more flexibility to the ecosystem.
2.3. Node.js Environment
Node.js, an open source environment, originates from the JavaScript V8 engine it is built on. It has brought the versatility of server-side JavaScript programming since its beginning in 2009. Node.js revolutionized the web ecosystem by enabling developers to use JavaScript for server-side application development. Distinctive for its non-blocking, event-driven nature, Node.js is well suited for high-performance applications. Its architecture is asynchronous and built on a single-thread model. In a Node.js application, a primary process known as the event loop orchestrates the execution of various events in different execution phases.
Tasks or events submitted for execution are first queued in a specific queue based on the event’s nature. The event loop traverses these phases, dequeues the events in each queue, and executes them. For blocking events such as I/O operations, a thread pool is used to delegate execution and avoid blocking the event loop. Node.js is a multi-layered system. Internally, it comprises several components that work together to yield a result. However, at the lower layers of the operating system such as in the kernel space, the Node.js process appears as a black box that makes system calls or generates context switch events. From this perspective, it is challenging to discriminate events being executed. A significant unresolved issue is linking high-level information such as requests and invoked JavaScript functions to actions performed in the V8 engine and the Libuv orchestration layer.
Current tools only allow for the visualization of high-level information, such as a request’s duration or the execution time of a service or JavaScript function. However, when such information is provided by distributed tracing tools, debugging is necessary to trace back to the cause. Debugging such issues in Node.js is extremely challenging since, as a single-thread system, all concurrent request executions are conflated into the same process. Distinguishing which request is causing performance issues is difficult because even if a service shows high latency, it does not necessarily mean the service itself is at fault. For instance, the event loop might have been blocked by the execution of a non-optimized function, thus propagating the error to other pending requests. Therefore, it is important to develop methods suitable to these environments.
3. Related Works
Recent research has demonstrated that distributed tracers are crucial for enabling the monitoring of interactions among microservices, as studied by Sampaio et al. [
10]. This experience demonstrates the need for a more lightweight technique to trace such fine-grained architectures. Santana et al. [
23] suggested a novel transparent tracing methodology that leverages the kernel of the operating system to intercept system calls associated with communication among microservices. They proposed using a proxy that adds a neutral layer to the microservice to intercept its interactions and correlate the information to deduce the causalities associated with the various requests. The interception of system calls ensures application tracing transparency, but the developer is responsible for configuring the infrastructure.
Statistically extracted dependency structures from documentation were used in service discovery by Wassermann and Emmerich [
25], while fault detection was addressed by Chen et al. [
26] through middleware instrumentation to log the respective components that process a particular request. A degree of transparency could be achieved, but such an approach requires developers to dedicate significant time to library instrumentation. The distributed tracers Dapper and X-trace, proposed by Sigelman et al. [
7] and Fonseca et al. [
11], respectively, are able to trace the whole request lifecycle, exposing its flow and helping in diagnosing issues throughout execution. They rely on trace context injection mechanisms to reconstruct the context of the trace. A prior instrumentation phase of the application is required to activate the collection mechanism. In contrast to these approaches, our method does not inject the trace context into the request. It leverages the internal asynchronous mechanism of
Node.js to reconstruct the request path.
Tracing request path strategies was also addressed by Kitajima and Matsuoka [
27] using heuristics. Request causality diagnosing algorithms were proposed by Aguilera et al. [
28]. Both approaches offer a degree of transparency but rely on middleware instrumentation. Gan et al. [
29] introduced Seer, an online debugger designed to foresee quality of service (QoS) violations in cloud-based applications. Their research was conducted on a microservices framework, employing Memcached, which shares functional similarities with Redis as an in-memory database.
The process of debugging performance issues using Seer requires an instrumentation phase for microservices. This step is also implemented in the Memcached data store, with a particular focus on polling functions and various network interface queues. Seer has the ability to predict QoS violations using a model developed from deep learning techniques applied to upstream traces. By instrumenting the functions responsible for managing packet queuing at the data store level, Seer can effectively identify potential bottlenecks, especially those involving Memcached.
A comparison of tracing approaches is provided in
Table 1. The various existing approaches to instrumenting microservices can be classified into three distinct groups. These groups include instrumentation methods using distributed tracing, transparent instrumentation methods utilizing service meshes, and approaches based on instrumenting middleware and libraries. Each of these methods offers advantages and disadvantages, and the choice of which method to use is heavily influenced by the specific context in which it will be applied. Distributed tracing tools, for instance, offer a straightforward way to gather information about system executions and interactions, providing a user-friendly interface for identifying bottlenecks and diagnosing performance issues within distributed environments.
However, these methods are primarily designed to capture interactions among components, typically offering granularity in the order of milliseconds and occasionally microseconds. They are less suitable for capturing host system-level executions that require a much higher level of granularity, which is often expressed in nanoseconds. The second category of microservice instrumentation relies on service meshes to achieve transparent tracing of interactions among microservices. This approach leverages the capabilities of service meshes to seamlessly discover infrastructure components and insert proxies that intercept low-level interactions.
While this method brings transparency to data collection, it presents two significant challenges. Firstly, it necessitates privileged access to the system, as it relies on system calls to capture information about microservice interactions. Such privileged access is generally unavailable in public cloud infrastructures. Secondly, it requires configuration efforts to deploy the collection’s infrastructure, effectively shifting some of the workload associated with instrumentation, as proposed by distributed tracing tools, to the setup of the collection infrastructure.
The third category, in contrast, emphasizes instrumentation at the library or middleware level. This approach offers the advantage of minimizing alterations to the application’s source code. Nevertheless, it still requires dedicated instrumentation efforts and, consequently, may introduce changes to the system’s behavior.
Vnode, on the other hand, employs an entirely different approach. It relies on comprehensive instrumentation of the runtime to enable seamless tracing of applications that use it. Vnode utilizes a specific technique called ITTCR to identify and reconstruct causality in interactions among different microservices running under Node.js. Importantly, this approach is applicable to various runtimes, including Java, Golang, etc.
4. Proposed Solution
4.1. System Architecture
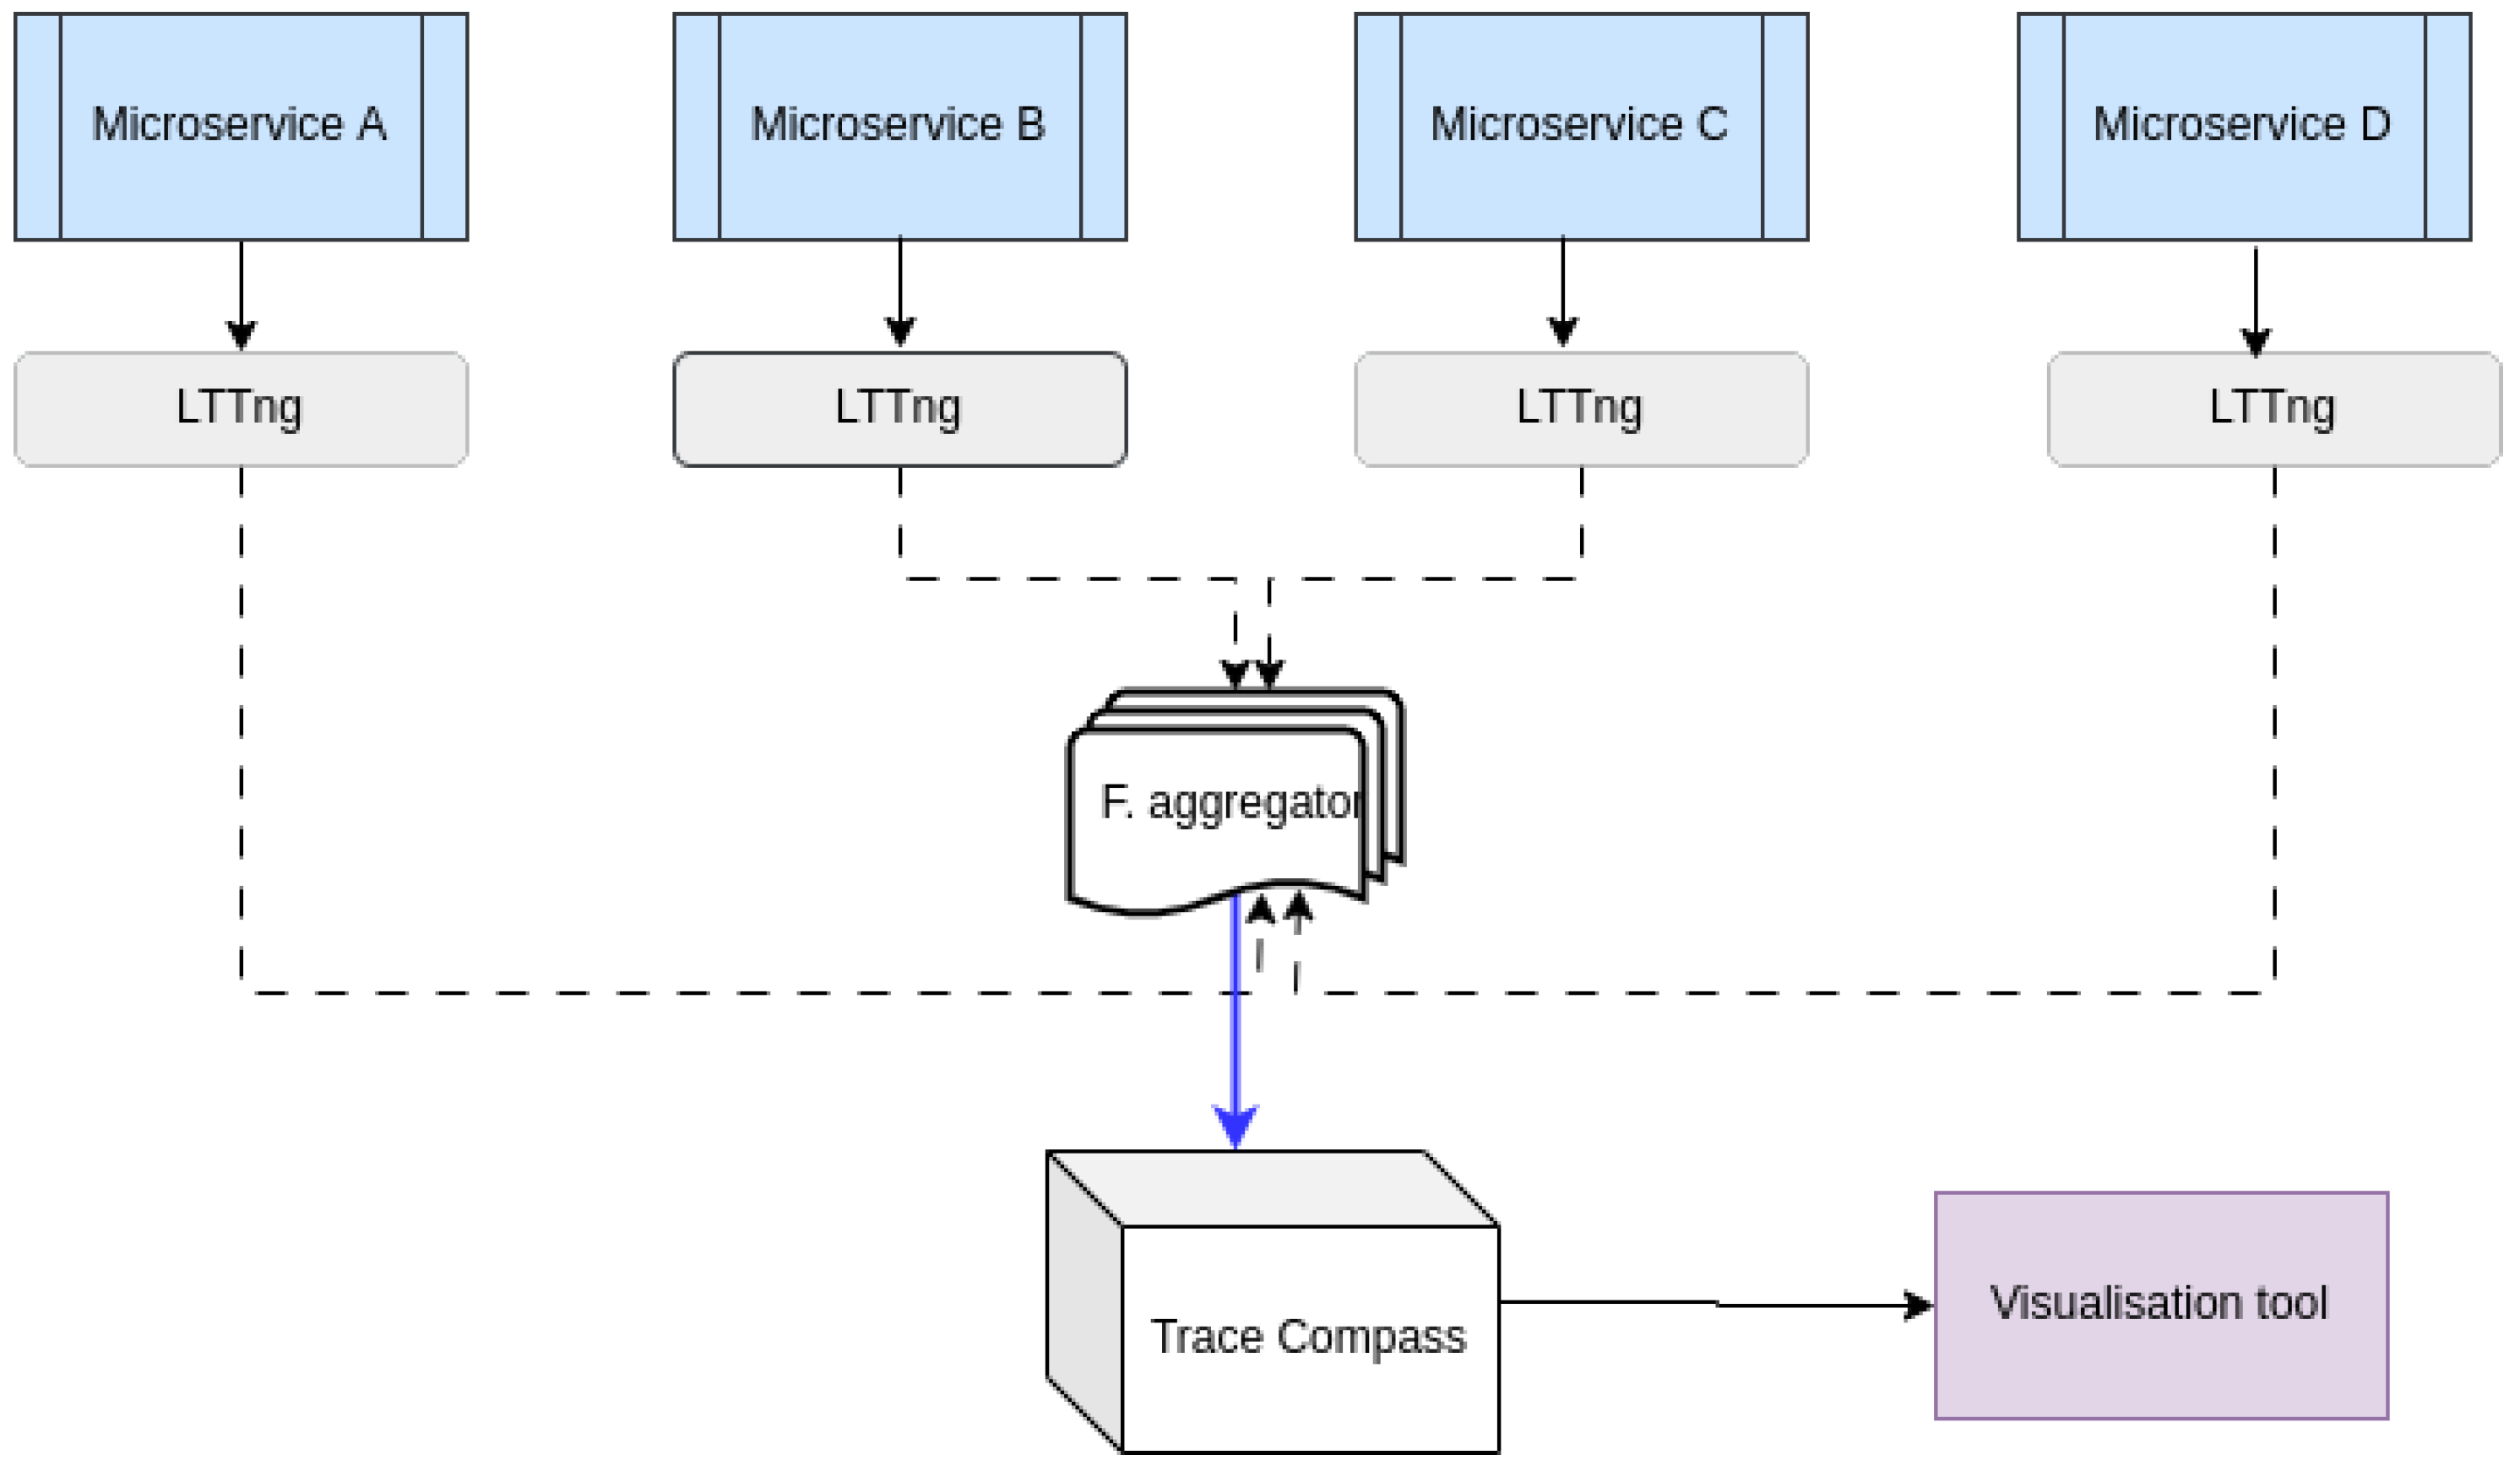
The diagram depicted in
Figure 1 illustrates the operational framework of the system. Given that each microservice is deployed in a container,
LTTng [
30] (Linux Tracing Toolkits Next Generation) is enabled on each one to capture traces. This produces several CTF (Common Trace File)-formatted local trace files. A file aggregator retrieves these files for importing them as an experiment into Trace Compass (TC) (
https://projects.eclipse.org/projects/tools.tracecompass (accessed on 2 November 2023)), where analyses are conducted. These analyses involve building an execution model based on the state system technology, constructed from the trace’s extracted attributes.
The State History Tree (SHT) [
31] is a highly efficient data structure employed in the creation of the model while reading the trace. It is used to store the attributes extracted from the trace as well as various analysis-related data. TC provides the framework for modeling and developing such data structures. The optimization technique employed enables the model to be queried in logarithmic time. It provides multiple features for the organization of the traces and the objectivity of the analyses. This is achieved by employing multi-abstraction, highlighting, and filtering. TC enables the definition of the desired granularity of performance measurements and the application of analyses within the desired time limits.
The trace is collected by inserting tracepoints into the internal Node.js layers. LTTng is used to conduct static instrumentation. The tracepoints are initially inserted at the level of the C++ bindings that interface with the native JavaScript modules, specifically the functions handling socket communications in Node.js. Then, it is possible to extract the necessary information pertaining to the various sockets and their attributes for the correlation and context reconstruction stages.
Information on the request attributes (methods, addresses, and ports) is transmitted directly from native JavaScript modules to the C++ bindings. In this manner, the expense of parsing HTTP requests is avoided and an LTTng probe is inserted at that juncture. The engine that generates asynchronous resource identification numbers is probed during the second instrumentation step. This technique enables accessing at the origin the identifiers of the execution contexts associated with the asynchronous resources, as well as the identifiers of the execution contexts of the resources that generated them. In addition, it enables monitoring their entire lifecycle from creation to destruction.
Therefore, the costly Node.js Async Hooks API is unnecessary for monitoring the asynchronous resources. Tracing is performed directly within the VM, which significantly reduces the overhead in this context. LTTng has become known as the fastest tracer in the world and incurs minimal system overhead. It permits the creation and collection of events, which are then loaded into TC. Developed extensions in the latter facilitate the creation of event analyzers and handlers. It is a free, open source tool that allows for the analysis of traces and logs. The extensibility of the system enables the creation of graphs and views, as well as the extraction of metrics.
4.2. Framework Implementation
In this section, we present the implementation of our transparent tracing technique. It unfolds in two main stages. The first stage involves collecting execution traces across various microservices by going through a Node.js virtual machine instrumentation phase. This phase enables the establishment of a transparent execution trace collection infrastructure. In other words, it automatically captures events generated by interactions among microservices, without requiring developers to manually instrument their systems using distributed tracers.
The second stage involves conducting an analysis to build a model based on finite state machines and SHTs (State History Trees). The analysis entails traversing the trace events, extracting attributes, and calculating the metrics necessary for model construction. TC is a highly efficient framework that provides an environment for building finite state systems and can handle traces containing millions and billions of events. This is made possible through the construction of a specific on-disk data structure called an SHT. Developed views can then query the model to display information for performance debugging of microservices.
4.2.1. Instrumentation and Transparent Trace Collection Technique
Microservice interactions occur through message passing across network sockets. In microservices using HTTP as the communication protocol, when one microservice wants to send a message to another, it first establishes a connection with the remote component. Internally in Node.js, native modules managing network sockets communicate with the Node.js virtual machine to request information about the created socket context. In a single-threaded environment like Node.js, multiple events are managed concurrently. Node.js implements an internal mechanism to track different asynchronous resources by assigning them an identifier.
For instance, if a function with identifier “12” first creates a socket, this socket might receive identifier “13”, implying that this new resource was created in the “12” context. Similarly, any new resource initiated within the socket’s context will have “13” as its execution context, in addition to its own resource identification number. Managing asynchronous resources in environments like Node.js is extremely complex and challenging. Async Hooks, an experimental API, was proposed to track the lifecycle of these asynchronous resources. However, this API is costly in terms of system performance, sometimes increasing the overhead by up to 50%.
For most production applications, this overhead is not tolerable. This is because each call to the API requires crossing the JavaScript/C++ barrier of the V8 engine, which incurs a very high cost on the system. The proposed solution circumvents this by addressing and collecting information directly at the source, that is, at the level of the engine responsible for generating the asynchronous resources. In other words, our solution involves definitively instrumenting the
Node.js virtual machine to transparently collect network communication data.
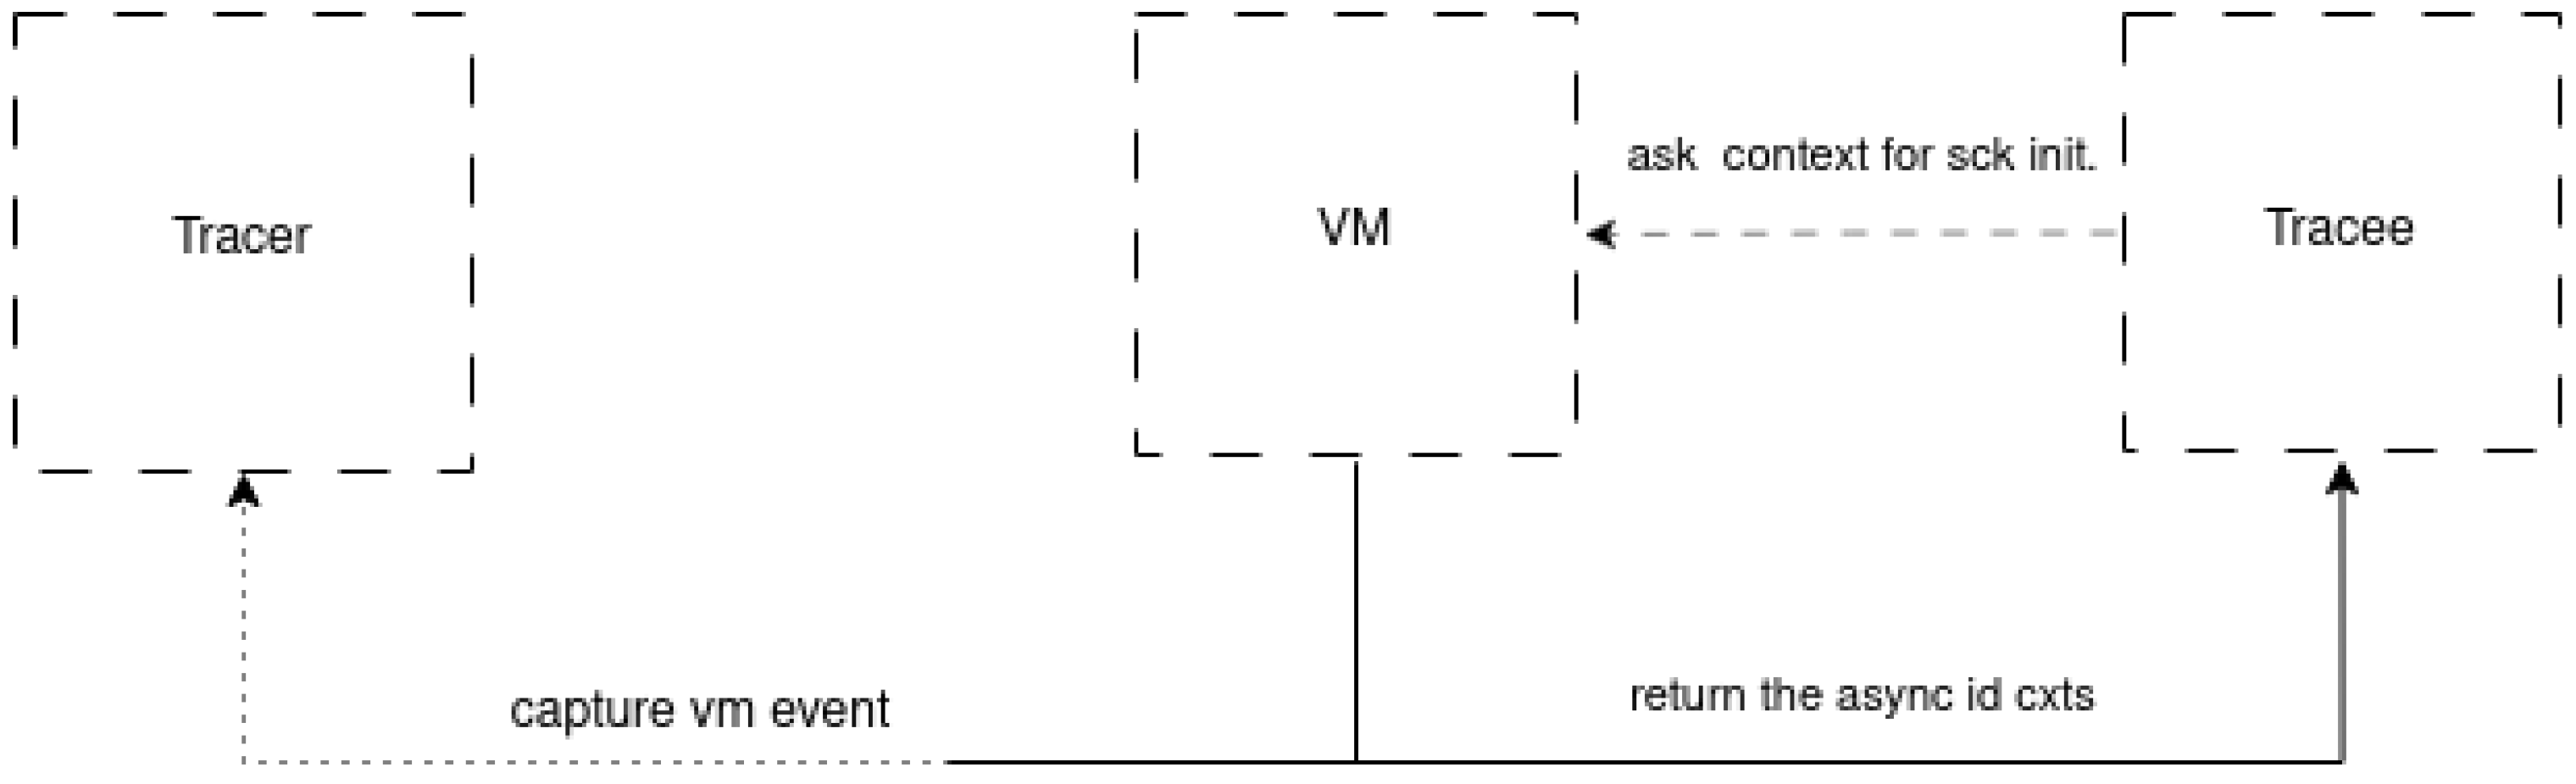
Figure 2 shows the internal process of execution context creation at the VM level when a network connection is established. It can be observed that when a microservice sends a message to another component,
Node.js native network modules request the context from the asynchronous resource manager.
This manager initializes the new resource and assigns it a generated number. The number assigned to the created socket allows for the identification of the execution context of objects. For example, when a response to a request returns, Node.js checks the socket number (context) in the request header to route it to the waiting resource. This is a Node.js multiplexing function, given its single-threaded nature. To trace the interactions among microservices, five main tracepoints were inserted into the native module and the Node.js virtual machine: http_server_request, http_server_response, http_client_request, http_client_response, and async_context.
The http_server_request tracepoint is activated when the server receives a request to process, such as when a microservice receives a specific request. The http_server_response tracepoint is activated when the server returns a response after processing the request. The http_client_request tracepoint is activated when a component emits a request, for example, when a microservice contacts another microservice. The http_client_response tracepoint is activated when the response is returned to the sender.
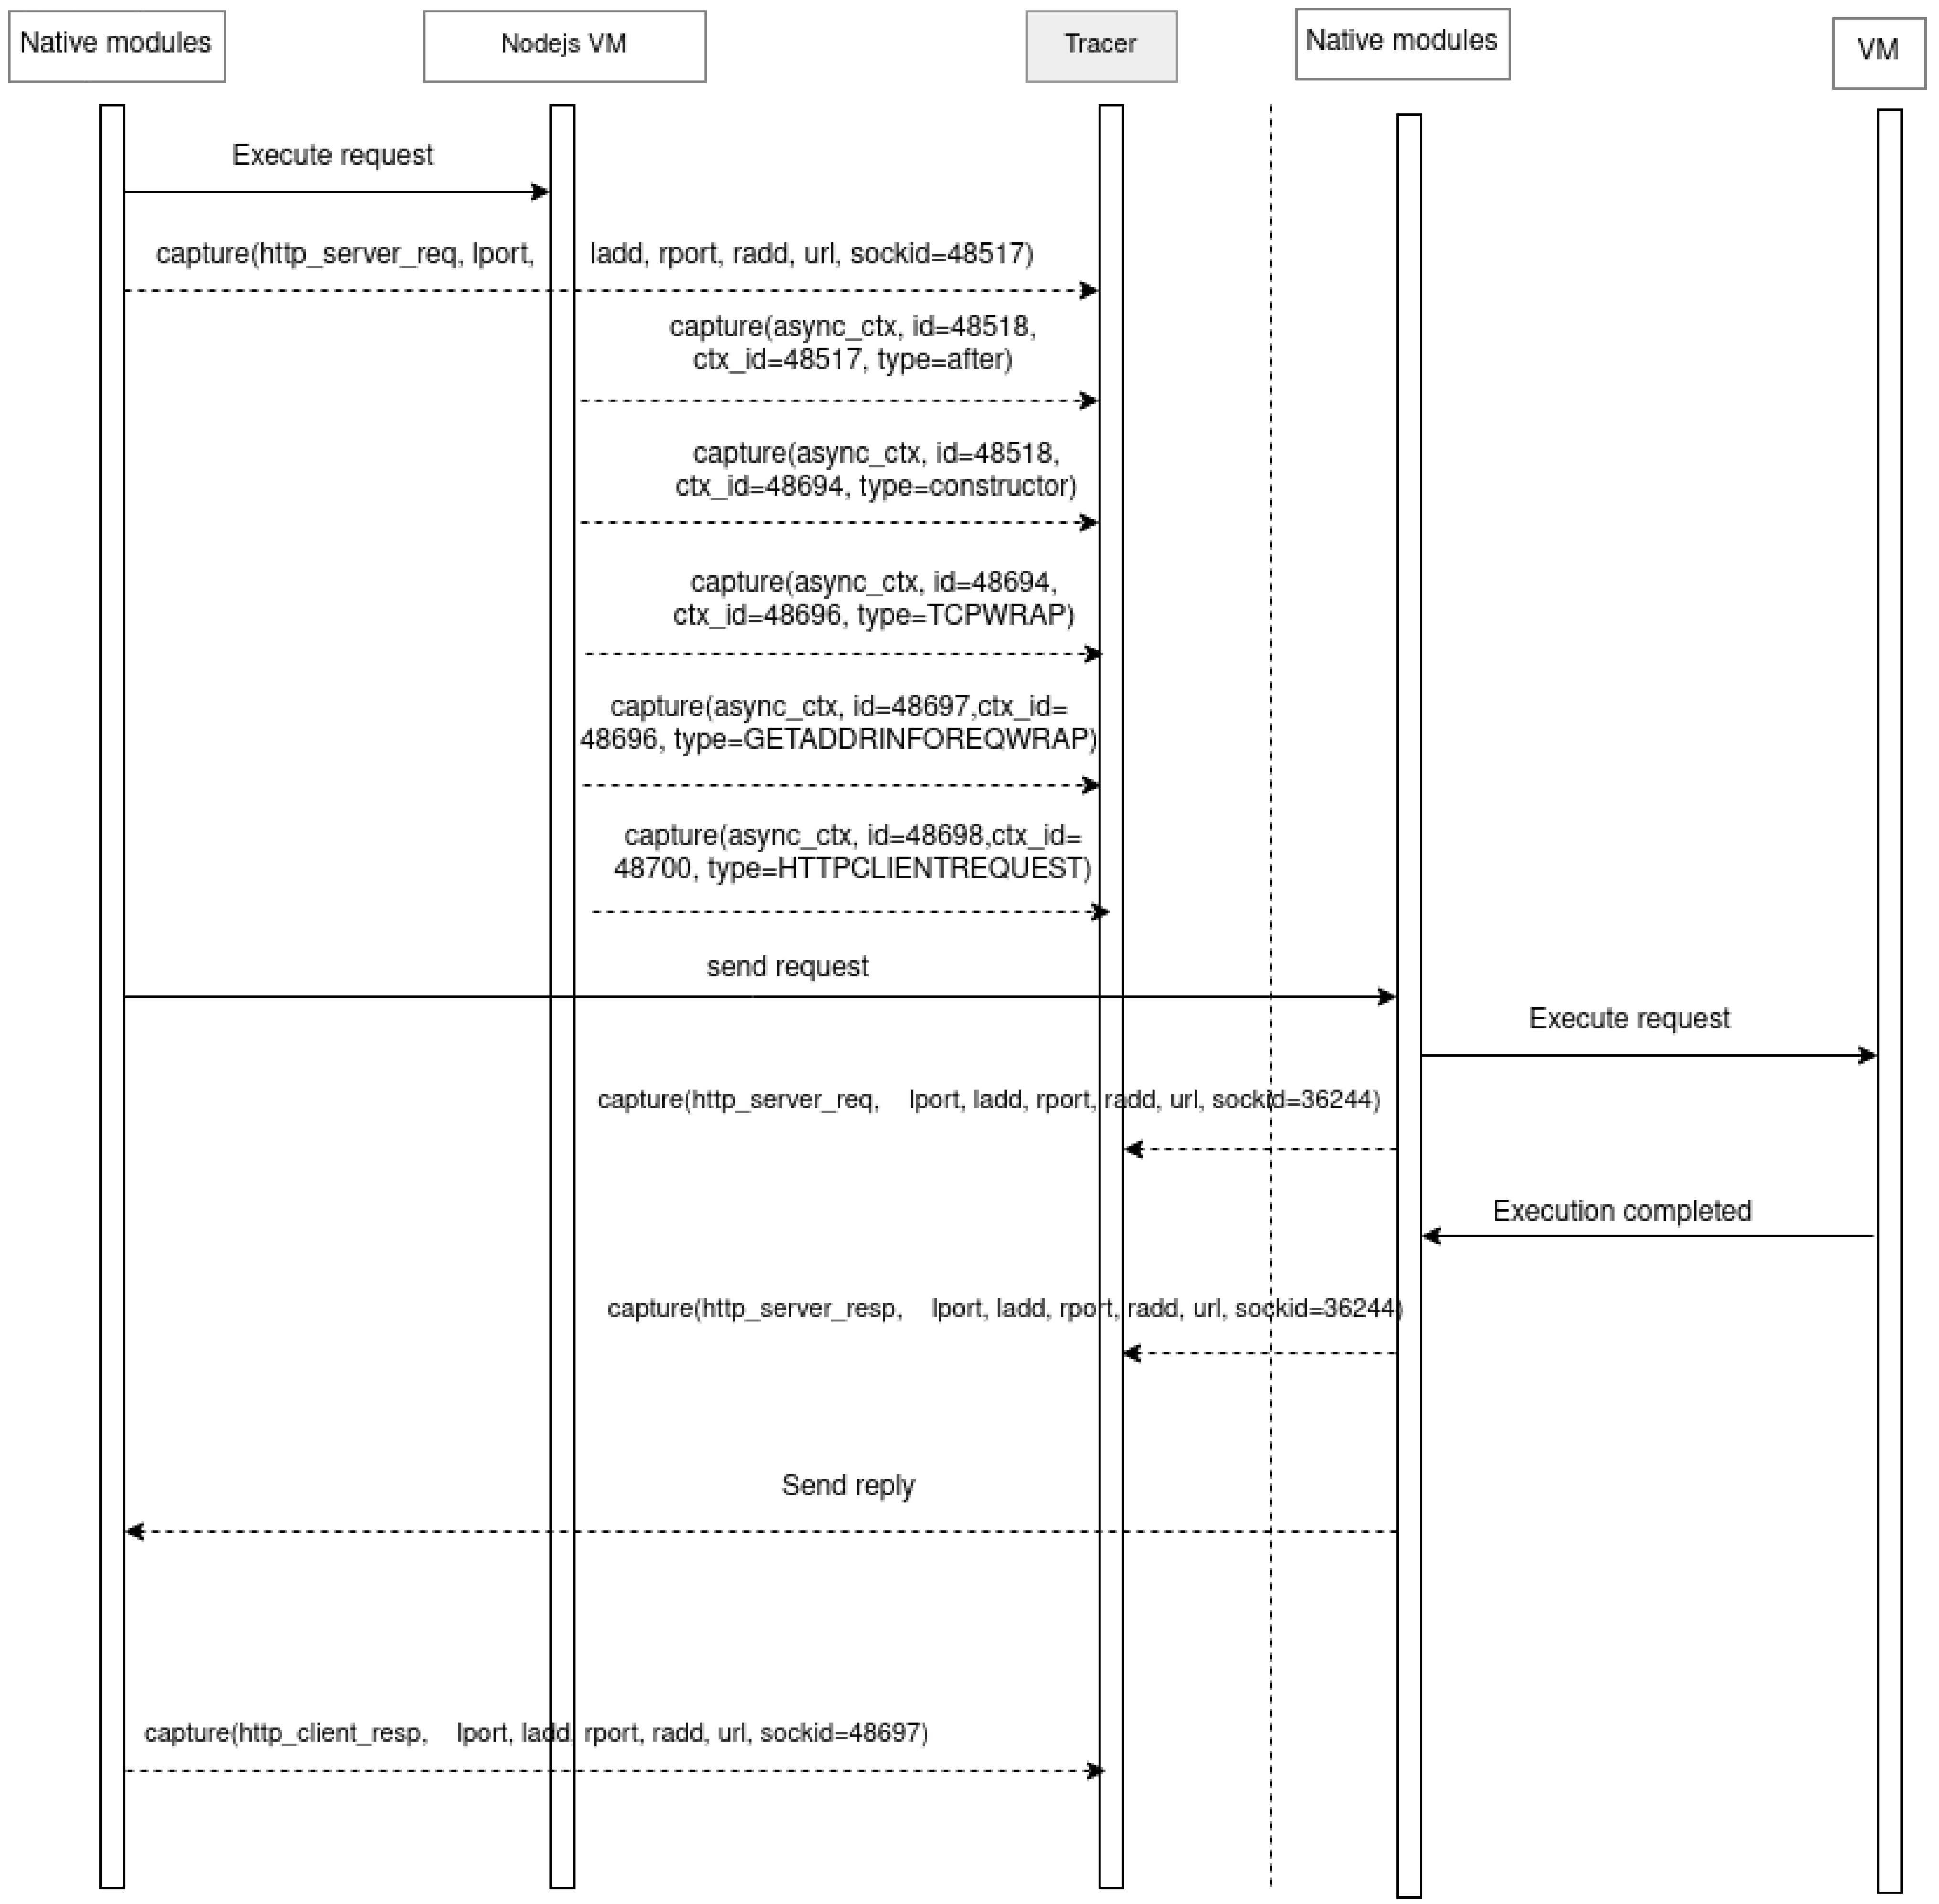
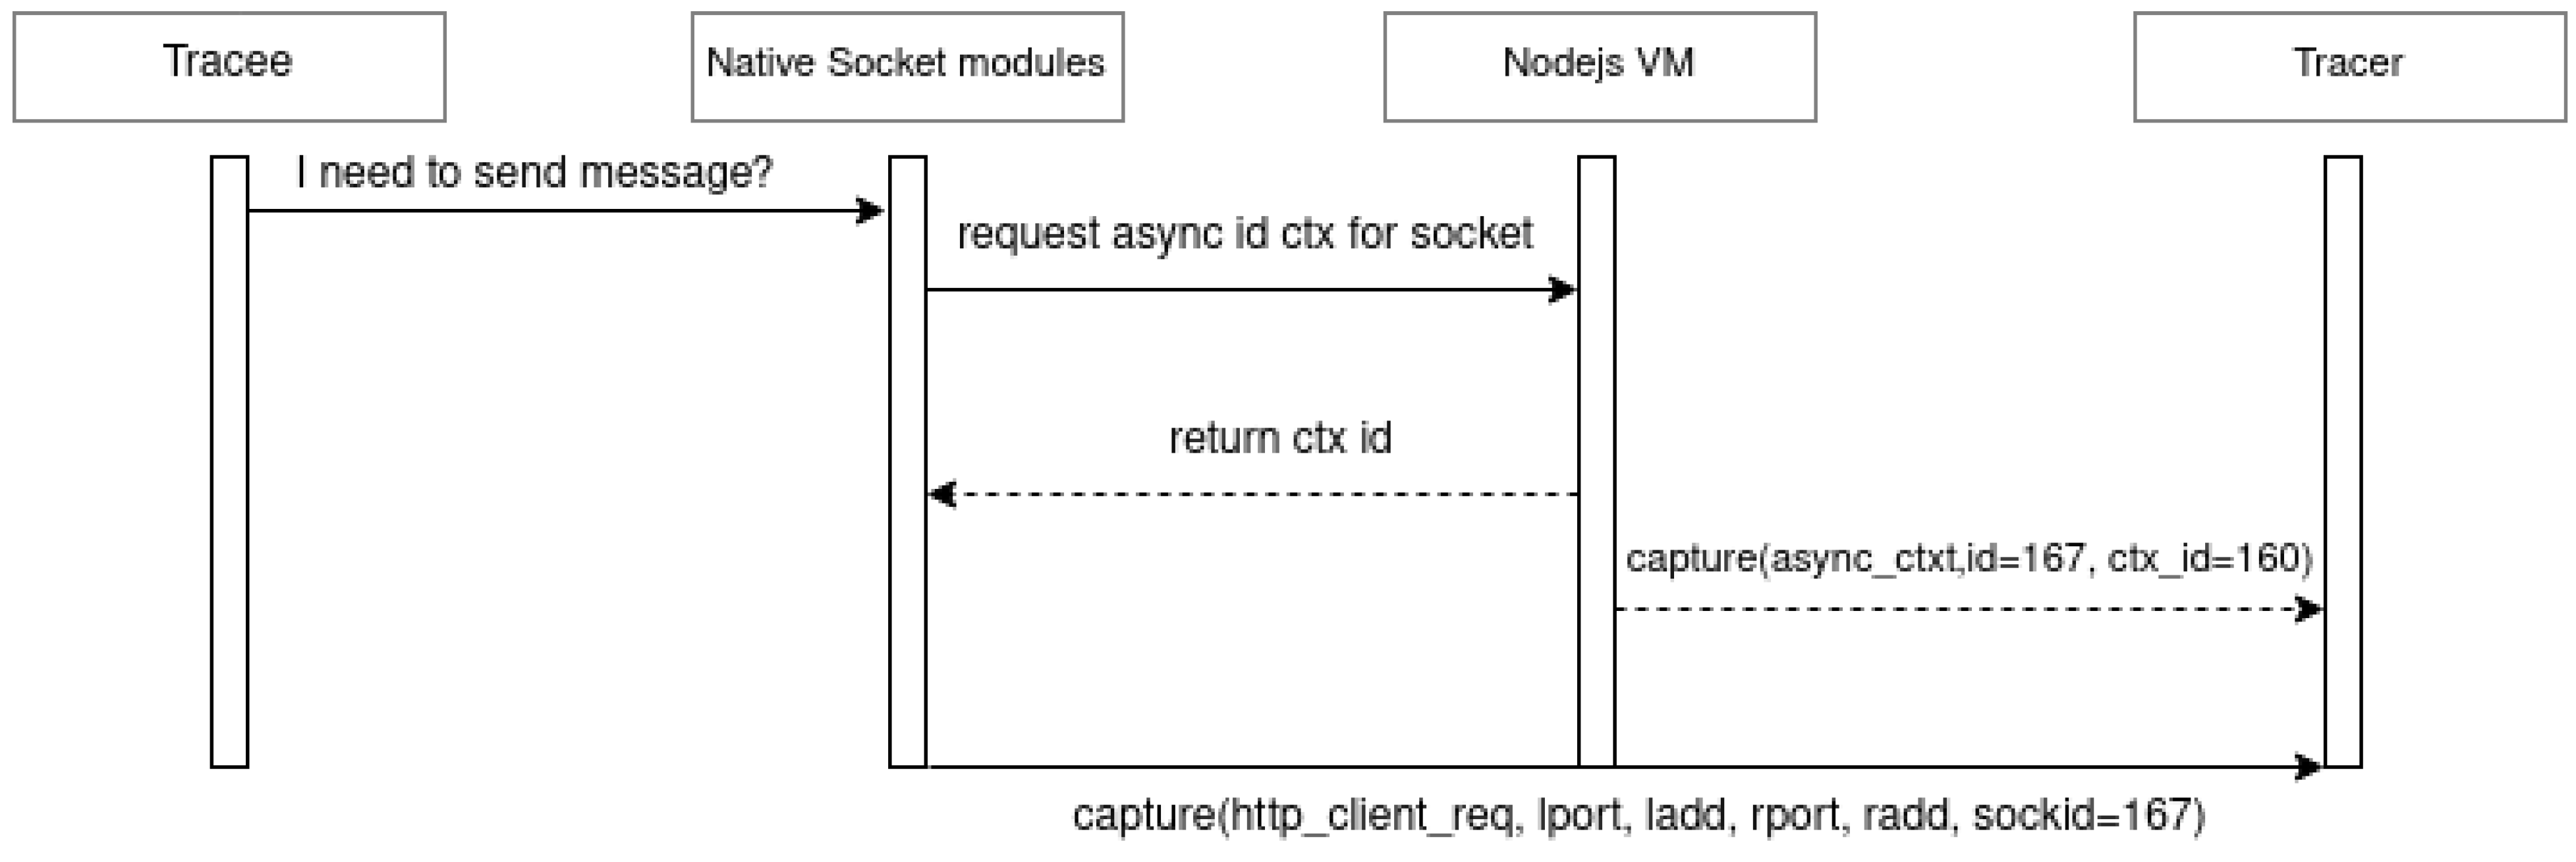
Figure 3 shows how this process unfolds when a request is issued by a microservice. First, native network functions obtain the socket context information containing the socket number and the number of the resource that created it to preserve the hierarchy and execution sequence. The creation and initialization of the new resource by the VM trigger an event captured by LTTng (the event is recorded as
async_context). This event exports various information in its attributes, including the identification number of the created resource, the identification number of the parent resource, and the resource type. After the request is sent by the native network functions, the
http_client_request tracepoint is activated and captured by
LTTng. It is exported with the attributes, as represented in
Figure 2.
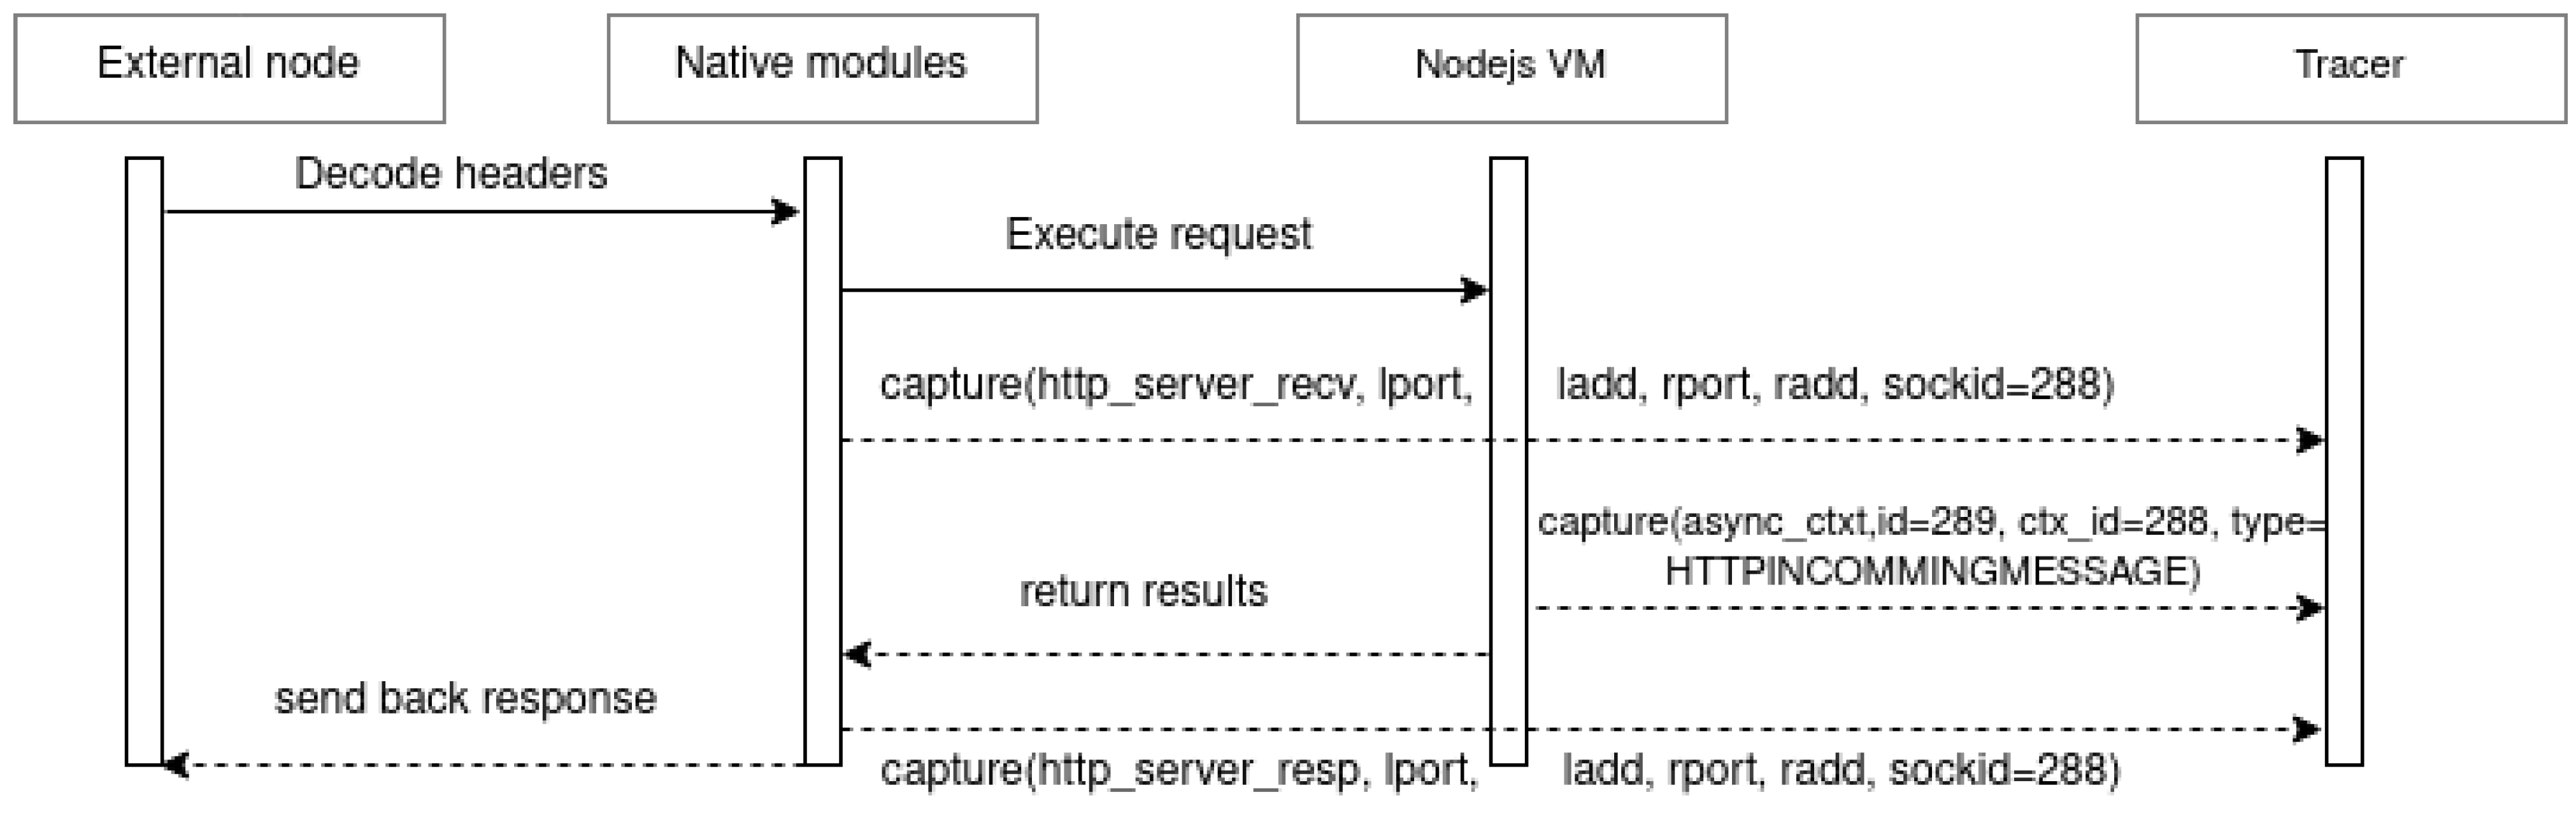
When the destination microservice receives the request, as observed in
Figure 4, the request is first decoded by
Node.js network functions, and at the same time, the
http_server_receive tracepoint is activated. The event is exported to LTTng along with all its attributes, as shown in
Figure 4. At the end of the request processing, the request is returned, activating the
http_server_response tracepoint, which is also exported along with all its attributes. Activating the different tracepoints produces a file in CTF format at the end of system tracing.
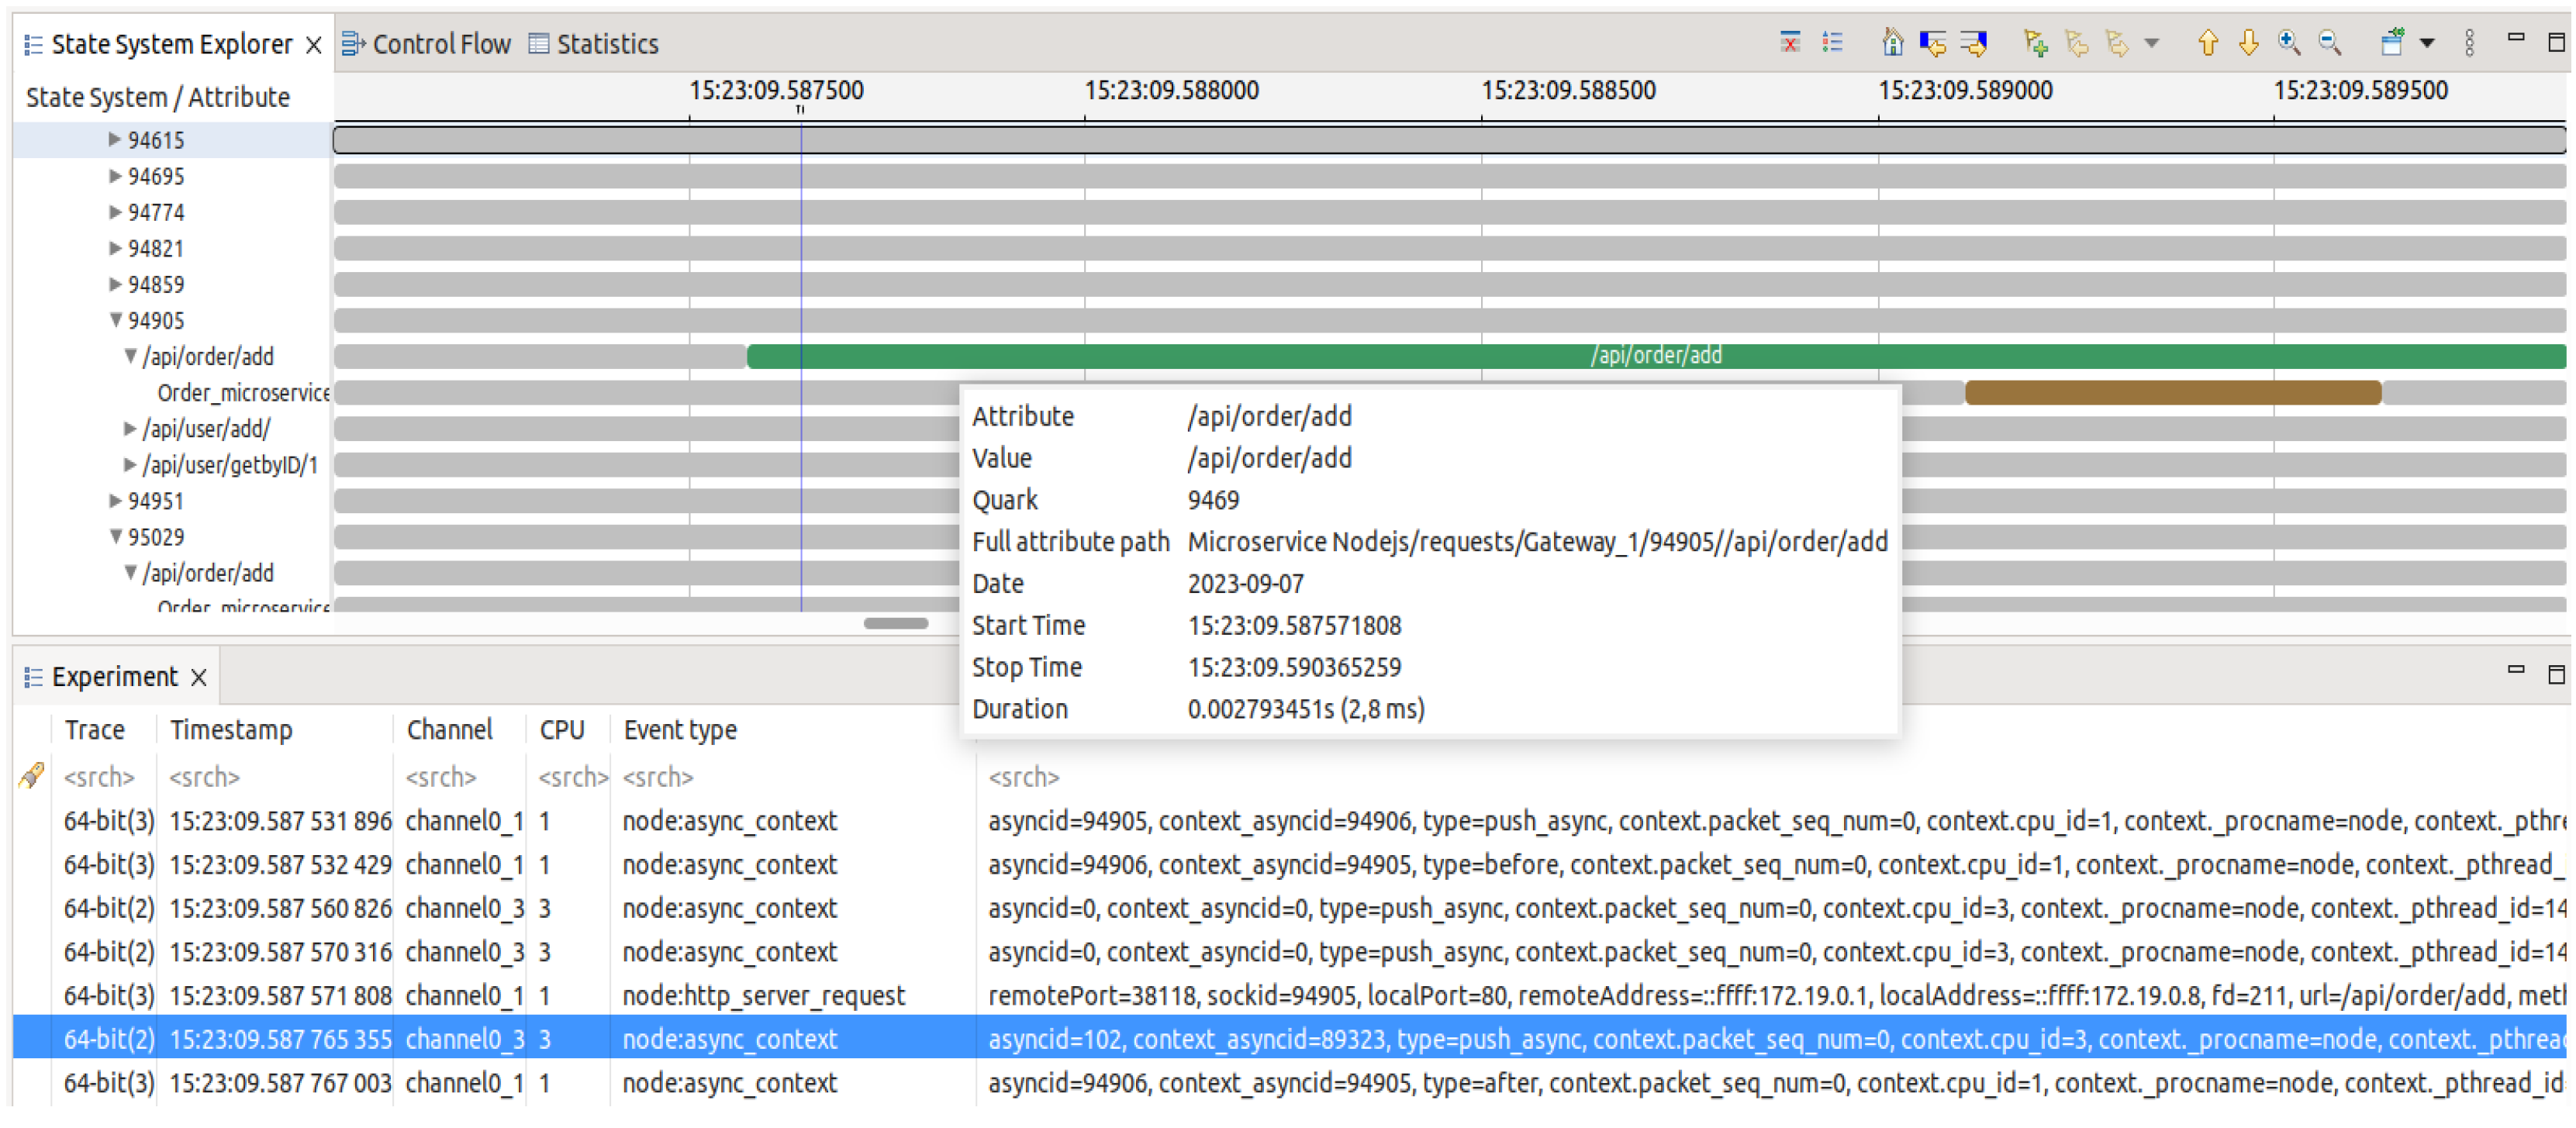
Figure 5 depicts a part of the trace experiment. Some events are not included to optimize the view. This file, containing the transparently collected information, can be very large depending on several factors, such as the system load or the duration of its tracing. Therefore, it is crucial to employ automated methods to analyze the trace to extract relevant information. The next section addresses the new analysis approach we propose in this work.
4.2.2. Pattern-Based Context Reconstruction Formalization for Trace Analysis
When conducting analysis using TC, a state system is built. The states encompass all the events that are deemed acceptable by the analyzer for the purpose of instantiating and activating the different system transitions. Our approach for reconstructing the execution contexts of all the requests relies on identifying specific sequences of system transitions. These sequences are retrieved from the global state system and serve as the detected patterns. By traversing the trace to construct the state system, concurrent state subsystems belonging to the global system are identified and correlated with the concurrent requests to which they are bound. The obtained state system can be regarded as a finite state machine consisting of six components.
Let
M be a finite state machine:
where
P represents the state space;
F represents the event space;
B represents the action space;
G represents a subset of P;
s represents an element of P, the initial state; and
represents the state transition function
where
represents all the sequences of members belonging to X. In other words, the patterns that model the execution of the concurrent requests in the state system are sequences of members of the global state system. The transition function can be extended as defined in Equation (
2). In this case, if
p is the active state of M and if there is an occurrence of event
f, then
q becomes the new active state of the system; therefore, action
b is taken. The handling of events during the execution of the analysis makes the system transition to multiple states. For each state, related actions are undertaken.
Consider the events
p,
t, and
h; the states
s,
k, and
w; and the actions
a,
b, and
c defined in Equations (
4)–(
6). Then,
pth is an event sequence in
. As defined by Equation (
7), the system should transition from its initial state,
s, to
k and then to
w and
n. For each transition, the system will perform the actions
a,
b, and
c. The inputs to the model are the different accepted events from the trace while the handler is running. Actions are taken for each of the accepted events required to construct the global state system and build the SHT. The patterns are modeled as a subset of the global state system identifying transition sequences.
4.2.3. Trace Analysis Technique
Performance debugging in microservices involves a phase of trace collection that necessitates system instrumentation. This step is crucial for gathering the necessary data to interpret the system’s operation. An analysis abstracts the system’s overall functioning to avoid delving into the minutiae of the data extracted from the system. However, effective, robust, and rapid methods are required to utilize the data collected in the initial phase, as the files can become exceedingly large, containing millions or even billions of events. This necessitates the use of tools capable of handling such vast quantities. Our approach conceptualizes system executions as finite state machines. A request is viewed as an automaton transitioning through states based on trigger events. The automaton sequence of transitions represents a series of events occurring during system execution.
Our method achieves transparency in the analysis by matching pattern sequences observed during request executions. An initial understanding of system activity based on the collected traces allows for the identification of recurring patterns in microservice interactions within
Node.js. We then model these patterns as finite state machines to understand the system’s various states to debug its performance. We utilize TC to load the trace for our analyses. TC extensibility enables the development of visualizations based on these analyses, providing essential tools for the analysis of system performance. To preserve the different states of the automaton, we use a particular expandable data structure optimized for supporting very large file sizes, known as an SHT. In
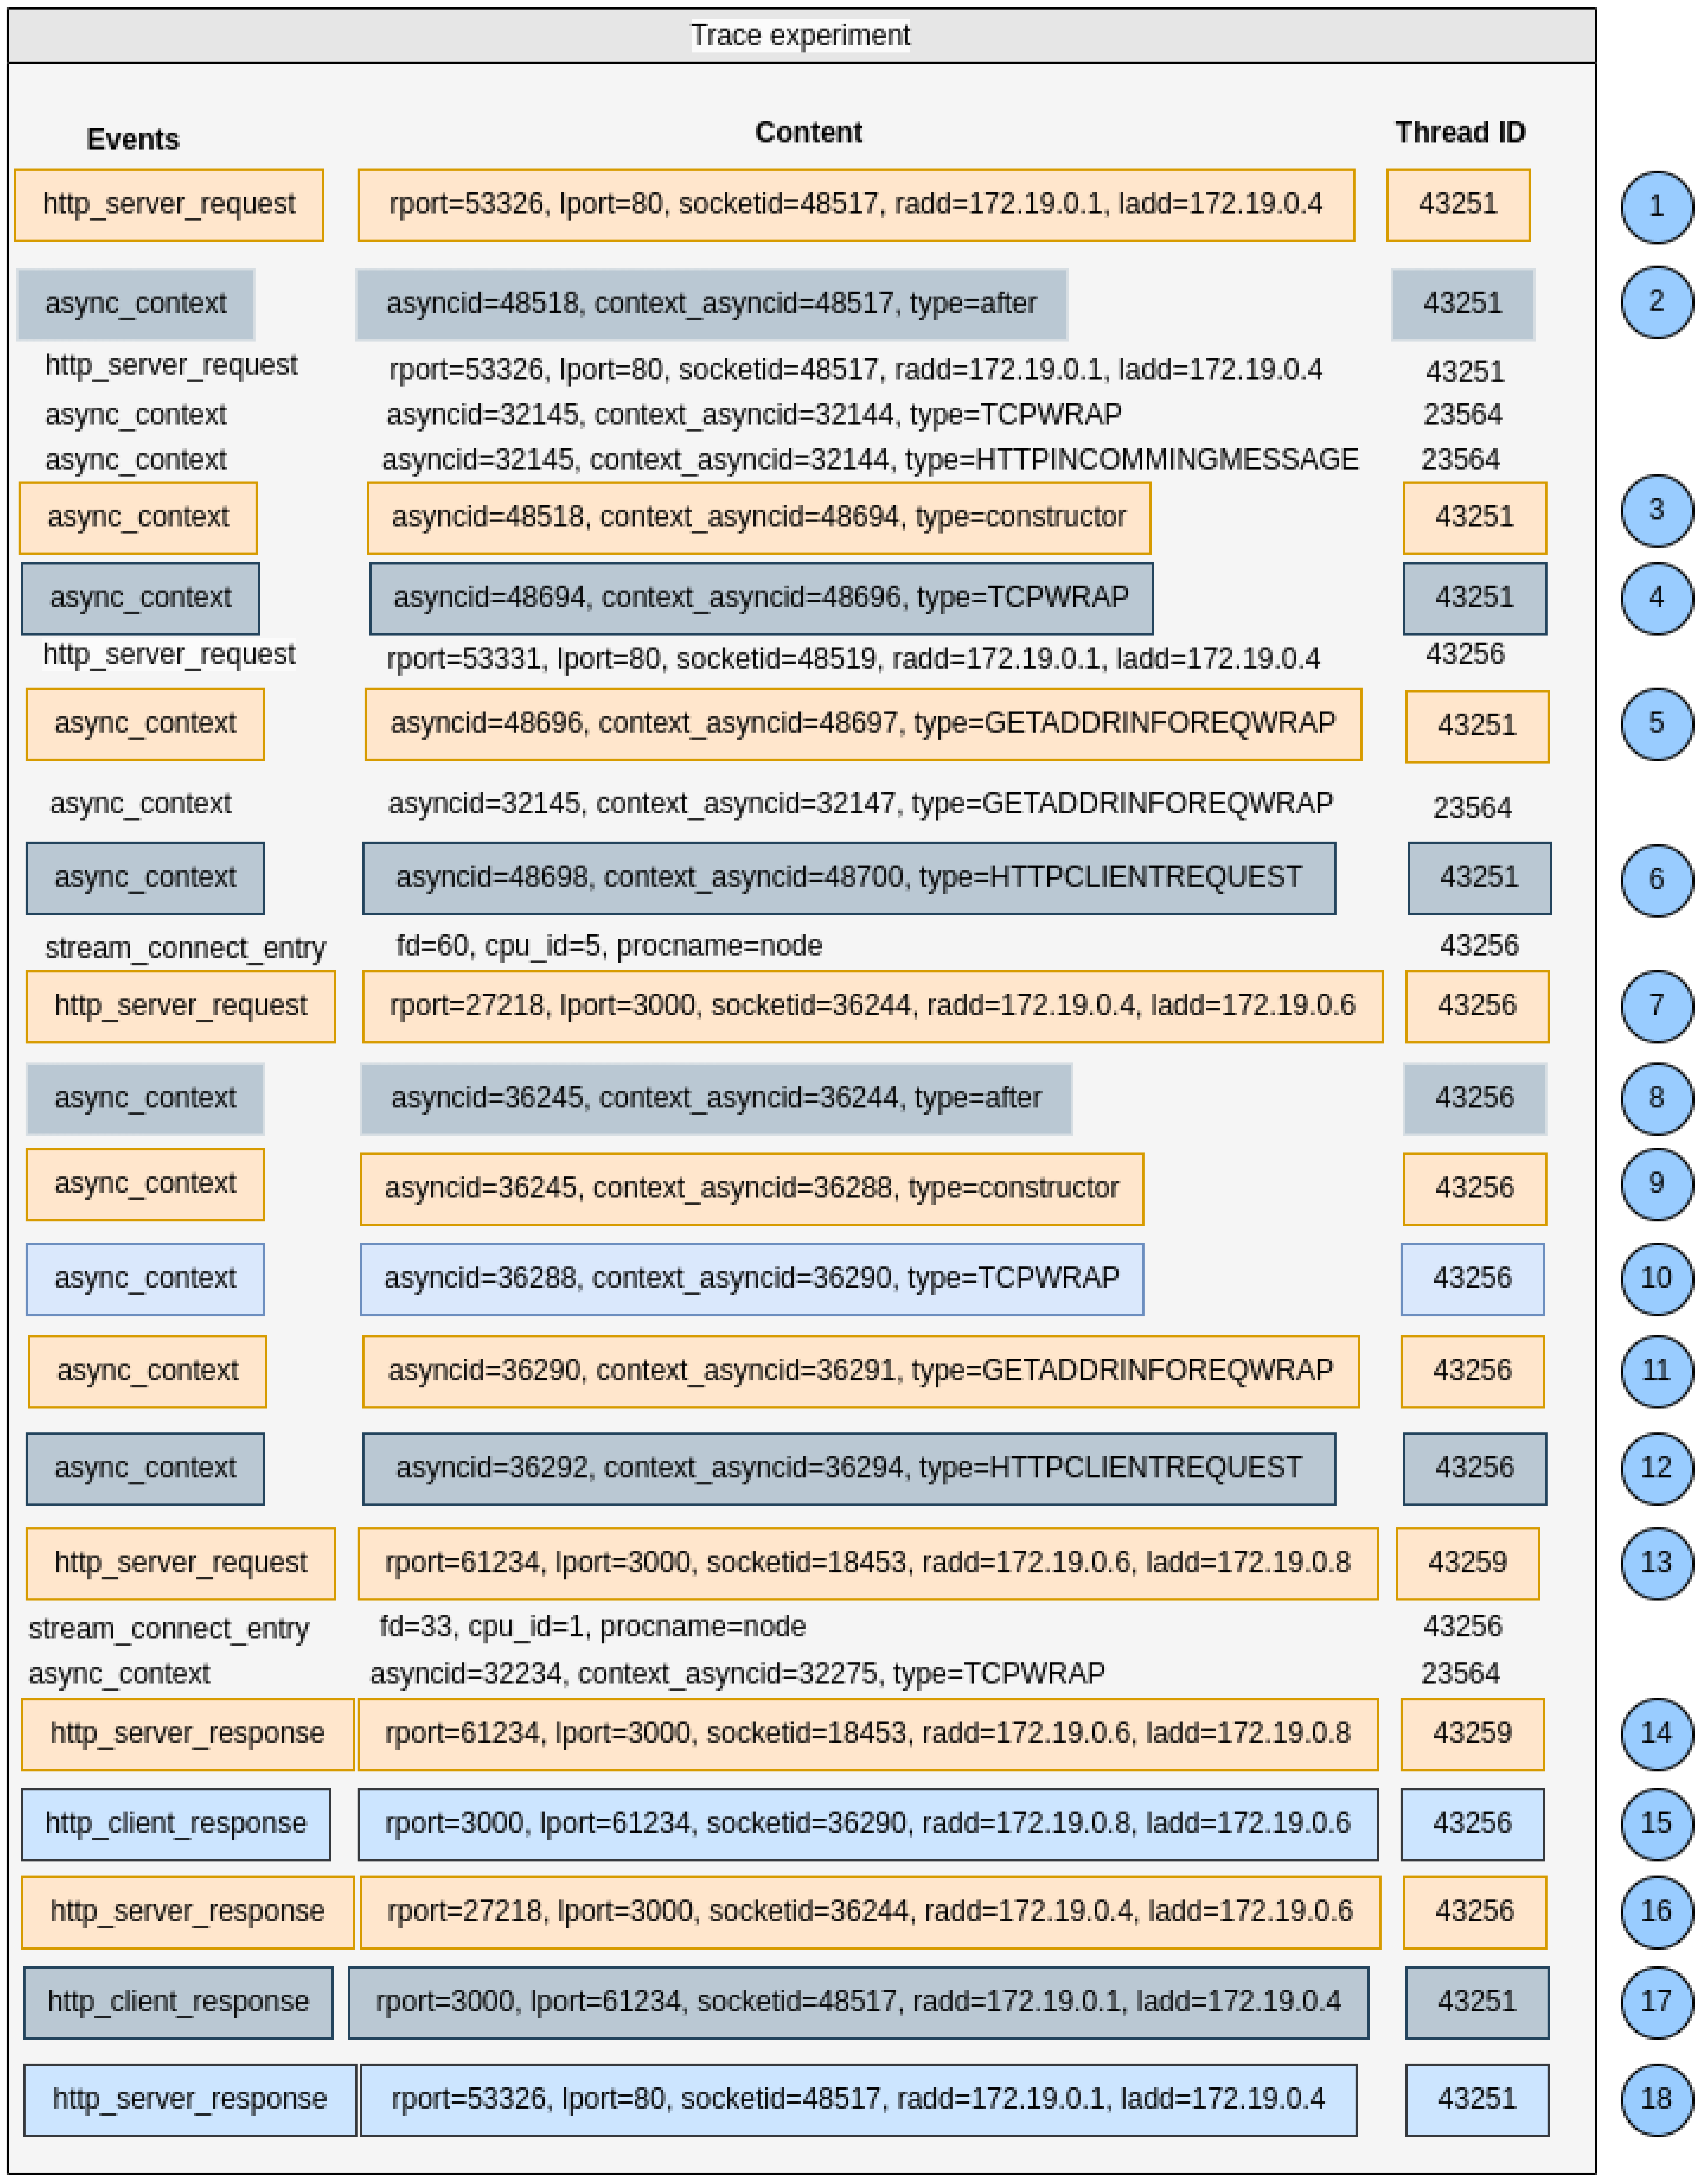
Figure 6, it can be seen that a request arrives at the gateway microservice, which must redirect it to the relevant service’s microservice.
In this case, activating the http_server_request tracepoint initiates the state machine and sets it to the “receive request” state. To preserve this state, in the highest level of the hierarchy, the automaton state is recorded in the SHT with the data extracted from its attributes. The automaton transitions to the next state when the async_context event is encountered in the trace, and its attribute type is “after”. Here, the sockid value of the previous http_server_request event is matched with the ctx_id attribute of the async_context event, ensuring that the current event occurs within the context of the ongoing request.
The next state is activated when the async_context event’s attribute type is “constructor”. At this level, the id attribute value is matched with that of the previous state (48518 and 48518), ensuring that the reconstructed sequence is linked to the initial request. The automaton transitions to the next state when the async_context event type value equals “TCPWRAP”. To maintain the sequence context, the id attribute is matched with the ctx_id of the previous state (48694 and 48694). The next automaton transition occurs when the async_context event type value is “GETADDRINFOREQWRAP”, with its ctx_id matched to the previous state (48696 and 48696). Finally, the system transitions to the next state when the async_context event type value is “HTTPCLIENTREQUEST”. Here, the id attribute value must be one order higher than the previous state (48698 and 48697).
At this point, the asynchronous sequences that the received request passes through within the gateway microservice before being forwarded to the intended microservice are transparently reconstructed. This state sequence is the model followed by Node.js to communicate with microservices via HTTP (REST API). The type attribute values are obtained directly from the Node.js virtual machine, representing the different asynchronous resources created during request execution. Each system state is recorded along with its attribute values in the SHT. The context allows for hierarchically inserting states and attributes into the SHT to form a hierarchy defining the sequence of automaton execution, including their start and end, thus enabling visualizations to extract information for studying system performance. The outcome of the analysis yields a structured and hierarchical representation of the diverse interactions across microservices, achieved through a fully transparent process.
5. Results
In this section, we demonstrate the capabilities of our tool using three use case scenarios. The objective is to effectively articulate the anticipated outcomes derived from the utilization of
Vnode. The
Nodejs-Restful-Microservices application (
https://github.com/tudtude/MICROSERVICE-RESTful-Nodejs (accessed on 4 November 2023)) is utilized for this purpose. This application is a complete microservice architecture developed with
Node.js that uses
Redis as an in-memory store. We subsequently evaluate the overhead incurred from the use of our technique in comparison to other state-of-the-art approaches.
5.1. Use Cases
In this section, we present three practical use cases to demonstrate the efficacy of our tool.
5.1.1. GET Request Tracing and Visualization
In the initial use case, simultaneous requests are executed in order to retrieve specific information pertaining to an individual user. The requests made are of the
GET type. Executing these requests after deploying the application generates multiple CTF-formatted trace files. As described previously, they are aggregated and imported as an experiment into TC.
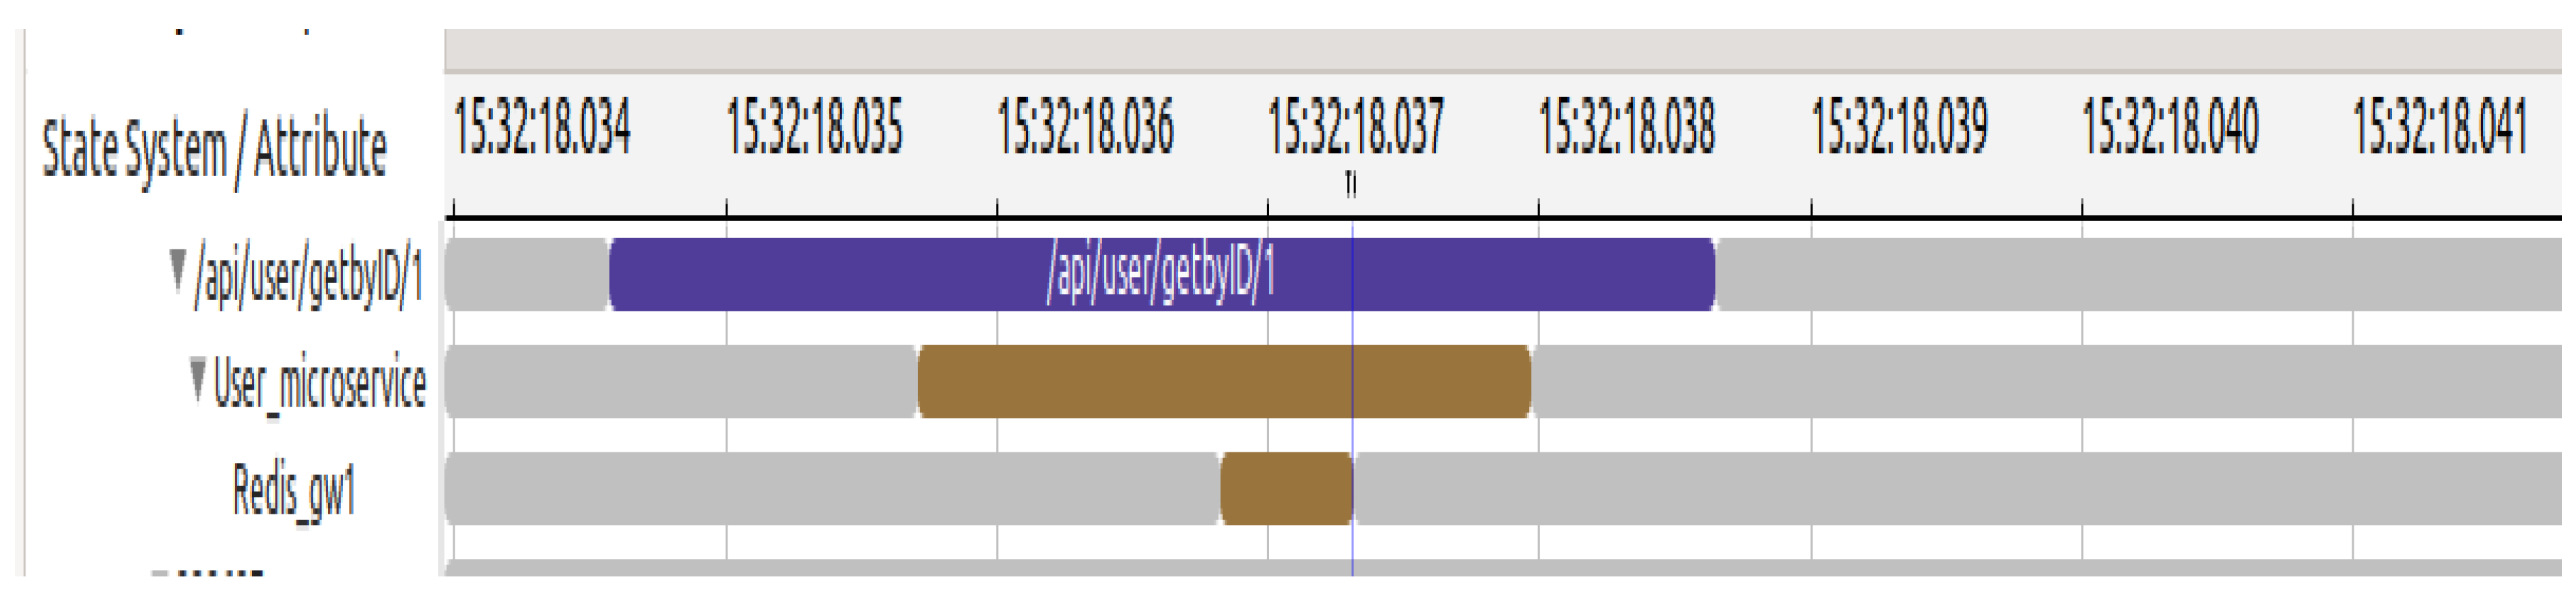
Figure 7 depicts the visual outcome of our analyses. The reconstruction of the alignment of request execution flows based on their respective contexts can be observed. After receiving the request, the server transmits it to the user microservice. The request is then forwarded to the Redis gateway since the data reside in the memory of the Redis data structure. The
Vnode facilitates the transparent horizontal alignment of requests and can be seamlessly integrated into the application development and operation pipelines.
5.1.2. POST Requests Tracing and Visualization
The second use case involves the sending of
POST requests to place item orders.
Figure 8 demonstrates the capability of
Vnode to smoothly rebuild request execution contexts, depicting the output of the analysis execution. In contrast to the initial use case, upon receipt of the request by the server, it is promptly forwarded to the microservice responsible for handling orders. As the operation entails the insertion of data into the database, the microservice executes the operation directly, bypassing the
Redis gateway.
When analyzing the two use cases, the particular feature of Vnode regarding the reconstruction of the communication architecture becomes evident. The strength of Vnode resides in its capacity to enable developers to comprehend and visualize the communication architectures of microservice systems implemented in Node.js. The developer does not need to grasp the application code or inner workings to comprehend how its components interact internally. Vnode reconstructs each API call execution sequence transparently and presents the results through a visual and interactive tool.
5.1.3. Tracing and Visualizing Requests Passing through Proxy Microservice
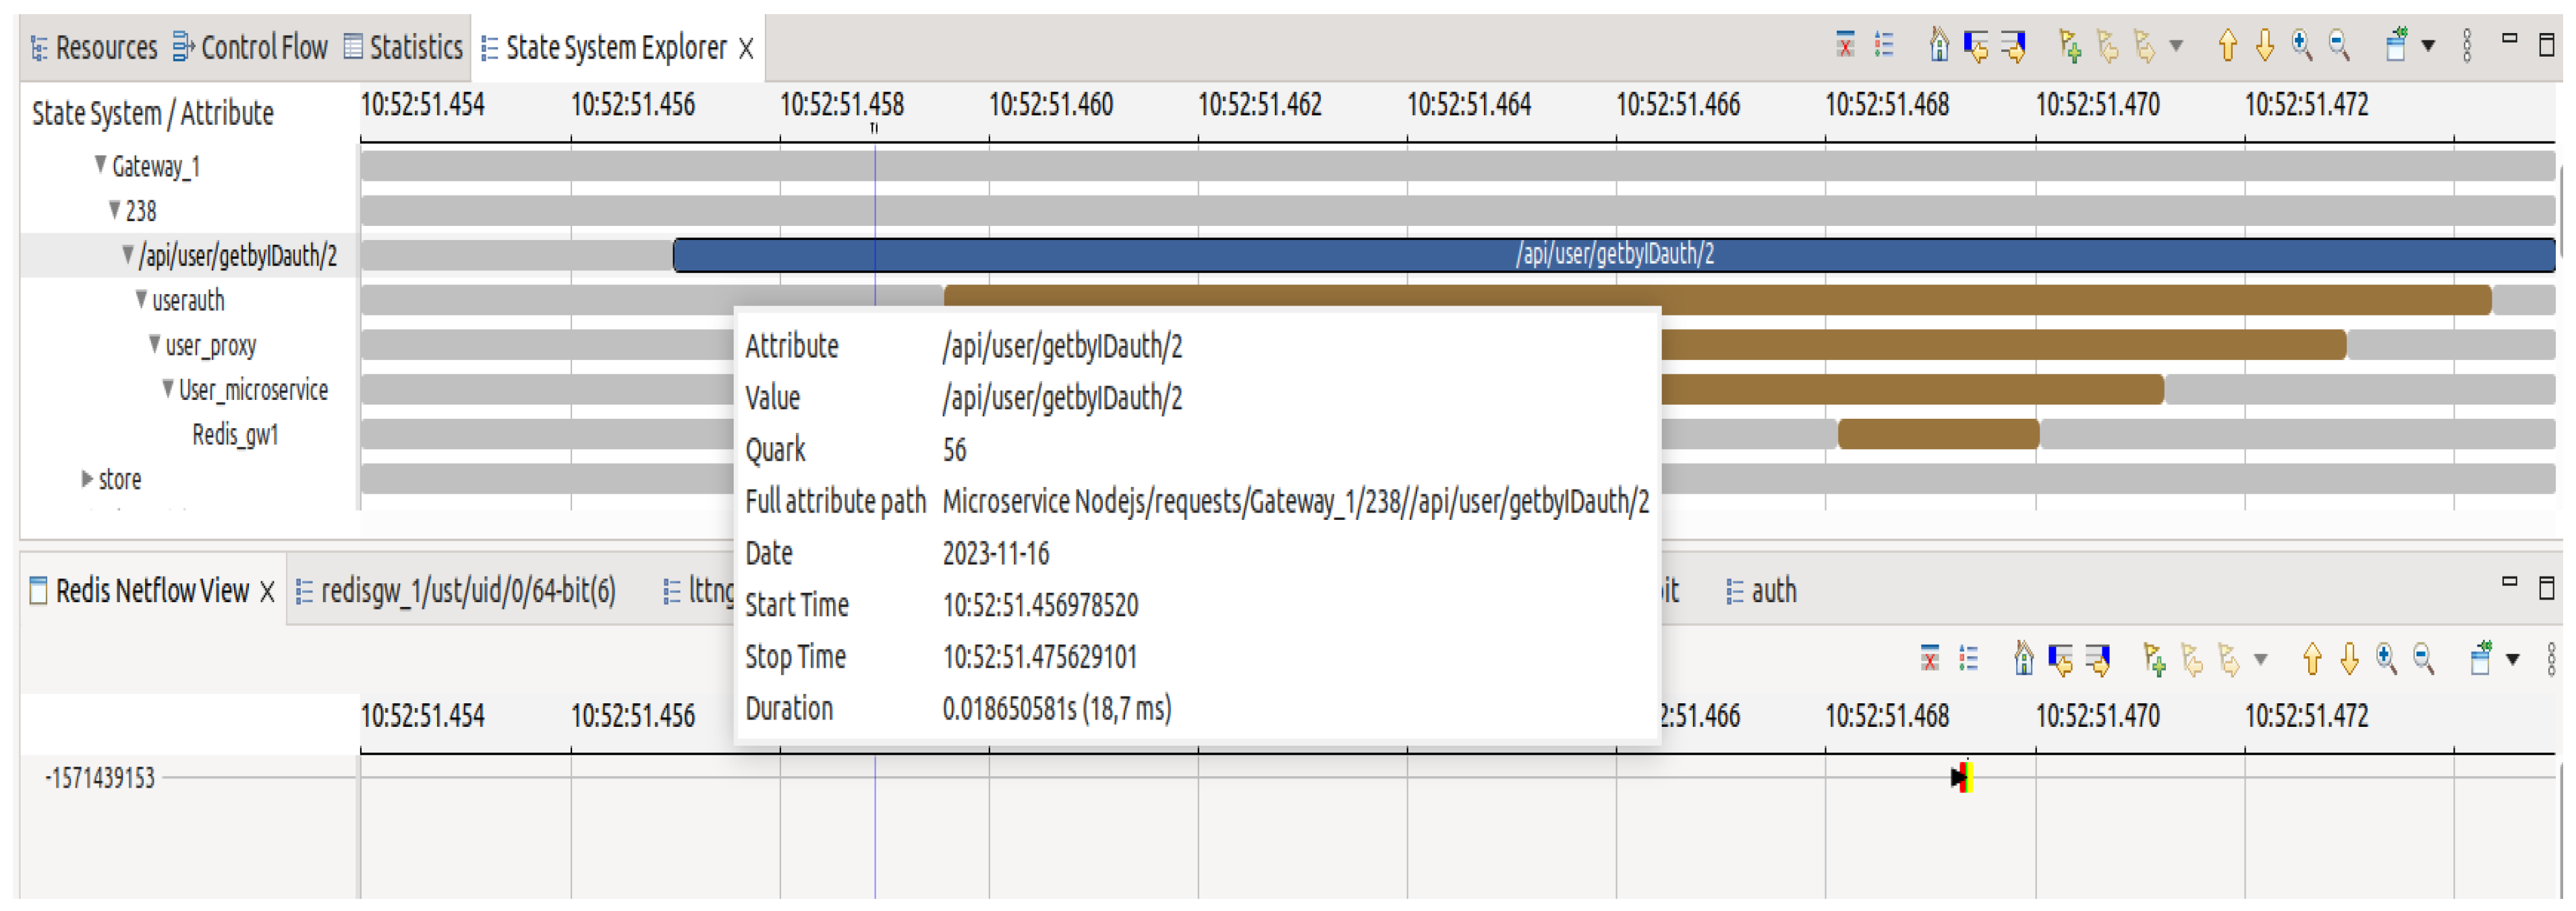
In this third scenario, requests are sent to a user authentication service to obtain the tokens necessary for user session validity. As shown in
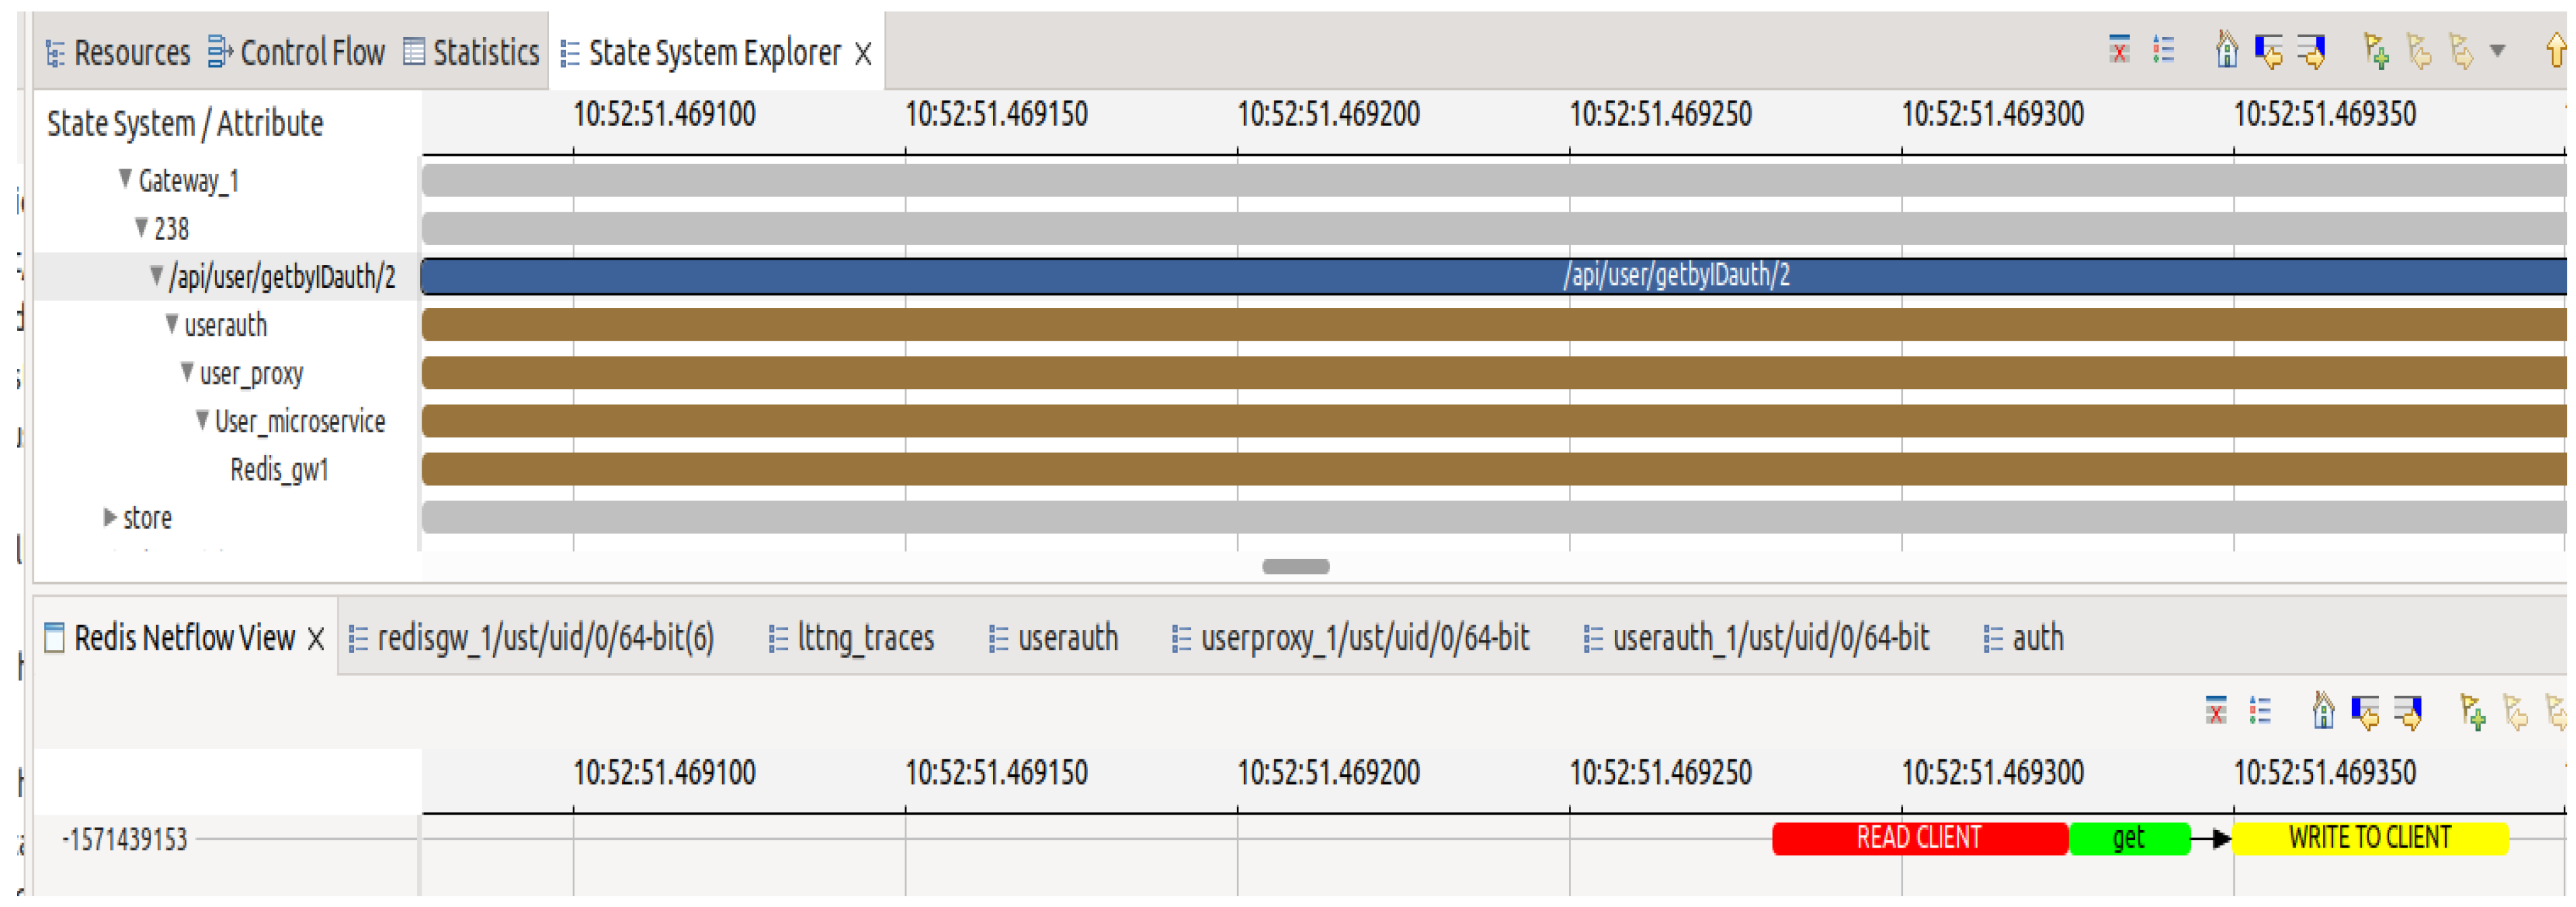
Figure 9, in this case, once the request reaches the gateway microservice, it is automatically redirected to the authentication microservice. After processing the request, the latter redirects it to the microservice acting as a proxy for the user service before being redirected again to the user microservice, which retrieves user information from the Redis database through the Redis gateway microservice.
Aligning the spans enables the complete visualization of the time the request spent in each microservice. By combining the microservice view with the
Redis one, as depicted in
Figure 9 and
Figure 10, it can be observed that the execution of the “get” command on the Redis server took an extremely short time, only 40 microseconds. However, the request took at least 18 milliseconds to complete. It is clear that the majority of this time was spent on the interactions among the microservices.
These results demonstrate how a system trace can be collected and analyzed in a completely transparent manner without requiring developer intervention. To the best of our knowledge, there is currently no approach that enables this. In this context, the execution flow and operational architecture of the microservices can be visualized without prior knowledge of the system’s implementation.
5.2. Evaluation
This section presents an evaluation of our tracing approach. We carried out experiments in different scenarios for the purpose of validating our strategy and comparing it to state-of-the-art approaches. The system configuration was an I7 core with 16 GB of RAM and a 500 GB SSD. The Nod.js versions used were , , and .
5.2.1. Objectives
A comprehensive assessment was conducted to evaluate the performance of our solution with respect to the incremental cost incurred by the system being evaluated. The process encompassed three primary parts: (i) an evaluation of the overall overhead incurred by the implementation of our tool; (ii) a comparison of the overhead associated with our tool in relation to other tracing methodologies; and (iii) an assessment of metrics that directly influence the development and operation of microservices.
5.2.2. Experiments
We utilized the Nodejs-Restful-Microservices application to generate the user traffic for the experiments. The response time was selected as the metric for evaluation because it accurately reflects the user experience, as highlighted by Menasce [
32]. The parameters employed in our investigations are presented in
Table 2.
Apache Jmeter (
https://jmeter.apache.org/ (accessed on 24 October 2023)) was utilized to generate 1200
HTTP POST requests directed at the “add user” operation and 1200
HTTP GET requests directed at the “get user” operation, both with the longest critical paths.
We considered three evaluation scenarios when carrying out our experiments. First, the evaluation of the application was performed without the use of any instrumentation. In this particular scenario, the microservices were deployed with their original
Node.js versions without any alterations, and the average response time was observed.
JMeter was employed for the purpose of generating the user load. In the second scenario, the application was instrumented using Open Telemetry (
https://opentelemetry.io/ (accessed on 4 November 2023)), and the average response time was also observed. In the third scenario, the application was deployed using the strategy proposed by Santana et al. [
23], and the average response time was also observed. In the final scenario using our technique, the instrumented
Docker images of
Node.js were deployed alongside the application, and the response times were also observed.
In order to evaluate the effectiveness of the Rbinder technique [
23], we implemented it in conjunction with our microservice application and proceeded to configure the different proxies accordingly. No system call activation was performed in our strategy; only the
Node.js Docker images were deployed alongside the application. The technique implemented did not necessitate changes to the application deployment procedure. One of the benefits of this approach is its ability to provide transparency in both the deployment and tracing processes. The analyses are characterized by transparency, as they can generate visual results without any involvement from the developer.
The process requires starting the LTTng tracer on every container to capture the application trace and then halting the tracer and automatically aggregating the traces. The microservices are then imported into the TC platform, where an analysis is executed and a visualization depicting the interactions among these microservices is generated.
5.3. Discussion
The outcomes of the experiments depicted in
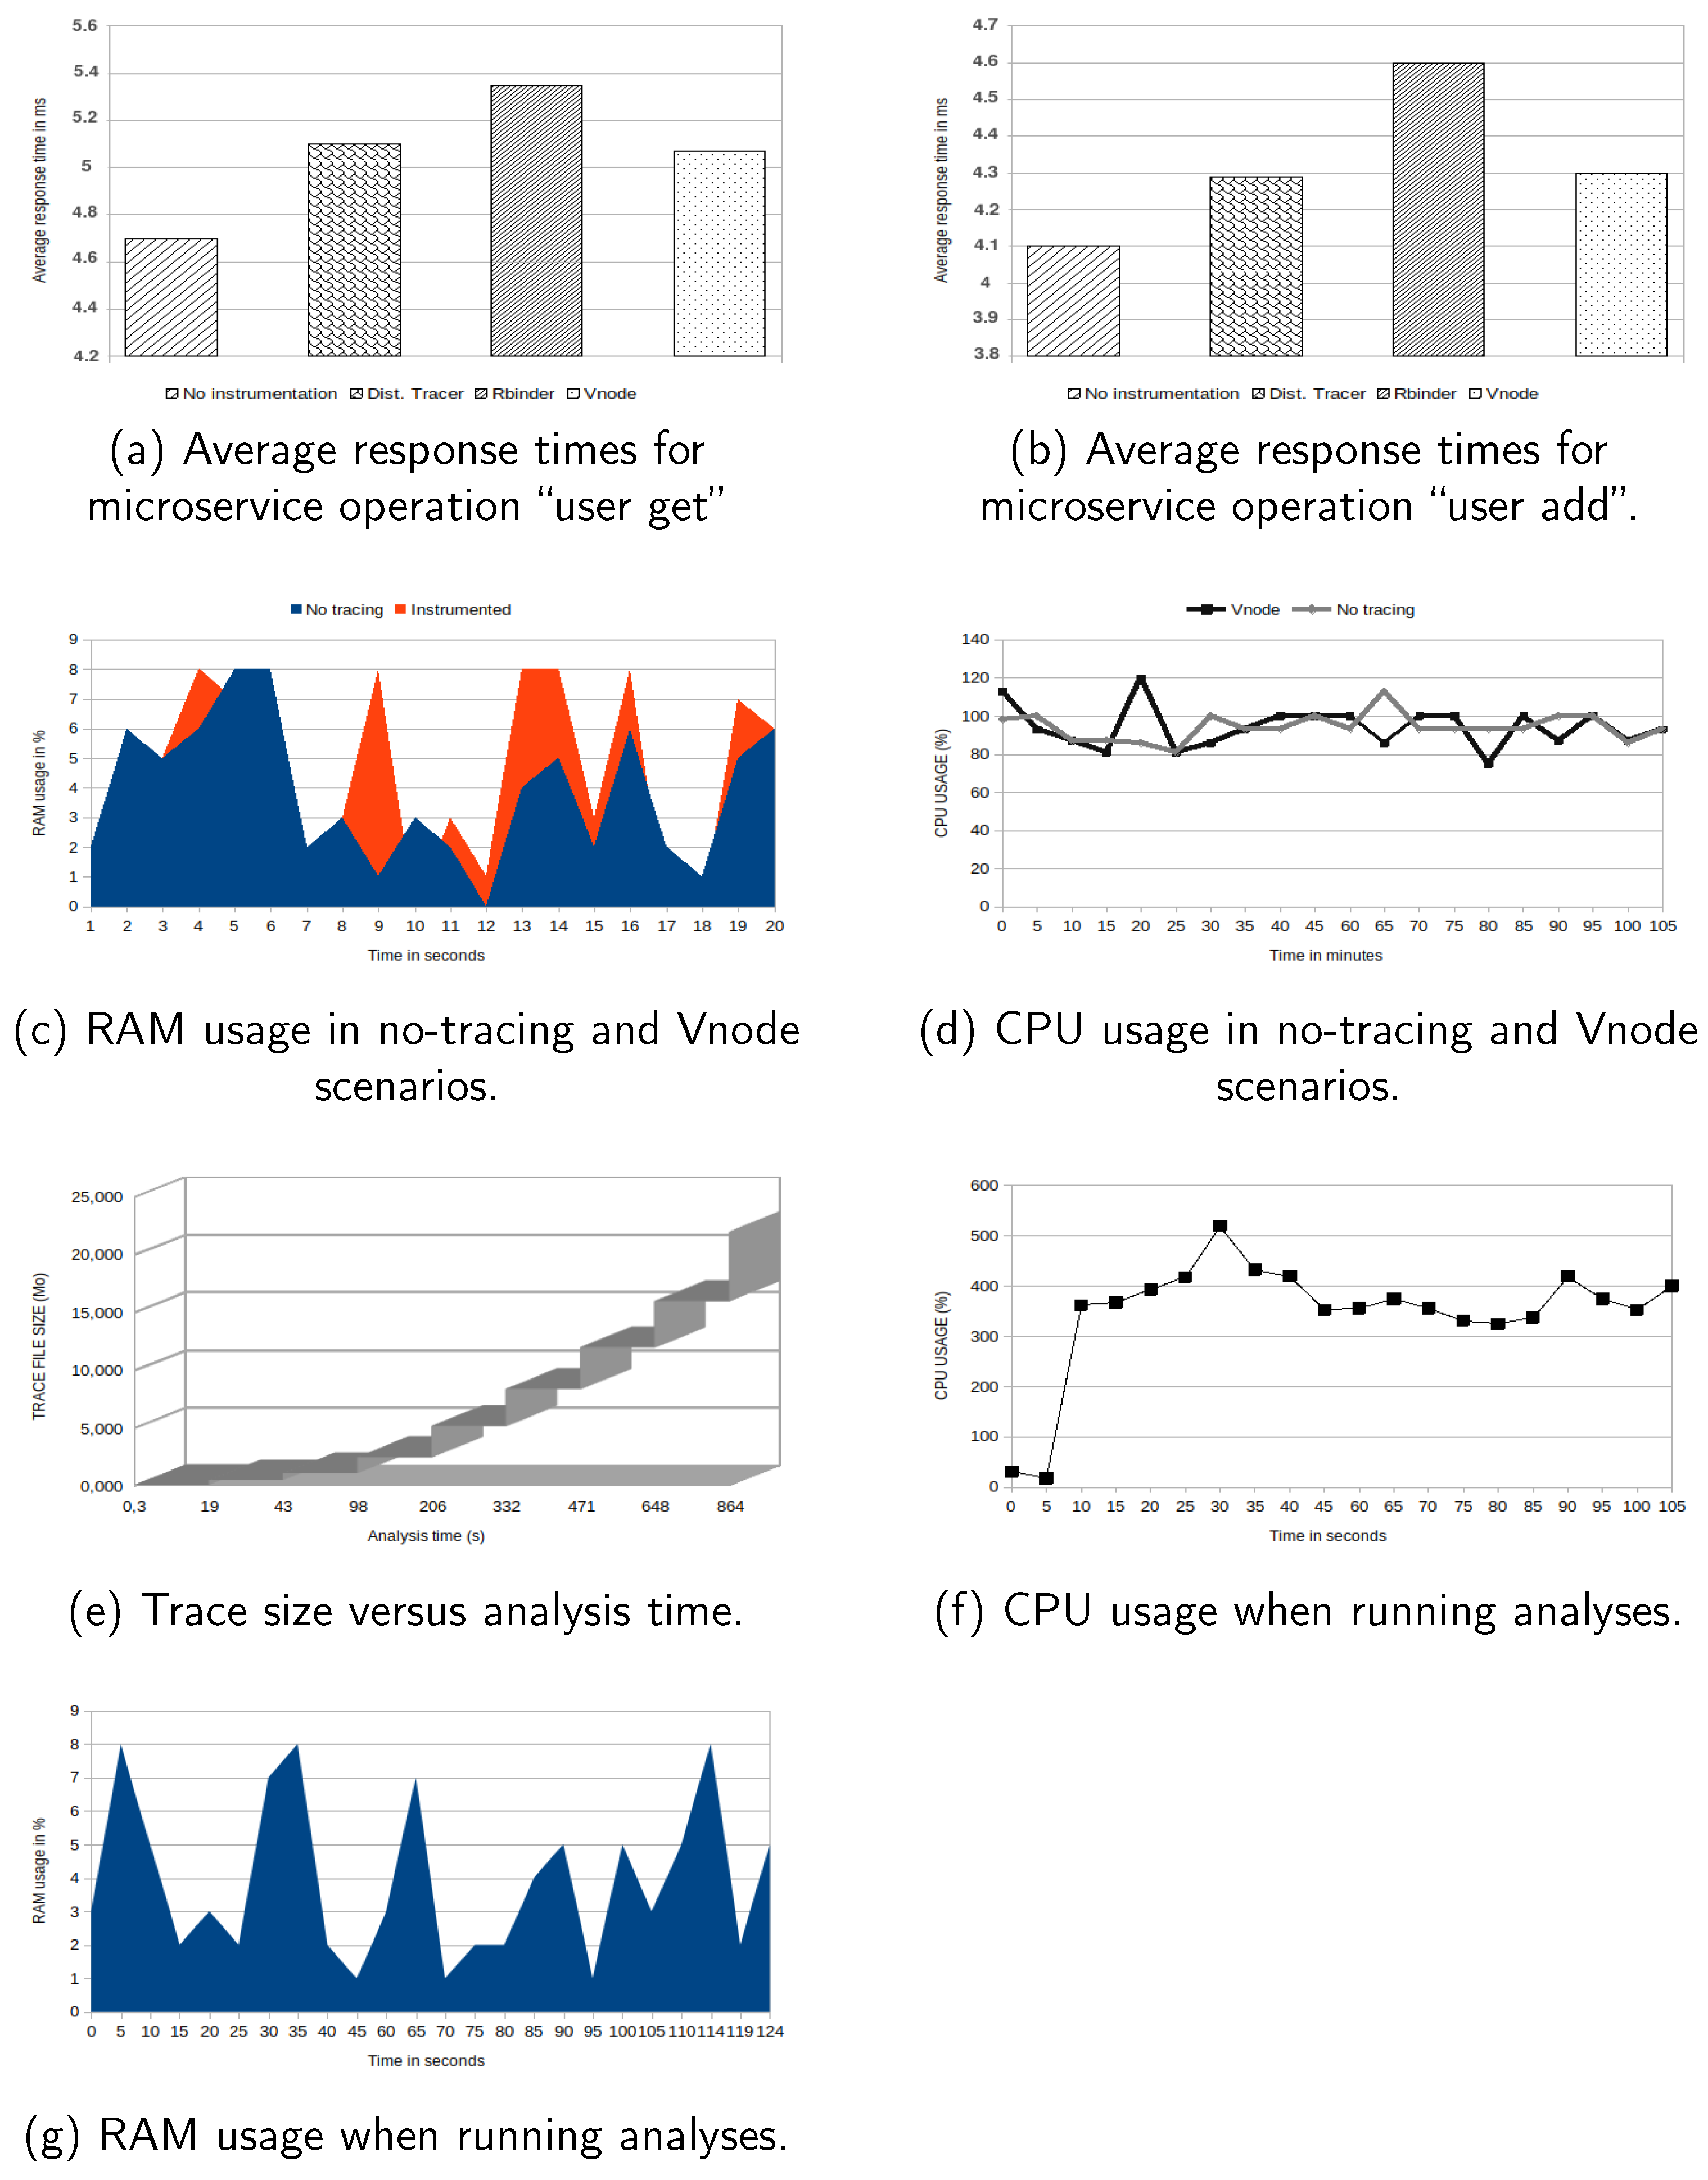
Figure 11a show that the response times of the application executed using our method incurred a low overhead on the system compared to the uninstrumented application. The average response time for the “get user” operation was
ms (standard deviation: 1.33) when no instrumentation was conducted, 5.1 ms (standard deviation: 1.18) when distributed tracing was employed, 5.35 ms (standard deviation: 1.05) when the Rbinder strategy was employed, and 5.07 ms (standard deviation: 1.23), when our strategy (Vnode) was employed.
In the second scenario, experiments were conducted by initiating
POST requests for the “user add” operation. The obtained response times are depicted in
Figure 11b. It is clear that the supplementary cost associated with tracing, on average, was consistently of a comparable magnitude, similar to the preceding scenario. The mean response time for the untraced program was
ms (standard deviation: 1.33),
ms (standard deviation:
) when using distributed tracing,
ms (standard deviation:
) when using Rbinder, and
ms with Vnode. An examination of the overhead resulting from tracing using our approach reveals that it is comparable to state-of-the-art approaches, incurring only a 5% cost on the traced system.
Figure 11c illustrates the central processing unit (CPU) utilization in the scenario when the application was executed without any tracing. Comparing the aforementioned data with those in
Figure 11d, which illustrates the CPU utilization while employing our proposed methodology, a slight increase in resource use was observed.
Given that the execution time of the analyses required to build the model is strongly dependent on the number of events contained in the trace, it is important to measure the time required on various trace file sizes.
Figure 11e,f, respectively, depict the CPU utilization and time to run the analysis according to the trace sizes. For different sizes of the trace, the needed time is presented. The experiments show that our technique is optimized to run with very good times. This is due to the nature of the data structure (SHT) used, enabling access in logarithmic time.
The LTTng tracer had a minimal impact on the system, as the activation of a tracing point incurred a nanosecond-level overhead. LTTng is the fastest software tracer available [
30]. The evaluation of the collection and analysis infrastructure using our approach demonstrates all the advantages it offers. Firstly, the induced overhead was relatively low on the system in terms of CPU and memory usage. In the first case, this can be justified by the tracer used and the optimization of the inserted tracepoints. In the second case, memory usage was not significantly impacted despite the size of the trace files, which can contain millions and billions of events, simply because the data structure constructed was disk-based. It depends primarily on disk write speed, especially during model construction.
In the case of distributed tracing, the tracing overhead is acceptable, but using this strategy requires an understanding of the application’s source code for instrumentation. This involves additional human costs and alters the application’s behavior. To spare developers from these instrumentation efforts, an approach based on a “proxy envoy”, called Rbinder, has been proposed. However, while it offers the advantage of transparently tracing the application, it still requires developers to invest significant time in setting up the collection’s infrastructure, especially in configuring the proxies. In contrast to these approaches, our approach enables transparent tracing without any developer intervention. Developers are not required to establish the collection’s infrastructure. Only the images of Node.js containers are replaced with instrumented images and deployed seamlessly, without modifying the development pipeline procedures.
6. Conclusions
This work introduced a novel approach for tracing and performing performance debugging in Node.js microservice architectures. It stressed the importance of maintaining trace transparency to reduce the costs associated with instrumenting and deploying trace collection infrastructures. By adopting a tracing paradigm that relies on context reconstruction through Node.js virtual machine instrumentation, we developed a specific technique for correlating multi-layer metrics.
In this way, developers can avoid the burden imposed by the instrumentation phase. Furthermore, automated analysis is performed on the collected data to create a high-level model that can be queried through developed views, enabling a better understanding of system operations and the identification of performance bottlenecks.
The presented approach not only enables transparent tracing of microservices but also offers a framework for uncovering the operational architecture of microservices. Consequently, without delving into the intricacies of the application’s source code to comprehend component interactions, our technique can be utilized to visualize the complete communication architecture of microservices transparently. An intriguing possibility is to expand the collection architecture to support other communication protocols, such as WebSockets. Another potential avenue for further exploration involves conducting a thorough investigation into the root causes of performance issues that our approach facilitates pinpointing for the purpose of conducting root-cause analyses. The sources of the analyses, comprising the TC plugins can be accessed from the public repository
https://git.eclipse.org/r/q/owner:hervekabamba%2540gmail.com (accessed on 16 November 2023).


