Article

Edge-Computing-Based People-Counting System for Elevators Using MobileNet–Single-Stage Object Detection

Computer Science and Information Engineering, National Yunlin University of Science and Technology, Yunlin 640301, Taiwan
*
Author to whom correspondence should be addressed.
Future Internet 2023, 15(10), 337; https://doi.org/10.3390/fi15100337
Submission received: 30 August 2023 / Revised: 27 September 2023 / Accepted: 27 September 2023 / Published: 14 October 2023

Abstract

:
Existing elevator systems lack the ability to display the number of people waiting on each floor and inside the elevator. This causes an inconvenience as users cannot tell if they should wait or seek alternatives, leading to unnecessary time wastage. In this work, we adopted edge computing by running the MobileNet–Single-Stage Object Detection (SSD) algorithm on edge devices to recognize the number of people inside an elevator and waiting on each floor. To ensure the accuracy of people counting, we fine-tuned the SSD parameters, such as the recognition frequency and confidence thresholds, and utilized the line of interest (LOI) counting strategy for people counting. In our experiment, we deployed four NVIDIA Jetson Nano boards in a four-floor building as edge devices to count people when they entered specific areas. The counting results, such as the number of people waiting on each floor and inside the elevator, were provided to users through a web app. Our experimental results demonstrate that the proposed method achieved an average accuracy of 85% for people counting. Furthermore, when comparing it to sending all images back to a remote server for people counting, the execution time required for edge computing was shorter, without compromising the accuracy significantly.

1. Introduction

Elevators are essential in tall buildings, as they allow people to move quickly between floors and significantly reduce travel time. In order to improve elevator efficiency, many researchers, such as Atsuya Fujino et al. [1] and Aljoša Vodopija et al. [2], have focused on solving elevator scheduling problems. Although good elevator scheduling can reduce waiting times, there is still room for improving the user experience. For example, existing elevator systems lack the ability to display the number of people waiting on each floor and inside the elevator. This causes an inconvenience as users cannot tell if they should wait or seek alternatives, leading to unnecessary time wastage. Tomoki Yamauchi et al. [3] pointed out that not knowing the elevator occupancy in advance causes longer wait times for disabled individuals and those carrying large items. If users are aware of elevator occupancy, they can make better choices between using elevators or alternative ways to reach their destination, thereby reducing the waiting time. Therefore, having a real-time system for providing the numbers of people inside the elevator and waiting on each floor to those waiting for elevators is crucial.
The technology of people counting can be classified into two categories: sensor-based and image-based methods. For sensor-based methods, various sensors are used to count people. Zhaocheng Yang et al. [4] proposed the use of radar echoes to detect the movements of different individuals indoors and applied an activation index, connected regions, and energy of frames for calibration. They compared the accuracy of the probabilistic model and the convolutional neural network for counting people using radar echoes and found that the probabilistic model performed better than the convolutional neural network (CNN), especially when individuals were in a static state, with an accuracy of approximately 90%. However, in larger spaces, adopting this method may have a low accuracy due to sources of environmental interference, such as noise and weak signals. Masafumi Hashimoto et al. [5] employed radar for crowd tracking. They developed a background subtraction method to extract the positions of individuals. Similarly, Sylvia T. Kouyoumdjieva et al. [6] used various non-image methods for people flow detection, such as gas, radar, Wi-Fi, and Bluetooth. For these sensor-based methods, the major challenges and limitations are that the accuracy of people counting could be affected via environmental noise, signal strength, spatial layout, and so on.
Compared to sensor-based methods, image-based approaches offer advantages for people counting, as they are not constrained via spatial limitations and can capture all spatial information within a frame. However, when utilizing only image-based models with the region of interest (ROI) and line of interest (LOI) methods, challenges may arise when dealing with stationary individuals or overlapping targets. The system might encounter difficulties with accurately distinguishing individuals when targets are stationary or overlapping with others, leading to a decline in the counting accuracy. In such scenarios, where targets exhibit little or no apparent motion or separation, the boundaries of the individuals in the image may become unclear, introducing disturbances and errors into the counting process. Furthermore, to date, there have been no studies combining the LOI and ROI methods for people counting. LOI is commonly used to detect whether targets pass through a virtual line, while ROI is employed to mark regions of interest. Combining these two methods could potentially enhance the accuracy of people flow counting, but there is currently a lack of corresponding research and methodologies to achieve this integration. As such, further exploration and the development of a combined LOI and ROI approach are warranted to address the challenges posed by stationary individuals and overlapping targets and to improve the precision and reliability of people counting in image-based methods.

Our Contributions

We propose an indoor elevator people flow counting system based on an image analysis. The system leverages image data to perform real-time tracking of the number of individuals inside the elevator and those waiting for the elevator in the building. The acquired data are subsequently transmitted to a central server and presented on a large display screen, providing an overview of the people flow information to all occupants of the building. The system features a mobile interface that allows users to interact with the system by scanning a QR (quick response) code, granting access to real-time updates on the current elevator waiting status and the count of occupants inside the elevator. The displayed numerical values are intelligently color-coded (green, yellow, and red) to denote varying crowd density levels, thereby assisting users in making informed decisions regarding their elevator usage.
Edge computing has emerged as a promising solution to the limitations of traditional cloud computing. Keyan Cao et al. [7] emphasized its benefits, including its reduced bandwidth usage, faster response times, enhanced security, and improved privacy protection. Yaser Magalhães et al. [8] demonstrated edge computing’s practical advantages through an annotated visual dataset for real-time tomato detection, highlighting its potential to enhance automation and precision. Therefore, in the application of elevator waiting people counting, edge computing can minimize the latency when counting individuals waiting for elevators. Furthermore, it conserves the streaming bandwidth by transmitting only essential information, which not only reduces costs but also optimizes the efficiency of data communication within our system.
In this work, we utilize MobileNet V3 for image recognition and single-stage object detection (SSD). MobileNet V3 combines depthwise separable convolutions from V1 and linear bottlenecks from V2, enhancing the accuracy with the Hard Swish activation function. The COCO dataset is used for “person” object recognition. SSD offers faster processing than the Faster RCNN by applying YOLO’s concept for classification and bounding box regression. MobileNet V3 generates candidate regions for SSD detection. The centroid tracker algorithm tracks targets by predicting their positions. Counting is based on target centroids crossing the LOI. This method reduces the counting errors during occlusion and ensures efficient counting when targets enter the waiting area.
In order to verify the accuracy of the system’s counting method, we designed various scenarios with different elevator queue formations and positions of individuals inside the elevator, including configurations with three, five, and eight people. The elevator queue formations consisted of horizontal, vertical, diagonal, and criss-cross patterns, while the positions inside the elevator included non-overlapping and overlapping arrangements. Additionally, we considered scenarios involving pedestrian movements in corridors, such as walking in the same direction and encountering pedestrian crossings. The cameras were positioned on the walls near the elevator doors at a 45-degree angle to capture the waiting crowd and the individuals inside the elevator simultaneously. The test subjects’ heights ranged from 170 to 180 cm, and the counting of individuals waiting for the elevator and inside the elevator was performed using the LOI approach. Furthermore, we conducted tests on both the Nvidia Jetson Nano Developer Kit embedded development board and a computer host using the same counting system. Regardless of whether it was run on the host computer or the embedded development board, our counting method achieved an average accuracy of 85% when counting the people flow.
The rest of this paper is organized as follows: Section 2 explores the relevant literature on people-counting methods using the ROI and LOI. Section 3 explains the design requirements and challenges. Section 4 elaborates on the people-counting method and the system interface used in this system. Section 5 shows the accuracy of the people-counting system. Finally, Section 6 concludes this work and discusses future work.

2. Related Work

Pedestrian flow detection methods can be primarily categorized into image-based and non-image-based approaches. Non-image-related studies include sensors, wireless radio frequency, networks, sound waves, and other methods used to count the number of people in a given area. However, these methods often encounter limitations in terms of spatial coverage and are more prone to counting errors when dealing with dense pedestrian flows. Therefore, this study adopts an image-based approach for pedestrian flow counting. On the one hand, image-based methods offer larger spatial coverage compared to non-image-based methods, and, on the other hand, they generally provide a more reliable counting accuracy. In the following subsections, three main categories of image-based pedestrian flow counting methods are discussed, including ROI images, LOI images, and high-density crowd counting. Relevant literature on these three aspects of image-based counting methods is explored.

2.1. People Counting Using the ROI

This research employed surveillance cameras or cameras installed in corridors and doorways at angles of 45 or 90 degrees relative to the ground to count the number of people passing through the current scene. Xiao Li et al. [9] detected the behavioral characteristics of crowds using anomaly detection and trained a CNN on collected behavioral feature datasets. In this study, the first step involved the collection and annotation of pedestrian detection training sets for training on the CNN. Then, the algorithm based on object extraction was used to locate the X and Y coordinates of individuals in each frame image. Simultaneously, the target object’s positioning in the previous or subsequent frame image was considered. Compared to conventional CNN-based detection of image positions, this approach can instantly capture the locations of target objects in the image. However, the limited variety of training data used in this study may have resulted in a decreased accuracy when recognizing large and diverse datasets, which does not meet the authors’ expectations. Min Li et al. [10] proposed a people-counting method for regions using the mosaic image difference (MID) and histograms of oriented gradients (HOGs) based on the head–shoulder detection algorithm. First, MID was used to extract the foreground from the active area and the target image. Then, the head–shoulder detection model was employed to detect the shapes and numbers of heads and shoulders in the foreground-extracted region, which served as the basis for people counting. This method is suitable for both static and dynamic conditions and focuses on a specific region of interest in the image. However, its performance under occlusion is not well described, and its effectiveness when dealing with head-obscured situations remains unclear. Naufal Akbar et al. [11] utilized the Faster R-CNN and ResNET50 for people counting in surveillance footage, achieving an accuracy of 97.20%. The authors trained on 900 images of 640 × 480 resolution with 300 images used for testing. The training set was used to train the Faster R-CNN, and the obtained weights were added to the target Faster R-CNN model to count people in the surveillance footage. The major drawback of this study is the limited size of the training set, which raises questions about its generalizability to different scenarios. Irshad Ali et al. [12] aimed to address the inaccuracies in traditional pedestrian-counting methods caused by overlapping individuals. This research combined person detection and tracking, where the detected target objects in each frame were tracked and erroneous tracking targets (e.g., persons’ shadows, etc.) were eliminated. On the other hand, Nam Trung Pham et al. [13] used a two-step object tracking approach to reduce the instances of object detection failure and detection errors. In the first step, all possible target objects were tracked, and in the second step, a trained deep learning model was used to select and highlight the desired target objects from the candidates.

2.2. People Counting Using the LOI

Unlike ROI counting, LOI counting involves drawing a virtual line in the image, and counting is only performed when individuals in the image pass through the line. The LOI counting method pays special attention to the movement directions of people. Therefore, in related research, different algorithms have been designed for counting people’s flow in and out, left and right, and front and back with respect to the LOI. Manh Cuong Le et al. [14] proposed a methodology comprising two consecutive stages. Firstly, a detection task is executed to identify individuals within the current frame, with the MobileNetv2-SSD deep learning architecture employed for detection purposes. Subsequently, if any individuals are detected, the tracking phase, founded on visual tracking techniques, is initiated to monitor the positions of individuals. Zheng Ma et al. [15] placed lines in the areas of interest in the image. They converted the image into individual frames, and counting was triggered when people in the image crossed the line segment. In comparison with previous methods that treated target objects as “points”, this approach avoids misjudgments caused by overlapping points when multiple people walk together, which would otherwise be considered as one large point, leading to errors in the system’s determination. Sung In Cho et al. [16] proposed a people-counting system that is applicable to department stores. They utilized three methods: (1) foreground extraction for each frame image, (2) a dilated motion search using the maximum a posteriori probability (MAP), and (3) a flow analysis using multiple touching sections (MTSs). The system first applies the line-wise average path length (APL) for foreground extraction, employs the MAP for a dilated motion search to locate the target regions on the line, and then analyzes the foreground to generate a fluctuation graph based on the MTSs. With the estimation of the motion and flow analysis, the number of people entering and exiting the store can be determined. The hardware implementation of this system utilizes wireless transmission-capable microcomputers with easy-to-install software. The experiment results show that this system achieves a high accuracy while maintaining a low computational complexity, as the computational complexity is reduced using MTS and MAP. Javier Barandiaran et al. [17] used cameras placed at high angles to count the number of people entering and exiting the target area. The wireless surveillance cameras recorded with a focal length of 3.5 mm and a resolution of 352 × 288. The study discusses the relationship between different LOI widths and lengths in the counting algorithm and the counting accuracy.

2.3. Counting High-Density Crowd

Both the ROI and LOI counting methods encounter a common issue—significant occlusion—when the crowd density is high, leading to a substantial increase in the likelihood of undercounting or overcounting. Therefore, it becomes crucial to use neural networks to collect images with a higher crowd density and extract their key features to determine the number of individuals in the images. We summarize the relevant studies from journals in Table 1 for further discussion. Weizhe Liu et al. [18] proposed a novel approach that entails the estimation of person flows between consecutive images and infers person densities from these flows instead of using direct regression. This approach enables us to impose significantly stronger constraints that encode the conservation of the number of individuals. Yongjie Wang et al. [19] proposed three parallel branch methods and dynamic weight adjustment. Initially, a ten-layer network was constructed using VGG-16, with each layer containing three parallel branches to capture information from different regions of the images and produce density maps. To ensure the quality of the final density map, the authors introduced learnable relative weights for the three density maps to merge them. The experimental phase involved testing on four datasets, namely ShanghaiTech, WorldExpo10, UCSD, and UCF_CC_50. Jingyu Chen et al. [20] utilized aerial drones to capture images of crowds to estimate the number of people in the current photography area. They trained the deep learning model Flounder-Net for aerial crowd density image processing and used a developed algorithm for counting. In the recognition process, the images underwent two rounds of convolution to obtain two sets of feature maps, each with six feature maps. Then, six convolutional layers were applied to the first three and the last three feature maps, resulting in feature labels from one to six. By continually conducting pairing comparisons, human features were derived from the images, leading to the final density map. Chuan Wang et al. [21] addressed the common issue of having insufficient training data in density-based people counting. Many approaches, like SIFT (scale-invariant feature transform), HOG, etc., involve the manual extraction of features to increase the amount of training data. However, these methods may yield unsatisfactory results when dealing with a higher crowd density or limited training samples. To tackle this, they proposed an end-to-end deep recurrent model for dense people counting. The approach begins with the CNN automatically learning crowd features. To mitigate influences such as occlusion by trees or buildings, the authors added relevant data and marked these images as the ground truth with zero counts. Using these "negative examples", the crowd density counting model was trained, yielding a better counting accuracy compared to previous methods. However, the feature-point-extraction-based counting method is only suitable for dynamic situations where people are in motion. As the related studies rely on ground truth points obtained from displacements of the target objects, the method may not apply to static scenarios like waiting for an elevator or attending concerts.
Our system utilizes MobileNet V3 for image recognition and single-stage object detection. This was developed by Liu, W et al. [22]. They used a single neural network for object detection. SSD simplifies training, offers a competitive accuracy level, and achieves faster inference compared to methods with additional proposal steps. Magalhães, S.A. et al. [23] further addressed the need for advanced perception in agricultural robots, focusing on tomato harvesting in greenhouses at various growth stages. They introduced a unique dataset of green and reddish tomatoes, enabling real-time detection for harvesting robots using edge artificial intelligence.

3. System Design Requirements and Challenges

This study employed cameras installed in corridors and elevator waiting areas to capture the number of people in the elevator waiting area and inside the elevator. The data from different floors were then aggregated, and the results were displayed on large screens on each floor. This system aims to assist users with route planning, enabling them to reach their destinations in the shortest possible time and minimizing the waiting time for elevators and congestion in crowded areas.

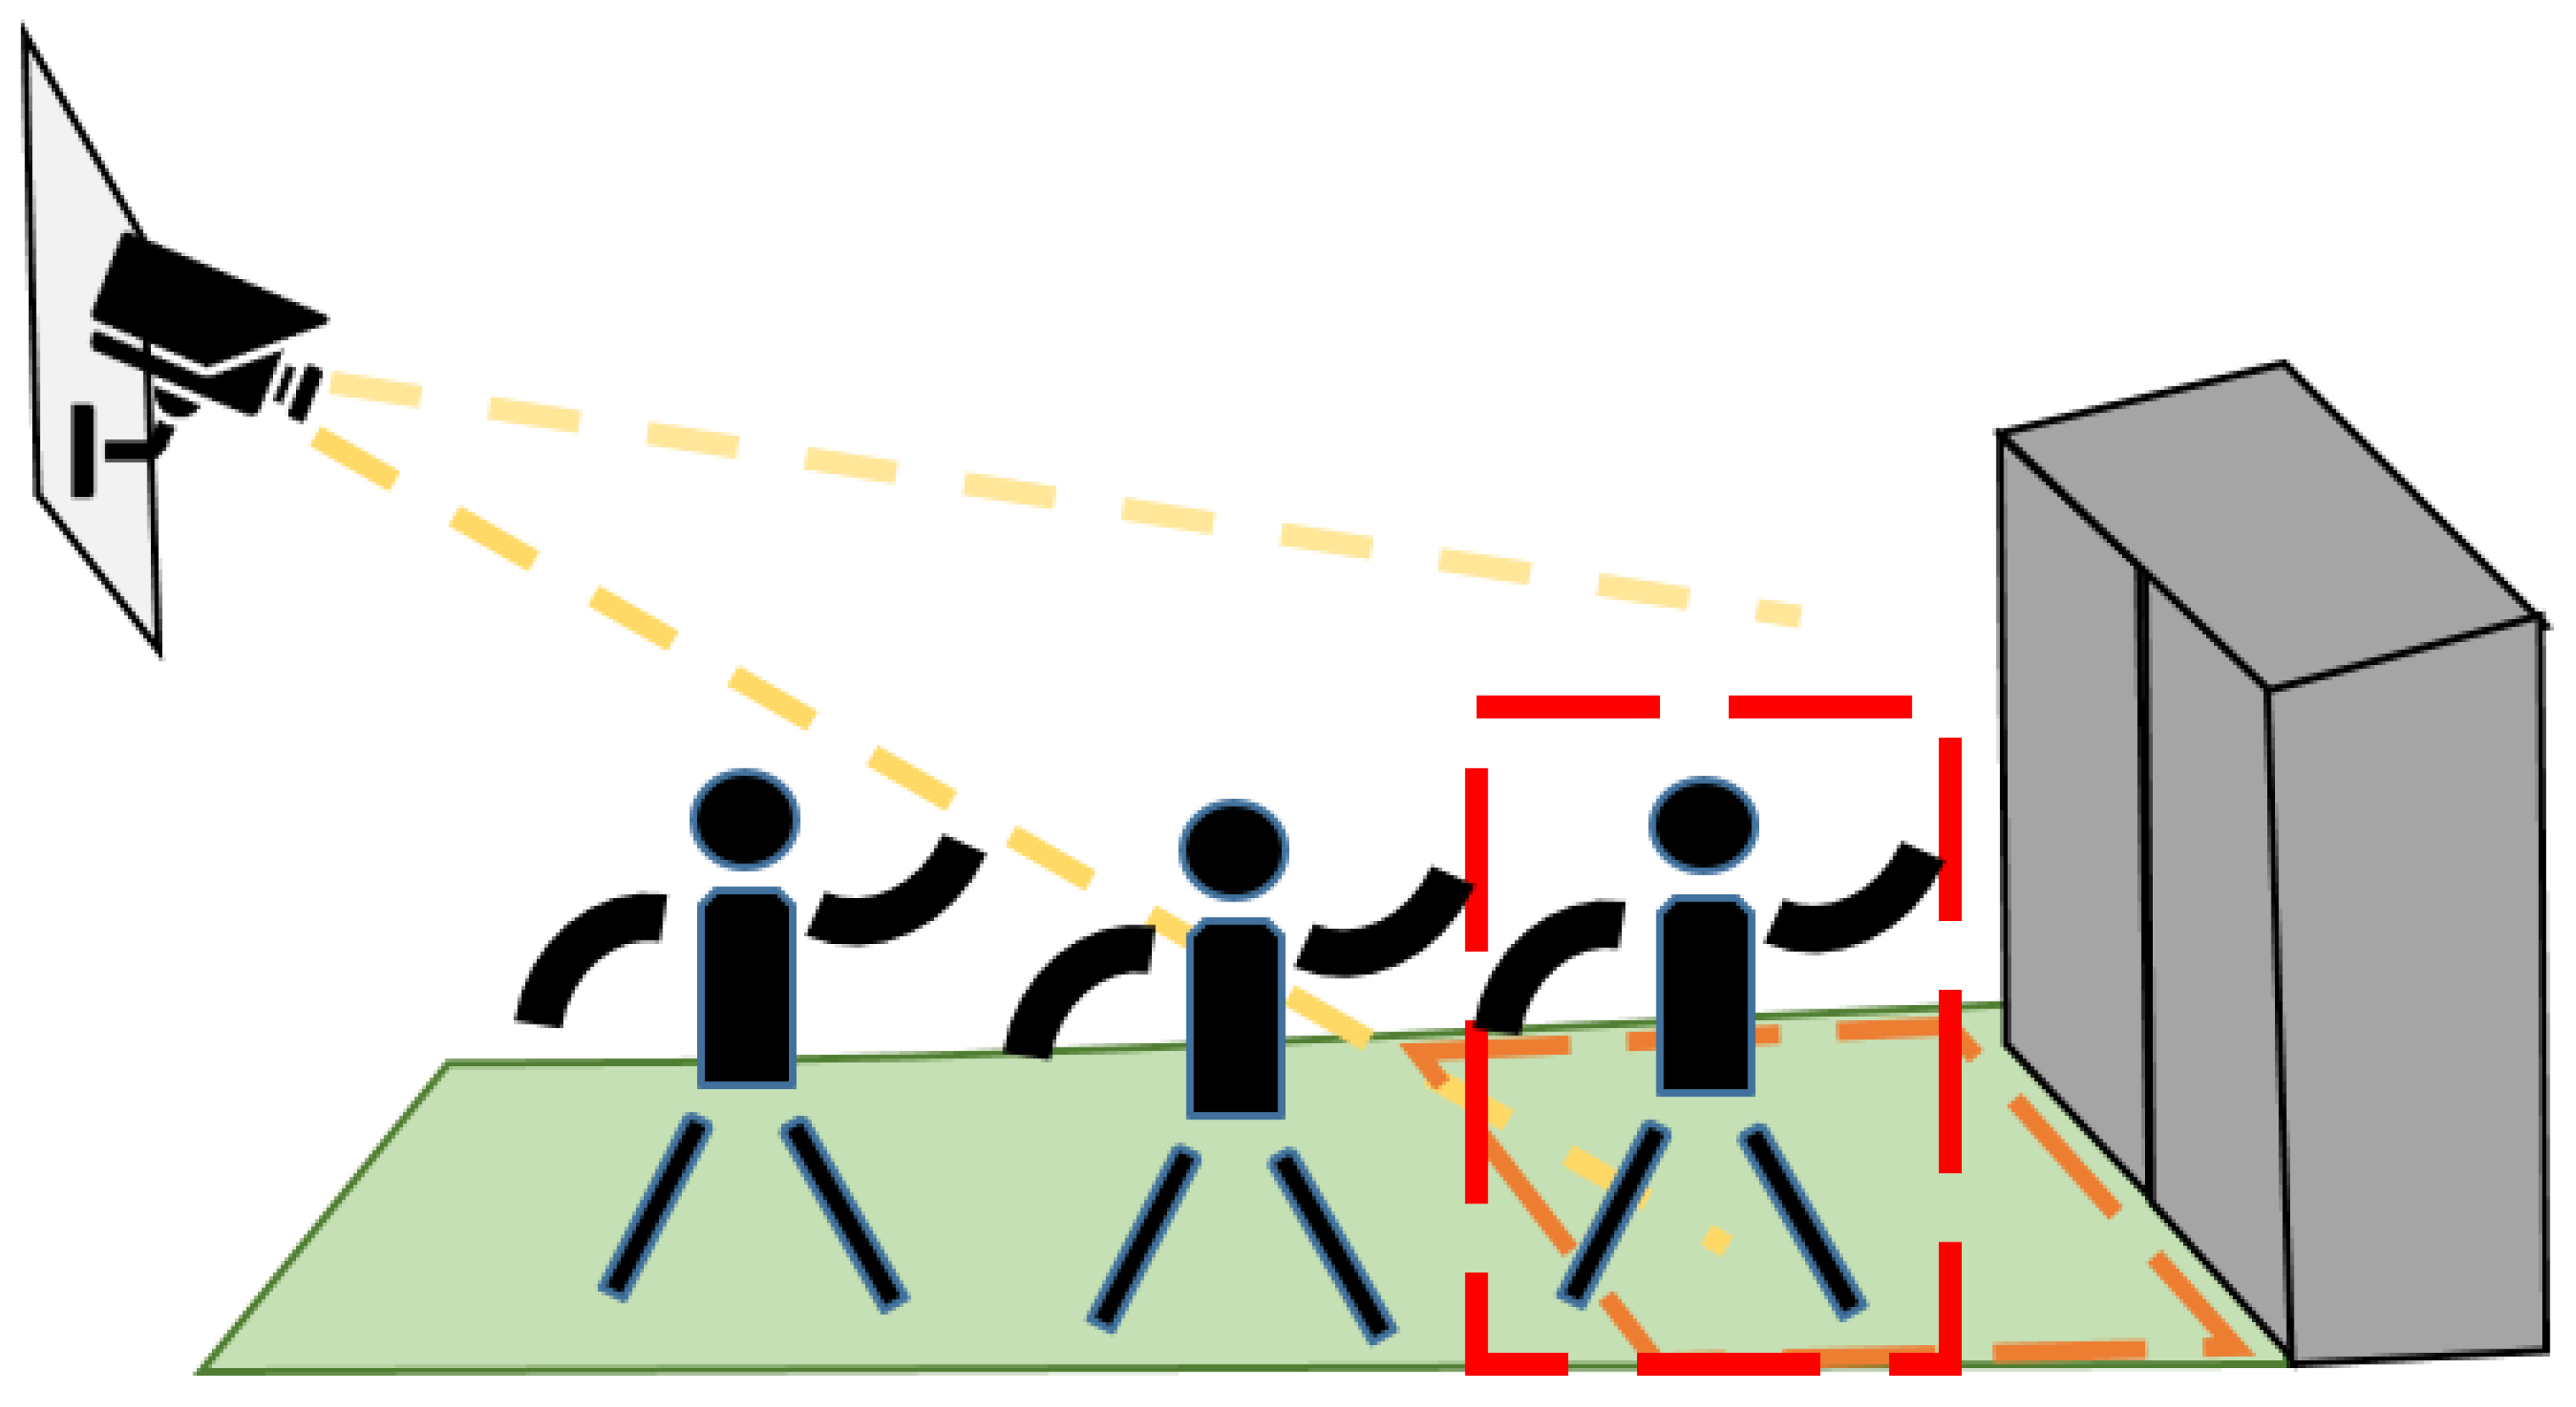
3.1. Recognizing the Elevator Hall Occupancy

Throughout the day, the numbers of people in different elevator waiting areas within a building vary, representing the future flow of people that each elevator needs to transport. Therefore, accurately capturing the pedestrian flow in each waiting area is crucial for elevator scheduling and to help users choose which elevator to wait for. Moreover, calculating the number of people in the waiting areas and presenting these data to prospective elevator users allows them to assess whether to proceed to wait for that elevator. However, in this problem, we face the challenge of determining which individuals are actual elevator users waiting for their rides, as the waiting areas may also be traversed by individuals who do not intend to use the elevator. Including all individuals in the area would result in a discrepancy between the number of people detected through image recognition and the actual number of elevator users, causing potential user misjudgment and hindering the effectiveness of assisting users to choose less crowded elevators.

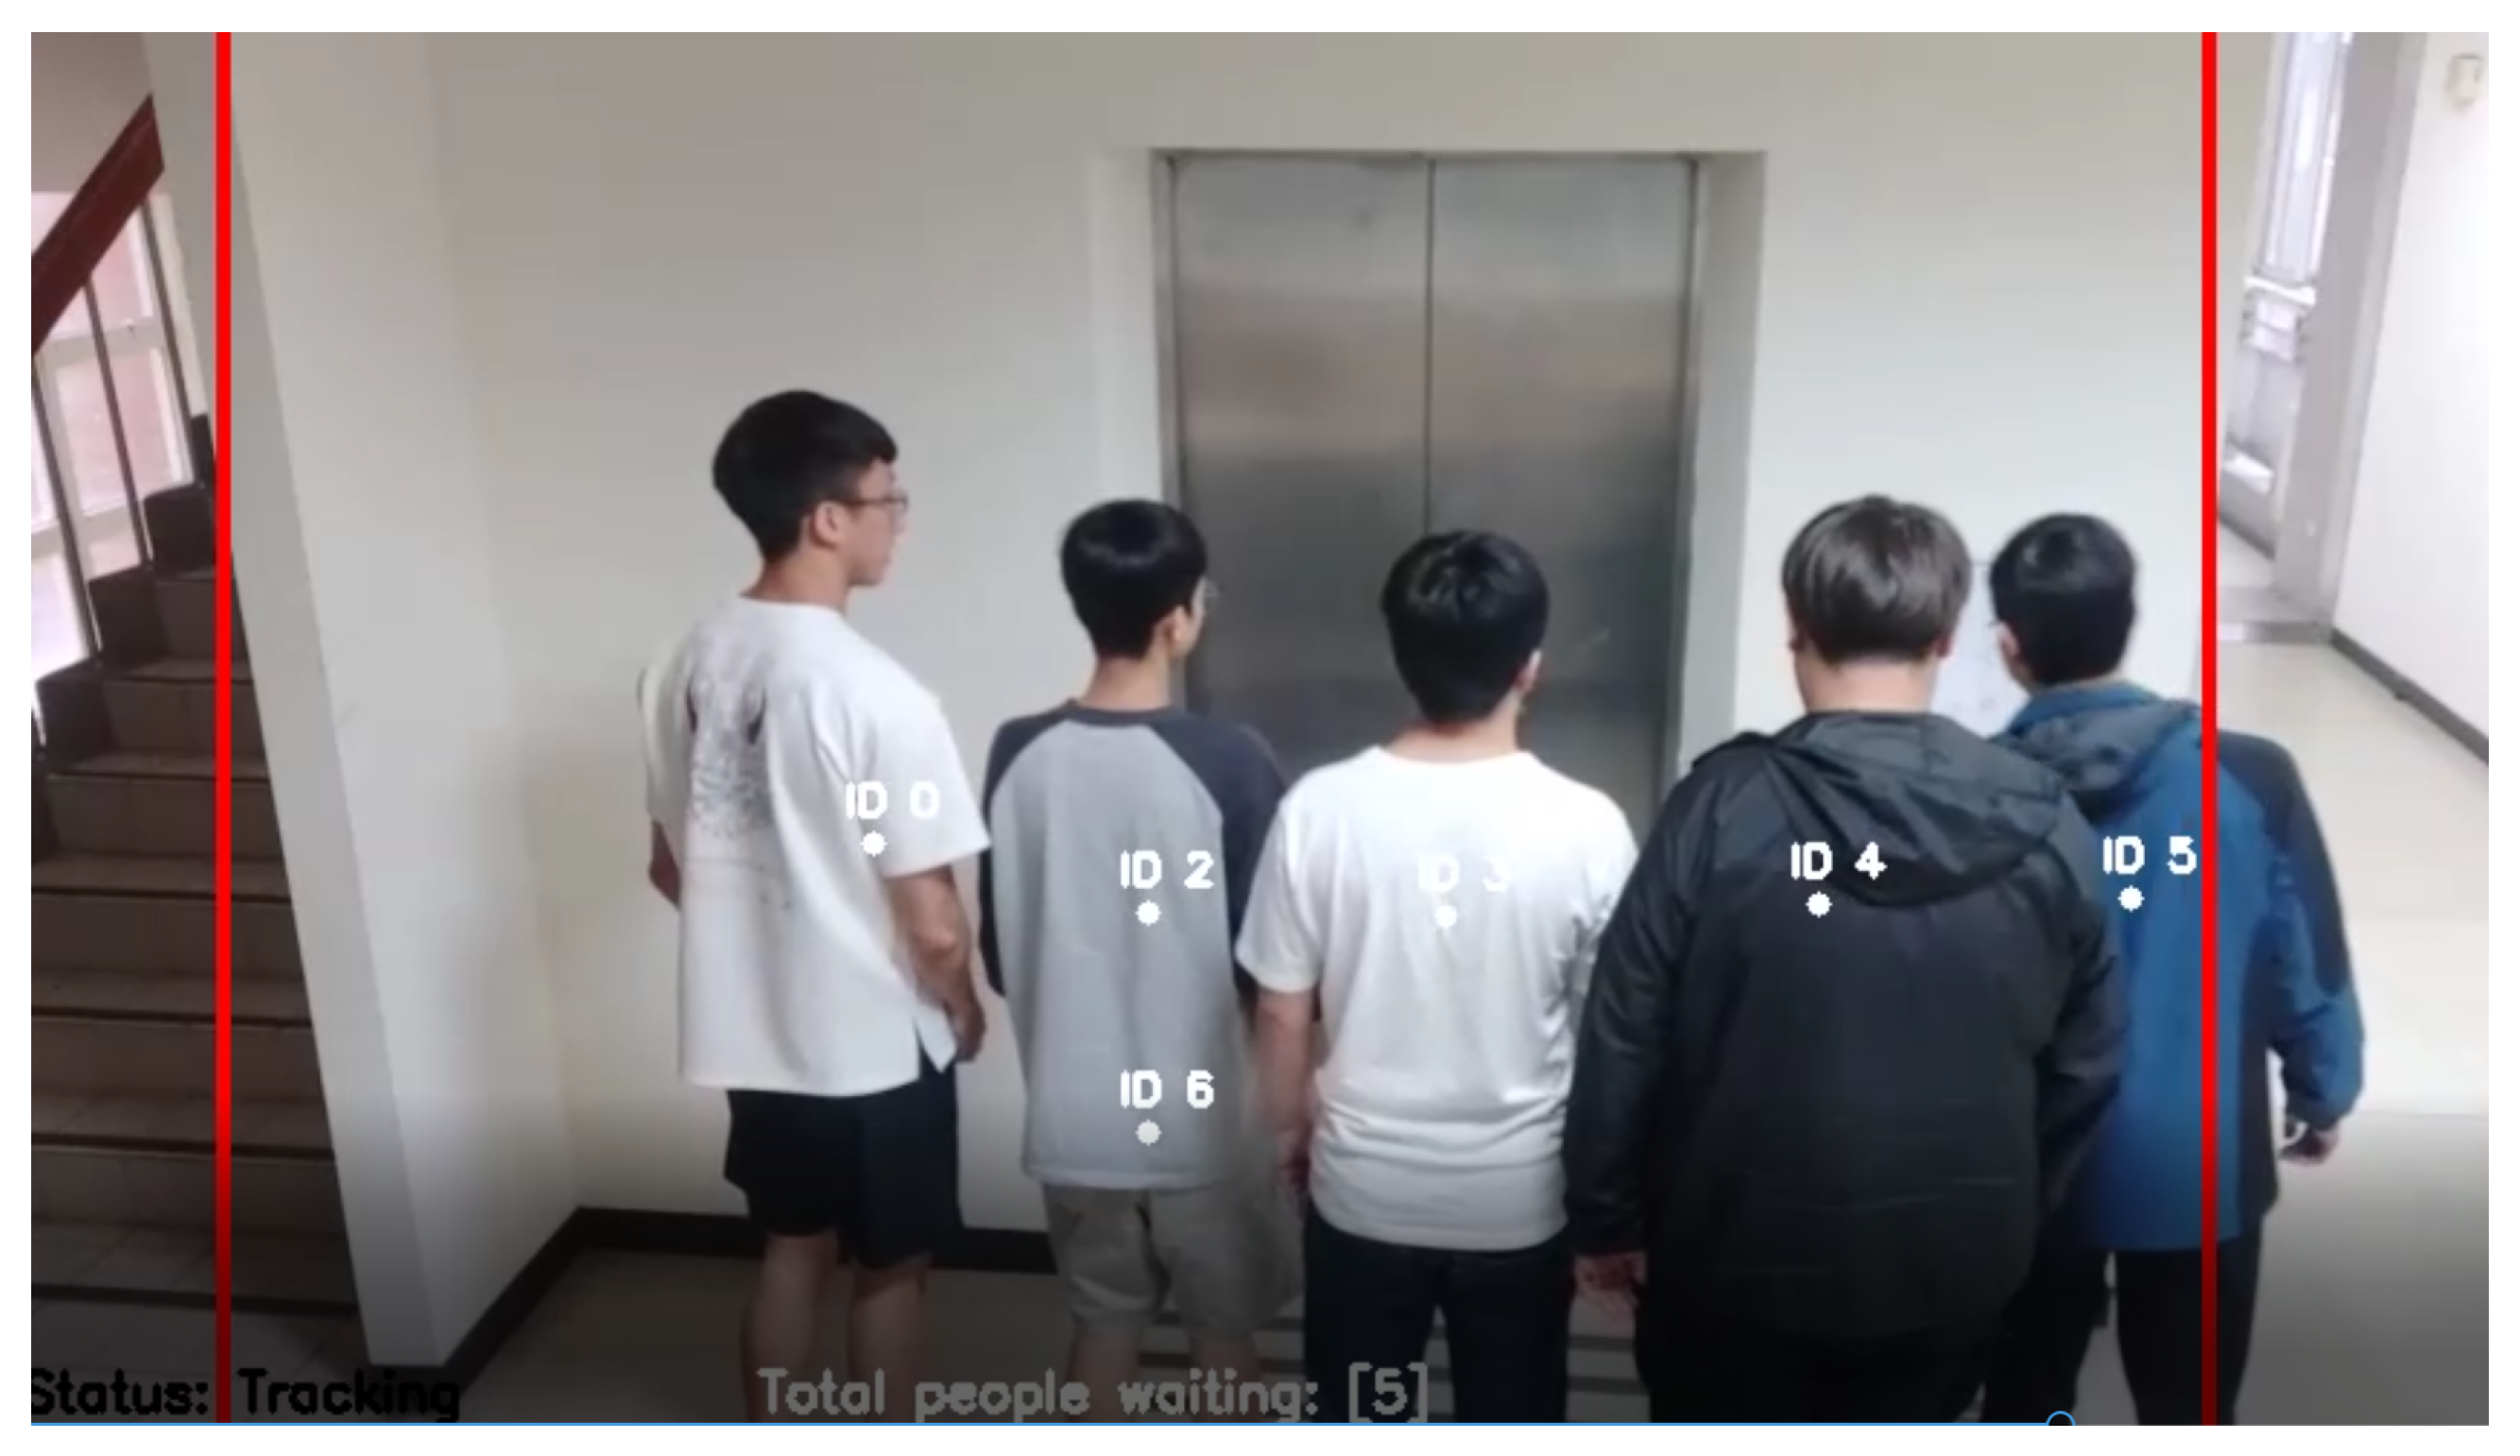
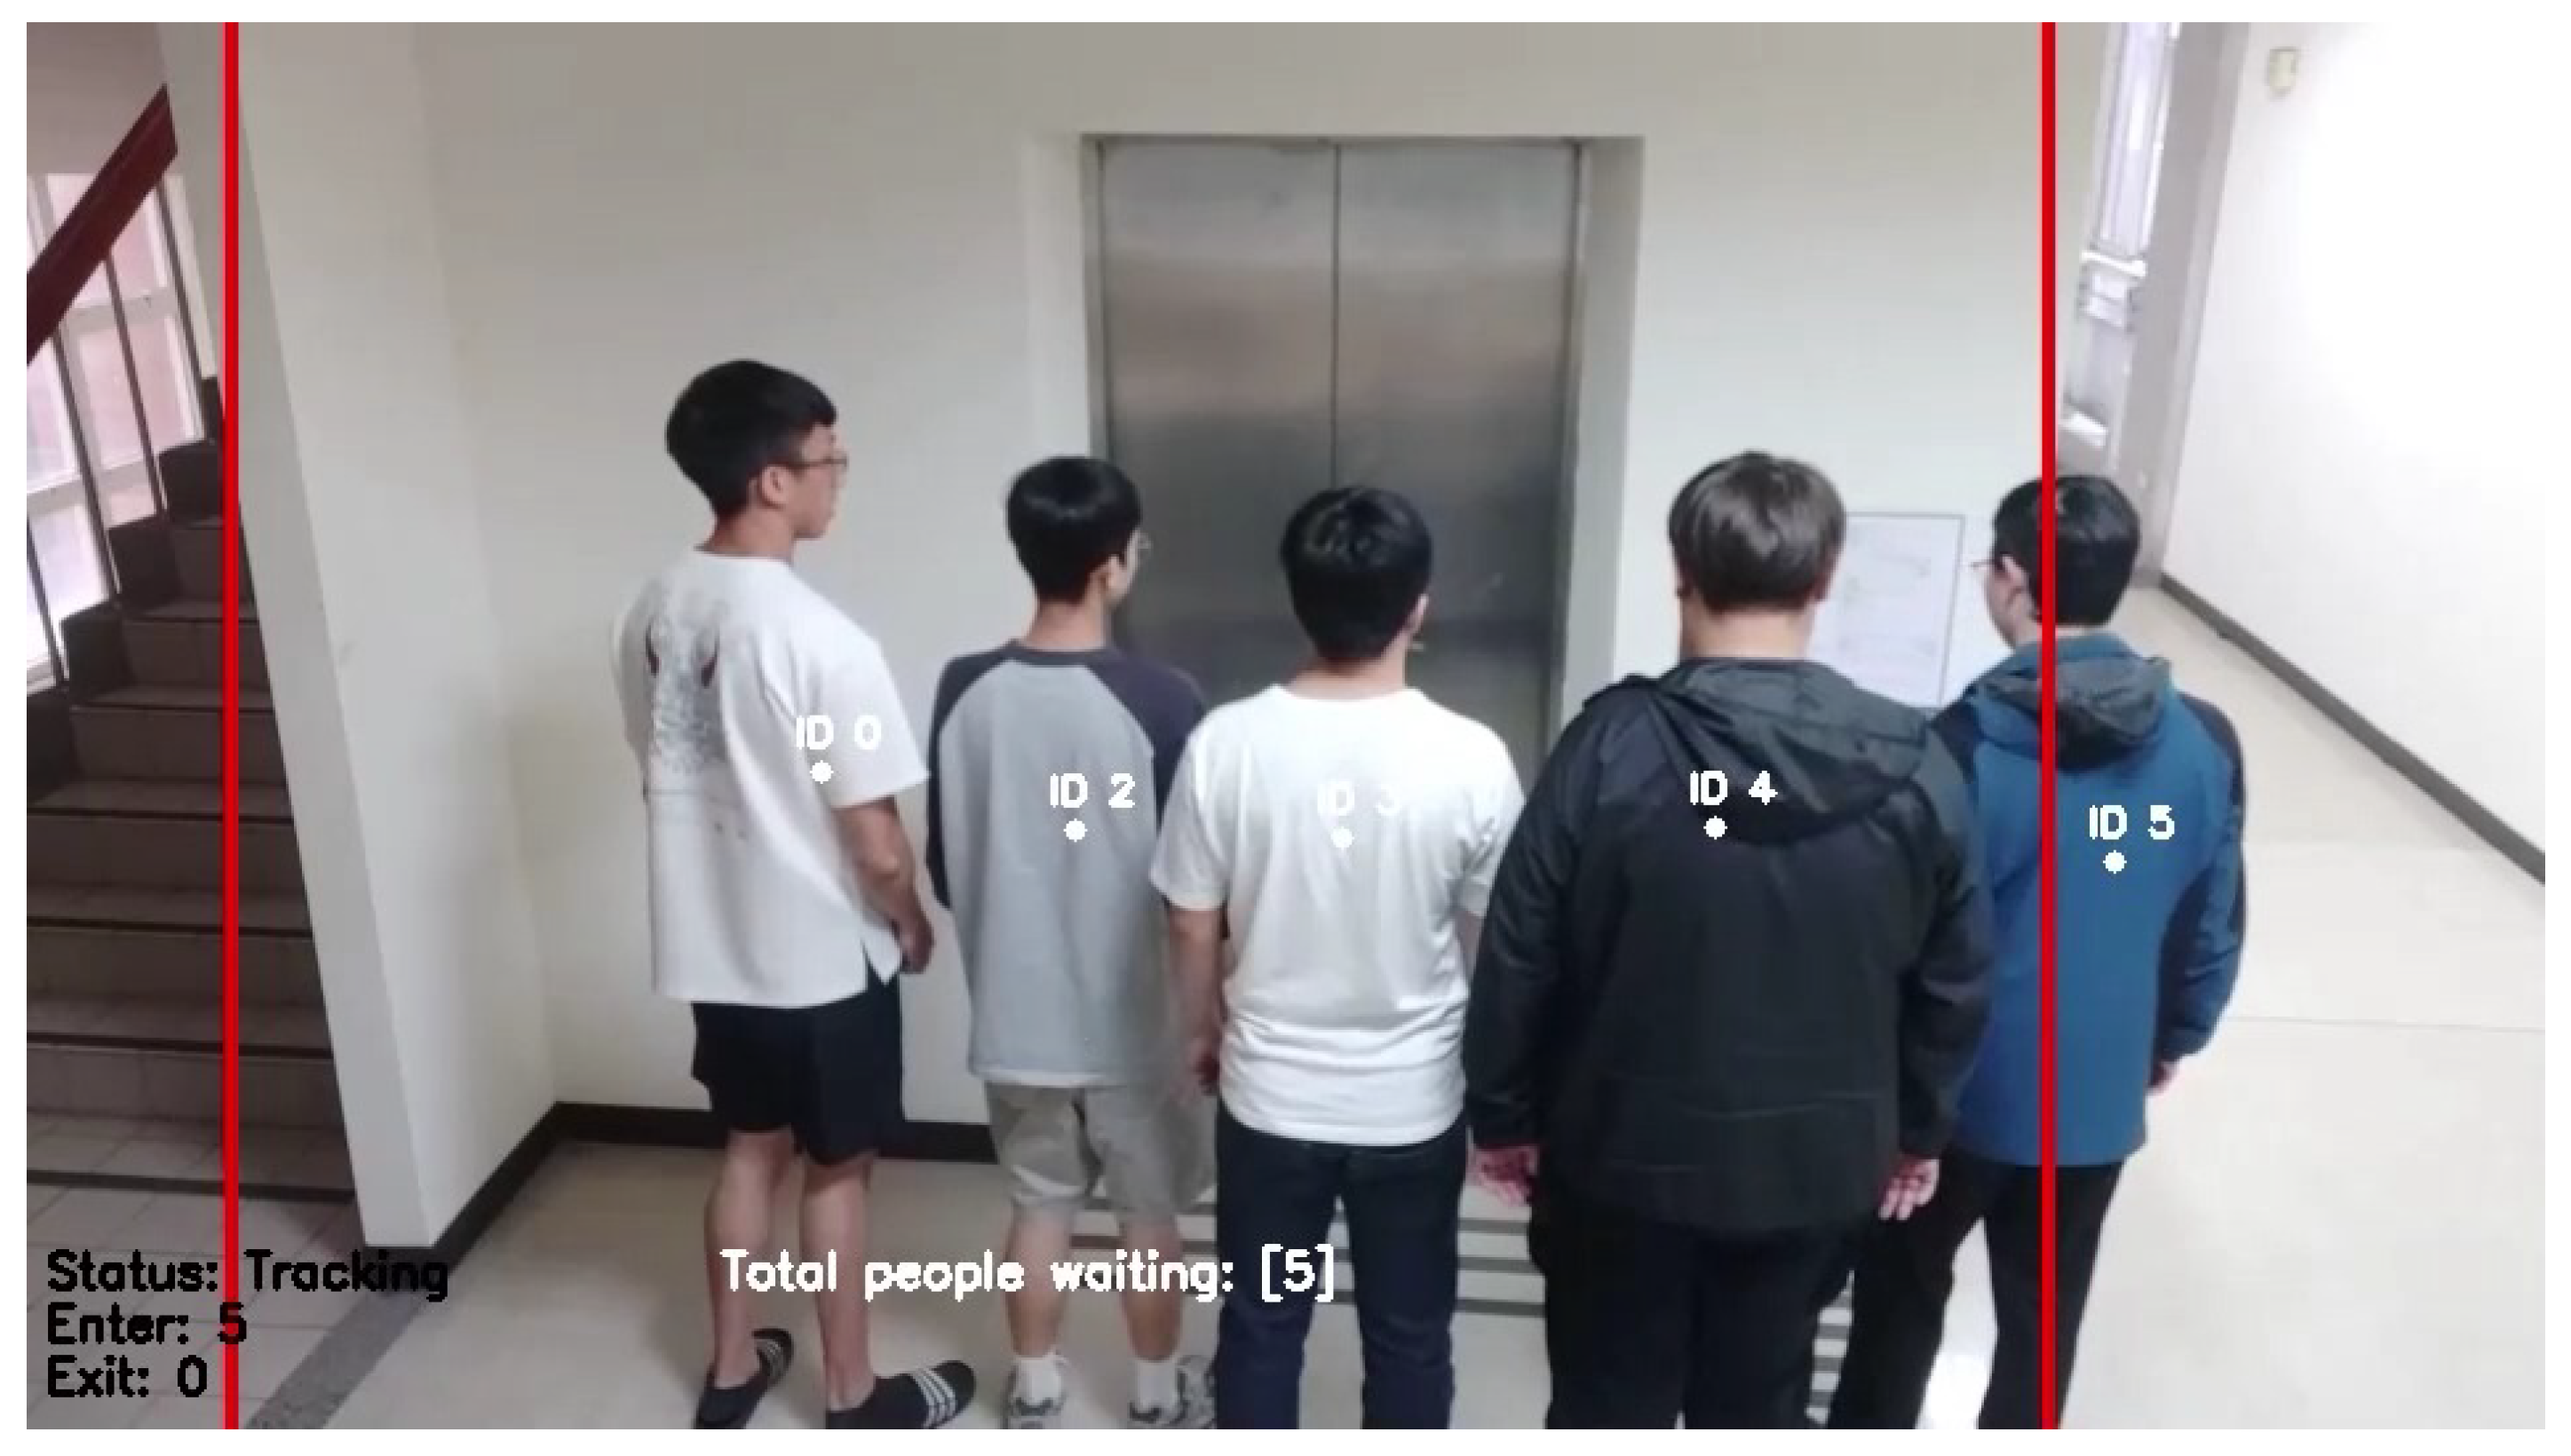
3.2. Counting Elevator Occupants

By installing cameras in the elevator waiting areas and capturing images from the external perspective toward the interior of the elevator, statistical information regarding the number of people waiting inside the elevator is obtained. The advantage of this people-counting method lies in the fact that it eliminates the need to install cameras inside each individual elevator to assess the passenger load. Instead, the information on the passenger count of each elevator is provided to users, allowing them to make informed decisions about whether to choose that particular elevator. However, this design also faces two challenges. Firstly, the issue of occlusion arises due to the camera’s top-down angled perspective of approximately forty-five degrees, which may result in people standing in the back row being obstructed by those in the front row, leading to inaccurate counting. Secondly, calculating the number of people both inside the elevator and in the elevator waiting area simultaneously presents the possibility of the elevator arriving at the waiting area without being able to accommodate all waiting passengers. Thus, distinguishing between the current number of people inside the elevator and those still waiting in the waiting area within the same frame is one of the problems that this study needed to address.

4. Elevator People-Counting System

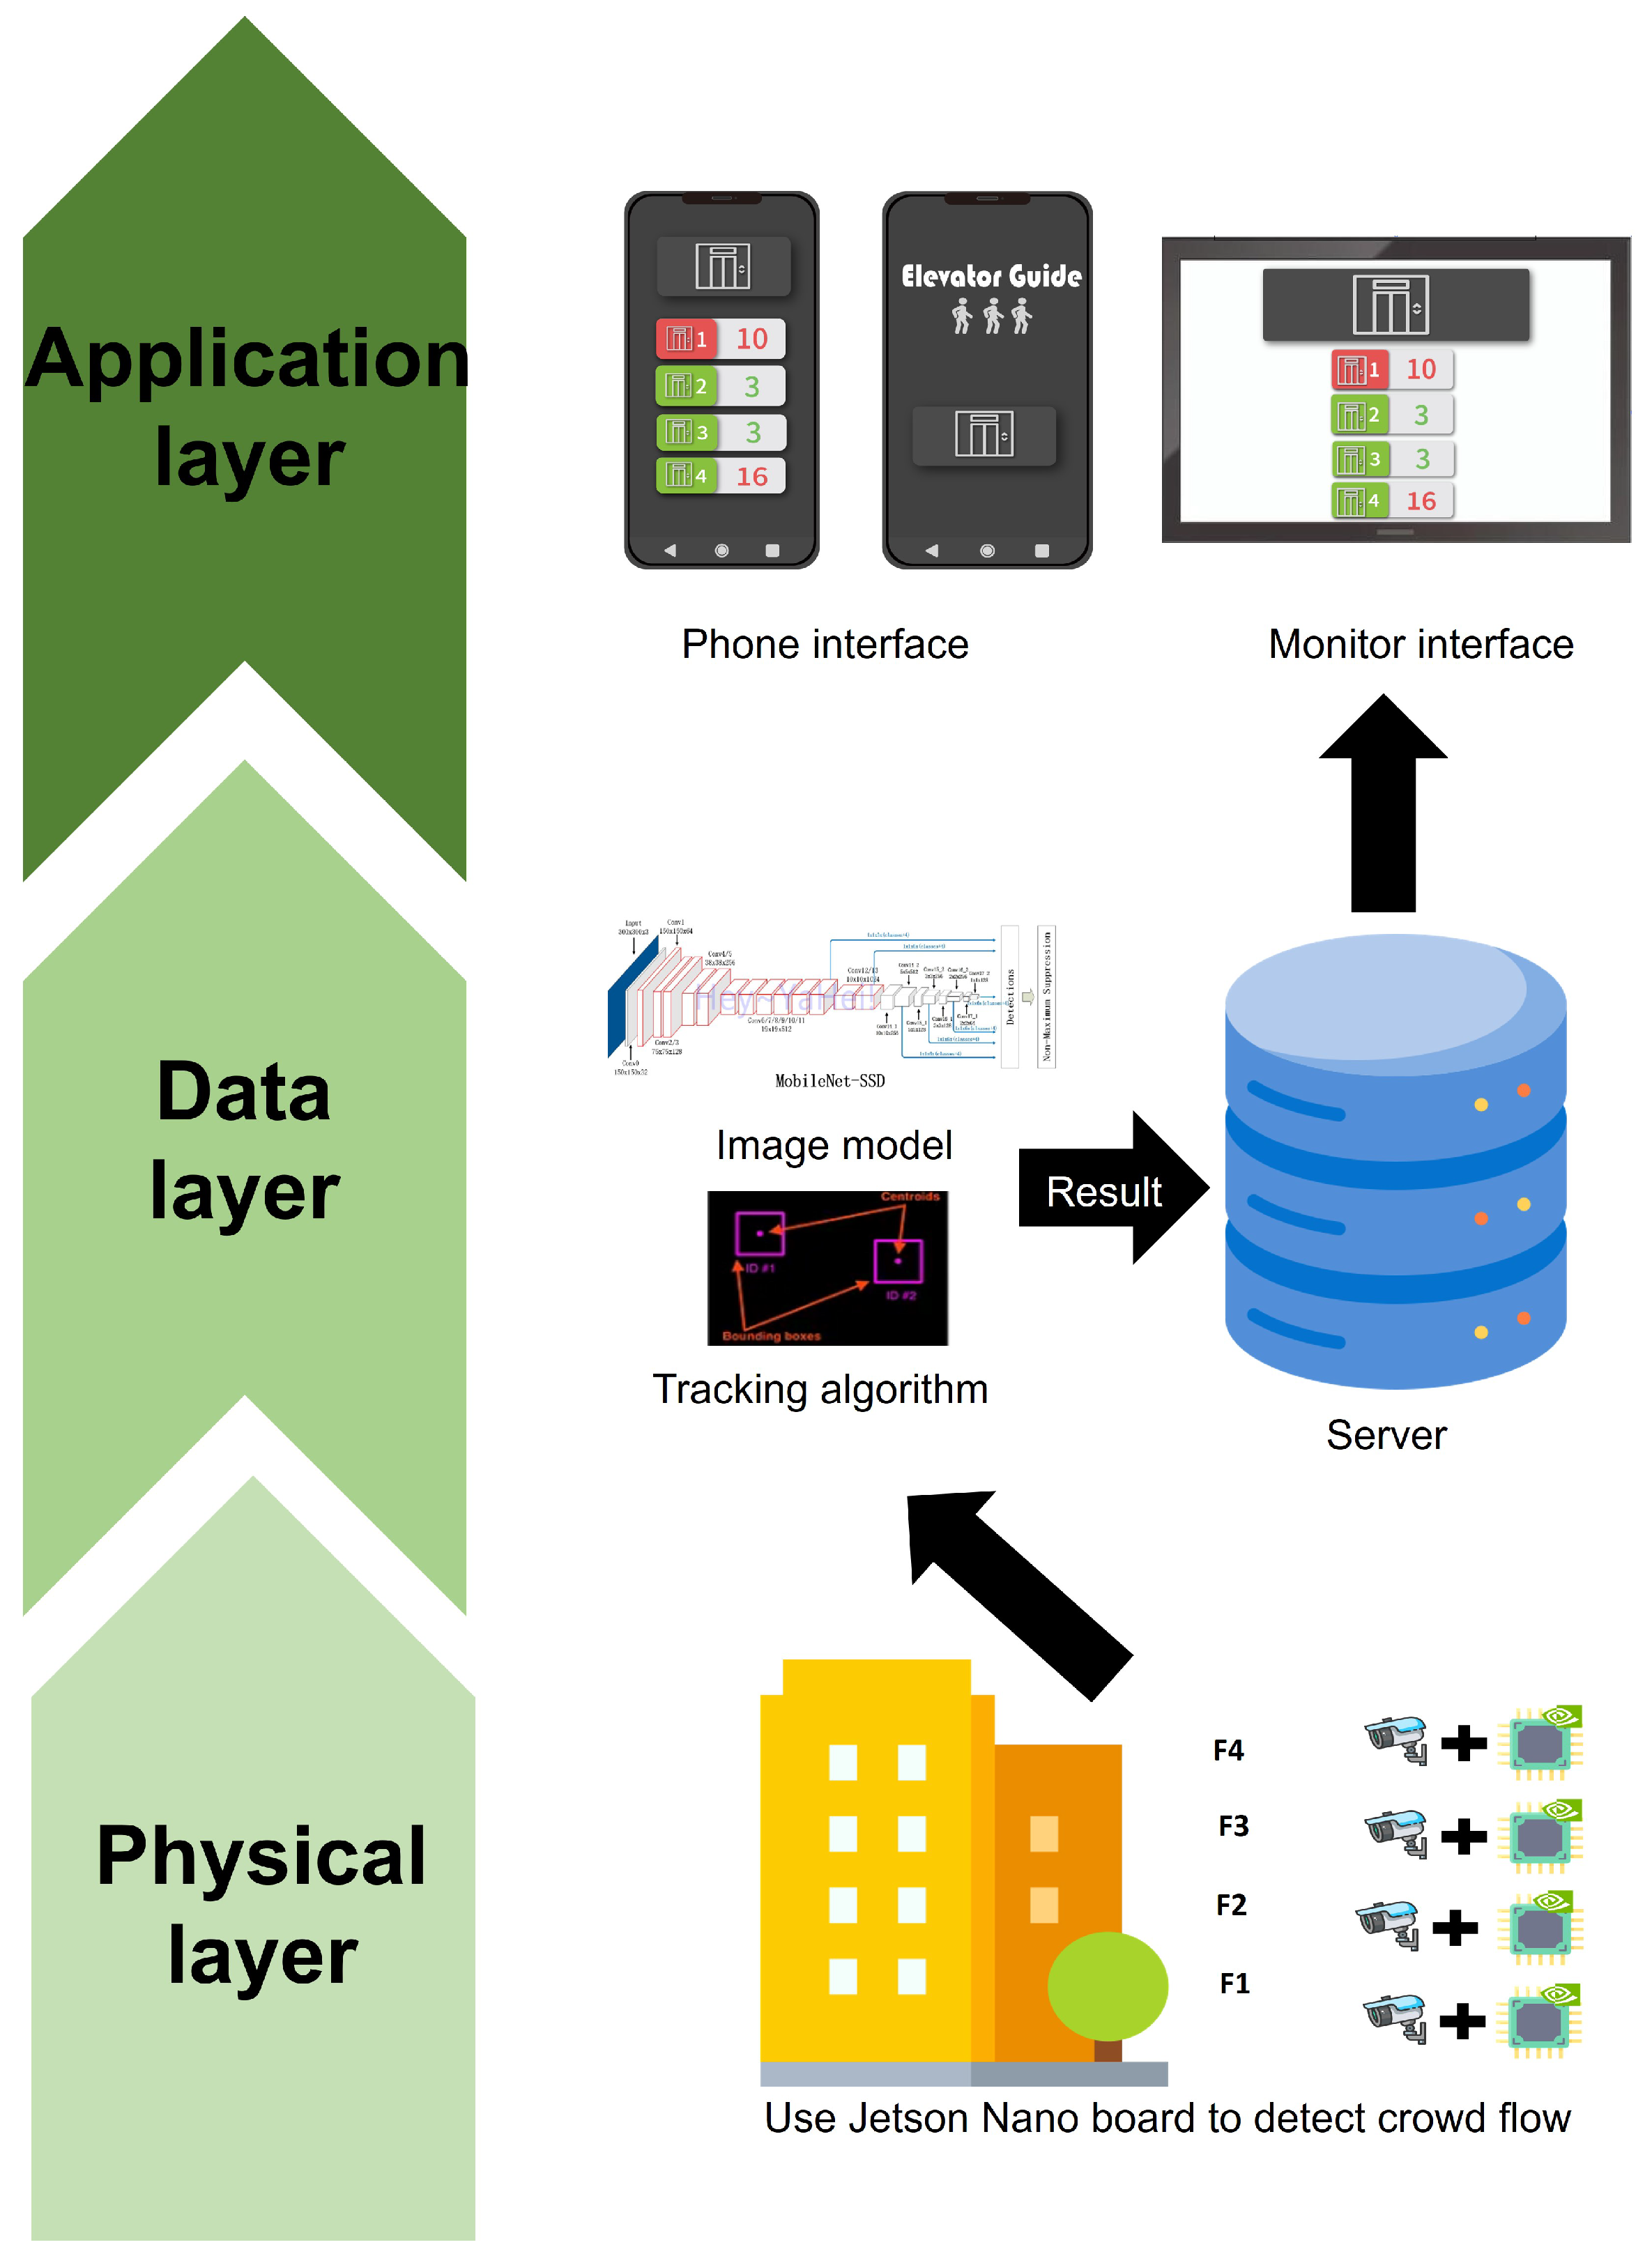
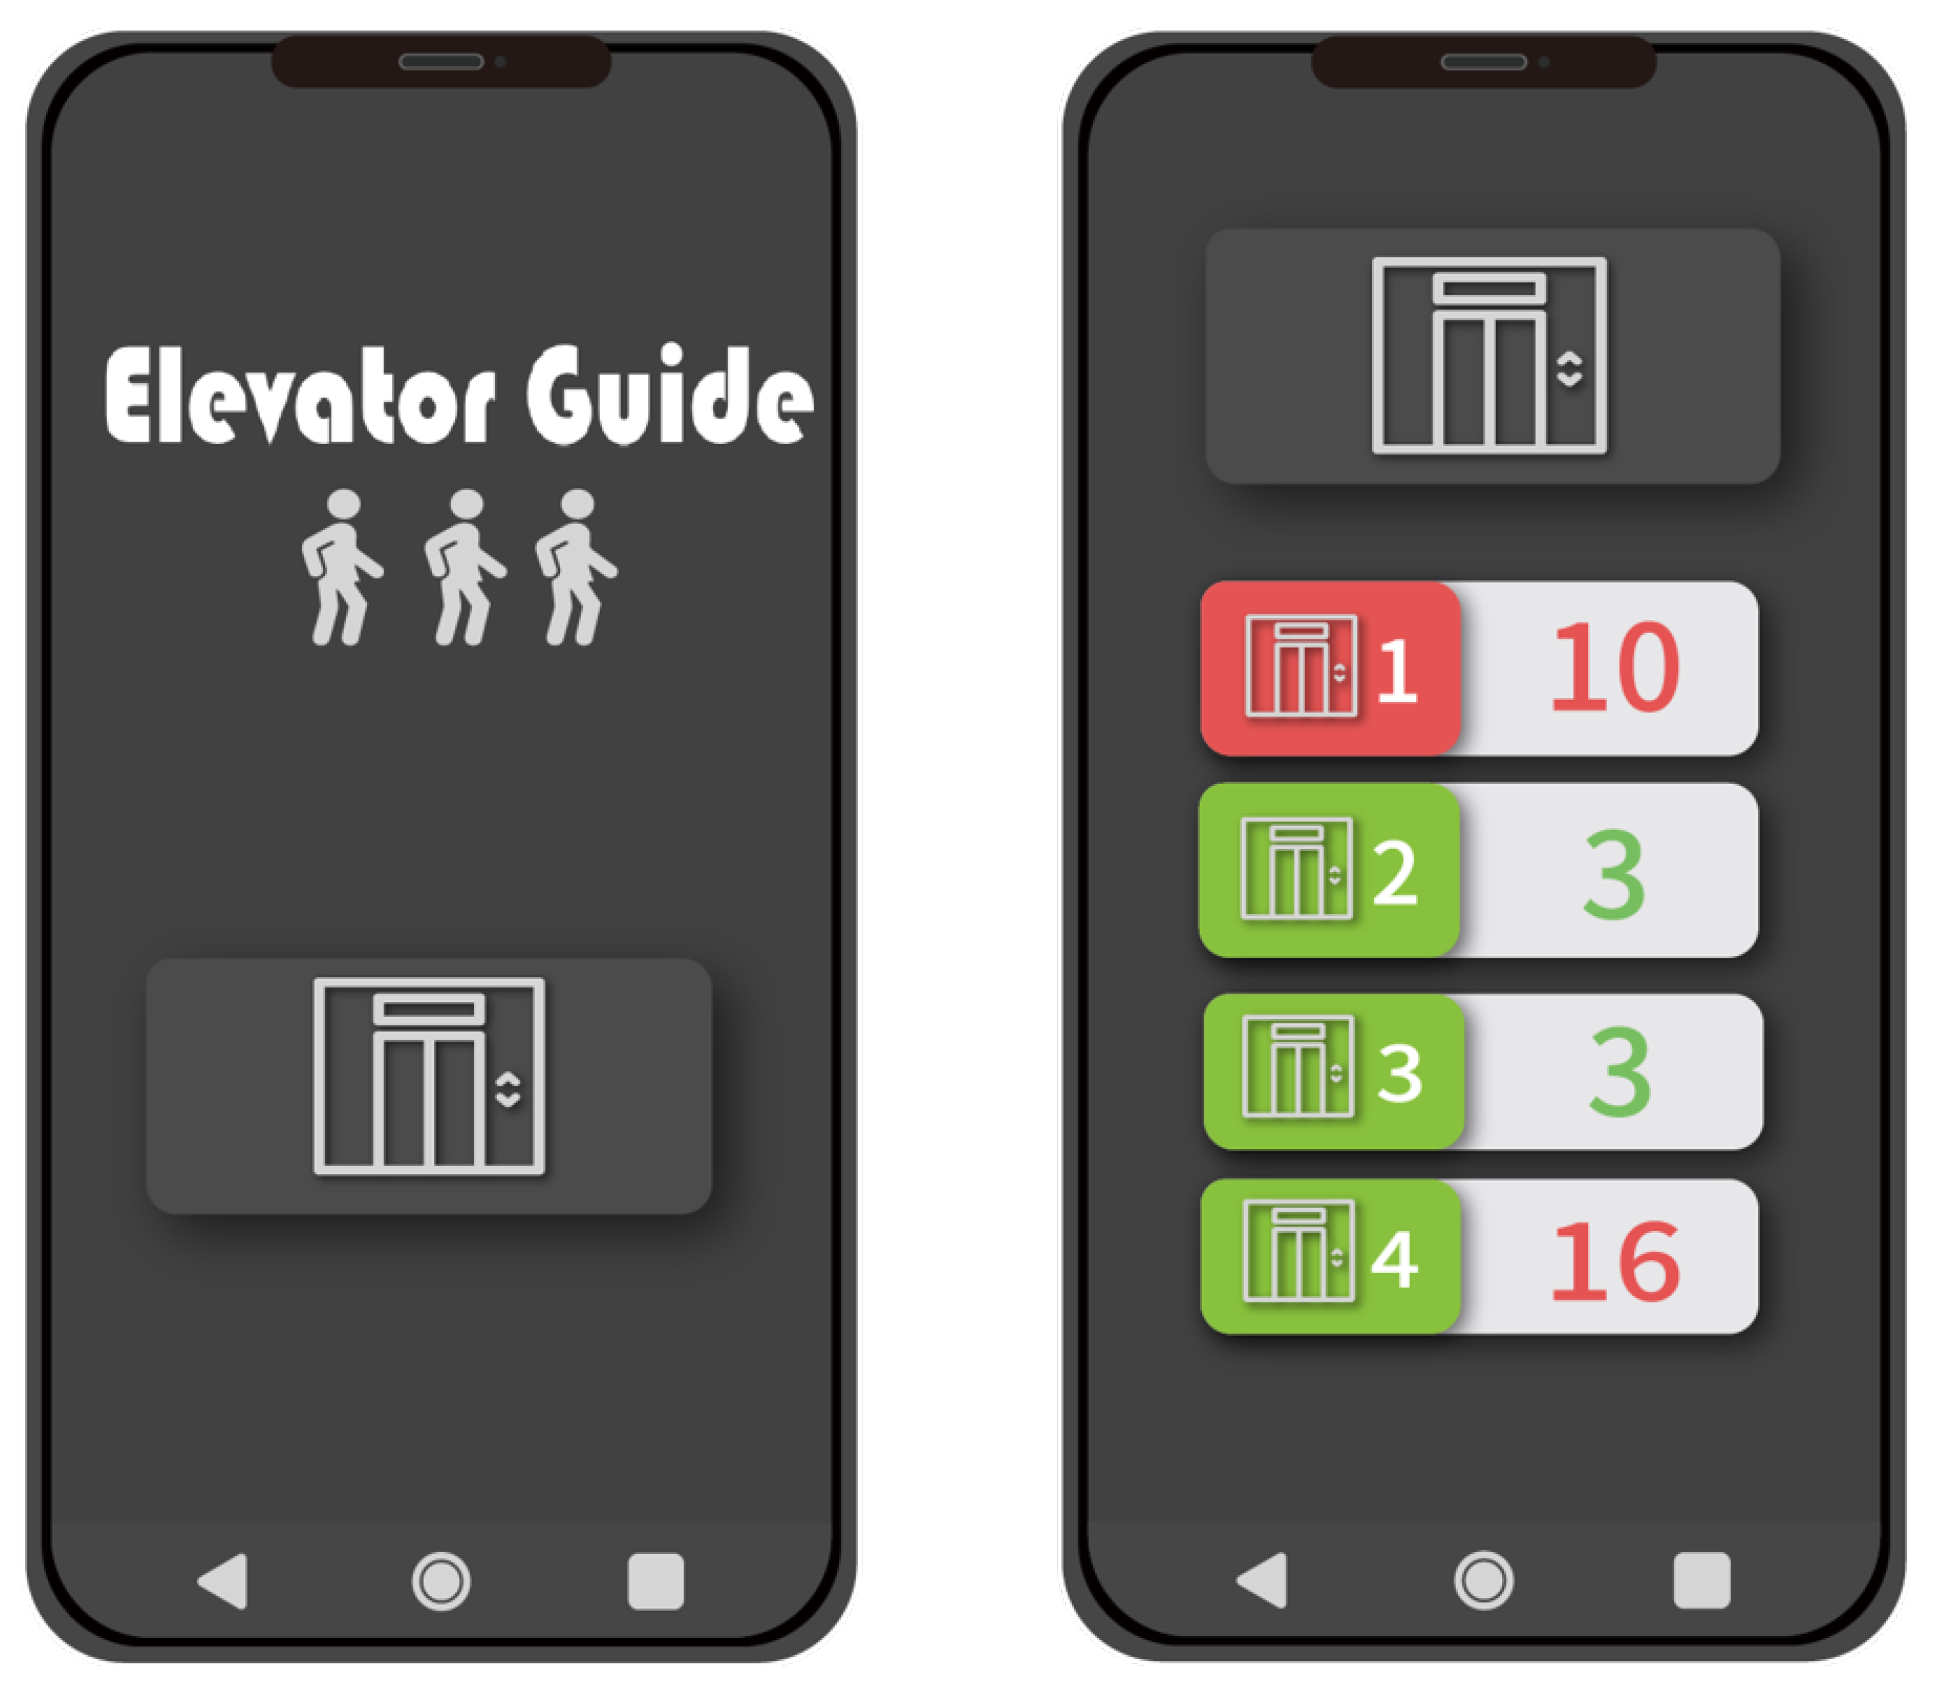
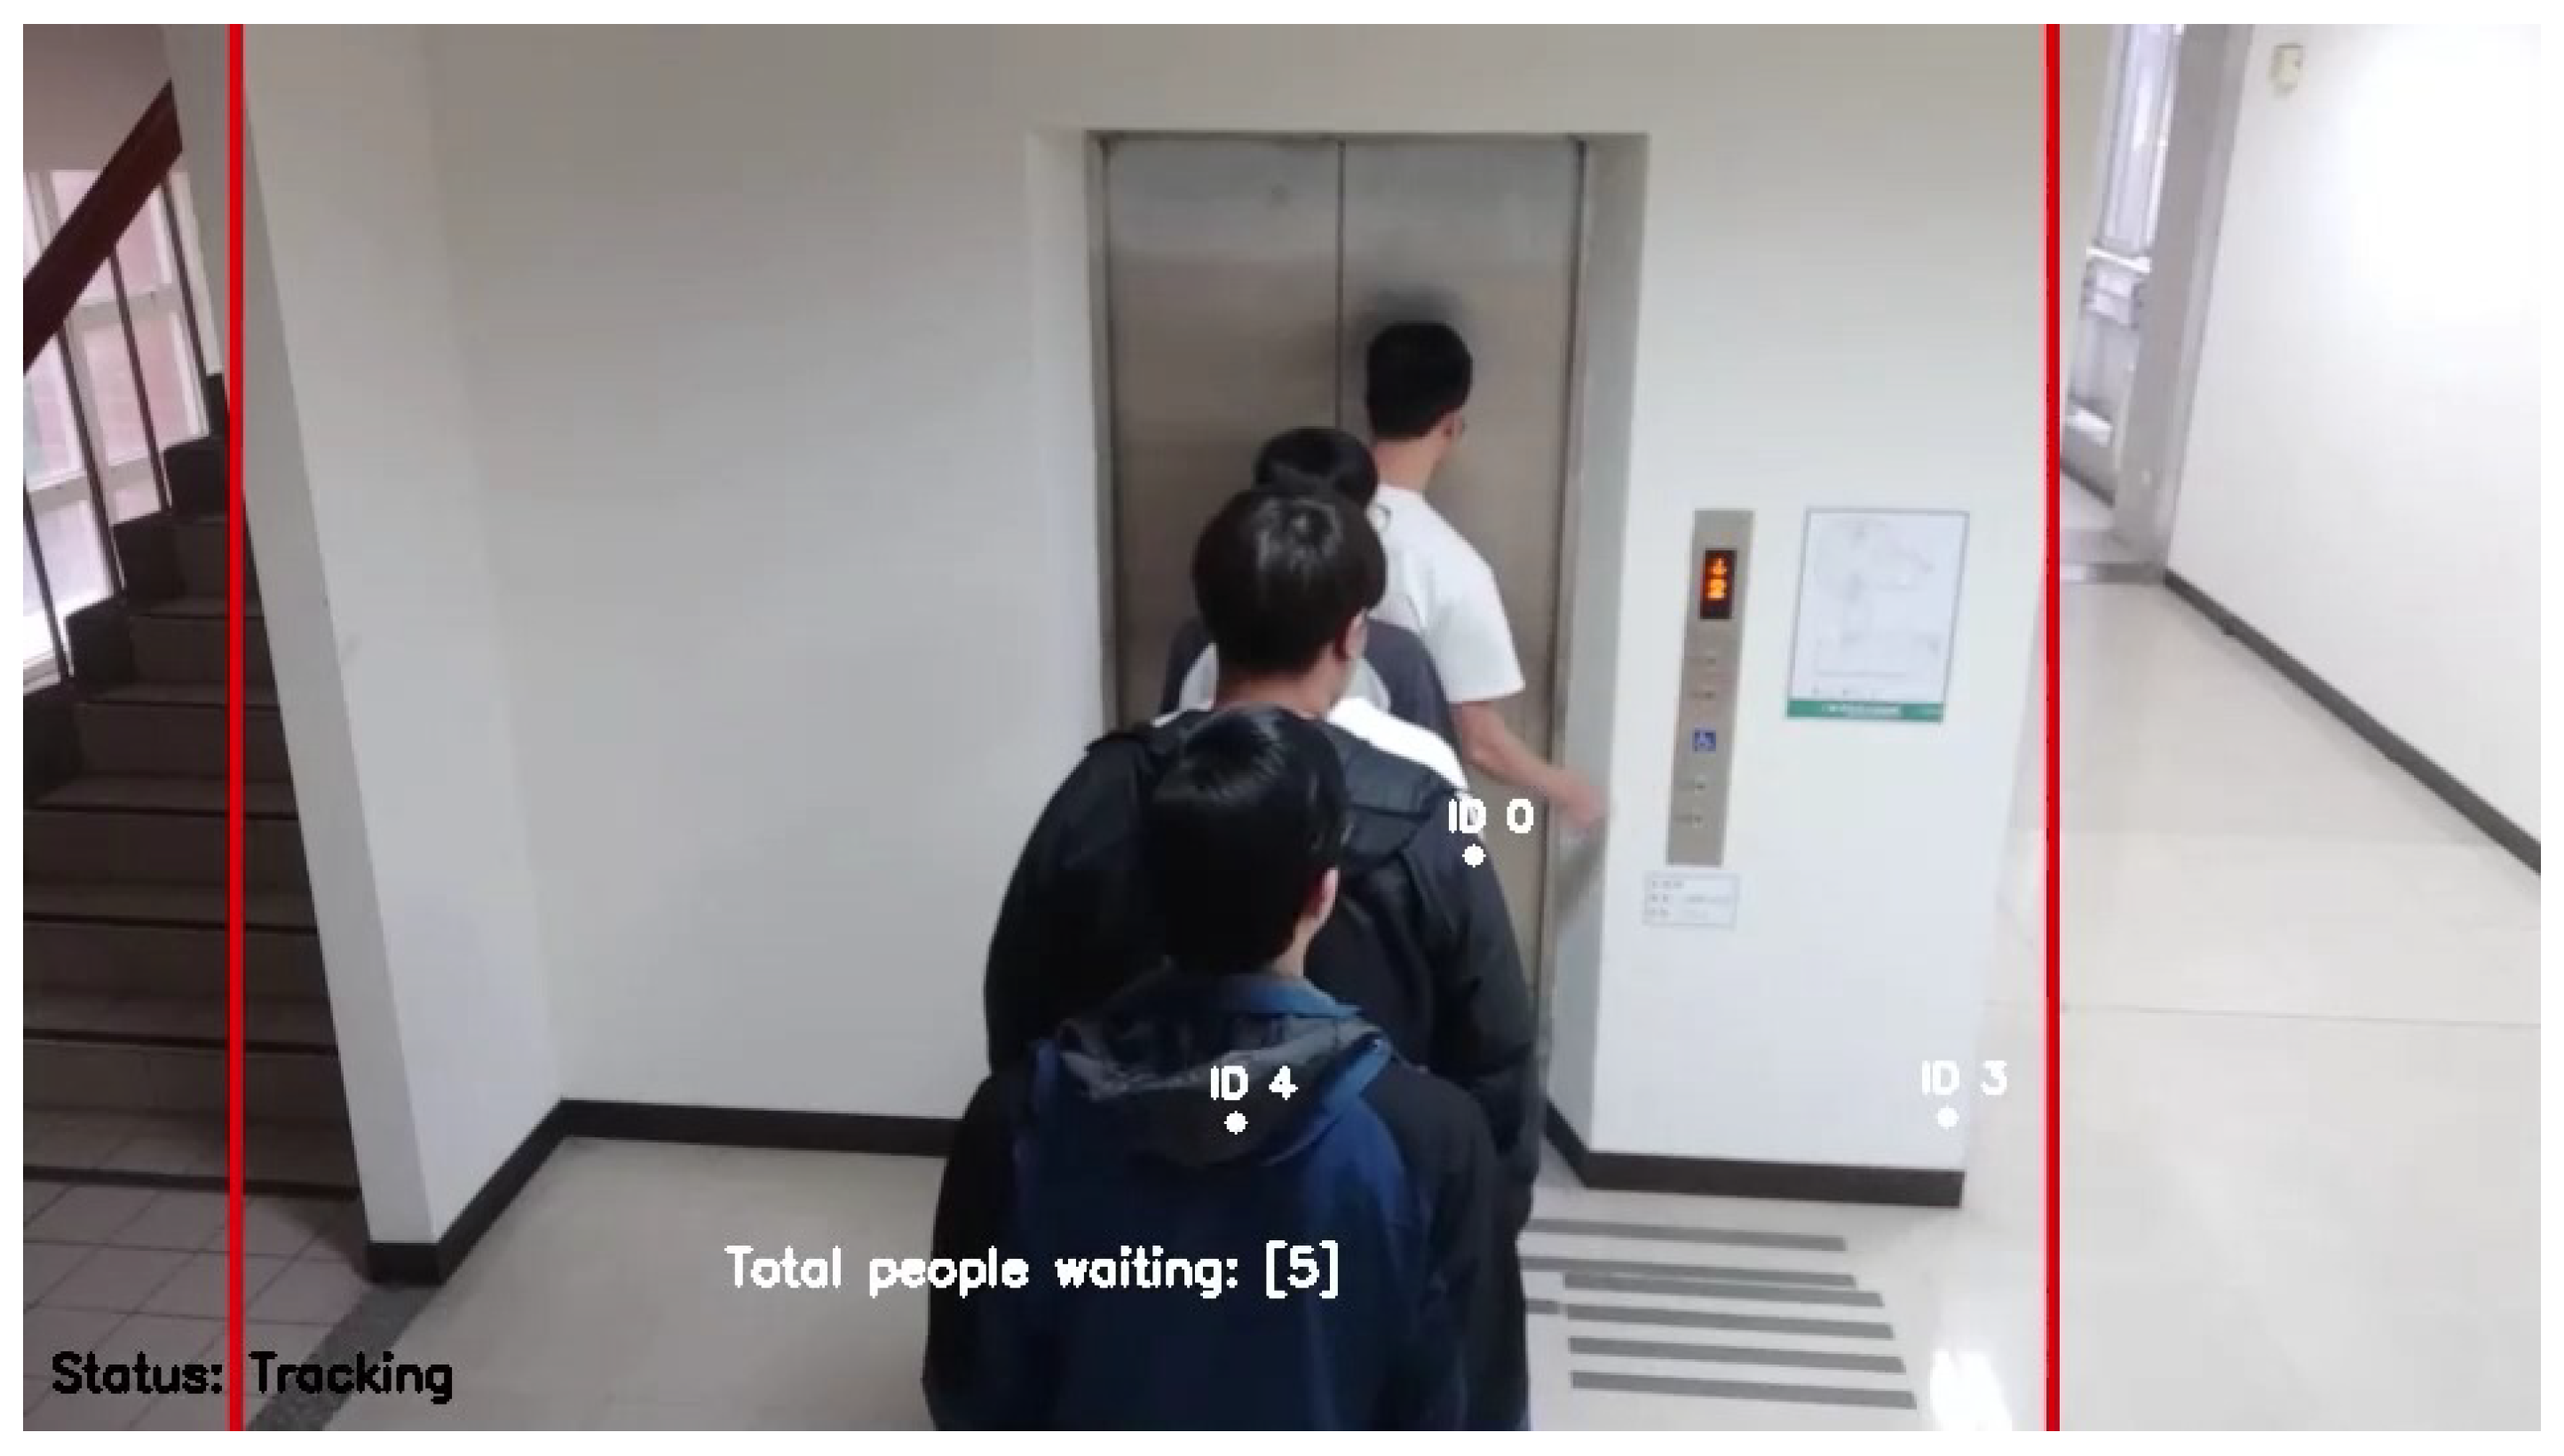
4.1. System Functions and User Interface

This paper presents an image-based indoor elevator people flow counting system that employs visual data to monitor the current passenger flow inside and outside elevators within a building. It simultaneously performs a statistical analysis to determine the number of occupants. The acquired data are transmitted to a server and ultimately displayed on a large screen for all building occupants to observe. The mobile interface design is depicted in Figure 1. The left side of the figure illustrates the main mobile interface. Upon scanning a QR code and accessing the main interface, users can select the elevator icon to view the current elevator waiting status and the number of occupants inside the elevator, as shown on the right side. On the presentation interface for elevator waiting numbers and elevator occupants, the elevator occupancy number is displayed on the right half of the interface. The color of the displayed number corresponds to different levels of occupancy, represented by a color-coded classification into three levels, green, yellow, and red, signifying low to high occupancy levels. Users, upon viewing this interface, can decide whether to use the elevator based on the displayed waiting numbers and elevator occupancy numbers. In addition to the mobile interface, we also designed an electronic screen interface, as depicted in Figure 1. It was created using Mockuphone [24], a free tool that can help to wrap app screenshots in different mobile devices. These electronic screens are placed in the elevator waiting halls on each floor. They provide information about the current elevator waiting status and the number of occupants inside the elevator for each floor. The numerical values and color representations on the electronic screen interface correspond to those on the mobile interface and serve the same purpose. By offering this electronic screen interface, users who do not have a mobile phone with a QR code scanner can still directly view the screen to obtain information about the current elevator waiting status and the number of occupants inside the elevator within the building.

4.2. System Architecture and Usage Scenarios

The system’s architecture diagram is illustrated in Figure 2. On various floors of the building, we installed NVIDIA Jetson Nano embedded development boards equipped with cameras. Our developed people flow counting system was integrated into these development boards. When the development board captures the current waiting and in-elevator passenger numbers using the camera and completes the counting process on the board, the data are transmitted back to the backend server through Wi-Fi. Based on the returned IP address, the server identifies the floor information and updates the relevant data. Finally, the organized data are presented on both the mobile interface and the electronic screen interface.
In the envisioned application scenario, within a four-story building, there is an elevator system designed to transport people. During peak hours, a substantial number of individuals require elevator usage. However, due to the absence of available information regarding the current waiting queues on each floor and the occupancy status within the elevator, users often experience anxiety and are unable to determine whether to continue waiting, resulting in inefficient time utilization. To address this issue, we implemented embedded development boards equipped with cameras and Wi-Fi capabilities at elevator entrances, exits, and corridors on each floor. Each embedded board captures real-time images of waiting queues, elevator occupancy, and pedestrian flow in the corridor through the embedded camera. The system analyzes these data locally and transmits them to a backend database via Wi-Fi, with distinct IPs assigned to differentiate data originating from different floors. The collected data are then presented on large screens and web pages for each floor. Users can instantly access this information upon entering the building by scanning QR codes. This provides insights into the current status of waiting queues on various floors, the elevator occupancy, and the corridor pedestrian density.
Beyond smartphone access, users can also acquire this information from large screens placed on each floor. Armed with insights into elevator wait times and occupancy, users can make informed decisions regarding whether to continue waiting for the elevator or explore alternative transportation options. These data can also be utilized to optimize elevator scheduling algorithms. By incorporating this information into scheduling algorithms, the system can devise the most efficient route for users to reach their destinations within the building, facilitating prompt elevator usage or alternative modes of transportation for users, thus minimizing travel time.

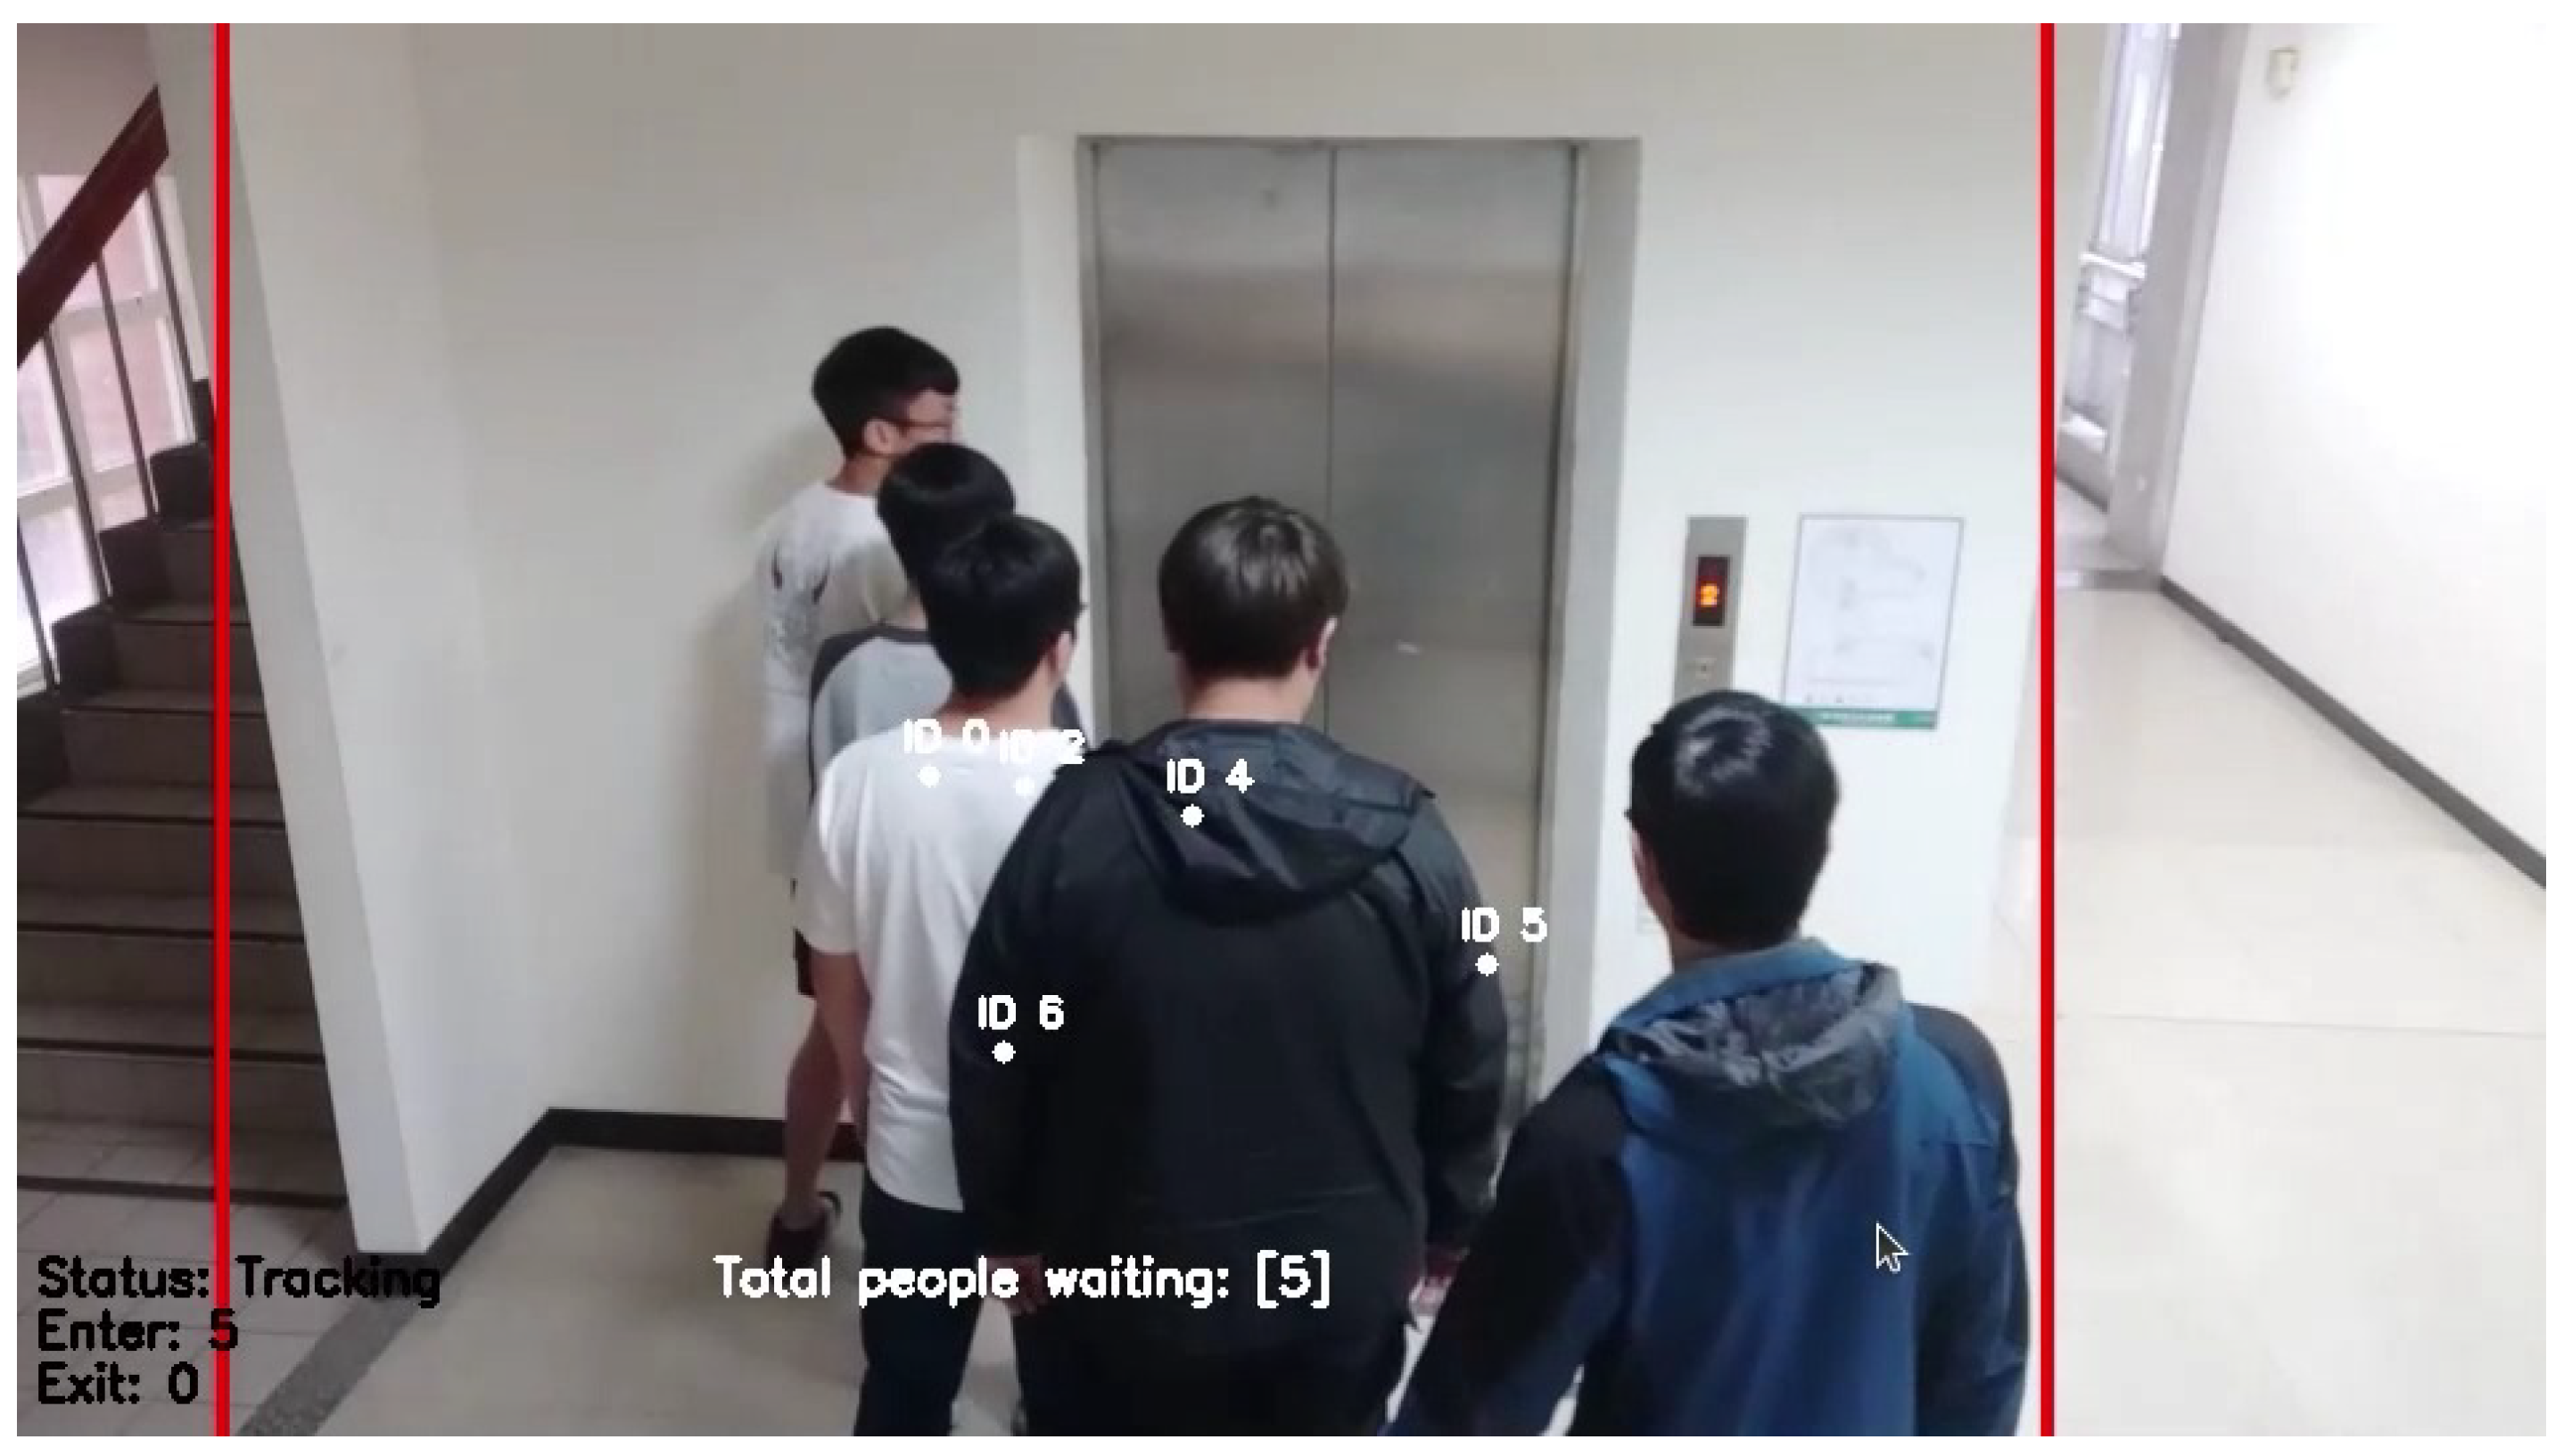
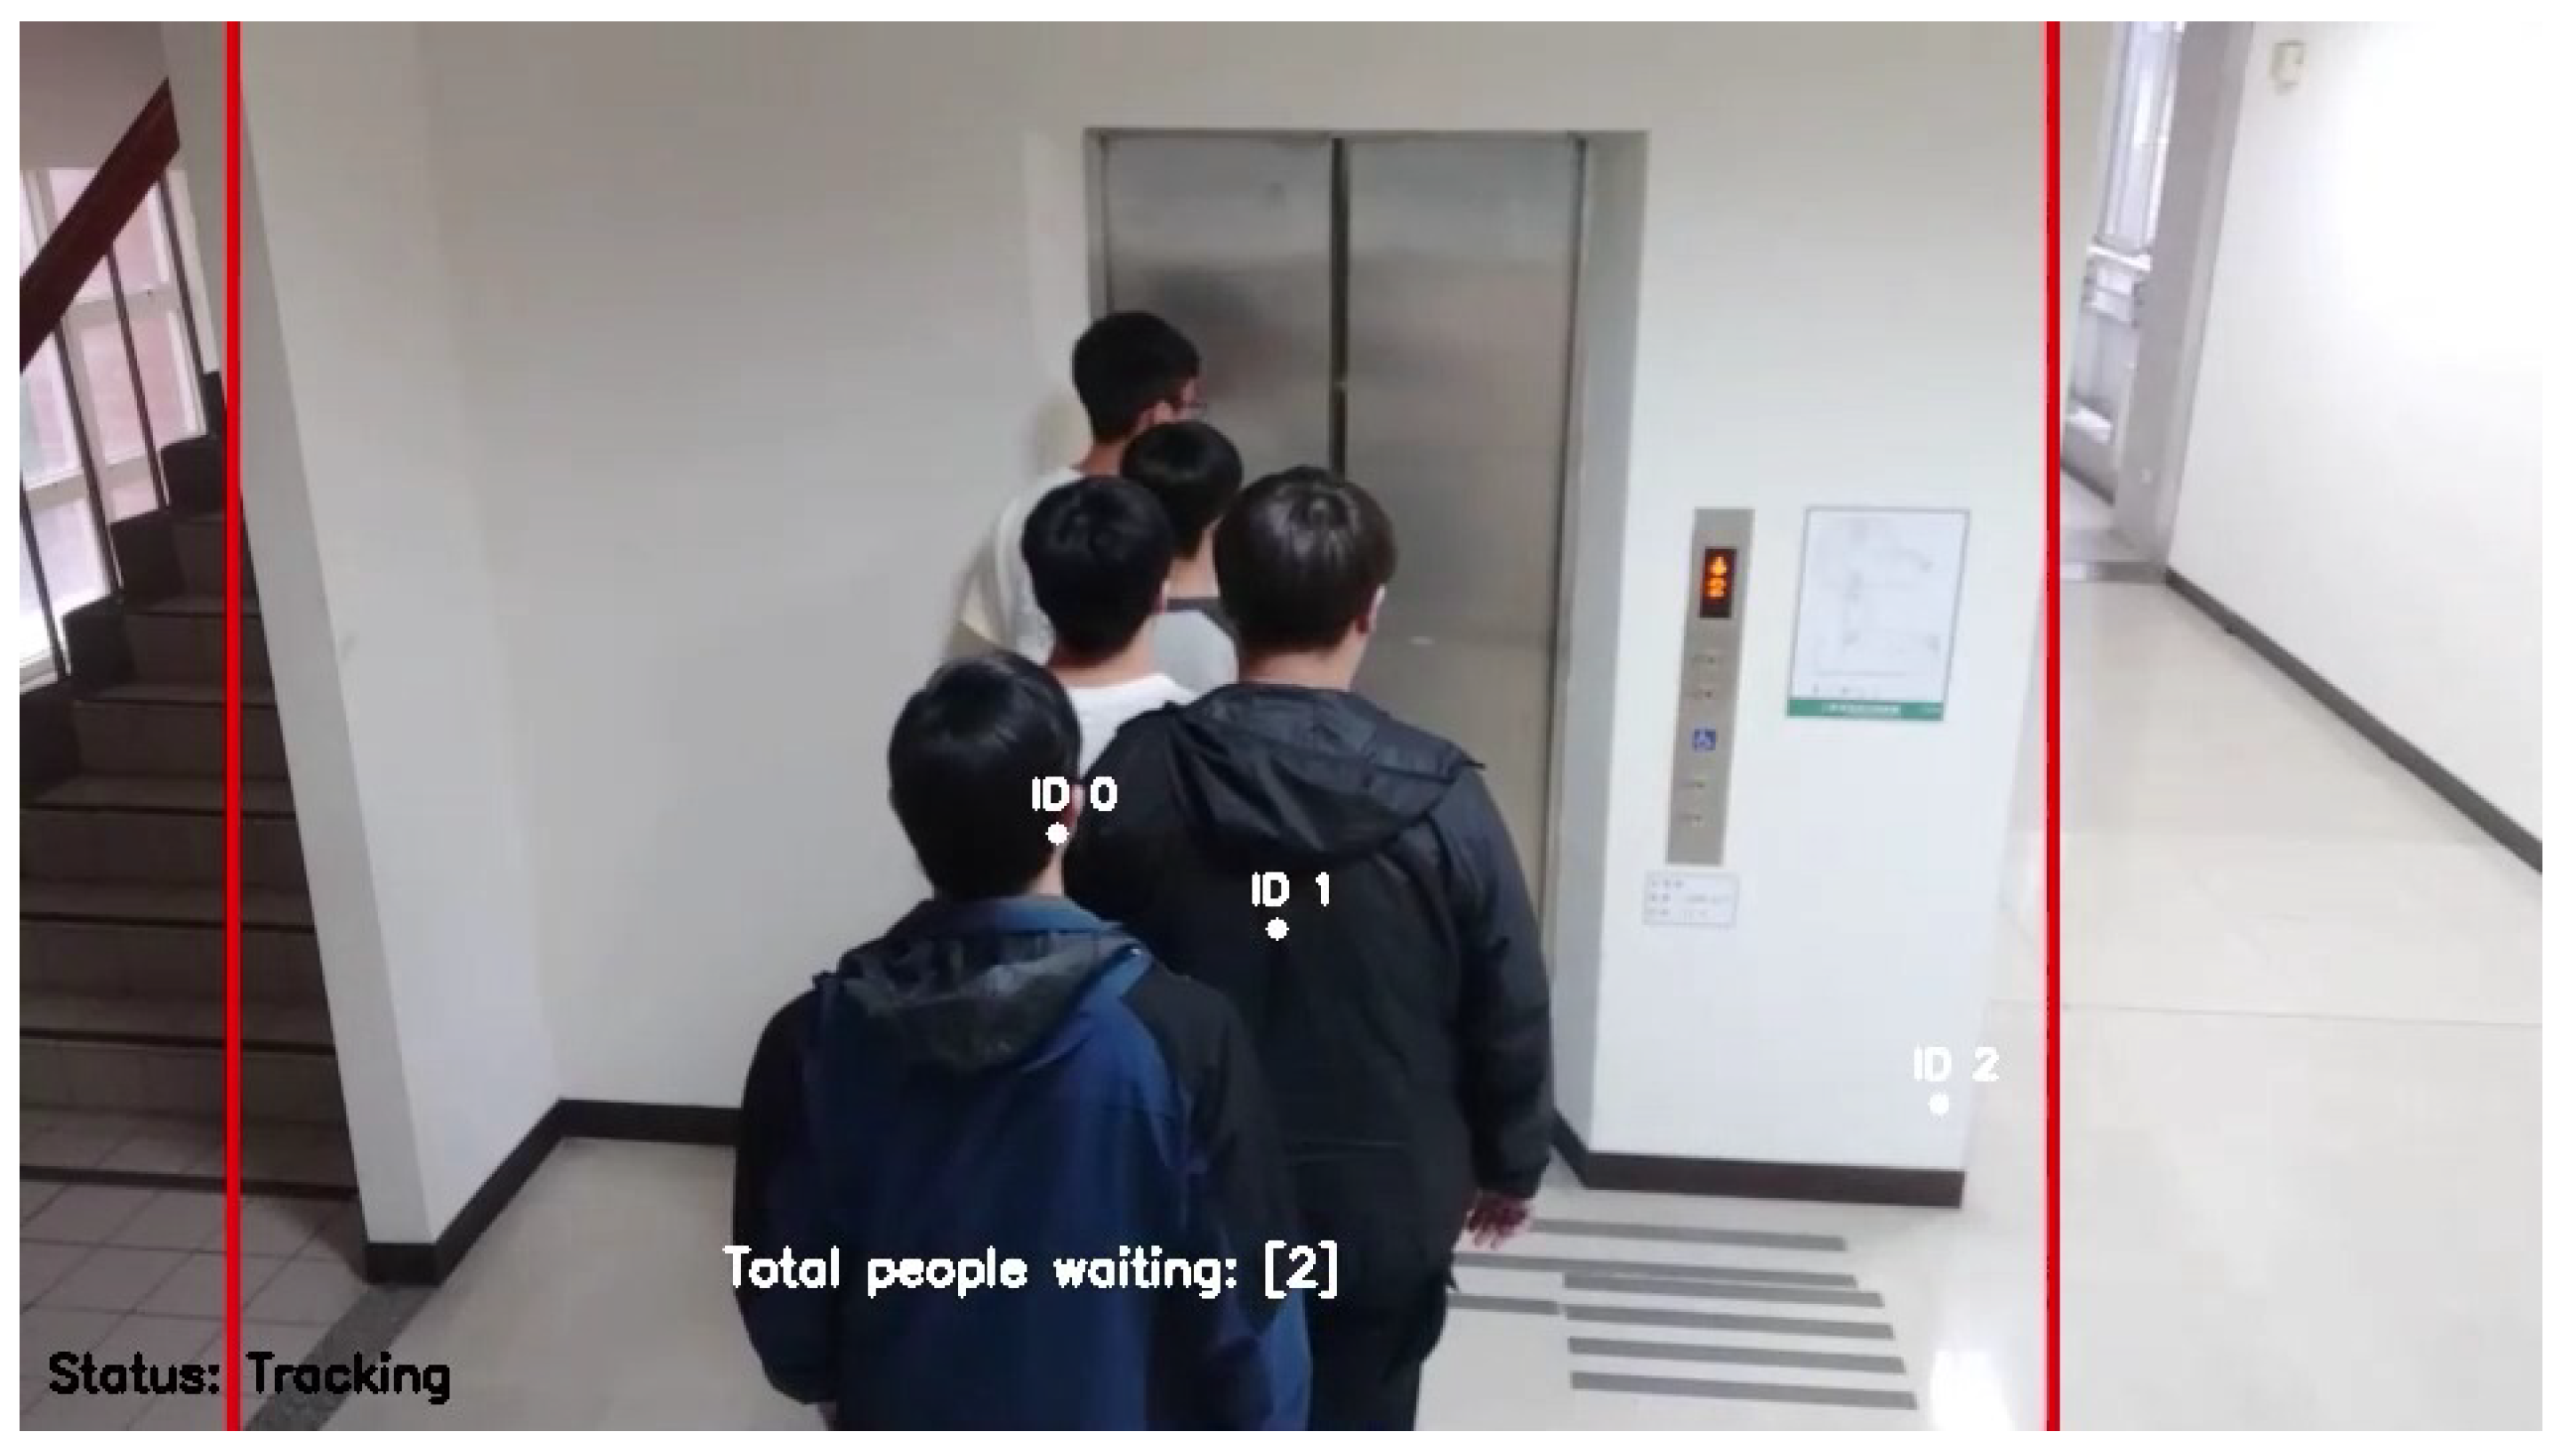
4.3. People-Counting Method

The algorithm used for people flow tracking utilizes MobileNet as the image recognition model combined with the SSD object-tracking algorithm. MobileNet, chosen as the image recognition model, exhibits attributes of low latency and low power consumption. These characteristics make it well suited for deployment on embedded development boards, aligning with our research objectives. Despite its comparatively lower accuracy, its lightweight nature is a dominant advantage. Specifically, we employed MobileNet V3, an improved version, which incorporates depthwise separable convolution from V1 and the linear bottleneck inverted residual structure from V2. Notably, V3 replaces the ReLU activation function with h-swish(x), resulting in an enhanced neural network accuracy. For our dataset, we employed the publicly available COCO dataset and selected target objects labeled as people for recognition. The SSD object tracking algorithm was employed due to its superior processing speed compared to the Faster RCNN. It shares the image processing concept with YOLO, conducting verification (classification) and bounding box regression simultaneously. In our approach, MobileNet V3 identifies candidate regions in the image, followed by SSD detection of all candidate regions. Subsequent to detection and localization, we determine the current waiting count based on whether the tracked target crosses the LOI that we have set. Our model’s dataset was derived from the "person" data within the COCO open dataset, consisting of a total of 66,808 data samples (i.e., images). Among these, we randomly selected 20,000 samples for training to keep our model at a reasonable size, of which 17,000 samples were used for training, and the remaining 3000 were reserved for testing. After 3000 iterations, the loss stabilized at approximately 1.5 to 2.5, with a mean average precision (mAP) of 0.727.
Recognition involves the consideration of confidence values and frame rates, both of which exert considerable influences on subsequent detection. To explore their influences, we conducted experiments with different camera angles, using horizontal formation as a benchmark to adjust the two parameters. Initially, we tuned the confidence value, which measures the model’s recognition of objects similar to the target in the image. By adjusting this value, we ensured that the model focused on objects that closely resembled the target. We utilized Equation (1) and parameterized the confidence value using the variable I c , denoting the confidence threshold adjustment with the parameter i. The parameter range for i spanned from 0.6 to 0.8, with adjustments made in increments of 0.005. This process yielded intermediate accuracy values I P c i , which allowed us to determine the optimal confidence threshold parameter I c via Equation (1). Subsequently, we adjusted the frame rate parameter I F . In scenarios where adjusting the confidence value still led to objects being omitted, frame rate adjustment was needed.
I c = M A X ( I P c i ) .
We defined the frame rate variable as I F , beginning at 10 and increasing incrementally until the optimal accuracy was achieved. Equation (2) facilitated the identification of the optimal frame rate using I P f j , where j ranged from 1 to 10. The frame rate was adjusted by two frames at a time, up to a maximum of thirty frames. Once the ideal accuracy was achieved in the horizontal formation, we applied these parameter adjustments to the other three formations, vertical, diagonal, and zigzag, achieving effective parameters for all four formations.
I c = M A X ( I P f i ) .
The tracking method involves the centroid tracker algorithm. Upon a target’s initial appearance, its centroid is computed, assigned an ID, and tracked. Subsequently, the Euclidean distance between the centroids in consecutive images is calculated. We assume that the target will continuously appear after the initial appearance and use the calculated Euclidean distances to predict the next position. Our counting method is determined by whether the target’s centroid crosses the LOI. If the target’s centroid is not initially detected when it enters the frame but enters the waiting area later, the algorithm assigns it an ID. Incremental counts occur each time a new ID is added until the target exits the frame. This method focuses on recognizing and tracking the target only when it enters the waiting area, rather than continuously recognizing and counting objects in the image. In this way, we can minimize the counting errors caused by occlusions between the target and other objects.

4.4. Recognition Frequency

The frame rate significantly impacts the smoothness and clarity of the detection images. Higher frame rates result in smoother images but also require more computational resources. Therefore, depending on specific requirements, adjustments to the frame rate are necessary to achieve the target image recognition accuracy while maintaining acceptable smoothness in the images. In this study, we discuss the frame rate settings for different formations with a fixed confidence value of 0.55. In the horizontal formation, where there are no occlusion issues, the frame rate can be set to 150 frames, as shown in Figure 3. This setting accurately captures the positions of individuals and correctly calculates the number of people present. In the vertical formation, where occlusion issues are more severe, there might be some cases of undercounting if the targets that initially did not cross the LOI are tracked continuously using the SSD’s object path prediction. Therefore, the frame rate can only be set to 15 frames in this scenario, but still achieves good counting results, as illustrated in Figure 4. For the other two formations, diagonal lines (Figure 5) and criss-cross (Figure 6), which are closer to real-world scenarios and may encounter some occlusion situations, the testing showed that the best results were achieved within the frame rate range of 13 to 15. In summary, when occlusion occurs, setting the frame rate at around 15 frames provides good counting results.

4.5. Confidence Threshold

The confidence threshold is defined as the probability value given by the MobileNet image model to identify an object as a person. We establish an appropriate confidence threshold tailored to the specific implementation environment, such as different settings in terms of environmental factors, camera height, and angles, to achieve better image recognition results. In this system, we fix the frame rate at 15 frames and adjust the confidence threshold to obtain the best counting results for four different formations (horizontal, vertical, diagonal straight lines, and criss-cross formations) with varying occlusion areas. In the case of the horizontal formation, where no occlusion occurs, the confidence threshold can be set as high as 0.96 and still achieve accurate results. However, for the other three formations (vertical, diagonal straight lines, and criss-cross formations) where occlusion is present, the optimal confidence threshold falls to 0.55, providing better results. By combining the findings from Section 4.4, we can conclude that our personnel-counting system, which combines the MobileNet image model with the SSD algorithm, achieves excellent counting results with a frame rate of 15 frames and a confidence threshold of 0.55 in our experimental environment.

4.6. Crowd Detection Module Porting

The embedded development board used in this research was the NVIDIA Jetson Nano Developer Kit, equipped with a 128-core NVIDIA Maxwell GPU and a quad-core ARM CortexA57 MPCore processor. It has 4 GB of 64-bit LPDDR4 memory. After migrating the image model and algorithm to the embedded development board, the environment creation process involves the following steps. Firstly, a microSD card with a capacity of greater than 16 GB is prepared, and the image file is burned using Etcher, a process that takes approximately 15 min. Then, the SD card is inserted into the development board slot, and power is supplied to initiate the system. Upon successful booting, the development board enters the interface and establishes a connection. The environment installation process begins by adjusting the power mode. The command “$sudo jetson_clocks” is used to lock the power to avoid overloading, and “$sudo nvpmodel -m 0” is executed to set the board to high-performance mode (10 W). In this mode, the power supply must reach DC 5V 4A; otherwise, sudden shutdowns may occur. Next, the following four commands are used to install the Python environment: “$sudo apt-get install python3-pip python3-dev build-essential”, “$sudo -H pip3 install –upgrade pip”, “$sudo -H pip3 install jetson-stats”, “$sudo systemctl restart jetson_stats.service”. Regarding the frame rate and confidence interval adjustments, hardware limitations prevent frame rates of higher than 10 frames from running accurately, resulting in counting errors. Thus, the frame rate is adjusted to between five and ten frames. As for the testing videos, the original resolution of 540 P is reduced to 480 P to ensure smoother processing. Due to the reduced resolution, the confidence threshold is adjusted to between 0.5 and 0.7. The recognition accuracy results are presented in Section 5.3, showing that even with the decreased image quality, the counting accuracy remains satisfactory.

5. Experiment

5.1. Experiment Design

To validate the accuracy of the counting system, we designed various scenarios involving different elevator queue formations and positions of individuals inside the elevator, with configurations of three, five, and eight individuals. The elevator queue formations encompassed horizontal, vertical, diagonal, and criss-cross patterns (as illustrated in Figure 5, Figure 6, Figure 7 and Figure 8). Positions within the elevator were characterized by non-overlapping and overlapping arrangements. Furthermore, scenarios mimicking pedestrian movements within corridors, including walking in the same direction and encountering pedestrian crossings, were considered. To conduct the experiments, cameras were strategically installed in the elevator waiting areas, on the ground floor corridor, and inside staircases on various floors of Engineering Building 5 at the National Yunlin University of Science and Technology. The camera placement for capturing the waiting crowd and the individuals inside the elevator simultaneously (as shown in Figure 9) involved mounting cameras on the walls near the elevator doors at a 45-degree angle to the ground. Each scenario’s personnel arrangement was repeated five times, enabling the calculation of the system’s accuracy for people flow counting within that specific area. The test subjects’ heights ranged between 170 and 180 cm, and the counting of individuals waiting for the elevator and those inside the elevator was performed in real-time using the LOI approach. Based on the aforementioned configurations, we conducted investigations in three different environments, two of which comprised three individuals, while the remaining environment featured five individuals. These scenarios were intended to examine the accuracy of people counting during both the waiting and entering phases of the elevator.

5.2. Accuracy of Cloud Computing

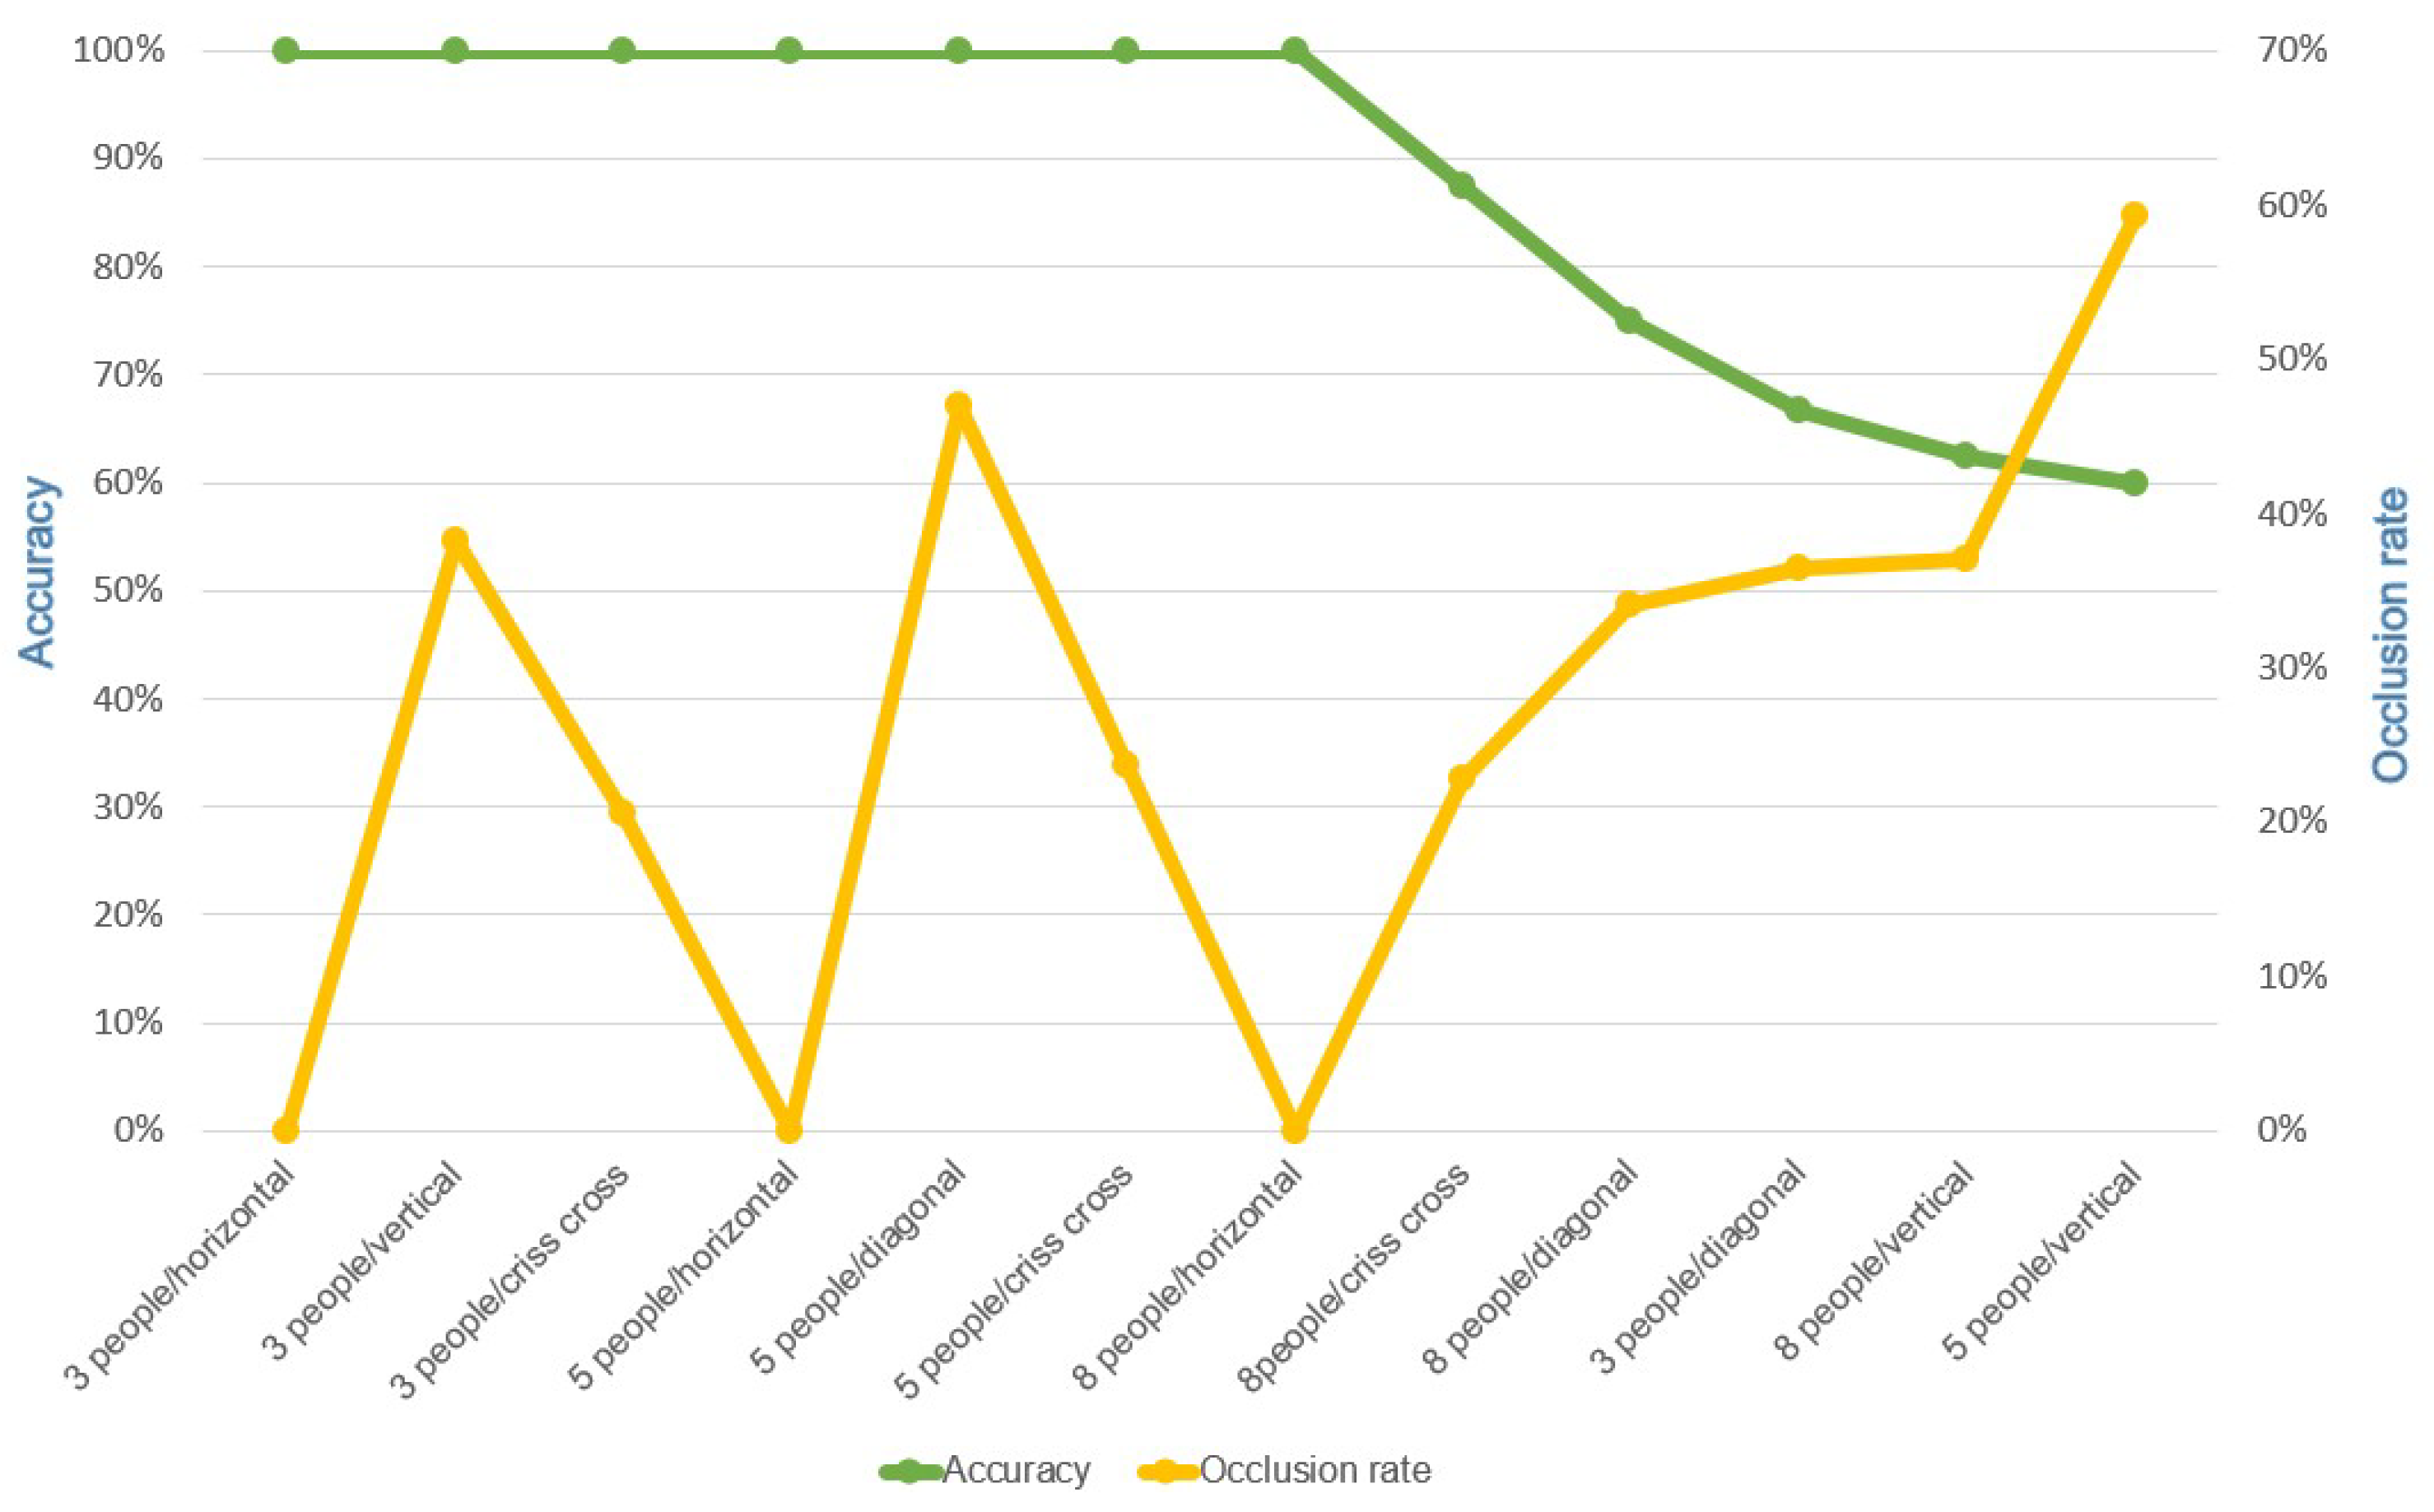
5.2.1. Effect of People Formations on the Accuracy

In this study, we designed a total of four formations for experimentation: a horizontal straight-line formation, a vertical straight-line formation, a diagonal straight-line formation, and a criss-cross formation. Through trials conducted in three distinct environments and from varying angles, we observed that, under all conditions, the recognition performance was optimal for the horizontal straight-line formation, while it was least effective for the vertical straight-line formation. The latter exhibited a reduced recognition performance due to the substantial overlap of target objects, rendering the MobileNet image model unable to identify the targets and consequently hindering subsequent SSD-based tracking, leading to counting inaccuracies. In contrast, the diagonal straight-line and criss-cross formations also exhibited target overlap, albeit with smaller coverage areas, allowing the image model to still recognize target categories and enabling subsequent tracking by algorithms.
People sequentially entered the waiting area for the elevator. The results, as indicated in Table 2, Table 3 and Table 4, show that, for the same number of individuals, the camera angle of forty-five degrees obliquely downward provides a superior accuracy level compared to the horizontal angle. This angle choice mitigates the issue of obscured recognition when individuals are nearly invisible due to occlusions, thus resulting in higher accuracy and stability values across various formations.
With an increase in the number of individuals within the image, apart from addressing occlusion-related issues, the image model must distinguish whether the detected targets are distinct objects to prevent double-counting or undercounting. Within the MobileNet-SSD object detector framework, the SSD algorithm employs the centroid tracker to identify the centroids of objects classified by MobileNet within the designated image regions and records them. If the centroid remains within a limited displacement range during subsequent object tracking, it is not considered a new object; conversely, a significant displacement indicates a new object. In our system, once a target enters the recognition area and is identified with a centroid, upon the centroid crossing the designated LOI segment, the system increases the count for that area. Conversely, if the centroid exits and crosses the LOI segment, the count for that area decreases. Throughout our experiments involving the four formations with varying numbers of individuals entering the recognition area, accurate recognition was consistently achieved, regardless of either the horizontal or forty-five-degree viewing angles. Concerning the formations, the accuracy was compromised for formations with pronounced overlap, such as the vertical and criss-cross formations, resulting in a comparatively lower accuracy. Thus, in scenarios where the image contains a higher number of target objects with increased occlusion, the accuracy of the MobileNet-SSD object detector is notably impacted.

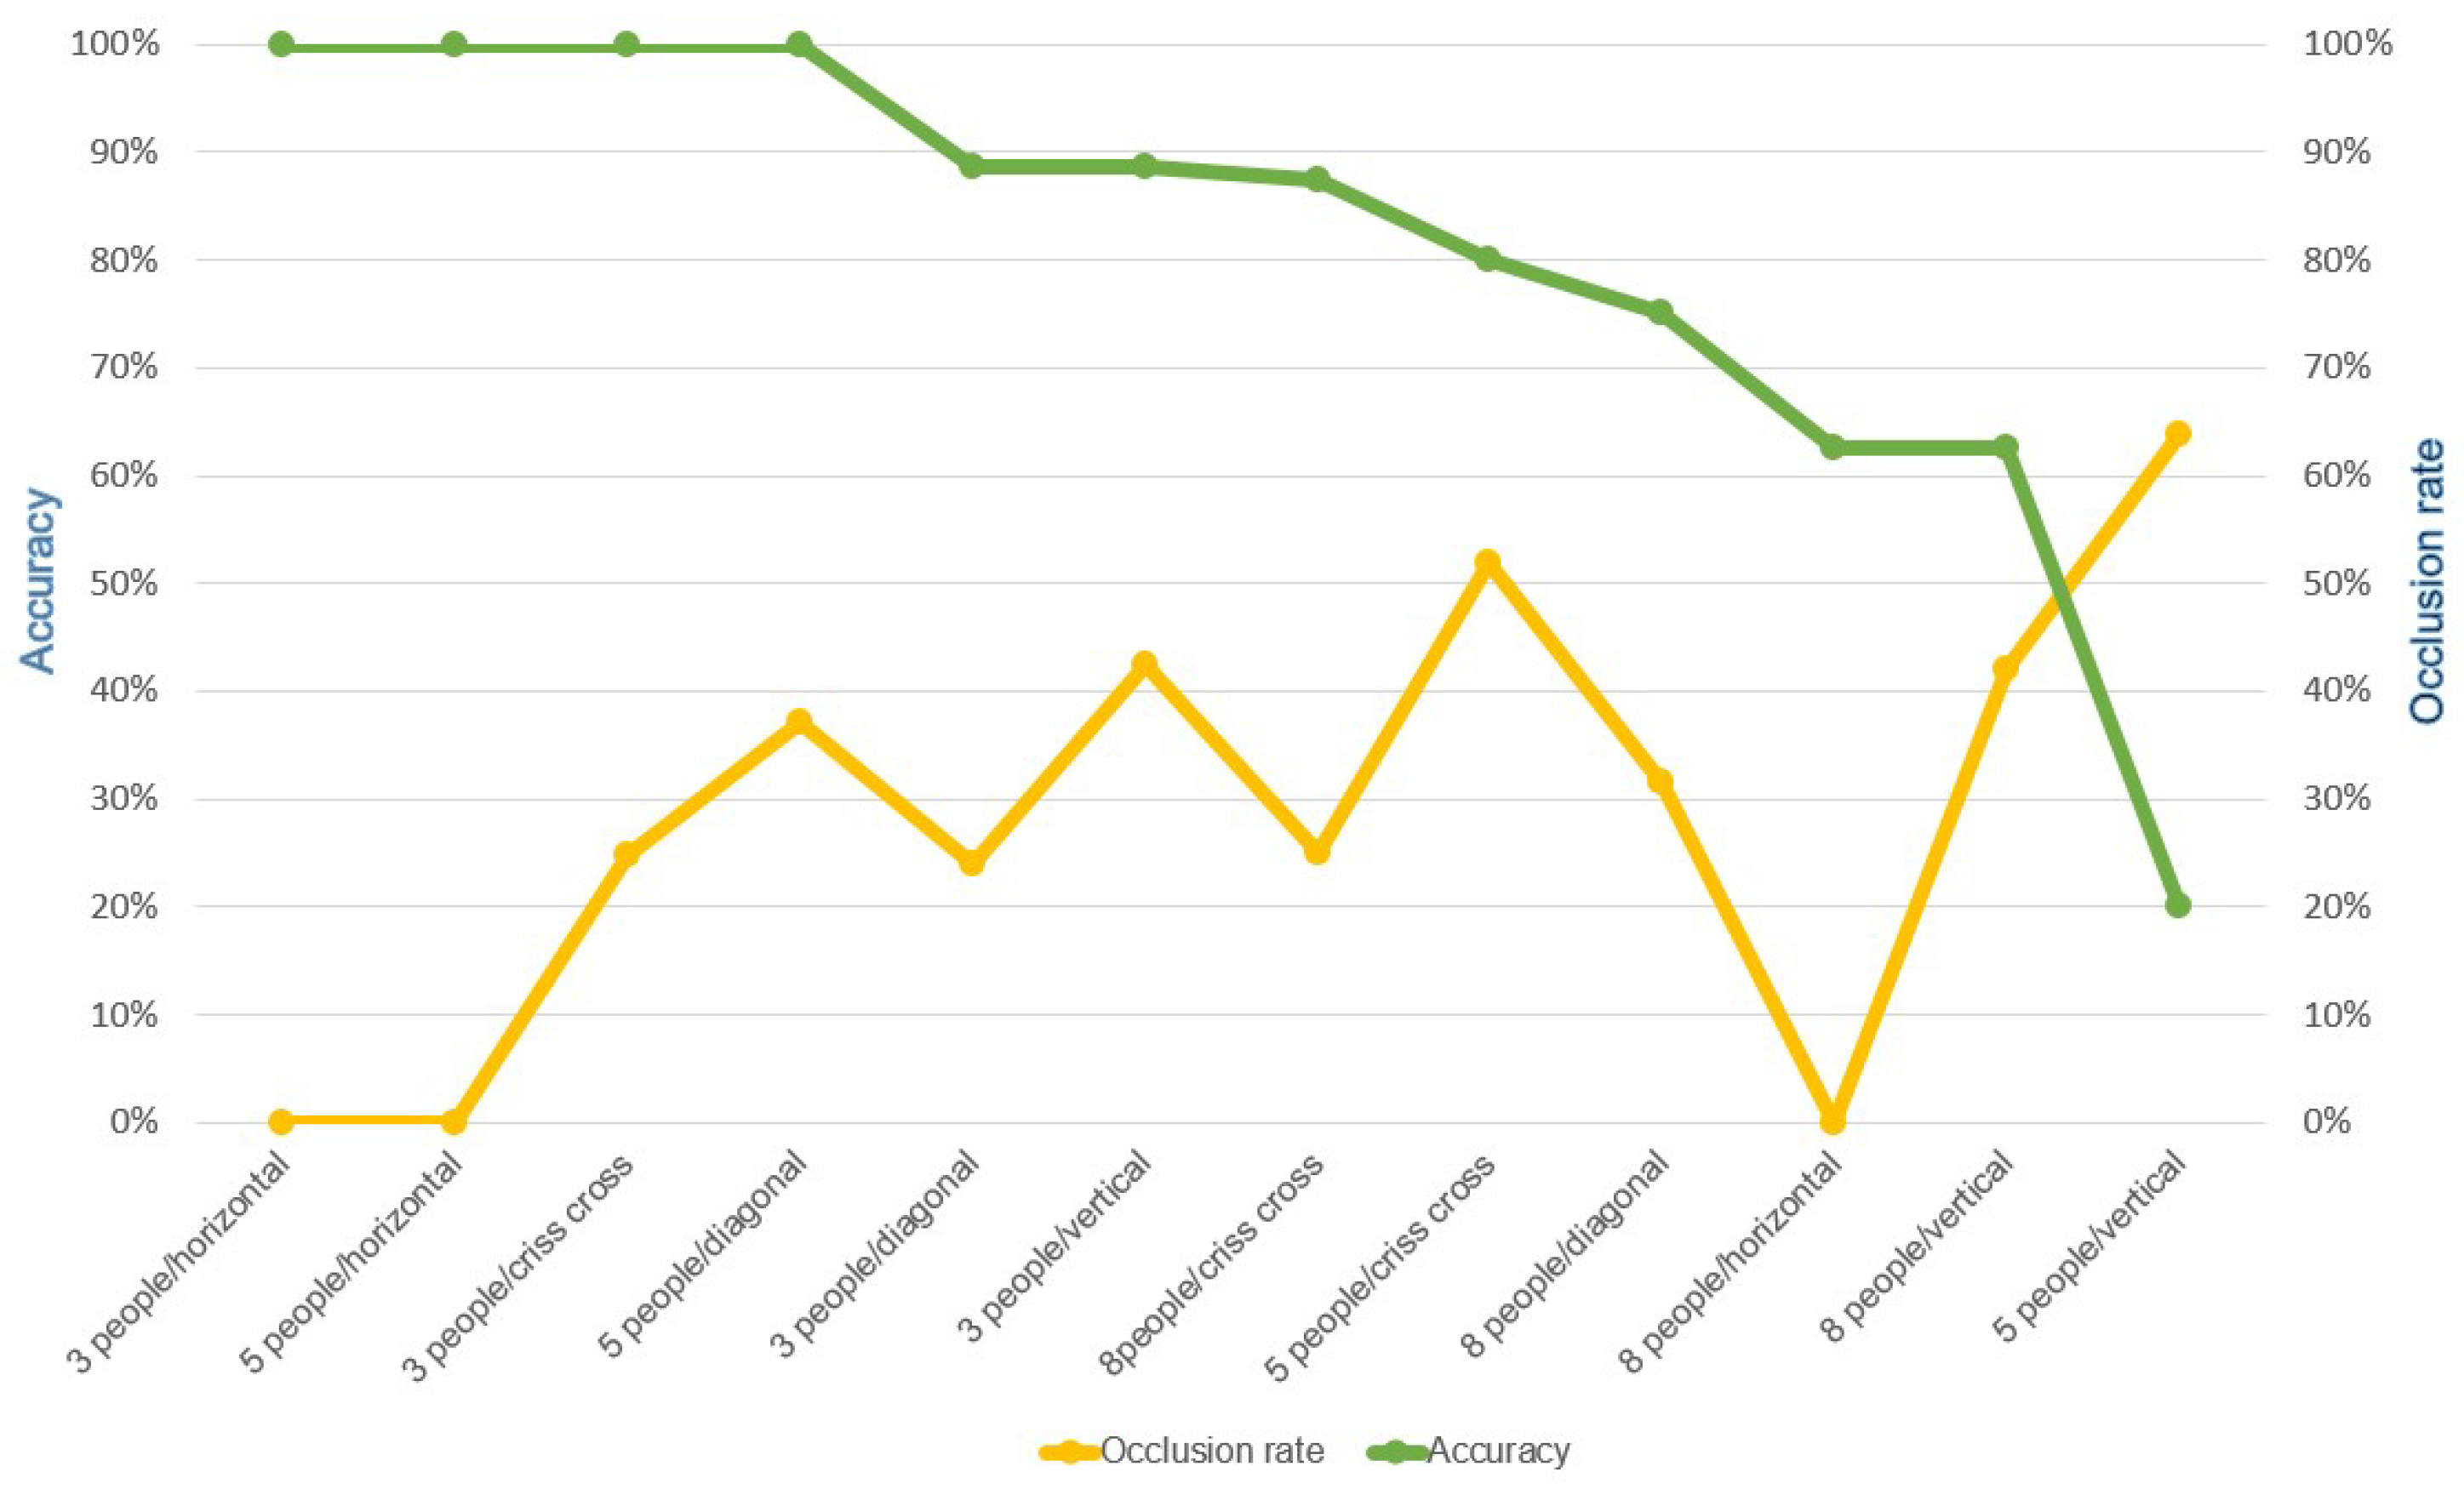
5.2.2. Effect of Occlusion on the Accuracy

In this study, we examined the influence of object occlusion proportions on the counting accuracy. ImageJ software was employed for the image processing and pixel counting of our selected target objects. We adopted an irregular outlining technique, in which individual human silhouettes are depicted and then ImageJ is utilized to calculate their pixel counts using Equation (3).
A f i j = 1 P i j P 1 j .
In the equation, the variable A f i j represents the occlusion ratio, and the variable f i j denotes the collection of values for i individuals, where i = 3, 5, 8 and j represents formations, with j = horizontal formation, vertical formation, diagonal straight-line formation, criss-cross formation, with the first element defined as 1. P f i j signifies the pixel count for the arrangement with i individuals under formation j. The experimental results, illustrated in Figure 4, depict the recognition accuracy represented by the green line and the occlusion ratio represented by the yellow line. The left y-axis indicates the recognition accuracy, while the right y-axis represents the occlusion ratio. Under various scenarios with different numbers of individuals, the impact of occlusion occurrence on the technical outcomes is contingent upon reaching a certain threshold. As depicted in the graph, in most scenarios, if the occlusion of target objects in the image surpasses 30%, there is a high probability of it affecting the counting accuracy. The possible reasons for this observation are twofold. Firstly, within these formations, when individuals enter the designated area, certain angles of the target objects enable the image model to rapidly identify the intended target compared to other angles. This swift identification allows for immediate localization and tracking through positioning algorithms. As a result, even if the target object is subsequently occluded, its trajectory allows the system to determine its continued presence within the area, thereby maintaining the counting accuracy. Secondly, as the original waiting area is initially devoid of individuals, instances might arise where individuals enter the area concurrently, leading to situations where their positions are staggered in the captured image. This can result in the target objects being localized as they enter the waiting area, enabling tracking even if the objects become occluded. Since each target object has already been localized and has not left the area defined by the LOI, the counting result remains unchanged. This experiment demonstrates that when the overall occluded area of the target objects is less than 30%, our counting system achieves an accuracy of nearly 100% across most scenarios.

5.2.3. Response Time

We conducted tests on the counting reaction time of the host system, and the results are presented in Table 5, which shows the frames per second (FPS) achieved during counting execution by the host system. The FPS represents the speed at which the video is played. From Table 5, it can be observed that as the occlusion becomes more pronounced, FPS values are higher. However, correspondingly, the counting accuracy also decreases. Further investigation reveals that, in formations with more frequent occlusions, the recognition process entails fewer steps involving identification and label assignment, resulting in a shorter computation time. Regarding the FPS performance, the formations with higher occlusion levels require fewer computational resources due to the reduced number of tracked objects, thus yielding higher FPS values.
Additionally, Table 5 demonstrates that the variation in the number of individuals within formations does not significantly impact the computation time or the FPS. Consequently, it is not feasible to directly compare the image computation time and the FPS across formations with different numbers of individuals. Such a comparison can only be made under identical conditions of individual counts, allowing us to comprehend the impacts of occlusion on the computation time and FPS through these two metrics.

5.3. Accuracy of Edge Computing

5.3.1. Effect of People Formations on the Accuracy

Based on Table 6, Table 7 and Table 8, for the first horizontal formation, situations with both three and five individuals do not encounter occlusion issues in this formation, resulting in the highest recognition accuracy. However, in the case of eight individuals, due to spatial limitations, occlusion occurs between the front and rear individuals, leading to a decline in the accuracy. The accuracy drops from 100% in the cases of three and five individuals in the horizontal formation to 63% when eight individuals are involved. In formations other than the vertical formation with five individuals shown in Figure 10, the accuracy drops significantly for cases with eight individuals due to the increased number of individuals, which causes more pronounced occlusion issues.

5.3.2. Effect of Occlusion on the Accuracy

The experimental assessment of the occlusion effects on the accuracy of an embedded development board is illustrated in Figure 10. The green line represents the recognition accuracy, while the yellow line signifies the occlusion proportion. The left y-axis corresponds to the recognition accuracy, whereas the right y-axis corresponds to the occlusion rate. The discernible influence of occlusion ratios induced by varying population scenarios and formations necessitates a certain threshold being reached before a perceptible impact is manifested on the technological outcomes.
The graphical representation illustrates that, under most circumstances, there is a significant probability of observing an impact on the counting accuracy when the occlusion within the imaged targets exceeds a range of 20% to 50%. This phenomenon can be attributed to two plausible explanations. Firstly, within these formations, specific angles of the target object facilitate rapid recognition by the image model from other angles. This accelerated recognition prompts immediate localization and tracking through positioning algorithms, ensuring that the counting accuracy is maintained, even when the target object is subsequently occluded. Secondly, the initial absence of individuals within the waiting zone can lead to a scenario where individuals simultaneously enter the area, inducing a temporal misalignment. This misalignment can result in pre-identification of the target object’s position upon entry into the waiting area. Consequently, subsequent occlusion of the target object within the identified region does not alter the count, as the target’s position is established and remains within the defined LOI boundary. Furthermore, due to the inherent computational limitations of embedded development boards relative to more powerful computational platforms, the processing capacity available for tracking is constrained. This constraint augments the likelihood of losing track of an object’s location during tracking.

5.3.3. Response Time

We conducted tests to measure the counting response time for individual devices, and the results are presented in Table 9. These show the required FPS for counting using a single development board. The FPS represents the video playback speed during this process. According to Table 9, it is evident that as the severity of occlusion increases in various formations, the video processing time becomes shorter, and the FPS becomes higher. However, this improvement in the processing time comes at the cost of a decreased counting accuracy. This observation can be attributed to the fact that formations with more frequent occlusions require fewer recognition and ID-labeling actions due to the obscured targets. As a result, they demand less time for subsequent tracking and counting, yielding counts that are closer to the actual number of individuals. Regarding the FPS performance, formations with greater occlusion tend to exhibit reduced target tracking, leading to a lower number of tracked targets.

6. Conclusions

This research utilized an image model trained on MobileNet for person recognition and employed the SSD object detection algorithm for target localization. To calculate the number of people waiting for the elevator and the number of people inside the elevator, we combined the LOI and ROI methods and utilized the centroid-tracking multi-target tracking algorithm. In a four-floor building, Nvidia Jetson Nano development boards were installed at each floor’s elevator entrance and connected to cameras to compute the number of people waiting for the elevator and the number of people inside the elevator on the development board. The calculation results were sent back to the backend database via Wi-Fi and presented to the people about to use the elevator through a mobile interface and large screens, enabling them to decide whether to wait or take the elevator. According to the test results, in the absence of an occlusion, our system achieves an accuracy of 100% in terms of counting the number of people waiting for the elevator under different occupancy conditions. In the presence of an occlusion, using the vertical formation as the reference, the accuracy is 55.33%. Applying our recognition method to the embedded development board yielded a counting accuracy of 100% in most cases.
In the future, we plan to integrate this method with elevator-scheduling algorithms, utilize the obtained people-counting results to estimate the waiting time on each floor, and optimize the order of elevator transportation to complete the people flow within the building in the shortest time period. The scalability will be investigated as well. Furthermore, energy efficiency has always been a concern, as elevators consume significant energy during their operation. If algorithms can be utilized to minimize power consumption during each transport, this will greatly contribute to energy savings. Additionally, this study also addressed the impact of occlusion on counting accuracy and will continue to improve the algorithm to minimize counting errors caused via occlusion.

Author Contributions

Conceptualization, T.-C.S. and E.T.-H.C.; methodology, T.-C.S. and E.T.-H.C.; software, T.-C.S.; validation, T.-C.S. and E.T.-H.C.; investigation, T.-C.S.; resources, E.T.-H.C.; data curation, T.-C.S.; writing—original draft preparation, E.T.-H.C.; writing—review and editing, E.T.-H.C.; visualization, T.-C.S.; supervision, E.T.-H.C.; project administration, E.T.-H.C.; funding acquisition, E.T.-H.C. All authors have read and agreed to the published version of the manuscript.

Funding

This research received no external funding.

Informed Consent Statement

Informed consent was obtained from all subjects involved in this study.

Data Availability Statement

Data are available upon request.

Acknowledgments

We would like to express our gratitude to Hua-Yu Li, Yu-Yun Yeh, Chin-Wei Hou, Chang-Yu Lin, Kai-Ti Chang, Yu-Hung Liu, Shun-Yi Hsu, Chien-Hung Lin, and Che-Yu Wu for their assistance with conducting the experimental tests. We extend our thanks to Yi-Zhen Liao for providing continuous encouragement during the paper revision process, which motivated us to face challenges with greater determination. We also appreciate the design contributions to the interface by Tsu-Chi Shen and Wan-Ting Lin. Lastly, we acknowledge ChatGPT for its invaluable contribution to the rectification of grammatical errors in the English manuscript.

Conflicts of Interest

The authors declare no conflict of interest.

References

  1. Fujino, A.; Tobita, T.; Segawa, K.; Yoneda, K.; Togawa, A. An elevator group control system with floor-attribute control method and system optimization using genetic algorithms. IEEE Trans. Ind. Electron. 1997, 44, 546–552. [Google Scholar] [CrossRef]
  2. Vodopija, A.; Stork, J. Thomas Bartz-Beielstein, and Bogdan Filipič. Elevator group control as a constrained multiobjective optimization problem. Appl. Soft Comput. 2022, 115, 108277. [Google Scholar] [CrossRef]
  3. Yamauchi, T.; Ide, R.; Sugawara, T. Fair and effective elevator car dispatching method in elevator group control system using cameras. Procedia Comput. Sci. 2019, 159, 455–464. [Google Scholar] [CrossRef]
  4. Yang, Z.; Qi, G.; Bao, R. Indoor regional people counting method based on bi-motion-model-framework using uwb radar. IEEE Geosci. Remote Sens. Lett. 2022, 19, 1–5. [Google Scholar] [CrossRef]
  5. Hashimoto, M.; Tsuji, A.; Nishio, A.; Takahashi, K. Laser-based tracking of groups of people with sudden changes in motion. In Proceedings of the 2015 IEEE International Conference on Industrial Technology (ICIT), Seville, Spain, 17–19 March 2015; pp. 315–320. [Google Scholar]
  6. Kouyoumdjieva, S.T.; Danielis, P.; Karlsson, G. Survey of non-image-based approaches for counting people. IEEE Commun. Surv. Tutor. 2020, 22, 1305–1336. [Google Scholar] [CrossRef]
  7. Cao, K.; Liu, Y.; Meng, G.; Sun, Q. An overview on edge computing research. IEEE Access 2020, 8, 85714–85728. [Google Scholar] [CrossRef]
  8. Mansouri, Y.; Babar, M.A. A review of edge computing: Features and resource virtualization. J. Parallel Distrib. Comput. 2021, 150, 155–183. [Google Scholar] [CrossRef]
  9. Li, X.; Yang, Y.; Xu, Y.; Wang, C.; Li, L. Crowd Abnormal Behavior Detection Combining Movement and Emotion Descriptors; Association for Computing Machinery: New York, NY, USA, 2020. [Google Scholar]
  10. Li, M.; Zhang, Z.; Huang, K.; Tan, T. Estimating the number of people in crowded scenes by mid based foreground segmentation and head-shoulder detection. In Proceedings of the 2008 19th International Conference on Pattern Recognition, Tampa, FL, USA, 8–11 December 2008; pp. 1–4. [Google Scholar]
  11. Akbar, N.; Djamal, E.C. Crowd counting using region convolutional neural networks. In Proceedings of the 2021 8th International Conference on Electrical Engineering, Computer Science and Informatics (EECSI), Semarang, Indonesia, 20–21 October 2021; pp. 359–364. [Google Scholar]
  12. Ali, I.; Dailey, M.N. Multiple human tracking in high-density crowds. Image Vis. Comput. 2012, 30, 966–977. [Google Scholar] [CrossRef]
  13. Pham, N.T.; Leman, K.; Zhang, J.; Pek, I. Two-stage unattended object detection method with proposals. In Proceedings of the 2017 IEEE 2nd International Conference on Signal and Image Processing (ICSIP), Singapore, 4–6 August 2017; pp. 1–4. [Google Scholar]
  14. Le, M.C.; Le, M.; Duong, M. Vision-based people counting for attendance monitoring system. In Proceedings of the 2020 5th International Conference on Green Technology and Sustainable Development (GTSD), Ho Chi Minh City, Vietnam, 27–28 November 2020; pp. 349–352. [Google Scholar]
  15. Ma, Z.; Chan, A.B. Crossing the line: Crowd counting by integer programming with local features. In Proceedings of the 2013 IEEE Conference on Computer Vision and Pattern Recognition, Portland, OR, USA, 23–28 June 2013; pp. 2539–2546. [Google Scholar]
  16. Cho, S.I.; Kang, S. Real-time people counting system for customer movement analysis. IEEE Access 2018, 6, 55264–55272. [Google Scholar] [CrossRef]
  17. Barandiaran, J.; Murguia, B.; Boto, F. Real-time people counting using multiple lines. In Proceedings of the 2008 Ninth International Workshop on Image Analysis for Multimedia Interactive Services, Klagenfurt, Austria, 7–9 May 2008; pp. 159–162. [Google Scholar]
  18. Liu, W.; Salzmann, M.; Fua, P. Counting people by estimating people flows. IEEE Trans. Pattern Anal. Mach. Intell. 2022, 44, 8151–8166. [Google Scholar] [CrossRef] [PubMed]
  19. Wang, Y.; Zhang, W.; Liu, Y.; Zhu, J. Multi-density map fusion network for crowd counting. Neurocomputing 2020, 397, 31–38. [Google Scholar] [CrossRef]
  20. Chen, J.; Xiu, S.; Chen, X.; Guo, H.; Xie, X. Flounder-net: An efficient cnn for crowd counting by aerial photography. Neurocomputing 2021, 420, 82–89. [Google Scholar] [CrossRef]
  21. Wang, C.; Zhang, H.; Yang, L.; Liu, S.; Cao, X. Deep People Counting in Extremely Dense Crowds; Association for Computing Machinery: New York, NY, USA, 2015. [Google Scholar]
  22. Liu, W.; Anguelov, D.; Erhan, D.; Szegedy, C.; Reed, S.; Fu, C.; Berg, A.C. SSD: Single shot MultiBox detector. In Computer Vision—ECCV 2016; Springer International Publishing: Berlin, Germany, 2016; pp. 21–37. [Google Scholar]
  23. Magalhães, S.A.; Castro, L.; Moreira, G.; Santos, F.N.d.; Cunha, M.; Dias, J.; Moreira, A.P. Evaluating the single-shot multibox detector and yolo deep learning models for the detection of tomatoes in a greenhouse. Sensors 2021, 21, 3569. [Google Scholar] [CrossRef] [PubMed]
  24. Mockuphone. Available online: https://mockuphone.com/ (accessed on 25 August 2022).
Figure 1. User interface display.
Futureinternet 15 00337 g001
Figure 2. System architecture.
Futureinternet 15 00337 g002
Figure 3. LOI boundary.
Futureinternet 15 00337 g003
Figure 4. Relationship between the accuracy and the occlusion rate under different conditions.
Futureinternet 15 00337 g004
Figure 5. Five-person diagonal line formation.
Futureinternet 15 00337 g005
Figure 6. Five-person criss-cross formation.
Futureinternet 15 00337 g006
Figure 7. Five-person horizontal formation.
Futureinternet 15 00337 g007
Figure 8. Five-person vertical formation.
Futureinternet 15 00337 g008
Figure 9. Camera angle and waiting area of an elevator.
Futureinternet 15 00337 g009
Figure 10. Relationship between the accuracy and the occlusion rate under different conditions.
Futureinternet 15 00337 g010
Table 1. A comparison of people-counting methods.
AuthorsMain ObjectivesMethods
AccuracyReal-TimeLow
Computation
Object
Tracking
Feature
Extraction
Xiao Li et al. [9]V V
Min Li et al. [10]VV V
Naufal Akbar et al. [11] VV V
Irshad Ali et al. [12]V V
Nam Trung Pham. et al. [13]VV VV
Zheng Ma et al. [15]VV V
Sung In Cho. et al. [17]VV VV
Javier Barandiaran et al. [19] VVV
Yongjie Wang et al. [20]V V
Jingyu Chen et al. [21] VV V
OursVVVVV
Table 2. Accuracy when counting three people sequentially entering the elevator waiting area.
FormationHorizontalVerticalDiagonalCriss-Cross
Number
of People in
Waiting Area
1100%100%100%100%
2100%100%100%100%
3100%100%67%100%
Table 3. Accuracy when counting five people sequentially entering the elevator waiting area.
FormationHorizontalVerticalDiagonalCriss-Cross
Number
of People in
Waiting Area
1100%100%100%100%
2100%100%100%100%
3100%89%100%100%
4100%75%100%100%
5100%60%100%100%
Table 4. Accuracy when counting eight people sequentially entering the elevator waiting area.
FormationHorizontalVerticalDiagonalCriss-Cross
Number
of People in
Waiting Area
1100%100%100%100%
2100%100%100%100%
367%89%100%100%
475%75%100%75%
580%60%80%60%
683%67%83%67%
786%71%86%71%
875%75%75%75%
Table 5. FPS required for people counting on a server.
Number of PeopleFormationFPS
3Horizontal15.91
3Vertical24.90
3Diagonal16.75
3Criss-Cross24.15
5Horizontal15.45
5Vertical24.98
5Diagonal17.24
5Criss-Cross16.91
8Horizontal19.69
8Vertical22.33
8Diagonal18.72
8Criss-Cross26.60
Table 6. Accuracy when counting three people sequentially entering the elevator waiting area.
FormationHorizontalVerticalDiagonalCriss-Cross
Number
of People in
Waiting Area
1100%100%100%100%
2100%100%100%100%
3100%89%89%100%
Table 7. Accuracy when counting five people sequentially entering the elevator waiting area.
FormationHorizontalVerticalDiagonalCriss-Cross
Number
of People in
Waiting Area
1100%100%100%100%
2100%50%100%100%
3100%33%100%100%
4100%25%100%100%
5100%20%100%80%
Table 8. Accuracy when counting eight people sequentially entering the elevator waiting area.
FormationHorizontalVerticalDiagonalCriss-Cross
Number
of People in
Waiting Area
1100%100%100%100%
2100%100%100%100%
3100%100%100%100%
450%100%100%100%
540%80%100%80%
667%67%83%83%
757%71%86%86%
863%63%75%88%
Table 9. FPS required for people counting on a single development board.
Number of PeopleFormationFPS
3Horizontal5.98
3Vertical6.85
3Diagonal6.57
3Criss-Cross6.58
5Horizontal4.11
5Vertical5.70
5Diagonal5.18
5Criss-Cross5.16
8Horizontal4.65
8Vertical5.93
8Diagonal4.26
8Criss-Cross5.08
Disclaimer/Publisher’s Note: The statements, opinions and data contained in all publications are solely those of the individual author(s) and contributor(s) and not of MDPI and/or the editor(s). MDPI and/or the editor(s) disclaim responsibility for any injury to people or property resulting from any ideas, methods, instructions or products referred to in the content.

