1. Introduction
1.1. Extended Reality
The emergence of extended reality (XR) technologies, including augmented reality (AR), virtual reality (VR) and mixed reality (MR) provide many new opportunities that started to be exploited in the medical field in the following areas:
Diagnostic data visualization [
1]
Examination environment customization [
6]
The first appearance of VR technology can be traced back to the 1980s, but the devices of that time were still expensive and inconvenient for users due to the display and the weight of the device. In recent years, leaps and bounds have been made in this area as well. The new generation of head-mounted devices (HMD) have taken a big step to be able to meet the technical and ergonomical requirements that are essential for everyday use in routine pathology [
7,
8]. Such properties include:
In our research, we focused on the application of virtual reality technology. The reason behind this decision, that from the 3 extended reality subcategories, only the wired VR headsets has good enough display resolution.
1.2. Extended Reality in Digital Pathology
Pathologists have been making diagnoses using digital microscopes and digitized samples for decades. In the 1980s, a new term appeared in this field, telepathology. This means remote pathological diagnosis and consultation, which are done with the help of digital image transmission over a network [
9]. The emergence of digital pathology and the development of new types of examination software, renewed pathology, and enabled a new and efficient digital workflow. With the help of a digital workflow the patient can receive a faster and more accurate diagnosis, thereby increasing the chance of recovery [
10]. An example of an implementation of a digital workflow used in pathology can be seen in the publication of H. Dawson [
10].
Since the spread of digital pathology [
11], diagnostic pathology activity is carried out with software capable of displaying digitized samples. Today, pathological software supporting 2D visualization are widespread, but solutions that use virtual reality or augmented reality are becoming more and more common. Today’s pathology software solutions provide the doctor with the opportunity to examine a specific part of the sample even at the highest magnification level, to place different annotation markers, or to make voice notes. These functions and many other additional functionalities enable the doctor to make the most accurate diagnosis, in the most comfortable environment possible.
The rise of technologies such as extended reality, which includes virtual reality, augmented reality and mixed reality may revolutionize digital pathology in the future. These tools not only enable more advanced data visualization, but with these visualization technologies the doctors can examine digitalized samples from a new perspective.
In addition to the advantages provided by the use of XR devices, it is also necessary to mention the limitations that are currently hindering the wide spread of this visualization technology. Examples of such limitations are: motion sickness [
12], computational limitations of XR devices, the learning curve of using XR devices, and the lack of easy-to-use user interfaces in extended reality. Motion sickness is perhaps one of the most serious obstacles to the spread of XR technology. When motion sickness exists, the user feels uncomfortable in the virtual environment, as a result of which the user experience deteriorates. In some cases, motion sickness causes nausea and dizziness [
13].
3D visualization has enabled great progress within digital pathology. With this technology, the doctor can examine the digitized serial sections in their real, 3-dimensional shape, so the doctor has the opportunity to examine the samples from a new perspective [
14,
15].
Nowadays, solutions using XR technology focus on clarifying, speeding up and further developing the current pathology workflow. There is a lot of research into how XR technology could be used in digital pathology [
2,
9,
15,
16]. Current solutions show that extended reality may be useful in the future in areas such as medical student education [
16] or telepathology [
17]. On the other hand, in order to be able to use the technology in routine diagnostics, a lot of development is still needed. Such development includes, for example, the design and implementation of the functionalities that the researcher or doctor will use in the virtual environment, increasing the resolution of the display, and making the use of the XR device more comfortable.
The basic principles laid down at the time of the introduction of digital pathology have not lost any of their importance or actuality in the nearly 20 years since their introduction.
1.3. Visualization Techniques
Polygon-based graphic display builds 3D objects from smaller building blocks called polygons, in other words, triangles. Each triangle used for this visualization is defined by the coordinates of the triangle’s vertices. Using this type of display technique, the more polygons used to display a 3D object, the more detailed the result will be [
18]. The polygon-based visualization has three basic classes: faces, edges, and vertices [
19]. When we use a polygon-based display during the 3D visualization, there are 4 basic operations with which we can shape the 3D object. These are: extrusion, subdividing, bevels and shaping.
Although the voxel-based display lags behind the polygon-based display solutions used today in terms of performance [
20], it still contains possibilities that cannot be ignored. Such possibilities include making the 3D display volumetric, and the scalable resolution by changing the number of voxels. Another big advantage is that if voxels of the same size are used during the entire duration of the display, then in areas where precise distance, area and volume measurements are important, this can easily be done using voxels [
21]. The basis of voxel-based visualization is that a 3D object is not described with polygons, instead it works with so-called voxels. Voxels can be considered as the equivalent of pixels extended in 3 dimensions, which have 3 main parameters: position, size and colour [
21].
1.4. Graphics Engines
Functions provided by the graphics engine may include 2D or 3D graphics rendering, simulation of physical forces, collision detection, sound handling, program code and library management, running animations or network management. Currently, on the market, the 3 most used graphics engines are Unreal Engine, Unity and Godot.
Unreal Engine: One of the main advantages of the Unreal Engine graphics engine is its high graphics quality. The graphics engine has a number of functionalities integrated into it that allow to the user to develop high quality software. Examples of such functionalities include physics simulations and lighting. For the purposes of this article, a big advantage of the Unreal Engine graphics engine is that it fully supports development for XR platforms. The main coding language of the Unreal Engine is C++, but it also supports blueprint visual scripting, which allows less experienced programmers to work with the graphics engine. One of the weaknesses of the graphics engine is its complex interface, which can result a steep learning curve for new users. Another weakness is the system requirements of the graphics engine if all functionality is to be exploited.
Unity: One of the greatest advantages of the Unity graphics engine is its cross-platform nature, which allows the software to be exported to more than 25 platforms, including the web, XR platforms and desktop. The user interface of the Unity graphics engine is easy to use and intuitive. This, together with the fact that the graphics engine’s code language is C#, results in a less steep learning curve than was the case with the Unreal Engine. One of the drawbacks of the Unity graphics engine is that it lags behind, for example, the previously mentioned Unreal Engine in terms of graphics quality.
Godot: Godot is an open source graphics engine that allows users to tailor its operation to their needs. The Godot engine (like the Unreal Engine and Unity) supports the development of 2D and 3D software. A big advantage of the engine is that it supports several programming languages, such as C#, C++, or its own high level programming script language. Thanks to its open source code, the Godot graphics engine is completely free and has great support for third-party developers. The user interface of the graphics engine is clean and easy to use. The Godot graphics engine (similar to the previous two graphics engines) supports software development for XR devices. As for the disadvantages of the engine, the quality of the graphics display is not as good as the two previously mentioned graphics engines.
During our research, we chose the Godot graphics engine for the following reasons: source code-level customization, completely free, support for many programming languages, support for XR devices.
In the use of graphics engines, two major trends can be distinguished nowadays. It can be said that the majority of graphic engines offer the user some high-level programming language (Java, C#, Python). According to the second trend, the graphics engines used today strive to ensure the so-called cross-platform export for developers. This solution greatly facilitates the work of developers, as they can publish their software on different platforms by keeping the same codebase [
22].
1.5. Whole Slide Images (WSI)
During the production of digital pathology samples, the scanner device takes several high-resolution small images, which are joined together with a 2–5% of overlap. This procedure producing the high-resolution digitized sample, which includes the entire pathological sample that was originally on the glass plate. During the creation of WSI samples it is common to work with high resolution. It happens often that a WSI sample can have a resolution up to 100,000 pixel × 100,000 pixel [
23,
24]. Digitization has 4 essential parts, which are as follows: image acquisition, data storage, editing, and display [
25,
26,
27,
28].
Different image storage file formats are currently available to users and come from different manufacturers. The formats define how are the medical images stored together with their metadata.
1.6. Problem Definition and Motivation
Visualization in digital pathology is key to making the right diagnosis. Our research focused on exploiting the visualization potential of 3D and VR technology. The aim of our research was to build a 3D tomogram in virtual space using 2D samples, which are currently used in digital pathology, and to provide the functionalities that are essential for the digital evaluation of medical samples. The use of virtual reality was a fundamental objective of our work, as this technology makes the visualization more immersive for the user. Our goal is to build on the principles laid down in the past and present a possible solution to the basic premise of the use of image, text, sound, and other types of data using virtual reality [
29].
3. Results
During our research, we used the Godot graphics engine to implement the 3D visualization [
30]. As shown in
Figure 1 we designed our 3-dimensional display solution so that it is not limited to digitized pathological samples as an input source, but can display DICOM standard-type medical images from any medical imaging modality and can visualize them in 3D with the help of voxels or with polygons.
Regarding the structure of the system, two major parts can be separated. The first is the processing of the data, while the second is the 3D visualization. In the data processing stage the system reads the metadata from the DICOM files, that is necessary to create a 3D reconstruction of the medical data. Such data is, for example, the width and height of the sample. In the 3D visualization stage, the software reconstructs the medical sample in a previously created 3D VR environment, based on the processed data. An important detail regarding the visualization is that our system performs work processes in parallel on several threads. With this solution, we were able to ensure that there were no lags when using VR even when performing tasks with a high computing requirements. The various functions described in the paper are available to the user only after at least one medical sample has been loaded by the user.
3.1. 3D Voxel-Based Visualization
To be able to display the 3D imaging of the selected digitized medical serial section in the virtual reality, we have developed a formula, which is suitable not only pathological samples but also using any DICOM-based medical image file as input. With this solution, we can display the digital serial sections to the doctor in their original 3D form.
We set up mathematical relationships to be able to determine the appropriate coordinates of the current vertices of each voxel in the 3-dimensional space. The following equation gives the 3D coordinates of the first vertex of the first voxel of a series section reconstructed in 3 dimensions on the
x,
y and
z plane.
The notations in the equation mean the following:
: A 3-element matrix with 1 row and 3 columns. These individual values represent the 3D position of a given vertex of a given voxel.
x: The given width coordinate of the medical image.
y: The given height coordinate of the medical image file.
z: The index of the medical image to be displayed within the serial section.
: A matrix with 3 rows and 8 columns, which can be used to algorithmically determine the vertices of the voxels. The Vo matrix looks like this:
: The matrix determining the size of the voxels. This can be used to specify the size of the serial section to be displayed within virtual reality. The matrix structure is as follows:
By expanding Equation (1), we can represent an entire serial section in voxel-based 3D, and determine the 3D coordinates of all vertices of all voxels. In this case, the number of elements in the series section, also known as the number of samples in the serial section, must be taken into account during the calculation. This is represented by the following equation:
In the case of the equation, the following restrictions apply to the variables x, y, z, l:
x [1 W],
y [1 H],
z [1 D],
l [1 8],
where:
W: Width of digitized pathology sample in pixel.
H: The height of the digitized pathological sample in pixel.
D: The number of samples in the digitized pathological serial section.
In this case, the applied variables , and are the same as their counterparts used in Equation (1).
As
Figure 2 shows, by using the voxel-based solution, we were able to reconstruct the digitized pathological tissue sample in a 3D virtual reality environment. Using Equation (2) after performing the calculations related to the display, we got too low values for the frame per second concerns them. From the point of view of the usability of our solution, we considered it important to optimize it, because the frame per second is reduced even further if the user wants to display a serial section consisting of several samples, or if the user’s hardware has limited computing resources. The result of the optimization can be seen in
Section 3.3.
Optimization of 3D Voxel Based Visualization
Although the voxel-based 3D display solution described in the previous paragraph is functional, in terms of efficiency, it is not capable of displaying an entire medical serial section (which can consist of hundreds of samples) in the virtual space. For this reason, we have created a performance optimization method. This method can be used to reduce the number of voxel coordinate calculations used for visualization. This reduces the hardware resource requirements of the software. For more information about our first implementation of the voxel coordinate optimization, see the following paper [
20]. In our optimization, we divided the displayed voxels into groups, which groups are based on the spatial position of the voxels about each other. The division of the groups and the basic optimization methodology are shown in
Figure 3.
The markings shown in
Figure 3 are as follows:
v1, v2, v3, v4, v5, v6, v7 and v8: The different vertices of the voxels.
A: This group always contains only 1 voxel, always the upper left voxel of the displayed pattern.
B: Those voxels that are located in the first column of the displayed 3D object belong to group B. In this case, as shown in
Figure 3 half of the coordinates to be calculated during the display can be saved, because the four upper vertices of the current voxel can be determined from the previous voxel.
C: The voxels that are located in the first row of the displayed 3D object belong to this group. As shown in
Figure 3, in this case as well (similarly to group B), half of the voxel coordinates to be calculated can be saved.
D: The voxels that come from the first sample of the serial section belong to this group. If a voxel has neighboring voxels, 3/4 of the voxel coordinates to be calculated can be saved as circled in
Figure 3.
E: The voxels that are located in the first row regarding the z axis. As shown in
Figure 3, we can save at least half of the voxel coordinate calculations. However, the voxels, that are located in group E are also divided into subcategories such as: A, B, C, D.
3.2. Star-Based 3D Visualization
It is easy to see that if we want to display a complete pathological serial section in 3 dimensions using voxels in such a way that we want to keep the constraint that 1 pixel corresponds to 1 voxel in the 3-dimensional space, we will quickly reach the limits of the available hardware resources, memory, and regarding computing capacity. To overcome this difficulty, we designed and developed a solution based on triangles. The following paragraph focuses on the presentation of this solution.
With the newly developed triangle-based solution, we are able to display complete medical series sections without any level of interruption, and by applying our solution, users are able to perform the display even on devices with weaker hardware components.
The basis of our solution is to build the object to be displayed in 3-dimension layer by layer. If the original DICOM medical samples are properly transformed into each other, the desired 3-dimensional structure will be built after matching the 3-dimensional layers we generate. With this solution, we were able to achieve more optimal results in terms of performance. The results of the star-based solution can also be seen in
Figure 4. Each layer generated by our solution consists of several sub-layers, these sub-layers allow the user to see it on the appropriate cutting plane from every viewing angle.
As shown in
Figure 4, there were serious differences between the results of the two display techniques. In the case of the voxel-based solution, a kind of distortion is visible, which results from the use of voxels. The reason for the appearance of the distortion is that when the user actually leans into the displayed 3D object in virtual reality, the user’s camera starts cutting the voxels, but due to the viewing angle, a sharp border area is formed between the individual layers due to the cutting of the side faces of the voxels. This distortion should not be confused with the lines that can be seen inside the 3D objects in both examples. These lines result from the coloring of the digitized pathological serial sections because their coloring was not done uniformly.
For the star-based solution, it should be mentioned that if we want to display the 3D pathological serial section at high resolution, there may be a frame rate decrease if the serial section is built from a large amount of samples. This is a limitation of the current solution that we would like to improve in the future.
3.3. Compare the 3 Visualization Solutions Regarding Performance
After completing of the voxel-based development phase, we tested the relative performance of the two voxel-based solutions by performing visualizations in a test environment. According to our expectations, the optimized implementation should have given better results in terms of frame per second. In the case of the tests, we used the same digitized series section for every display method, and each test was run 10 times, and then the average of the results was displayed in
Figure 5 and
Figure 6. Regarding the performed tests, it should be mentioned that the so-called vertical sync (Vsync) setting option within the graphics engine was turned off for the duration of their execution. We did this because the vertical sync technique limits the frame per second of the software to the display frequency of the monitor used for display, but we wanted to see the actual performance of our solutions during the tests.
The tests were performed on hardware with the following specifications:
CPU: 11th Gen Intel(R) Core(TM) 11900 KF @ 3.50 GHz
RAM: 64 GB
GPU: NVIDIA GeForce RTX 3090
SSD: Samsung SSD 980 PRO 2 TB
3.3.1. Compare the 3 Visualization Solution Regarding Computational Resource Utilization
The results regarding the test of the computer resource utilization can be seen in
Figure 5. If we compare only the two voxel-based solutions, we can see that, the optimized voxel-based solution uses more memory to display digitized tissue samples. Based on the tests, it also turns out that the optimization has no significant effect on CPU usage, but a smaller decrease in the utilization of the video card was shown after the tests. If we consider the star-based solution, we can see that it consumes less resources, except for CPU usage.
3.3.2. Compare the 3 Visualization Solution Regarding Visualization Performance
The results regarding the test of the visualization performance of the 3 introduced solutions can be seen in
Figure 6.
In addition to the test results, it can be seen that the frame rate increased by 30.1% with the use of the optimized voxel solution compared to the original voxel solution. If our star based solution is also taken into account, we can see that it performs better than the two voxel-based solutions regarding the loading time and the frame rate. Regarding
Figure 6, it should be noted that the loading time is the lower the better, while the frame rate is the higher the better.
3.4. Zooming in 3D Environment
A key part of the daily work of pathologists is the examination of digitized serial sections. In order to be able to perform this operation with adequate efficiency, the magnification operation is essential. With the help of the so called zooming functionality [
15] a more detailed picture with higher magnification level can be visualized. We have implemented two different 3D VR zooming solutions. With the first one the user is able to zoom on individual samples, and with the second one the user can zoom on the whole 3D object, so their usage is complementary to each other. The first solution is called SlideZoom, while the second is called SerialZoom. Both functions are included in the PathoVR software, which combines the functionalities presented in the paper in one software solution. In the case of the first solution, we only zoom in on a certain slice of the medical serial section, resulting a single, more detailed image. On the other hand, in the second solution, we zoom in on the pathological model reconstructed in 3D, resulting a new 3D model.
3.4.1. The SlideZoom Solution
Nowadays, the use of 2D image viewing software solutions is widespread in digital medicine. The reason for this is ease of handling, speed, and the fact that the user can examine the digitized sample even at the level of the nucleus. In order to be able to provide the mentioned benefits for the doctor in virtual reality, we designed and developed a solution that combines the new possibilities inherent in 3D visualization with the speed and detail of 2D visualization.
As we can see in
Figure 7, with this solution, the user is able to examine the digitized medical sample displayed in 3D at the same time, as well as zoom in on each sample. Another advantage of this solution is that the user can make changes to the displayed 3D model, while the result of the 2D zoom can be modified independently One of the great advantages of the SlideZoom functionality is that the required loading time and computing capacity does not depend on the size of the medical serial section. As a result, the user can always get a 2D zoomed image quickly from one of the sample inside a serial section by using SlideZoom.
3.4.2. The SerialZoom Solution
In our implementation, the user can select any point of the displayed 3D serial section using a laser pointer within the VR world. The selected point will be the center of the zoom. In order for the magnification to be functional, we wrote the appropriate conversion equations between the individual magnification levels of the medical sample. Equations (3)–(6) are implemented pixel-to-pixel between individual magnification levels.
In SerialZoom, the resolution of the displayed 3-dimensional sample does not change but shows the doctor a smaller region of the original complete medical image. In order to be able to do this, we need the exact coordinate where the user zoomed in on the displayed sample in virtual reality.
The equations used during the user’s first zoom are (3) and (4). In this case, the magnification coordinates must be recalculated from the displayed sample with a lower resolution to the whole slide image. However, after the first zoom is performed by the user, Equations (5) and (6) are needed so that we can maintain sufficient accuracy through several zoom steps.
The following notations were used in the equations:
: The x coordinate of the zoom point converted to the original whole slide image resolution.
: The y coordinate of the zoom point converted to the original whole slide image resolution.
: An array storing the x-coordinates of zooms performed by the user. These coordinates refer to the displayed lower-resolution samples.
: An array storing the y-coordinates of zooms performed by the user. These coordinates refer to the displayed, lower-resolution samples.
: The number of zooms performed by the user.
: Magnitude of zoom performed.
: The x coordinate on which the user first performed the zoom.
: The y coordinate on which the user first performed the zoom.
m: Half of the height of the displayed sample in pixels.
s: Half of the width of the displayed sample in pixels.
: The ratio of the width of the original native resolution medical sample to the displayed sample. How it is calculated: The width of the native resolution sample divided by the width of the displayed sample.
: The ratio of the height of the original native resolution medical sample to the displayed sample. How it is calculated: The height of the native resolution sample divided by the height of the displayed sample.
The practical application of the equation provides the following result:
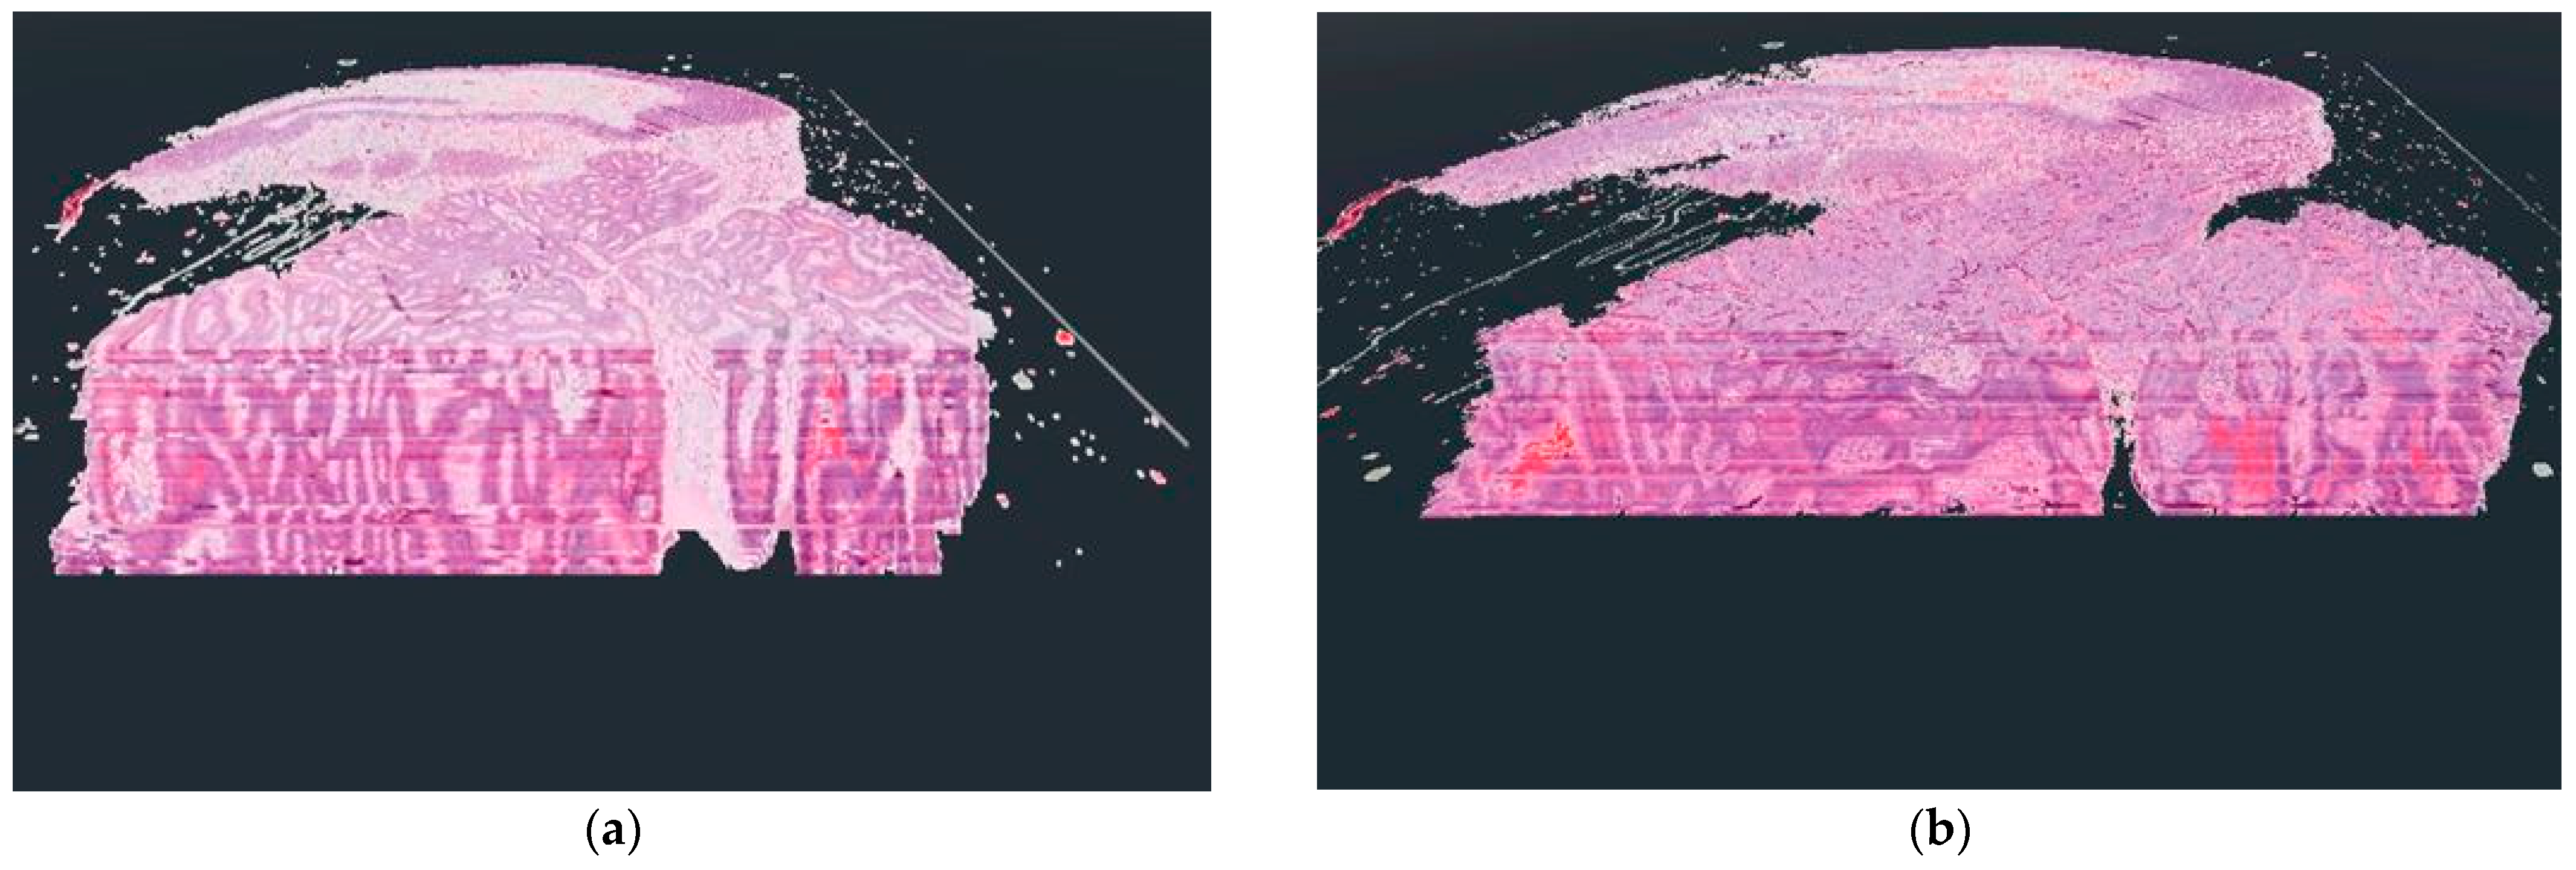
Red circles in
Figure 8 mark the area, where the user has used the SerialZoom functionality. The zooming results shown in the image follow one after the other, so the user must first perform a 10× magnification (which results image
Figure 8b), then with the next magnification performed, the user can see a 20× magnification image compared to the originally displayed sample (this can be seen on image
Figure 8c). In the case of SerialZoom, an important limitation is the size of the medical serial section. If the serial section consists of a large number of samples, the loading time may increase, which may affect the user experience.
3.5. Volumetric Measurement in 3D
A medical volumetric measurement is a three-dimensional measurement of the extent of a tissue part or organ. For more information on our first implementation of volumetric measurement, see the following paper [
31]. As a continuation of our research on this topic, we have further tested our implementation, the results of which are presented in this paragraph. In our research, we defined an equation that can determine the spatial extent of the area marked in virtual reality by the user, be it a polygon of any shape.
The elements in the equation have the following meanings:
i: Section element number of the digitized series currently being examined.
j: Number of the markers with which the user surrounded the area to be measured.
A: The area of the polygon delimited by the user.
P: The polygon bounded by markers placed by the user.
: The result of the volumetric measurement.
As you can see from Equation (7), our solution created for volumetric measurement performs the area measurement on each sample of the series section separately. When you are done with the last one, you get a spatial extension as a result.
In order to be able to test our implementation designed for volumetric measurement, we used basic 3-dimensional shapes. Two of these test cases can be seen in
Figure 9, For the volume calculation test on the cubic object, we obtained exactly the expected result of 1
. In the case of the triangle, our test showed that we did not get a 100% accurate result. Compared to the expected result of 2.598058
, we got 2.833732
, which is an error of 0.090711%.
4. Discussion
The basic idea of our research was to design a solution that would provide doctors and researchers with the opportunity to evaluate digitized pathology serial sections in a comfortable and customizable 3D environment. In order to make this evaluation as immersive as possible, we used virtual reality technology. Using VR technology, we were able to create a 3D environment that the doctor can share with colleagues to jointly evaluate the medical data displayed.
Our research had two goals. First, we have established equations that can be universally used for 3D visualization not only of digitized medical tissue samples used in pathology, but also of any digitized medical image data based on the DICOM standard. Based on
Section 3.3, it can be said that the star based solution gave the best results regarding the parameters that directly affect the user experience (loading time, frame rate), but it should be mentioned that voxel-based solutions also have their own advantages.
The second aim of our research was to use the visualization possibilities offered by VR technology. In the
Section 3.4 we have described the different zoom functions we have developed. This feature is also found in 2D visualization software used today, but in our case it has been implemented in 3D, virtual reality.
Based on the test results obtained during our research, further optimization solutions can be implemented in order to achieve even better results in the field of 3D visualization of digitized medical samples. The resolution of serial sections displayed in virtual reality must be further increased in the future in order to make the displayed 3D model and certain parts of the model suitable for making diagnostic decisions. Increasing the displayed resolution can be achieved by using technologies such as GPU programming.
Basically, with our research, we wanted to create a work environment that is comfortable for the pathologist, customizable, and has the most basic functionalities that the pathologist may need when evaluating a 3D serial section. The basic premise of our research is that in the future the pathologist will be able to evaluate tissue samples with the help of XR technologies more easily, faster and more precisely. In addition to the development results of our research, we also wanted to show with our paper that the technology is already there today, that image data generated in medicine can be displayed even in virtual reality. With our research we also wanted to show that virtual reality can provide an interdisciplinary environment that has no spatial limitations.
With our solution, it will be possible for doctors and researchers to share their medical data with each other in the 3D space provided by virtual reality. In the future, it will be possible for doctors from different fields of medicine to create a diagnosis together in a common virtual 3D environment by examining the same 3D sample. With this solution, the time needed to establish a diagnosis can be shortened, as physical barriers between doctors working on the same case can be eliminated. Of course, setting up a common virtual 3D lab environment has many requirements. Such requirements include secure data management between users, authentication, and low-latency data transmission.
In the course of our research, we have successfully developed a solution that can visualize medical samples stored in DICOM format in 3D and zoom in on either the displayed 3D model or on an element of the model. During our research, we have created a solution within the developed software that allows the user to perform volume measurements on a specific region of the displayed 3D model in a VR environment.
In the future, we would like to further develop the display solutions to be able to visualize different metadata for the samples together with the 3D serial section. According to our plans, in the next period, we will realize that our software can be used by several pathologists at the same time, thereby creating an opportunity to establish a common diagnosis. We will continue to research the possibilities of using XR technologies in medicine, and more narrowly within digital pathology. In the future, 3D VR visualization can be combined with other solutions already used in digital pathology, such as artificial intelligence, various computer-aided diagnosis (CAD) solutions, or image processing algorithms. In the future, we plan to perform user experience tests to determine the usability of the presented software. Based on the results of these tests we will be able to further improve the user interface of our solution.


