1. Introduction
The current COVID-19 pandemic has presented significant worldwide challenges, with millions of cases and fatalities reported to date [
1]. In response, governments and global health organizations have emphasized the importance of vaccination, social distancing, and mask usage to mitigate the spread of the virus [
2]. Airborne transmission, particularly in indoor spaces, poses a higher risk of viral exposure, leading to more severe illness and extended hospital stays [
3]. Timely diagnosis and effective management are crucial for increasing survival rates, including early detection during asymptomatic stages and proper containment measures [
4].
Besides the COVID-19 pandemic, infectious disease outbreaks pose significant challenges to public health systems worldwide, which can lead to increased morbidity and mortality. The recent COVID-19 pandemic highlighted the critical need for effective outbreak management and disease prevention strategies. Traditional methods of outbreak management often relied on retrospective data analysis and manual reporting, leading to delays in detecting and responding to emerging threats. To address these challenges, there is an increasing demand for innovative and data-driven approaches that can provide timely and accurate outbreak predictions. Therefore, because the traditional surveillance methods may not be agile enough to capture real-time data, leading to delays in recognizing the emergence of new infections, the implementation of necessary interventions, timely detection, and containment of outbreaks are essential to minimize the impact on public health.
Furthermore, the dynamic nature of infectious diseases requires continuous monitoring and surveillance to track their evolution and spread. Wearable Internet of Medical Things (IoMT) technologies offer a potential solution to address this challenge. These devices, such as smartwatches, wristbands, and other mobile-based gadgets, provide a means for continuous monitoring of individuals’ physiological and environmental data. They can capture vital signs, body temperature, respiratory patterns, and other relevant health metrics in real-time, offering a wealth of information for outbreak prediction and monitoring.
By leveraging the continuous data collection capabilities of wearable devices, public health authorities and healthcare professionals can gain valuable insights into population health trends and detect early signs of disease outbreaks. This continuous monitoring enables proactive measures, such as implementing targeted interventions, resource allocation, and contact tracing, to prevent further spread of infectious diseases.
The critical importance of accurate outbreak predictions cannot be overstated. Early detection allows for timely response measures, including quarantine protocols, travel restrictions, and vaccination campaigns. By deploying an autonomous outbreak prediction and monitoring platform, such as the framework proposed in this paper, public health officials can optimize resource allocation, identify at-risk populations, and implement evidence-based measures to control the spread of infectious diseases.
Therefore, the challenges in outbreak management and disease prevention necessitate a paradigm shift towards data-driven approaches that prioritize timely and accurate outbreak predictions. Wearable IoMT technologies play a pivotal role in this endeavor, as they offer real-time data collection and continuous monitoring, enabling public health authorities and healthcare professionals to take proactive measures that reduce the impact of infectious diseases on public health. To that effect, the proposed mPOC: Mobile Health (mHealth) Predictive Outbreak for COVID-19 framework offers a promising solution to address these challenges by leveraging wearable devices and integrating user-centric and public health data to provide an innovative and effective tool for outbreak prediction and monitoring.
This paper introduces the mPOC framework, which is an extension to the mDRS (mHealth Disaster Recovery System), previously presented in reference [
5]. While the mDRS focused on disaster recovery and post-disaster health management, it primarily addressed immediate response and recovery measures after a disaster or outbreak had already occurred. The mDRS played a crucial role in providing health services and support during emergencies, but its capabilities were limited to addressing the aftermath of an outbreak.
In contrast, the mPOC system was introduced to take outbreak management and disease prevention to the next level. It extends beyond disaster recovery to provide real-time outbreak prediction, continuous monitoring, and early warning capabilities. By leveraging the Internet of Medical Things (IoMT) and wearable devices, the mPOC system captures user-centric physiological data to gain valuable insights into an individual’s health status and response to outbreak situations. The mPOC mechanism is designed to address the need for timely diagnosis and effective management of pandemic-related illnesses on a public health scale. It incorporates two distinctive and collaborative approaches, namely, a bottom-up and top-down approaches.
- (1)
Bottom-up approach: This involved capturing user-centric physiological parameters (that will be discussed in
Section 3), which offers valuable insights into an individual’s well-being and response to outbreaks. Integrating these parameters into the mPOC system enables a comprehensive understanding of individuals’ health status, leading to the evaluation of the Deterioration Risk Index (DRI), which measures users’ medical risk levels. Concrete examples of data collection scenarios can facilitate personalized and timely outbreak predictions, thereby optimizing public health responses and ensuring individual well-being during infectious disease outbreaks. A bottom-up approach is used to collect and analyze user-centric data, including psychological factors, to assess and monitor individuals.
- (2)
Top-down approach: Simultaneously, the mPOC’s top-down approach involves transmission of information to and from the Outbreak Tracking Centre (OTC) and other public-health-related resources. The top-down approach complements the user-centric data obtained in the bottom-up approach, providing valuable insights from a broader perspective. Examples of the top-down data collection include:
Public Health Data—The algorithm receives real-time data on confirmed cases, outbreak trends, and demographic information from health authorities and healthcare institutions. Analyzing this data helps assess outbreak severity, identify high-risk regions, and allocate resources effectively.
OTC Information—The mPOC framework establishes a bi-directional connection with the OTC to transmit daily updates on outbreak progression, containment strategies, and healthcare capacities. This enables timely adjustments to predictions and response strategies.
Environmental Data—Integrating data from environmental sensors and weather databases provide insights into factors influencing disease transmission. For instance, monitoring air pollution, wind speed, and humidity levels aids in identifying potential hotspots for rapid outbreak spread.
Healthcare Infrastructure and Resource Availability—Data on hospital bed capacities and medical supplies contributes to effective outbreak response planning. Assessing available resources helps determine the healthcare system’s readiness and facilitates resource allocation.
Mobility and Transportation Data—Analyzing data from transportation systems, such as public transit usage and travel patterns, offers insights into population movement and its impact on disease spread. This data supports the optimization of containment measures, such as travel restrictions and quarantine protocols.
The mPOC algorithm evaluates the top-down data and calculates the Predictive Exposure Index (PEI). The values of DRI and PEI are then used to assess the current status and expected pandemic-related exposure, which help create appropriate warnings that are triggered using an adaptive threshold-based criteria. These warnings are then sent to the Outbreak Tracking Center (OTC) on a regular basis.
This paper provides a detailed analysis of the mechanisms and algorithm employed. To summarize, the main contributions of this paper are as follows:
- (1)
The description of the mPOC framework, based on its intelligent algorithm;
- (2)
Combining the bottom-up and top-down approaches, leading to the calculations of the DRI and PEI values from end-user and OTC information gatherings;
- (3)
Leveraging wearable IoMT devices, based on the Bio-Watch concept;
- (4)
By combining wearable devices, intelligent algorithms, and real-time data analysis, the system contributes to enhancing disease prevention and control efforts, providing valuable insights and timely alerts to mitigate the impact of outbreaks.
The structure of this paper is as follows:
Section 2 presents a literature review on the technological interventions for COVID-19 monitoring.
Section 3 explores non-invasive clinical and physiological presentations (CPPs) of COVID-19, discussing their specificity and sensitivity measures.
Section 4 provides an overview of epidemiology and public health perspectives of COVID-19.
Section 5 focuses on the sensory systems utilized in the mPOC framework.
Section 6 delves into the mPOC algorithm and IoMT protocols. The feasibility, scalability, and performance evaluation of mPOC are discussed in
Section 7.
Section 8 outlines future directions for technology-driven pandemic response systems, followed by the conclusion and references.
In this paper we aim to address and respond to the following two research questions.
How can the mPOC framework effectively utilize wearable and mobile devices to autonomously predict and monitor outbreaks in pandemic-stricken areas?
What are the key features and functionalities of the mPOC system that make it superior to existing technology-assisted intervention systems for monitoring COVID-19 and preventing the spread of the virus?
These research questions focus on understanding the effectiveness and unique aspects of the mPOC framework in outbreak prediction and monitoring, as well as its advantages over other technology-assisted interventions.
2. Literature Review on the Technological Interventions for COVID-19 Monitoring
The COVID-19 pandemic has brought about significant and long-lasting changes in the healthcare system and has emphasized the need for effective technology-assisted interventions. In this section, we present a comprehensive review of current intervention systems, specifically focusing on the utilization of mobile-based applications. A total of 30 recent studies conducted between 2020 and 2023 were selected and analyzed to examine the various smartphone applications used for monitoring the COVID-19 pandemic and its associated symptoms. These applications were primarily employed for active and passive screening, as well as contact tracing [
6,
7].
2.1. Study Selection Criteria
The 30 studies included in this review (references [
4,
5,
6,
7,
8,
9,
10,
11,
12,
13,
14,
15,
16,
17,
18]) were carefully selected based on the following criteria:
Mobile Health (mHealth) Devices: The focus of these studies on the utilization of app-based digital devices capable of collecting and/or analyzing physiological information were considered. This includes smartphones, smartwatches, tablets, and wearable sensors.
Human Subjects: In each of the studies, a minimum of 10 subjects are included to ensure an adequate sample size for reliable conclusions.
Health Monitoring: These studies were specifically designed for monitoring COVID-19 signs and symptoms and ensuring relevance to the recent COVID-19 pandemic.
Quality Publications: Only peer-reviewed publications were included in this review, ensuring the reliability and credibility of the research.
Year of Publication: The considered studies in the literature review were published between January 2020 and June 2023, encompassing a wide range of coverage in technology-assisted interventions for the last three years in COVID-19 monitoring.
By applying these rigorous selection criteria, we aimed to ensure the inclusion of high-quality studies that provide valuable insights into the use of mobile devices for monitoring and managing the COVID-19 pandemic.
2.2. Literature Review Assessments
A total of 30 research studies were reviewed, encompassing 1047 mobile apps. Among these studies, 83% (25 out of 30 studies) were conducted in developed countries, with the United States of America accounting for 40% (10 out of 25 studies). Other countries involved in the studies included the United Kingdom (UK), Germany, Spain, Denmark, France, Sweden, Norway, Switzerland, Australia, Korea, Hong Kong, India, Taiwan, and Japan. The participant demographics in these studies were diverse, covering variations in genders, age groups, ethnicities, professions, and health conditions, as discussed in
Section 2.1.
The participants in the studies were from various backgrounds, including:
COVID-19 patients (87%) ([
4,
6,
7,
8,
9,
10,
11,
12,
13,
15,
16,
17,
18]), global participants (67%) (references [
4,
6,
7,
9,
10,
12,
14,
15,
17,
18]), healthcare workers (27%) ([
4,
12,
13,
17,
18]), academics (staffs and students) (20%) (references [
4,
11,
16]), elderly (13%) ([
4,
9], [
14,
16,
18]), and adults with specific medical conditions (20%) ([
8,
9,
13]). Furthermore, the mHealth tools and techniques utilized in these studies varied. Approximately 73% of the studies used mobile (iOS or Android) apps, while 3% utilized tablets and SMS. Additionally, 40% of the studies integrated wristbands or smartwatches with necessary apps.
Table 1 summarizes the findings from the research studies.
Table 1 presents the research results that focused on various participants from global populations aged 15 to over 80 years of age with diverse backgrounds, including healthcare professionals, patients, academics, and individuals from different countries, including Australia, Iran, India, USA, Germany, Singapore, Switzerland, and Pakistan. The performance metrics evaluated in the studies varied, including system availability, app uptake measures, feasibility, reliability, delay measures, technology acceptance, health data analysis, user experience, technology adoption, and system usability. The majority of the studies were based on bottom-up approaches, with a few including top-down approaches. The research method and tools used for data collection and analysis included: mobile applications, smartwatches, wristbands, web applications, and other mobile-based gadgets.
In contrast to these studies, the proposed mPOC solution offers several unique features that set it apart from the systems and devices used in the reviewed studies. Firstly, it leverages the combination of a smartwatch and a smartphone app, with potential extensions to tablets and laptops/PCs without direct user interventions (apart from the initialization step) in a non-invasive approach. Secondly, the mPOC solution is designed to easily scale up to the population level. Thirdly, it is adaptive, meaning it can adapt to an individual user’s physiological information, leading to higher accuracy compared to traditional systems and approaches. These distinguishing features will be discussed in detail in the subsequent sections.
3. Non-Invasive Clinical and Physiological Presentations (CPPs) of COVID-19
The impact of diseases, such as cancers, often involves clinical diagnoses that require invasive procedures such as biopsies and pathological tests. In contrast, non-invasive approaches are preferred by patients as they allow medical procedures to be conducted more comfortably, avoiding the inconvenience and pain associated with invasive procedures. However, these technology-based methods must receive approval from government and regulatory agencies, such as the Food and Drug Administration (FDA), before complete autonomous usage is permitted. Once approved, these methods can be easily scaled up for public utilization, alleviating the burden on overwhelmed healthcare systems, as experienced by many countries during pandemics [
18].
This article introduces a novel approach for monitoring COVID-19 symptoms on a public health scale using the mPOC mechanism, which is based on the bidirectional mHealth Disaster Recovery System (mDRS) [
5]. The mPOC system relies on the physiological symptoms and clinical presentations, which include fever, dry cough, sore throat, fatigue, and shortness of breath, which can be seen in severe cases and in elderly patients. The gastrointestinal symptoms (vomiting and diarrhea), cardiac presentations (myocarditis, pericarditis and/or atrial fibrillation), and loss/reduction of senses (smell and taste) are less commonly observed in recent COVID-19 subvariants (e.g., XBB) [
19,
20]. By utilizing these clinical and physiological presentations (CPPs) within its algorithm, the mPOC system assesses the user’s health condition and calculates two crucial indices: the Predictive Exposure Index (PEI) and the Deterioration Risk Index (DRI). These indices trigger appropriate warnings to the user and facilitate the transmission of updates to and from the Outbreak Tracking Center (OTC). The selection and weighting of CPPs are determined by their non-invasive detectability, prevalence, specificity, sensitivity (accuracy), and demographic-specific considerations, enabling the system to adapt to individual users.
Before delving into the list of CPPs, it is important to define several terminologies associated with the characteristics of CPPs:
Prevalence (PR): Percentage of diagnosed (or to be diagnosed) people displaying the physiological presentation.
Timeline: The entire timeline of the disease can be divided into several segments:
Incubation Period (IP)—The period right after the initial exposure to the virus until the time that the initial symptoms appear, which can take up to 5 days for XBB Omicron subvariant (XBB 1.15 and 1.16) [
19].
Early Stage (ES)—The duration of the initial signs and symptoms of Omicron subvariants, which can take anywhere from 1 to 5 days, with an average of 3.63 days (95%CI: 3.25–4.02 days). During this stage the patient exhibits flu-like symptoms [
21].
Advanced Stage (AS)—This is when the disease progresses into a more serious stage and the patient’s overall health starts to decline more rapidly. This could happen between 5 to 7 days after the initial exposure. The final stage follows the AS, which can either lead to the Recovery Stage (RS), when the patient starts to feel better and recovers from the disease (at least 3 days after last main CPPs), or it progresses into a Terminal Stage (TS), when the patient enters a critical phase, often requiring a ventilator or a breathing tube. After TS, the patient either survives and enters the RS or passes away.
Specificity and Sensitivity (SS): Is the percentage of accuracy of diagnosis based on the detection of a specific CPP. Overall, diagnosing COVID-19 is linked to a relatively low sensitivity and a high specificity, meaning the initial home-based tests (RAT: Rapid Antigen Test) may initially yield negative results while the patient has COVID-19 and, eventually after a few tests, the result will turn positive. However, if the test result becomes positive, it is with a high percentage (over 95%) of certainty that the patient is actually COVID positive.
Demographic Factor (DF): The algorithm is initialized based on initial values of prevalence, timelines, and specificity and sensitivity of each CPP and once the algorithm learns about the user’s demographic data (e.g., age, gender, ethnicity, BMI (Body Mass Index), preexisting conditions, etc.), the more accurate weights for the CPP will be calculated.
The capabilities of the current smartphones and the feasibility of utilizing body-worn sensors enable the non-invasive detection of the following CPPs: dry cough, fever, heartbeat rate, fatigue (manifested as unusual inactivity), shortness of breath (dyspnea), nasal congestion, confusion (manifested in abnormal EEG “electroencephalography” readings), and low blood oxygen level (hypoxemia). Pre-existing medical conditions can also be tracked by using body-worn sensors, such as electrocardiography (ECG), to track cardiovascular issues, and terahertz technology, to track diabetes [
22].
In the following section, the characteristics of the early CPPs are discussed [
23].
3.1. CPPs during Incubation Period (IP)
During the incubation period (IP), most patients typically show little to no signs; however, a subset of individuals may experience mild symptoms, such as fatigue and a low-grade fever. These subtle changes in body temperature and behavior can be detected by sensors.
3.2. CPPs during Early Stage (ES)
The early CPPs, which can be detected using a smartphone, have the following features and characteristic [
24]:
Timeline: Early Stage (ES).
Prevalence: fever (67%), cough (42%), runny nose (rhinorrhea) (33.7%), body ache (14.5%), fatigue (14.1%), and shortness of breath (dyspnea) (9.6%) ([
19,
20,
21]).
Specificity and Sensitivity: Each of these early CPPs individually has a sensitivity and specificity of around 50% for diagnosing COVID-19 using the Rapid Antigen Test (RAT). However, when combined with the Polymerase Chain Reaction (PCR) test, their accuracy can reach 95% [
25].
This study focuses on tracking and identifying individuals during the incubation period (IP) and early stage (ES) of COVID-19, wherein they may exhibit minimal or no symptoms. It is assumed that individuals who are positive for COVID-19 would have already received treatment during the advanced stage (AS), recovery stage (RS), or terminal stage (TS). The IP period is considered crucial as it is a time when the infection is more likely to spread unknowingly, given that the median duration of asymptomatic infection is 2 days [
25]. The proposed mPOC system aims to detect and monitor individuals during this critical phase.
4. Public Health Epidemiology of COVID-19
COVID-19, also known as SARS-CoV-2, belongs to the human coronavirus family of viruses, sharing genome similarities with SARS (Severe Acute Respiratory Syndrome, SARS-CoV) and MERS (Middle East Respiratory Syndrome, MERS-CoV). The transmission of SARS-CoV-2 occurs through droplet transmission (when droplets are >5–10 μm in size), contact transmission (physical contact with contaminated surfaces and objects, followed by touching the mouth, nose, or eyes), and aerosol transmission (cloud of droplet particles <5 μm in size). Both droplet and aerosol transmissions occur when an infected person coughs or sneezes and an uninfected person inhales the droplets. The virus can remain active on various surfaces for several days, and the contaminated droplets can stay airborne for up to an hour, particularly in indoor spaces [
26]. Consequently, the risk of transmission increases in enclosed environments, such as shopping malls, restaurants, and cafes.
Public health agencies play a crucial role in providing the population with essential pandemic-related information. However, many individuals may struggle to understand and interpret the overwhelming volume of released and sometimes conflicting information. Therefore, the presence of an intelligent, user-centric device capable of interpreting and aligning this information with the user’s demographic details becomes vital.
A fundamental epidemiological concept, known as the reproduction number, or
R0, is utilized to assess the contagiousness of COVID-19.
R0 represents the average number of people that can be infected by a single sick individual. An
R0 value of 1 suggests that one infected person can spread the virus to one other person, resulting in a relatively stable number of infections. An
R0 value less than 1 indicates that an infected person, on average, transmits the virus to fewer than one person, leading to a gradual decline in the disease’s spread. Conversely, an
R0 value greater than 1 signifies that an infected person, on average, transmits the virus to more than one person, resulting in a rapid spread of the disease, depending on the magnitude of
R0. Initially, the estimated
R0 for COVID-19 ranged from 2.2 to 3.58 [
27]. However, its contagiousness had increased, with
R0 values estimated to have been around 5.08 (95% CI 3.8–8.9) for the Delta variant, and with a 3-to-6-fold increase to 10–18.6 for the Omicron variant (BA.7 and XBB) (references [
28,
29,
30]). In comparison, the flu has an
R0 of 1.4–1.6 [
31,
32].
The mPOC system utilizes the R0 value to calculate the Predictive Exposure Index (PEI) and Deterioration Risk Index (DRI), which measure the likelihood of users infecting others based on sensed CPPs and other demographic factors. A higher PEI value indicates a higher likelihood of users exposing others to the virus, while a higher DRI value indicates an increased risk of the individual’s health deterioration once exposure occurs.
5. mPOC Sensory System
In this section, we will discuss the design of the innovative mPOC system and its algorithm, which is based on the Internet of Medical Things (IoMT) protocol. As previously mentioned, mPOC has been developed as an extension of an existing solution called the mHealth Disaster Recovery System (mDRS) [
5]. The foundation of both, mPOC and mDRS revolves around the utilization of the Bio-Watch, which captures physiological signals from users in conjunction with a smartphone running the mPOC/mDRS apps—which are used in disaster management. The capabilities of the mPOC system have been expanded beyond the conventional mDRS to cater to COVID-19 applications, including the three stages of the mPOC algorithm, the DRI and PEI evaluations, as well as the intelligent warning system that was not included in the mDRS. In the following section, the details of the mPOC system are presented.
5.1. Smartphone-Embedded Sensory Functionalities
Nowadays, smartphones are equipped with a variety of embedded (on-device) functionalities that serve various purposes. For instance, the microphone is essential for establishing bidirectional voice communication with humanitarian operators. Moreover, microphones can actively capture various physiological sounds, including the user’s breathing and respiratory sounds, as well as ambient voices in the background.
The combination of a loudspeaker and visual signals is utilized to issue appropriate warnings to the user, when necessary, from the humanitarian operators.
The accelerometer and gyroscope sensors are capable of detecting acceleration/deceleration along different axes using angular velocities. These sensors enable tracking of tremors, chills, and fatigue, which are characterized by relatively low mobility compared to the user’s typical behavior profile. Additionally, sudden falls can also be detected by these sensors.
Furthermore, smartphones are equipped with a compass, as well as GPS and indoor tracking tools, allowing for the tracking of the user’s location, heading, and direction in relation to reference points. This functionality proves helpful in monitoring and keeping track of the user’s whereabouts.
5.2. The Physiological Watch (Bio-Watch)
The innovative concept of the Bio-Watch framework was introduced in reference [
5]. The current article further incorporates various original and additional physiological parameters to enable autonomous outbreak prediction and monitoring. These parameters include brainwaves (electroencephalography; EEG), blood pressure, heart pulse rate (electrocardiography; ECG), body temperature, blood oxygen level (SpO2), muscle contractions (electromyography; EMG), and blood glucose levels (utilizing Terahertz technology [
22]). Notably, the experimental results from testing ECG, SpO2, EEG, and EMG highlight the successful processing of sensory data for highly mobile systems [
33].
Here we delve into the pertinent technologies deployed in the mPOC framework.
5.3. Fifth Generation (5G) Mobile Networks
The 4G technology, also known as Long Term Evolution (LTE), which was supported by the 3rd Generation Partnership Project (3GPP), had been a widely adopted mobile communication standard since 2010. The 5G technology was introduced in 2019 and while 5G and 4G LTE can coexist, 5G operates on various frequency spectrums, including below 1 GHz, sub 6 GHz, and 26–40 GHz (sub-mmWave). While the number of LTE/4G mobile subscriptions worldwide is expected to peak in 2023 at around 5.4 billion subscriptions and then gradually decline, the number of 5G subscribers continues to grow, and is forecasted to pass 1.5 billion in 2023 and reach 4.6 billion globally by the end of 2028 [
34].
It should be noted that the sixth Generation (6G) mobile system standard is currently under development and is planned to be rolled out by 2030 [
34].
5.4. Device-to-Device (D2D) Communications
Device-to-Device (D2D) supports the connectivity between mobile applications and is transparent to users. D2D is supported by both 4G-LTE (initiated with Release 12) and 5G. The current 3GPP (5G) is based on Release 18, which supports D2D communications [
35,
36,
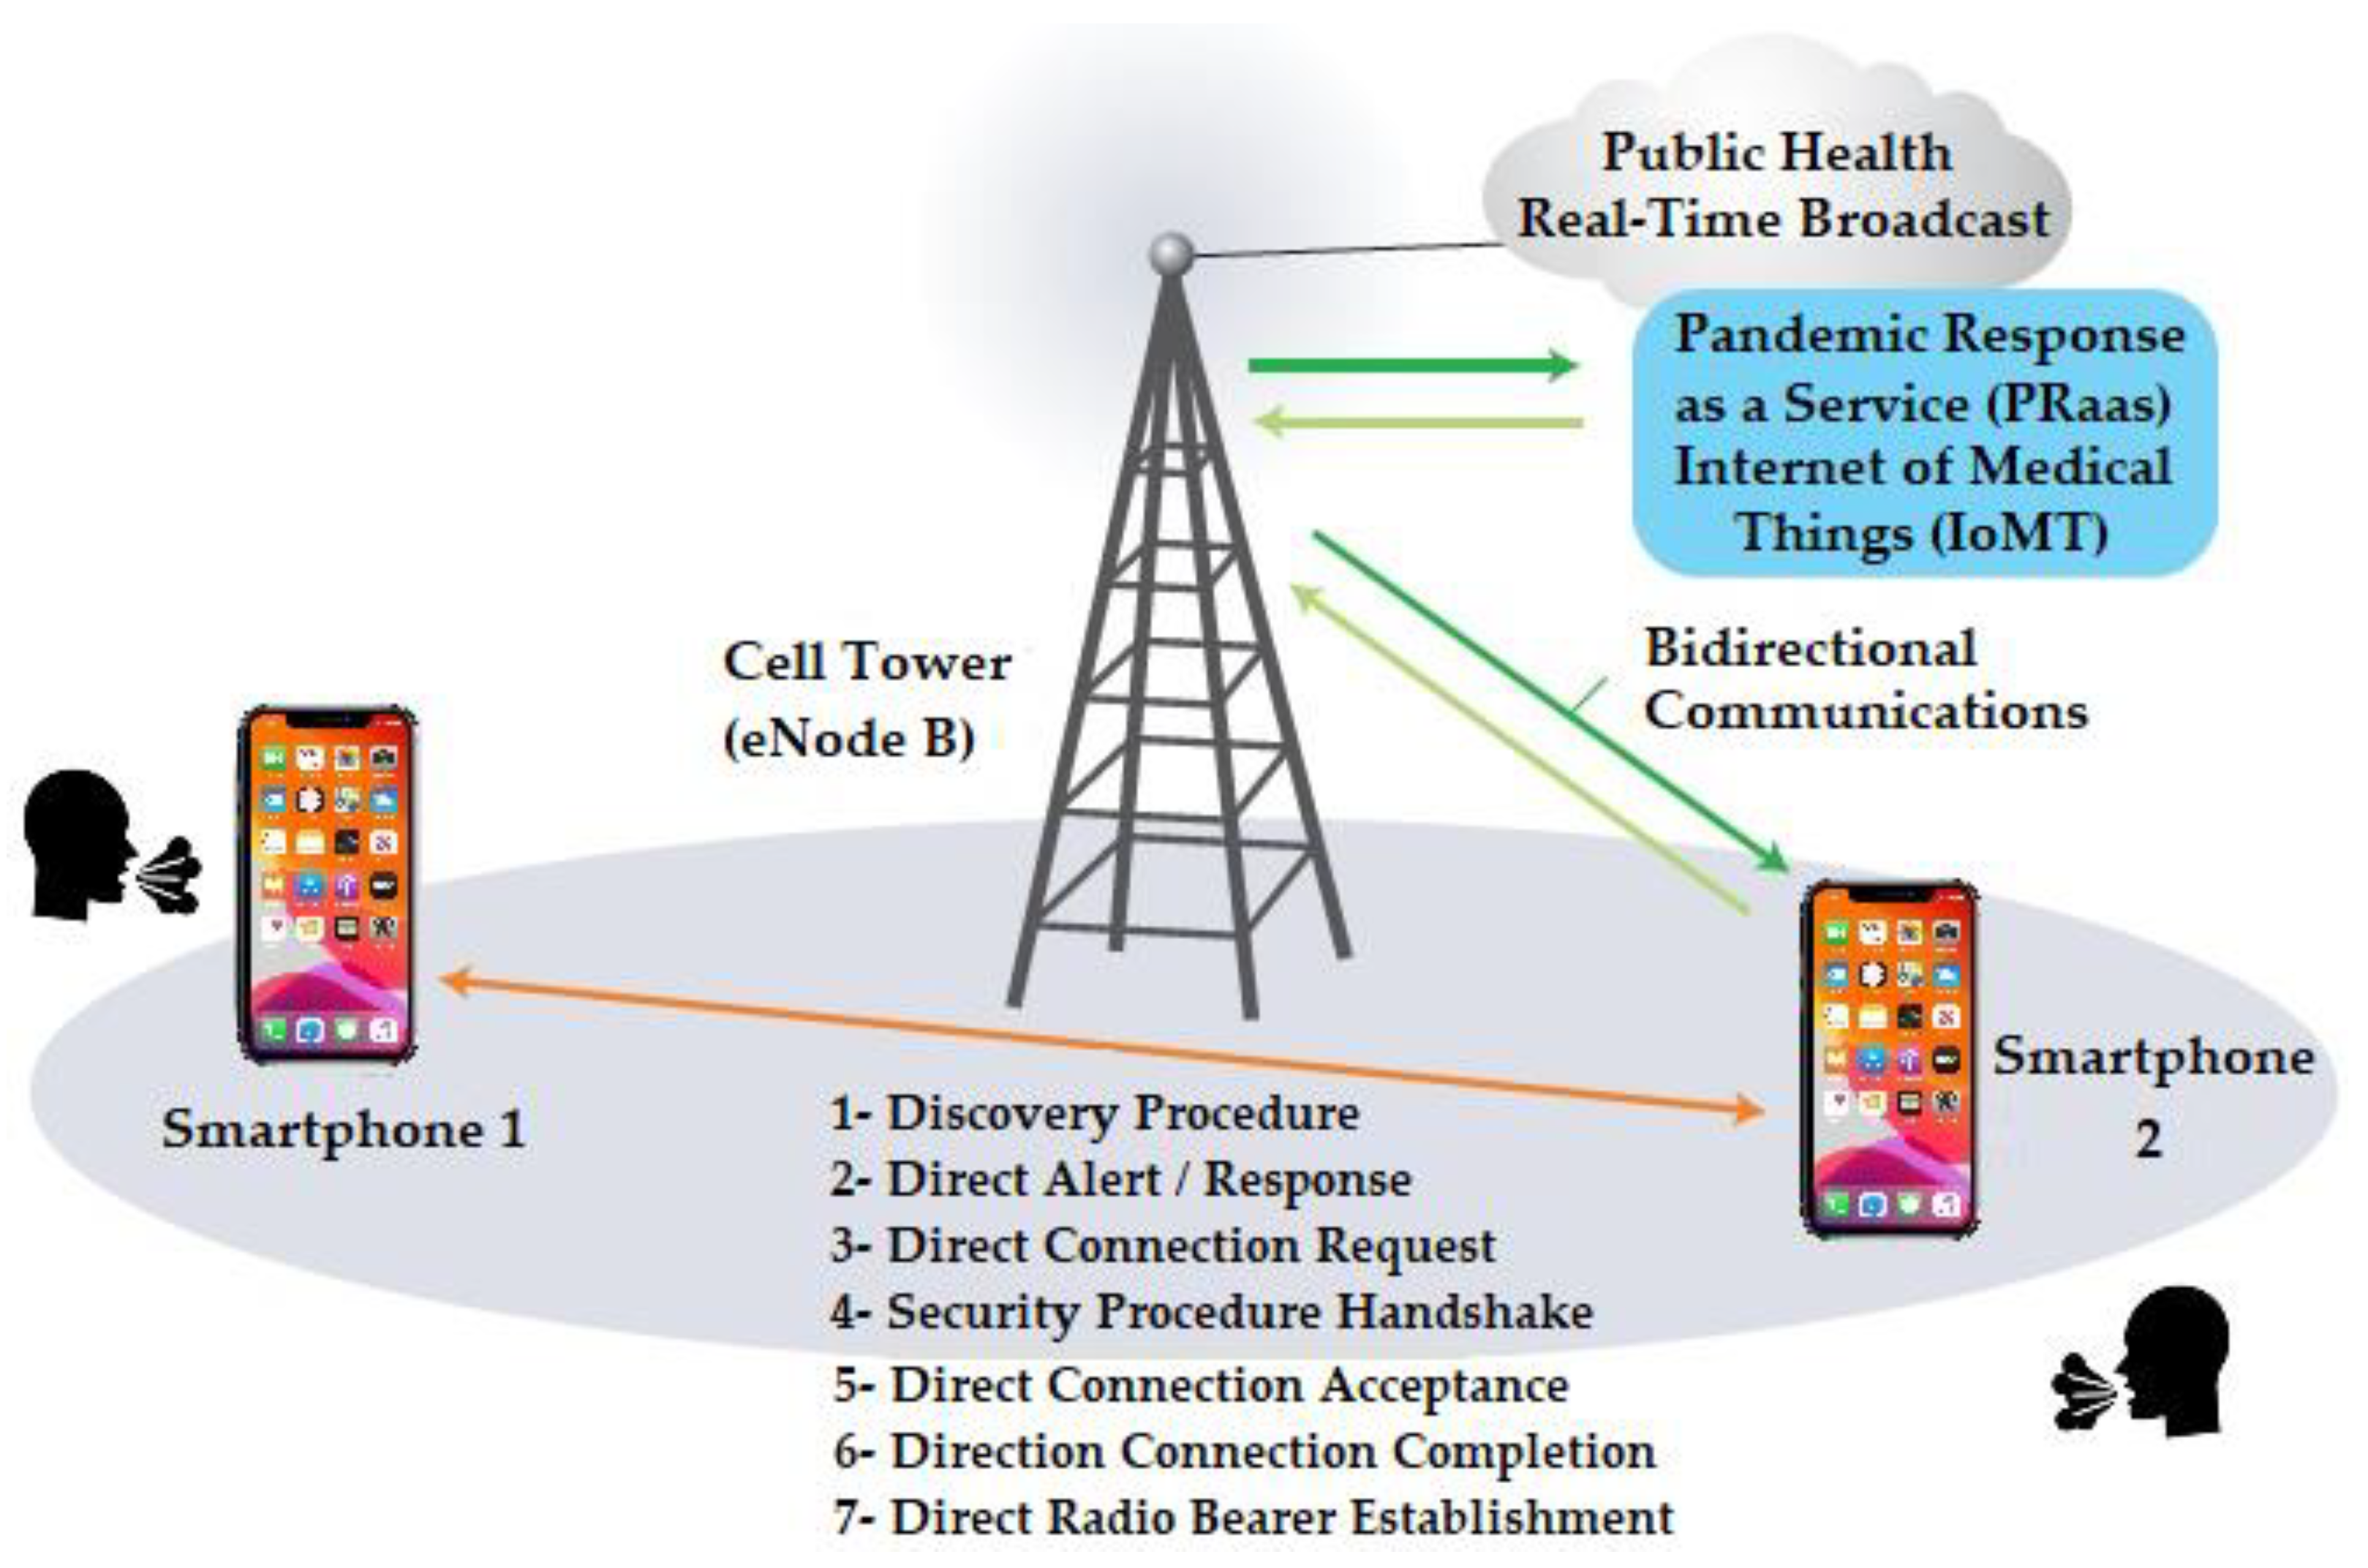
37]. In the context of the mPOC system, smartphones in the wireless range of one another can discover each other and exchange users’ (e.g., health-related) information, in addition to the information received from the public health agencies, which are then used as a predictive measure to assess the dynamics of the moving population and forecast the possibility for further spread of the virus in a pandemic situation. This can be assisted by a mechanism provided by the LTE protocol, called LTE Direct (LTE-D), which uses line-of-sight communication, and it has a range of up to 500 m.
Figure 1 shows the LTE-Direct one-to-one discovery and registration handshakes (adapted from [
5]). The mPOC algorithm utilizes D2D, which will be discussed in the next section.
It’s important to acknowledge that D2D can also be leveraged through other communication protocols, such as Bluetooth and NFC (Near Field Communication), which are out of the scope of this paper.
6. Novel mHealth Predictive Outbreak for COVID-19 (mPOC) Algorithm and IoMT Protocol
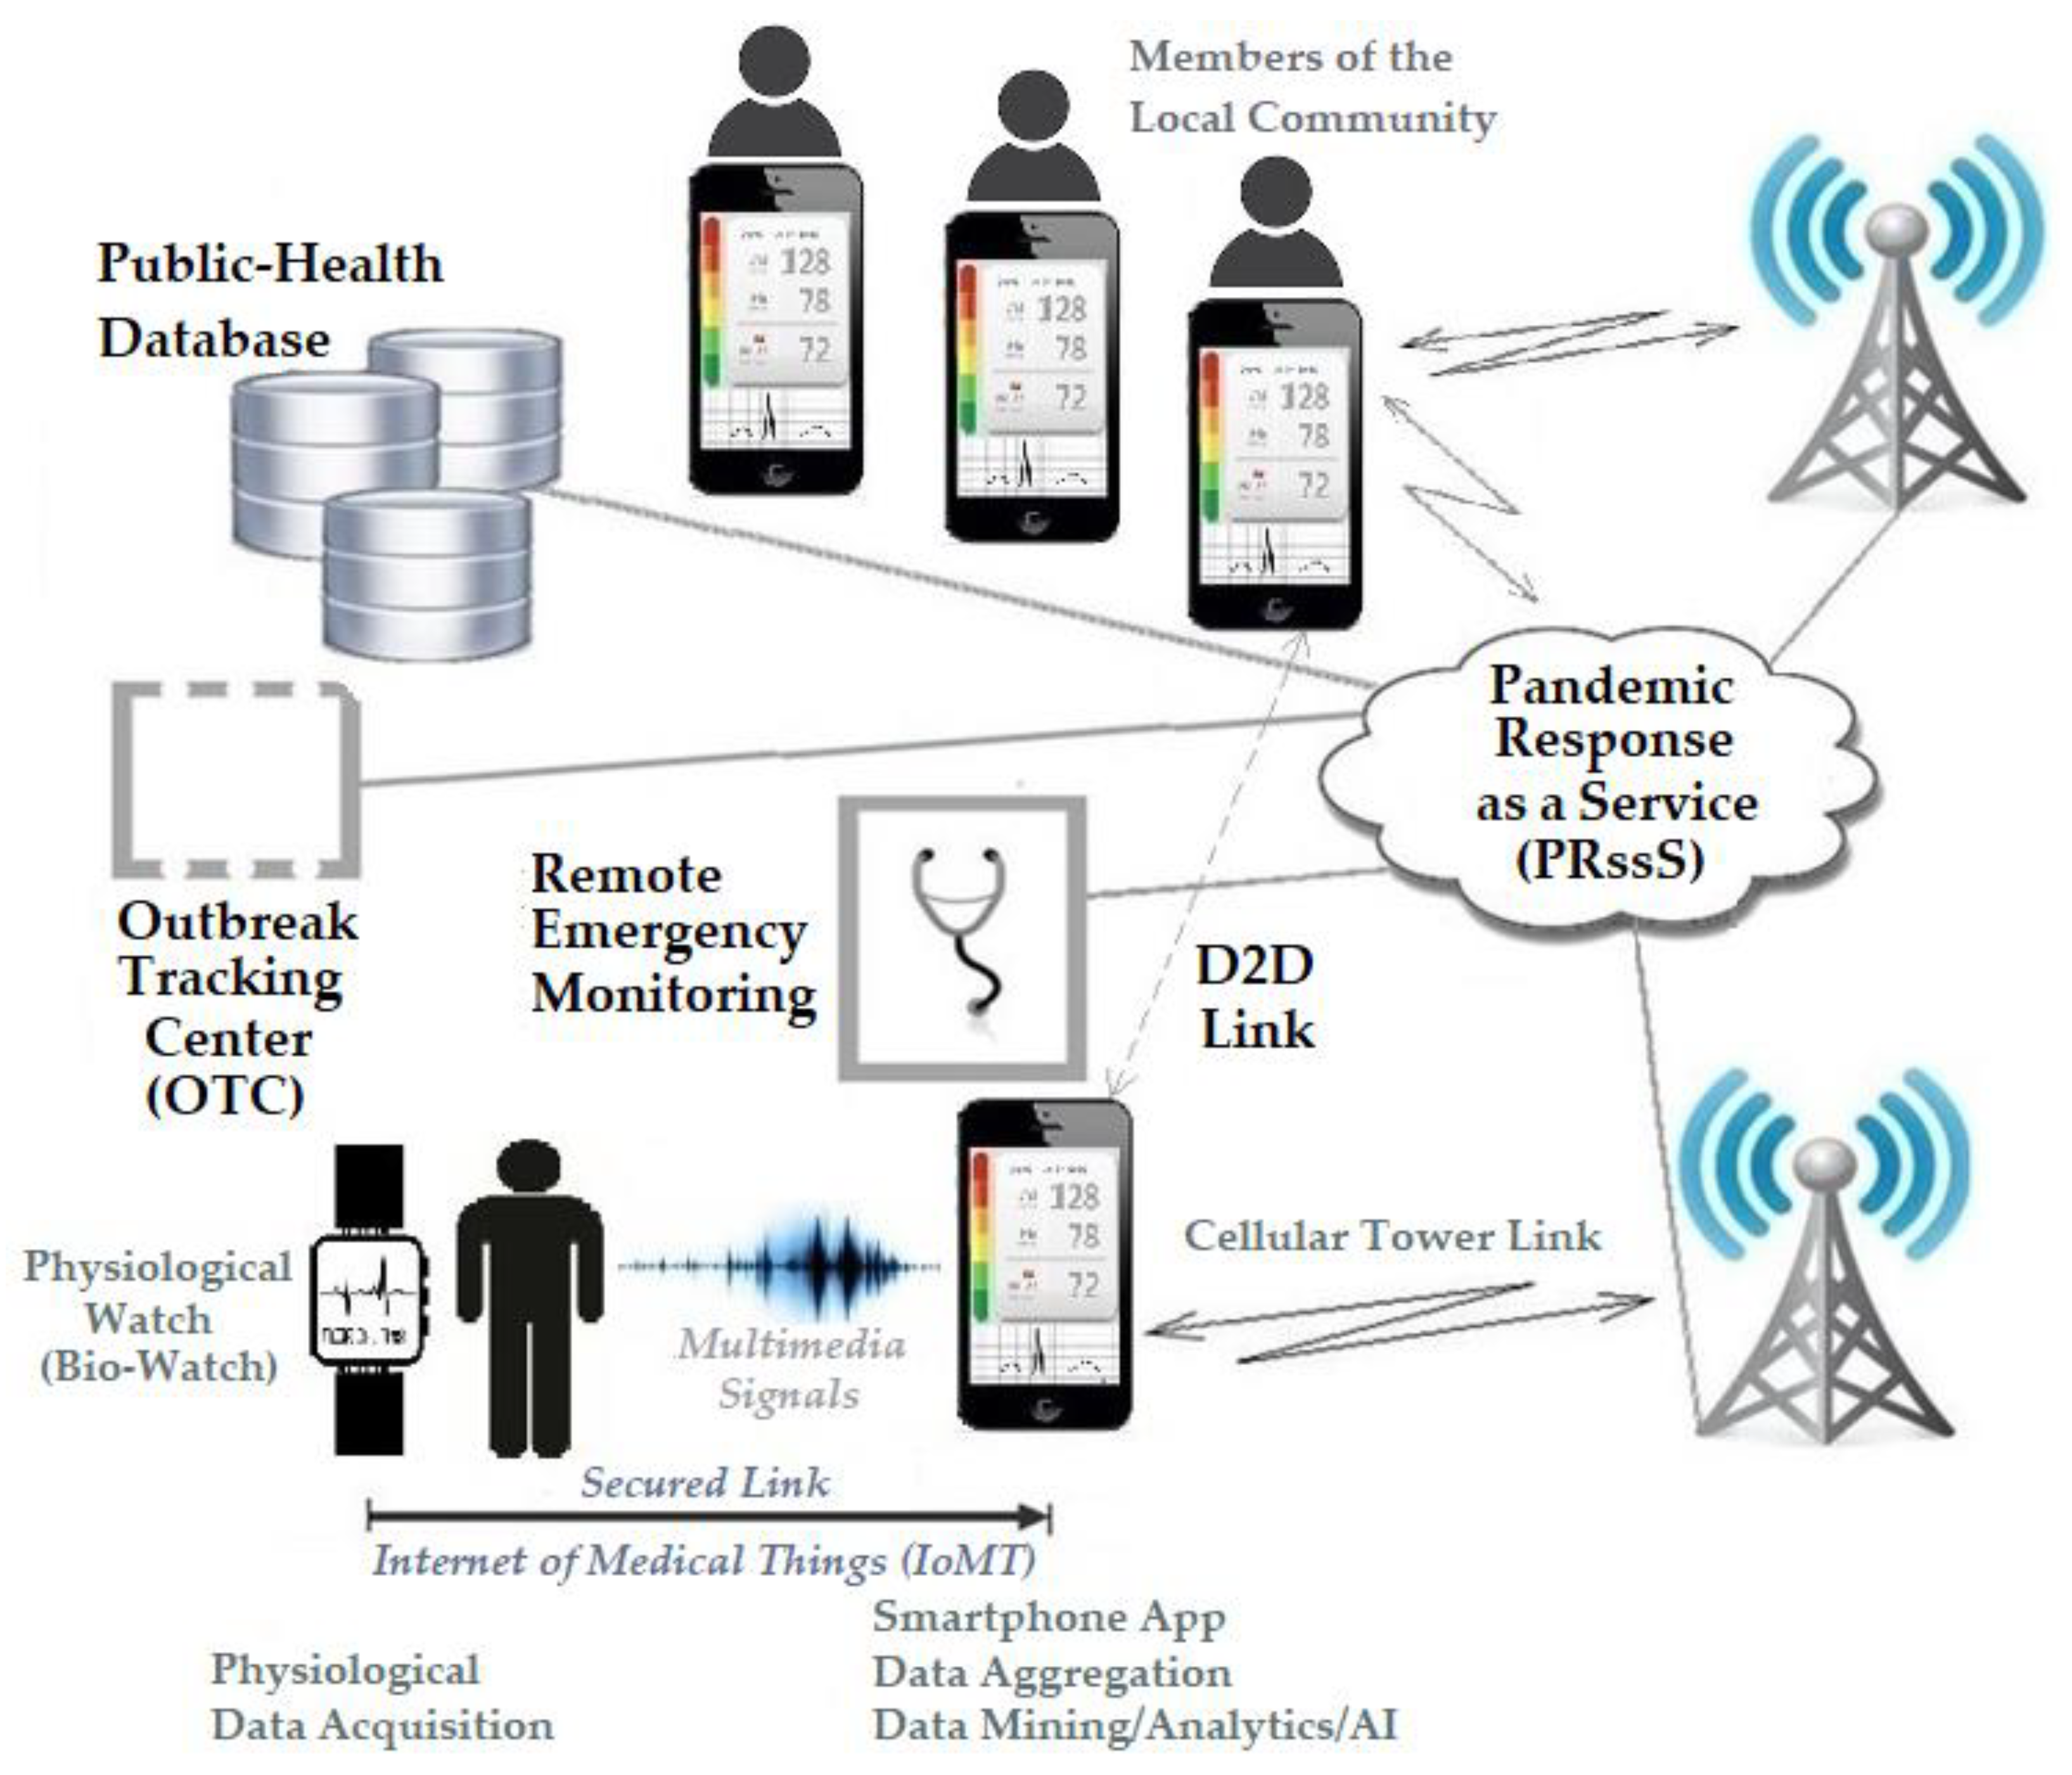
In this section, we present the design of our innovative mHealth Predictive Outbreak system for COVID-19 (mPOC). The successful operation of the mPOC system relies on the presence of an mPOC-ready application installed on users’ smartphones. This application seamlessly integrates the functionalities of the smartphone, Bio-Watch, and public health information, as depicted in
Figure 1 and
Figure 2.
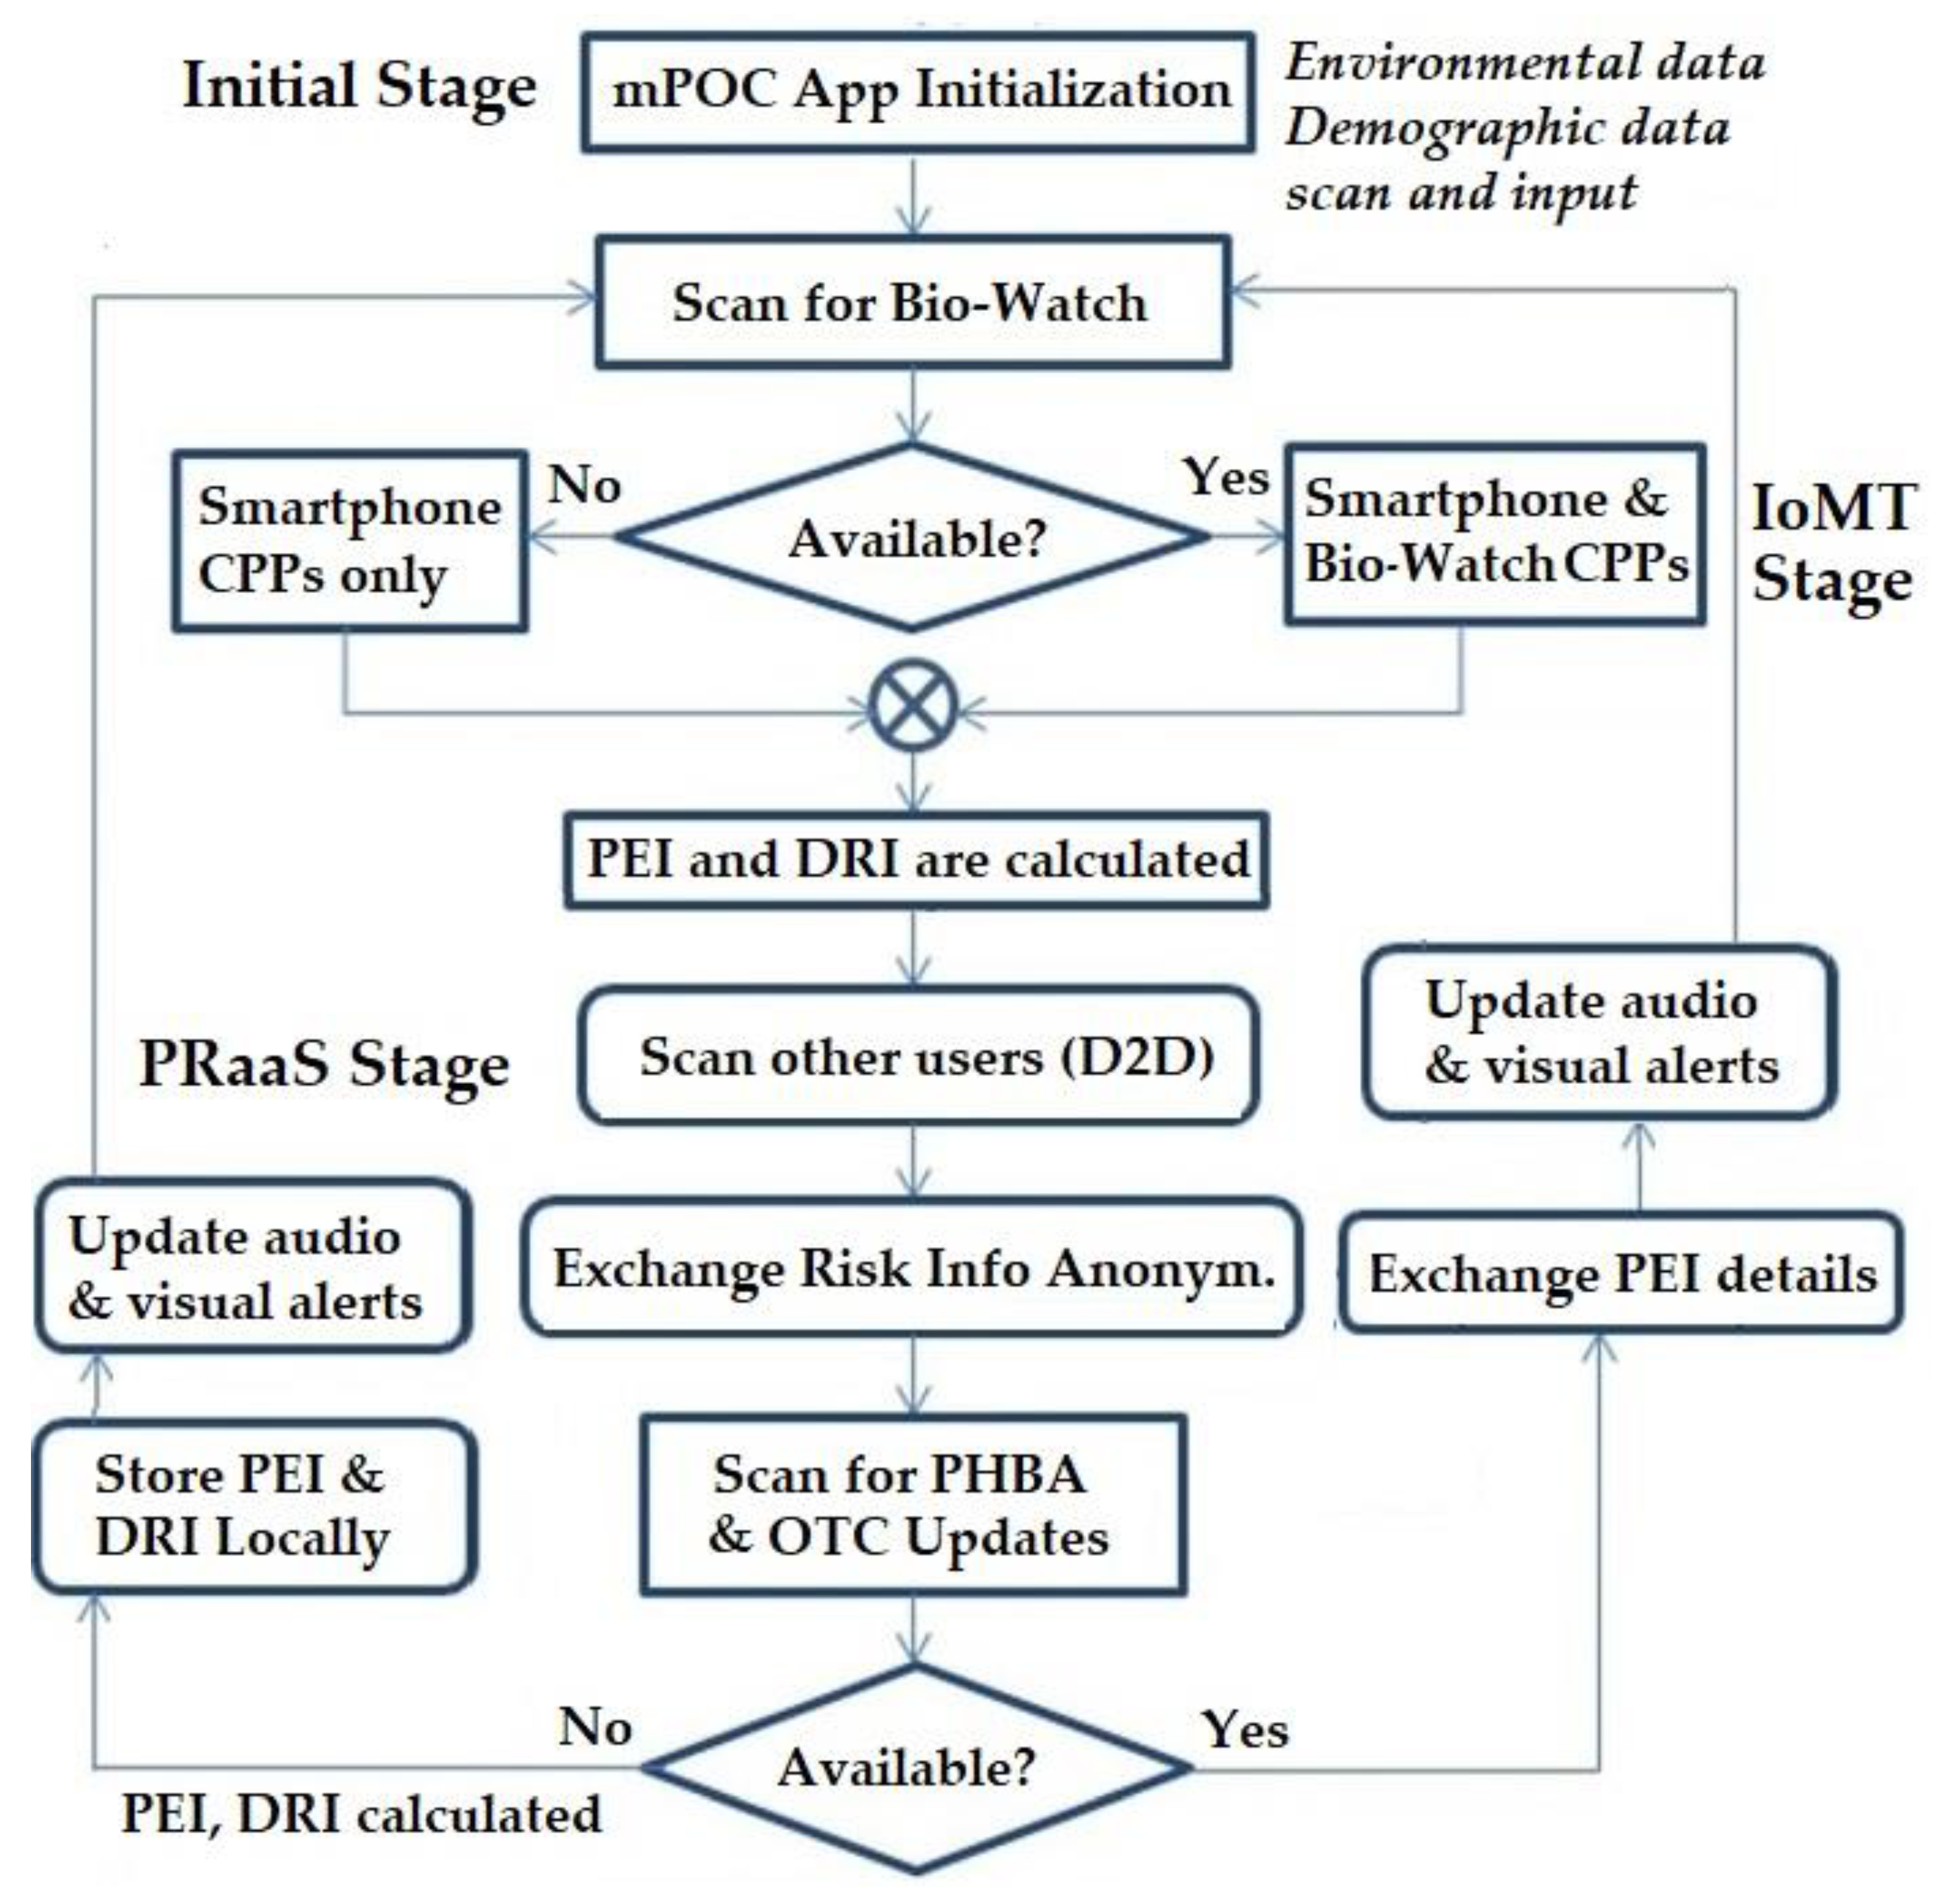
The mPOC system incorporates an algorithm that progresses through three distinct stages, as illustrated in
Figure 3. These stages will be comprehensively defined and discussed in the subsequent parts of this section.
6.1. Initial Stage
Once the mPOC application is successfully installed and launched on the smartphone, the algorithm initiates and collects user-related information, such as the user’s location, including the suburb, city, and country. This location data can be obtained through various means, such as GPS, Wi-Fi, or mobile networks. Additionally, the application prompts the user to provide essential demographic details, including age, gender, ethnicity, height, weight, and any pre-existing health conditions that may influence the risk of COVID-19 complications; examples of such conditions encompass cancer, immunocompromised disorders, diabetes, pulmonary, renal, and cardiovascular diseases.
One notable complication that can arise from COVID-19 infections is the hyperactive immune response known as Cytokine Storm (CS) [
38], wherein the immune system inundates the infection site (e.g., lungs) with inflammatory white blood cells, potentially leading to multiple organ failure. By conducting a blood test to assess the cytokine/chemokine profiles, it becomes possible to identify risk factors associated with Cytokine Storm, which can be considered a pre-existing condition. The DRI value, which indicates the health risk, is updated accordingly to reflect this information.
Concurrent with the mPOC algorithm’s execution on the smartphone, the Bio-Watch device attempts to establish a connection with the smartphone, calibrate its sensors, commence capturing the user’s physiological indicators, and adapt to the typical readings. This stage occurs once and can be subsequently updated, as depicted in
Table 2, to ensure accurate and reliable data captured for the mPOC system.
6.2. Internet of Medical Things (IoMT) Stage
The Internet of Medical Things (IoMT), in a classical sense, represents an interconnected network of medical devices, sensors, and software applications designed to collect, transmit, and analyze healthcare data. It empowers traditional medical devices with internet connectivity, enabling remote monitoring and real-time data analysis, which are pivotal in the realm of digital healthcare. These devices and applications establish connectivity through diverse means, including Wi-Fi, mobile networks, and mesh networks (D2D), ensuring seamless and efficient information exchange.
Recently, IoMT has seen significant advances in the deployment of wearables with Device-to-Device (D2D) communication for disaster management. These developments have revolutionized how healthcare professionals and emergency responders handle crisis situations. IoMT wearables equipped with D2D capabilities offer enhanced connectivity, allowing devices to communicate directly with one another, even in the absence of a centralized network, ensuring seamless data exchange in challenging environments. This feature is crucial during emergencies when traditional communication infrastructure may be compromised or overwhelmed. The integration of wearables with IoMT and D2D communication enables remote patient monitoring, providing real-time tracking of vital signs and physiological parameters of disaster-affected individuals. Such data empower rapid triage and decision-making, ensuring timely and appropriate medical interventions. Additionally, IoMT wearables with D2D facilitate predictive analytics and early warning systems, continuously monitoring physiological data to detect early signs of distress or illness in disaster-affected populations, enabling pre-emptive actions to mitigate health risks. Moreover, the generated data from these wearables provides valuable insights into disaster-affected areas, identifying hotspots, assessing injuries’ severity, and optimizing resource allocation for efficient disaster response efforts. D2D-enabled IoMT wearables also serve as communication tools for first responders, enhancing coordination and information sharing among rescue teams. Furthermore, wearables equipped with biosensors can detect hazardous environmental factors in disaster zones, assisting in risk assessment and ensuring responder and survivor safety. These recent advances in IoMT and D2D have transformed disaster management, thereby providing real-time data insights and enabling more efficient and effective responses, ultimately saving lives and improving healthcare delivery during crises. The ongoing evolution of these technologies promises further transformative innovations for disaster management in the future ([
39,
40]).
The IoMT capability is integrated with the mPOC algorithm’s second stage, where the system continuously scans and senses the user’s physiological signals in an iterative loop. These signals are subject to meticulous analysis to calculate the user’s Deterioration Risk Index (DRI) and Predictive Exposure Index (PEI) values based on their physiological data. Additionally, the system, which encompasses smartphones and/or Bio-Watches, proficiently captures COVID-19-related Clinical Presentation Profiles (CPPs), such as dry coughs, nasal congestion, and shortness of breath. By concurrently considering these CPPs alongside the PEI and DRI values, which fall within a range of 1 to 10, the system provides invaluable insights into the user’s health condition.
6.3. Pandemic Response as a Service (PRaaS) Stage
During the final stage of the mPOC system, it establishes real-time bidirectional connections with other smartphones within the D2D wireless range (within 500 m), as well as with Public Health Broadcast Agencies (PHBA) and the Outbreak Tracking Center (OTC) through various network channels, such as mobile, internet, and cloud. Through these connections, the mPOC system collects anonymous location data from users within the wireless range and exchanges relevant information with the OTC. The PEI value, which reflects the environmental risk based on the user’s location, activity type, and movement direction, and the DRI value, indicating the physiological risk factors if exposed to the virus, play a crucial role in this stage.
The concept of Pandemic Response as a Service (PRaaS) is rooted in the utilization of cloud technology to provide an effective pandemic response. First introduced in 2014 within the framework of Healthcare as a Service (HaaS) [
41], PRaaS shares several common features with HaaS, including scalability based on regional and hierarchical structures, seamless and on-demand operations, virtually infinite computation through fog and edge computing, big data analytics, online storage, and resource sharing [
42,
43]. However, it is important to highlight that the key differentiating factor of PRaaS lies in the integration of end-user smartphones equipped with Bio-Watch and running the mPOC platform, which form the backbone of the system’s functionality.
6.4. DRI Construct
This subsection focuses on the calculation of DRI, and as illustrated in
Table 2, it outlines the risk factors involved in determining the DRI value, including age, gender, ethnicity, height/weight, and pre-existing conditions. The relationships among these risk factors are as follows:
Age: Age plays a significant role in the outcomes following viral exposure. Generally, a higher age is associated with increased chances of complications. However, it is important to note that the severity of complications is also influenced by pre-existing conditions, which have notably contributed to higher mortality rates among younger patients.
Body Mass Index (BMI): BMI is calculated using weight (W) and height (H) with the formula W/H2 (when weight is in kilograms and height is in meters), or BMI = 703 × W/H2 (when weight is in pounds and height is in inches). Individuals who are classified as obese (BMI > 30) face a higher risk of complications during hospitalization, and this factor is included in the calculation of DRI.
Ethnicity: The mortality rate from COVID-19 has an association with patients’ ethnic backgrounds, which is largely influenced by factors such as healthcare access, education, income, and social standing. These factors are taken into consideration when calculating DRI.
Pre-existing conditions: Based on reports from the World Health Organization (WHO), the increase in mortality rates for individuals with pre-existing health conditions (in addition to the rates for otherwise healthy individuals) are as follows: cardiovascular diseases (10.5%), diabetes (7.3%), pulmonary diseases (6.3%), hypertension (6%), and cancer (5.6%) [
44]. These conditions are factored into the calculation of DRI.
The DRI value is presented as a color-coded indicator on the user’s device, as mentioned in
Table 3. This value is influenced by various scenarios, including the user’s location at home and subsequent movement to other places. Therefore, the calculation of DRI is represented by Equation (1), indicating that the future (recursive) value of DRI is a function of the user’s age, gender, BMI value, ethnicity, pre-existing medical conditions, and the current value of DRI.
g: gender, e: ethnicity, phc: pre-existing health conditions.
Table 3.
User profile risk assessment criteria.
Table 3.
User profile risk assessment criteria.
Location
(Now) | Location
(Next) | PEI
(Now) | DRI | PEI
(Next) | Alert
(Light-Audio) |
|---|
| Home | Home | ↓ | ↓ | ≈ | G/S |
| Home | Home | ↑ | ↓ | ≈ | Y/S |
| Home | Home | ↓ | ↑ | ≈ | G/S |
| Home | Home | ↑ | ↑ | ↑↑ | A/S |
| Home | LRL | ↓ | ↓ | ≈ | G/LRA |
| Home | LRL | ↑ | ↓ | ↑↑ | Y/LRA |
| Home | LRL | ↓ | ↑ | ≈ | Y/LRA |
| Home | LRL | ↑ | ↑ | ≈ | A/LRA |
| Home | MRL | ↓ | ↓ | ≈ | A/MRA |
| Home | MRL | ↑ | ↓ | ↑↑ | A/MRA |
| Home | MRL | ↓ | ↑ | ≈ | R/MRA |
| Home | MRL | ↑ | ↑ | ↑↑ | R/MRA |
| Home | HRL | ↓ | ↓ | ≈ | A/HRA |
| Home | HRL | ↑ | ↓ | ↑↑ | A/HRA |
| Home | HRL | ↓ | ↑ | ≈ | R/HRA |
| Home | HRL | ↑ | ↑ | ↑↑ | R/HRA |
| MR | LRL | ↑ | ↓ | ↑↑↑ | R/VHRA |
| HR | LRL | ↑ | ↓ | ↑↑↑ | R/VHRA |
6.5. PEI Construct
The Predictive Exposure Index (PEI) is also a recursive index primarily influenced by environmental and behavioral factors. In the initial stage, the algorithm collects information from the user regarding their household members, occupations, and other factors that impact their typical behaviors, as depicted in Equation (2).
During the IoMT stage, the algorithm monitors the user’s physiological changes and captures environmental sounds, analyzing the rate at which they are changing, particularly in relation to DRI-related parameters.
In the PRaaS stage, PEI is actively updated by receiving location details from GPS and mobile networks, tracking the user’s current location, movement, and intended final destination. The system regularly sends PEI updates to the Outbreak Tracking Center (OTC) and receives real-time updates from the Public Health Broadcasting Agencies and OTC. The DRI and PEI updates are translated into audio warnings for the users, indicating the risk level of their destination. Furthermore, users at the destination are informed about the risk rating of impending arrivals, showcasing the predictive nature of the system. The calculation of future PEI values involves considering both current DRI and PEI values in a recursive manner, as outlined in Equation (2). These dependencies, along with user behavior and movements, are presented in
Table 3. As mentioned, the PEI/DRI calculation results are converted into audio and video signals, which users receive as health and location risk alerts and notifications (
Table 3).
Upon initializing the mPOC application, PEI starts with a user-specific initial value. Based on Equation (2) and the user’s movements, PEI is updated with new values. For instance, if the user remains stationary at home, the PEI value will remain low, and this information will be conveyed to the OTC. As the user ventures out of their residence, the PEI value may change depending on the risk factors associated with the trajectory or destination (for instance, going to a high-risk area will increase the PEI value). The DRI also continuously senses physiological parameters and updates its values accordingly. These two indices trigger appropriate light and audio notifications on the smartphone running the mPOC application to alert the user accordingly.
Figure 3 shows the flowchart of the system and the three stages.
hh: household data, lm: location and movement.
6.6. The mPOC System Methodology
The mPOC algorithm uses an iterative and recursive approach to provide continuous monitoring and adaptive capability to support specific users. Below is a detailed description of each stage aligned with the system’s methodology and algorithm.
- (1)
Stage 1 (Initial Stage):
- -
Devices: Smartphone and Bio-Watch
- -
Sensing/Information Input: The smartphone collects location data (suburb, city, country), BMI, pre-existing conditions, job information, and the number of members in the household. The Bio-Watch receives sensory data input from the smartphone and calibrates sensors to learn user’s physiology.
- -
Monitored CPPs/Health Conditions and User Inputs: Users input their age, gender, ethnicity, height, weight, and pre-existing conditions, including cancer, organ implants, hypertension, diabetes, and pulmonary, renal, CS, and cardiovascular diseases. The algorithm calculates BMI and risk factors based on age and gender, resulting in the calculation of DRI.
- (2)
Stage 2 (IoMT Stage):
- -
Devices: Smartphone and Bio-Watch
- -
Sensing/Information Input: The smartphone gathers data from various sensors, such as microphone (voice/sound), camera (video/light), gyroscope, accelerometer, compass, and GPS. The Bio-Watch collects data from sensors, including temperature, accelerometer, gyroscope, compass, ECG, EMG, EEG, SpO2, BVP (Blood Velocity Pulse), SCL (Skin Conductance Level), and THz (Terahertz).
- -
Monitored CPPs/Health Conditions and User Inputs: Users provide information about dry cough and nasal congestion through the microphone; shortness of breath through the microphone and SpO2 reading; hypertension through BVP sensor; pain level through BVP, ECG, and SCL sensors; fever through the temperature sensor; and tachycardia through ECG. Various diseases can also be monitored, such as restlessness/fatigue/insomnia using PSG (Polysomnography), confusion using EEG, diabetes using THz, heart conditions using ECG, and diarrhea and vomiting using the microphone.
- -
Data Exchange: All the collected data is sent to the PRaaS stage, where the PEI is calculated.
- (3)
Stage 3 (PRaaS Stage):
- -
Devices: Smartphone and Bio-Watch
- -
Sensing/Information Input: The smartphone uses LTE-Direct (D2D), connects with PHBA (Public Health Broadcasting Agency), and exchanges anonymous health details with users within wireless range. The PEI value is calculated and DRI and PEI values are recursively updated and sent to the OTC.
6.7. Simulation Environment and Parameter Setup
The mPOC system has been tested and simulated using the LabVIEW Community Edition [
45], which is a powerful and versatile platform for data acquisition, analysis, and control. This subsection outlines the simulation environment setup and the related parameter configuration within the LabVIEW system.
- (1)
LabVIEW Simulation Environment: The LabVIEW Community Edition provides an ideal simulation environment for testing the mPOC system’s functionalities in a controlled and repeatable manner. The LabVIEW graphical programming interface allows for easy integration of various components, making it suitable for simulating the complex interactions between wearable IoMT device emulation, data processing algorithms, and outbreak prediction models.
- (2)
Wearable IoMT Device Emulation: To mimic real-world data acquisition from wearable IoMT devices, LabVIEW incorporates virtual instrumentation for emulating physiological signals, including EMG, EEG, ECG, and breathing patterns. This emulation allows for comprehensive testing of the mPOC system’s data collection capabilities under different outbreak scenarios.
- (3)
Data Processing Algorithms: LabVIEW’s extensive library of built-in functions and tools is leveraged to develop and integrate data processing algorithms into the simulation environment. These algorithms simulate the real-time processing and analysis of user-centric physiological parameters, such as calculating Predictive Exposure Index (PEI) and Deterioration Risk Index (DRI) based on EMG, EEG, ECG, and breathing pattern data.
- (4)
Outbreak Prediction Models: Within LabVIEW, sophisticated machine learning and artificial intelligence (AI) models are incorporated to predict outbreak trends and patterns based on the processed physiological data. These models take into account both bottom-up user-centric data and top-down public health information to make accurate outbreak predictions.
- (5)
Parameter Setup: The LabVIEW simulation environment allows for flexible parameter configuration to test various outbreak scenarios and system responses. Key parameters include:
- -
Outbreak Scenarios—Different outbreak scenarios—including varying disease transmission rates and geographic spread—can be simulated to assess the mPOC system’s predictive capabilities under diverse conditions.
- -
Physiological Signal Variability—LabVIEW allows for the introduction of signal noise and variability to emulate real-world fluctuations in physiological signals, enabling robustness testing of the system.
- -
Network Latency—Parameters related to network connectivity and latency are adjustable to evaluate the system’s performance in handling real-time data transmission from wearable IoMT devices to the central system.
- -
Predictive Thresholds—The LabVIEW simulation environment facilitates the dynamic adjustment of predictive thresholds for PEI and DRI, enabling fine-tuning of the system’s sensitivity and specificity in issuing outbreak warnings.
The accuracy and responsiveness of the mPOC system during various scenarios were tested, which are presented in
Figure 4 and explained in detail in
Section 7.2.
7. Feasibility, Scalability, and Performance Evaluation
As discussed in the previous sections, the mPOC system relies on a pair of devices, namely a smartphone and a Bio-Watch, with the mPOC application running on the smartphone. The system operates through three distinct modes of information data handling:
- (1)
Capturing Clinical and Physiological Presentations (CPPs) data: This mode involves collecting relevant clinical and physiological information. The Bio-Watch and smartphone are linked using a Wireless Body Area Network (WBAN), typically utilizing technologies such as Bluetooth.
- (2)
Bidirectional communication with the Outbreak Tracking Center (OTC): In this mode, the mPOC system gathers public health data and maintains continuous communication with the OTC, ensuring timely updates on outbreaks and relevant information.
- (3)
Establishing Device-to-Device (D2D) links with other users within wireless range: The third mode enables the mPOC system to establish D2D connections with nearby smartphones, facilitating the exchange of vital details. These connections rely on widely available mobile networks, such as 4G LTE/5G, which are both scalable and capable of handling the necessary bandwidth. The mPOC system primarily transmits short text-based messages, resulting in low bandwidth requirements and eliminating the need for multimedia data exchange.
The computational analysis for the system can be easily performed on the smartphone itself, and the classification and characterization of health information can be accomplished using fog/edge computing techniques.
For DRI-related evaluations of the performance of the mPOC system in relation to COVID-19, reference [
46] considers six clusters that indicate various infection complications. These clusters are as follows:
Cluster 1—flu-like without fever: Symptoms include headache, muscle and chest pains, dry cough, and sore throat.
Cluster 2—flu-like with fever: Similar to Cluster 1, but with the addition of fever and voice hoarseness.
Cluster 3—gastrointestinal: Symptoms consist of headache and chest pain, loss of smell and appetite, diarrhea, and sore throat without cough.
Cluster 4—severity 1, fatigue: This cluster includes headache, fatigue, loss of smell, dry cough, fever, voice hoarseness, and chest pain.
Cluster 5—severity 2, confusion: Symptoms comprise headache, loss of smell and appetite, dry cough, fever, voice hoarseness, sore throat, confusion, fatigue, and chest/muscle pain.
Cluster 6—severity 3, abdominal/respiratory: Similar to Cluster 5, but with the addition of shortness of breath, diarrhea, and abdominal pain.
These clusters indicate an increased likelihood of patients requiring supplemental oxygen or ventilators, ranging from 1.5% (Cluster 1) to 19.8% (Cluster 6). It’s worth noting that most of these CPPs, except for loss of smell and appetite (which is less prevalent in the recent COVID-19 subaviants), are applicable to our mPOC system with a relatively high degree of accuracy (gold standard of 90% and above). Tracking the loss of smell/taste can be incorporated through a simple question-and-answer query issued to the user by the mPOC application.
7.1. The mPOC Technical Feasibility Study
The mPOC technical feasibility study evaluates various factors to determine if the system is feasible from technical, economical, operational, social, legal, ethnical, scalability, sustainability, and risk perspectives. In this article, we will only cover the technical feasibility aspect of the mPOC system. The feasibility of other factors can be considered in future studies.
The technical feasibility of the mPOC system focuses on evaluating the practicality and viability of its technology components. This assessment considers various technical aspects to determine if the system can be successfully developed, deployed, and operated. Here are the key factors involved in the technical feasibility of the mPOC system:
System Availability: This includes assessing the availability of hardware components, such as smartphones and wearable devices (e.g., Bio-Watch). It also considers the availability of software components, including the mPOC application and algorithms necessary for data processing and analysis.
Sensor Integration: The mPOC system relies on the integration of sensors to capture clinical and physiological data. This assesses the availability and functionality of sensors that can accurately and reliably measure vital signs, symptoms, and other relevant health data. This includes evaluating the compatibility of sensors with the smartphone and wearable device, ensuring seamless data collection and transmission.
Connectivity: The mPOC system requires connectivity options to transmit data between the smartphone, wearable device, and other public domain stakeholders, such as the OTC. This feasibility study examines the availability of wireless communication technologies, such as Bluetooth, Wi-Fi, or cellular networks (4G/5G), to establish reliable and secure connections. It ensures that the chosen connectivity options are capable of handling the required timely (real-time) information exchange.
Data Processing and Analysis: This required the computational evaluation of the capabilities of the smartphone to handle the processing and analysis of data collected by the mPOC system. This includes assessing the processing power, memory, and storage capacity of the smartphone to perform complex algorithms and classification tasks. Additionally, it considers the availability of fog/edge computing techniques to offload some computational tasks and improve efficiency.
Data Security and Privacy: This technical feasibility encompasses the assurance of robust (personal/public) data security and privacy measures within the mPOC system. This involves assessing encryption mechanisms, secure data transmission protocols, and access to control measures to protect sensitive health information. The system may require compliance with relevant data protection regulations and standards (e.g., NIST).
System Scalability: This examines the scalability of the mPOC system to accommodate a potentially large number of users. It assesses whether the system can handle increased data volume, simultaneous connections, and user interactions without compromising performance or data accuracy. Scalability considerations may involve evaluating the network infrastructure, server capabilities, and data storage capacity.
Integration with Existing Infrastructure: In many cases, the mPOC system needs to integrate with existing healthcare infrastructure and information systems. This feasibility study evaluates the compatibility and interoperability of the mPOC system with Electronic Health Record (EHR) systems, laboratory information systems, or public health databases. It ensures seamless integration and data exchange between the mPOC system and other healthcare systems.
By conducting a thorough Technical Feasibility assessment, the end-users can determine if the mPOC system’s technology components are readily available, compatible, and capable of meeting the system’s requirements. This evaluation provides valuable insights into its development.
7.2. The mPOC Performance Evaluation
In this section, the performance evaluation of the mPOC prediction model is analyzed. The mechanism involves capturing physiological data from users, which can be susceptible to unwanted noise and occasional faulty readings. To enhance the specificity and sensitivity of the diagnosis, appropriate filtering techniques, such as Kalman filtering, are employed [
47].
The second mode of operation relies on the timely delivery of real-time health and outbreak information by the authority, necessitating the establishment and maintenance of anytime and anywhere connectivity. This is generally not a challenge in metropolitan areas. The third mode of operation involves establishing proper device-to-device (D2D) connections with community members for information exchange. Since no multimedia data, such as voice, video, or images, are transmitted across the network, there is no need to maintain a high-quality communication link. The transmitted information is in the form of text, allowing for some degree of delay.
The mPOC system is capable of tracking the physiological signs of users during the advanced stage (AS) if they require the attention of a healthcare professional while self-isolating at home.
For the end-to-end performance evaluation, we utilized LabVIEW Community Edition [
45], simulating the mobile/Bio-Watch user, the Outbreak Tracking Center (OTC), and various infection clusters. The algorithm (
Figure 3) is deployed and simulated revolving around the movement of the mobile user from a low-risk area (residence) to various high-risk areas. The local visual and auditory feedback systems were utilized and recorded during the movements.
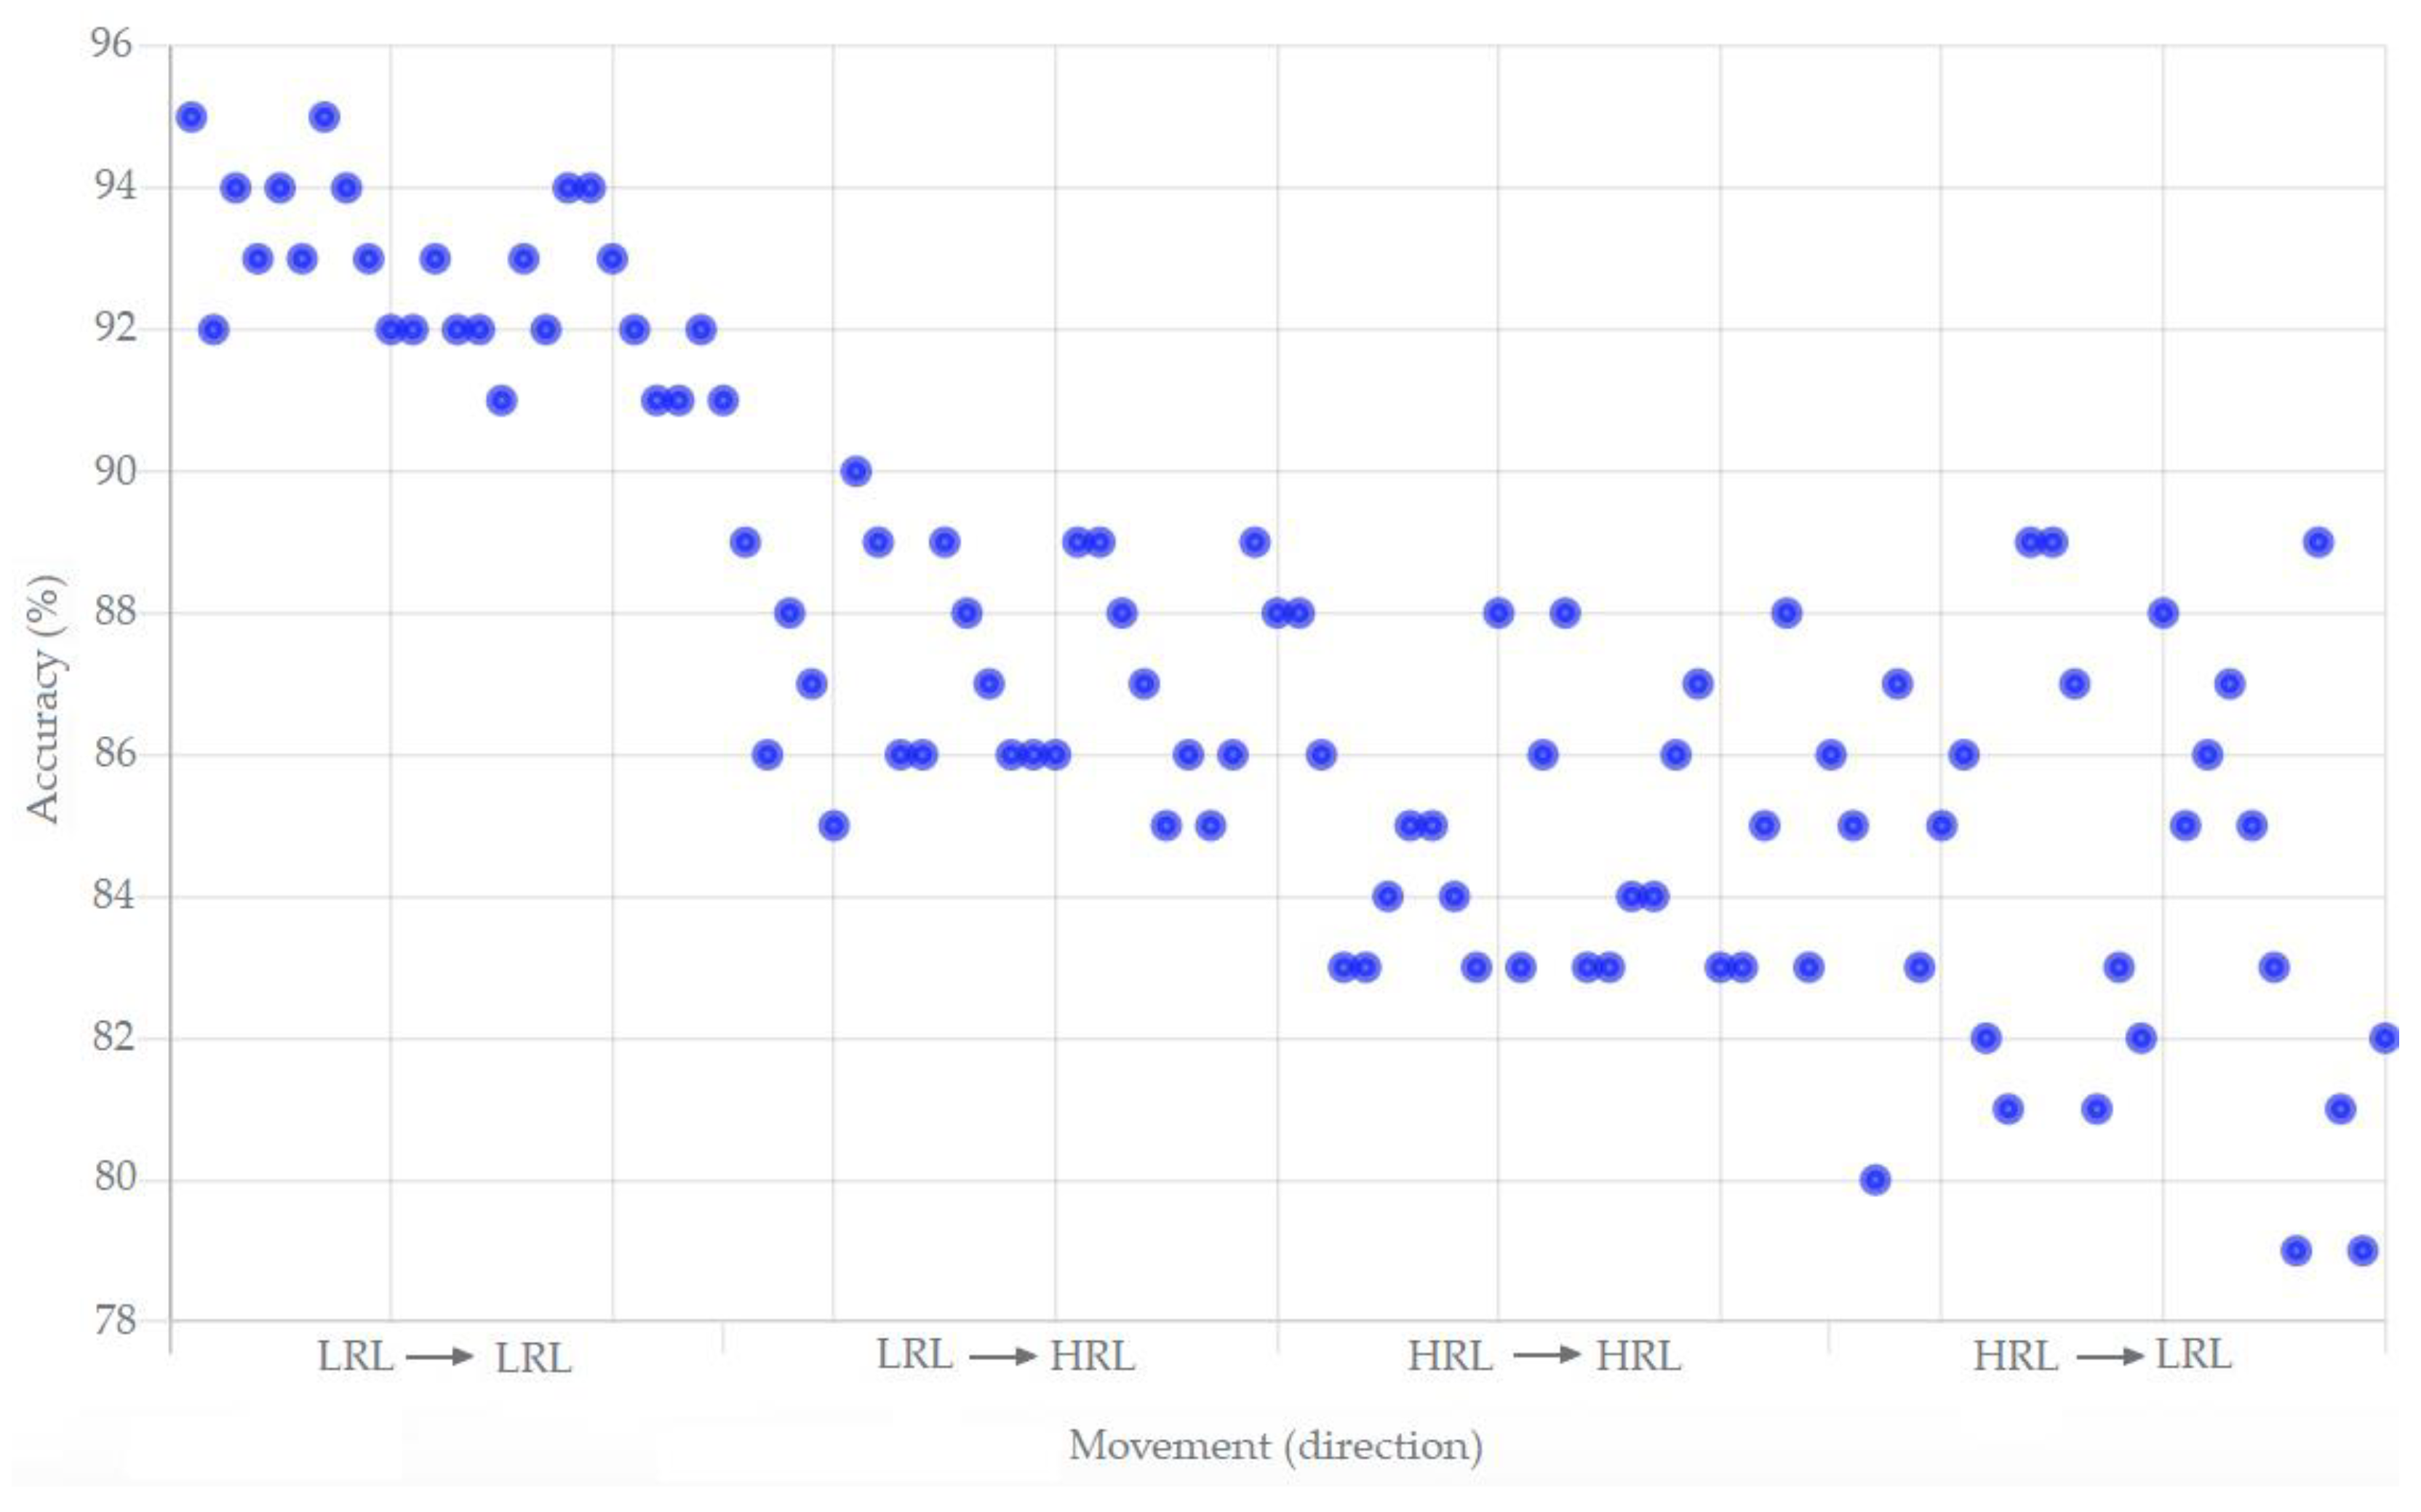
Figure 4 illustrates the achieved accuracy based on the movements from a Low-Risk Location (LRL) to a High-Risk Location (HRL) and vice versa.
The performance scatterplot demonstrates that the accuracy measures for correctly identifying the user’s risk when moving from one LRL to another LRL are at the highest levels, with a mean value of 92.8% accuracy with the variations ranging from 91% to 95%. The accuracy measures slightly decrease for movements from LRL to HRL, with a mean value of 87.08% accuracy with the variations between 85% and 90%. The accuracy measures further decline for movements from HRL to HRL, with a mean value of 84.84% with the variations between 83% and 88%. This decline can be attributed to the increased utilization of the algorithm to capture, transmit, and interpret the rapidly changing parameters.
The accuracy measures display high variation during movements from HRL to LRL, with a mean value of 84.12% and significant variations between 79% and 89%. This variation is influenced by differences in parameter reporting between high- and low-profile locations.
A crucial aspect of the application that needs to be addressed is the security and privacy capabilities of the mPOC system. Since mPOC users are within the D2D wireless range of each other (within 500 m), they will receive personalized DRI and PEI values from other users, which are to be passed to the OTC. To address security and privacy requirements, each mPOC system is assigned a unique anonymous 10-digit code, which remains private and secured from all users. All communication channels between mPOC users are encrypted to prevent Man-In-The-Middle Attacks, ensuring that adversaries cannot impersonate valid users or hijack established communication channels. The OTC stores and maintains the list of validated secure codes for all users in its database.
Although the accuracy versus movement performance measure is by far the most important performance measure that can be considered in this article, other metrics can also be used to study the performance of the mPOC system, such as:
- (1)
The economical, operational, social, legal, ethnical, scalability, and sustainability aspects of the mPOC system;
- (2)
The feasibility and readiness of the elderly and non-tech savvy users to use the mPOC technology for disaster management;
- (3)
Delay studies for OTC to reach end-users;
- (4)
The effectiveness of the mPOC system in keeping infected users in isolation once signs and symptoms of COVID-19 appear in a specific user, after which the system is capable of issuing appropriate warnings and instructions, thereby guiding the user to get tested at the nearest testing center and self-isolate at home.
Other performance measures may include the system’s capability in contact tracing, which may also be possible and is envisioned in the system, which can be included in future studies.
8. Future Directions for Technology-Driven Pandemic Responses
Utilizing technology for containing pandemics and outbreaks, such as COVID-19, has demonstrated promising results and is crucial for achieving a safer community. As we look towards the future, it is evident that investing in the current technologies is the most viable path forward. The following are important technology-driven capacities that should be developed and enhanced ([
48,
49,
50,
51,
52,
53]):
8.1. Leveraging Digital Technologies for Detection
Rapid viral detection is essential for containing viral pandemics with an R0 higher than 1, which is the case for most diseases, including the flu and COVID-19. Various digital technologies can be utilized to increase the speed of disease detection, particularly when limited or no symptoms are present; the mPOC system serves as a perfect example of such a technology.
8.2. Real-Time Monitoring and Contact Tracing
Once an infection is detected and confirmed, it becomes crucial to monitor the infected population in real-time and perform contact tracing. Technologies that enable real-time monitoring and contact tracing play a vital role in managing the spread of the virus. However, because of the inherent delay in the operations of the conventional contact tracing systems and the rapid evolvements of the newer COVID-19 subvariants, which caused the
R0 values to increase by up to six-fold, the performance of the contact tracing systems gradually decreased from 67.1% to 15% [
54]. The future technologies for contact tracing need to consider high
R0 values to ensure adequate performance. The mPOC system, when deployed at a population level, has the capability to fulfill this requirement.
8.3. Critical Data Sharing Capability
With the frequent movement of individuals across cities, states, and countries, the sharing of critical data becomes increasingly important. This data sharing helps in understanding and mitigating the emergence of new and more dangerous viral subvariants. Additionally, addressing the issue of social media disinformation and managing conflicting data are essential, and proper data assessment and sharing can contribute to tackling this challenge effectively.
8.4. Pandemic-Ready Smart Cities
A crucial aspect of smart cities is having a technology-enabled and interconnected city infrastructure. During a pandemic, having a predictive system that can show the trajectory of localized infections’ severity becomes vital. By integrating pandemic readiness into smart city frameworks, cities can proactively respond to outbreaks and effectively allocate resources.
8.5. Top-Down Meeting Bottom-Up Approaches
The top-down approach involves information flowing from infrastructure, government agencies, and regulators down to end-users and the general population. Conversely, the bottom-up approach prioritizes the well-being of the general population. To achieve the best possible outcomes, both approaches should run in parallel. This approach, where top-down and bottom-up approaches converge, is adopted in the mPOC system and should be embraced in future technology-driven pandemic responses.
8.6. Vendor-Specific Bottom-Up Systems/Technologies
There are several recent gadgets and vendor-specific technologies that can be used for a bottom-up approach in a variety of pandemic-like situations. Here are a few examples:
- (1)
Oura Ring: The Oura Ring is a wearable device that tracks various biometric data, including body temperature, heart rate, respiratory rate, and sleep patterns. It can provide early indications of changes in health and help individuals monitor their well-being [
55].
- (2)
BioButton: The BioButton is a wearable biosensor that continuously monitors vital signs, including temperature, heart rate, and respiratory rate. It provides real-time health data and can help individuals identify potential COVID-19 symptoms and take appropriate actions [
56].
Other vendor-specific technologies include: Garmin Vivosmart, Fitbit Sense, Apple Watch, and Samsung Galaxy Watch.
These are just a few examples of recent vendor-specific technologies that can be used for a bottom-up approach in a pandemic situation. It’s important to note that the availability and specific features of these technologies may vary depending on the region and the vendors’ offerings.
By focusing on the current state of gadgets, their future directions, and continuously advancing technology-driven approaches, we can enhance our ability to detect and contain pandemics effectively. By embracing digital technologies, real-time monitoring, data sharing, pandemic-ready smart cities, and integrating top-down and bottom-up approaches, we can build systems that can contribute to building resilient and proactive systems that can save lives and minimize the impact of future outbreaks.
9. Conclusions
In this paper, we have introduced the Mobile Health (mHealth) Predictive Outbreak COVID-19 (mPOC) system, which utilizes a cutting-edge wearable device that can be utilized by individuals from all walks of life. The centerpiece of this system is a smartphone-driven physiological watch called Bio-Watch, which captures and tracks users’ physiological signals using both bottom-up (individuals first) and top-down—from public health and the Outbreak Tracking Center (OTC)—approaches.
By merging the top-down and bottom-up approaches, we believe we have found a way to effectively address fast evolving future pandemics and provide fast and efficient support to affected individuals. The algorithm described in this paper, which operates through three recursive stages, calculates the user’s likelihood of being infected based on two formulas: the Predictive Exposure Index (PEI) and the Deterioration Risk Index (DRI). Visual and auditory warnings are then issued to inform users of their risk of infection.
We have also discussed the feasibility of this approach, aiming to revolutionize pandemic outbreak management by utilizing existing systems and sensors with minor upgrades to devices and communication protocols. The mPOC system makes optimal use of Device-to-Device (D2D) communication, which is supported by current 4G/5G networks. From a performance perspective, we simulated the behavior of the mPOC system using the LabView Community Edition. The results demonstrate mean accuracy values in correctly informing mobile users of risks, ranging from 92.8% for movements between Low-Risk Locations (LRL), 87.08% for movements from LRL to High-Risk Locations (HRL), 84.84% for movements within HRL, and 84.12% for movements from HRL to LRL. The decline in accuracies for movements within HRL can be attributed to the increased utilization of the algorithm to capture, transmit, and interpret parameters in high-risk environments.
The distinctive feature of the proposed method is its focus on the well-being of affected individuals and the ability to monitor them with accuracies close to the gold standard (>90%), which was previously unattainable. Our mPOC system has the potential to revolutionize pandemic management by providing timely and accurate information to individuals as well as public health agencies, thereby enabling early detection and intervention.
Further research and development in this field will allow us to refine the mPOC system and explore additional functionalities, such as contact tracing. By continually improving and advancing wearable IoMT technology, we can enhance the efficiency and effectiveness of outbreak prediction and monitoring, ultimately saving lives and mitigating the impact of future pandemics.


