1. Introduction
Modern healthcare faces several challenges due to the increasing demand for healthcare services. This demand is driven by the growing volume of patient data, the continuously evolving technological capabilities, and the need for rapid and efficient healthcare processes and systems.
According to a 2019 study [
1], over the last decade, the healthcare information technology market has significantly expanded along with the focus on remote health-monitoring techniques adopting wearable devices, usually defined as IoT health sensors, connected to the internet. This growth trend is further highlighted by the recent health crisis caused by COVID-19. In fact, further studies [
2] predict that the wearable medical devices market will be worth USD 50 billion by 2026.
Smart healthcare is the term that identifies the set of modern technologies and approaches used to address healthcare challenges.
Platforms that allow for the collection of medical data are considered to be essential components of smart healthcare, and they are used to develop end-user solutions, such as web or mobile applications.
The main implementation aspects that the new intelligent health services platforms must guarantee are:
Data acquisition: the way in which medical data is acquired from various IoT sensors;
Data storage: innovative methodologies for long-term storage of all medical data from various patients which allows for immediate and resilient access to the information;
Data processing: algorithms that allow for validation and real-time data prediction through the use of machine learning techniques;
Data sharing and visualization: creation of dynamic dashboards that optimize the use of previously processed information and allow sharing the information with other systems.
The currently available tools are effective for processing data, but lack homogeneous infrastructural organization, which may provide a centralized solution to the encountered issues. An efficient system may reduce costs and improve services by minimizing errors [
3].
In this paper, we propose the use of digital twins (DTs) to solve various problems; in particular, we use DT technology in the classification of cardiac pathologies through the ECG signals. The main objectives, which also represent the novelty of this paper compared to the state of the art described in
Section 2, are as follows:
The implementation of a case study including a proof-of-concept of a heart DT based on microservices architecture characterized by an artificial intelligence component (studied and presented in [
4,
5]) is provided;
The proposed heart DT architecture collects several input signals, such as ECG signal, blood pressure, pulse, and blood oxygen saturation. In particular, real-time ECG data recorded by a smartwatch is analyzed and validated through an inference process on a pre-trained model;
An extension of this study, a higher-level platform for disease management and monitoring is presented, in particular we focused on a specific cardiac pathology, i.e., ACS.
The rest of the paper is structured as follows:
Section 2 provides an overview of the state of the art regarding DT-based systems applied to healthcare, with particular attention to cardiovascular diseases analyzed through ECG signals. The architecture and implementation of the heart DT is described in
Section 3. The setup description of the heart DT is conducted in
Section 4. This section outlines the structure of an ECG signal, the pre-trained network model with a dataset containing normal ECG signals and those affected by cardiac pathologies, the real-time ECG signal acquisition system, and the obtained results. In
Section 5, a higher-level platform is contextualized, which allows for the integration of different DTs, each for a specific organ, defined as Organ DT, to classify a specific pathology.
Section 6 provides an example on how the platform can be utilized to address a particular cardiac pathology. Finally,
Section 7, the comparison of the research present in the state of the art and the heart DT proposed in this paper has been provided.
2. Related Work
The concept of DTs have been investigated in different fields of research for several years now. However, they are currently gaining increasing importance, and were the third-highest trending technology in 2020 according to the IEEE Computer Society [
6].
The key elements of DTs are the physical component, the digital component, and the communication link between them, involving bidirectional communication to keep the two mirror elements constantly updated. The digital counterpart is the element that allows to increase the capabilities of a normal physical object or system by adding, for example, an AI component.
In general, DTs are employed in many sectors, including the manufacturing industry [
7,
8], and in energy production [
9,
10], agriculture [
11], transportation [
12], and many others [
13,
14]. Due to their multiple application possibilities and their ability to improve the efficiency and effectiveness of processes and systems, it is expected that their use will be sustained in the future.
Particular attention is paid to the application of this technology in the healthcare field [
15,
16,
17]. It is considered that by applying such technology it is possible to provide doctors with a valuable tool to analyze data in real time, monitor patients’ conditions, and prevent possible diseases by correlating the obtained information with AI techniques [
18,
19].
In the medical field, DTs can be used to simulate the behavior of organs, tissues, or parts of the human body [
20]. These models can be used to improve the current understanding of diseases, predict possible complications, and develop new therapies. For example, a DT that replicates the cardiovascular system can be used to simulate synthetic photoplethysmogram (PPG) data to evaluate blood flow and pressure, as well as to predict possible obstructions and arteriosclerosis [
21], thus assisting doctors in making decisions concerning the most suitable treatment for the patient.
Another example of the use of DTs in medicine concerns the design of customized prostheses and medical devices [
22]. DTs can also be used for simulations of complex surgical procedures [
23], analysis of medical device performance, and disease prevention through the collection and analysis of patient data.
The use of DTs in the medical field is not only aimed at the services provided by the healthcare facility, but also to optimize the structure itself, as described by Karakra et al. [
24], where a tool is proposed to evaluate the efficiency of healthcare services in real time using predictive analysis. There are other papers that focus on assisting the elderly [
25] and systems for detecting ischemic heart disease (IHD) [
26]. Finally, some papers aim at analyzing healthcare assistance based on the metaverse [
27].
Among the various application contexts discussed, extensive studies have focused on the use of DTs in the cardiac field, which is also the subject of the current research. In fact, it is well known that there are some pathologies, such as myocardial infarction, which—if properly monitored—could decrease the mortality rate [
28].
As proposed by Gillette et al. [
29] cardiac digital twins (CDTs) may be used as digital replicas of patients’ hearts, thus assisting in clinical decision making and testing of new therapies.
A study proposed by Bodin et al. [
30] focuses on the use of computer graphics to visualize the electrical activity of the heart using a voxel representation of a 3D heart model and a spring voxel as a unit volume. The paper also discusses the process of voxelization and the use of mathematical models for visualization based on the Aliev–Panfilov model. The possibility of presenting ischemic myocardial damage using the developed model is also considered.
Similarly, a study proposed by Martinez-Velazquez et al. [
26] describes the architecture referred to as the cardio twin, designed to detect IHD and prevent heart problems such as ischemia and stroke. The technology uses a classification algorithm, known as the convolutional neural network (CNN), trained on data from the “PTB Diagnostic ECG Database” in Physio Bank. Each patient data sample was divided into 2.5 s windows for training, and the model achieved an accuracy of 85.77%. The platform was designed to operate entirely at the edge of the network in a possible future.
The study proposed by Elayan et al. [
31] implements a DT framework for intelligent healthcare systems by monitoring patient’s health status and constructing an ECG cardiac rhythm-classification model to diagnose heart diseases and detect heart problems. The proposed framework integrates DTs with the healthcare sector, thus improving healthcare processes and contributing to creating a complete and scalable intelligent healthcare ecosystem with the aim of promoting health, increasing life expectancy, reducing healthcare costs, and addressing many healthcare problems and challenges. In addition, an ECG signal classifier is implemented based on various machine learning (ML) and deep learning (DL) techniques for continuous monitoring and detecting cardiac anomalies. Experimental results show that DL-based systems (CNN and long short-term memory, LSTM) offer better performance, and about 96–97% accuracy, than techniques based on ML (multilayer perceptron (MLP), support vector classification (SVC), logistic regression (LR)).
Comparing the state of the art with real-life scenarios, the authors put forward the following two key objectives:
The first objective of this study is to create an infrastructure for the heart DT capable of operating with real-time data acquired from wearable devices such as smartwatches. These smart devices provide us with data related to blood oxygen saturation, blood pressure, ECG, pulse, etc. In particular, this study focuses on the verification and validation of ECG data, provided by smartwatch, using DL techniques. An inference will be made on the data using a pretrained neural network model with a dataset containing ECG signals related to various cardiac pathologies.
The second objective is to place this approach in a broader context, in which the patient’s health will be entirely monitored using different types of DTs, each characterizing a specific organ.
3. Heart DT
3.1. Heart DT Architecture and Implementation
The creation of a heart DT involves the presence of various functional components both in the digital and real world. The implementation of such a system requires the use of technologies capable of making the entire system scalable, dynamic, and resilient. For this reason, a modular approach was chosen, dividing the workflow into functional blocks.
The enabling technology combines microservices, which natively possess characteristics that perfectly fit with the requirements of the heart DT architecture, such as scalability, robustness, and isolation.
The following technologies were used for the development of the architecture: Docker [
32] as the execution environment for microservices, while Kubernetes [
33] was chosen for their orchestration.
The functional blocks for the implementation of the proposed architecture with the corresponding software applications are described below.
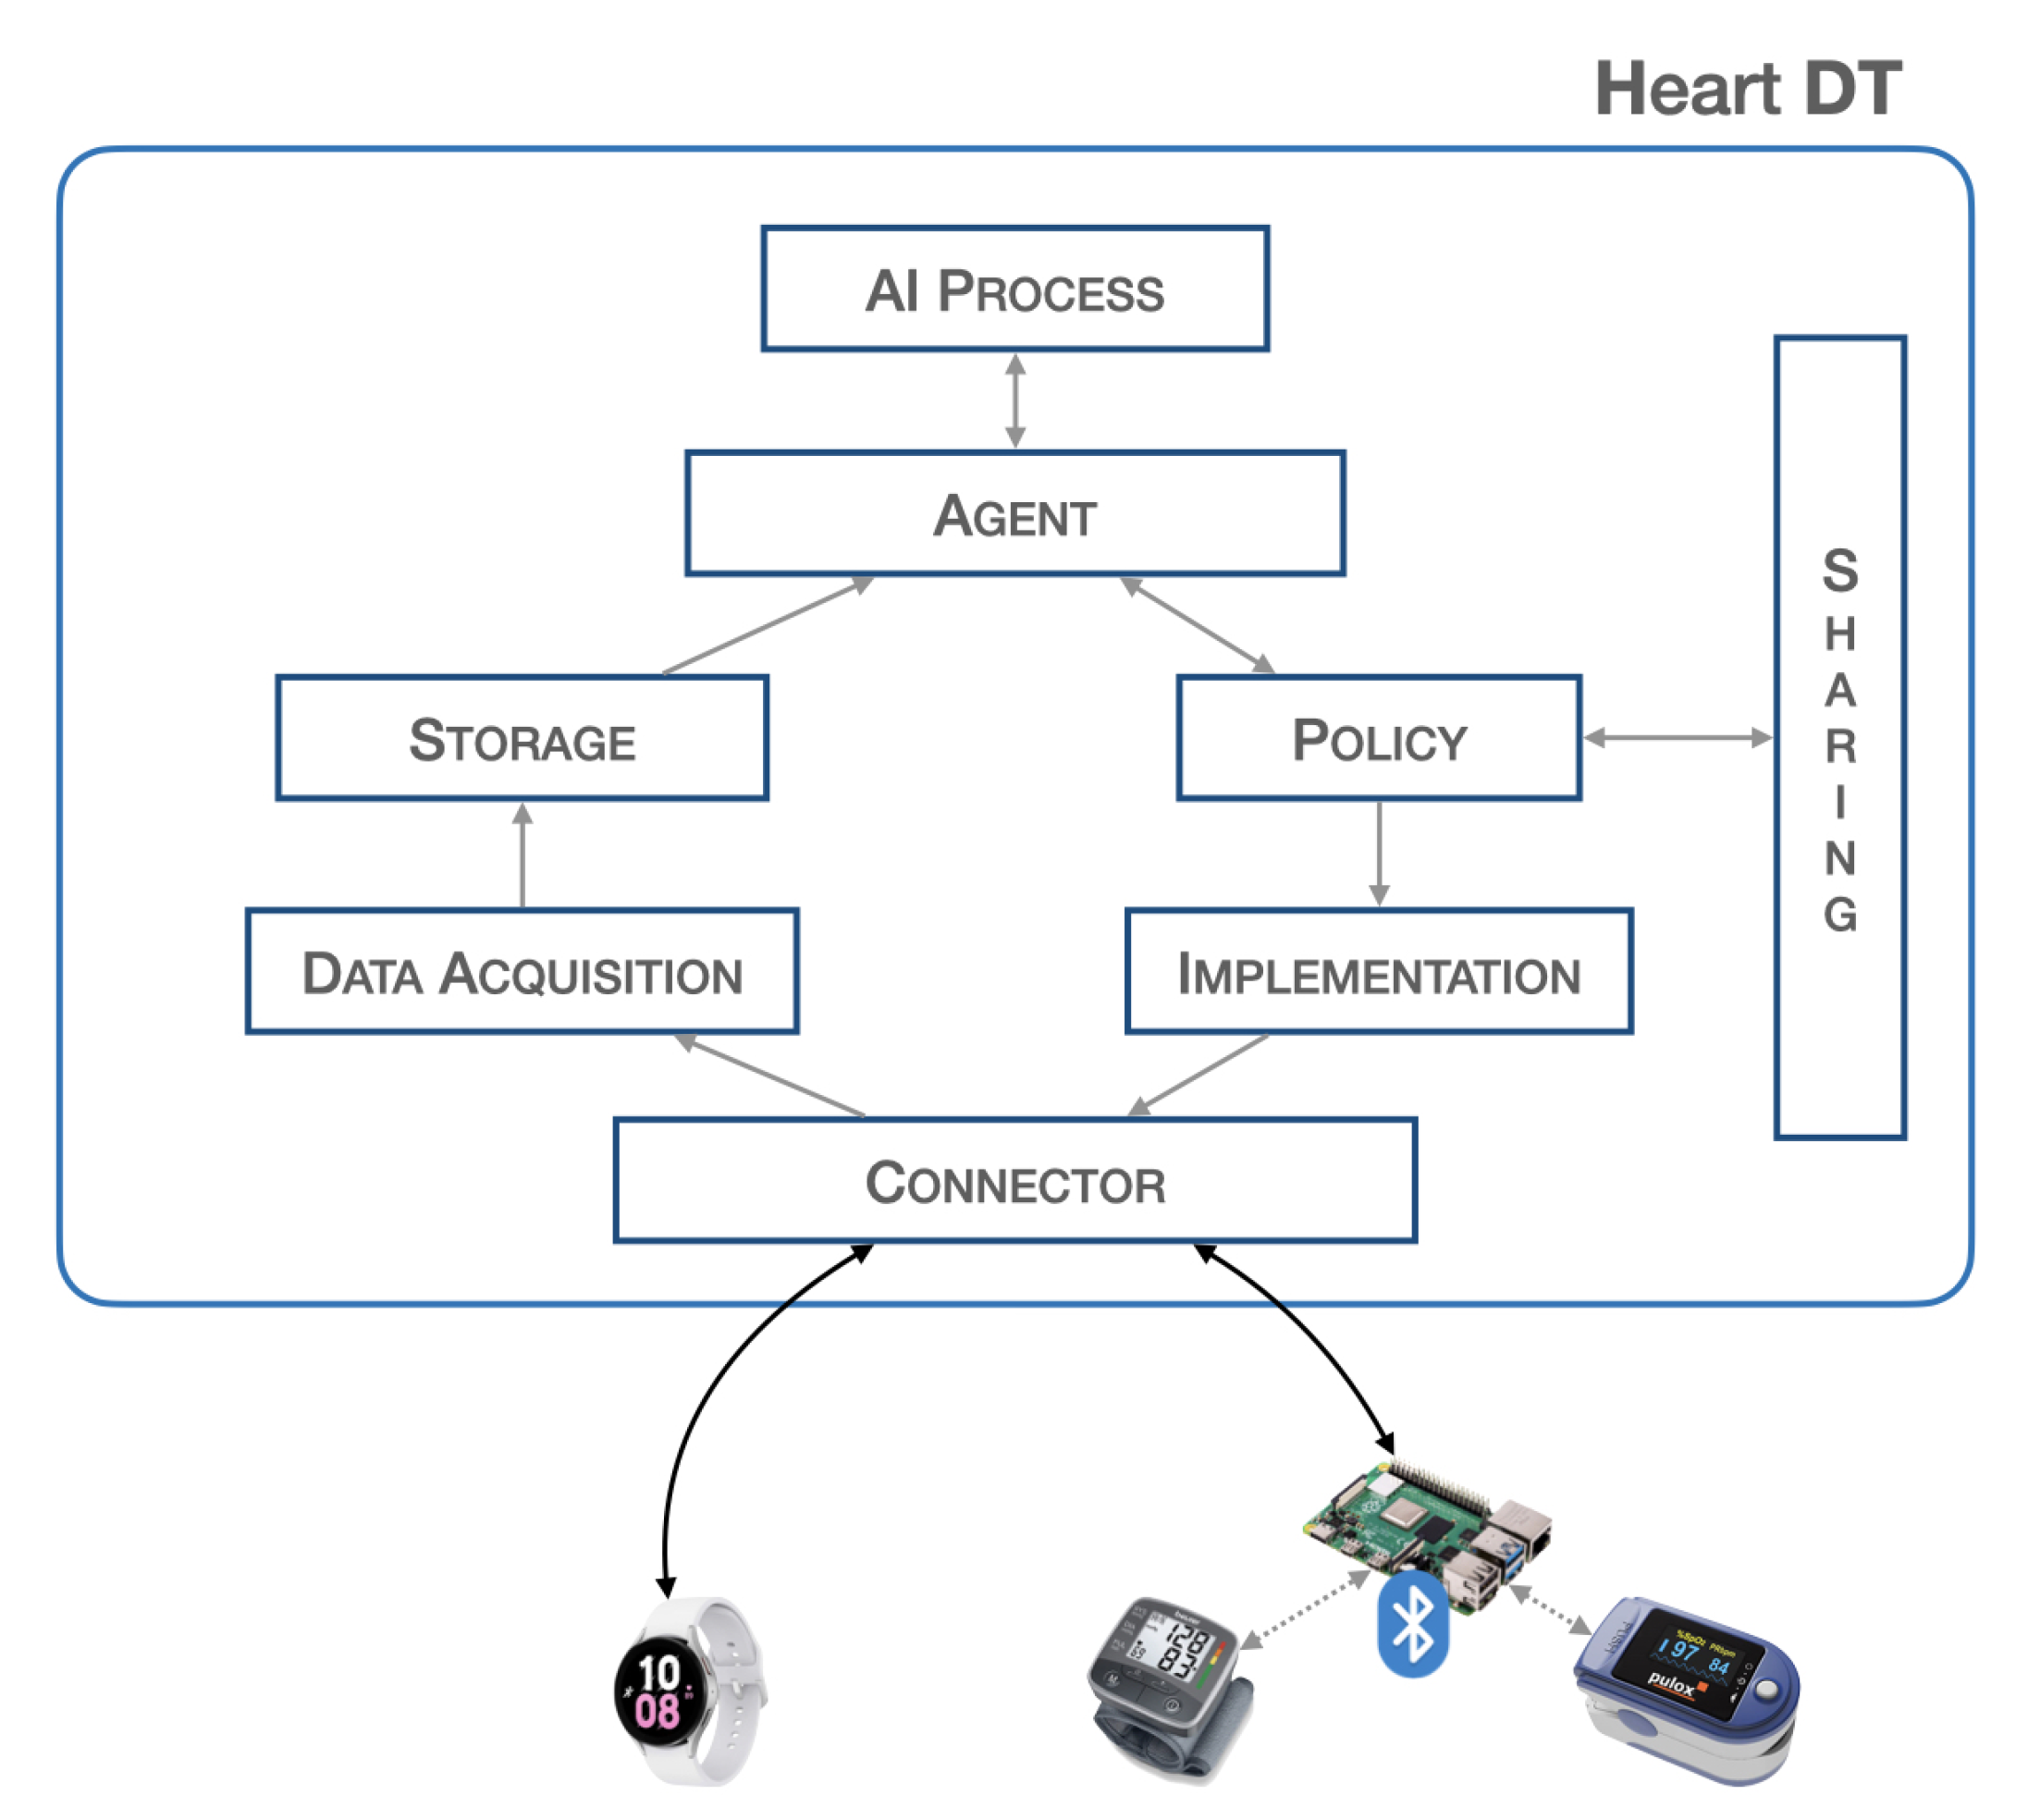
Figure 1 provides a block representation of the proposed system.
The blocks described are, furthermore, all independent of each other and are activated when an underlying block sends and schedules possible actions. Such a structure allows for the creation of a dynamic and scalable heart DT that can host a large volume of data and can interact with other elements. The workflow of the entire system is illustrated in
Section 3.2.
Connector:
The connector block is responsible for establishing connections with the physical world, allowing bidirectional data transfer. It is necessary to ensure connectivity with various communication protocols such as HTTP, MQTT, etc., and guarantee the safety of communications so as not to invalidate data and adapt the data format to the platform. The platform is designed to have a single endpoint, i.e., a single IP address that all sensors point to. There are proxy policies in place that allow for discrimination of the respective connector based on the path. If communication requires higher level of security, such as control of actuators, VPN tunnels will be established within the connector block to ensure the highest level of security. This architecture respects all principles of GDPR. This block consists of two PODs (PODs are the smallest deployable units of computing that you can create and manage in Kubernetes,
https://kubernetes.io/docs/concepts/workloads/pods/, accessed on 19 April 2023) that establish the connection with the outside world. In particular, there may be a POD that implements a REST API server for the acquisition of biomedical data from the physical world, and a second POD that passes this information to the higher-level blocks. In this scenario, since the implementation in the physical world is not expected, we do not find any POD that schedules commands to any actuators. SERVICES are configured to expose services outside the Kubernetes cluster via NodePort.
Data Acquisition:
The data acquisition block is responsible for acquiring the data, it filters and preprocesses the data before storage. At the implementation level, there is a need to manage various PODs for filtering and preprocessing raw data. In particular, the first POD is set up to communicate with the connector block, the second POD performs data resampling, and the third POD extracts a specific time window. At the end of these processes, the data is sent to the database in a specific previously defined format.
Storage:
The storage block contains a database that stores the acquired data. This is useful because many applications need to have a significant amount of historical data for better analysis. This block contains three PODs: the first POD runs a database instance (such as mysql), the second POD performs queries such as inserting and extracting data from it, whereas the third POD communicates with the other blocks. Implementing this block requires configuring a Volumemounts to ensure data consistency in the event of an abnormal system shutdown.
Agent:
The agent block is the main element responsible for starting (according to specific policies) the inference process to validate the data extracted from the database. Furthermore, once the output from the validation is obtained, it is used to send commands to the physical world or share the information with other elements. The implementation of this block requires the development of various PODs: a POD that manages the time and schedule of all operations, a POD that extracts data from the database, a POD that passes this information to the AI process block, and a POD that interacts with the policy and implementation blocks.
AI process:
The AI process block is responsible for validating the real-time data previously captured through the inference process. At the implementation level, this block consists of a POD that receives data from the agent and another POD that performs inference and returns the result. The latter POD contains the trained neural network model.
Policy:
The policy block is responsible for defining the boundaries that the processed data and information must have, specifying the limits within which it is or is not possible to pass certain information, thus avoiding modifying certain parameters beyond certain thresholds.
This block consists of a POD containing a descriptor, listing all the information-sharing policies and thresholds for implementing actions, through actuators, in the real world.
Implementation:
The implementation block is responsible for executing, with the authorization of the policy block, the corrective actions suggested by the agent or other DTs to the actuators. The implementation block also manages connections with actuation devices operating in the physical world, and adapts the information from higher-level components to the physical devices. The implementation takes place through a POD that defines specific operations and commands to be scheduled in real devices; for this reason, its implementation depends on specific cases.
Sharing:
The sharing block allows the sending and receiving of information from other elements, particularly by exposing a REST API server. This provides an endpoint through which it is possible to contact and be contacted for data and information exchange. This block consists of a POD that implements a REST API server to expose communication interfaces to other objects.
3.2. Heart DT Workflow
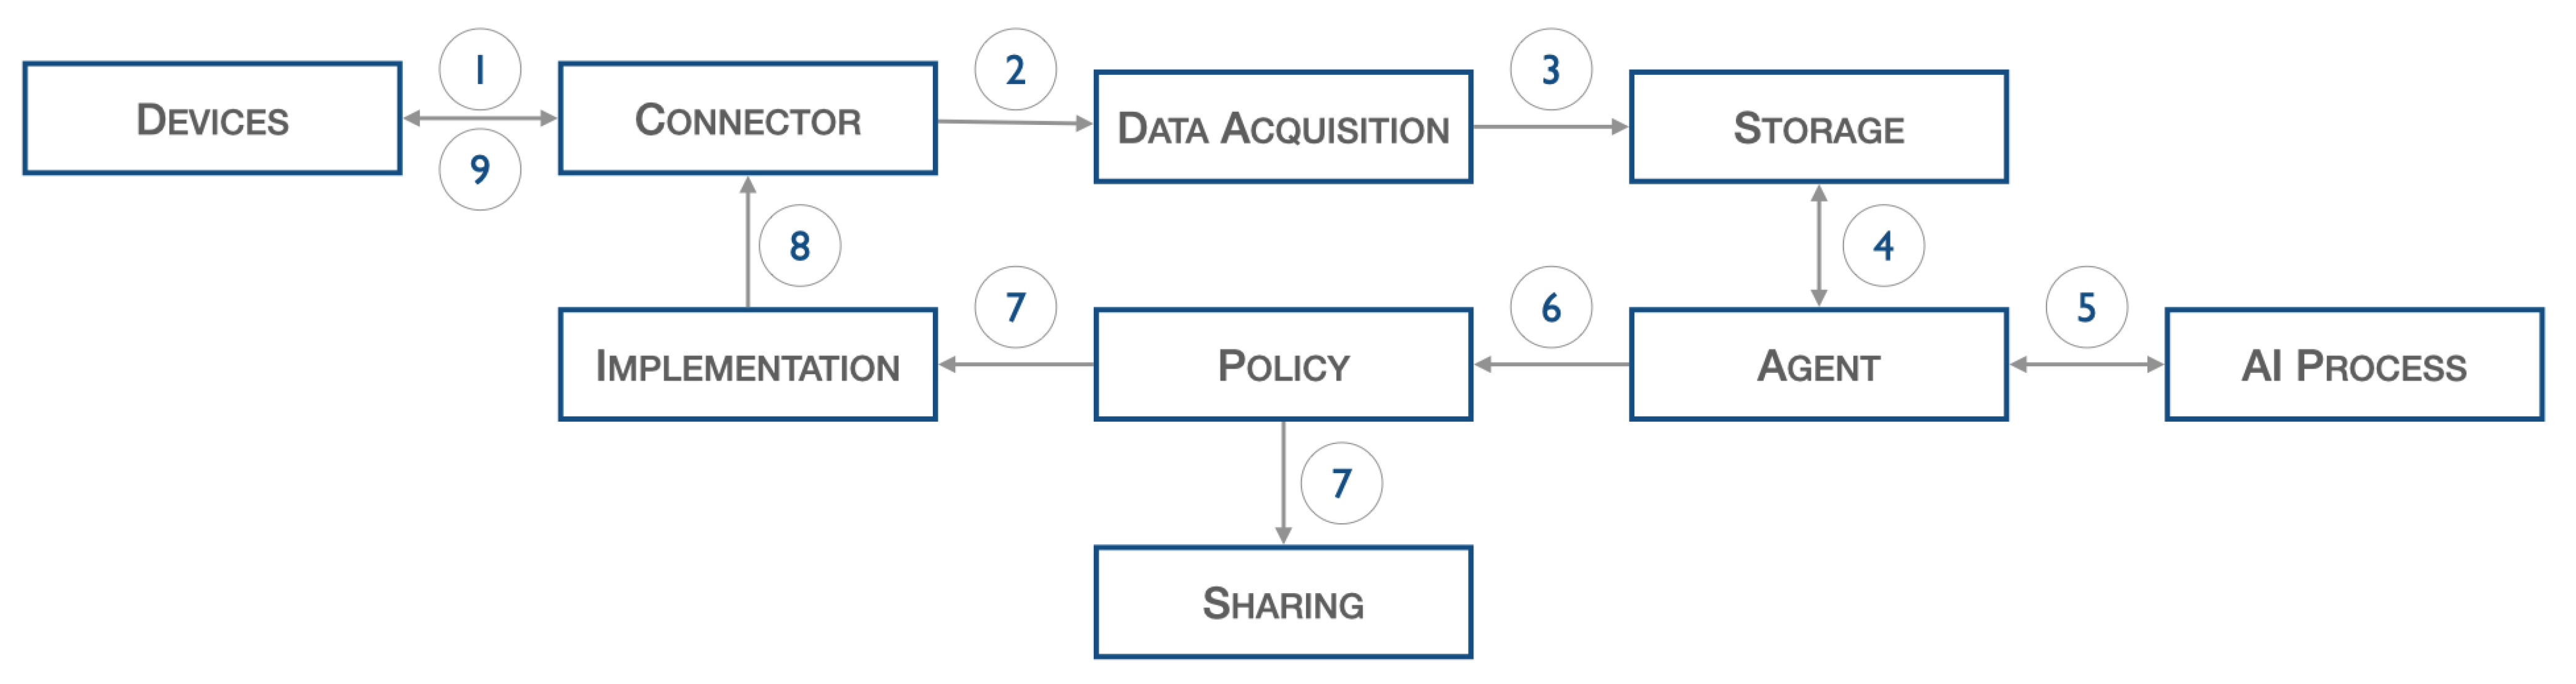
The architecture introduced above, illustrated in
Figure 2, describes the following workflow.
Data from IoT sensors, such as ECG, pressure, and pulse, are acquired and sent to the connector (1), which forwards them to the data acquisition stage (2). The latter, after performing normalization operations, inserts the filtered data into the database (3). The agent block, at certain fixed periods set during the configuration phase, start the validation process: specifically, the previously input data are extracted from the database (4) and passed to the AI process block (5), which perform inference on it.
As a result of this last process, certain actions are decided upon, but these are first screened by the policy block (6). Once consent is obtained from the policy block, information can be shared with other elements through the sharing block (7) or commands can be scheduled to the physical world through the Implementation block (7). The latter interacts with the Connector block (8) to forward the command to the actual device (9).
4. Testbed Setup of Heart DT
In this section, the authors use the architecture introduced in
Section 3.1 to implement the heart DT based on ECG signals. The authors selected a smartwatch capable of recording ECG signals instead of specific medical devices to ensure ease in taking measurements. The proof of concept was carried out by identifying two healthy subjects (normal heartbeats), a man and a woman, and recording their ECGs. The subjects were given two identical smartwatches, namely two Samsung Galaxy Watch 5, with an ECG signal-sampling rate of 500 samples per second. The authors denominated the two observed subjects as Patient A and Patient B.
Section 4.1 provides a brief description of the structure of the ECG signal. The neural network model used to perform real-time data inference is described in detail in
Section 4.2. Finally,
Section 4.3 assesses the overall performance of the inference process.
4.1. ECG Signal Background
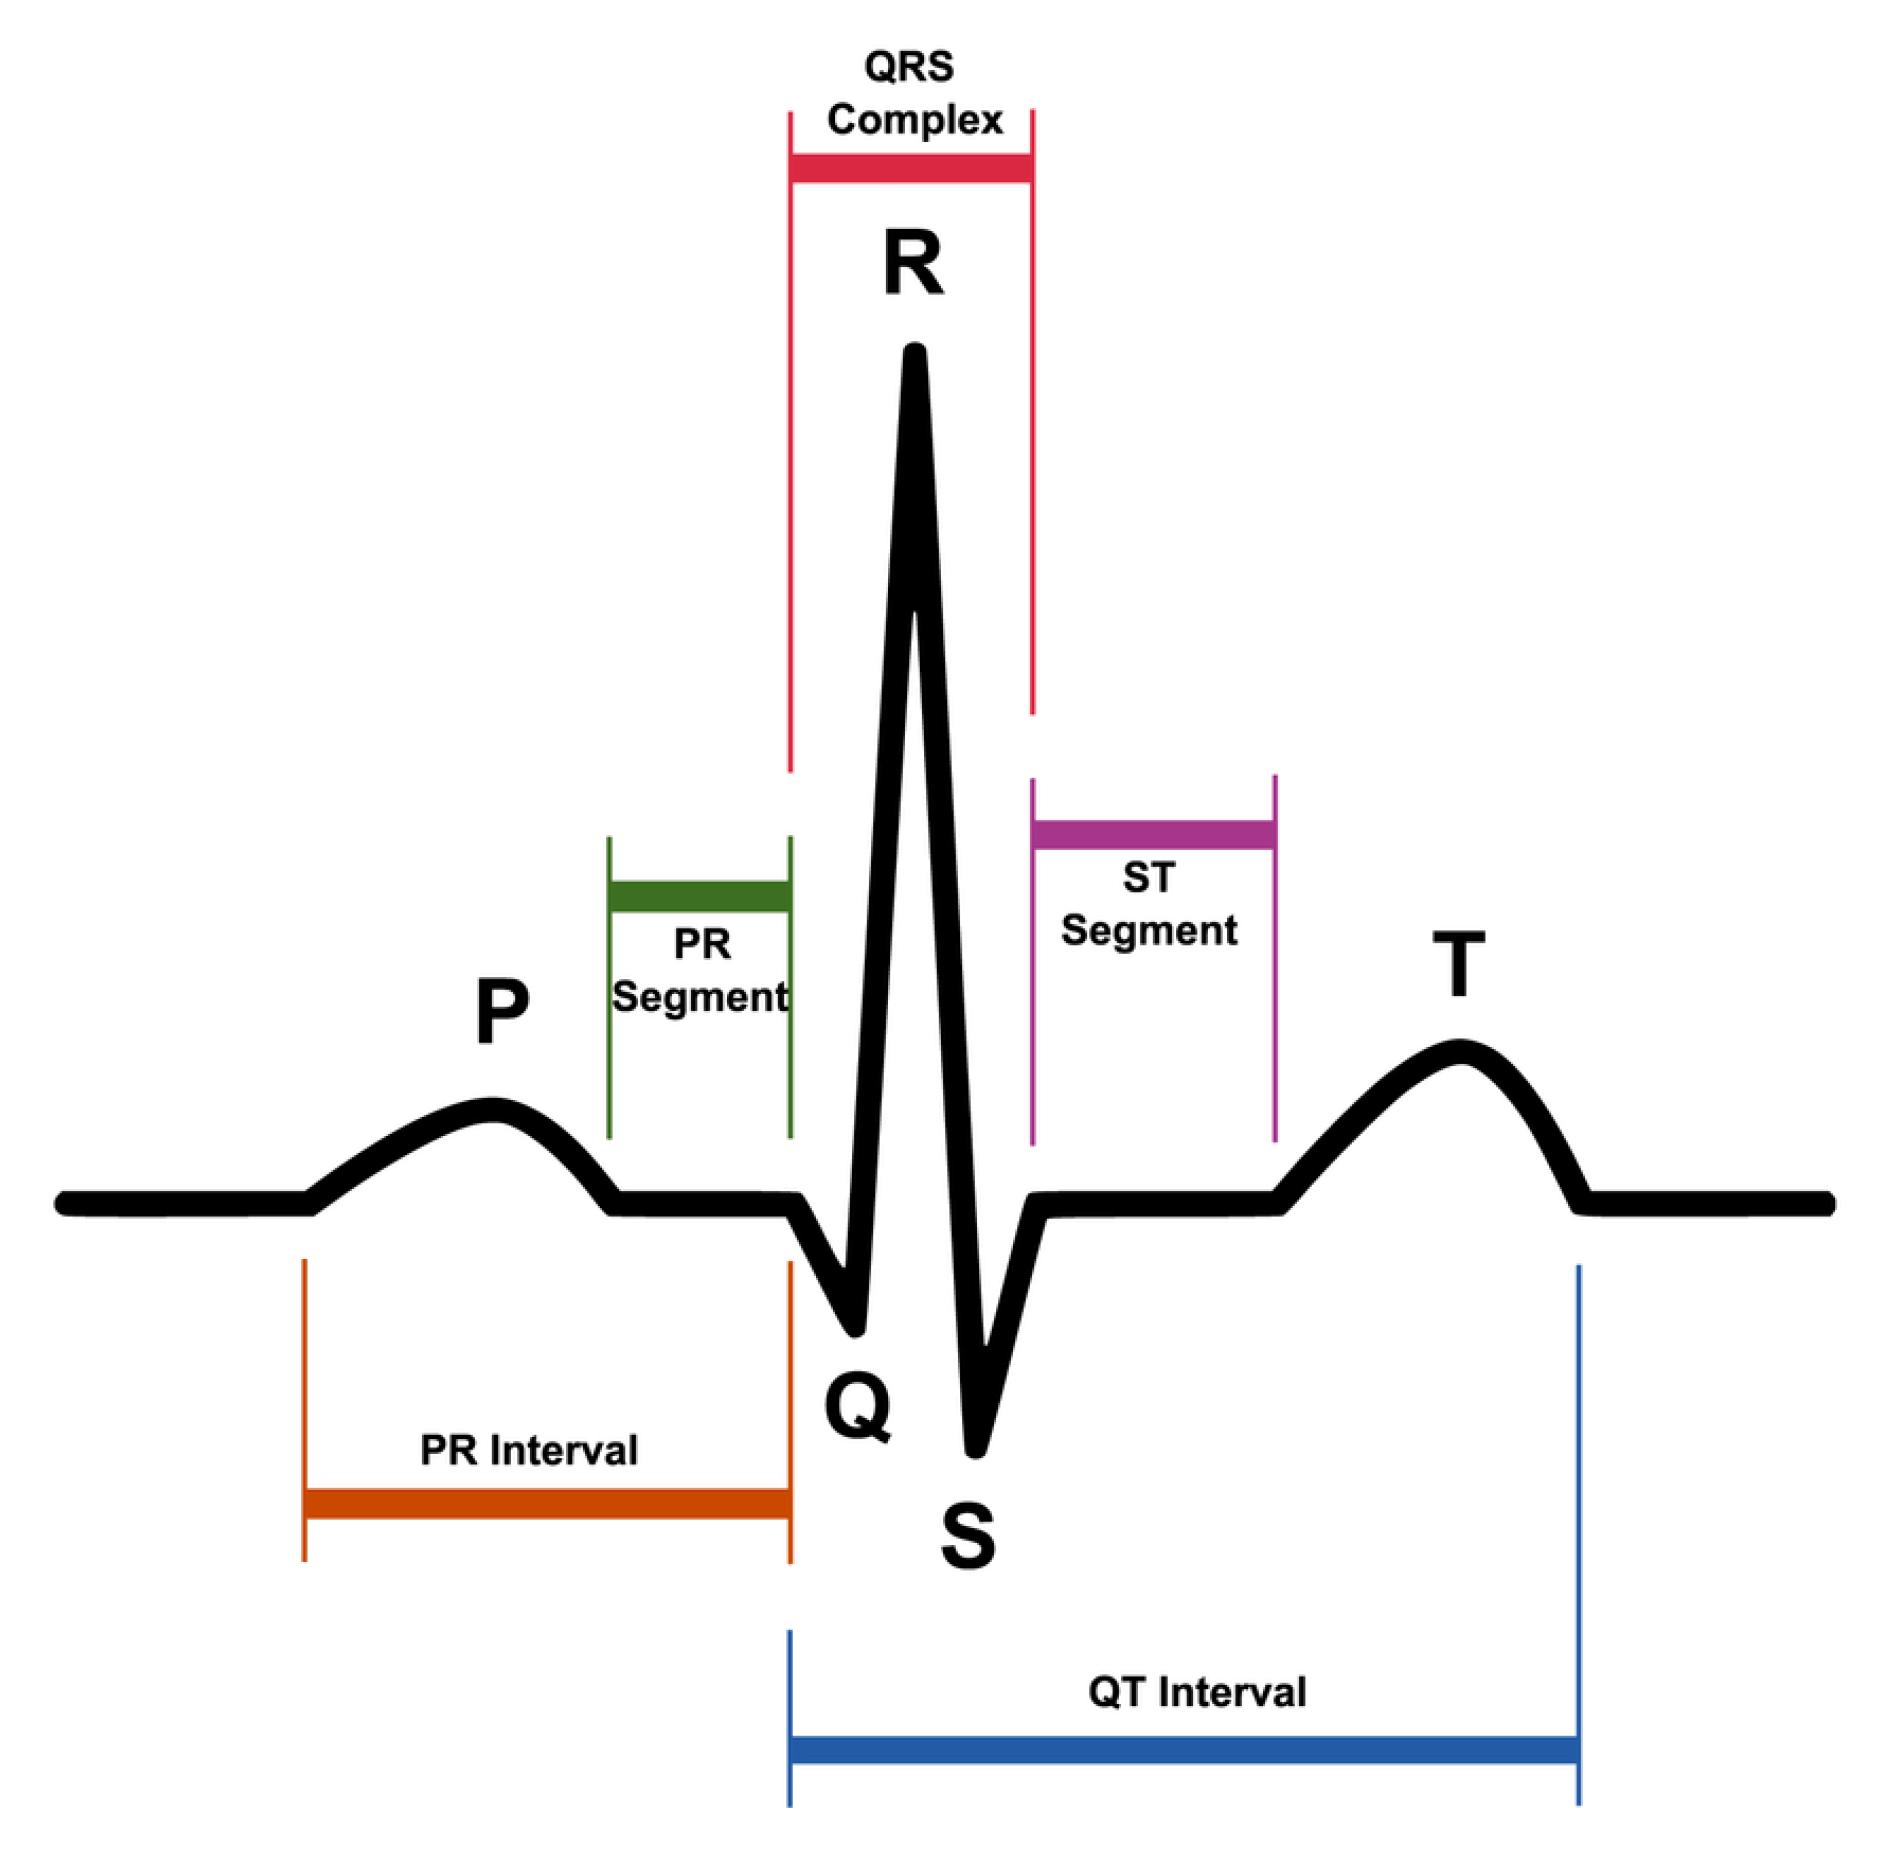
ECG represents the electrical activity of the heart during its regular operation.
Figure 3 shows the most significant elements of an ECG signal.
The P wave is the first wave that occurs in the ECG cycle and represents atrial depolarization, commonly referred to as “atrial contraction”;
The T wave represents ventricular depolarization or more commonly denominated “ventricular relaxation”;
The Q, R, and S waves form the so-called QRS complex that represents ventricular contraction.
Commonly, ECG is used to diagnose heart diseases [
34].
In the literature, there are public datasets containing ECG signals of normal beats and beats related to different types of heart pathologies. Thus,
Section 4.2 illustrates the dataset used for training the neural network.
4.2. ECG Datasets and Pre-Trained CNN Model Description
The dataset used for training the neural network was derived from the combination of two public datasets: the MIT-BIH Arrhythmia Dataset [
35,
36] and the MIT-BIH Atrial Fibrillation Dataset [
37]. The first dataset contains ECG recordings of 47 subjects for a total of 48 ECG recordings each lasting 30 min. The recordings refer to different types of cardiac pathologies: normal sinus rhythm (N), paced rhythm (P), atrial fibrillation (AFIB), ventricular bigeminy (B), and sinus bradycardia (SBR). The recordings were digitized at 360 samples per second over a range of ±10 mV.
The second dataset consists of 25 ECG recordings of subjects with atrial fibrillation, in particular, AFIB, AFL, J (AV junctional rhythm), and N (used to indicate all other rhythms). Each recording has a duration of 10 h, and the signals were sampled at 250 samples within an interval of ±10 mV.
The combination of the two datasets is performed by preanalyzing the data, since the recordings, for each dataset, were made at a different sampling frequency (). Therefore, to combine the data, the original sequences were resampled at a frequency of = 1 kHz.
Regarding the heart disease classes, the only class that the two datasets have in common is AFIB. To combine the two datasets uniformly, the N class related to MIT-BIH atrial fibrillation and the AFIB class related to MIT-BIH arrhythmia was removed altogether.
Thus, the resulting classes from the combination of the two datasets are the following:
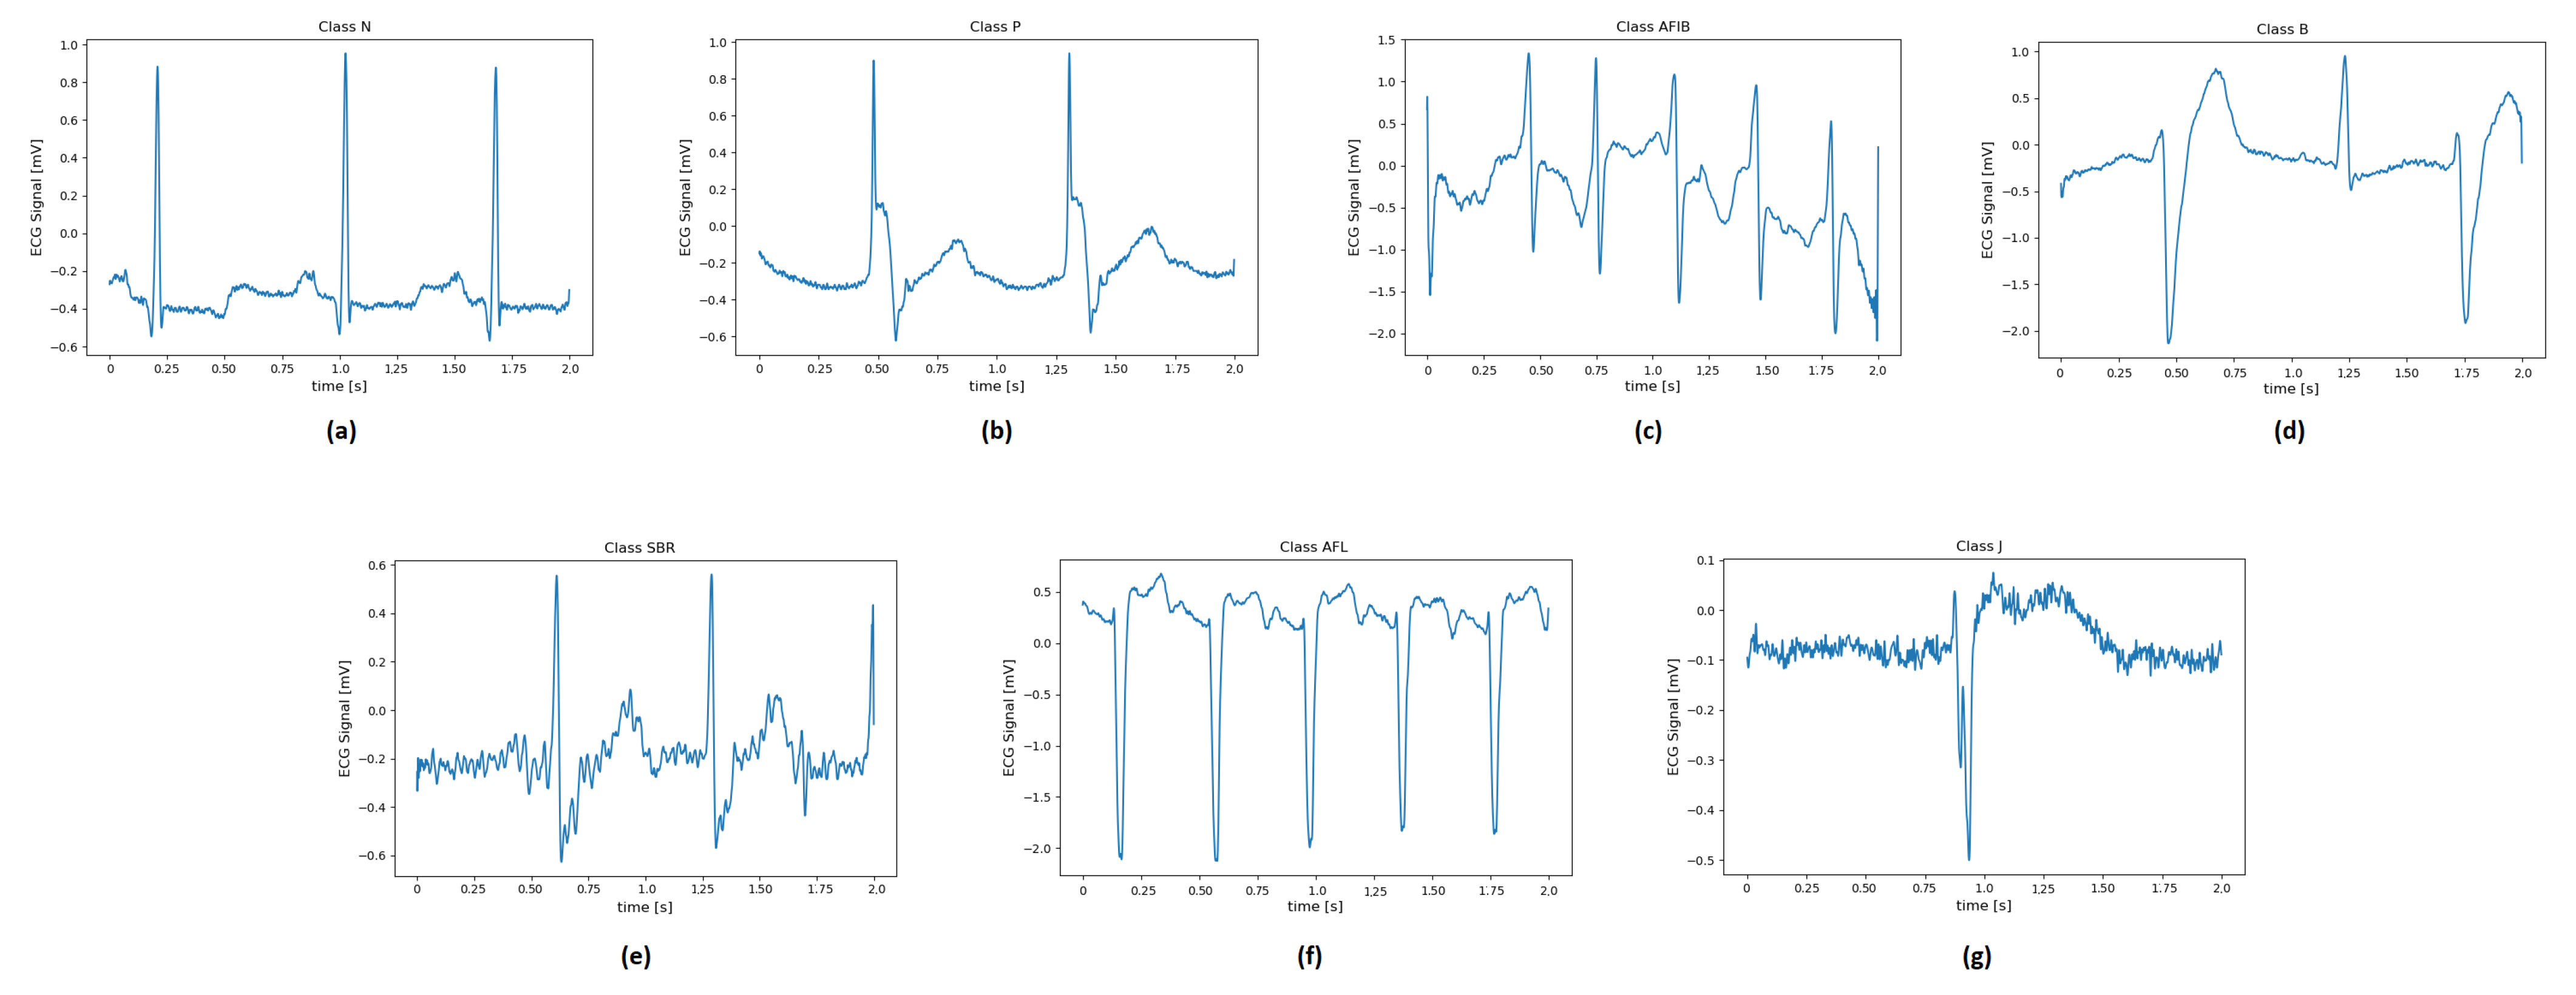
Figure 4 illustrates examples of two-second ECG recordings of each pathology.
Subsequently, to train the neural network, each ECG recording is divided into 2 s segments for each class. Considering that a resampling of the ECG sequences has been performed, the input of the neural network consists of 2 s segments (equivalent to 2000 samples).
The number of 2 s ECG sequences for each class is as follows:
N class, with 31,570 ECG recordings;
P class, with 3608 ECG recordings;
B class, with 1804 ECG recordings;
SBR class, with 902 ECG recordings;
AFIB class, with 150,157 ECG recordings;
AFL class, with 2932 ECG recordings;
J class, with 164 ECG recordings.
For the data, 70% (learning dataset) is used as input to the network for training, while the remaining 30% (testing dataset) is used to test the accuracy of the previously trained model. The architecture of the CNN network used in this study is detailed in the papers by Avanzato et al. [
4,
5]. This network consists of 5 layers, and for each hidden layer, the network includes a 1D convolution layer, batch normalization, RELU layers, and pooling layers. For the output layer, we also have the softmax layer. Once extracted, the ECG recordings are sent to the CNN network for classification of cardiovascular diseases (CVDs) into the seven previously defined classes. The resulting model, which performs well as illustrated by Avanzato et al. [
5], can be used for inference on real ECG data recorded from any type of wearable IoT sensor, after a short preanalysis of the data.
4.3. ECG Data Acquisition and Results
As previously mentioned, in order to validate the model described in
Section 4.2, real ECG recordings were acquired using two identical smartwatches with an ECG signal sampling frequency of 500 samples per second. The recording campaign was carried out on 2 healthy subjects (normal heartbeats) for a total of 4 recordings, each lasting 30 s.
For each patient, an instance of heart DT is executed. Once the data is acquired, the data acquisition block performs a filtering and preprocessing phase of the data. In particular, a resampling of the ECG signal is performed at a sampling frequency of
= 1000 Hz to match the recorded signal to the signals that constitute the network model (introduced in
Section 4.2). Subsequently, each recording is divided into 2 s long sequences.
The two heart DTs, one for each patient, perform the inference process in the AI process block with data from the smartwatches of the two patients.
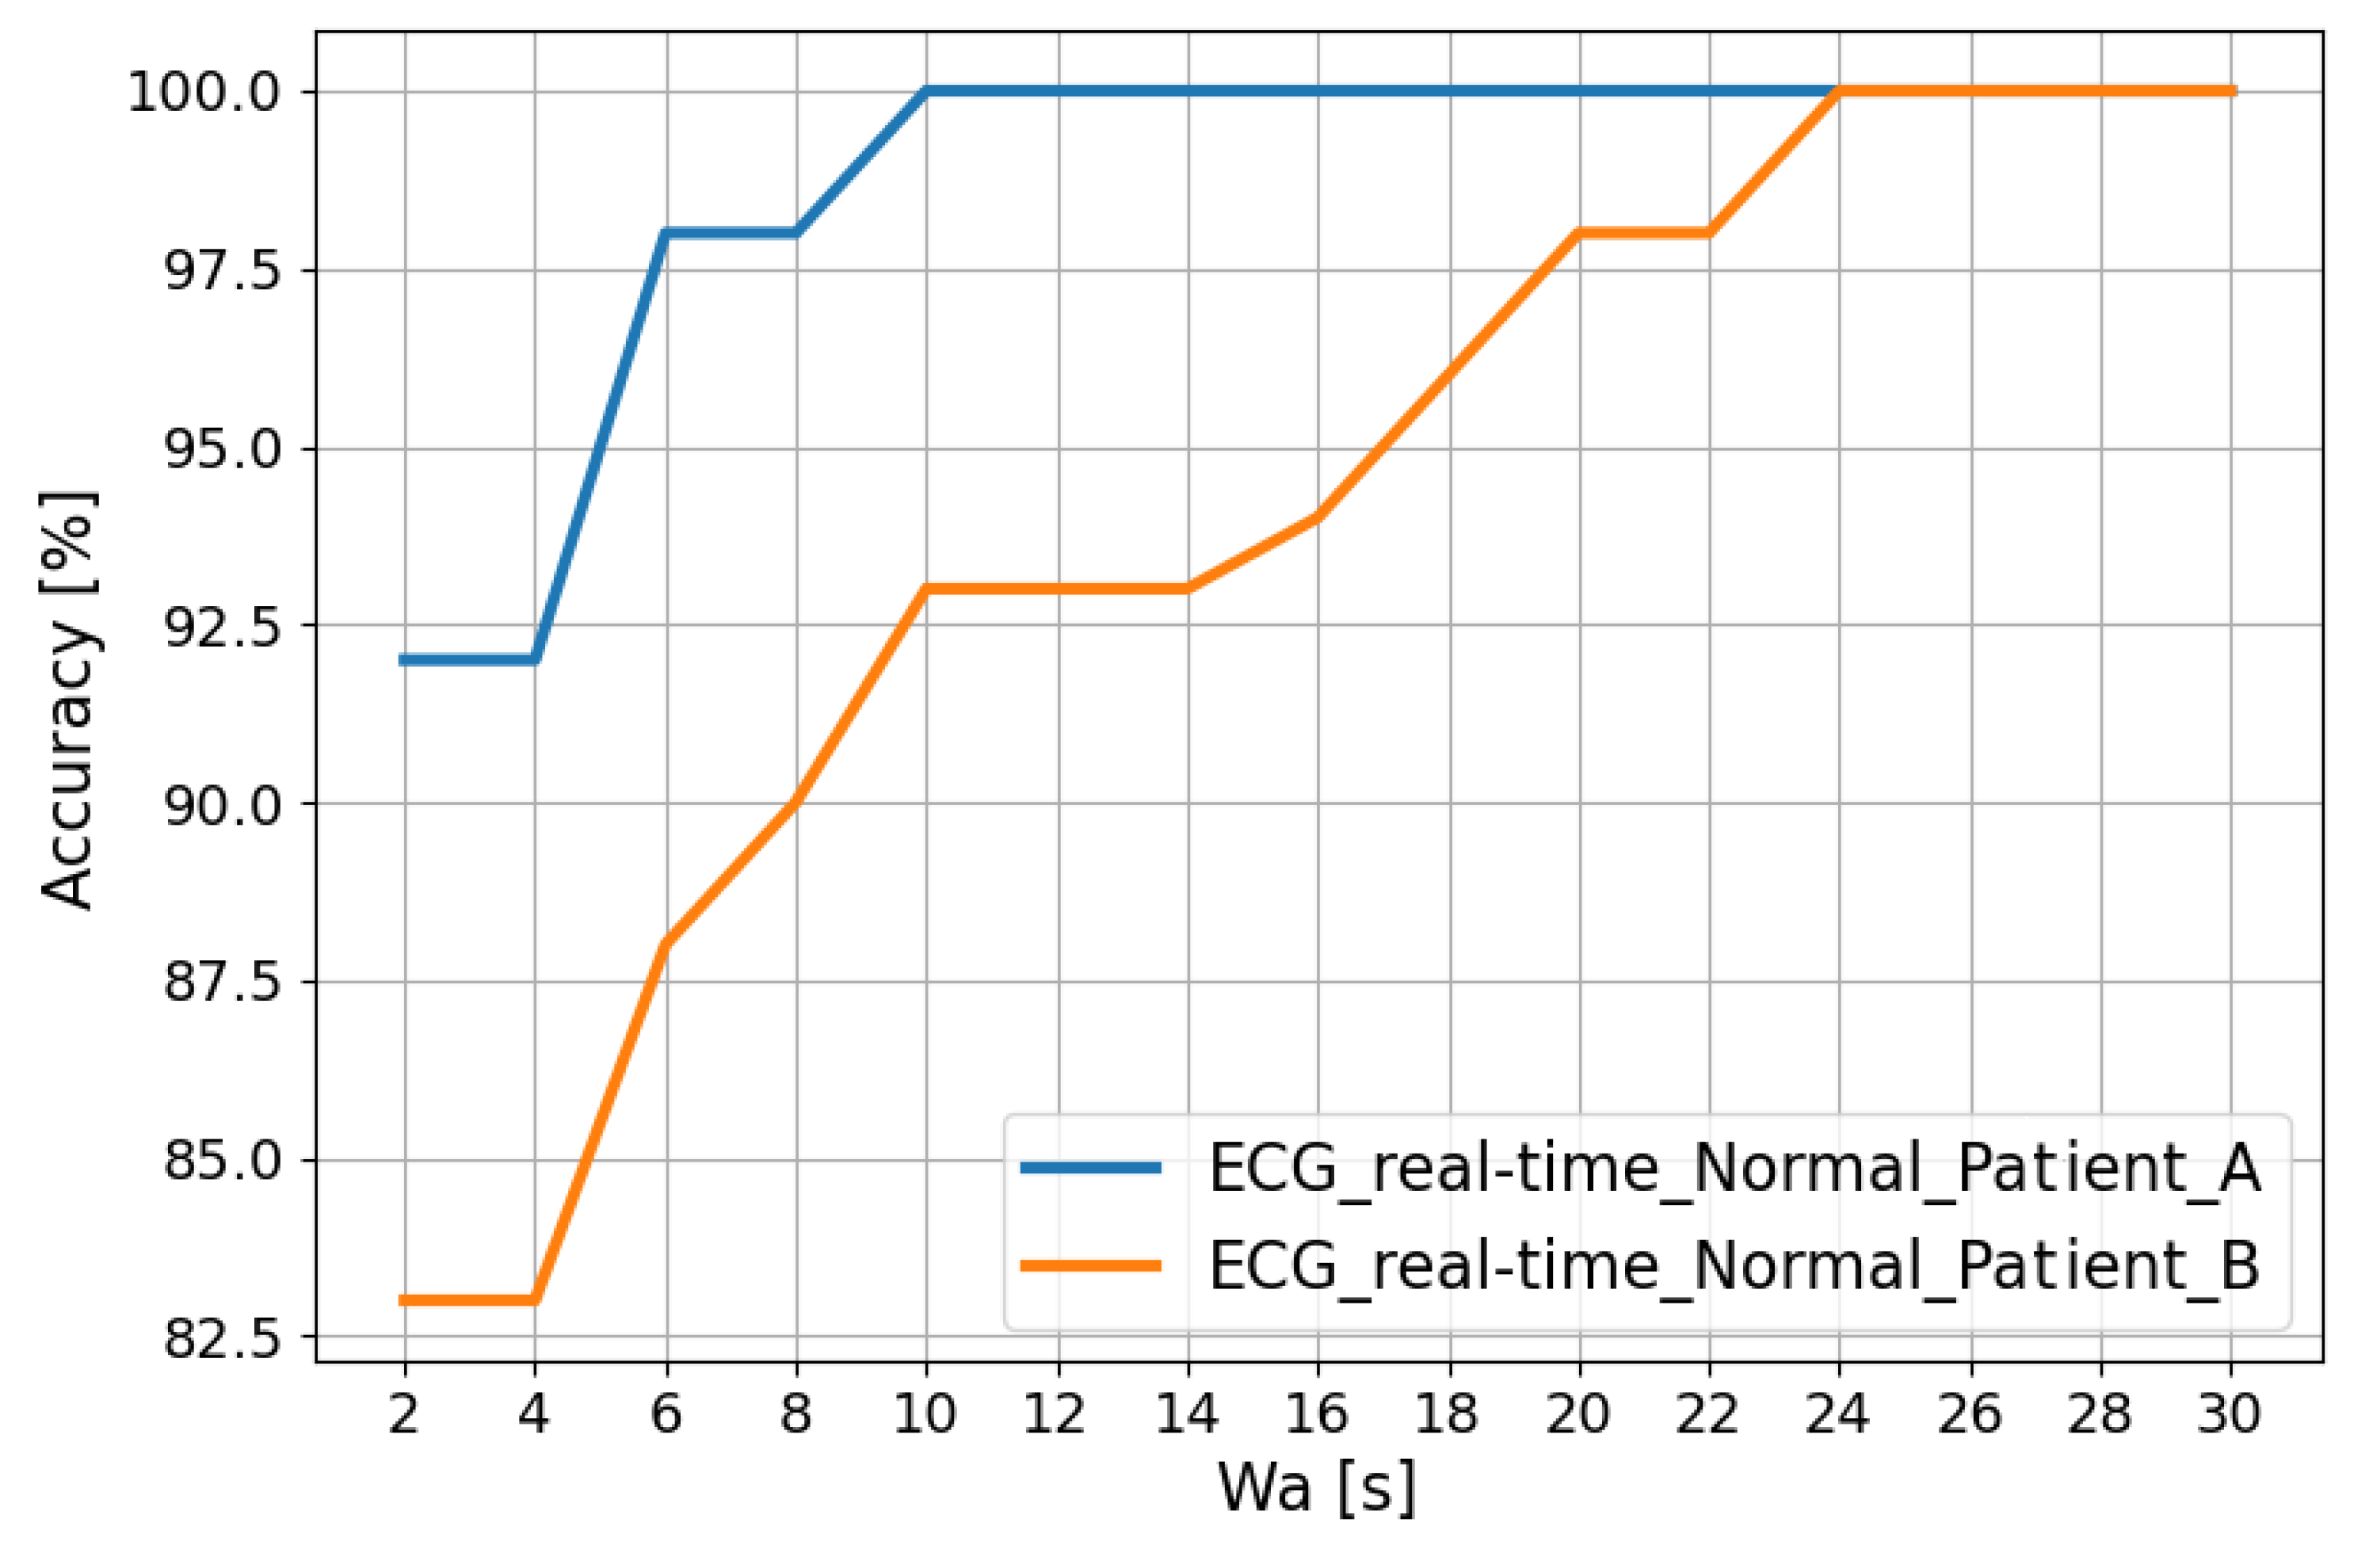
The trends in
Figure 5 show that the classification accuracy in the “Normal” class for Patient A and Patient B improves as the analysis window (
[s]) changes. In fact, this window is obtained using a post-processing filter called the “Recurrence Filter” [
38]. Using the latter, the obtained accuracy reaches 100% after about 24 s.
5. Organ DT Integration for Pathology Monitoring
As previously stated, DTs can virtualize the doctor–patient relationship, allowing remote patient monitoring using real-time data and artificial intelligence to predict the course of the disease.
The approach discussed in
Section 3 can be replicated to implement other organs as well, as suggested by Lombardo et al. [
39]. The implementation of a DT for each organ would provide the healthcare industry with additional tools for monitoring a pathology that involves the analysis and correlation of physiopathological information related to multiple organs of a single patient.
Furthermore, the DTs placed in a single platform can communicate with each other and exchange information concerning a particular pathology: if necessary, DTs may be aggregated differently to tackle the particular pathology.
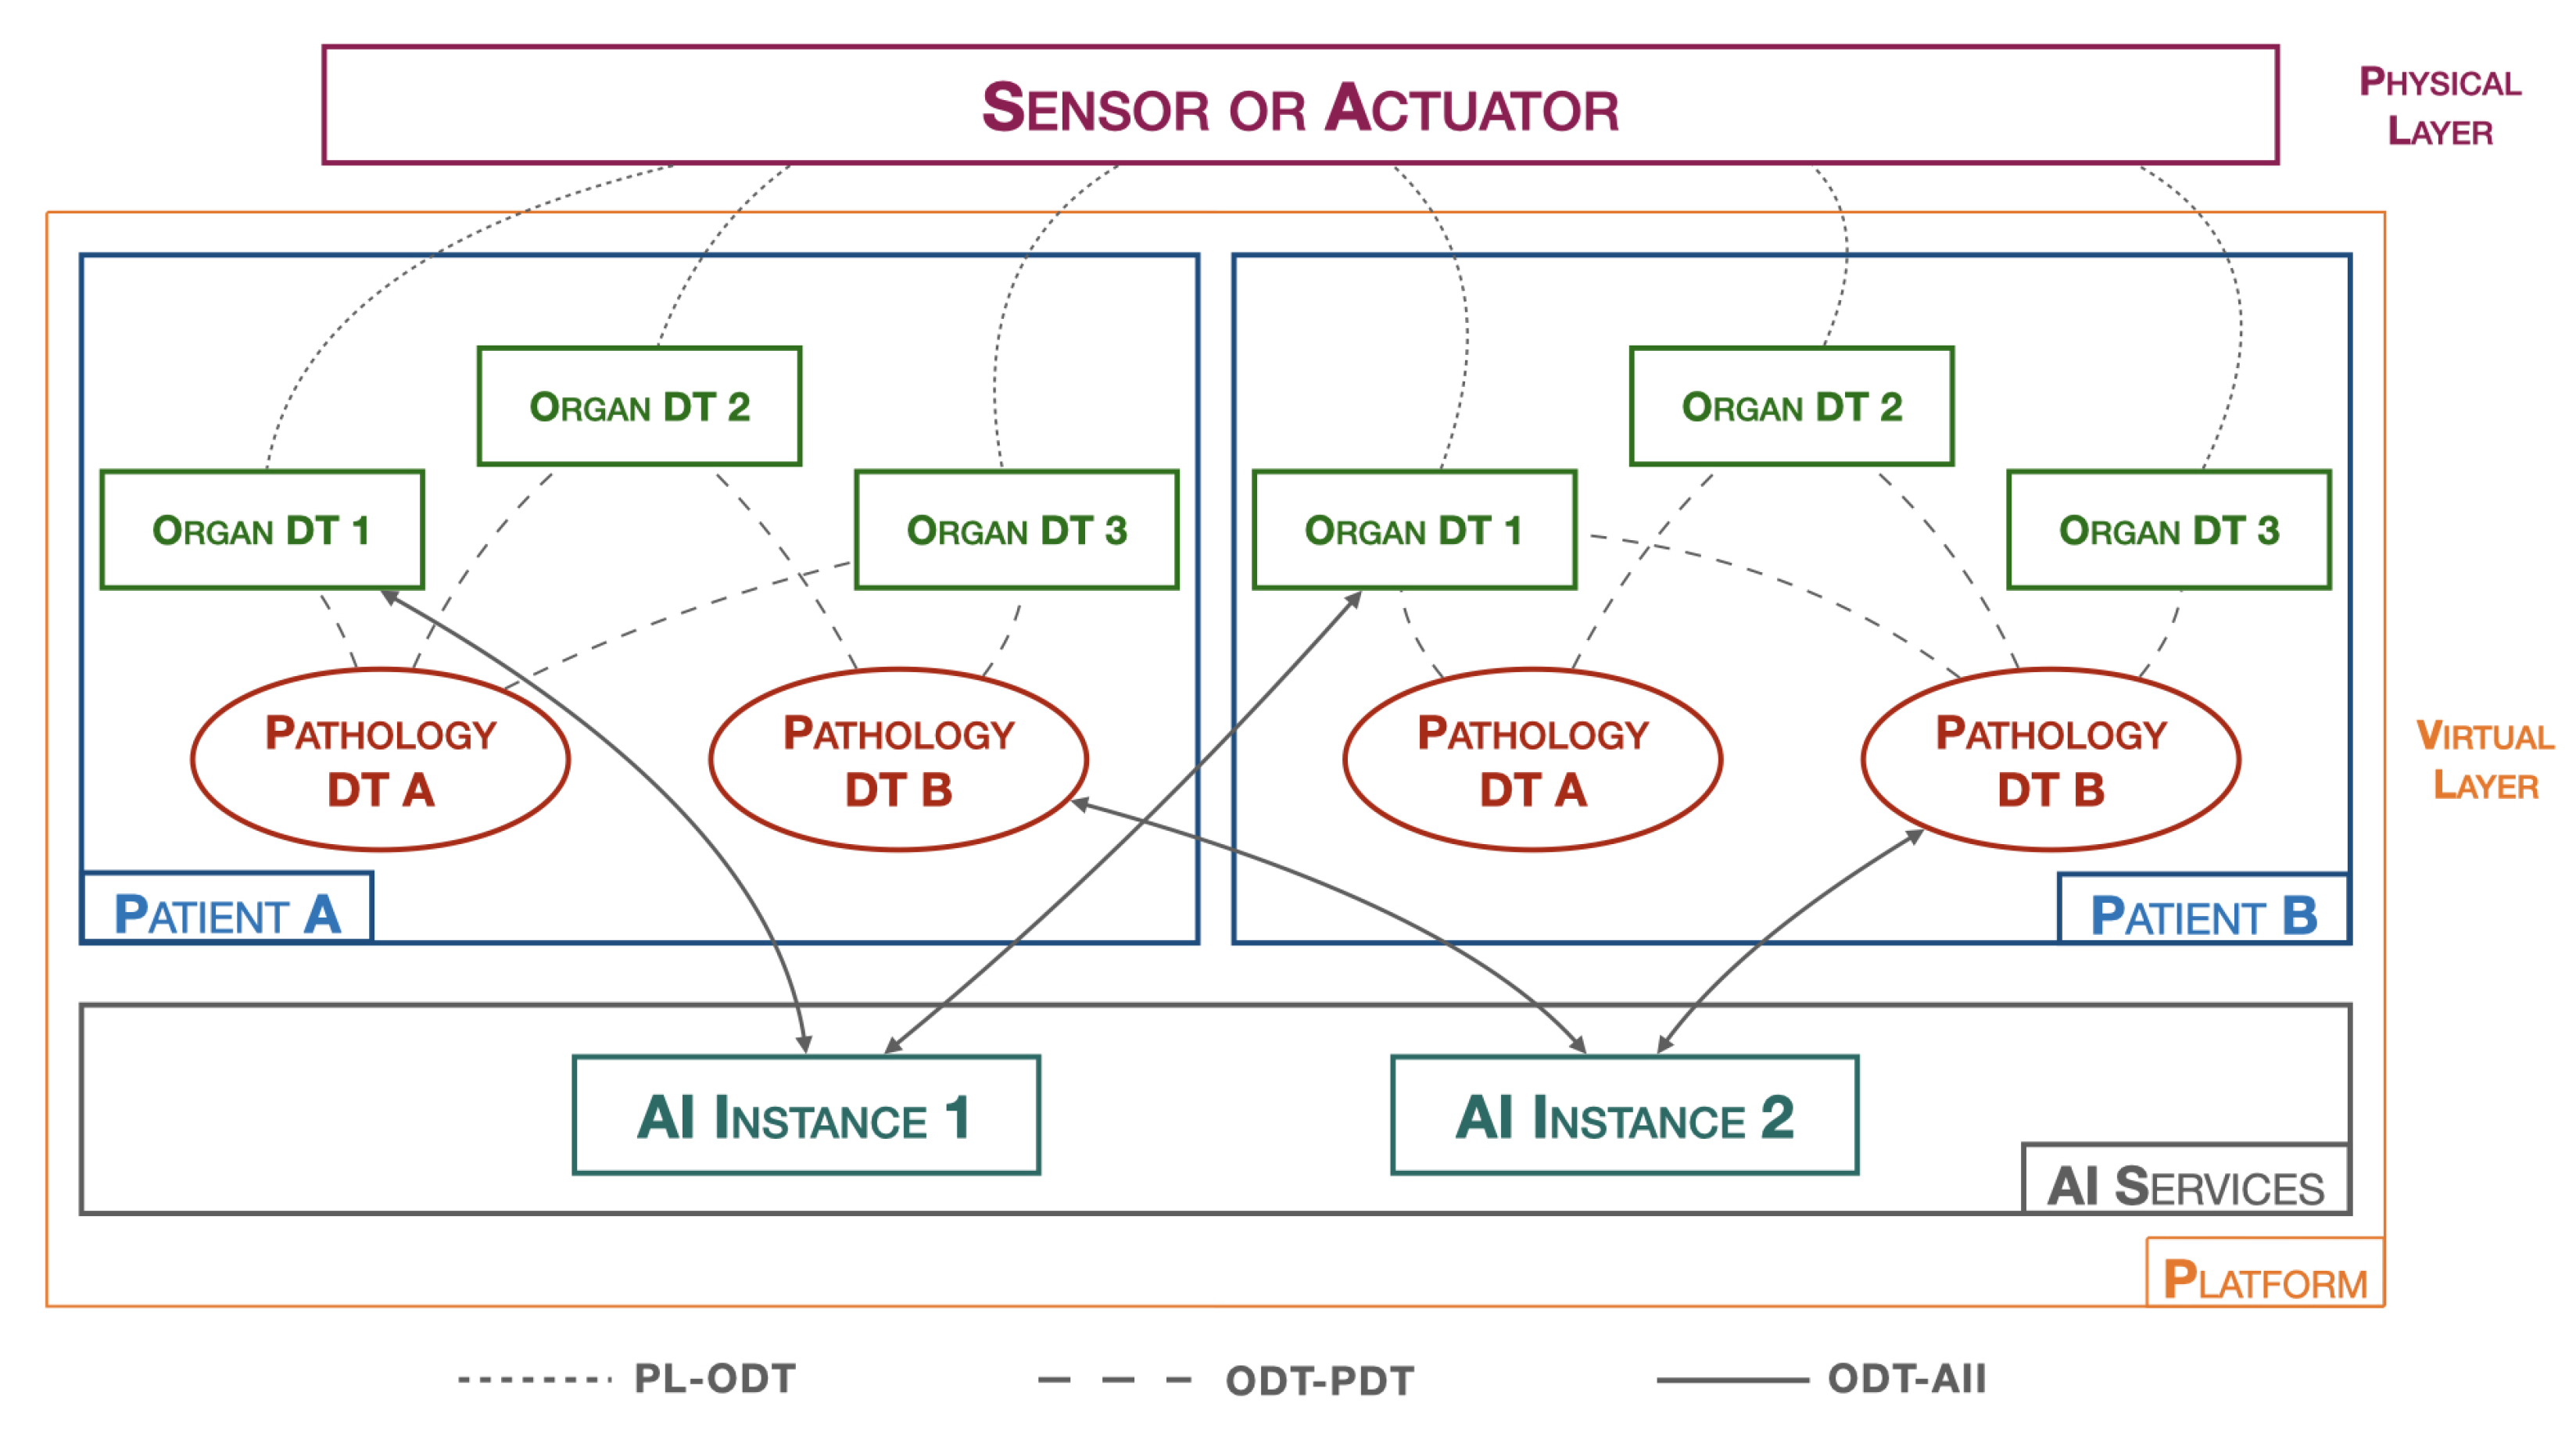
Figure 6 shows the architecture of the suggested platform.
The platform, hereinafter referred to as pathology DTs monitoring platform (PDMP), introduces a new type of a DT that is responsible for collecting and analyzing physiological data from various organs in order to represent a specific pathology, the pathology DT.
In the
Figure 6, the physical layer (PL) includes all healthcare data-acquisition devices, such as blood pressure monitors, heart rate monitors, ECG systems, digital medical records, etc. Moreover, it also includes devices that allow for active interaction with the surrounding physical environment, such as, for example, insulin pump systems.
The virtual layer (VL) is composed of all the hardware and software components that create the digital twin of the object in question. Two macro objects can be distinguished:
Patients: As previously introduced, a patient is represented by various organ DTs that cooperate with each other and exchange information with the pathology DTs. The organ DT has full control over its corresponding real organ. Its main tasks are both to predict abnormal behaviors that the real organ may encounter and to act on the organ by commanding the related actuators. On the other hand, the pathology DT, having a broader perspective and obtaining more information from individual organ DTs, can operate at a higher level by monitoring specific diseases and preventing future problems. They do not directly act on the real world but rather contact organ DTs to make changes in the physical world. Both types of DTs require the presence of an AI component, residing in the AI process block, for efficient monitoring. Many approaches, such as CNN algorithms, require AI to be trained on specific datasets to provide the most robust and accurate model possible. AI techniques, including dataset training and model creation, are performed in the AI services to achieve greater platform flexibility.
AI services: correspond to the section where different AI algorithms reside. This includes several instances, as each AI may require different datasets and processing techniques. The idea is to have many active AI algorithms, which, after completing all the training phases, can return the models. Whenever the organ DTs and pathology DTs need to perform a data-validation process, such as through an inference process, the AI process block downloads the appropriate previously trained model from the reference AI instance. In this way, the data insertion, dataset training, and real-time data-verification phases are completed independently of each other. If the dataset is increased/varied with new data, a neural network retraining is performed within the AI instance. This operation can be carried out without interrupting the execution of the organ DTs and pathology DTs, which continue to monitor the patient.
In addition to the macro objects, we also determine all the interfaces that are used for communication between the various objects present on the PDMP. In particular, these include:
PL-ODT: an interface that connects the physical world with the virtual world and allows bidirectional communication between them. All sensor detection data and all directives to actuators pass through this interface.
ODT-PDT: an interface that connects organ DTs with pathology DTs and allows bidirectional communication between them. This interface conveys all the information that the various DTs must exchange with each other, such as anomalies recorded by an organ that need to be communicated to pathologies, or any actions that pathologies schedule for organs.
ODT-AII: an interface that connects DTs with AI instances, allowing DTs to download previously trained models. This interface is used when a DT needs to update the model.
6. Organ DT Integration for Cardiac Disease
Monitoring
CVDs, such as ACS, are the leading cause of death in the western world and account for the majority of healthcare expenditure due to hospitalization, drugs, and outpatient services. To minimize these costs, the government is promoting digitization in the healthcare sector and DTs constitute a potential solution [
40].
In this context, the PDMP platform could be used in scenarios where it is necessary to both carry out a large-scale monitoring campaign and organize/collect a large amount of data from several acute coronary syndrome (ACS) patients. Another use case is related to the management of the postoperative phase where constant patient monitoring is necessary. It can be managed remotely, reducing the length of stay in the healthcare facility and, at the same time, reducing the posthospitalization costs.
The authors consider ACS pathology as a relevant case for the implementation of PDMP. In order to model a patient affected by ACS associated with a myocardial infarction, a doctor needs to evaluate information related to the patient’s health in a more general context, which takes into account information concerning the condition of other organs, such as the liver and pancreas, in the case the patient is affected by high cholesterol and/or diabetes mellitus, respectively. Moreover, the course of the heart disease requires regular monitoring of the lungs and blood oxygenation.
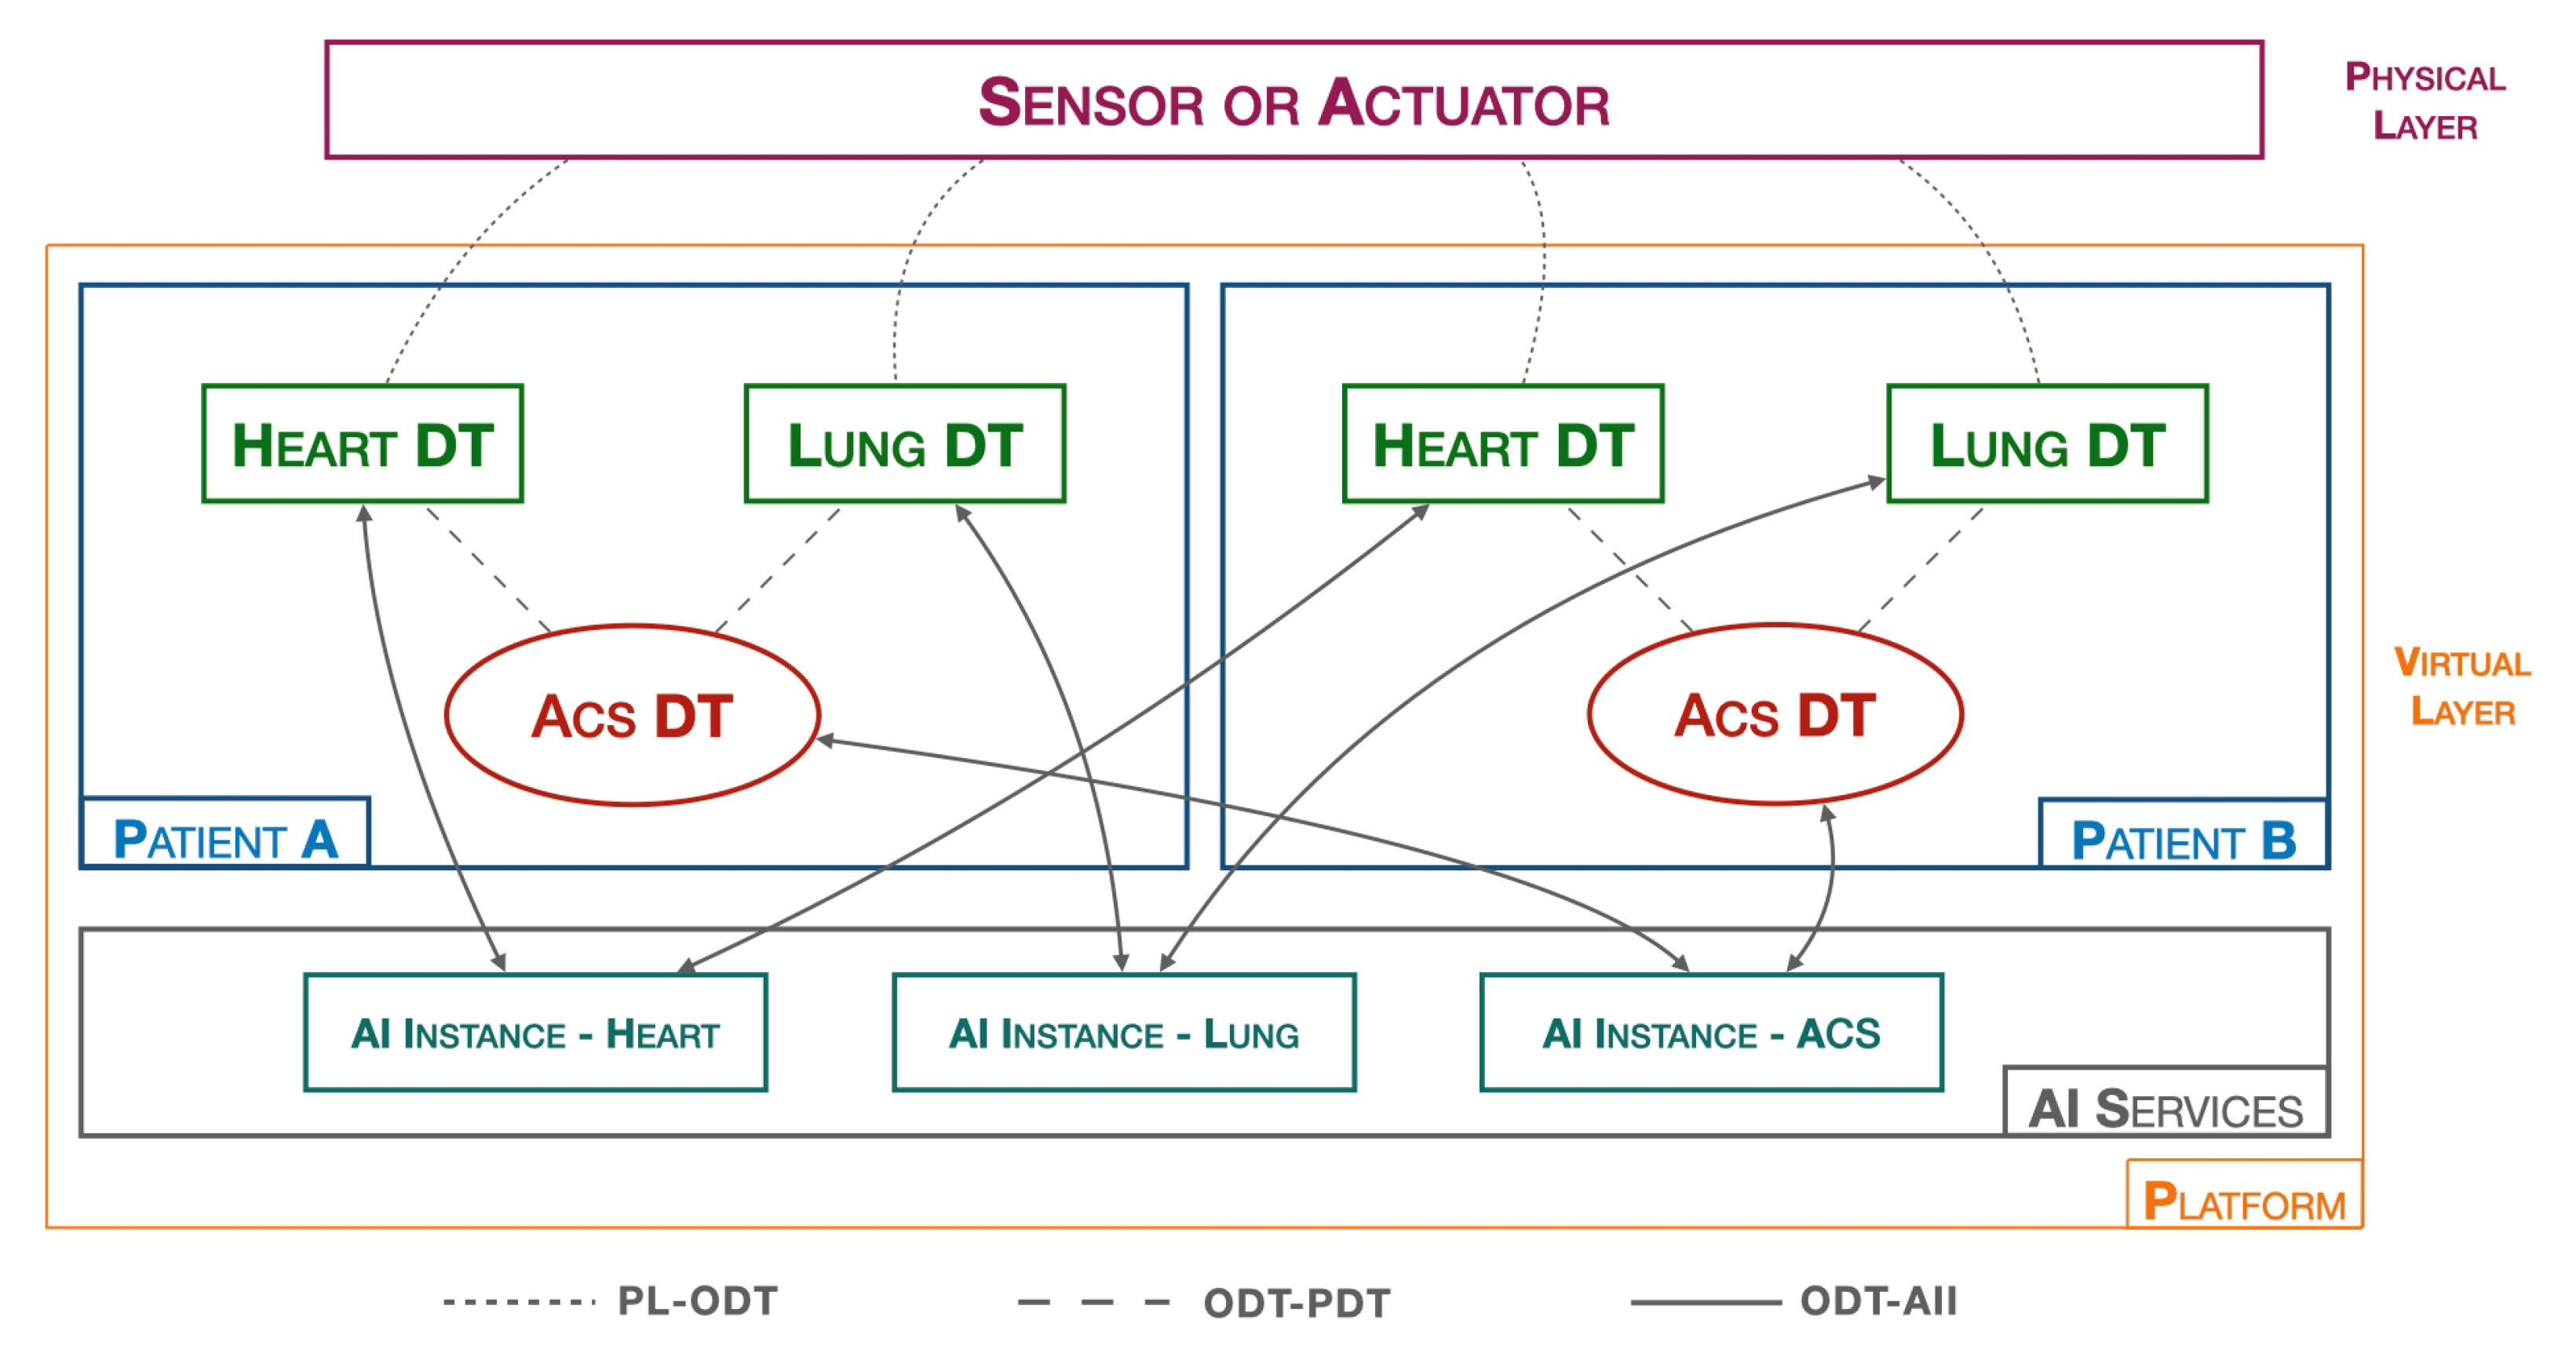
For this reason, in addition to the heart DT introduced in
Section 3, other organ DTs, including lung DT, have to be implemented in the platform.
In particular, a lung DT is to be implemented similarly to a heart DT, but the implementation differs mainly in two aspects: the first concerns the nature of the data, which in this case are the saturation values, SpO2, recorded by the smartwatch, while the second difference concerns the AI process block, which no longer implements inference logic for data validation, but threshold algorithms are adopted for the validation of SpO2 values.
Figure 7 shows the previously introduced elements within the platform.
The threshold values [
41] we have implemented in the Lung DT for classifying SpO2 values are:
Threshold 1 [optimal]: SpO2 ≥ 96%;
Threshold 2 [possible oxygenation problems]: 93% ≤ SpO2 ≤ 96%;
Threshold 3 [insufficient oxygenation]: 90% ≤ SpO2 ≤ 92%;
Threshold 4 [severe oxygen deficiency]: SpO2 ≤ 90%.
In addition to the various organ DTs, according to the PDMP it is necessary to develop an ACS DT which represents the cardiac pathology that affects the patient. The DT block characterizing the ACS DT is the related AI process, which, in this case, implements multivariate AI algorithms considering data of a different nature. Along with the two organ DTs (heart DT and lung DT) and the Pathology DT, in the AI SERVICES layer we have three AI instances, one for each DT, responsible for training and releasing their respective models.
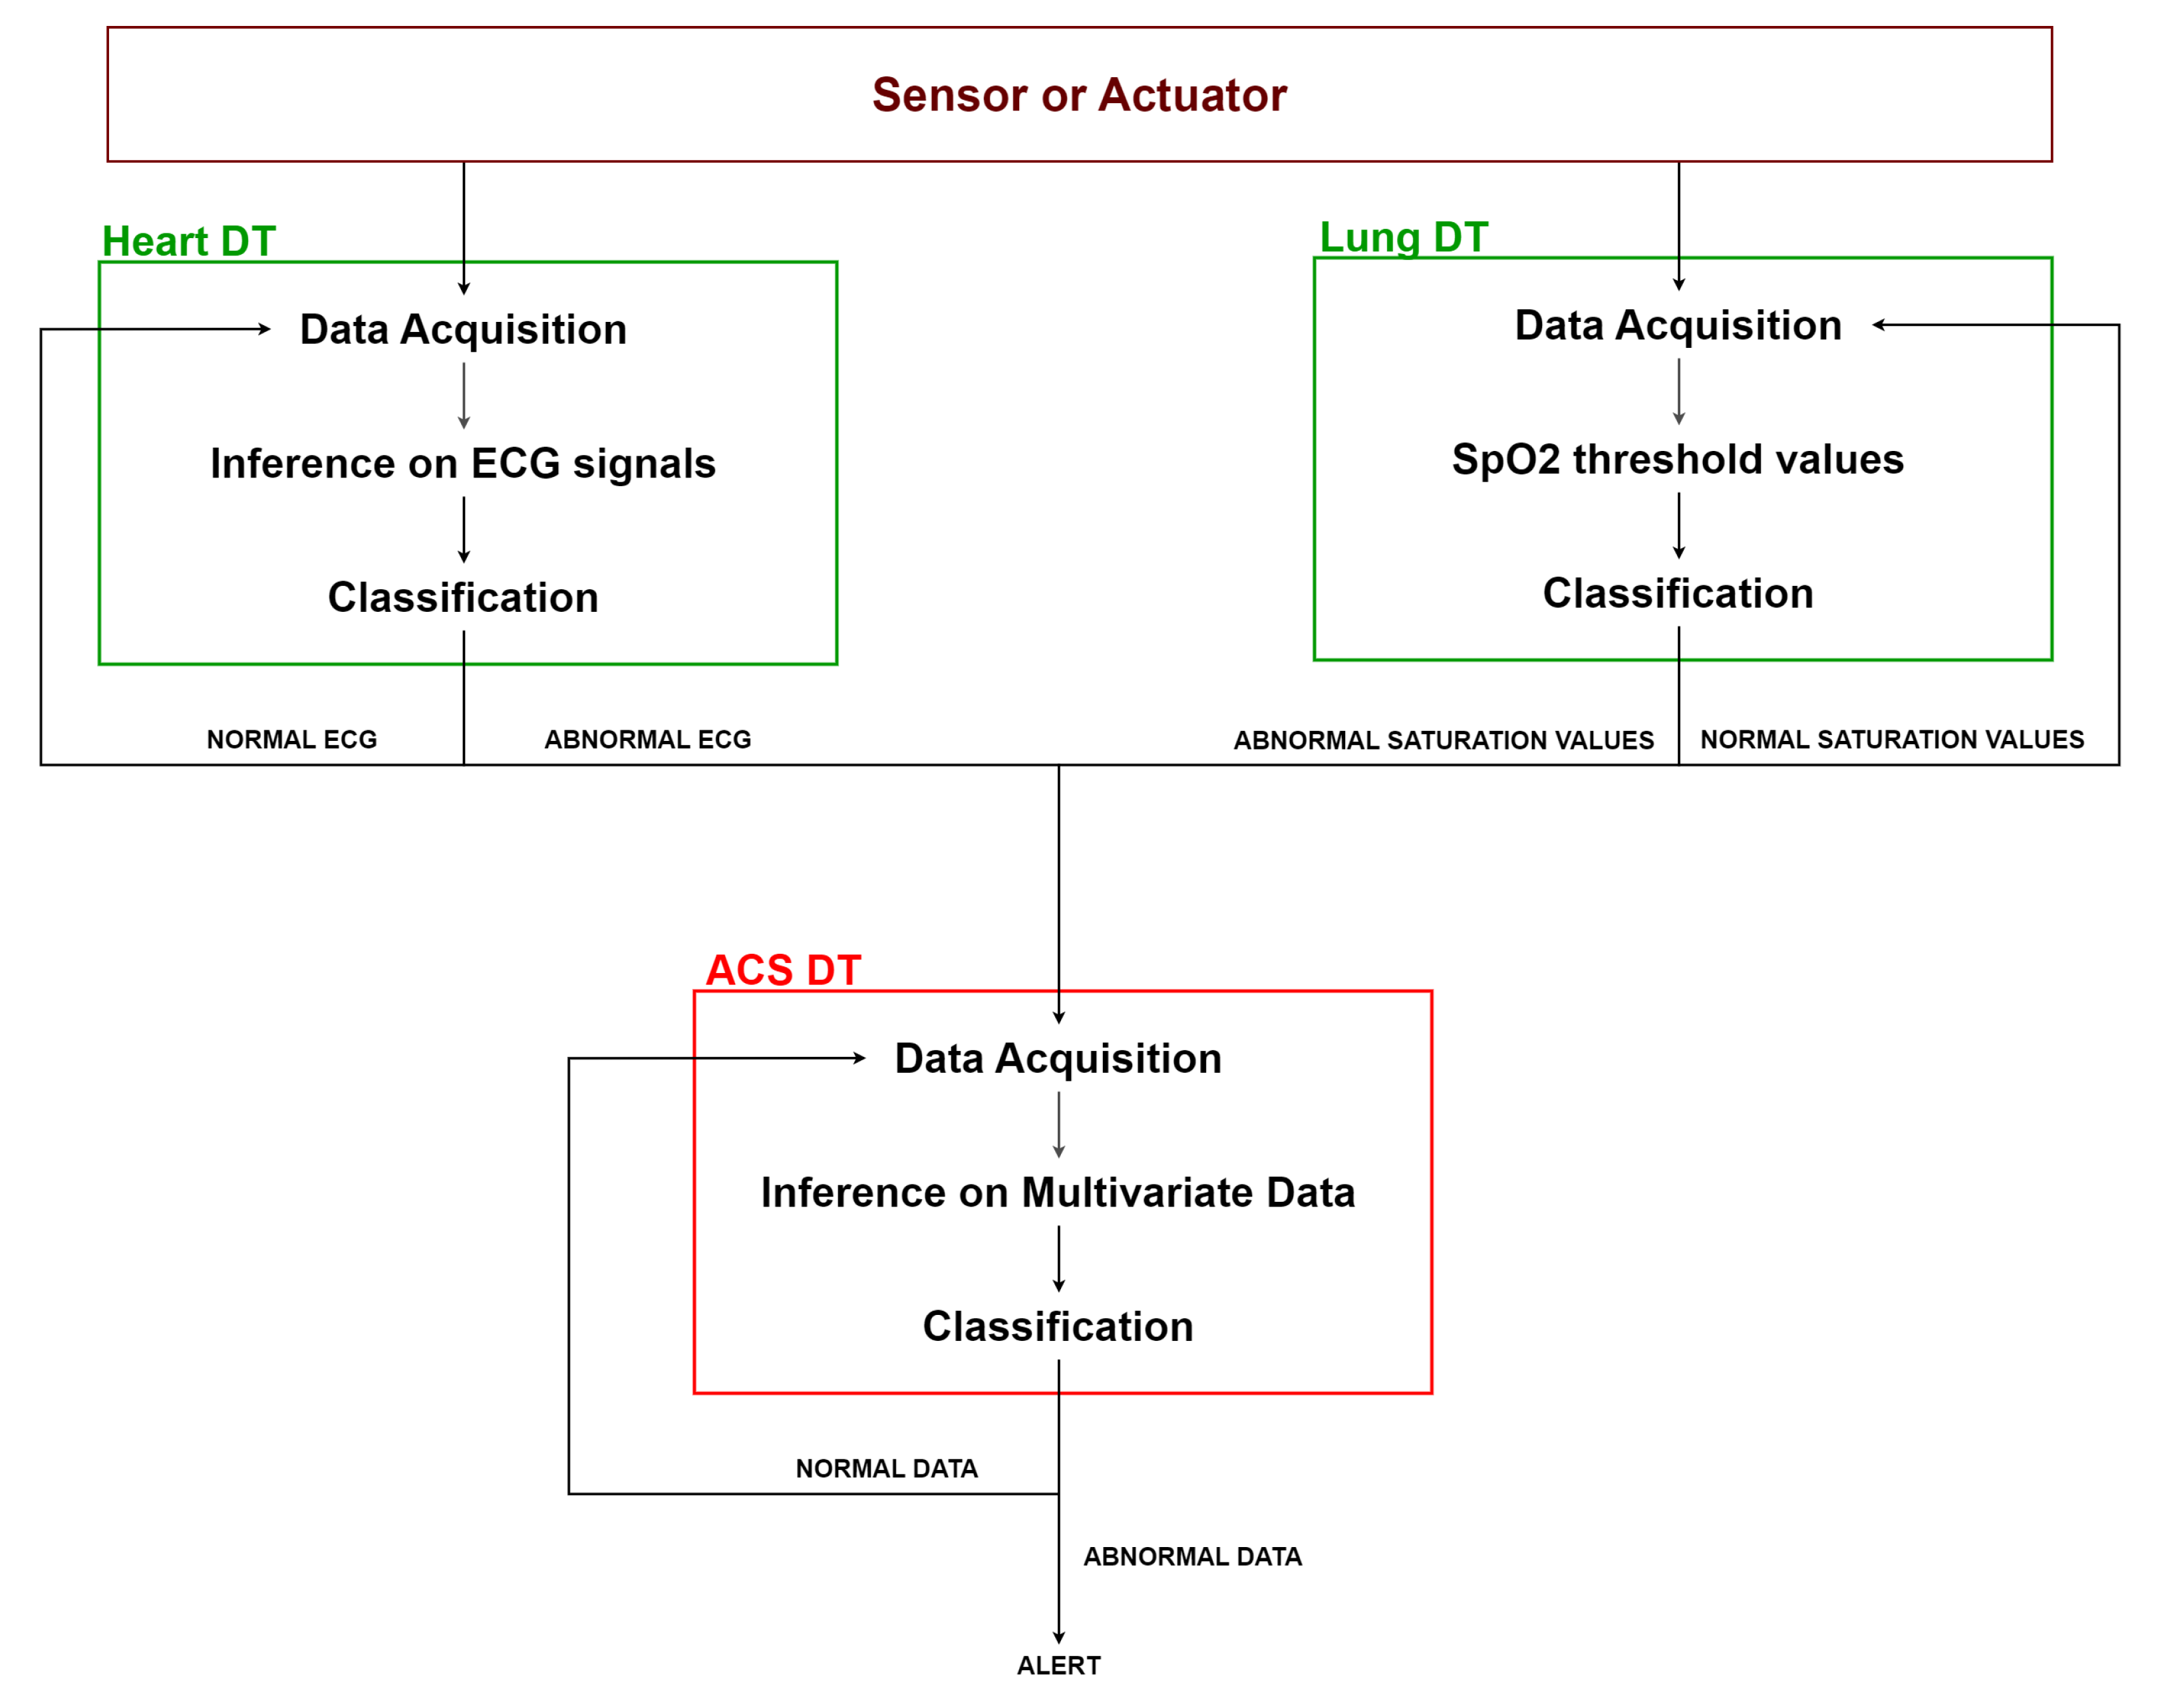
As shown in
Figure 8, the heart DT and the lung DT assess the previously acquired data according to their respective algorithms. Whenever an anomaly is detected, it is notified to the ACS DT. The latter acquires data from the DTs of the connected organs and applies multivariate AI algorithms to assess data by correlating different types of information. Based on the result of this evaluation, the ACS DT determines whether it is necessary to activate an ALERT, such as notifying the doctor, or to continue normal monitoring.
7. Discussion
In this section we will discuss and compare the state-of-the-art research on the topic and the heart DT proposed in this paper.
Table 1 shows a comparison between our study and state of the art literature concerning the use of DTs in healthcare, and DTs that exploit ECG signals to characterize the heart (function, pathology, activity, etc.). In particular, the table compares the technology used, the tasks the research papers address, challenges, and performance in terms of accuracy.
Although all papers referred to in
Table 1 pertain to the cardiac field, most of the papers differentiate from our study in the “Task” section. The only study we could compare our study with is by Elayan et al. [
31]. The comparison shows that our approach involves the use of real-time ECG data (acquired from a smartwatch) and offers higher performance accuracy in terms of the classification of ECG signals. In addition, we have introduced the platform in step two to extend the treatment of patient health monitoring via additional data from other organs.
8. Conclusions
In this paper, the authors focused on the application of DT technology in the healthcare sector. The study is divided into two parts. The first part introduces the creation of a Heart DT, which is a dynamic and highly customizable system that can acquire, process, and analyze vital data from sensors in the physical world. With its ability to communicate and interact with other elements, the heart DT can play a key role in monitoring and treating cardiac conditions, promoting better health care and patient wellbeing. The heart DT was developed using microservice-based logic and is run in a Kubernetes environment. The structure of the heart DT consists of several modules that process real-time data from the smartwatches. Before being used for data validation, the acquired ECG signals undergo processing and preprocessing. Within the heart DT, specifically in the AI process block, a pre-trained model is instantiated on a dataset containing ECG signals related to various heart diseases. The heart DT uses this model to perform inferences on the data in real time. The performance results obtained are very good; in fact, the classification accuracy of the ECG signals, recorded by two different users, offer performances ranging from 82.5% to 100%, even when postprocessing filters are applied. Given the excellent results, in the second part, we further devised a higher-level platform that would use the previously implemented approach to manage a patient’s health more efficiently. The idea that we propose, but do not implement, is to have a distributed system of DTs divided into two levels; that is, multiple instances of DTs that can communicate and collaborate with each other to manage a more complex disease in its entirety. To this end, we have introduced pathology DTs, representative of the patient’s diseases. The structure of the platform envisages that DTs of the various organs are at a lower level, while DTs representing the diseases are at a higher level. Finally, a practical example of implementing the platform to manage ACS patients was described. The main limitations of this study relate to:
Not having developed but only idealized the PDMP platform, as it will be explored more in detail in our future work;
Characterizing the heart only with ECG signals; in a future study it may be possible to characterize the heart by adding other parameters or combining outputs from various artificial intelligence algorithms;
The necessity to expand the dataset we perform inference with, by including recordings from subjects with possible pathology. In addition, we will also extend the tests by considering data from other organs in order to validate the overall platform.
It is considered that the future work may involve extending the platform with other organs and pathologies and integrating it with several actuation devices present in the physical world.
Author Contributions
Conceptualization, R.A., F.B., A.L. and C.R.; methodology, R.A., F.B., A.L. and C.R.; software, R.A. and C.R.; validation, R.A., F.B., A.L. and C.R.; formal analysis, R.A., F.B., A.L. and C.R.; investigation, R.A., F.B., A.L. and C.R.; resources, R.A., F.B., A.L. and C.R.; data curation, R.A. and C.R.; writing—original draft preparation, R.A., F.B., A.L. and C.R.; writing—review and editing, R.A., F.B., A.L. and C.R.; visualization, R.A., F.B., A.L. and C.R.; supervision, F.B. and A.L.; project administration, A.L. All authors have read and agreed to the published version of the manuscript.
Funding
This research is partially supported by the National Operational Plan (PON) Project 4FRAILTY (project code: ARS01_00345).
Informed Consent Statement
Informed consent was obtained from the two researchers involved in the study.
Data Availability Statement
Not applicable.
Conflicts of Interest
The authors declare no conflict of interest.
Abbreviations
The following abbreviations are used in this manuscript:
| ACS | Acute coronary syndrome |
| AFIB | Atrial fibrillation |
| AI | Artificial intelligence |
| AII | Artificial intelligence instance |
| AFL | Atrial flutter |
| B | Ventricular bigeminy |
| CNN | Convolutional neural network |
| CDT | Cardiac digital twin |
| CVD | Cardiovascular disease |
| DL | Deep learning |
| DTs | Digital twins |
| ECG | Electrocardiogram |
| HTTP | Hypertext transfer protocol |
| IHD | Ischemic heart disease |
| IoT | Internet of Things |
| J | Junctional rhythm |
| LR | Logistic regration |
| LSTM | Long short-term memory |
| ML | Machine learning |
| MLP | Multilayer perceptron |
| MQTT | Message-queuing telemetry transport |
| N | Normal sinus rhythm |
| ODT | Organ digital twin |
| P | Paced rhythm |
| PDT | Pathology digital twin |
| PDMP | Pathology DTs monitoring platform |
| PL | Physical layer |
| PPG | Photoplethysmogram |
| SBR | Sinus bradycardia |
| SVC | Support vector classification |
| VL | Virtual layer |
References
- Healthcare IT Market. Global Forecast to 2024, By Product and End User, MarketsandMarkets. Available online: https://www.marketsandmarkets.com/Market-Reports/healthcare-it-252.html (accessed on 19 April 2023).
- Globenewswire. Global Wearable Medical Devices Market Report 2022. Available online: https://www.globenewswire.com/en/news-release/2022/07/08/2476457/28124/en/Global-Wearable-Medical-Devices-Market-Report-2022-Sector-to-Grow-to-49-6-Billion-by-2026-Despite-Data-Privacy-Concerns.html, (accessed on 20 April 2023).
- Tyagi, S.; Agarwal, A.; Maheshwari, P. A conceptual framework for IoT-based healthcare system using cloud computing. In Proceedings of the 2016 6th International Conference—Cloud System and Big Data Engineering (Confluence), Noida, India, 14–15 January 2016; pp. 503–507. [Google Scholar] [CrossRef]
- Avanzato, R.; Beritelli, F. Automatic ECG diagnosis using convolutional neural network. Electronics 2020, 9, 951. [Google Scholar] [CrossRef]
- Avanzato, R.; Beritelli, F. Heart disease recognition based on extended ECG sequence database and deep learning techniques. In Proceedings of the 2022 IEEE International Conference on Internet of Things and Intelligence Systems (IoTaIS), Bali, Indonesia, 24–26 November 2022; pp. 117–121. [Google Scholar]
- IEEE Computer Society. IEEE Computer Society’s Top 12 Technology Trends for 2020. Available online: https://www.computer.org/press-room/2019-news/ieee-computer-societys-top-12-technology-trends-for-2020 (accessed on 20 April 2023).
- Marosi, A.C.; Emodi, M.; Hajnal, Á.; Lovas, R.; Kiss, T.; Poser, V.; Antony, J.; Bergweiler, S.; Hamzeh, H.; Deslauriers, J.; et al. Interoperable Data Analytics Reference Architectures Empowering Digital-Twin-Aided Manufacturing. Future Internet 2022, 14, 114. [Google Scholar] [CrossRef]
- Lepasepp, T.K.; Hurst, W. A Systematic Literature Review of Industry 4.0 Technologies within Medical Device Manufacturing. Future Internet 2021, 13, 264. [Google Scholar] [CrossRef]
- Yu, W.; Patros, P.; Young, B.; Klinac, E.; Walmsley, T.G. Energy digital twin technology for industrial energy management: Classification, challenges and future. Renew. Sustain. Energy Rev. 2022, 161, 112407. [Google Scholar] [CrossRef]
- Steindl, G.; Stagl, M.; Kasper, L.; Kastner, W.; Hofmann, R. Generic digital twin architecture for industrial energy systems. Appl. Sci. 2020, 10, 8903. [Google Scholar] [CrossRef]
- Pylianidis, C.; Osinga, S.; Athanasiadis, I.N. Introducing digital twins to agriculture. Comput. Electron. Agric. 2021, 184, 105942. [Google Scholar] [CrossRef]
- Martínez-Gutiérrez, A.; Díez-González, J.; Ferrero-Guillén, R.; Verde, P.; Álvarez, R.; Perez, H. Digital twin for automatic transportation in industry 4.0. Sensors 2021, 21, 3344. [Google Scholar] [CrossRef]
- Qian, C.; Liu, X.; Ripley, C.; Qian, M.; Liang, F.; Yu, W. Digital twin—Cyber replica of physical things: Architecture, applications and future research directions. Future Internet 2022, 14, 64. [Google Scholar] [CrossRef]
- Al-Ali, A.R.; Gupta, R.; Zaman Batool, T.; Landolsi, T.; Aloul, F.; Al Nabulsi, A. Digital twin conceptual model within the context of internet of things. Future Internet 2020, 12, 163. [Google Scholar] [CrossRef]
- Kamel Boulos, M.N.; Zhang, P. Digital twins: From personalised medicine to precision public health. J. Pers. Med. 2021, 11, 745. [Google Scholar] [CrossRef]
- Volkov, I.; Radchenko, G.; Tchernykh, A. Digital twins, internet of things and mobile medicine: A review of current platforms to support smart healthcare. Program. Comput. Softw. 2021, 47, 578–590. [Google Scholar] [CrossRef]
- Ur Rasool, R.; Ahmad, H.F.; Rafique, W.; Qayyum, A.; Qadir, J.; Anwar, Z. Quantum Computing for Healthcare: A Review. Future Internet 2023, 15, 94. [Google Scholar] [CrossRef]
- Ridhawi, I.A.; Otoum, S.; Aloqaily, M.; Boukerche, A. Generalizing AI: Challenges and Opportunities for Plug and Play AI Solutions. IEEE Netw. 2021, 35, 372–379. [Google Scholar] [CrossRef]
- Mourtzis, D.; Angelopoulos, J.; Panopoulos, N.; Kardamakis, D. A smart IoT platform for oncology patient diagnosis based on ai: Towards the human digital twin. Procedia CIRP 2021, 104, 1686–1691. [Google Scholar] [CrossRef]
- Pascual, H.; Bruin, X.M.; Alonso, A.; Cerdà, J. A Systematic Review on Human Modeling: Digging into Human Digital Twin Implementations. arXiv 2023, arXiv:2302.03593. [Google Scholar]
- Mazumder, O.; Roy, D.; Bhattacharya, S.; Sinha, A.; Pal, A. Synthetic PPG generation from haemodynamic model with baroreflex autoregulation: A Digital twin of cardiovascular system. In Proceedings of the 2019 41st Annual International Conference of the IEEE Engineering in Medicine and Biology Society (EMBC), Berlin, Germany, 23–27 July 2019; pp. 5024–5029. [Google Scholar] [CrossRef]
- Hernigou, P.; Olejnik, R.; Safar, A.; Martinov, S.; Hernigou, J.; Ferre, B. Digital twins, artificial intelligence, and machine learning technology to identify a real personalized motion axis of the tibiotalar joint for robotics in total ankle arthroplasty. Int. Orthop. 2021, 45, 2209–2217. [Google Scholar] [CrossRef]
- Bjelland, Ø.; Rasheed, B.; Schaathun, H.G.; Pedersen, M.D.; Steinert, M.; Hellevik, A.I.; Bye, R.T. Towards a Digital Twin for Arthroscopic Knee Surgery: A Systematic Review. IEEE Access 2022, 10, 45029–45052. [Google Scholar] [CrossRef]
- Karakra, A.; Fontanili, F.; Lamine, E.; Lamothe, J.; Taweel, A. Pervasive Computing Integrated Discrete Event Simulation for a Hospital Digital Twin. In Proceedings of the 2018 IEEE/ACS 15th International Conference on Computer Systems and Applications (AICCSA), Aqaba, Jordan, 28 October–1 November 2018; pp. 1–6. [Google Scholar] [CrossRef]
- Liu, Y.; Zhang, L.; Yang, Y.; Zhou, L.; Ren, L.; Wang, F.; Liu, R.; Pang, Z.; Deen, M.J. A Novel Cloud-Based Framework for the Elderly Healthcare Services Using Digital Twin. IEEE Access 2019, 7, 49088–49101. [Google Scholar] [CrossRef]
- Martinez-Velazquez, R.; Gamez, R.; El Saddik, A. Cardio Twin: A Digital Twin of the human heart running on the edge. In Proceedings of the 2019 IEEE International Symposium on Medical Measurements and Applications (MeMeA), Istanbul, Turkey, 26–28 June 2019; pp. 1–6. [Google Scholar] [CrossRef]
- Song, Y.T.; Qin, J. Metaverse and Personal Healthcare. Procedia Comput. Sci. 2022, 210, 189–197. [Google Scholar] [CrossRef]
- Boersma, E.; Maas, A.C.; Deckers, J.W.; Simoons, M.L. Early thrombolytic treatment in acute myocardial infarction: Reappraisal of the golden hour. Lancet 1996, 348, 771–775. [Google Scholar] [CrossRef]
- Gillette, K.; Gsell, M.A.; Prassl, A.J.; Karabelas, E.; Reiter, U.; Reiter, G.; Grandits, T.; Payer, C.; Štern, D.; Urschler, M.; et al. A framework for the generation of digital twins of cardiac electrophysiology from clinical 12-leads ECGs. Med. Image Anal. 2021, 71, 102080. [Google Scholar] [CrossRef] [PubMed]
- Bodin, O.N.; Chekaikin, S.V.; Rakhmatullov, F.K.; Rakhmatullov, R.F.; Kramm, M.N.; Bodin, A.Y. Visualization of a Digital Twin of the Heart. In Proceedings of the 2021 IEEE 22nd International Conference of Young Professionals in Electron Devices and Materials (EDM), Altai Republic, Russia, 30 June–5 July 2021; pp. 419–423. [Google Scholar] [CrossRef]
- Elayan, H.; Aloqaily, M.; Guizani, M. Digital Twin for Intelligent Context-Aware IoT Healthcare Systems. IEEE Internet Things J. 2021, 8, 16749–16757. [Google Scholar] [CrossRef]
- Docker. Docker Overview. Available online: https://docs.docker.com/get-started/overview/ (accessed on 5 May 2023).
- Kubernetes. Kubernetes Documentation. Available online: https://kubernetes.io/docs/home/ (accessed on 5 May 2023).
- Vijayavanan, M.; Rathikarani, V.; Dhanalakshmi, P. Automatic classification of ECG signal for heart disease diagnosis using morphological features. Int. J. Comput. Sci. Eng. Technol. 2014, 5, 449–455. [Google Scholar]
- Moody, G.B.; Mark, R.G.; Goldberger, A.L. PhysioNet: A web-based resource for the study of physiologic signals. IEEE Eng. Med. Biol. Mag. 2001, 20, 70–75. [Google Scholar] [CrossRef]
- Moody, G.B.; Mark, R.G. The impact of the MIT-BIH arrhythmia database. IEEE Eng. Med. Biol. Mag. 2001, 20, 45–50. [Google Scholar] [CrossRef] [PubMed]
- Moody, G. A new method for detecting atrial fibrillation using RR intervals. Proc. Comput. Cardiol. 1983, 10, 227–230. [Google Scholar]
- Avanzato, R.; Beritelli, F. Heart sound multiclass analysis based on raw data and convolutional neural network. IEEE Sens. Lett. 2020, 4, 7004104. [Google Scholar] [CrossRef]
- Lombardo, A.; Ricci, C. Digital Twins Federation for Remote Medical Care of De-Hospitalized Patients. In Proceedings of the 2022 IEEE International Conference on Pervasive Computing and Communications Workshops and other Affiliated Events (PerCom Workshops), Pisa, Italy, 21–25 March 2022; pp. 718–723. [Google Scholar] [CrossRef]
- Melhem, S. Assessing Country Progress Towards Digitization; World Bank: Washington, DC, USA, 2019. [Google Scholar]
- NCBI. Oxygen Saturation. 2020. Available online: https://www.ncbi.nlm.nih.gov/books/NBK525974/ (accessed on 15 May 2023).
| Disclaimer/Publisher’s Note: The statements, opinions and data contained in all publications are solely those of the individual author(s) and contributor(s) and not of MDPI and/or the editor(s). MDPI and/or the editor(s) disclaim responsibility for any injury to people or property resulting from any ideas, methods, instructions or products referred to in the content. |
© 2023 by the authors. Licensee MDPI, Basel, Switzerland. This article is an open access article distributed under the terms and conditions of the Creative Commons Attribution (CC BY) license (https://creativecommons.org/licenses/by/4.0/).


