Abstract
Recommending points of interest (POI) is a challenging task that requires extracting comprehensive location data from location-based social media platforms. To provide effective location-based recommendations, it is important to analyze users’ historical behavior and preferences. In this study, we present a sophisticated location-aware recommendation system that uses Bidirectional Encoder Representations from Transformers (BERT) to offer personalized location-based suggestions. Our model combines location information and user preferences to provide more relevant recommendations compared to models that predict the next POI in a sequence. Based on our experiments conducted on two benchmark datasets, we have observed that our BERT-based model surpasses baselines models in terms of HR by a significant margin of 6% compared to the second-best performing baseline. Furthermore, our model demonstrates a percentage gain of 1–2% in the NDCG compared to second best baseline. These results indicate the superior performance and effectiveness of our BERT-based approach in comparison to other models when evaluating HR and NDCG metrics. Moreover, we see the effectiveness of the proposed model for quality through additional experiments.
1. Introduction
The popularity of mobile communication and the internet is leading us toward an era of mobile networks. This popularity has also made it easier to determine the geographic location of users through smart devices such as mobile phones and iPads. As a result, location-based social networks (LBSNs) are becoming increasingly popular, with well-known sites such as Foursquare [1] and Gowalla [2]. Users can check-in at any location and time on major social networking sites, rate or comment on points of interest (POI), and create their social network to exchange POI with others with similar interests.
The rapid increase in mobile internet users and the volume of available information has created a conflict between limited network resources and growing user demands. To address this challenge, there is a need to explore algorithms that can accurately and efficiently extract users’ behavioral patterns, analyze their interests, and provide personalized POI recommendations. Recommender systems [3,4] are specialized software that analyze users’ preferences, behaviors, and interactions to generate personalized suggestions, such as POI in our context. By incorporating a recommender system, we can optimize network resources, address the challenges posed by the growing information volume, and enhance user satisfaction.
Developing a POI recommendation system based on LBSNs is particularly challenging compared to building standard recommendation algorithms. This is due to the multifaceted contextual data involved in POI recommendations, including users’ check-in time, social network, geographical location, and more. Moreover, users’ interests can shift over time and vary across locations. A significant challenge is data sparsity, which arises from the limited number of POI visited by users. To provide personalized POI recommendations, it is essential to effectively integrate POI data and develop robust models that account for the multifaceted contextual information, users’ evolving interests, and data sparsity challenges inherent in LBSNs.
Deep neural network-based models [5] have achieved state-of-the-art success in various domains and applications, including social networks, health science, news, and entertainment. Among these models, Transformer-based [6] architectures have become more utilized in recent years. These architectures employ self-attention mechanisms [6] to differentially weight the significance of each component in the input data. In this study, we propose a POI recommendation model based on Bidirectional Encoder Representations from Transformers (BERT) [7], an advanced neural-network based model based on Transformer architecture.
BERT has demonstrated exceptional accuracy in a range of natural language processing (NLP) tasks, such as general language understanding, classification, summarization, and translation [8]. The model is trained simultaneously in both Masked Language Modeling (MLM) (50%) and Next Sentence Prediction (NSP) (50%) tasks. This inspired us to adapt this model for building a POI recommendation system. We chose BERT due to its extensive training on vast data sources such as Wikipedia and the Toronto Books Corpus, enabling it to predict “masked” items (e.g., POIs in our research). Moreover, BERT effectively handles sequential data and time-ordered user sequences with high accuracy [9,10]. In our context, sequential modeling allows us to predict users’ next actions based on their historical preferences.
In this work, we develop a recommendation model based on the BERT architecture and name it BERT4Loc (BERT for Location). The steps of our work are summarized as follows: (1) We prepare users’ histories from the dataset by arranging each user’s history as a time-sorted list of POI; (2) we replace some of these POI with a [MASK] token, using the MLM task; (3) we train our model on POI datasets, such as Yelp and Foursquare, to predict the correct values of the masked POI. Through this process, our model learns the useful representations that exist between different POI.
There are some state-of-the-art recommender systems that have been proposed to address the challenges associated with POI recommendations. Some notable methods include matrix factorization-based techniques [11], recurrent neural networks (RNN) [12], and adversarial models [13]. Matrix factorization methods, such as GeoMF [11], incorporate geographical information to improve recommendations, while RNN-based models, such as ST-RNN [12], exploit the temporal dynamics of users’ check-in behavior. Adversarial-based models, such as Geo-ALM [13], capture the complex interactions between users and locations through a fusion of geographic features and generative adversarial networks. In recent years, there has been a number of innovative advancements in location-aware recommendation systems [14,15,16,17], which are inspirations for this work.
Despite the effectiveness of previous methods, accurately capturing the complex relationships between users and POI, as well as addressing data sparsity, remains challenging. In our proposed BERT4Loc model, we offer a promising solution by leveraging the advanced capabilities of BERT in handling sequential data. Additionally, we incorporate contextual information from users and items to overcome the data sparsity challenge. Our primary objective is to provide more accurate and personalized POI recommendations, enhancing the overall recommendation quality.
2. Related Work
This section covers some state-of-the-art works in this line of research.
The recommender systems assume that the users who share behavioral preferences are more likely to form connections with each other. Social recommender systems target social media [18] such as Facebook, Instagram, and Twitter. SocialMF [19] is a social recommender system that learns the users’ preferences using the basic matrix decomposition model and then builds the profile by using the information of user’s friends. SoReg [20] is another social recommender that solves the overfitting problem in SocialML. TrustSVD [21], another social recommender system, models the implicit behavioral data and social relationship of users. By incorporating implicit information about the user’s network, this model brings the user’s feature representation closer to actual application scenarios.
In 2016, Google proposed the Wide&Deep [5] approach, which has generated a lot of interest in recommendation systems. This model has inspired several other models, including DeepFM [22], Deep & Cross [23], NFMs (Neural Factorization Machines) [24], AFMs (Attentional Factorization Machines) [25], DIN (Deep Interest Network) [26], and others. Sequential recommender systems [27], based on deep neural networks, also model the real-life interactions between users’ actions before and after they have consumed an item. For example, in a location recommendation station, when a person visits a place, it is more appropriate to recommend other POI that are nearby and related to the user’s current and past-visited POI.
With recent progress in NLP, sequential recommendation models have also advanced. From the initial Markov Chain [28], through to the following RNNs, Convolutional Neural Network (CNN) models, and now the popular Transformer [7], there has been a lot of progress. The SASRec [29] sequence recommendation model is based on the self-attention mechanism used to model past user behavior and retrieve top-k recommendations. Recently, Transformer architecture [26] has been used to understand better the items that the user has clicked on by capturing the underlying sequential signals.
BERT has also been adapted for recommendation tasks, as seen in BERT4Rec [10], a Transformer-based recommender model that treats the sequence of user actions as a text sequence. Another approach combines BERT with the Neural Collaborative Filtering (NCF) framework [30], resulting in improved item recommendation performance. In a related work, a BERT-based hybrid collaborative filtering system [31] is developed to learn user and item embeddings, demonstrating enhanced performance compared to traditional collaborative filtering methods. Furthermore, BERT has been extended for sequential recommendation [32] by incorporating temporal contexts. One such study integrates time-aware attention mechanisms with BERT to capture sequential patterns in users’ historical interactions. In our study, we extend the application of BERT in recommender systems specifically for POI recommendations. Our model incorporates additional item (POI) information and user features, including social relationships. Trained on a real-world dataset, our model is capable of providing real-time POI recommendations.
There are some works that have been proposed for POI recommendations in recent times. For example, Nguyen et al. [15] proposed a cross-cultural recommendation system for tourism services, outperforming existing methods in terms of accuracy. There is also a POI recommendation system [14] that considers both user preferences and geographic factors, achieving significantly better performance than previous approaches. The OurPlaces platform [16], another POI recommender system, enables cross-cultural sharing of spatial experiences and improves tourism recommendations, surpassing a baseline in terms of accuracy. iTouSPOT [33] is another framework that enhances next POI recommendations in LBSNs by capturing fine-grained user temporal preferences and utilizing sequential contextual information. A related study [17] on topological recommendations employed user influence in social networks and their rating data to enhance personalized recommendations. A more advanced related study [34] deployed a hierarchical attention network, considering user influence and community redundancy, to improve cascade prediction in online platforms.
All these works have been the motivation for the current research.
3. Methodology
In this section, we describe our methodology.
3.1. Data Collection
We gather and process data related to various POIs, including their location, category, and related metadata. Additionally, we also consider user data, such as their historical visits, ratings for POI, and demographic information. We transform raw data into a format more suitable for sequential modeling. For the POI data, we extract relevant features, such as the category of the POI and its geographic location. Similarly, from user data, we extract features such as a user’s past visiting history, their ratings for previously visited POI, and their demographic information.
3.2. POI Recommendation Model
We develop a model to understand the interaction between users and POI. We formalize the problem and introduce our training objectives in this section. The notations used in this table are given in Table 1.

Table 1.
Notations Used.
Let be a set of users and be a set of items. The list of interactions of user is denoted by , where user u has interacted with item at the relative time step t. Each item is associated with a set of keywords that describe the item v. We refer to set K as the metadata related to the item. Given the history and the additional metadata for every , the POI recommendation task is to predict the next item in the sequence of a user’s interactions. We adapted the deep bidirectional self-attention model BERT [7] for the sequential recommendation task, resulting in our BERT4Loc model. Our modifications in the original BERT4REC models are the following.
The original BERT4Rec model has two embeddings: (i) an embedding of the POI (item) identifier, and (ii) an additional embedding for the position of the items in the sequence for the Transformer blocks. We include an additional keyword embedding to the Transformer layer and we also consider modification of the loss function.
Adding an additional keyword embedding to the Transformer layer: Our first modification to the BERT4Rec is that we modify the Transformer layer and add an additional embedding of the keywords of item , representing the metadata as additional information.
Integrating Bayesian Personalized Ranking (BPR) for computing loss instead of Binary Cross-Entropy (BCE): Our second adaptation in the BERT4Loc model involves a change in the training process. Instead of the original BCE loss function employed by BERT4Rec, we integrate the BPR [35] for computing loss. The BCE function uses negative sampling to differentiate between items a user has and has not interacted with. BCE treats the unobserved user–item pairs as negative instances, which may not always reflect the user’s actual preferences. BPR is a ranking loss function, which is designed for scenarios involving implicit feedback. We chose BPR over BCE due to the BPR method’s effectiveness in handling implicit feedback and optimizing ordinal preferences, making it more suited for our recommendation task. The modified BERT4Loc architecture is shown in Figure 1 and consists of three different layers:
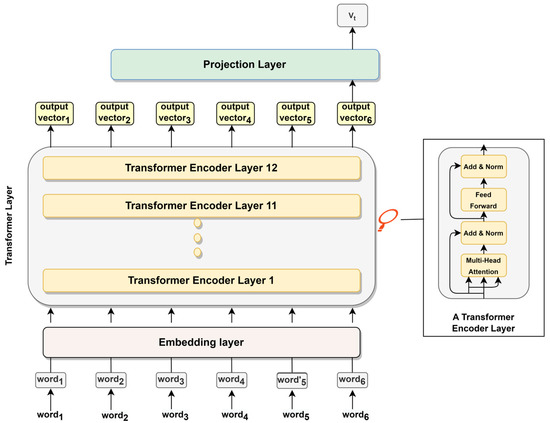
Figure 1.
BERT4Loc architecture.
- Embedding layer: This layer learns a representation of the inputs, including the POI (business) ID and the associated metadata (e.g., business category), and transforms this representation into continuous vectors or “embeddings”. These embeddings capture the semantic meaning and characteristics of the inputs, providing dense information for the upcoming layers. The resulting embeddings are then passed to the Transformer Layer for further processing.
- Transformer layer: This layer consists of a stack of 12 Transformer blocks, each with 12 self-attention heads. The mechanism of self-attention allows the model to weigh the importance of each item in a sequence relative to the others. Each layer takes in a list of token embeddings and produces the same number of embeddings on the output (with transformed feature values). The output of the final Transformer block is passed to the projection layer.
- Projection layer: This layer takes the refined embeddings from the Transformer Layer and maps them into the item space. It uses a SoftMax layer to probabilistically rank all potential recommendations. We employ the Cloze task [36] as our training method. This method randomly masks certain items in the interaction sequence, prompting the model to predict these “hidden” (POI) items. The model learns to anticipate user behavior, preparing it to make future recommendations.
3.3. Training
BPR loss function is utilized during the training phase of the BERT4Loc model. BPR is a pairwise ranking loss which tries to ensure that for each user the items that they have interacted with are ranked higher than items they have not interacted with. BPR is more suited in scenarios with implicit feedback, where we only know if a user has interacted with an item but lack explicit ratings (like or dislike, for example). Implicit feedback is prevalent in many real-world recommendation scenarios, such as item views, clicks, or purchase history.
3.4. Prediction and Recommendation
During the prediction process, we compute preference scores for POI items for users and recommend the items with the highest scores. This prediction process considers the user’s historical data and the features of the POI. The score essentially reflects how much a particular user might prefer or like a certain POI. Finally, for a given user, we rank all POI based on the predicted preference scores. We then recommend the top-scoring POI to the user.
4. Experimental Setup
In this section, we elaborate the experiment setup.
4.1. Data Set
We utilized the Yelp Dataset [37], which is available on Yelp’s website. The dataset contains 1.6 million reviews and 500,000 tips from 366,000 users for 61,000 businesses. It also includes 481,000 business attributes, such as hours, parking availability, and ambiance, as well as check-ins for each of the 61,000 businesses collected over time via a social network of 366,000 people, resulting in a total of 2.9 million social users. Specifically, the dataset comprises data for 61,184 businesses, 1,569,264 reviews, and 366,715 users.
We also used the Foursquare Dataset [1] to address the recommendation problem. From this dataset, we obtained approximately 43,108 unique geographical locations for our experiment. We considered 18,107 users with a total of 2,073,740 check-ins, focusing on users with at least 10 check-ins.
For user features from both datasets, we considered user ID, user reviews, ratings, and timestamps of user interactions. For location (item) features, we used location ID, location name, and city name. The user ID and business ID serve as primary information related to users and businesses (locations), respectively. Metadata related to users includes stars, text (review), and interaction timestamps, while metadata related to items consists of business names. We included these pieces of information for training, but our model is generalizable and can accommodate more metadata if available.
The features of both the datasets used in this work are given in Table 2.
Table 2.
Datasets features used.
In this work, we converted all numerical ratings or the presence of a review into an implicit feedback score of 1 (i.e., the user interacted with the item). We then grouped interaction records by users and constructed interaction sequences for each user by sorting the records by timestamps.
We performed an analysis of some of the data. Figure 2 calculates the distribution of ratings and computes the average length of reviews in the Yelp dataset. Figure 2 shows that most of the reviews have lengths of 100, 200, and 400, which is likely due to the fact that these are common values for people to use when writing reviews. Many people may have a certain amount of information they want to convey in their review and may find that these lengths allow them to do so effectively.
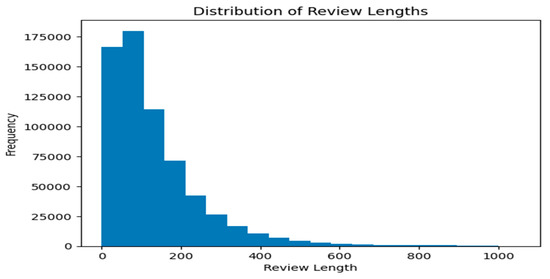
Figure 2.
Chart showing the distribution of ratings in the Yelp review dataset.
Next, we show the word cloud of positive reviews for both datasets in Figure 3. The word cloud of positive reviews shows that some of the most common words used in positive reviews are “food”, “place”, “great”, “good”, and “nice one”. These are, in general, words that people commonly use to describe positive experiences with restaurants and other food-related businesses.

Figure 3.
Word cloud of positive reviews for both datasets.
We also created a word cloud for all the negative reviews in the dataset (i.e., those with a rating of 1 or 2) and do not find any useful patterns. So, we performed the sentiment analysis using the VADER [38] library for the reviews data from both datasets and reported the distribution of positive, negative, and neutral sentiments on reviews, which ranges from −1 (most negative) to 1 (most positive), as seen in Figure 4. The sentiment analysis, while not directly related to recommendation systems, is used here to examine user reviews data. Such information provides valuable insights that can help businesses improve their products, services, and customer relationships. Based on the sentiment distribution histogram in Figure 4, we can observe that there are some negative sentiments expressed by reviewers, but the majority of the sentiment polarities fall between neutral and 75% positive.
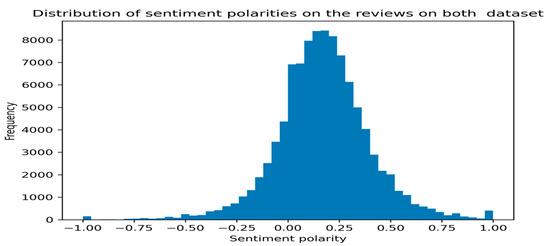
Figure 4.
Distribution of sentiment polarities on the reviews of both datasets.
Figure 5 displays the distribution of reviews and star ratings across major cities in the Yelp dataset. Our analysis found that Las Vegas had the highest number of ratings. However, when looking at the distribution of five-star ratings for different cities (as shown in Figure 5), they are almost equal.
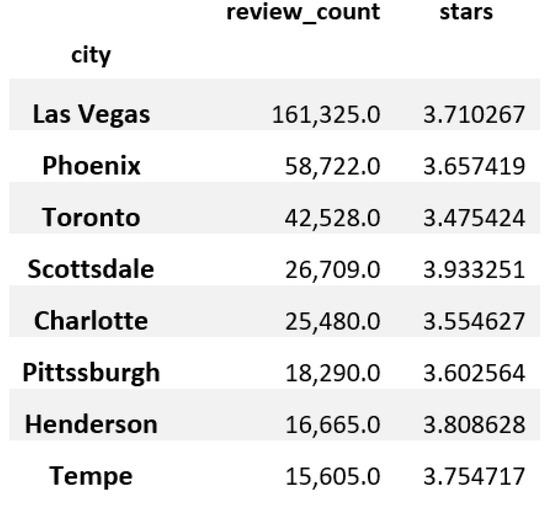
Figure 5.
Cities with the most reviews and best ratings.
4.2. Evaluation Methodology
For our experiments, we used a time-based splitting criterion for both datasets. In time-based splitting, the test set indexes are greater than those of the validation set, which are greater than those of the training set. As an example, if a dataset contains at least twenty ratings for each item and user, the available ratings can be divided into train, validation, and test sets. The test set contains the user’s most recent six ratings, while the validation set contains the user’s previous four ratings. The train set for this dataset is comprised of all previous ratings (at least ten).
In our work, we sorted the data by the timestamp of user interaction in descending order and split them accordingly. We used the leave-one-out data splitting method where, for each user, we held out the last item of the behavior sequence as the test data, treated the item just before the last as the validation set, and utilized the remaining items for training. We use the following evaluation metrics in this paper.
Precision is a measure for computing the fraction of relevant items out of all the recommended items. We average the metric for each user u to obtain the final result. Precision is shown in Equation (1).
where represents the ground-truth set of items that user u has interacted with and represents the item count of .
Recall is a measure for computing the fraction of relevant items out of all relevant items. Recall is defined in Equation (2).
Hit Ratio (HR) is a way of calculating how many ‘hits’ are in a k-sized list of ranked items. If there is at least one item that falls in the ground-truth set, it is called a hit. HR is defined in Equation (3).
where δ(.) is an indicator function; δ(.) = 1 if it is a hit and 0 if otherwise. ∅ denotes the empty set.
Normalized Discounted Cumulative Gain (NDCG) is a measure of ranking quality, where positions are discounted logarithmically. It accounts for the position of the hit by assigning higher scores to hits at top ranks. It is defined as in Equation (4).
where δ(.) is an indicator function.
We consider the top-k values, where k is 10, 20, and 50. We compared the performance of various recommender systems in top-k metrics, including Precision, Recall, F1-score, Hit Rate (HR), and Normalized Discounted Cumulative Gain (NDCG), with their respective Mean and Standard Deviation (Mean ± SD) values. The results were reported for both datasets. Regarding the calculation of Mean values, we took the average of the performance metric values across all users or items in the test set. For example, to calculate the Mean Precision, we first calculated the Precision value for each user or item in the test set, and then took the average of these values. The Standard Deviation (SD) was calculated to measure the variability of the performance metric values across all users or items in the test set.
4.3. Baselines
To evaluate the performance of our models, we compared them with a range of different approaches for recommendation systems. These baselines were chosen based on the most commonly used methods in recommender system research. By comparing our models to these baselines, we were able to assess their effectiveness and identify areas for improvement. These baselines are given below.
BERT4Rec [10]: Sequential Recommendation with Bidirectional Encoder Representations from Transformer, which employs the deep bidirectional self-attention to model user behavior sequences.
MultiVAE [39]: Variational Autoencoders for collaborative filtering extends the variational autoencoders (VAEs) for implicit feedback. This model uses a non-sampling method by default, so we also did not use any negative sampling in this method. We simply use cross-entropy loss for this method as the loss function type.
ENMF [40]: Efficient Neural Matrix Factorization without sampling for recommendation is based on a matrix factorization architecture that learns from the whole training data to make recommendations. We use cross-entropy as the loss function for this model.
SASRecF [41]: A Feature-level Deeper Self-Attention Network for sequential recommendation that integrates heterogeneous features of items into feature sequences with different weights through an attention mechanism. We chose the BPR as the loss function.
RepeatNet [42]: A Repeat Aware Neural Recommendation Machine for session-based recommendation that uses an encoder–decoder architecture to address repeat consumption in the session-based recommendation task. We chose the BPR as the loss function.
SLIM [43]: Sparse Linear Methods for Top-N recommendations introduce a linear model that learns to predict the similarity between items in a sparse manner. This method provides a compact and interpretable model for top-N recommendations. We use the BPR loss function for this model.
NCF [44]: Neural Collaborative Filtering is a general framework for collaborative filtering that combines matrix factorization and a multi-layer perceptron to learn the user–item interaction patterns. For this model, we use the cross-entropy loss function.
GRU4Rec [28]: Session-based Recommendations with RNNs; Gated Recurrent Units (GRU) model the sequential behavior of users in session-based recommendations. We use the BPR loss function for training.
FPMC [45]: Factorizing Personalized Markov Chains for next-basket recommendation combines matrix factorization and Markov chains to model user behavior and generate personalized recommendations. We use the BPR loss function for this model.
4.4. Hyperparameters Setting
In our experimental setup, we fine-tuned our BERT4Loc model with a set of carefully chosen hyperparameters. We used the uncased version of the BERT-base model because it offers a strong foundation for NLP tasks. This model has been widely adopted due to its ability to capture contextual relationships and meaning in text, making it suitable for a range of applications such as sentiment analysis, question answering, and text classification. We fine-tuned the model for the recommendation task. The loss function used in training was BPR, and we trained the model for 20 epochs with a learning rate of 0.001. We used a train_batch_size and eval_batch_size of 16 and set the attention dropout probability to 0.5. Additionally, we set the mask_ratio to 0.2 to reduce overfitting. We experimented with different hyperparameters to optimize the model’s performance. The maximum sequence length was set to 200, which was the maximum number of POI visited by a user in our dataset. To ensure a fair comparison, we fine-tuned all the baseline models to their optimal hyperparameter settings. We used Google Colab as the programming platform and connected it to Google Drive to store and access our data. During training, we created small batches of data to fit all the data into memory. Each batch took approximately 20–25 min for training, and the complete training process with the full dataset took several hours.
5. Results and Analysis
In this section, we present the results and analyze the performance of our model.
5.1. Overall Results
The comparison between our model and all the baselines is shown in Table 3.
Table 3.
Performance comparison of various recommender systems on top-k metrics, including Precision, Recall, F1-score, Hit Rate (HR), and Normalized Discounted Cumulative Gain (NDCG), with their respective Mean and Standard Deviation (Mean ± SD) values. The results are reported for both datasets. Bold means best result.
Based on the results shown in Table 3, BERT4Loc and BERT4REC show the highest precision, recall, and F1-score among all models. These models demonstrate a strong performance across all top-k values (10, 20, and 50). BERT4Loc achieves the highest HR and NDCG for all top-k values, indicating that it is highly effective in ranking relevant items for users. The comparison between BERT4Rec and BERT4Loc reveals that BERT4Loc performs better in location-aware recommendation scenarios. BERT4Rec is designed to take in user–item features without considering contextual features, and we consider the contextual information in BERT4REC in this experiment; nevertheless, BERT4Loc with its default design to leverage rich contextual features makes more accurate recommendations. In our experiments, we provide the same input features to all baseline models; a model’s ability to naturally incorporate rich contextual features can give it an advantage in providing better recommendations.
MultiVAE, RepeatNet, SASRecF, and ENMF models show relatively lower performance compared to BERT4Loc and BERT4REC. Their precision, recall, and F1-score values are lower, indicating that these models are less accurate in predicting the top-N items for users. The HR and NDCG metrics also indicate that these models are less effective in ranking relevant items.
SLIM, NCF, GRU4Rec, and FPMC models show moderate performance in comparison to the other models. Their precision, recall, and F1-score values are better than MultiVAE, RepeatNet, SASRecF, and ENMF but lower than BERT4Loc and BERT4REC. The HR and NDCG metrics for these models are also intermediate, indicating that they have moderate effectiveness in ranking relevant items.
The superiority of our BERT-based model is attributed to its design, which has the following distinctive attributes: (1) it considers the side information from the POI items in the item encoder; (2) it considers the contexts in the user model to better capture the sequential correlation of a user’s POI history; and (3) it is based on sequential recommendation, which implicitly consider both the short- and long-term interests of users.
Inherently, our model is based on the BERT architecture, which is a deep bidirectional self-attention model that can capture item relations on both sides, left and right, whereas other sequential recommendation models (in these experiments) only consider users’ historical sequences from left to right. In real situations, a user’s behavior depends on the user’s current interests, which can evolve in a highly dynamic manner. Therefore, considering only previous items is insufficient in terms of accuracy. Our model can predict the next item by extracting user historical patterns based on the relationship between rated items in the history data of target users (item sequences).
We also observe the highest scores of BERT4LOC based on the HR and NDCG metrics, which show that BERT4Loc performs well in ranking relevant items for users in both datasets. For the remaining models, their performance may vary between the two datasets due to the differences in data characteristics. Some models might be more sensitive to the data sparsity or the distribution of user–item interactions, which could lead to variations in their performance metrics. Due to similar patterns in the results and for brevity reasons, we will report the results of the next experiments solely for the Yelp dataset.
5.2. Ablations
Ablation experiments help understand the impact of different parts of a model by comparing performance with and without certain components. In this experiment, we used this approach to estimate the importance of user and item features in our BERT4LOC model.
The bar chart in Figure 6 shows the ablation study. We observe that if we remove any feature set, the NDCG score, which measures the model quality, goes down. We observe the biggest drop in NDCG score when we remove both user and item features. This shows that these features are not just important on their own, but also when used together. The chart also hints that user activity features might be slightly more important than the others. Overall, we conclude that all feature sets are important for the BERT4LOC model to work well. This comparison demonstrated that each feature set significantly contributes to the model’s effectiveness, hence validating our model’s design choices.

Figure 6.
Ablation study, NDCG comparison among different versions of BERT4LOC. BERT4LOC-U- is the model without user activity features, BERT4LOC-D- without user demographic features, BERT4LOC-C- without item categorical features, and BERT4LOC-U&C- without both user and item features.
5.3. Effectiveness of Different Sampling Techniques
We test the effectiveness of different sampling techniques that are mostly used in recommender systems [46,47] in this experiment and show results In Figure 7, we try the following sampling methods:
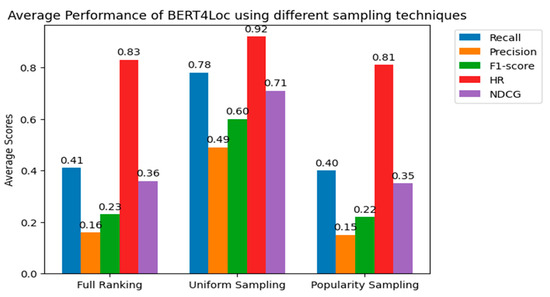
Figure 7.
Average performance of BERT4Loc using different sampling techniques.
- Full ranking: evaluating the model on all sets of items.
- Uniform X (uni-X): uniformly sample X negative items for each positive item in the testing set, and evaluate the model’s performance for these positive items with their sampled negative items.
- Popularity X (pop-X): sample X negative items for each positive item in the testing set based on item popularity, and evaluate the model’s performance for these positive items with their sampled negative items.
To provide a high-level summary of these results, we take the average of the top-k values (10, 20, and 50) to show the precision, recall, HR, NDCG, and F1 scores.
Figure 7 shows the average performance of BERT4Loc using different sampling techniques: full ranking, uni-100, and pop-100. We consider the sample size of 100 based on earlier experiments to choose an appropriate size.
According to the results, the uni-100 technique consistently outperforms both full ranking and pop-100 in terms of average recall, precision, F1-score, HR, and NDCG. This suggests that uni-100 is the most effective sampling technique among the three. Full ranking exhibits a moderate performance compared to the uniform sampling technique. It has higher average scores (though marginal) than popularity sampling but lower than uniform sampling. This indicates that although full ranking provides relatively accurate recommendations, it may not be as effective as uniform sampling. Popularity has the lowest average scores across all metrics, indicating that it is the least effective sampling technique in this experiment. This is because it samples negative items based on item popularity, which may lead to some random recommendations and lower-accuracy scores.
Overall, we find that given the dataset size and computational resources, using uniform sampling proves to be more effective than both full ranking and popularity sampling for BERT4Loc.
5.4. Effectiveness of the Length of the Recommendation List
We assess the recommendation accuracy for the top-k values (k = [10, 100]) using F1-score (harmonic mean of precision and recall), HR, and NDCG, as shown in Figure 8.
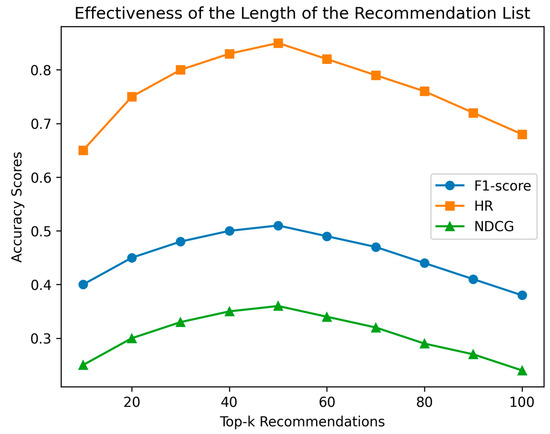
Figure 8.
Effects of recommendation list length on performance.
The plot in Figure 7 shows the effectiveness of the length of the recommendation list for top-k (k = [10, 100]) values using F1-score (harmonic mean of precision and recall), HR, and NDCG. We can observe that the model’s accuracy improves as the value of k increases. However, after a certain point (k = 50), the accuracy of the recommendations begins to decrease. This decrease in accuracy can be attributed to the fact that there may not be enough relevant items after a certain threshold of recommendations.
As the recommendation list becomes longer, it becomes more challenging for the model to provide accurate and relevant recommendations. Consequently, the precision and recall values start to decline, which in turn leads to a decrease in the F1-score, HR, and NDCG scores. Therefore, it is crucial to find an optimal value of k that balances the trade-off between the number of recommendations and the accuracy of the model. Based on the plot, it seems that k = 50 is an optimal point where accuracy is maximized before it starts to decline.
5.5. Comparison of Cold-Start Approaches
Our BERT4LOC model can combat the cold-start issue inherent to recommendation systems. It does so effectively by considering the contextual information related to the users’ preference and POI items’ data. The model employs rich embeddings from user–item features to grasp the nature of POI and relies on the BPR loss function to interpret implicit feedback and thereby observe user preferences. This consolidation of different strategies enables our model to provide relevant recommendations, despite limited user or item data.
To evaluate the performance of our model in cold-start scenarios, we conducted experiments using three different approaches: collaborative filtering, content-based filtering, and a hybrid approach; these are well-known recommender system approaches, as reported in the literature [3,48]. For collaborative filtering, we used a matrix factorization approach to recommend items based on similar users or items. For content-based filtering, we used the textual description of the items to recommend similar items to the user. For the hybrid approach, we combined the matrix factorization and content-based filtering approaches. We evaluated the performance of these approaches in the cold-start scenario, where there is limited information about new users or items.
As we can see from Table 4, BERT4LOC outperforms the other models in all evaluation metrics in the cold-start scenario. It has the highest recall, precision, F1-score, HR, and NDCG, indicating that it is the most effective model in recommending items for new users or items with limited information. This is probably because BERT4LOC leverages the power of Transformer-based architectures, which can handle sequential data and contextual relationships effectively. By integrating both location information and user preferences, BERT4LOC can provide more personalized and relevant recommendations, even in situations where there is limited information about the user or the item.
Table 4.
BERT4Loc (cold-start scenario). Bold means best score.
5.6. Example of BERT4LOC
As an example, we will now present how the BERT4LOC works.
Consider a group of tourists visiting a city, e.g., New York, for the first time. The tourists have a mobile app that uses BERT4LOC to recommend the next POI based on their activities. The tourists start their day at the Statue of Liberty (POI1), move on to Times Square (POI2), and then visit the Metropolitan Museum of Art (POI3). BERT4LOC processes this sequence of interactions and predicts the next POI they would most likely be interested in visiting. BERT4LOC would also consider many more factors, such as user preferences, item characteristics, and various contextual information. Based on similar user behavior in the past, BERT4LOC can predict Central Park (POI4) as the next destination. So, the application recommends Central Park to the tourists, and the tourist can decide to follow this suggestion. This example shows how BERT4LOC leverages the sequential pattern of user–POI interactions, enabling more personalized and efficient recommendations.
6. Discussion
Impact: Our study proposes a new approach for location recommendation, BERT4Loc, which combines the strengths of both collaborative filtering and content-based filtering techniques. Our approach shows promising results in terms of accuracy and efficiency in location recommendation.
The BERT4Loc approach has several benefits over traditional location recommendation techniques. First, it takes into account the user’s context and preferences, including historical check-ins, the user’s profile, and location attributes, to provide more accurate recommendations. Second, BERT4Loc is similar to a hybrid approach, which means it combines the strengths of collaborative filtering and content-based filtering. This approach makes it more robust and capable of handling cold-start scenarios. Finally, BERT4Loc is built on top of BERT, a state-of-the-art language model which can learn complex patterns and relationships among user, location, and context data, resulting in more accurate recommendations.
Limitations: Despite its promising results, our approach has some limitations. One limitation is that it requires a significant amount of training data to achieve high accuracy. This can be a problem for location-based services that do not have a large user base or have limited data. Another limitation is that the approach may not work well for rare or new locations that have limited data. In such cases, the model may fail to capture the patterns and relationships among the user, location, and context data, resulting in inaccurate recommendations.
During the development and fine-tuning of our model, we used an iterative approach. This included running multiple trials and fine-tuning on the Transformer models based on the results. We were able to continuously optimize the model parameters, identify any potential issues, and adjust our strategies as a result of this process. Because determining the optimal model parameters and architecture is not always straightforward, such an approach is commonly used in machine learning and deep learning projects. It will also be worthwhile to train the model using more recent datasets.
Future directions: There are several potential directions for future research on the BERT4Loc approach. One direction is to explore the use of more advanced deep learning models, such as graph neural networks or more foundation models [49,50], to improve the accuracy and efficiency of location recommendations. Another direction is to investigate the use of other types of data, such as social network data or sensor data, to enhance the performance of the BERT4Loc model.
Numerous other possibilities remain to be explored. We need to evaluate our model using additional datasets. A worthwhile direction is to incorporate rich POI features into the model, such as those related to the location, such as coordinates, weather, and neighborhood. Another interesting direction for future work would be to incorporate more information into the user encoder of the model to enable explicit user modelling when users are logged in multiple times.
BERT and LaMDA (Language Model for Dialogue Applications) [51] are both based on the Transformer architecture. BERT improves understanding of individual search queries, while LaMDA focuses on enhancing dialogue understanding and generating coherent responses. The application of LaMDA can be further explored for building such a POI recommendation system.
The distinguishing feature of BERT is its bidirectional self-attention mechanism, which allows it to determine the context of a word by simultaneously examining all other words in a sentence. However, several other transformer models may also be viable, depending on the specific requirements of a recommender system. OpenAI’s [51] GPT-2 and GPT-3 models, for example, follow a unidirectional, left-to-right architecture, and these models can be tested for producing recommendations in the location-awareness domain.
Additionally, different types of attention mechanisms, such as local or sparse attention [52], should be considered. These may provide different benefits than full self-attention in BERT. Moreover, changes to the model architecture itself, such as incorporating convolutional or recurrent layers in conjunction with self-attention, might prove advantageous.
Finally, it is important to evaluate the BERT4Loc approach for real-world datasets and compare its performance with other state-of-the-art techniques to gain more insights into its strengths and weaknesses. Despite these limitations, we believe that our approach can be further improved and extended in future research to address the challenges and opportunities in location-based services.
7. Conclusions
The BERT architecture has been extremely successful in terms of language comprehension. We introduce a BERT for location-aware recommendations in this paper. Our model is built on top of the BERT architecture, which includes a user encoder, a POI item encoder, and a task for preference prediction and recommendation. We treat the problem of recommending POI to a user as a sequential problem, with the task of predicting the user’s next POI. Experimental results on real-world datasets demonstrate that our model has is capable of producing POI recommendations. The results highlight the potential of incorporating language models in recommendation systems. However, there are limitations to our approach, such as the dependence on large amounts of data for training and the potential for overfitting. Future directions include exploring additional features and data sources to improve model performance and evaluating the scalability of the model for larger datasets.
Author Contributions
Conceptualization, S.R.B., V.B.M. and S.R.; methodology, S.R.B, V.B.M. and S.R.; validation, S.R.B., V.B.M. and S.R.; formal analysis, S.R.B. and V.B.M., investigation, V.B.M.; writing—original draft preparation, S.R.B.; writing—review and editing, S.R.B., V.B.M. and S.R., visualization, S.R.B.; supervision, V.B.M.; funding acquisition, V.B.M. All authors have read and agreed to the published version of the manuscript.
Funding
There is no funding provided for this study.
Data Availability Statement
The Foursquare data (Dingqi YANG’s Homepage—Foursquare Dataset (google.com, assessed on 1 May 2023)) and Yelp (Yelp Dataset) data are both available as open benchmark datasets.
Conflicts of Interest
The authors declare no conflict of interest.
References
- Dingqi YANG Foursquare Dataset. Dingqi YANG’s Homepage; China. 2019. Available online: https://sites.google.com/site/yangdingqi/home (accessed on 1 May 2023).
- Cho, E.K.; Myers, S.A.; Leskovec, J. The Social Network of a Mobile Society: Combining Geographic and Social Network Analysis with Participatory Sensing. In Proceedings of the 2011 IEEE Third International Conference on Privacy, Security, Risk and Trust and 2011 IEEE Third International Conference on Social Computing, Boston, MA, USA, 9–11 October 2011; pp. 278–285. [Google Scholar]
- Raza, S.; Ding, C. Progress in Context-Aware Recommender Systems—An Overview. Comput. Sci. Rev. 2019, 31, 84–97. [Google Scholar] [CrossRef]
- Raza, S.; Ding, C. News Recommender System Considering Temporal Dynamics and News Taxonomy. In Proceedings of the—2019 IEEE International Conference on Big Data, Big Data 2019, Los Angeles, CA, USA, 9–12 December 2019; pp. 920–929. [Google Scholar]
- Karatzoglou, A.; Hidasi, B. Deep Learning for Recommender Systems. In Proceedings of the RecSys 2017—11th ACM Conference on Recommender Systems, Como, Italy, 27–31 August 2017; pp. 396–397. [Google Scholar]
- Vaswani, A.; Shazeer, N.; Parmar, N.; Uszkoreit, J.; Jones, L.; Gomez, A.N.; Kaiser, Ł.; Polosukhin, I. Attention Is All You Need. In Proceedings of the Advances in Neural Information Processing Systems, Long Beach, CA, USA, 4–9 December 2017; pp. 5998–6008. [Google Scholar]
- Devlin, J.; Chang, M.W.; Lee, K.; Toutanova, K. BERT: Pre-Training of Deep Bidirectional Transformers for Language Understanding. In Proceedings of the NAACL HLT 2019—2019 Conference of the North American Chapter of the Association for Computational Linguistics: Human Language Technologies—Proceedings of the Conference, Minneapolis, MN, USA, 2–7 June 2019; Volume 1, pp. 4171–4186. [Google Scholar]
- Rogers, A.; Kovaleva, O.; Rumshisky, A. A Primer in {BERT}ology: What We Know About How {BERT} Works. Trans. Assoc. Comput. Linguist. 2020, 8, 842–866. [Google Scholar] [CrossRef]
- Rendle, S. Factorization Machines. In Proceedings of the 2010 IEEE International Conference on Data Mining, Sydney, Australia, 13–17 December 2010; pp. 995–1000. [Google Scholar]
- Sun, F.; Liu, J.; Wu, J.; Pei, C.; Lin, X.; Ou, W.; Jiang, P. BERT4Rec: Sequential Recommendation with Bidirectional Encoder Representations from Transformer. In Proceedings of the 28th ACM International Conference on Information and Knowledge Management, Beijing, China, 3–7 November 2019; Association for Computing Machinery: New York, NY, USA, 2019; pp. 1441–1450. [Google Scholar]
- Lian, D.; Zhao, C.; Xie, X.; Sun, G.; Chen, E.; Rui, Y. GeoMF: Joint Geographical Modeling and Matrix Factorization for Point-of-Interest Recommendation. In Proceedings of the 20th ACM SIGKDD International Conference on Knowledge Discovery and Data Mining, New York, NY, USA, 24–27 August 2014; pp. 831–840. [Google Scholar] [CrossRef]
- Al-Molegi, A.; Jabreel, M.; Ghaleb, B. STF-RNN: Space Time Features-Based Recurrent Neural Network for Predicting People next Location. In Proceedings of the 2016 IEEE Symposium Series on Computational Intelligence (SSCI), Athens, Greece, 6–9 December 2016; pp. 1–7. [Google Scholar]
- Liu, W.; Wang, Z.J.; Yao, B.; Yin, J. Geo-ALM: POI Recommendation by Fusing Geographical Information and Adversarial Learning Mechanism. In Proceedings of the IJCAI International Joint Conference on Artificial Intelligence, Macao, China, 10–16 August 2019; pp. 1807–1813. [Google Scholar]
- Jiao, X.; Xiao, Y.; Zheng, W.; Wang, H.; Hsu, C.H. A Novel next New Point-of-Interest Recommendation System Based on Simulated User Travel Decision-Making Process. Futur. Gener. Comput. Syst. 2019, 100, 982–993. [Google Scholar] [CrossRef]
- Nguyen, L.V.; Nguyen, T.H.; Jung, J.J. Tourism Recommender System Based on Cognitive Similarity between Cross-Cultural Users. In Proceedings of the Intelligent Environments 2021: Workshop Proceedings of the 17th International Conference on Intelligent Environments, Dubai, United Arab Emirates, 21–24 June 2021; Volume 29, pp. 225–232. [Google Scholar]
- Nguyen, L.V.; Jung, J.J.; Hwang, M. Ourplaces: Cross-Cultural Crowdsourcing Platform for Location Recommendation Services. ISPRS Int. J. Geo-Inf. 2020, 9, 711. [Google Scholar] [CrossRef]
- Li, Z.; Xiong, F.; Wang, X.; Chen, H.; Xiong, X. Topological Influence-Aware Recommendation on Social Networks. Complexity 2019, 2019, 6325654. [Google Scholar] [CrossRef]
- Guy, I. Social Recommender Systems. In Recommender Systems Handbook, 2nd ed.; Springer: Berlin/Heidelberg, Germany, 2015; pp. 511–543. ISBN 9781489976376. [Google Scholar]
- Jamali, M.; Ester, M. A Matrix Factorization Technique with Trust Propagation for Recommendation in Social Networks. In Proceedings of the Fourth ACM Conference on Recommender Systems, Barcelona, Spain, 26–30 September 2010; Association for Computing Machinery: New York, NY, USA, 2010; pp. 135–142. [Google Scholar]
- Ma, H.; Zhou, D.; Liu, C.; Lyu, M.R.; King, I. Recommender Systems with Social Regularization. In Proceedings of the Fourth ACM International Conference on Web Search and Data Mining, Hong Kong, China, 9–12 February 2011; Association for Computing Machinery: New York, NY, USA, 2011; pp. 287–296. [Google Scholar]
- Guo, G.; Zhang, J.; Yorke-Smith, N. TrustSVD: Collaborative Filtering with Both the Explicit and Implicit Influence of User Trust and of Item Ratings. Proc. Natl. Conf. Artif. Intell. 2015, 1, 123–129. [Google Scholar] [CrossRef]
- Guo, H.; Tang, R.; Ye, Y.; Li, Z.; He, X. DeepFM: A Factorization-Machine Based Neural Network for Ctr Prediction. arXiv 2017, arXiv:1703.04247. [Google Scholar]
- Wang, R.; Fu, B.; Fu, G.; Wang, M. Deep & Cross Network for Ad Click Predictions. arXiv 2017, arXiv:1708.05123. [Google Scholar]
- He, X.; Chua, T.-S. Neural Factorization Machines for Sparse Predictive Analytics. In Proceedings of the 40th International ACM SIGIR Conference on Research and Development in Information Retrieval, Tokyo, Japan, 7–11 August 2017. [Google Scholar] [CrossRef]
- Xiao, J.; Ye, H.; He, X.; Zhang, H.; Wu, F.; Chua, T.-S. Attentional Factorization Machines: Learning the Weight of Feature Interactions via Attention Networks. arXiv 2017, arXiv:1708.04617. [Google Scholar]
- Feng, Y.; Lv, F.; Shen, W.; Wang, M.; Sun, F.; Zhu, Y.; Yang, K. Deep Interest Network for Click-through Rate Prediction. IJCAI Int. Jt. Conf. Artif. Intell. 2019, 2019, 2301–2307. [Google Scholar] [CrossRef]
- Quadrana, M.; Cremonesi, P.; Jannach, D. Sequence-Aware Recommender Systems. ACM Comput. Surv. 2018, 51, 1–36. [Google Scholar] [CrossRef]
- Hidasi, B.; Karatzoglou, A.; Baltrunas, L.; Tikk, D. Session-Based Recommendations with Recurrent Neural Networks. arXiv 2015, arXiv:1511.06939. [Google Scholar]
- Kang, W.C.; McAuley, J. Self-Attentive Sequential Recommendation. In Proceedings of the 2018 IEEE International Conference on Data Mining (ICDM), Singapore, 17–20 November 2018; pp. 197–206. [Google Scholar] [CrossRef]
- Pugoy, R.A.; Kao, H.-Y. {BERT}-Based Neural Collaborative Filtering and Fixed-Length Contiguous Tokens Explanation. In Proceedings of the 1st Conference of the Asia-Pacific Chapter of the Association for Computational Linguistics and the 10th International Joint Conference on Natural Language Processing 2020, Suzhou, China, 4–7 December 2020; pp. 143–153. [Google Scholar]
- Channarong, C.; Paosirikul, C.; Maneeroj, S.; Takasu, A. HybridBERT4Rec: A Hybrid (Content-Based Filtering and Collaborative Filtering) Recommender System Based on BERT. IEEE Access 2022, 10, 56193–56206. [Google Scholar] [CrossRef]
- Seol, J.J.; Ko, Y.; Lee, S.G. Exploiting Session Information in BERT-Based Session-Aware Sequential Recommendation. In Proceedings of the SIGIR 2022—Proceedings of the 45th International ACM SIGIR Conference on Research and Development in Information Retrieval, Madrid, Spain, 11–15 July 2022; pp. 2639–2644. [Google Scholar]
- Wan, L.; Wang, H.; Hong, Y.; Li, R.; Chen, W.; Huang, Z. ITourSPOT: A Context-Aware Framework for next POI Recommendation in Location-Based Social Networks. Int. J. Digit. Earth 2022, 15, 1614–1636. [Google Scholar] [CrossRef]
- Zhong, C.; Xiong, F.; Pan, S.; Wang, L.; Xiong, X. Hierarchical Attention Neural Network for Information Cascade Prediction. Inf. Sci. 2023, 622, 1109–1127. [Google Scholar] [CrossRef]
- Rendle, S.; Freudenthaler, C.; Gantner, Z.; Schmidt-Thieme, L. BPR: Bayesian Personalized Ranking from Implicit Feedback. arXiv 2012, arXiv:1205.2618. [Google Scholar]
- Wu, X.; Zhang, T.; Zang, L.; Han, J.; Hu, S. Mask and Infill: Applying Masked Language Model to Sentiment Transfer. IJCAI Int. Jt. Conf. Artif. Intell. 2019, 2019, 5271–5277. [Google Scholar] [CrossRef]
- Asghar, N. Yelp Dataset Challenge: Review Rating Prediction. 2016. Available online: https://arxiv.org/abs/1605.05362 (accessed on 1 May 2023).
- Hutto, C.J.; Gilbert, E. VADER: A Parsimonious Rule-Based Model for Sentiment Analysis of Social Media Text. In Proceedings of the 8th International Conference on Weblogs and Social Media, ICWSM 2014, Ann Arbor, MI, USA, 1–4 June 2014; Volume 8, pp. 216–225. [Google Scholar]
- Liang, D.; Krishnan, R.G.; Hoffman, M.D.; Jebara, T. Variational Autoencoders for Collaborative Filtering. In Proceedings of the 2018 World Wide Web Conference, Lyon, France, 23–27 April 2018; pp. 689–698. [Google Scholar]
- Chen, C.; Zhang, M.; Zhang, Y.; Liu, Y.; Ma, S. Efficient Neural Matrix Factorization without Sampling for Recommendation. ACM Trans. Inf. Syst. 2020, 38, 1–28. [Google Scholar] [CrossRef]
- Zhang, T.; Zhao, P.; Liu, Y.; Sheng, V.S.; Xu, J.; Wang, D.; Liu, G.; Zhou, X. Feature-Level Deeper Self-Attention Network for Sequential Recommendation. In Proceedings of the IJCAI International Joint Conference on Artificial Intelligence, Macao, China, 10–16 August 2019; pp. 4320–4326. [Google Scholar]
- Ren, P.; Chen, Z.; Li, J.; Ren, Z.; Ma, J.; De Rijke, M. Repeatnet: A Repeat Aware Neural Recommendation Machine for Session-Based Recommendation. In Proceedings of the AAAI Conference on Artificial Intelligence, Honolulu, HI, USA, 27 January–1 February 2019; Volume 33, pp. 4806–4813. [Google Scholar]
- Ning, X.; Karypis, G. Slim: Sparse Linear Methods for Top-n Recommender Systems. In Proceedings of the 2011 IEEE 11th International Conference on Data Mining, Vancouver, BC, Canada, 11–14 December 2011; pp. 497–506. [Google Scholar]
- He, X.; Liao, L.; Zhang, H.; Nie, L.; Hu, X.; Chua, T.S. Neural Collaborative Filtering. In Proceedings of the 26th International World Wide Web Conference, WWW 2017, Perth, Australia, 3–7 April 2017; pp. 173–182. [Google Scholar]
- Rendle, S.; Freudenthaler, C.; Schmidt-Thieme, L. Factorizing Personalized Markov Chains for Next-Basket Recommendation. In Proceedings of the 19th International Conference on World Wide Web, Raleigh, NC, USA, 26–30 April 2010; pp. 811–820. [Google Scholar]
- Krichene, W.; Rendle, S. On Sampled Metrics for Item Recommendation. In Proceedings of the 26th ACM SIGKDD International Conference on Knowledge Discovery & Data Mining, Virtual Event, 23–27 August 2020; pp. 1748–1757. [Google Scholar] [CrossRef]
- Raza, S.; Ding, C. Deep Neural Network to Tradeoff between Accuracy and Diversity in a News Recommender System. In Proceedings of the 2021 IEEE International Conference on Big Data (Big Data), Orlando, FL, USA, 15–18 December 2021; pp. 5246–5256. [Google Scholar]
- Raza, S.; Ding, C. News Recommender System: A Review of Recent Progress, Challenges, and Opportunities. Artif. Intell. Rev. 2021, 55, 749–800. [Google Scholar] [CrossRef]
- Raza, S.; Schwartz, B. Entity and Relation Extraction from Clinical Case Reports of COVID-19: A Natural Language Processing Approach. BMC Med. Inform. Decis. Mak. 2023, 23, 20. [Google Scholar] [CrossRef]
- Raza, S.; Schwartz, B.; Rosella, L.C. CoQUAD: A COVID-19 Question Answering Dataset System, Facilitating Research, Benchmarking, and Practice. BMC Bioinform. 2022, 23, 210. [Google Scholar] [CrossRef] [PubMed]
- Collins, E. LaMDA: Our Breakthrough Conversation Technology. Google AI Blog 2021. OpenAI. Available online: https://blog.google/technology/ai/lamda/ (accessed on 1 May 2023).
- Roy, A.; Saffar, M.; Vaswani, A.; Grangier, D. Efficient Content-Based Sparse Attention with Routing Transformers. Trans. Assoc. Comput. Linguist. 2021, 9, 53–68. [Google Scholar] [CrossRef]


Disclaimer/Publisher’s Note: The statements, opinions and data contained in all publications are solely those of the individual author(s) and contributor(s) and not of MDPI and/or the editor(s). MDPI and/or the editor(s) disclaim responsibility for any injury to people or property resulting from any ideas, methods, instructions or products referred to in the content. |
© 2023 by the authors. Licensee MDPI, Basel, Switzerland. This article is an open access article distributed under the terms and conditions of the Creative Commons Attribution (CC BY) license (https://creativecommons.org/licenses/by/4.0/).