Abstract
With the constant expansion of the Web, search engines became part of people’s daily routines. How users behave during the search process depends on a variety factors, one of which is the topic of their search interest. This study focused on the behavior of users searching the Web for content related to art and cultural heritage. A proprietary, publicly available, federated search engine, in the form of a web and mobile app, was developed for this research’s purposes. This platform was used to monitor actual user behavior during a six-month period. Quantitative data related to the platform’s usage were collected and analyzed in order to provide a detailed picture of the way interested parties engaged with it. This information pertained not only to the search queries and results viewed, but also to the various characteristics of the search sessions themselves. The study presented an analysis of these data, with emphasis on query and result characteristics, usage devices, login preferences and session duration, and drew conclusions. The study’s findings showed, among other things, that art searchers showed a preference for shorter queries, a tendency for higher query repeatability, and showed interest in a wider number of results than general purpose searchers. Additionally, they were more keen to use desktop devices instead of mobile ones and displayed higher engagement metrics during longer search sessions or when logged in. These findings outlined an art searcher who was interested in concepts and people often revisited searches and results, showed interest for more than the first few hits, was attracted by rich content, and understood the art search process as a task which requires focus. They also pointed out a duality in the art search process itself which can be long and involved or short and purposeful.
1. Introduction
Web search constitutes an application of information retrieval [1]. Even from before the dawn of the new millennium, search engines became an essential part of the ever-expanding World Wide Web. Search transitioned from a marginally utilized service for the majority of Internet users to the default interface for computing in this information age [2]. Search engines along with social media platforms were in the front of algorithmic culture, fundamentally altering the nature of the Internet and, by extension, our interactions with each other [3]. With multiple search engine alternatives appearing in the early 90s, it became apparent that in order to better serve the needs of the users and, thus, increase revenue, search engines had to rank their results in a manner that satisfied user needs [4]. This ability to prioritize the results a user wants to see is what led to Google’s prevalence in the field and it was, according to O’Brien [5], a “success at modeling human behavior”. The PageRank algorithm, as it was described by Brin and Page in their introduction of Google [6], constituted essentially a method of modeling search engine user behavior. The effort of using behavioral information to improve web search ranking continued in the subsequent decades, with Agichtein arguing that incorporating implicit feedback could heavily increase ranking accuracy [7]. User behavior during a search may change based on the intended result of the search. Mishne and de Rijke identified different topics of engagement for blog searchers as opposed to general web searchers [8], while Kelly and Cool suggested that topic familiarity might alter informational search behavior [9]. At the same time, users seem to prefer seeking information at a search engine for reasons of convenience. The familiarity with a resource, the perception of its ease of use, and its proximity are all factors that contribute to its convenience [10].
In this research, the behavior of search engine users was studied, with emphasis put specifically on the fields of art and cultural heritage. Cultural heritage comprises of objects created or endowed with significance by human action [11]. In this way, it consists or combines objects of any conceivable format, material, size, or genre. Objects can consist of a single item or a collection of items whose significance is derived from their collective presentation. Cultural heritage artifacts are man-made, adapted, added to, or otherwise altered natural world objects, or natural world objects that acquired the status of cultural heritage object because a cultural community ascribed them meaning [12]. As part of ongoing research, the Art Boulevard platform was developed: Art Boulevard is a search engine that allows users to search for content related to art and cultural heritage using the principles of federated search and aggregating results from a series of art and culture related online repositories. The Art Boulevard platform was made available to the general public through the World Wide Web in the form of a website at the URL https://artboulevard.org (accessed on 16 February 2023) and through smartphone storefronts in the form of a mobile application.
Art and culture always played an important role in the development of human existence [13]. The interest in digital cultural heritage and the preservation of historical materials for future generations increased in the recent years [14]. Although there are several intriguing ICT applications that were developed in the context of art-related websites over the past few decades [13], in the vast landscape of the World Wide Web, where commerce and technology often steal the spotlight, fields such as art and cultural heritage are often overlooked. The effort to better understand the needs of users searching for material in fields related to humanities throughout the years included researching the behavior of scholars with access to informational databases such as the Getty Art History Information Program [15], documenting the feedback of undergraduate students on the usage of full-text databases [16], and more. Searching for content relating to art and cultural heritage may lead to differentiations in user behavior based on topic familiarity [9], on specific characteristics of the interested parties such as educational level or age, and on the nature of the topic itself. Mehrotra et al.’s findings on the affinity of various topics to be better suited for multitask or single-task searches indicated the existence of inherent characteristics of the various topics themselves and how they may influence user behavior [17]. In Mehrotra’s research, the arts appeared to be a topic more prone to appear in multi-task searches [17].
Another factor that influences user behavior is the device or platform which is used to access the content. Song et al. presented findings based on a three month log-based study that indicated significant differences in search patterns based on what platform was being used (mobile, tablet, or desktop) [18]. Query length in mobile and tablet was longer, query category distribution was different, and usage time also fluctuated [18]. Kim et al. [19] argued in their lab study that screen size difference corresponds to different eye-tracking patterns, which leads to differences in behavior. In smaller screens, there is less eye movement, which makes extracting information more strenuous [19]. Furthermore, the interaction with the mobile device’s interface is different compared to a desktop or a laptop, since it is carried out via different touch actions such as touching, swiping, zooming on results, and writing via screen touching [20]. Harvey and Pointon [21] also pointed out the effect of fragmented attention when it came to searching the web from mobile. In their study, they found out that when users were distracted in some way, they tended to rush on their web searches and perceived search as more difficult. Such behavioral differences also became a subject of this article.
The use of mobile devices also helped with the introduction of voice recognition technology into search engines. According to Song et al., more and more platforms take advantage of voice search features [18]. Beyond speech recognition, speech synthesis also started appearing in search engine platforms as a tool to help with multilingual content or accessibility. Adell Mercado et al. studied the introduction speech acquisition, recognition, and synthesis in the field of information retrieval in their development of the Buceador multi-lingual search engine [22].
Another technology that evolved alongside traditional query-based searching is content-based search: the ability to search for information using an image or other media instead of keywords. Lew et al. [23] argued that such systems may be especially useful when textual annotations that describe the search object are not available or can even increase search accuracy alongside traditional keywords. The Art Boulevard platform implements features that use both voice and visual search technologies in order to study user behavior regarding these fields.
Moving beyond technologies and towards the social aspect of online searching, the Art Boulevard platform also implemented a simple user system. Such a system can increase user engagement [24] and provide a social environment that is very important in the fields of arts and culture. Moreover, this system allows personalization of the platform’s user interface, which can ensure an environment that adapts to the users preferences and demands [25]. According to Jackson et al., who studied anonymous contributors in online communities [26], anonymity or the lack of anonymity has implications on user behavior. This was also supported by Cho et al.’s study of the real name policy used in the Web in South Korea, but which is also encountered internationally in specific websites [27]. Deciding to login or not is in itself a user-behavior-related decision, but further than that, the interactions between a logged in user and an anonymous user might provide insight into how anonymity might effect user behavior.
The duration of different search sessions may vary greatly. According to Jansen et al. [28], the intent of a web search session might be classified as informational, transactional, or navigational based on the intent of the searcher. Mendoza and Baeza-Yates’ findings indicated that the intent of a search session, and whether it is informational or not, may affect the search’s duration [29]. However, a long duration, as Hassan et al. mentioned [30], might be a sign of either exploring to discover interesting alternatives or struggling to find something useful. Studying how other implicit measurements change based on a search session’s total duration might provide better insight on both intent and on how user behavior changes through the course of a session.
Another factor that should be taken into account when it comes to engaging with a search engine is the user themselves. For instance, Alen et al. [31] argued that children (between 6 and 12 years old) desired more dynamic means of navigating search results and icon-based interaction options. According to White, people favored positive results over negative ones and sought confirmation of their beliefs, when searching online [32], implying a bias or an echo chamber effect. Web searches biases occur when searchers seek or are presented with information that deviates significantly from actual probabilities [32]. A well-known and extensively researched bias is the position or trust bias, which causes users to select more frequently higher-ranked results. Users believe that higher-ranked results are more pertinent because they have confidence in the search engine and retrieval function [33]. Another well known bias is the bias that is related to the reputation of a site or a domain. More popular or well-known websites are also more trusted and are, thus, more likely to be clicked if they appear on the results’ page of a search engine [34]. Mao et al. [20] also argued about another type of bias, the click necessity bias. In this bias, some results will have low clicks because they are self-explanatory, meaning that they provide the answer the users are searching for without requiring to be clicked to present it.
In the effort to identify and describe user behavior, various types of studies may be employed. According to Dumais et al., lab studies include participants in a controlled environment and may incorporate detailed instrumentation as well as great amounts of explicit feedback [35]. Field studies take place in the wild, but still include two-way communication and feedback [35]. Finally, log studies involve members of the general public in the most natural environment and despite not providing any explicit feedback may provide a large number of implicit signals [35]. Log studies are based on the analysis of data collected by a specific application in full production status and because they involve unmonitored or uncensored behavior, they provide valuable insights in behavior that the user would misremember or purposefully avoid during a lab or field study [35]. Implicit behavioral measures, as demonstrated by Fox et al. [36], may be used to analyze search user behavior and even provide good predictions of explicit judgments on user satisfaction. In a previous stage of this research, an extended lab study was carried out with a prototype version of the Art Boulevard platform [37]. That study combined limited quantitative metrics during a beta testing period with explicit qualitative feedback from semi-structured group interviews provided by the platform’s testers. In the present article, an analytics study based on the production instance of the Art Boulevard platform is presented. Actual usage analytics were collected by the platform itself over a six-month period, during which the general public had full access to it. Using this collected information, the present study attempts to answer the following research questions:
RQ1: What are the key values that describe the behavior of users searching online for art and culture and how do they compare to findings regarding general purpose search engines or other area-specific search engines?
RQ2: How are these key values that describe the behavior of users searching online for art and culture affected by the device used to perform the search session, the users’ choice to login and the session’s total duration?
This research’s innovation in terms of data collection comes from the fact that the study combines traditional query and result-related data, which were collected with server-side algorithms and are commonplace in search engine log analyses, with user interaction metrics such as scrolling, cursor distance, and clicks on interface elements, which were mined in real-time with client-side algorithms from the searchers’ browsers. This process created a very diverse and robust dataset of information, which, in combination with the fact that it came from members of the general public using the platform candidly in the wild, reinforced the objectiveness of the findings.
The innovative scientific contribution of this article is a result of the research’s focus on the thematic fields of art and culture and is presented thoroughly in the discussion section, through a multidimensional comparison between the behavior of art searchers and that of general purpose searchers, as well as the analysis of the factors that influence the process of art search. This study identified some interesting and significant differences between the process of searching for art and culture and general purpose searching, thus highlighting the different needs and habits that emerge during specialized search, which need to be met by institutions and individuals that act as content providers in these fields. The produced knowledge that outlined user behavior when searching for art- or cultural-heritage-related content online may help providers and repository developers design and implement better and more efficient platforms and ultimately enhance the findability and diffusion of said content and the satisfaction of their target audience.
2. Methodology
2.1. Research Design
The research that is the subject of this article was carried out in three distinct stages:
- The development of the platform;
- The collection of real usage data;
- The analysis of this information in order to provide valuable metrics.
The first stage, which involved the development of the Art Boulevard platform along with its data collection mechanism, was deemed necessary in order to collect multifaceted behavioral information specifically from the fields of art and cultural heritage. Winkler et al. [38] maintained that software prototyping is essential in investigating promising research directions. Going beyond prototyping and releasing a full production application allows for high external validity by taking the research “in the large” [39].
During the second stage of research, the Art Boulevard platform collected user behavioral information over a period of six months. According to Henze et al., mobile apps that record their users’ behavior may be used to investigate research questions while ensuring both numerous degrees of freedom and a diverse user base [39]. The data collected during the platform’s usage from the general public consisted not only of query and result related information, as would be typical in a log analysis [35,40], but also of implicit user behavioral measurements, which Fox et al. [36] claimed can provide good predictions of user satisfaction and other behavioral aspects. The study of query-related information to investigate user intent is a commonplace practice [41,42]. It is often combined by mining context from the results that users show preference for [42]. Caruccio et al. [43], in their study on user intent, demonstrated the added importance of interaction mining, in order to achieve a more detailed understanding of searcher intent. In this study, the collection of query- and result-related information, alongside data derived from interaction mining, achieved a robust dataset that was used to analyze art searcher behavior.
Finally, after the information was collected in the platform’s database, a rigorous data analysis process was carried out. Descriptive statistics were used as a tool to analyze search engine transaction logs in multiple occasions [35,40]. Jansen [40] discussed in detail how data that were collected needed to be prepared by converting the textual information of the log into clean structured data. Art Boulevard, since it was designed from the start with the intention to collect behavioral data, begins the preparation of data from the moment the user interacts with it. Moreover, useful interaction metrics such as screen scrolling, cursor movement distance, clicking of interface elements, etc., are also seamlessly stored in the platform’s database, providing valuable behavioral information [36,43]. Using these data as its basis, this study explores various staple search behavior related metrics such as query length, query repeatability, result ranking, session duration, device usage, and more.
2.2. Presenting the Art Boulevard Platform
The Art Boulevard platform is essentially a federated search engine. Its main functionality is accomplished by taking the user input in the form of a textual search query consisting of one or multiple keywords and providing it to seven different online repositories through their respective application programming interfaces (APIs). It then proceeds to collect the results from said repositories, integrate them, and present them in a unified manner to the end user.
The online repositories used as content sources for Art Boulevard are:
- Europeana Collections
An online aggregation of European Cultural Heritage objects from multiple content providers and include millions of digital representations of works.
- 2.
- Harvard Art Museums
The online presence of Harvard-supported museums, providing a variety of digital content derived from their physical collections.
- 3.
- The Metropolitan Museum of Art
One of the most popular art museums on the planet, providing datasets of information on more than 470,000 artworks from the museum’s collection.
- 4.
- The National Gallery of Denmark (SMK)
The biggest art museum of Denmark featuring more than 260,000 pieces of art, focusing mainly on traditional visual arts.
- 5.
- Artsy
An online art marketplace with over 4000 partners and millions of works of art from both established and emerging artists.
- 6.
- Crossref
A digital object identifier registration agency and scientific paper aggregator.
- 7.
- The Open Library
An open library catalogue containing a large number of published books and aiming to catalog every book in existence.
Figure 1 presents a visualization of the result aggregation process performed by the platform [37]. Art Boulevard uses an advanced caching algorithm to avoid putting unnecessary burden on the various repositories, while at the same time improving search performance.
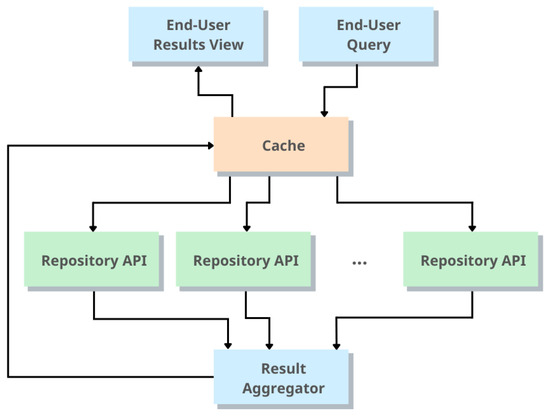
Figure 1.
Visualization of the result aggregation process [37].
In addition to the basic search functionality, Art Boulevard implements the following additional technologies:
- Speech Synthesis—Using the Speech Synthesis Web API, the platform offers all result titles and descriptions as audio. This greatly increases the accessibility of the platform while at the same time providing better usability for all its users.
- Speech Recognition—Using the Microsoft Azure’s Speech to Text service, the platform can interpret user speech input into a textual query and then use it to perform its basic search process.
- Content-Based Search—Using the Microsoft Azure Visual Search API, the platform can search the Web for visually similar images to any result and, thus, broaden the users’ search scope based on their initial search interest.
- User Profile System—A simple user system that allows users to bookmark results they are interested in, create a public profile, and follow other users. The system supports social sign up through Google, Facebook, and Apple, as well as an independent sign up process.
- Moreover, the platform offers advanced search functionality, provides various previous search queries and results on its front page and also offers the users a list of related results for every result they decide to view. Figure 2 presents a screenshot of the front page of the platform.
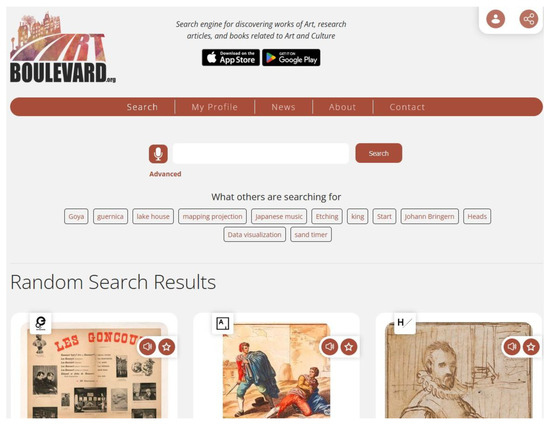 Figure 2. Screenshot of the front page of Art Boulevard.
The web version of the platform officially launched in 15 July 2022. Soon after, the Art Boulevard mobile app launched for Android on the Google Play storefront and for iOS on the Apple Store storefront. The choice to use PWA technologies to bring Art Boulevard to the mobile app space was made in order to ensure a uniform user experience in both the web and the mobile app, while at the same time taking advantage of the advantages that the technology offers. According to Magomadov, PWAs offer cost-effectiveness, better search engine optimization and independence from application storefronts [44]. Taking a step for further integration in the mobile ecosystem, using the tools provided by Microsoft’s PWABuilder community, the platform was translated to an application format applicable for mobile storefronts. Figure 3 presents a series of screenshots from the mobile app version of the Art Boulevard platform.
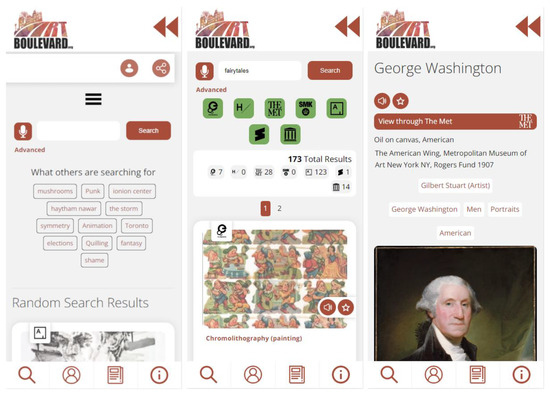
Figure 3.
Screenshots of the front page, a search result page, and an artwork view page from the Art Boulevard mobile app.
For the purpose of brevity, this article avoided a very detailed description of the platform’s operation. Such an analysis of its functionality, specifics about the additional technologies implemented, an overview of its data model used during the aggregation of the results, and a look at its UI/UX design are provided in the authors’ previously published research concerning the beta testing of the platform [37].
2.3. Behavioral Data Collection
The period of data collection lasted from 15 July 2022 to 15 January 2023. In order to achieve maximum diffusion of the Art Boulevard platform, a social media presence was established early on and a marketing campaign followed. Moreover, best practices were followed in terms of search engine optimization in order to increase organic visits through other search engines. In terms of structured data, the Open Graph and Twitter Cards metadata protocols were implemented, as well as the schema.org JSON-LD data model. This type of integration of semantic web elements not only helps with the platform’s SEO and ranking performance but can also play an important role, specifically in audiovisual and media content diffusion, as Dimoulas et al. established [45].
During its operation, the platform recorded in its relational database system information regarding the users’ queries and the results collected from the various APIs, as well as user interaction information. In order to achieve this, the platform used a combination of server-side and client-side data collection algorithms. The basic query data that would be equivalent to a search engine’s transaction log data were collected during the search process itself. Since Art Boulevard was designed from the start as both a federated search engine and a tool for collecting searcher behavior information, this was accomplished with minimum overhead to the performance of the platform. Moreover, the platform recorded information concerning the results that were presented to the users and especially those that users interacted with. This information consisted not only of the URL of the external source providing the result, as is commonplace in log studies [42], but also from rich metadata regarding the result, collected directly from each repository.
User interaction mining was achieved through the collaboration of the platform with the users’ browsers. Using JS alongside AJAX techniques, in a manner similar to Caruccio [43], the searchers’ browser collected session information including duration, page scrolling, cursor distance, and user clicks, and delivered it to the platform. For the purposes of this study, a session was defined as the series of interactions between the user and the platform regardless of duration, as long as there was no extended period of inactivity or there was no change in the users’ device or software agent (e.g., changing browsers). The inactivity timer was set at 24 min, which is the default duration of the global session variables in the PHP language.
Query-related data collected included:
- The terms of each query;
- The existence of any advanced query information;
- How many pages of results were requested;
- The total results the query returned;
- The results returned per repository;
- Cursor tokens for pagination purposes for the repository APIs that supported cursor based pagination;
- The dates that the query was first and last performed on.
Result-related data collected included the following details for each item:
- Repository of origin;
- Type (artwork/article/book);
- Ranking in the results as they were delivered by their repository;
- Title;
- Link to source repository;
- Description;
- Image;
- Metadata elements such as artist name, creation date, location, methods, techniques, subject, provenance, and more;
- The first and last date the result was discovered.
Session information included:
- Country of origin of the user;
- IP;
- HTTP User Agent header;
- Device which the user was using;
- Total duration of the session in seconds;
- Total distance the user mouse (or tap) moved in pixels;
- Total scrolling in pixels;
- Date/times on which the session started and ended;
- Login ID (if the user logged in the platform).
In order to retain information regarding the many-to-many relationships between queries, results, sessions, and user interactions, the necessary relational database structure was established. These relationships included which user performed each query, which results were produced by each query, which results were liked by each user, and so on.
As mentioned above, during a user’s interaction with the platform, a series of interaction events were recorded in the platform’s database. In order to achieve this, the platform made use of a specialized table using the entity–attribute–value (EAV) data model. This table was called the session timeline table (STT). For each event, the database stored information regarding its one-to-many relationship with a session (treated as the entity of the EAV model), the date and time the event was triggered, the URL that the event originated from, as well as the URL that it occurred in or produced if it was a click-through event, the type of event (treated as the attribute of the EAV model), and a value further clarifying the interaction (treated as the value of the EAV model). The events recorded with their type variable names are presented below in Table 1.

Table 1.
Session events recorded.
An important metric of user engagement in search engines are click-through events. These are events that trigger when the user clicks on a link that will provide them with further information and, according to Xue et al., they provide a valuable indication of the user’s intention and its relationship with the clicked link [46]. The events from the list above that were considered click-through events are those that implied that the user had found something that furthered their interest; for example, viewing a result page or clicking an external link.
2.4. Behavioral Data Processing
After the data collection period was concluded, various metrics were derived from the information stored in the database regarding queries, results, sessions, and session events. A series of algorithms were created that aggregated some measurements from the platform’s operational database tables, while at the same time mining some other measurements from the session timeline table. This information was stored in different tables in the platform’s database. Using different tables allowed the researchers to proceed with data analysis tasks without interfering with the platform’s normal operation, which went on and is still ongoing.
With regard to search queries, the algorithm collected the number of keywords each query string consisted of, how many times a unique query string was used, whether the query included any advanced search terms, how many queries initiated from a voice recognition process, how many queries initiated from a click to a result’s related term, how many total pages of results were presented to users by the platform, what was the maximum page number which a user navigated to, how many were the total items the query discovered in the various repositories, and how many results were provided by each repository.
With regard to results, the algorithm collected for each unique result listed by the platform the repository that provided it, the type of the result (artwork, article, or book), its ranking based on relevance as provided by the source repository, whether the result had a title, description, and image, the total length in characters of the textual metadata available for each result, the number of times a user navigated to the view page of each result, and the number of times a user opened the external source link of each result. A secondary process was developed to specifically collect this information for every time a user navigated to the view page for such a result. The data on unique results listed provided insight into the nature of the results the platform collected, while the data on each result viewed provided insight into which results piqued a user’s interest.
Finally, with regard to sessions, the algorithm collected whether the session was performed by a normal searcher or a bot, calculated the session’s total duration, the total mouse or tap distance covered during a session, the total page scroll, the number of total session events, the number of total click-through events for each session, whether a user was logged into the platform’s user system during each session, and how many events of each type of session event were documented for each session. An algorithm based on regular expressions was developed that identified bots based on the HTTP User-Agent, so their requests would not skew the behavioral findings. In addition to the above, the algorithm used the URLs recorded in the STT to identify how many results were navigated to by clicking a related result from a previous result’s view page, how many results were navigated to by clicking a random result from the homepage, and how many results were navigated to directly through use of their URL, which would mean that users arrived to the result view page via means outside the platform (social media share, organic search result from Google, etc.).
In addition to session event variables, three meta variables that included the sum of different types of events were calculated. The variable _visual_search included all visual search related events (type “Visual Search” in Table 1), the variable _voice included all events related to speech recognition or speech synthesis technologies (type “Voice” in Table 1), and the variable _user_system included all events related to the platform’s user system (type “User system” in Table 1).
Table 2 presents the series of additional metrics that were derived during the initial stage of the data analysis phase based on the collected data. The later stages of data analysis which involve calculation of statistic measurements and formulation of graphs and diagrams will be presented in detail in the results section.
Table 2.
Metrics derived from the collected data.
3. Results
As described in the methodology section, a series of measurements were recorded concerning the search queries performed by users on the Art Boulevard platform, the results listed by the platform and viewed by users and general interaction data collected from the platform’s search sessions. This information was collected over a period of six months (15 July 2022 and up to 15 January 2023) and corresponded to 10,490 platform visits performed by human users from 97 different countries, belonging in the general public. In this section, these measurements are presented in detail.
3.1. Query Related Measurements
The query related data consisted of a total of 2065 queries. These queries contained 731 unique query strings. A total of 2278 result pages were generated by the platform and viewed by the users. Based on information derived from the session timeline table (STT), the recorded queries displayed above average repeatability, while special functionalities such as advanced or voice search were not popular. At the same time, queries that were initiated from a related term were significant, reaching 9.15% of total searches. Table 3 presents information regarding the queries’ terms. The average number of terms per query was 1.68. The largest search query was 26 keywords long and was triggered by a user clicking on a very long result-related term. The largest hand typed query was 10 keywords long. The vast majority of queries contained few terms as was expected.
Table 3.
Keyword related measurements.
In terms of query uniqueness, 64.6% of performed queries were found to be query repetitions. Table 4 presents a series of measurements pertaining to the various unique query strings that were used. These measurements include the number of times each unique query string was used to perform a search, the number of total result pages that were served to the various users using this search query, the number of the maximum result page that a user navigated to, and the total results that the platform’s repositories provided as results to this specific query string.
Table 4.
Measurements pertaining to unique query strings.
Figure 4 presents a chart depicting the distribution of unique query strings by the maximum result page viewed by a user. For 86.73% of the unique query strings, only the first result page was viewed. For 10.53%, the maximum result page viewed was the second page, and for 1.64%, the third page. Overall, for 13.27% of the unique query strings, the users requested more result pages besides the first page. This paints a clear picture of users focusing more on the first page of results. This is common in search engine usage and is discussed in detail in the discussion section below.
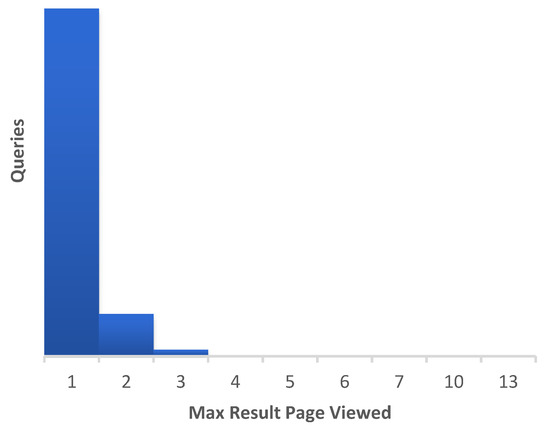
Figure 4.
Distribution of unique query strings by maximum result page viewed.
Figure 5 presents a chart depicting the distribution of unique query strings by total result pages viewed by all users. For 34.88% of the unique query strings, only a single page of results was viewed by any user, for 24.49%, two total pages of results were viewed, and for 13.54%, three. As seen in Figure 5, these numbers kept diminishing in a logarithmic manner.
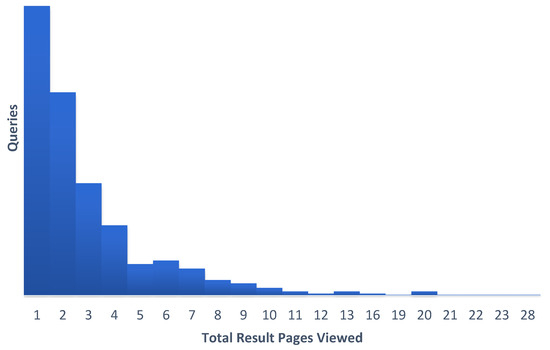
Figure 5.
Distribution of unique query strings by total result pages viewed by users.
3.2. Result-Related Measurements
The measurements collected and derived by the platform regarding results fell into two categories:
- Unique results provided by the repositories and listed by the platform to users;
- Results clicked by a user in order to navigate to the result’s view page.
3.2.1. Unique Results Listed
The platform acquired from the various repositories and listed to users on their requested a total of 64,136 unique results during its six-month operation period. Table 5 presents the total number of unique results listed, how many of these results were artwork, books, or research articles; how many of them had titles, digital representations of the result item, and textual descriptions of what that item was. The vast majority of items had at least some textual annotation in the form of a title, while most were also accompanied by a description and a digital representation. This is a good indicator of result quality in terms of metadata. Most results were artworks since most repositories used by the platform focused on artworks themselves. Research articles were also a significant part, with books trailing slightly behind.
Table 5.
Measurements pertaining to unique results listed.
Table 6 presents statistics regarding the ranking of each unique result listed, according to the order in which they were provided by their source repository during the search query, the total characters of textual content that the source repository provided for this specific result, the total times it was viewed by a user, and the total times which its original source was clicked by a user. The median and average values of the _ranking variable reinforced the notion that searchers focused on the first page(s) of results, while item views created a clear picture of how few of the listed results actually generated click-through events.
Table 6.
Measurements pertaining to unique results listed by the platform.
3.2.2. Results Viewed by Users
From a total of 64,136 results listed, 2484 were clicked by users for the purpose of navigating to the result’s view page (3.87%). This number includes both results that might have been clicked by more than one user and also results clicked more than once by a single user. Table 7 presents the equivalent measurements as Table 6 but, this time, only for the results that were actually clicked by users.
Table 7.
Measurements pertaining to results clicked.
Comparing the values of Table 6 and Table 7, an increase in textual metadata was noted. This underlined the importance of metadata, as discussed in the discussion section below. At the same time, article and book results were fewer, implying a greater searcher interest in artworks.
Table 8 presents statistics regarding the ranking of each result clicked by a user according to the order in which they were provided by their source repository during the search query, the total characters of textual content that the source repository provided for this specific result, and how many times the original source was accessed by a user while viewing the result. Ranking median and average were lower than their equivalents for listed results. This is an indication of greater searcher interest for higher ranked results.
Table 8.
Measurements pertaining to results clicked by the users.
Figure 6 presents the distribution of clicks for the various different ranking values of all results viewed by a user. A total 11.27% of clicked results had a ranking of one, 9.38% had a ranking of two, and 7.48% had a ranking of three. From ranking 8 to 20, the distribution of clicks plateaued between 2.5% and 4%, and then diminished. As is discussed in detail below, despite the clear searcher preference for high ranking results, user attention was retained for results that were ranked as low as 19 or 20. This was higher than what is usually observed in general purpose search engines.
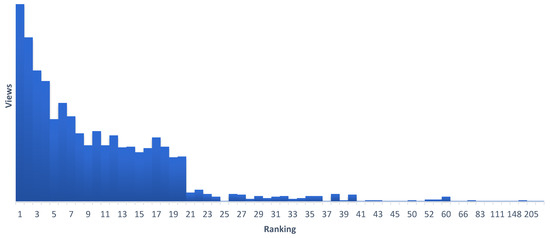
Figure 6.
Distribution of results clicked by users by their ranking.
3.3. Session Related Measurements
During the six-month operating period of the Art Boulevard platform, which was the focus of this study, and after weeding out bot activity, a total of 10,490 user sessions were identified originating from 97 different countries. Sessions where the user only landed on a page and did not engage in any further interaction (page scrolling, navigating to a different page, any click event, or even clicking on empty space) were considered bounces. From all recorded sessions, 52.73% were bounces, while 47.27% displayed at least some user engagement. From these substantial sessions, 14.12% contained at least one performed query, out of which 40.98% contained only one query. The session-related measurements focused on these substantial sessions, which involved even minimal engagement.
For every substantial session, a series of statistics including the average was calculated for each of the important session variables. Additionally, the percentage of sessions that had a non-zero value for each variable was calculated. The same statistics were also calculated for sessions, including at least one search query. These statistics are presented in Table 9 and are investigated in the discussion section.
Table 9.
Measurements pertaining to all substantial sessions.
As mentioned above, an important factor that affected user behavior was the device being used. During our data collection period, 70.16% of the substantial sessions were performed using a desktop or laptop computer, while 29.84% were performed using a mobile device (smartphone or tablet). Out of these, 46.4% were performed by visiting the platform’s website on a mobile device, while 53.6% were performed through the Art Boulevard PWA application, available through the Google and Apple storefronts. In terms of sessions involving at least one search query, 54.54% were performed from a desktop device, while 45.45% from a mobile device. A preference for desktop devices became apparent, while, at the same time, the mobile app and the mobile web versions were used almost equally. This preference for desktop devices was thoroughly investigated in the discussion section below. Figure 7 presents two pie charts depicting the distribution of substantial sessions by device and mobile platform.
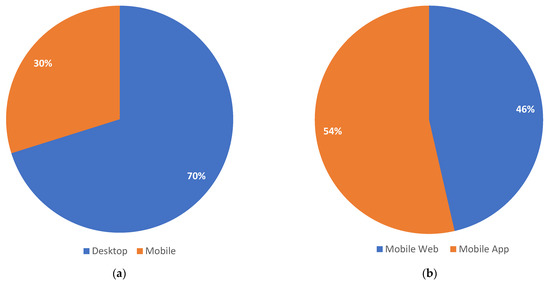
Figure 7.
Pie chart of device usage distribution (a) and mobile platform usage distribution (b) for substantial sessions.
In order to investigate the effect of the users’ device on measurements, the calculations of Table 9 were repeated separately for sessions performed from desktop devices and for sessions performed from mobile devices, including the use of the PWA app. These measurements are presented in Table 10 and investigated in the discussion section.
Table 10.
Measurements pertaining to all desktop and mobile substantial sessions.
During the sixth-month period of operation, 17.97% of sessions recorded by the platform involved a user login, while in the other 82.03%, the user remained anonymous. From the anonymous sessions, 78.74% were performed from a desktop or laptop computer, while 21.26% used a smartphone or tablet. From the sessions that involved a login, 30.98% was performed from a desktop or laptop, while 69.02% was performed from a smartphone or tablet. In terms of sessions involving at least one search query, 31.05% involved a user login, while 68.96% did not. Most users preferred to remain anonymous during their search sessions, despite missing out on personalization and user functionality. This situation was reversed specifically on mobile devices. Figure 8 presents three pie charts depicting the distribution of logged and anonymous sessions and the distributions of devices for logged and for anonymous sessions.
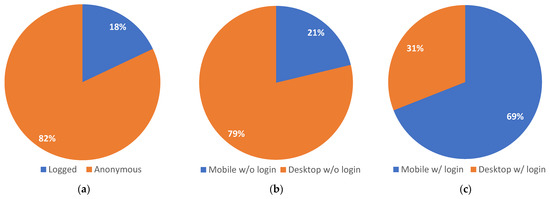
Figure 8.
Pie chart of logged or anonymous session distribution (a), device usage distribution during anonymous sessions (b), and device usage during logged sessions (c).
In order to investigate the effect of anonymity on measurements, the calculations of Table 9 were repeated separately for sessions that involved a login and for sessions that did not. These measurements are presented in Table 11 and investigated in the discussion section.
Table 11.
Measurements pertaining to substantial sessions involving or not involving a user login.
During the sixth-month period of operation, 15.35% of sessions recorded by the platform lasted over the average session duration of 115.35 s, 72.47% lasted less than the average session duration, while the other 12.18% did not record any duration and appeared to have been instantaneous. From the short sessions, 68.03% were performed from a desktop or laptop computer, while 31.97% used a smartphone or tablet. From the sessions which lasted longer than the average session duration, 60.71% were performed from a desktop or laptop, while 39.29% were performed from a smartphone or tablet. In terms of sessions involving at least one search query, 60.7% were long sessions, while 39.3% were short ones. Figure 9 presents three pie charts depicting the distribution of short and long sessions and the distributions of devices for short and long sessions.
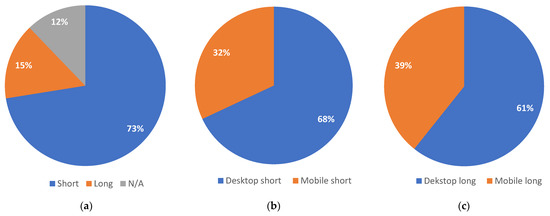
Figure 9.
Pie chart of short or long session distribution (a), device usage distribution during short sessions (b), and device usage during long sessions (c).
In order to obtain some information relating to the rate of activity on shorter and longer sessions, two new variables were defined: the page scroll in pixels per second and the total number of events per second. Through the first variable, we can monitor the exploratory activity of a user such as scrolling down lists of results, browsing for something of interest. Through the second variable, we can monitor the active engagement of a user such as clicking on a result or performing a new query. Measurements regarding these variables’ maximum value as well as average are presented in Table 12. Shorter sessions displayed a lower _scroll/_duration ratio average but a higher _total_event/_duration. This indicates a shift in behavior depending on duration, which is investigated in the discussion section below.
Table 12.
Rate measurements pertaining to substantial sessions of short or long duration.
4. Discussion
4.1. Findings Summary
In the introduction section, the two research questions of this study were presented. In this paragraph, the findings regarding each research question are outlined. These findings are discussed in detail in the following subsections.
RQ1: What are the key values that describe the behavior of users searching online for Art and Culture and how do they compare to findings regarding general purpose search engines or other area-specific search engines?
Based on the data presented in the results section and comparing it to findings from the literature, it was observed that actual people searching online in the wild for art- or culture-related content:
- Use queries with fewer terms than observed in general search;
- Display higher query repetition than observed in general search, but were similarly observed in other fields of specialized search;
- Focus on the first few pages of results as similarly observed in general search;
- Show interest in a wider ranking of results than observed in general search;
- Show similar interest in results with visually and textually rich content as users in other fields;
- Display an average session duration that is closer to general Web session duration, than observed in lab studies;
- Take advantage of SEO findability to discover repository content through general search;
- Show higher preference for desktop and laptop device use, than observed in general search.
The above findings, as discussed below, paint the picture of an average art searcher who prefers searching for single word concepts and artist names and avoids natural language queries, is interested in reviewing past results and retrying their old searches, shows preference for the highest ranked search results, but still ventures much deeper into lower ranked results than general purpose searchers, prefers results that are attractive at first glance through thumbnails and textual content, and understands the search process as an involved task that is not well suited to tackle “on the run” through mobile devices.
RQ2: How are these key values that describe the behavior of users searching online for Art and Culture affected by the device used to perform the search session, the users’ choice to login and the session’s total duration?
Based on the data presented in the results section and as detailed below, it was observed that actual people searching online in the wild for art- or culture-related content:
- Show higher engagement metrics when using mobile devices;
- Have more success in finding interesting results when using desktop devices;
- Prefer anonymity and avoid logging in when using desktop devices but prefer to log in when using mobile devices;
- When logged in, display more interest in secondary functionality features and much higher engagement metrics;
- Show indications of an exploratory behavior during longer sessions and a transactional behavior during shorter sessions;
The above findings, as discussed below, create the impression of two distinct approaches to art search, one which displays long engagement and often includes a social login, the usage of advanced features and an exploratory behavior, and another which is shorter, involves short-time browsing and limited basic search functionality and implies a transactional user intent.
4.2. RQ1: What Are the Key Values That Describe the Behavior of Users Searching Online for Art and Culture and How Do They Compare to Findings Regarding General Purpose Search Engines or Other Area-Specific Search Engines?
4.2.1. Query Length
Based on the query related statistics collected by the Art Boulevard platform, the queries performed had an average query length of 1.68 keywords, as is presented in Table 3. Jansen and Spink [47], during their study of search engine transaction logs, mentioned query length in English ranging from 2.2 to 2.43 keywords based on previous work in the field. Taghavani et al. [48], in their analysis of web proxy logs, discussed a query length ranging from 2.35 to 2.9, while their own findings were as high as 3.08 keywords on average. On the other hand, in a more recent query log study in 2017 by Kacprzak et al. [49], the query length in data portals was found to be 2.08 keywords on average. All of the above findings indicate a longer query length in general purpose searches than observed in this study. Specifically in the field of art and culture, Ceccarelli et al. [50] discovered an average query length of 1.86 terms through studying Europeana query logs. Taking into consideration our finding of 1.68, Europeana’s 1.86 average [50], and an average of 1.76 detected during the testing period of Art Boulevard [37], there is a strong indication that when searching for art- and cultural-heritage-related content, users use fewer search terms. One of the reasons for this difference between general purpose search and art search seems to be the lack of natural language queries (queries in the form of questions as one would use in normal speech), which are a popular way to use general purpose search engines. Additionally, in Art Boulevard, people showed a clear preference for single-term or two-term queries. Single-term queries were dominated by general concepts and themes and artist names where only the last name was used, while two term queries were dominated mainly by artist names, with concepts and themes becoming less prevalent. All of the above query subjects are best conveyed through fewer terms and this seems to have played a major role in the shorter average query discovered.
4.2.2. Query Repetition
Another interesting query-related finding in our analysis had to do with query repetition. According to Table 4, the average query was repeated 2.82 times and 64.6% of all queries were repetitions. Smythe et al., in their study regarding query repetition in an adaptive community-based web search engine [51], discovered that in general purpose searches, only 15.1% of queries were exact duplicates of other queries. On the other hand, in the same study, during image search, that percentage rose to 60.6%, while during specialized search in the Nutrition domain and during a fact-finding search task, 58.9% and 54.7% of repeated searches were discovered. Smythe et al. argued, based on these numbers, that in specialized search, duplicate queries are prevalent and their findings are supported by the findings of our study concerning searches specialized in the field of art and culture. People will often return to the same queries in order to take a second glance at a result they were interested in or to try to expand their initial findings. It is common practice among artists (and specialists in general) to focus extensively on singular themes, when working on a specific artwork or researching a specific field as opposed to the opportunistic nature that general purpose searches often display. Additionally, the singular thematic approach somewhat limits the nature of potential queries to an extent which increases repeatability.
4.2.3. Result Pages
In terms of result pages, our findings indicated that for 86.73% of unique queries, only the first result page was viewed, while only for 13.27%, a second or later page was requested by the user, as seen in Figure 4. This result is similar to what was observed during the platform’s closed beta testing [37], which indicates that the general public’s behavior corresponded with our test group in this specific regard. Moreover, this finding corresponded with similar findings in a general purpose log analysis by Silverstein et al. [52], in which for only 15% of the queries, the second results’ screen was viewed. This behavior was noticed consistently in general purpose search engines with search traffic originating from the first page ranging from 71% to 92% in recent years, according to Shelton [53], and is attributed to an extent to the “position or trust bias”, which involves the searchers trusting the search engine’s conclusions about result relevancy, as detailed by Joachims et al. [33]. In this regard, both general purpose and art and culture searchers showed high “trust bias” and focused their attention mainly on the first page of the results. It should be noted that as mentioned in the methodology section, in the Art Boulevard platform, each results’ page may contain up to 70 results, which would also mean that even for the 86.73% of queries, where only the first page of results was shown to the users, this page contained more results than the 10 to 20 results usually displayed by general purpose search engines.
4.2.4. Result Rankings
Further investigating this behavior through the statistics collected by the Art Boulevard platform, in regard to results listed and viewed by the user, in order to obtain a clearer picture, we looked at the ranking of these results based on the relevance order in which they were provided by their source repositories. For listed results, the average ranking was 13.75, while the median was 11, as seen in Table 6. For user-clicked results, these numbers dropped to 10.4 and 7, respectively, indicating that, despite their strong preference for top listed results, art searchers showed interest for a wider range of results than what is the norm in general purpose search engines [53,54]. As seen in Figure 6, results ranked at 1 generated 11.27% of the clicks, while results ranked from 1 to 5 in aggregate generated 39.73% of total results clicked. These numbers, although still strongly indicating a preference towards top results, create a clear distinction from general purpose search engines, where these very few first results are even more important. Beus indicated that the first result of Google generated 28.5% of clicks [54], while Shelton stated that the first five results generated 67.6% of clicks [53]. In order to reach the equivalent percentage, results ranked between 1 and 12 should be aggregated in the Art Boulevard platform—over double the number of ranking spots. Moreover, taking a closer look at Figure 6, it becomes apparent that the rate of diminishing engagement plateaus until we reach results ranked 20, thus creating a secondary area where art searchers discovered results that interested them. Results ranked between 17 and 20 generated as many clicks as the first result, while results ranked between 5 and 20 generated a significant 52.7% of total clicks. All of the above are indicators that, even though art searchers still focused mainly on top results, they showed interest in a much wider range of ranking positions than general purpose searchers do.
4.2.5. Result Content
Taking a closer look at the differences between listed results and viewed results as they appear in Table 5 and Table 7, respectively, a noticeable increase was discovered in the percentage of viewed results that were artworks (74.32% to 85.06%) and that included an image of the item (67.09% to 83.78%). Both of these increases indicate a user preference for these results over others. Most artworks would contain a unique thumbnail while articles, on the other hand, rarely did. Images helping with engagement were not just suggested by conventional wisdom: Li and Xie, in their research concerning user engagement with social media, measured that the presence of a directly viewable picture increased engagement with posts [55]. This behavior was not reserved for social media only: Davis et al. maintained that the use of digital media such as images, info-graphics, etc., also improved website engagement [56], while Bufquin et al., in their research involving photographs in websites of hotels, discovered an increase in user enjoyment related to visual content [57]. The increase in engagement with results containing images in our platform further supports this notion. In fields such as art and culture, where visualization is extremely important, this behavior is something that is to be expected, but the clear image painted by the measurements provided a solid confirmation.
A similar increase was also discovered for result items containing a textual description (from 56.41% to 63.49%). This, in combination with the fact that listed results’ textual content was on average 349.4 characters, while viewed results’ textual content was 476.9 characters (a 26.73% increase in content) indicates a preference for results that also provide more information. Panchal et al. maintained in their digital marketing article that product descriptions helped convert visitors into customers [58]. On the other hand, in the Bufquin et al. hotel website analysis, it was indicated that long textual descriptions may increase stress and, thus, reduce enjoyment [59]. In the Art Boulevard platform, the existence of a description did seem to increase the chances of engagement with the result, but it should be noted that in the result’s list page, the length of this description was intentionally limited to 180 characters.
4.2.6. Session Duration
Based on the session statistics presented in the results section, the average session duration for substantial sessions was 115.35 s, as shown in Table 9. This translates to almost two minutes. Specifically, for substantial sessions involving at least one performed query, this session duration was increased to 397.22 s, approximately 6.6 min. This number was much lower than the session duration for sessions involving at least one query measured during the platform’s testing which was 19.6 min long [37]. Bafriah et al. performed a lab study regarding user experience in a digital library and also measured a session duration close to 20 min [59]. On the other hand, Jansen et al. [60], during a quantitative analysis involving analytics from two different analytic service provider and 86 different websites, discovered average session durations of 202.91 s from Similar Web and 463.51 s from Google Analytics, which were much closer to the values measured in this study. This is a good indicator on how selected user groups might present very different results than the general population and why analysis in the wild may provide different insights compared to lab analysis. White and Morris [61] indicated that advanced user sessions tended to be longer, which would seem relevant in this case, since in the beta testing of the platform, the testers were people with experience in the fields of art and culture, while during this data collection period, the general public was involved.
4.2.7. SEO Findability
Taking a closer look at the differences in measurements between all substantial sessions and only sessions which involved at least one search query, as they appear in Table 9, an increase in engagement can be seen not only in the duration metric but across almost all statistics. This is an indication that users who performed their own queries were more likely to be involved in all aspects of the platform’s functionality. The only metric which presented a decrease was the direct result views, which indicate result view pages navigated to directly from outside the platform. In fact, only 5.5% of sessions involving a direct result view also contained a query. This indicates that a number of substantial sessions were a result of the platform’s content appearing in general purpose search engines or social media and traffic originating from these sources rarely proceeded to continue the use of the platform at that time. While this might be detrimental to the Art Boulevard’s platform engagement metrics and, at first glance, might seem as a negative outcome, it is in fact not so. These 10% of sessions that included direct result viewing were a result of increased content findability through search engine optimization. As Onifao and Rasmussen noticed in their study concerning content findability in digital libraries, the number of indexed webpages and the reputation of the website may lead to increased ranking on SERPs [62] and, thus, drive interested parties to the content, without them having to search for it explicitly through repository’s system. For art- and culture-related content providers, understanding the fact that some searchers showed strong preference for general purpose search engines, for both their general and their specialized search needs and aiming for content findability through SEO, is an important part of understanding user search behavior.
4.2.8. Device Preference
Three out of ten sessions that took place during the data collection period of the Art Boulevard platform were performed using a mobile device, while the remaining 70% were performed using a desktop or laptop device. This observation is in contrast with what appeared to be the case in general purpose search engines. For example, in Google search, 64% of searches were performed on the mobile phone [63], while 35% were performed on desktop devices. This was also the case during the beta testing period of the platform, with only 13.12% of sessions being on mobile [37]. Baeza-Yates et al. [64], in their analysis of mobile search queries, also discovered that in the thematic category of arts and literature, desktop searches were much more prevalent compared to mobile searches than in any other thematic category. From all of the above, a pattern begins to emerge concerning the use of mobile devices in this field. It is also worth noting that in previous research leading up to the development of the Art Boulevard platform, interviewees from the fields of arts and culture showed a clear preference for the use of desktop or laptop computers for their art search purposes [65]. Art searchers both explicitly stated [65] and were observed through this research and others [64] to have a clear preference to desktop and laptop devices over smartphones and tablets. Moreover, as observed by Harvey and Pointon [21], mobile search leads to fragmented searcher attention, which creates a perception of the search process being more difficult. The nature of art search as a deliberate and focused activity makes the office or home office environment, which involves desktop and laptop devices, more suitable for its purposes, and comes in contrast with the on-the-go or casual nature of smartphone and tablet usage which is often accompanied by various distractions.
With regard to the query-related measurements, Song et al. [18] in their general purpose search engine log analysis detected, on average, fewer search terms in desktop than mobile (2.73 vs. 3.05). The high usage of desktop devices, when searching for art and culture online, might also contribute to the lower average terms per query that was discovered in the field by this study and others [50], alongside other factors mentioned in the first paragraph of this section.
4.3. RQ2: How Are These Key Values That Describe the Behavior of Users Searching Online for Art and Culture Affected by the Device Used to Perform the Search Session, the Users’ Choice to Login and the Session’s Total Duration?
4.3.1. The Effect of Device Choice
Comparing the usage of desktop or mobile devices, as detailed in Table 10, some interesting differentiations appear, which shed further light to the users preference for desktop devices. Mobile user sessions lasted a bit longer and had a higher average of total events. They also presented higher engagement metrics in the usage of secondary features such as visual search, voice recognition/synthesis, user system functionality, and user logins. Despite that, two metrics, in which desktop user sessions did better, were on the percentage of sessions with at least one result viewed and the percentage of sessions with at least one result source clicked. The increased ratio of result sources viewed and the increased percentage of at least one result viewed are an indication that more desktop search sessions end with an actual result than mobile ones, which is an important factor for search user satisfaction. Li et al.’s study on good abandonment (search sessions abandoned after finding a result) in mobile search indicates that although mobile searches present higher good abandonment percentages in most cases, in some thematic categories, this is reversed, and states that “perhaps mobile searchers give up more quickly on searching categories for which they previously had an unsuccessful experience” [66]. If art search on mobile has fewer cases of success, as implied by the lower percentage of sessions that had at least one result view in our measurements, this might be negatively impacting the searchers’ preference towards mobile devices, thus enhancing the difference between desktop and mobile usage that is presented in Figure 7. Based on the above, it can be stated that art searchers, as opposed to general purpose searchers, show a distinct preference towards desktop and laptop devices because mobile searches in this field tend to provide fewer end results. The nature of mobile devices and their smaller screens makes it more time-consuming for searchers to access the larger number of top results that, as seen in Figure 9 and discussed above, are important in art- and culture-specific search.
4.3.2. The Effect of Anonymity and User Login
A total of 18% of the sessions that occurred during the data collection period of this study included a user logging in to the Art Boulevard platform, as seen in Figure 8. During anonymous sessions, 79% of the users used a desktop device, while 21% of them used a mobile device. In contrast, for sessions involving a user login, 31% was performed using a desktop device, while 69% of them were performed on mobile. These findings displayed a much higher percentage of mobile users logging into the user system compared to desktop users. This corresponds with our findings in the previous paragraph, which indicated that mobile users were engaged with the platform’s functionalities including the usage of the social login and user system. As noted by Gafni and Nassim [67], the social login mechanism mitigates concerns by helping avoid “password fatigue”, increasing the ease of use of login systems. This is especially true on mobile devices where logging in is a very popular feature with as many as 85% of applications with over 1 billion downloads featuring a login mechanism, according to Micallef et al. [68].
In Table 11, a series of statistics and measurements were presented regarding the sessions that involved a user login and those that did not. All metrics which revolve around user activity and engagement were much higher in the case of sessions involving a login. The only metric that was higher in anonymous sessions was the direct result view. As noted above, this metric captured external traffic driven directly into content results. This activity has a circumstantial nature that does not correspond with the very deliberate activity of logging into the platform. As expected from the nature of social media [24], using the login functionality is a strong indication of engagement with the platform, which explains the increased engagement metrics in all other aspects of Art Boulevard’s functionality. The fact that average session duration during sessions with a login was 345.05 s, while it was only 63.07s for anonymous sessions (a 447% increase in duration), is a solid indication of how stronger the engagement of logged in users is.
4.3.3. The Effect of Session Duration
Figure 9 provides a glimpse into the nature of the various sessions based on their duration. A total of 73% of sessions displayed a duration below the average substantial session duration, while 12% of sessions did not record any duration at all, which, in this study’s case, translates to consisting only of a single HTTP request. The distribution among desktop and mobile devices presented in Figure 9 indicates a small preference for longer sessions on mobile devices, which might be the result of better engagement metrics, as they were analyzed in Section 4.3.1 of this chapter.
As we can see by the two ratios presented in Table 12, on one hand, shorter sessions displayed a higher ratio of events per second while, on the other hand, longer sessions presented a higher ratio of distance scrolled in pixels per second. The high scrolling ratio of longer sessions points towards an exploring behavior by the user, which involves going through lists of results trying to identify something of value to them, which is similar to what would be expected during any informational query. In contrast, the high event ratio for shorter sessions points towards a behavior more consistent with the notion of navigational or transactional queries.
5. Conclusions
In this article, a quantitative analysis of various metrics concerning the behavior of users searching for art- and cultural-heritage-related content was presented. The various measurements were collected during a six-month period of real world usage of the Art Boulevard platform, which implements federated search engine functionality using several repositories of artworks, research articles, and books. The metrics were recorded by an analytics system fully integrated with the platform, and the results presented were a product of data analysis on this information and corresponded to the actions of general public users.
The findings presented in detail in the discussion section converge to create a draft profile of an average art searcher who prefers searching for concepts and people while avoiding long queries, is keen on revisiting old searches and reviewing results, is not satisfied with just the first few results but delves a bit further, is attracted to visually and textually rich content and wants to avoid the attention issues that often accompany mobile search. The same findings also create an impression of duality in the search process itself, which, on the one hand, may be very involved, making use of social features and advanced functions and displaying an informational user intent and, on the other hand, may be short and purposeful, avoiding distractions and displaying a more transactional user intent.
The study produced some interesting findings but was limited in two factors:
- Although the newly launched platform did display a satisfactory amount of traffic, its collected data still dwarfed in comparison to the millions of queries analyzed in major general purpose search engines;
- The nature of the platform itself might have had an effect in some of these measurements, that skewed the influence of the thematic nature of the searches for art- and culture-related content, which was the focus of this study.
Work in this field may continue through the collection of a greater data sample and through the analysis of other metrics concerning the behavior of users, such as query reformulation and edit distance, session abandonment, query content analysis, and more. Additionally, the use of machine learning can be used to perform clustering based on the datasets collected by the platform, which would allow conclusions to be drawn regarding the varying nature of search sessions. Since the session timeline is very thoroughly recorded in the platform’s database, a method of visualizing such a session could lead to interesting results and would allow human expert observers to notice behavioral patterns in these sessions which would be hard to notice on a spreadsheet of numbers. Finally, using the research design and methodology of this study, alongside similar tools, this type of analysis could be applied to other fields of content, such as news, sports, entertainment, etc., in order to identify variations of user behavior based on the search’s topic.
Behavioral analysis was a very important aspect of research surrounding search engines. Unfortunately, more often than not, most studies focused solely on general purpose search engines or on e-commerce and marketing-related specialized platforms. This created a discrepancy between the quality of the experience offered by the commercial part of the Web and the non-commercial part. Through this research and its findings, it became apparent that art searchers, in particular, display differences in behavior, as opposed to general purpose searchers in a variety of ways. By highlighting and documenting these differences, a better understanding of their needs can be achieved. Content providers can then use this understanding to provide better services both in terms of the search process itself and in terms of how results are presented. This can lead to a better overall search experience, specifically suited to the characteristics of the fields of art and culture, which would be beneficial for both providers and searchers. The Art Boulevard platform and the ongoing research deriving from its usage are aiming to provide such useful insight on the behavior and needs of searchers, specifically in the fields of art and cultural heritage and, thus, allow for a more optimal art search experience moving forward.
Author Contributions
Conceptualization, M.P. and A.G.; methodology, M.P., N.G.K. and A.G.; software, M.P.; validation, M.P. and I.V.; formal analysis, M.P. and I.V.; investigation, M.P., I.V. and A.G.; resources, I.V. and A.G.; data curation, M.P. and I.V.; writing—original draft preparation, M.P.; writing—review and editing, M.P., I.V., N.G.K. and A.G.; visualization, M.P.; supervision, I.V., N.G.K. and A.G.; project administration, M.P. and A.G. All authors have read and agreed to the published version of the manuscript.
Funding
This research received no external funding.
Institutional Review Board Statement
Not applicable.
Informed Consent Statement
Not applicable.
Data Availability Statement
The data presented in this study are openly available in Zenodo at [https://doi.org/10.5281/zenodo.7646933] (accessed on 16 February 2023), reference number [10.5281/zenodo.7646933].
Conflicts of Interest
The authors declare no conflict of interest.
References
- Buttcher, S.; Clarke, C.L.; Cormack, G.V. Information Retrieval: Implementing and Evaluating Search Engines; MIT Press: Cambridge, MA, USA, 2016. [Google Scholar]
- Battelle, J. The Search: How Google and Its Rivals Rewrote the Rules of Business and Transformed Our Culture; Hachette UK: London, UK, 2011. [Google Scholar]
- Halavais, A. Search Engine Society; John Wiley & Sons: Hoboken, NJ, USA, 2017. [Google Scholar]
- Seymour, T.; Frantsvog, D.; Kumar, S. History of Search Engines. IJMIS 2011, 15, 47–58. [Google Scholar] [CrossRef]
- O’Brien, M.; Keane, M.T. Modeling user behavior using a search-engine. In Proceedings of the 12th International Conference on Intelligent User Interfaces, Honolulu, HI, USA, 28–31 January 2007; pp. 357–360. [Google Scholar]
- Brin, S.; Page, L. The anatomy of a large-scale hypertextual web search engine. Comput. Netw. ISDN Syst. 1998, 30, 107–117. [Google Scholar] [CrossRef]
- Agichtein, E.; Brill, E.; Dumais, S. Improving web search ranking by incorporating user behavior information. In Proceedings of the 29th Annual International ACM SIGIR Conference on Research and Development in Information Retrieval, Seattle, WA, USA, 6–11 August 2006; pp. 19–26. [Google Scholar]
- Mishne, G.; De Rijke, M. A study of blog search. In Proceedings of the European Conference on Information Retrieval, London, UK, 10–12 April 2006; Springer: Berlin/Heidelberg, Germany, 2006; pp. 289–301. [Google Scholar]
- Kelly, D.; Cool, C. The effects of topic familiarity on information search behavior. In Proceedings of the 2nd ACM/IEEE-CS joint conference on Digital libraries, Portland, OR, USA, 14–18 July 2002; pp. 74–75. [Google Scholar]
- Connaway, L.S.; Dickey, T.J.; Radford, M.L. If it is too inconvenient I’m not going after it:” Convenience as a critical factor in information-seeking behaviors. Libr. Inf. Sci. Res. 2011, 33, 179–190. [Google Scholar] [CrossRef]
- Bearman, D.; Trant, J.; Partners, A. Issues in structuring knowledge and services for universal access to online science and culture. In Proceedings of the Nobel Symposium “Virtual Museums and Public Understanding of Science and Culture, Stockholm, Sweden, 26–29 May 2002; pp. 26–29. [Google Scholar]
- Petras, V.; Hill, T.; Stiller, J.; Gäde, M. Europeana—A search engine for digitised cultural heritage material. Datenbank-Spektrum 2017, 17, 41–46. [Google Scholar] [CrossRef]
- Purificato, E.; Rinaldi, A.M. Multimedia and geographic data integration for cultural heritage information retrieval. Multimed. Tools Appl. 2018, 77, 27447–27469. [Google Scholar] [CrossRef]
- Datta, R.; Joshi, D.; Li, J.; Wang, J.Z. Image retrieval: Ideas, influences, and trends of the new age. ACM Comput. Surv. 2008, 40, 5. [Google Scholar] [CrossRef]
- Siegfried, S.; Bates, M.J.; Wilde, D.N. A profile of end-user searching behavior by humanities scholars: The Getty Online Searching Project Report No. 2. J. Am. Soc. Inf. Sci. 1993, 44, 273–291. [Google Scholar] [CrossRef]
- Wu, M.D.; Chen, S.C. Humanities graduate students’ use behavior on full-text databases for ancient Chinese books. In Proceedings of the International Conference on Asian Digital Libraries, Hanoi, Vietnam, 10–13 December 2007; Springer: Berlin/Heidelberg, Germany, 2007; pp. 141–149. [Google Scholar]
- Mehrotra, R.; Bhattacharya, P.; Yilmaz, E. Uncovering task based behavioral heterogeneities in online search behavior. In Proceedings of the 39th International ACM SIGIR Conference on Research and Development in Information Retrieval, Pisa, Italy, 17–21 July 2016; pp. 1049–1052. [Google Scholar]
- Song, Y.; Ma, H.; Wang, H.; Wang, K. Exploring and exploiting user search behavior on mobile and tablet devices to improve search relevance. In Proceedings of the 22nd International Conference on World Wide Web, Rio de Janeiro, Brazil, 13–17 May 2013; pp. 1201–1212. [Google Scholar]
- Kim, J.; Thomas, P.; Sankaranarayana, R.; Gedeon, T.; Yoon, H.J. Eye-tracking analysis of user behavior and performance in web search on large and small screens. J. Assoc. Inf. Sci. Technol. 2015, 66, 526–544. [Google Scholar] [CrossRef]
- Mao, J.; Luo, C.; Zhang, M.; Ma, S. Constructing click models for mobile search. In Proceedings of the 41st International ACM SIGIR Conference on Research & Development in Information Retrieval, Ann Arbor, MI, USA, 8–12 July 2018; pp. 775–784. [Google Scholar]
- Harvey, M.; Pointon, M. Perceptions of the effect of fragmented attention on mobile web search tasks. In Proceedings of the 2017 Conference on Conference Human Information Interaction and Retrieval, Oslo, Norway, 7–11 March 2017; pp. 293–296. [Google Scholar]
- Adell Mercado, J.; Bonafonte Cávez, A.; Cardenal, A.; Ruiz Costa-Jussà, M.; Rodríguez Fonollosa, J.A.; Moreno Bilbao, M.A.; Navas, E.; Rodríguez Banga, E. Buceador, a multi-language search engine for digital libraries. In Proceedings of the 2012 International Conference on Language Resources and Evaluation: Proceedings, Istanbul, Turkey, 23–25 May 2012; pp. 1705–1709. [Google Scholar]
- Lew, M.S.; Sebe, N.; Djeraba, C.; Jain, R. Content-based multimedia information retrieval: State of the art and challenges. ACM Trans. Multimed. Comput. Commun. Appl. (TOMM) 2006, 2, 1–19. [Google Scholar] [CrossRef]
- Sharma, H. Social Media Engagement Metrics—6 Things You Can Learn. 2011. Available online: http://www.optimizesmart.com/6-learn-postrank-social-engagement-metrics/#ixzz3OZtPcqmC (accessed on 16 February 2023).
- Germanakos, P.; Tsianos, N.; Lekkas, Z.; Mourlas, C.; Samaras, G. Capturing essential intrinsic user behaviour values for the design of comprehensive web-based personalized environments. Comput. Hum. Behav. 2008, 24, 1434–1451. [Google Scholar] [CrossRef]
- Jackson, C.B.; Crowston, K.; Østerlund, C. Did they login? Patterns of anonymous contributions in online communities. In Proceedings of the ACM on Human-Computer Interaction, 2(CSCW), Oslo, Norway, 29 September–3 October 2018; pp. 1–16. [Google Scholar]
- Cho, D.; Kim, S.; Acquisti, A. Empirical analysis of online anonymity and user behaviors: The impact of real name policy. In Proceedings of the 2012 45th Hawaii International Conference on System Sciences, Maui, HI, USA, 4–7 January 2012; pp. 3041–3050. [Google Scholar]
- Jansen, B.J.; Booth, D.L.; Spink, A. Determining the user intent of web search engine queries. In Proceedings of the 16th International Conference on World Wide Web, Banff, AB, Canada, 8–12 May 2007; pp. 1149–1150. [Google Scholar]
- Mendoza, M.; Baeza-Yates, R. A web search analysis considering the intention behind queries. In Proceedings of the 2008 Latin American Web Conference, Vila Velha, Brasil, 28–30 October 2008; pp. 66–74. [Google Scholar]
- Hassan, A.; White, R.W.; Dumais, S.T.; Wang, Y.M. Struggling or exploring? Disambiguating long search sessions. In Proceedings of the 7th ACM International Conference on Web Search and Data Mining, New York, NY, USA, 24–28 February 2014; pp. 53–62. [Google Scholar]
- Allen, G.; Peterson, B.L.; Ratakonda, D.K.; Sakib, M.N.; Fails, J.A.; Kennington, C.; Wright, K.L.; Pera, M.S. Engage! Co-designing search engine result pages to foster interactions. In Proceedings of the Interaction Design and Children, Athens, Greece, 24–30 June 2021; pp. 583–587. [Google Scholar]
- White, R. Beliefs and biases in web search. In Proceedings of the 36th International ACM SIGIR Conference on Research and Development in Information Retrieval, Dublin, Ireland, 28 July–1 August 2013; pp. 3–12. [Google Scholar]
- Joachims, T.; Granka, L.; Pan, B.; Hembrooke, H.; Gay, G. Accurately interpreting clickthrough data as implicit feedback. In Acm Sigir Forum; ACM: New York, NY, USA, 2017; Volume 51, pp. 4–11. [Google Scholar]
- Ieong, S.; Mishra, N.; Sadikov, E.; Zhang, L. Domain bias in web search. In Proceedings of the Fifth ACM International Conference on Web Search and Data Mining, Seattle, WA, USA, 8–12 February 2012; pp. 413–422. [Google Scholar]
- Dumais, S.; Jeffries, R.; Russell, D.M.; Tang, D.; Teevan, J. Understanding user behavior through log data and analysis. In Ways of Knowing in HCI; Springer: New York, NY, USA, 2014; pp. 349–372. [Google Scholar]
- Fox, S.; Karnawat, K.; Mydland, M.; Dumais, S.; White, T. Evaluating implicit measures to improve web search. ACM Trans. Inf. Syst. 2005, 23, 147–168. [Google Scholar] [CrossRef]
- Pergantis, M.; Varlamis, I.; Giannakoulopoulos, A. User Evaluation and Metrics Analysis of a Prototype Web-Based Federated Search Engine for Art and Cultural Heritage. Information 2022, 13, 285. [Google Scholar] [CrossRef]
- Winkler, D.; Mordinyi, R.; Biffl, S. Research Prototypes Versus Products: Lessons Learned from Software Development Processes in Research Projects. In Systems, Software and Services Process Improvement. EuroSPI. Communications in Computer and Information Science; McCaffery, F., O’Connor, R.V., Messnarz, R., Eds.; Springer: Berlin/Heidelberg, Germany, 2013; Volume 364. [Google Scholar] [CrossRef]
- Henze, N.; Shrazi, A.S.; Schmidt, A.; Pielot, M.; Michahelles, F. Empirical research through ubiquitous data collection. Computer 2013, 46, 74–76. [Google Scholar] [CrossRef]
- Jansen, B.J. Search log analysis: What it is, what’s been done, how to do it. Libr. Inf. Sci. Res. 2006, 28, 407–432. [Google Scholar] [CrossRef]
- Beitzel, S.M.; Jensen, E.C.; Frieder, O.; Lewis, D.D.; Chowdhury, A.; Kolcz, A. Improving automatic query classification via semi-supervised learning. In Proceedings of the Fifth IEEE International Conference on Data Mining (ICDM’05), Houston, TX, USA, 20–27 November 2005; p. 8. [Google Scholar]
- Cao, H.; Hu, D.H.; Shen, D.; Jiang, D.; Sun, J.T.; Chen, E.; Yang, Q. Context-aware query classification. In Proceedings of the 32nd International ACM SIGIR Conference on Research and Development in Information Retrieval, Boston, MA, USA, 19–23 July 2009; pp. 3–10. [Google Scholar]
- Caruccio, L.; Deufemia, V.; Polese, G. Understanding user intent on the web through interaction mining. J. Vis. Lang. Comput. 2015, 31, 230–236. [Google Scholar] [CrossRef]
- Magomadov, V.S. Exploring the role of progressive web applications in modern web development. J. Phys. Conf. Ser. 2020, 1679, 022043. [Google Scholar] [CrossRef]
- Dimoulas, C.; Veglis, A.; Kalliris, G. Audiovisual hypermedia in the semantic Web. In Encyclopedia of Information Science and Technology, 3rd ed.; IGI Global: Hershey, PA, USA, 2015; pp. 7594–7604. [Google Scholar]
- Xue, G.R.; Zeng, H.J.; Chen, Z.; Yu, Y.; Ma, W.Y.; Xi, W.; Fan, W. Optimizing web search using web click-through data. In Proceedings of the Thirteenth ACM International Conference on Information and Knowledge Management, Washington, DC, USA, 8–13 November 2004; pp. 118–126. [Google Scholar]
- Jansen, B.J.; Spink, A. How are we searching the World Wide Web? A comparison of nine search engine transaction logs. Inf. Process. Manag. 2006, 42, 248–263. [Google Scholar] [CrossRef]
- Taghavi, M.; Patel, A.; Schmidt, N.; Wills, C.; Tew, Y. An analysis of web proxy logs with query distribution pattern approach for search engines. Comput. Stand. Interfaces 2012, 34, 162–170. [Google Scholar] [CrossRef]
- Kacprzak, E.; Koesten, L.M.; Ibáñez, L.D.; Simperl, E.; Tennison, J. A query log analysis of dataset search. In Proceedings of the Web Engineering: 17th International Conference, ICWE 2017, Rome, Italy, 5–8 June 2017; Springer International Publishing: Berlin/Heidelberg, Germany, 2017; pp. 429–436. [Google Scholar]
- Ceccarelli, D.; Gordea, S.; Lucchese, C.; Nardini, F.M.; Tolomei, G. Improving europeana search experience using query logs. In Proceedings of the Research and Advanced Technology for Digital Libraries: International Conference on Theory and Practice of Digital Libraries, TPDL 2011, Berlin, Germany, 26–28 September 2011; Springer: Berlin/Heidelberg, Germany, 2011; pp. 384–395. [Google Scholar]
- Smyth, B.; Balfe, E.; Freyne, J.; Briggs, P.; Coyle, M.; Boydell, O. Exploiting query repetition and regularity in an adaptive community-based web search engine. User Model. User-Adapt. Interact. 2004, 14, 383–423. [Google Scholar] [CrossRef]
- Silverstein, C.; Henzinger, M.; Marais, H.; Moricz, M. Analysis of a Very Large AltaVista Query Log; Technical Report 1998-014; Digital SRC: Palo Alto, CA, USA, 1998; pp. 383–423. [Google Scholar]
- Shelton, K. The Value of Search Results Rankings. Forbes Magazine. 2017. Available online: https://www.forbes.com/sites/forbesagencycouncil/2017/10/30/the-value-of-search-results-rankings (accessed on 16 February 2023).
- Beus, J. Why (Almost) Everything You Knew about Google CTR Is No Longer Valid—SISTRIX. SISTRIX. 2020. Available online: https://www.sistrix.com/blog/why-almost-everything-you-knew-about-google-ctr-is-no-longer-valid (accessed on 16 February 2023).
- Li, Y.; Xie, Y. Is a picture worth a thousand words? An empirical study of image content and social media engagement. J. Mark. Res. 2020, 57, 1–19. [Google Scholar] [CrossRef]
- Davis Mersey, R.; Malthouse, E.C.; Calder, B.J. Engagement with online media. J. Media Bus. Stud. 2010, 7, 39–56. [Google Scholar] [CrossRef]
- Bufquin, D.; Park, J.Y.; Back, R.M.; Nutta, M.W.; Zhang, T. Effects of hotel website photographs and length of textual descriptions on viewers’ emotions and behavioral intentions. Int. J. Hosp. Manag. 2020, 87, 102378. [Google Scholar] [CrossRef]
- Panchal, A.; Shah, A.; Kansara, K. Digital marketing-search engine optimization (SEO) and search engine marketing (SEM). Int. Res. J. Innov. Eng. Technol. 2021, 5, 17. [Google Scholar]
- Barifah, M.; Landoni, M.; Eddakrouri, A. Evaluating the User Experience in a Digital Library. Proc. Assoc. Inf. Sci. Technol. 2020, 57, e280. [Google Scholar] [CrossRef]
- Jansen, B.J.; Jung, S.G.; Salminen, J. Measuring user interactions with websites: A comparison of two industry standard analytics approaches using data of 86 websites. PLoS ONE 2022, 17, e0268212. [Google Scholar] [CrossRef] [PubMed]
- White, R.W.; Morris, D. Investigating the querying and browsing behavior of advanced search engine users. In Proceedings of the 30th Annual International ACM SIGIR Conference on Research and Development in Information Retrieval, Amsterdam, The Netherlands, 23–27 July 2007; pp. 255–262. [Google Scholar]
- Onaifo, D.; Rasmussen, D. Increasing libraries’ content findability on the web with search engine optimization. Library Hi Tech. 2013, 31, 87–108. [Google Scholar] [CrossRef]
- Beus, J. The Proportion of Mobile Searches Is More Than You Think—What You Need to Know—SISTRIX. SISTRIX. 2021. Available online: https://www.sistrix.com/blog/the-proportion-of-mobile-searches-is-more-than-you-think-what-you-need-to-know (accessed on 16 February 2023).
- Baeza-Yates, R.; Dupret, G.; Velasco, J. A study of mobile search queries in Japan. In Proceedings of the International World Wide Web Conference, Banff, AB, Canada, 8–12 May 2007. [Google Scholar]
- Pergantis, M.; Lamprogeorgos, A.; Giannakoulopoulos, A. Results of a Qualitative Survey of Habits and Needs of Users searching the Web for Art and Cultural Heritage. In Proceedings of the 3rd International Conference Digital Culture & AudioVisual Challenges Interdisciplinary Creativity in Arts and Technology, Online, 28–29 May 2021. [Google Scholar]
- Li, J.; Huffman, S.; Tokuda, A. Good abandonment in mobile and PC internet search. In Proceedings of the 32nd International ACM SIGIR Conference on Research and Development in Information Retrieval, Boston, MA, USA, 19–23 July 2009; pp. 43–50. [Google Scholar]
- Gafni, R.; Nissim, D. To Social Login or not Login? Exploring Factors Affecting the Decision. Issues Inf. Sci. Inf. Technol. 2014, 11, 57–72. [Google Scholar]
- Micallef, N.; Adi, E.; Misra, G. Investigating Login Features in Smartphone Apps. In Proceedings of the 2018 ACM International Joint Conference and 2018 International Symposium on Pervasive and Ubiquitous Computing and Wearable Computers, Singapore, 8–12 October 2018; pp. 842–851. [Google Scholar] [CrossRef]


Disclaimer/Publisher’s Note: The statements, opinions and data contained in all publications are solely those of the individual author(s) and contributor(s) and not of MDPI and/or the editor(s). MDPI and/or the editor(s) disclaim responsibility for any injury to people or property resulting from any ideas, methods, instructions or products referred to in the content. |
© 2023 by the authors. Licensee MDPI, Basel, Switzerland. This article is an open access article distributed under the terms and conditions of the Creative Commons Attribution (CC BY) license (https://creativecommons.org/licenses/by/4.0/).