Article

Optimizing the Quality of Service of Mobile Broadband Networks for a Dense Urban Environment

1
Department of Electrical and Electronics Engineering, Faculty of Engineering, University of Lagos, Akoka, Lagos 100213, Nigeria
2
Department of Mechanical Engineering, Faculty of Engineering, Ambrose Alli University, Ekpoma 310103, Nigeria
3
Department of Physics, Federal University Lokokja, Lokaja 260101, Nigeria
4
Research and Development Center for Physical Education, Health, and Information Technology, Department of Library and Information Science, Fu Jen Catholic University, New Taipei City 24206, Taiwan
5
Department of Computer Science and Information Engineering, Asia University, Taichung City 41354, Taiwan
*
Author to whom correspondence should be addressed.
Future Internet 2023, 15(5), 181; https://doi.org/10.3390/fi15050181
Submission received: 10 April 2023 / Revised: 3 May 2023 / Accepted: 8 May 2023 / Published: 12 May 2023
(This article belongs to the Special Issue Applications of Wireless Sensor Networks and Internet of Things)

Abstract

:
Mobile broadband (MBB) services in Lagos, Nigeria are marred with poor signal quality and inconsistent user experience, which can result in frustrated end-users and lost revenue for service providers. With the introduction of 5G, it is becoming more necessary for 4G LTE users to find ways of maximizing the technology while they await the installation and implementation of the new 5G networks. A comprehensive analysis of the quality of 4G LTE MBB services in three different locations in Lagos is performed. Minimal optimization techniques using particle swarm optimization (PSO) are used to propose solutions to the identified problems. A methodology that involves data collection, statistical analysis, and optimization techniques is adopted to measure key performance indicators (KPIs) for MBB services in the three locations: UNILAG, Ikorodu, and Oniru VI. The measured KPIs include reference signal received power (RSRP), reference signal received quality (RSRQ), received signal strength indicator (RSSI), and signal-to-noise ratio (SINR). Specific statistical analysis was performed, and the mean, standard deviation, skewness, and kurtosis were calculated for the measured KPIs. Additionally, the probability distribution functions for each KPI were plotted to infer the quality of MBB services in each location. Subsequently, the PSO algorithm was used to optimize the KPIs in each location, and the results were compared with the measured data to evaluate the effectiveness of the optimization. Generally, the optimization process results in an improvement in the quality of service (QoS) in the investigated environments. Findings also indicated that a single KPI, such as RSRP, is insufficient for assessing the quality of MBB services as perceived by end-users. Therefore, multiple KPIs should be considered instead, including RSRQ and RSSI. In order to improve MBB performance in Lagos, recommendations require mapping and replanning of network routes and hardware design. Additionally, it is clear that there is a significant difference in user experience between locations with good and poor reception and that consistency in signal values does not necessarily indicate a good user experience. Therefore, this study provides valuable insights and solutions for improving the quality of MBB services in Lagos and can help service providers better understand the needs and expectations of their end users.

1. Introduction

Improving the quality of service (QoS) of mobile broadband networks depends on quality control and network performance monitoring [1,2]. For recent networks, such as 5G and 4G, network performance can only be monitored by critically analyzing relevant mobile broadband (MBB) metrics such as the reference signal received power (RSRP), reference signal received quality (RSRQ), received signal strength indicator (RSSI), and download throughput, among others. Equally important is a real-life test of how to target user equipment (UE) using the resource block (RB) allocated across different types of devices [3,4]. Despite the development and implementation of the fifth-generation network (5G) in leading nations of the world by the fall of 2020 [5], developing countries such as Nigeria still linger behind in the infrastructure and hardware required to implement 5G technology. When other factors influencing the adoption and acceptance of technology in society, such as religion and governmental policies, are considered, developing countries in Africa, such as Nigeria, may not have the technological drive nor the capital required to implement 5G technology across the nation very soon. The ever-increasing number of mobile broadband (MBB) subscribers find a ray of hope for better connectivity through the optimization of existing 4G LTE networks widely available across the country through mobile network operators (MNOs) such as the Emirates Telecommunications Corporation (Etisalat) and the Mobile Telephone Network (MTN).
As wireless technologies continue to advance and become widely adopted in daily and industrial applications, it is essential to note that this progress is not limited to cellular communications. Recent advancements in wireless technology have also paved the way for the deployment of autonomous vehicles, which can self-drive for several kilometers across different terrains by utilizing low latency and high data rates, particularly from the 4G/5G network, for the establishment of situational awareness [6]. Situational awareness, otherwise known as user localization, is critical to achieving reliable, full autonomy, especially in the establishment of vehicle-to-everything (V2X) communication [7]. As such, the metrics used to monitor MBB networks evaluate mobile communication and establish relevant documentation that can be used to enhance throughput values, especially in dense urban environments where vehicles need to maintain high levels of communication with pedestrians, other vehicles, and devices for safe navigation.
Achieving the high throughput and low latency levels specified for 5G networks requires transmission bandwidths of high magnitude. However, the scarcity of available spectra, otherwise known as unlicensed spectra, makes it difficult to sustain these conditions. Millimeter waves (mmWaves) have been used for 5G network deployment, as they offer significantly higher bandwidths than lower frequencies. Unfortunately, the short wavelengths of mmWaves mean they are easily blocked by obstacles, especially in dense urban areas. In practice, massive multiple-input multiple-output (mMIMO) and beamforming techniques have been used to effect directional communications to sustain the operation of the network, especially in dense environments. The work [8] proposes a reduced-complexity algorithm based on a pseudo-maximum likelihood (ML) approach capable of predicting unknown multipath constraints using spatially smoothed adaptive beamforming to arrive at an appropriate likelihood function. This helps to address the problem of direct position estimation (DPE) for multi-antenna receivers, especially in environments where a dynamic multipath is considered.
Although this paper seeks to extensively address the communication lapses common in MBB networks in the areas considered, it is noteworthy to state that, as in the case of autonomous vehicles, recent networks such as the 5G network find application in a wide variety of fields, including virtual reality, augmented reality, remote surgery, and very high-quality video streaming [9]. There are three main categories of 5G use cases: enhanced mobile broadband (eMBB), ultra-reliable low latency (URLLC), and massive machine-type communication (mMTC). While eMBB focuses on providing faster download and upload speeds and improving network capacity to support high-bandwidth applications such as streaming video, online gaming, and virtual reality, URLLC focuses on supporting low-latency and high-reliability applications such as autonomous vehicles, industrial automation, and remote surgery. Finally, mMTC supports large-scale deployments of connected devices and sensors, such as smart cities and the internet of things (IoT).
An abundance of literature exists that seeks to address the problems common in wired and wireless communication technologies. For instance, Sowmya and Teja [10] opined that issues involving the difficulty of transferring information between the sender and receiver using wireless communication systems could be addressed using minimization optimization techniques. The application of particle swarm intelligence and optimization (PSI and PSO) was seen when they focused on finding the best conditions for the signal-to-noise ratio (SNR) using a dynamic particle swarm optimization (DPOS) algorithm for a 5G network. Thus, PSO is used in our search for optimal KPIs for the 4G LTE network. As the development of the cellular service market continues to advance radically, spurring high levels of competition between MNOs, sophisticated methods that foster better service provision, better network coverage, and reductions in cell reselection, handover time, and requirements have been highly encouraged and adopted by MNOs [11]. Several works show the relevance of establishing different relationships between network parameters and the QoS provided via an optimization process [3,12].
The multidimensionality of the processes and requirements characterizing an eventual improvement in the service provided and the experience quality of an MBB network user involve changes in the qualitative methods adopted in both the design and the operation of the network in question. In some cases, major re-routing and replanning of the hardware positions within the target areas become indispensable if substantial levels of improvements are to be achieved [13,14,15,16]. These changes are costly but, nonetheless, not as expensive as the implementation of 5G. Moreover, with increasing subscribers and network service prices, MNOs have the corresponding income to help them sustain their quest to ensure better QOE for end users.
In [17], Imoize et al. extensively measured selected MBB KPIs in Victoria Island and Ikoyi in Lagos, Nigeria. Their work detailed the behavioral dynamics of the 4G LTE network in the two areas, followed by an extensive error analysis comparing the behavioral patterns formed with respect to missing data from the measurements. However, their work did not pay attention to other densely populated areas in Lagos, such as UNILAG. Similarly, Ref. [18] treated the characteristics of MBB networks with a focus on 5G-related operational codes and architecture using simulations. While adopting varying research approaches, none proposed practical network optimization methods. This work seeks to use recent measurement data from the areas considered in [17], increase the sample space to enhance the universality of the results obtained by adding UNILAG (another urban settlement in Lagos, Nigeria), analyze the network performance of an already deployed 4G LTE network in those areas, and perform minimal optimization using the PSO algorithm to suggest practical solutions to the problems of the 4G LTE network in the environments considered.
This study aims to delve into the complexities and scope of a live 4G LTE network, analyze its performance through selected propagation measurements, and provide optimized solutions to the problems faced by the network in the area. Cutting-edge drive test equipment from Huawei Technologies is adopted to ensure congruence with real-life conditions. Since this study seeks to address 4G LTE shortcomings and comprehensively evaluate its key performance indicators in Nigeria, the measurements will focus on vital indicators, otherwise referred to as key performance indicators (KPIs), such as RSRP, RSRQ, RSSI, PCC PHY DL throughput, and PDCP DL throughput. All measurements will be conducted at a working frequency of 1876.6 MHz. The propagation measurements will be taken over a distance of one kilometer at 100-m intervals. All measurements will begin at a reference distance of 100 m from the base station. The results will be extracted, scrutinized, and refined in MATLAB after the collection of measurements. The primary goal is to develop novel models that are tailored to the unique characteristics of the environments investigated in this study.

1.1. Key Contributions

For financial and scientific purposes, optimization of service provision or production processes aims at providing solutions that minimize input while sufficiently attaining the required output. This study brings to light the possibility of improving the QoS by adopting a minimization technique. Furthermore, it aims at suggesting optimized KPI values within the capacity of the MNOs, which are also conveniently within recommended standard values. The specific contributions are comprehensively summarized as follows:
  • We provide an extensive 4G LTE mapping and signal performance measurement overview in UNILAG, Ikorodu, and Oniru VI of Lagos, Nigeria. As a fast-growing economy, Lagos provides a thriving environment for adopting networking optimization. This can serve as the bedrock for improved network performance and user experience.
  • A detailed analysis and data visualization of the measured parameters has been performed using MATLAB R2021a and presented in appropriate tables and figures. The decision to use the data as obtained for the analysis makes the results obtained closer to reality than if the choice of completing missing data was adopted.
  • The relevance of adopting a multidimensional approach in the examination of the QoS and QoE of 4G LTE through metrics such as RSRP, RSRQ, SINR, throughput downlink (DL), and uplink (UL), rather than using a single parameter, will also be tested.
  • The specific optimized value range for metrics such as the RSRP, RSRQ, and SINR are suggested, while recommendations for implementing the optimized values for all the test environments are made in line with the specific challenges in the areas.

1.2. Paper Organization

The chronological arrangement of the remaining sections of this paper is as follows: Section 2 shows the origin and economic impact of wireless technology in Nigeria and details varying aspects of 4G LTE. Section 3 details the methodology of obtaining and processing the data measured. It also specifies the area covered, the driving test (DT) tool, and the performance metrics considered. Section 4 shows the analysis performed and the results obtained. Relevant findings and trends in the results are also discussed. Finally, Section 5 concludes the paper.

2. Theoretical Background

Mobile broadband (MBB) and wireless networks are increasingly impacting the economies of nations across the globe. MBB has created efficient business environments through effective communications and connectivity [19]. The World Bank also reckons that internet broadband has the propensity to create opportunities and avenues for job creation, helping developing countries to attain strategic development goals (SDGs) [20]. In Nigeria, the MBB market saw a leap from 400,000 to 92 million active subscribers between 2001 and 2016. Surprisingly, with over 48% of the entire population as active MBB subscribers, the reduced price of mobile phones is not the only factor responsible for the widespread adoption of wireless technologies. The endless desire for connection, the explosion of the internet, and gaming, among other reasons, are why people gravitate toward using MBB networks such as 4G LTE.
However, it is important to note that the exponential growth in the number of MBB subscribers in Nigeria has not always been the same in recent years. Following the liberalization policy reform of the Nigerian telecommunication industry in 2001, investments in wireless infrastructure have witnessed sporadic increases, which have only multiplied as more subscribers join different MNOs. Were it not for the poor wire/wireless internet infrastructure deployment in the country, which makes it difficult for the newest technologies such as 5G to be easily implemented, there is no telling the economic and sociological impact that wireless technologies could have in Nigeria. In the struggle towards better connection and communication in Nigeria, over 95% of internet connection is done over mobile broadband, which is led by major network providers such as MTN, Etisalat, Global Communication (GLO), and Airtel. The market was estimated to contribute over $6 billion to the national GDP in 2016. With such a level of impact, it is, therefore, necessary for network services such as the 4G LTE used in the nation to be optimized while plans are made for deploying 5G in the near future.

2.1. Related Work

In 2022, Imoize et al. analyzed the KPIs of 4G LTE networks, essentially applying the piecewise cubic Hermite interpolating polynomial (PCHIP) algorithm to mitigate the effect of missing data obtained during a driving test (DT) in a dense urban environment [17]. Their observance of a half-normal distribution for the parameters more connected with the throughput is a good indicator that MNOs have maintained a skewness towards obtaining better data transfer rates. Furthermore, while trying to curb the inevitable data loss due to poor distance and other environmental factors such as building density, they compared the data with missing values to a filled data set and found no significant difference between them.
For academic and industrial purposes, El-Saleh et al. conducted indoor and outdoor evaluations of 5 MNOs in Malaysia [1]. The study presented the operational levels of the signal quality and uplink and downlink throughput. To clearly define critical differences in the observed MNOs, the study stretched to less-considered parameters such as the ping and handover of all the network providers. Since the study focused on describing the overall QoE and other related network issues, the equipment used during measurements had 3G and 4G network compatibility.
Going by these developments, Isabona et al. [18] explored the low-density parity-check (LDPC) and polar codes conducive to 5G operation. They also compared these codes to the operating codes for 4G LTE. For a work targeted towards confirming the viability of the promise of a seemingly better communication technology that enables high-reliability connections, they spelled out the implication of using new 5G codes and the potential performance of a 5G architecture. On a practical note, however, Magray et al. [21] presented real-world deployment parameters while successfully integrating coplanar waveguide (CPW)-fed antennas and other simple devices to produce a special 4G LTE band known as category 7. The experiment was targeted toward smartphones, and a typical smartphone was used. Despite the improvements presented by 5G technology compared to the 4G LTE and older generations, there is still a need for periodic and empirical performance evaluation of cellular network technologies. Although signal coverage, among other parameters, is essential to determining the QoS of a wireless network, signal quality is also relevant. According to Isabona et al., and other researchers, 4G has better signal quality, while 4G LTE network has a range of signal coverage [18,22].
While the world speeds off into the adoption of 5G technology, the potential of the 4G network has not been fully harnessed and designed to have repeating patterns in its frequency to curb the problems of channel irregularities, frequency error, and time lag; a 4G network may be just enough to meet the average user requirements. One of the problems experienced most of the time concerning the QoE a user receives is due to service providers not meeting the standard specifications contained in the 3GPP. Coupled with the fact that different environmental conditions are left to the providers to address based on their hardware assets and the skills of their operators, the lack of implementation of the standard 3GPP signals provides a platform for estimating the time of arrival (TOA) in areas with MBB signal deficiencies, as discussed in [23]. In a work aimed at solving the problem of poor mobile network performance problem in Brazil, a limited region with poor networking infrastructure and coverage was selected. The number of base transceiver stations (BTS) and the power they transmitted for optimal coverage of the region were then analyzed, as presented in [24].
Based on social cloud computing, there have been suggestions of models that use image measurements to optimize the QoS and QoE [25,26,27,28] of wireless networks. The limitation, however, is that these suggestions do not include practically implementable mappings for achieving the models [11]. Similarly, in [27], the focus was on improving video quality in social clouds. These clouds formed a basis for which voice and video calling services in budding social networks and gaming were developed [29]. Physical KPIs explored certain relationships between the QoE and the QoS [30,31,32].

2.2. Long-Term Evolution (LTE)

In the context of the 3rd Generation Partnership Project (3GPP), LTE can be described as the flexible radio technology behind the 4G cellular network. During its first release, data transfer rates of 300 Mbps were recorded in different conditions [33]. These speeds had poor radio delays of less than 5 ms. LTE is operational across a wide variety of frequency spectrum allocations and operates across varying frequency or time-division duplexes (FDD or TDD). This makes it possible for LTE to provide solutions for wide-range system bandwidths [13]. In addition, LTE and other recent network technologies, such as 5G, bring to light the advantages of wireless technology, such as lower cost, mobility, and ease of installation for users.
In 2015, Ozovehe and Usman [34] compared the effective coverage of several mobile broadband operators (MNOs) in Nigeria. The study found that one operator’s network was comparatively better and that optimization could improve its performance. Deepak and Balaji [35] also compared multiple input multiple outputs (MIMO) transmission techniques over 4G networks and found that optimized data quality produced the best image quality. Additionally, in [36], Navita conducted a comparative analysis of MIMO, OFDMA, and synchronized channel frequency division multiple access and found that OFDMA provides the best quality of service. This performance was linked to its minimal signal-to-noise ratio at the least considered bit error rate.
4G networks have always had better quality compared to 3G. In 2011, this was clearly illustrated in a study by Kumar and Yadav [37] in which they used the universal mobile telecommunication service (UMTS) and mobile worldwide interoperability for microwave access (WiMAX) as the bases for 3G and 4G, respectively. Interestingly, while trying to improvise on better ways to improve packet data forwarding between multiple base stations, Amin and Ylä-Jääski [38] found that frequent polling during handover was the most efficient technique. Afroz et al. in 2015 [39], studied the relationship between four LTE measurements with emphasis on the effect of signal-to-noise ratio on the transfer rate of a network. They detailed their findings in [23], and this work laid the foundation for further studies, such as one conducted by other researchers in mobile broadband technologies. Notable researchers who have cited this work include Tanhatalab, Jadeh, and Esfahani, who in [40] provided solutions for improving data transfer rates by optimizing some propagation parameters. These studies provide valuable insights into the performance and optimization of all the network generations and their LTE networks. Thus, these empirical studies and other works provide quality grounds for examining the efficacies of existing mobile networks and comparing the network technologies. A summary of the related work is given in Table 1.
In conclusion, the studies presented here have shown how 2G, 3G, and 4G LTE networks can be improved in terms of their performance. These include the use of KPIs, reducing interference, deploying MIMO-OFDMA multiple access technology, optimizing handover mechanisms, and modulating network parameters. In addition, these studies highlight the importance of continued research and development in mobile network performance optimization as technology advances and new challenges arise.

2.3. Optimization

We will now discuss the theoretical framework for optimizing the experience of a 4G LTE network user applying particle swarm optimization (PSO). PSO is an optimization algorithm that searches for solutions by simulating the behavior of a swarm of particles considered a population. It searches for the optimal solution in a high-dimensional search space while information is shared among swarm members. The algorithm works by iteratively updating the position and velocity of the particles based on their current best performance and the best performance of the entire swarm. PSO has been successfully applied in various fields, including wireless communications, and has proven timeless in optimizing wireless networks.
Closely related to PSO is harmony search optimization (HSO), a dynamic version of the algorithm that combines PSO with other optimization techniques, such as genetic algorithms (GA), artificial neural networks (ANN), and fuzzy logic, to create a hybrid optimization algorithm. In HSO, the aim is to leverage the strengths of multiple optimization techniques and combine them into a single hybrid algorithm. Although the results are considered more efficient, PSO remains an effective optimization process that can handle complex and highly constrained optimization problems.
4G network architecture plays a role in any process, ensuring successful optimization. Generally, 4G network architecture consists of various components, such as the base station, the mobile terminal, and the core network. These components work together to provide the required QoS to the end users. For example, the base station provides radio coverage and manages data transmission between the mobile terminal (user equipment) and the core network. While the user equipment affords the user access to the network, the core network manages and routes the data to its destination.
To optimize the QoS of 4G networks, various metrics, such as signal strength, data rate, and packet loss rate, must be considered and optimized. This approach has been used in different works in the past for effective optimization, and is summarized in the following steps:
  • Modeling the 4G network: First, a network model is developed taking into account the physical characteristics of the network, operational base stations, active users, the frequency spectrum available, and the user’s proximity to a base station.
  • Defining the objective function: A mathematical representation of the QoS metric to be optimized is developed within a predetermined boundary. For example, in the case of 4G networks, common objective functions may include maximizing the data rate, minimizing the latency, or maximizing the energy efficiency of the network.
  • Selecting the optimization algorithm: Depending on the objective function and the characteristics of the 4G network, an informed choice can be made between applying PSO or HSO as the optimization algorithm. For example, if the objective function is complex and the network is large, HSO may be a better choice. On the other hand, if the objective function is simple and the network is small, PSO may be a more efficient choice.
  • Implementing the algorithm in MATLAB: Once the optimization algorithm has been selected, a thorough implementation in MATLAB is required. This will involve writing code that implements the algorithm, defining the parameters for the optimization, and setting up the objective function.
  • Running the optimization: Once the algorithm has been implemented in MATLAB, the optimization can then be run, specifying the initial conditions and the number of iterations. The algorithm will then iteratively update the parameters of the network until the objective function is optimized.
  • Analyzing the results: Finally, the optimization results can be further examined to determine the optimal configuration of the 4G network. This may involve plotting the results, comparing the results to the baseline, or determining the impact of the optimization on the QoS metric.

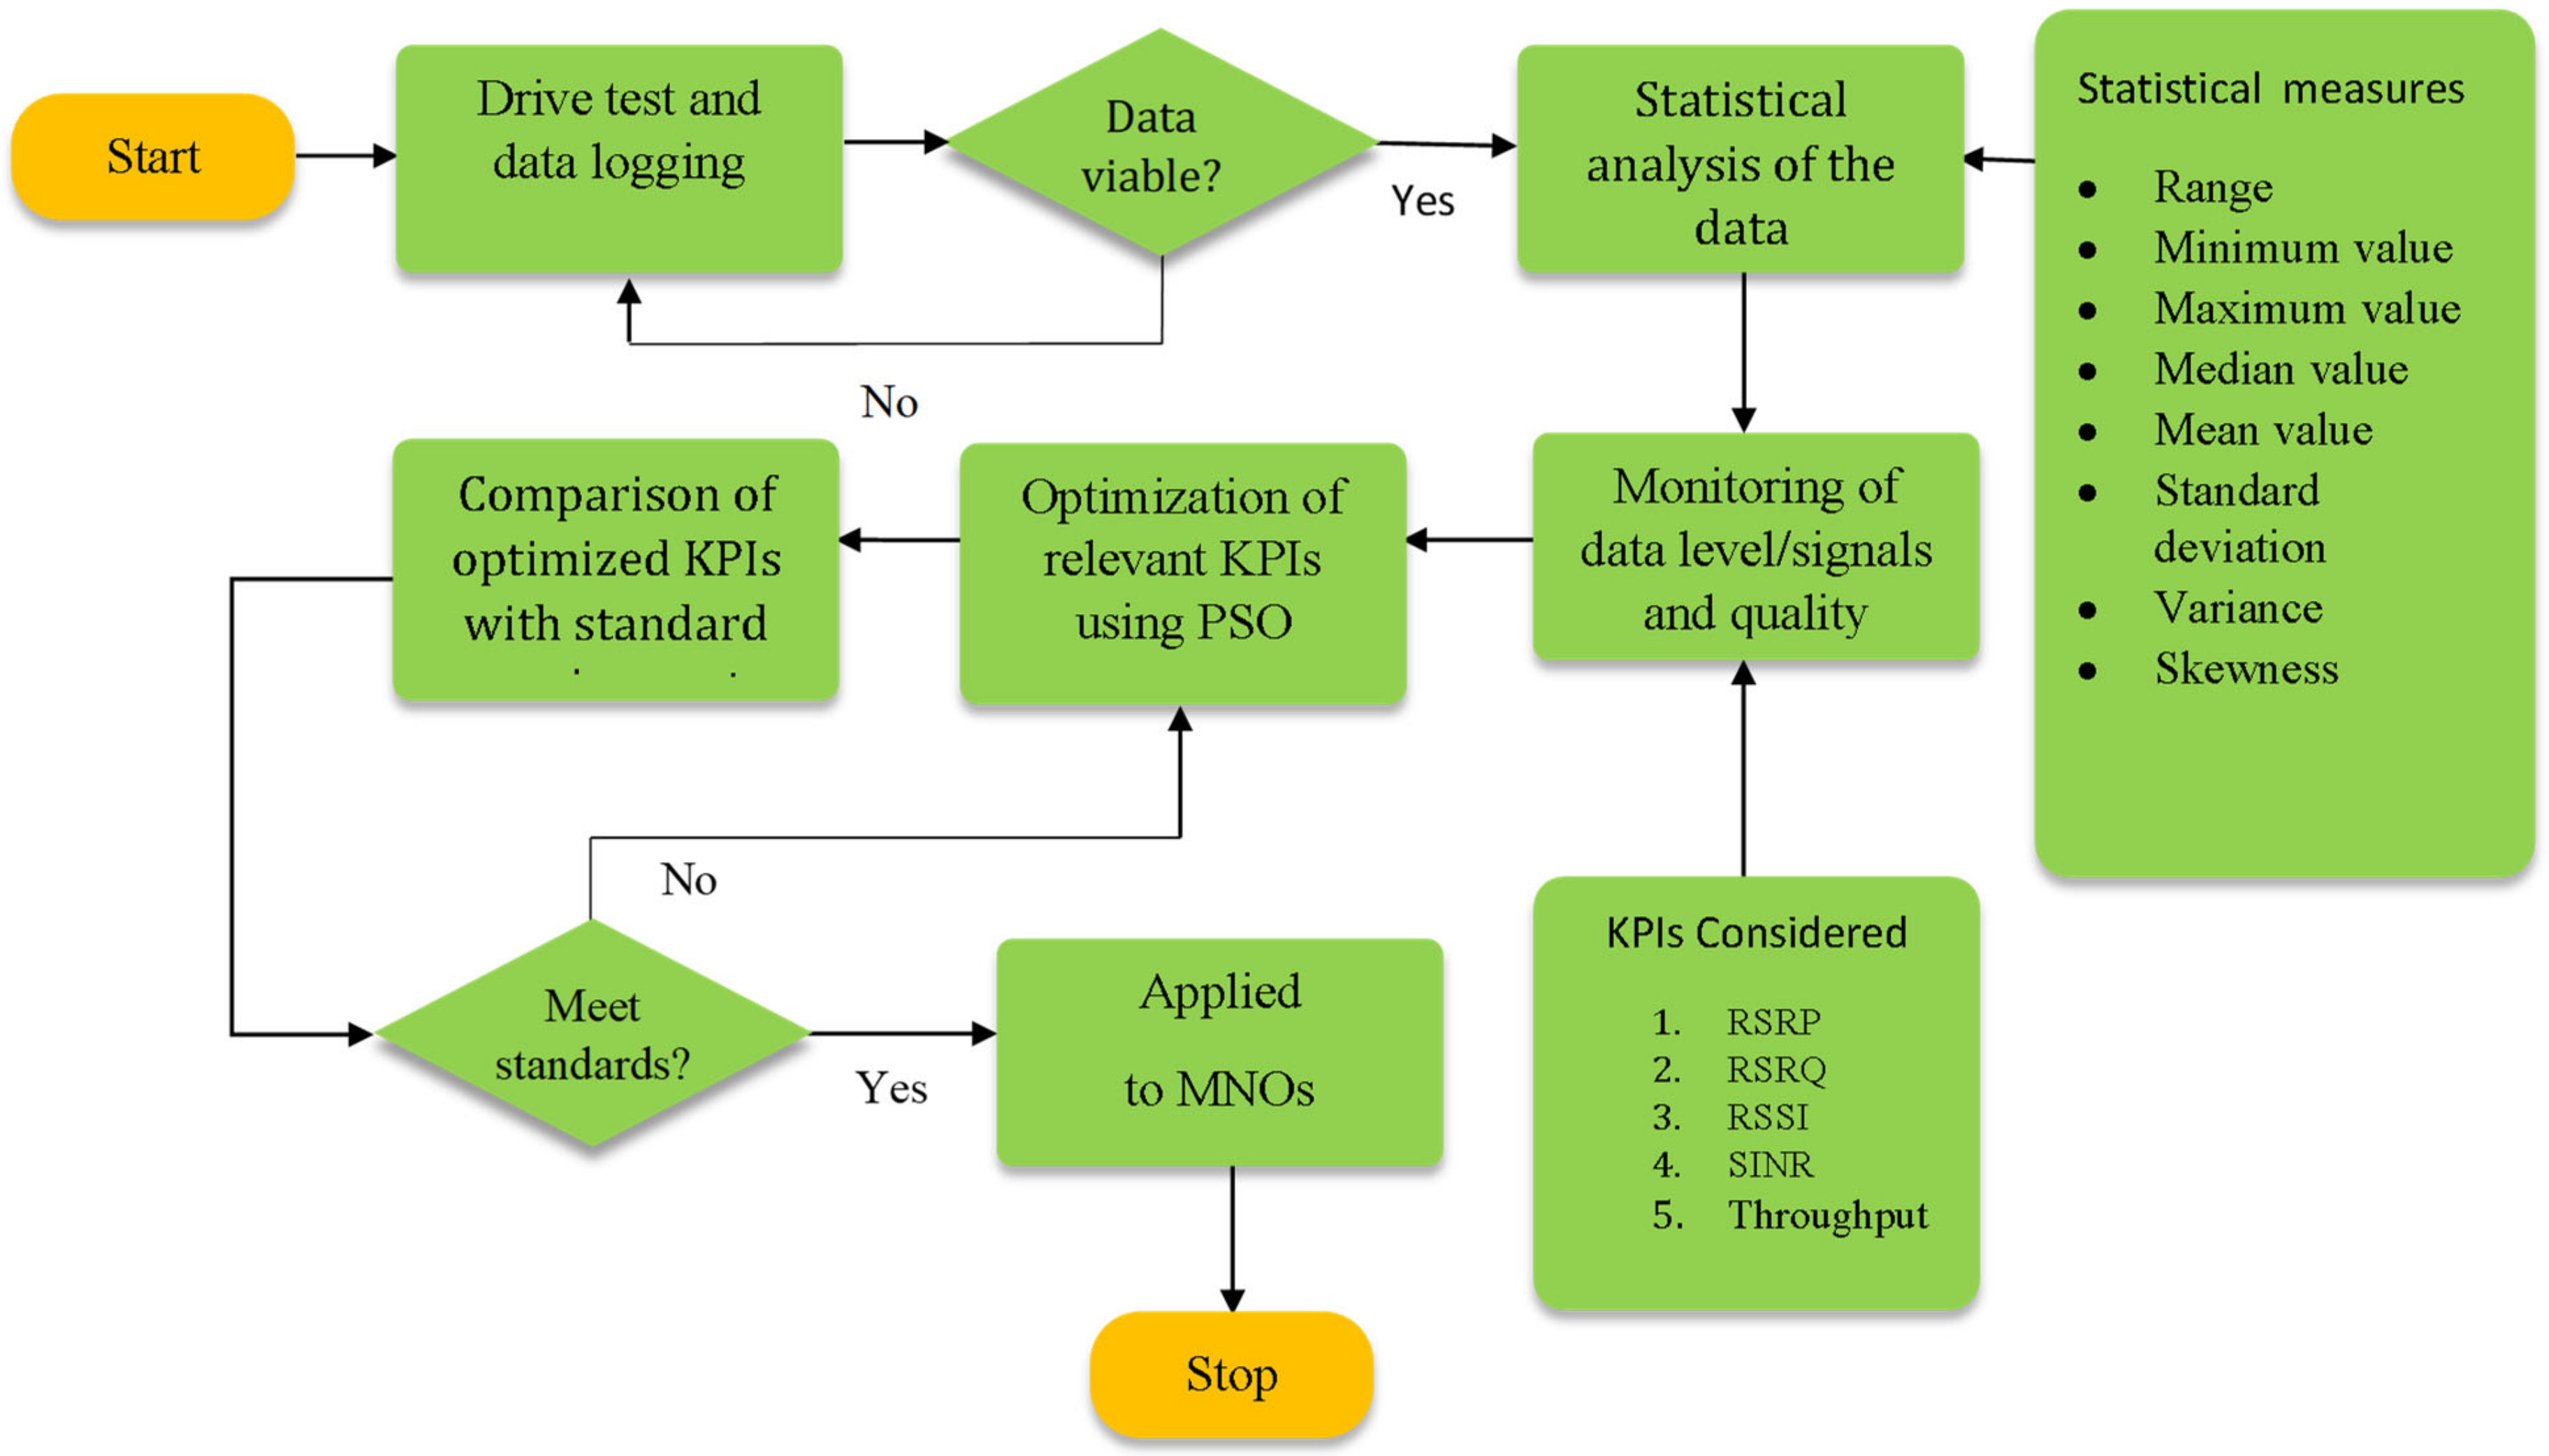
3. Experimental Design

This paper adopted a repeatable and thoroughly scrutinized methodology for data measurement, collection, and analysis, and trends were identified where obvious. This section details the campaign strategies, equipment, materials, and algorithms used in the sorting and optimization of broadband KPIs of interest. We will keep in mind that while a holistic approach was used in the acquisition of the data, a more selective approach was used in determining the KPIs to be analyzed for trends, patterns, and those optimized using the PSO algorithm.
For the more pragmatic application of the optimized metrics obtained, specific areas of Lagos, Nigeria, and a commercial MNO with nationwide coverage (Etisalat) have been targeted for the execution of the measurement, experiment, and optimization procedures. These methods can subsequently be adopted in other geographical areas and MNOs for the effective analysis and optimization of the metrics which are closely knitted to the user’s experience and the quality of service of the mobile network. The campaign involved measurements obtained with a personal computer equipped with GENEX Assistance Version 16, a standalone software program with its accompanying Genex version 16 probe for obtaining different network KPIs. A GPS unit was also necessary to determine the distance between test sites (stations). For accuracy, a 4G compatible Huawei Modem E392 with LTE upload speed up to 50 Mbit/s and download speed up to 100 Mbytes/s is used at a moderate speed of 30 km/h. A moderate speed ensures uniformity in the results obtained from the test terminal station in the test car. Data measurements were recorded against the global positioning system (GPS) coordinates (longitude and latitude), and the DT assistant also logged the time.
Once the DT was completed and the data logged into the CSV files for the three locations, the viability of the data was then checked with a bird’s eye view for obvious discrepancies and non-conformity with threshold values for the KPIs obtained. Though there was no need for a test rerun, as the data held substantial quality to pass the viability test, it was important to establish sets of rules to ensure the data obtained could efficiently be used to represent the network conditions of the MNO in the areas considered. Once the data viability test was passed, the data was then imported into MATLAB for an extensive statistical analysis to observe the measure of dispersion and correlation in the network quality obtained at the different locations. As shown in Table 2, Table 3 and Table 4, the relevant measures of dispersion, such as the range, median, standard deviation, and variance, show the distribution characteristics of the data obtained. The skewness factor is also used to show the asymmetry of the measurement and further establish the viability of the DT.
The KPIs are graphically interpreted and monitored at the next stage for signal levels and operational intricacies. As a means of ensuring the efficiency of the methodology, the signals for each KPI are compared for the different areas considered. From this process, the QoS and bandwidth strength at different locations of the DT can be shown, and positions with the least network performance can be noted for subsequent optimization procedures.
Starting from the experimental planning, DT, the MATLAB simulation, and analysis of the data obtained, the optimization process holds a high level of relevance, and care is taken to write the PSO algorithm, specify the upper and lower boundaries, and seek ways to ensure that swarm intelligence is used in its purest form to ensure accuracy of the optimization solution derived from the objective function chosen. The RSRP and SINR are used to develop the objective functions and boundary conditions for the optimization process. Optimized solutions are then tested against industry-recommended values to ascertain their practicality and usefulness to the telecommunication industry. Figure 1 is a flowchart representation of the methodology.

3.1. Materials and Experimental Setup

While a great deal of open and premium software is available for drive test (DT), Genex Assistant v16 was used in this study, as it bridges the gap between 3GPP MBB and the 4G LTE network. Besides being widely available, it also has a friendly interface for interacting with the data monitoring and acquisition process. The features of a DT assistant, such as the GENEX v16, are widely used in the measurement and study of network services and parameters, as they make test procedures practical, accurate, and convenient. Notable features of the DT assistant are:
  • Allows minimal modification of the terminal device and requires less technical knowledge.
  • Automatic measurement and logging of DT data at rapid and programmable sessions.
  • Mobility and ease of installation across multiple operating systems (for example, Windows, Linux, Mac).
  • Universal and applicable across different terminal devices, such as mobile phones, for measuring network parameters without special equipment.

3.2. Relevant 4G LTE Performance Metrics

The performance of a 4G LTE MNO, such as the Etisalat LTE network, can be monitored via a plethora of metrics. However, while some metrics directly impact the end user’s experience and the QoS, some are not as valuable in determining the performance and possible optimization of the network. For better optimization, a few of the most important metrics are considered in this study, and a handful of them are optimized. The KPIs considered are presented in Section 3.2.1, Section 3.2.2, Section 3.2.3, Section 3.2.4 and Section 3.2.5.

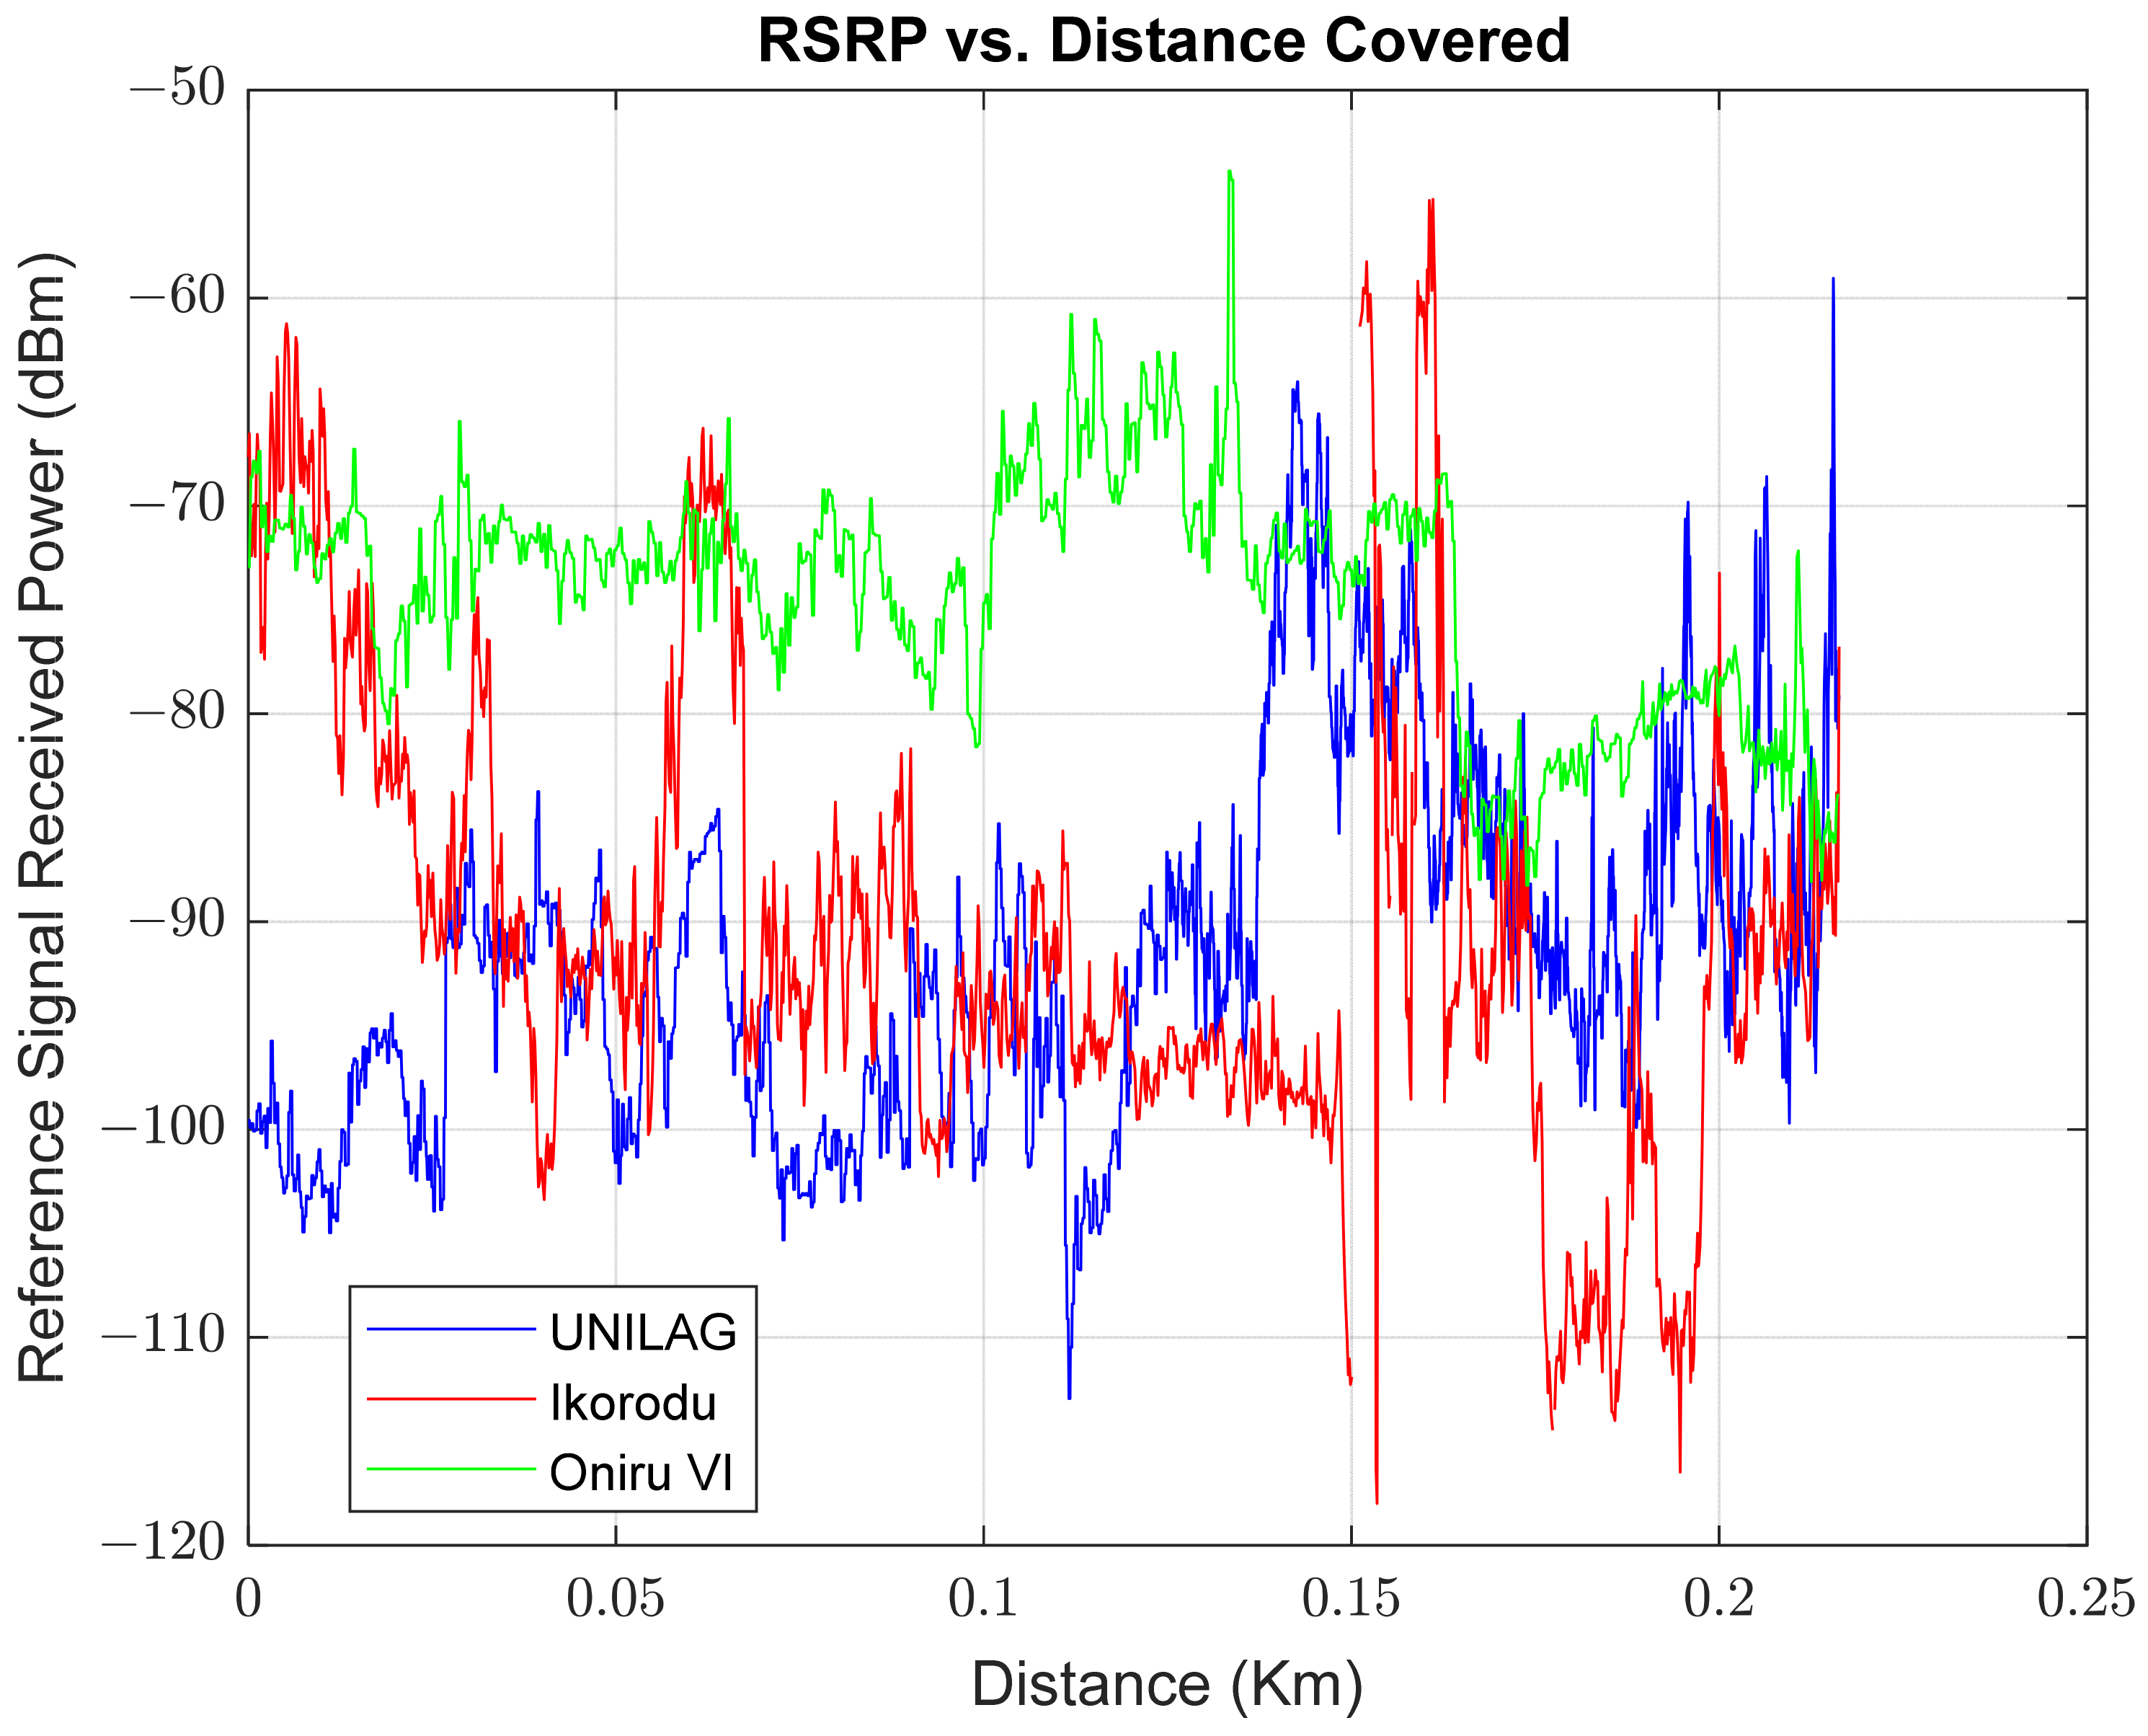
3.2.1. Reference Signal Received Power

In bandwidth, the average power that carries reference signals across resource elements to specific cells is referred to as the reference signal received power (RSRP). In other words, it represents a metric that can efficiently tell how much quality of service a terminal is allocated. In terms of its structure, eighty-four resource elements make up a resource block. In the frequency domain, this amounts to 180 KHz. In the time domain, these blocks reach a threshold of 0.5 ms. Since the network is targeted towards operating terminals, in the time-frequency grid, users are allotted resource blocks according to their proximity to the base station and the capability of their equipment. In general, higher values of RSRP measured from a user are an indicator of a higher network quality experience. Measured in decibel-milliwatts (dBm), the RSRP shows how many resource blocks (RB) a user receives to transfer data. High bit rates have also been noticed where high modulation is used on account of a high number of resource blocks, made available due to improvements in the RSRP measurements on a terminal. In handovers and cell reselection cases, the RSRP can be used in conjunction with the reference signal received quality (RSRQ) to determine when a user terminal switches from a signal antenna to receiver antennae.
Mathematically, RSRP is defined in Equation (1) as:
RSRP   dBm = P 0 N
where P r =   received   signal   power and N =   number   of   resource   blocks .

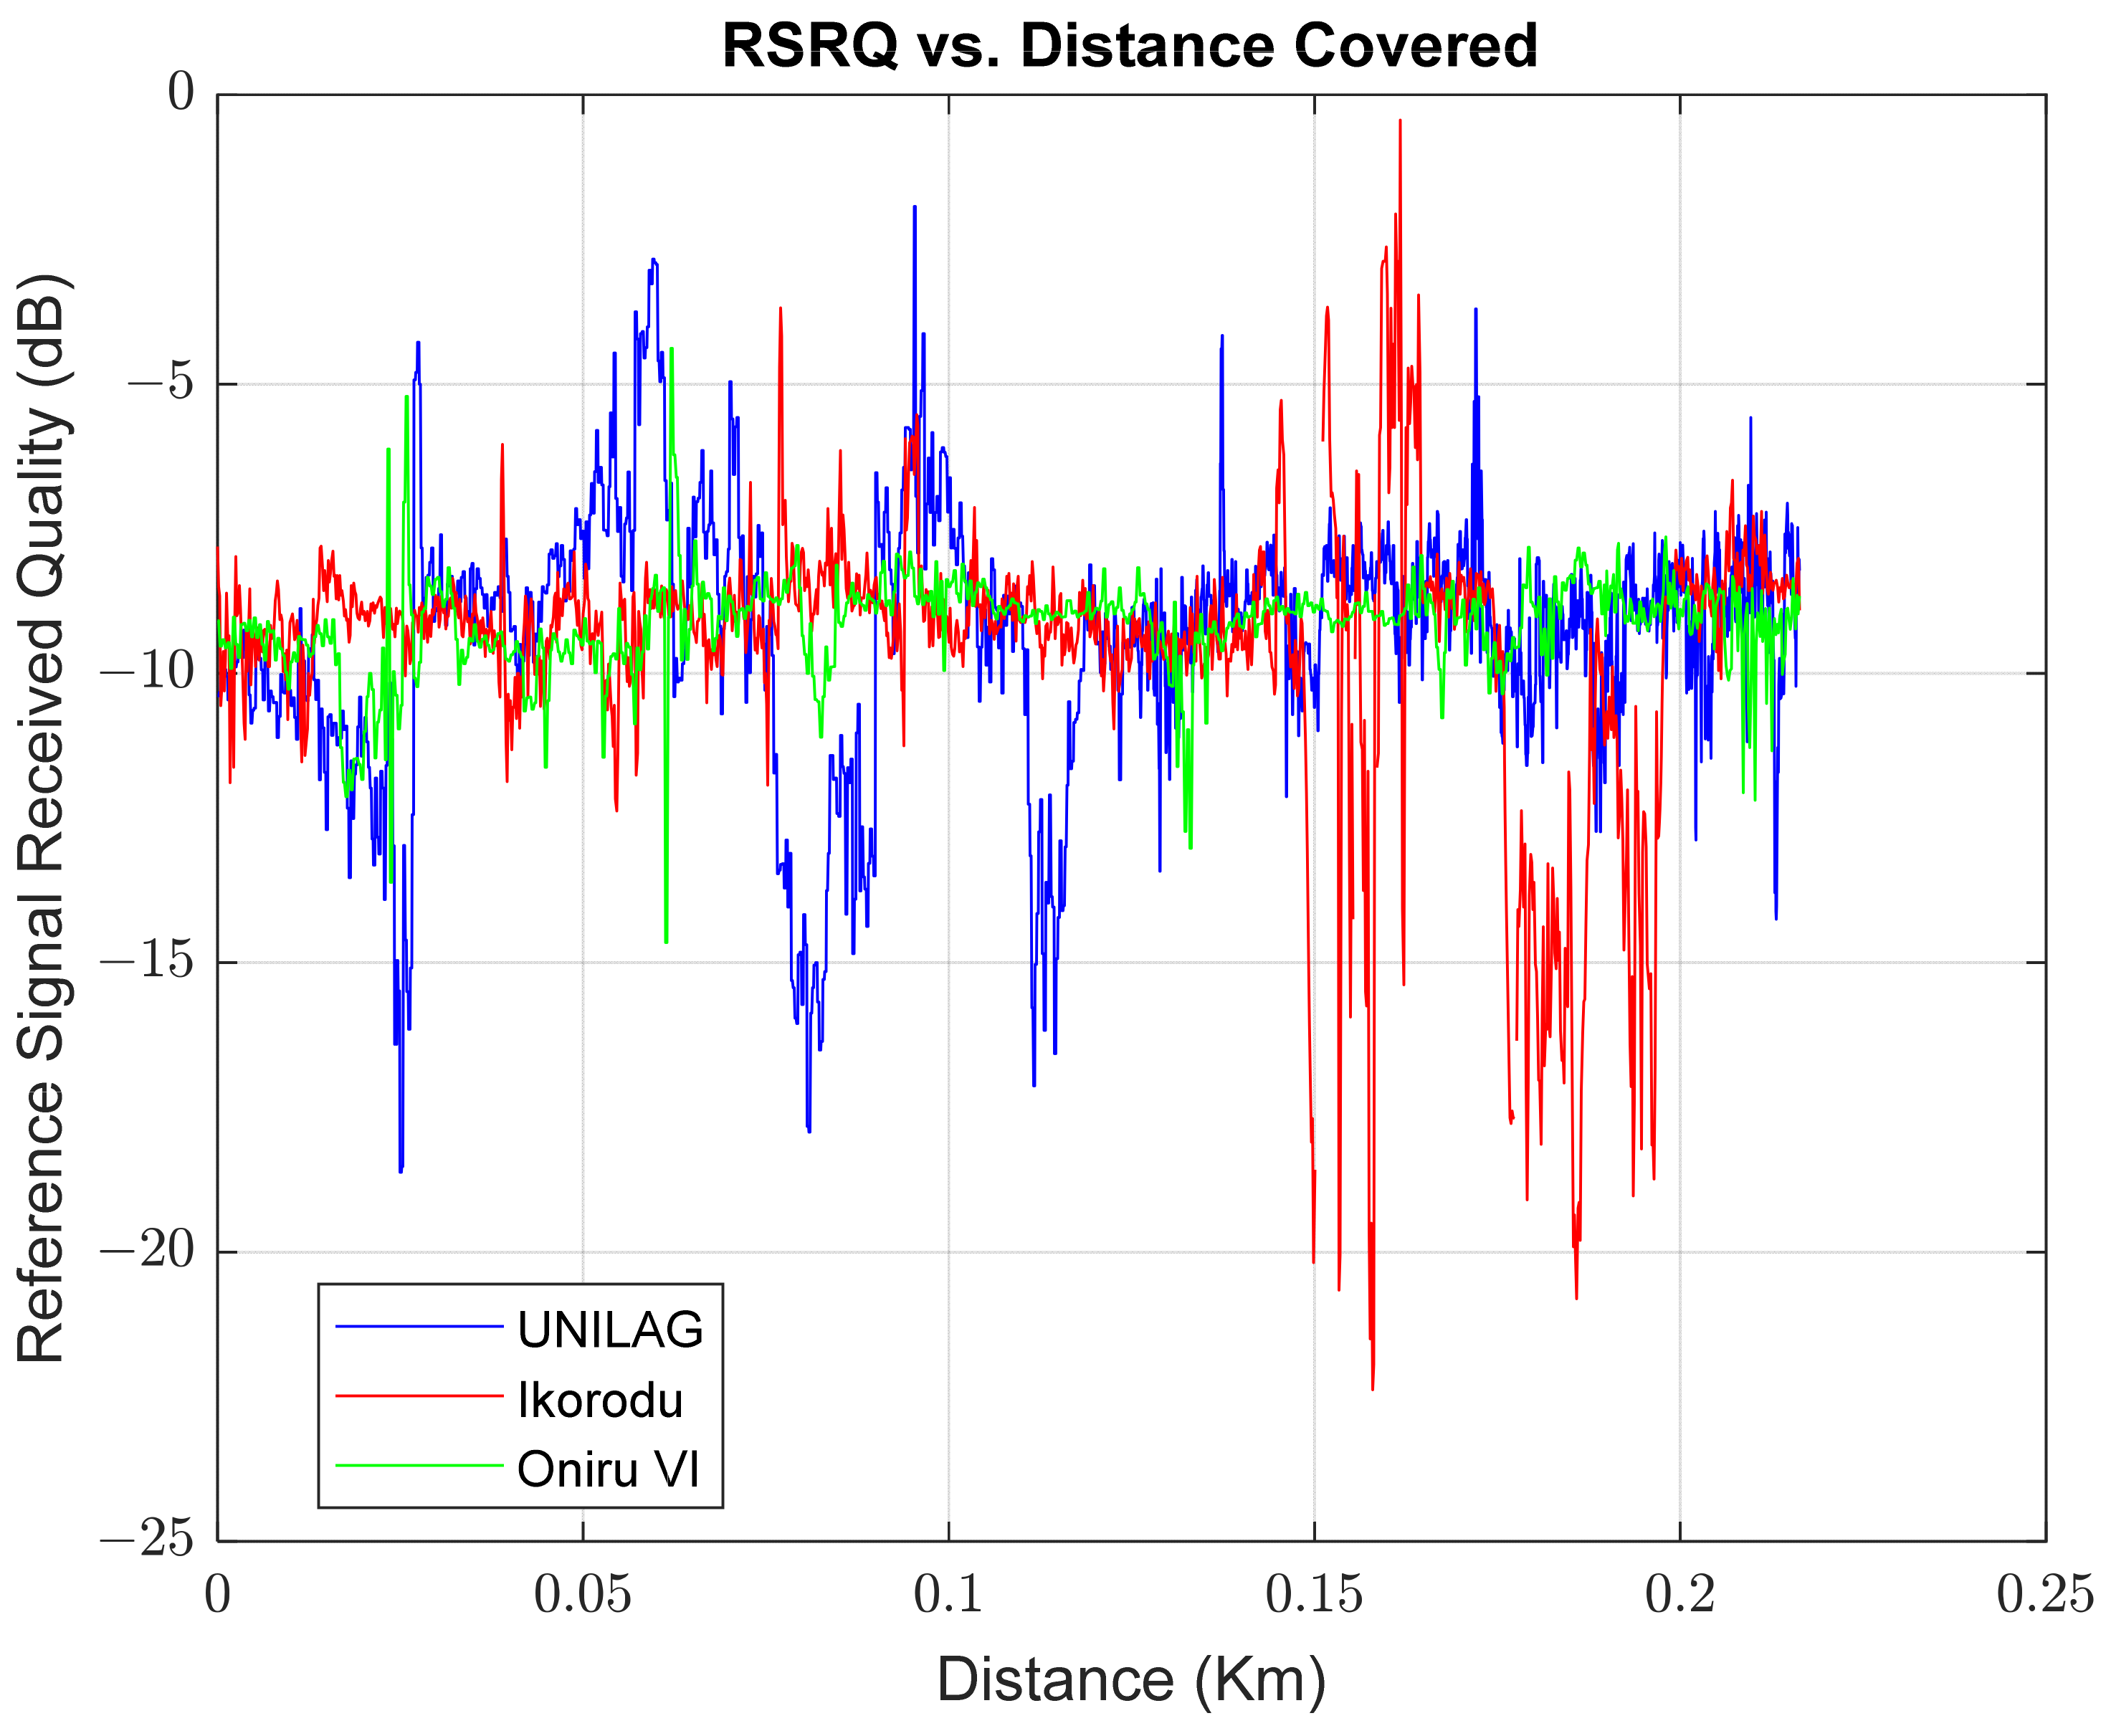
3.2.2. Reference Signal Received Quality

As stated earlier, the reference signal received quality (RSRQ) is a useful MBB metric used to examine cell reselection and handover. The relationship between the RSRQ and the RSRP can be seen in Equations (2) and (3). In terms of its application, in situations where the RSRP is not sufficient to determine the cell reselection and handover, the RSRQ must be used alongside the RSRP.
RSRQ = 10 log 10 N + RSRP dBm RSSI dBm
RSRQ   = N   ×   RSRP / RSSI
where N =   number   of   resource   blocks .

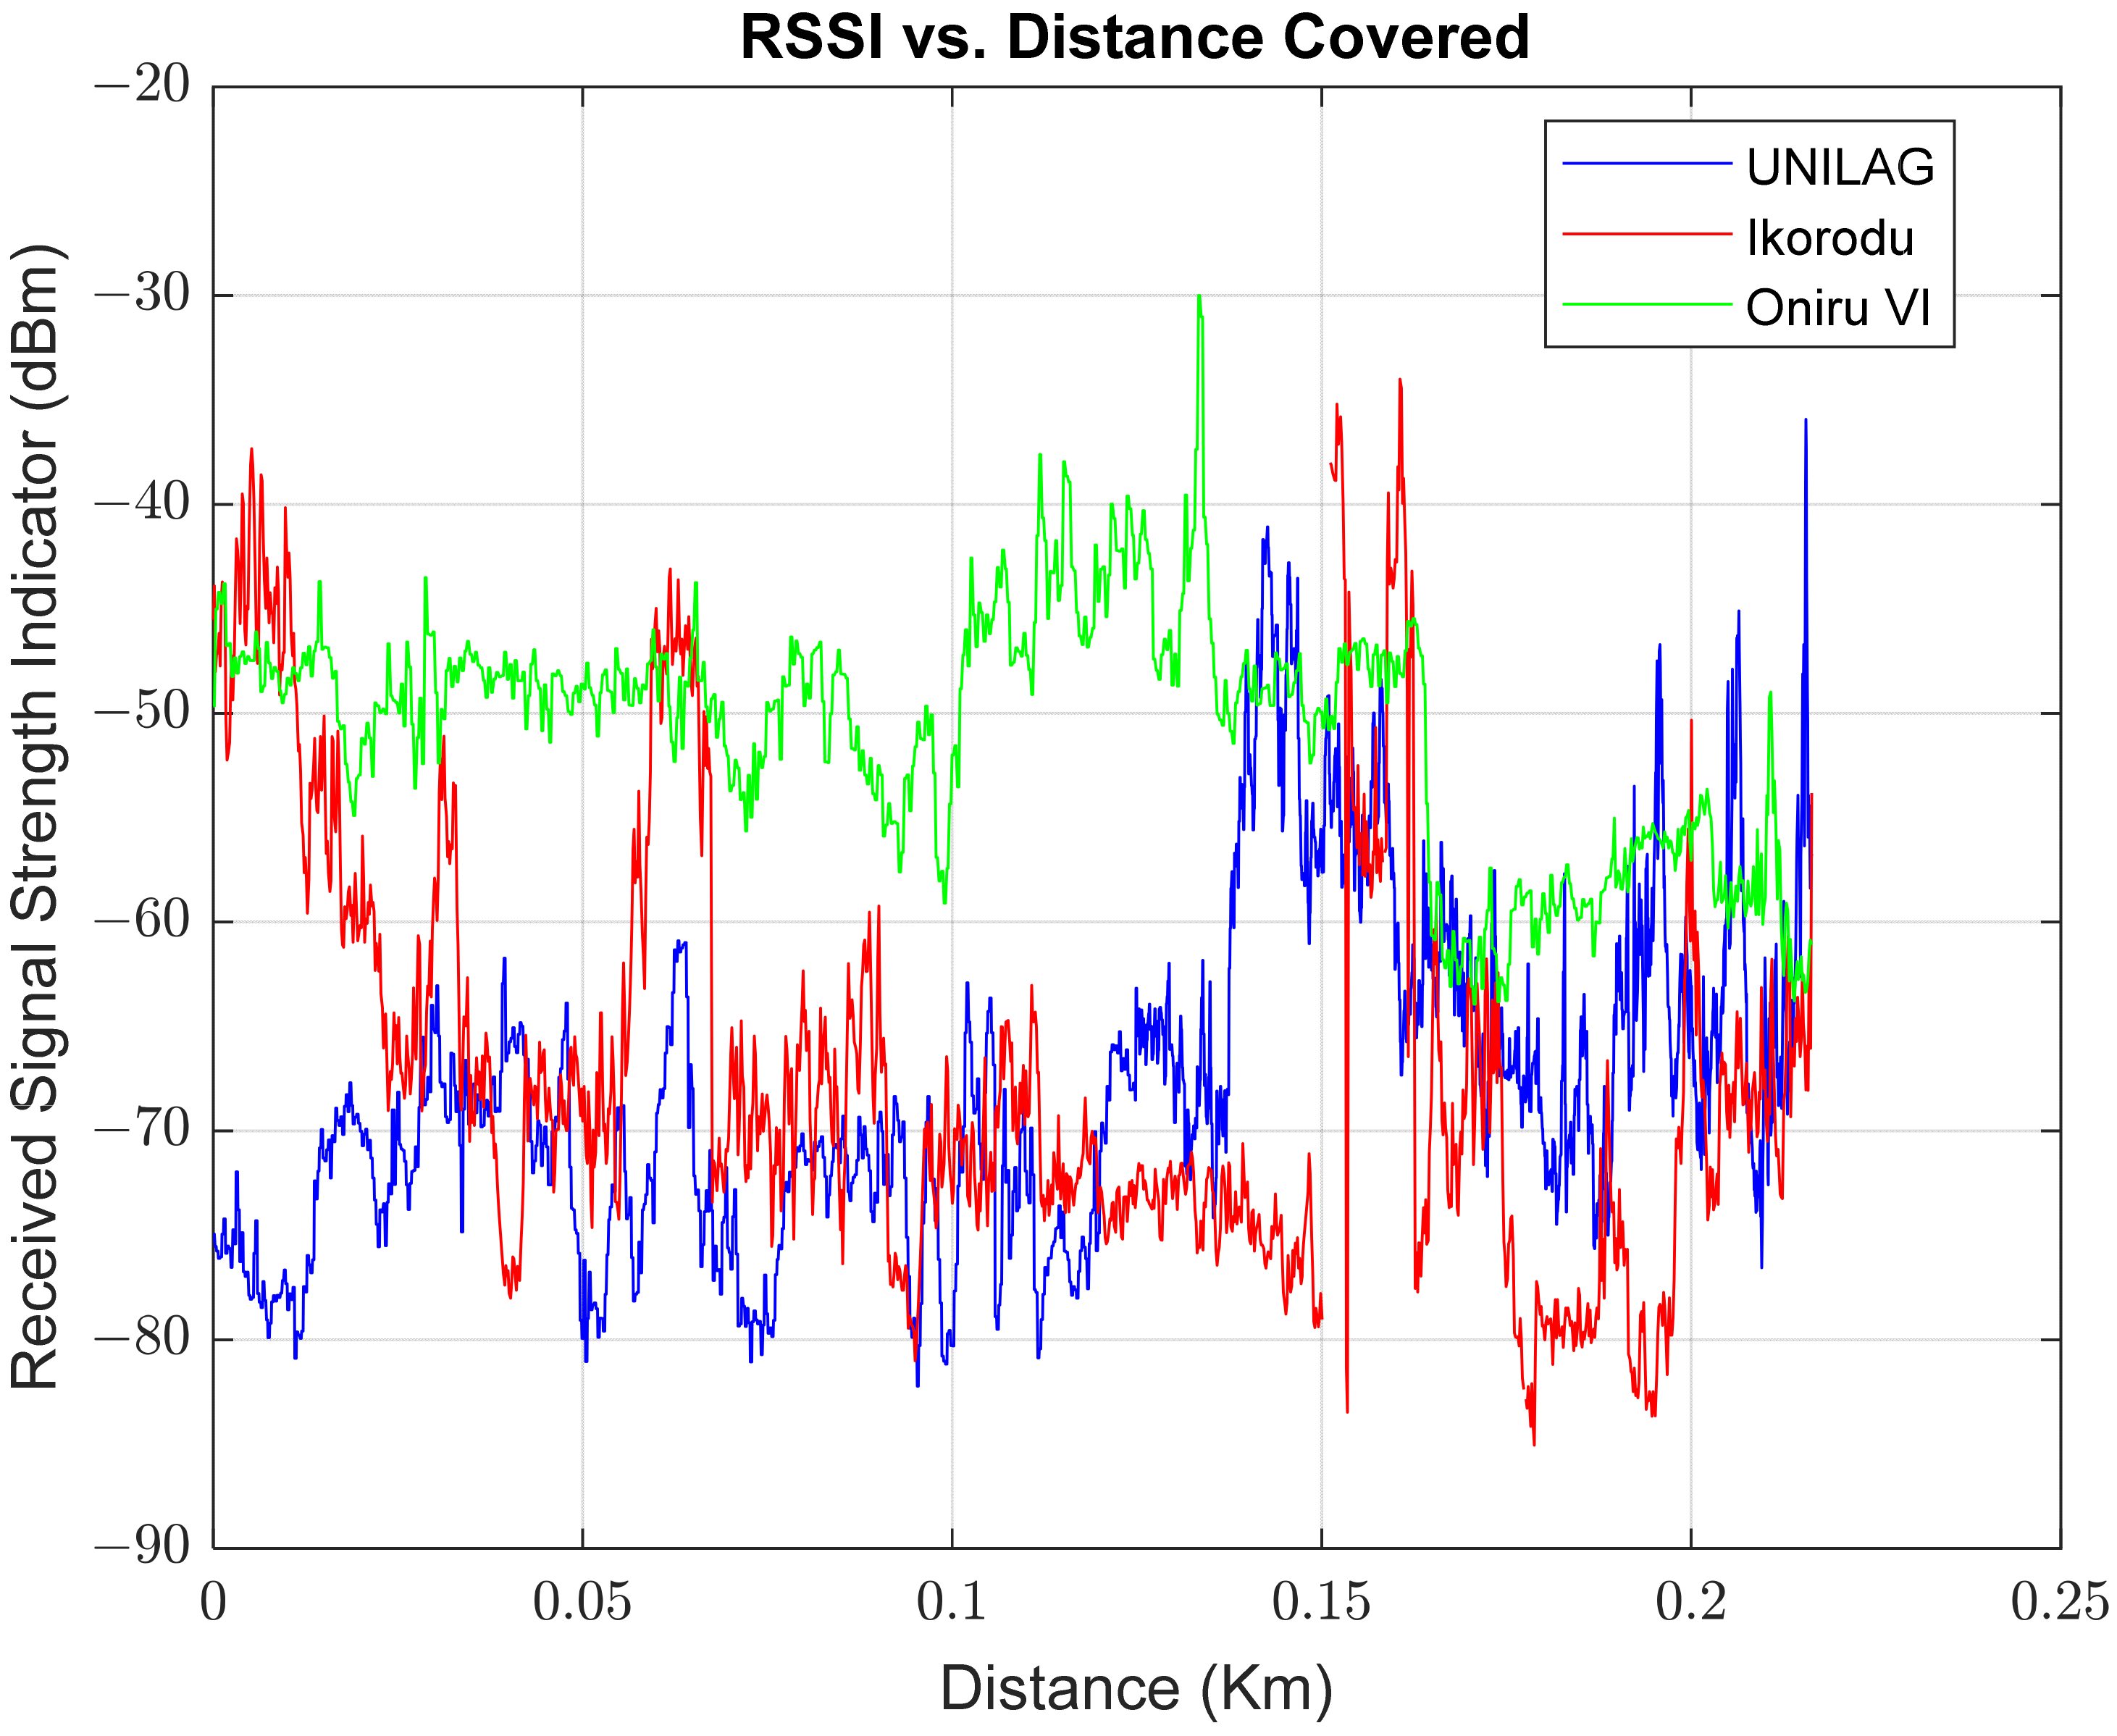
3.2.3. Received Signal Strength Indicator

Closely associated with the RSRP and the RSRQ is the received signal strength indicator (RSSI). According to Afroz et al. [39], the distinguishing factor here is that, unlike the RSRP, the RSSI is evaluated in orthogonal frequency division multiple (OFDM) symbols. These are obtained from the co-channel serving and non-serving cells, the thermal noise of the user’s device, and the adjacent channel interference. The RSSI can also be computed from Equation (2) when the RSRP and RSRQ are determined.

3.2.4. Signal-to-Noise plus Interference Ratio

The received signal comes with unwanted parts, which are not very useful to determine the user’s experience, nor do they paint an accurate picture of the signal sent by the MNO’s equipment. The signal-to-noise plus interference ratio (SINR) is a metric that captures this unwanted noise in the received signal and can be computed by the user’s equipment. Since the resource block (RB) is the property of the user’s device that is used to measure the SINR, the SINR becomes very important in predicting a modulation code scheme (MCS) that will guarantee a good throughput for the user to transmit data. A poor SINR measurement value on a user’s device translates into low throughput resulting from the lower-order MCS being applied to the signal. In general, low SINR values are associated with fewer bits per modulation symbol, resulting in low QoS for an MBB user. The SINR is captured mathematically in Equation (4):
SINR = P 0 1 n P I + N b
where
  • SINR   =   ratio   of   signal   to   interference   plus   noise   dB .
  • P r =   resource   block   reading   on   UE   for   received   signal   power .
  • P I =   neighboring   cell   interference   power   on   an   average .
  • N b =   background   noise   power .

3.2.5. Throughput

Evaluated based on Shannon’s law as a function of SINR and bandwidth, the measure of how fast data is transmitted over all resource blocks that a user is assigned is known as the throughput. It is location sensitive, as a user closer to the base station has a higher chance of getting more than a device far from the station. In maximum scheduling, the scheduler in the station (eNodeB) reports using the channel quality indicator (CQI) to get information about the user’s channel quality experience and uses this information to assign RB to the user terminals. The request for this information is usually sent by the user equipment (UE), as different equipment at the same location (or a similar distance away from the base station) can receive different resources due to the difference in the device used. In this study, the PCC PHY DL throughput and the PDCP DL throughput are recorded and analyzed.
With a major difference being the link being measured, the PCC PHY DL throughput and the PDCP DL throughput are quite similar, and both measure the rates of data delivery. While the PCC PHY DL throughput measures a physical link for the rate of successful data delivery in a 4G LTE network, the PDCP DL throughput is measured over a logical link. Although both measurements are in bits per second (bps), their purpose is different, as PCC PHY DL throughput presents a contextual mapping of the exact speed at which data is successfully delivered, while the PDCP DL throughput ensures, through a variety of protocols, that the data is properly transmitted by compressing and decompressing data, and sorting and interpreting the data transmitted.
It is widely believed that the throughput is sufficient to evaluate the network performance of an MNO [1]. Also known as data rate, the throughput of a network can efficiently evaluate the performance of two different user devices or MNOs in a test area. Greater bandwidth from an MNO can also result in higher data rates leading to a smoother user experience. Due to its level of relevance, many works in wireless network technologies use the throughput (data rate) as a major KPI. This wide adoption of the throughput is seen in [41,42].
Generally, the throughput is determined using Equation (5)
T = L S
where
  • T =   throughput ,
  • L =   slot   time   measure   of   payload   information   transmitted
  • S =   slot   time   length .
Equally important are the cell and user throughput denoted by T c e l l and T u s e r ; they describe the data rates available per cell and user, respectively. While they describe similar concepts for the cell and the user, they depend on widely different factors. These dependencies are represented in Equations (6) and (7) for the cell and user throughput, respectively.
T c e l l = 0 15 S 0.002 × N + N i  
T u s e r = 0 15 S 0.002 × 0 15 N b u f f
where
  • T c e l l =   cell   throughput
  • T u s e r =   user   throughput
  • S = sum   of   acknowledged   data   scheduled   every   2   ms .
  • N = sub   frames   obtained   every   2   ms .
  • N i = all   subframes   without   pending   user   data .
  • N b u f f = user   buffers   scheduled   for   every   2   ms   sub frame .

3.3. Drive Test Procedure

The drive test procedure involved a test vehicle where the test equipment was installed. The setup was comprised of a GPS, a computer, and a terminal station. An average speed of 30 km/h was maintained to simulate traffic conditions. A terminal connection was established using the 4G LTE-compatible Huawei Modem E392. Upon a successful connection, the download of five files totaling 20 GB was initiated. Whenever the connection dropped, the simultaneous download was continued once the network was restored. Also important is adherence to the planned cluster during the drive test. All measured data from the different sites were then saved in appropriately named csv files and exported to MATLAB for analysis and optimization.

3.4. Measurement Parameters

While the performance metrics are important, equally relevant to the success and consistency of this study are the parameters against which the network values are measured. Lagos is an urban city, and the areas of Lagos are considered to have certain parameters in common. These parameters include the average distance between buildings (20 m) and the 10 m street width. Additionally, the operating frequency, working height of the transmitter, and the receiver to transmitting antennae distance were 1876.6 MHz, 30 m, and 1 km, respectively. Table 2 shows the measurement parameters and their corresponding values.

3.5. Optimization Algorithm

Presented in Algorithm 1 is a representation of the general PSO algorithm. It shows a roadmap to the execution of the algorithm. It can be modified to suit specific problems with objective functions that set relevant variables defining the problem to be solved. PSO adopts an interconnected swarm where every particle is aware of the states of the positions visited by other particles in the swarm. Equations (8) and (9) describe the position and velocity of the individual particles in the swarm.
At every iteration, the position and velocities of each particle are updated, giving every particle a sense of the current position and velocity and, thus, the global best position and velocity of the swarm.
x i , d   i t + 1 = x i , d i t + v i , d i t + 1
v i , d   i t + 1 = v i , d i t + C 1 × R n d 0 ,   1 × p b i , d i t x i , d i t + C 2 × R n d 0 ,   1 × g b d i t x i , d i t  
where
  • i = particle’s index, specifying the particle to be examined;
  • d = dimension being considered, each particle has a position and a velocity for each dimension;
  • i t = describes the iteration number of the process;
  • x i , d = position of the ith particle in dimension d ;
  • v i , d = velocity of the ith particle in dimension d ;
  • C 1 = constant for the cognitive acceleration component;
  • R n d = stochastic component of the algorithm, a random value between 0 and 1;
  • p b i , d = a location in dimension d that intercepts with the best locations in the dimension of particle i ;
  • C 2 = constant for the cognitive and social components;
  • g b d = a location in dimension d that intercepts with the visited locations in the dimension of all the particles.
Algorithm 1: PSO algorithm with the objective function, the upper and lower bound for obtaining the global and personal best positions and velocities of a swarm
Input:     i : particle’s index, specifying the particle to be examined
     d : dimension being considered
     i t : describes the iteration number of the process
     x i : position of the ith particle in dimension d
     v i : velocity of the ith particle in dimension d
     c 1 : constant for the cognitive acceleration component
     c 2 : stochastic component of the algorithm
     p b e s t , i : a location in dimension d that intercepts with the best locations in the dimension of the particle i
     c b e s t : constant for the cognitive, and social component
     g b e s t : a location in dimension d that intercepts with the visited locations in the dimension of all the particles
    t: time of iteration
Output :   g b e s t o p t : Optimized global best positions
      p b e s t o p t : Optimized personal best positions
    1.  START
    2.  % Initialize the swarm
    3.  for i = 1 to Population size do
    4.     % Populate the swarm
    5.      x i   = random initialization within bounds
    6.      v i = random initialization within bounds
    7.     
    8.     % Ensure all particles are within the sample size
    9.      if   x i   > max permissible limit
    10.       x i   = max permissible limit
    11.     else   if   x i   < min permissible limit
    12.       x i   = min permissible limit
    13.    end if
    14.    
    15.    % Evaluate the objective function for the current position
    16.     f i = objective   function   ( x i )
    17.    
    18.    % Initialize the personal best for each particle
    19.     p b e s t i = x i
    20.     f p b e s t i = f i
    21.    % Update the global best if the current particle is better
    22.     if   f i   <   f g b e s t
    23.       g b e s t = x i
    24.       f g b e s t   = f i
    25.    end if
    26. end for
    27.       
    28. % Perform PSO iterations
    29. for it = 1 to Max iterations do
    30.    for i = 1 to Population size do
    31.      % Update the velocity and position of each particle
    32.       v i = w   ×   v i + c 1   ×     r a n d ( )   ×   ( p b e s t i x i ) + c 2   ×   r a n d ( )   ×   ( g b e s t x i )
    33.       x i   = x i   + v i
    34.      
    35.      % Check that optimized results are within max and min permissible limits
    36.       if   x i   > max permissible limit
    37.        x i   = max permissible limit
    38.      else if   x i   < min permissible limit
    39.        x i   = min permissible limit
    40.      end if
    41.      
    42.      % Evaluate the objective function for the new position
    43.       f i = objective   function   ( x i )
    44.      
    45.      % Update the personal best if the new position is better
    46.       if   f i < f_pbest_i
    47.        p b e s t i = x i
    48.        f p b e s t i     = f i
    49.      end if
    50.      
    51.      % Update the global best if the new position is better
    52.       if   f i   <   f g b e s t
    53.        g b e s t = x i
    54.        f g b e s t = f i
    55.      end if
    56.    end for
    57. end for
    58. 
    59. % Output the optimized global and personal best positions
    60.  g b e s t o p t = g b e s t
    61.  p b e s t o p t = p b e s t i
    62. STOP

4. Results and Discussions

An analysis of the existing performance parameters based on statistical functions and swarm intelligence was executed. In order to ensure that the network is providing a high-quality user experience, the network KPIs being considered are analyzed by the use of MATLAB to check for their consistency with national and international specifications. All the measurements from the three areas were tabulated and detailed in comma-separated values (csv). During the analysis, a fraction of the data collected was missing. In the bid to execute efficient analysis, it is common for researchers to attempt replacing missing data using the piecewise cubic Hermite interpolating polynomial (PCHIP) algorithm and other error analysis techniques. In this analysis, care is taken to ensure that the data is used as obtained to avoid wide disparity between the original results and possible alterations made during the analytical process of introducing approximated block values into the entire process.

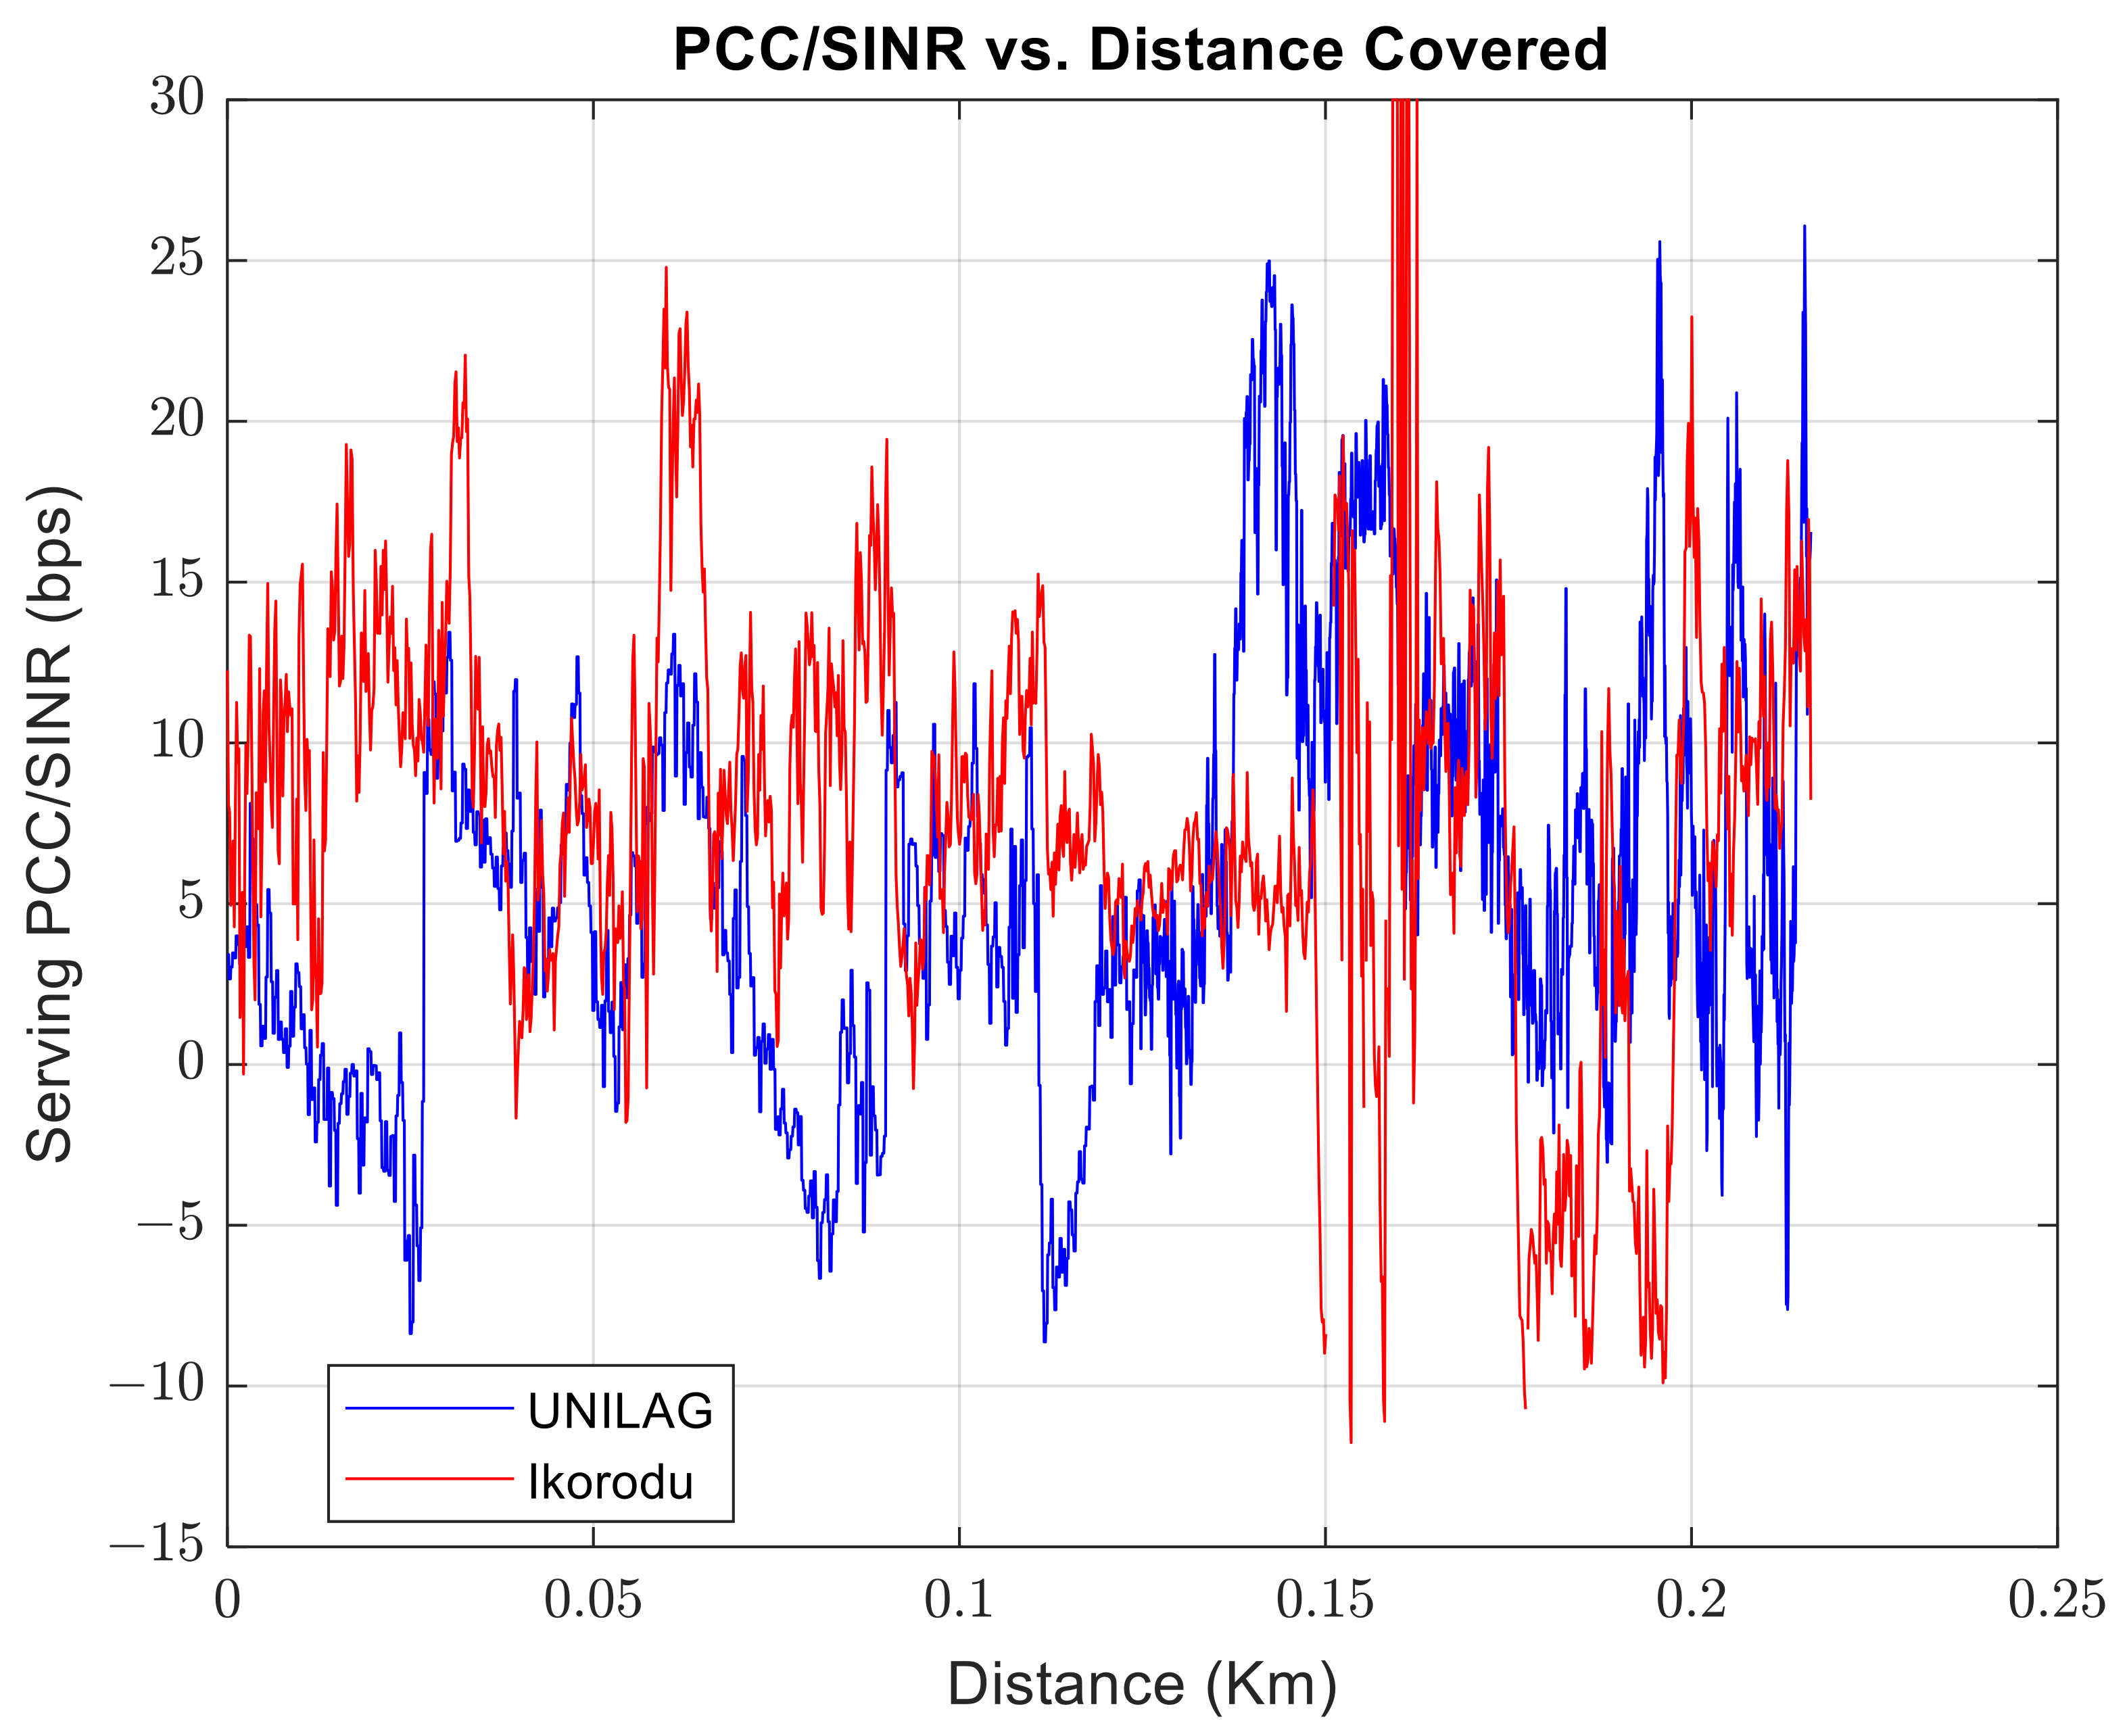
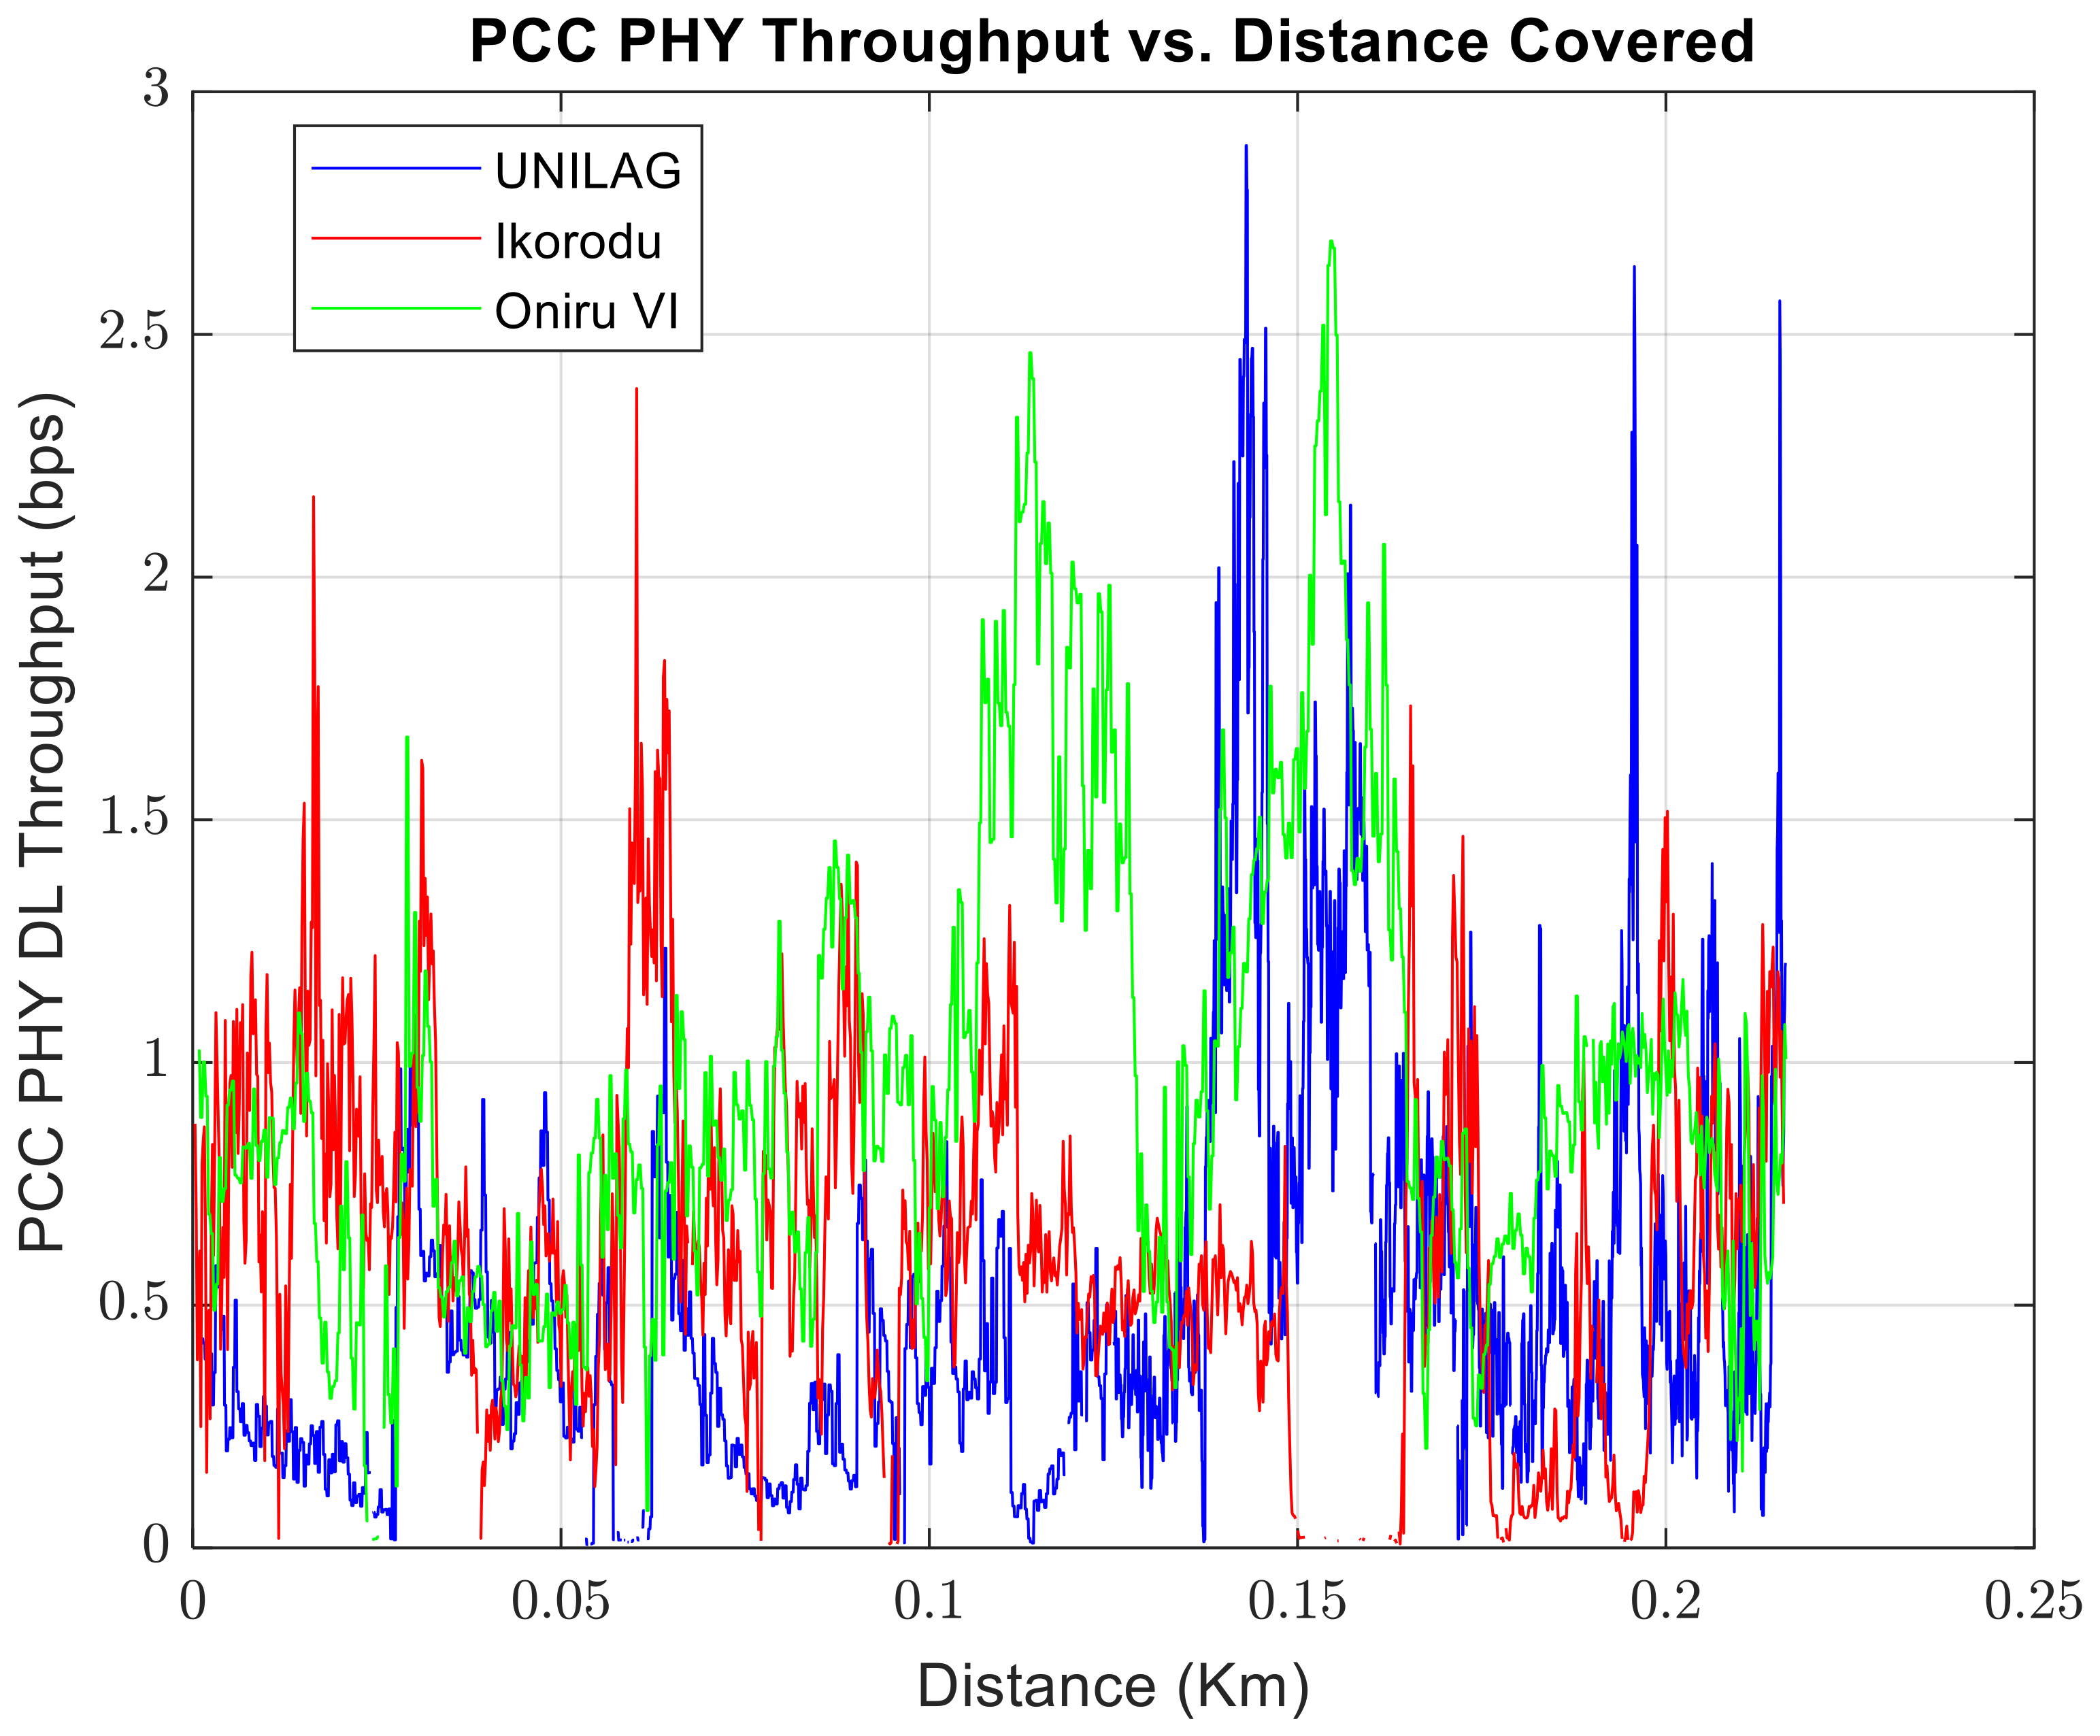
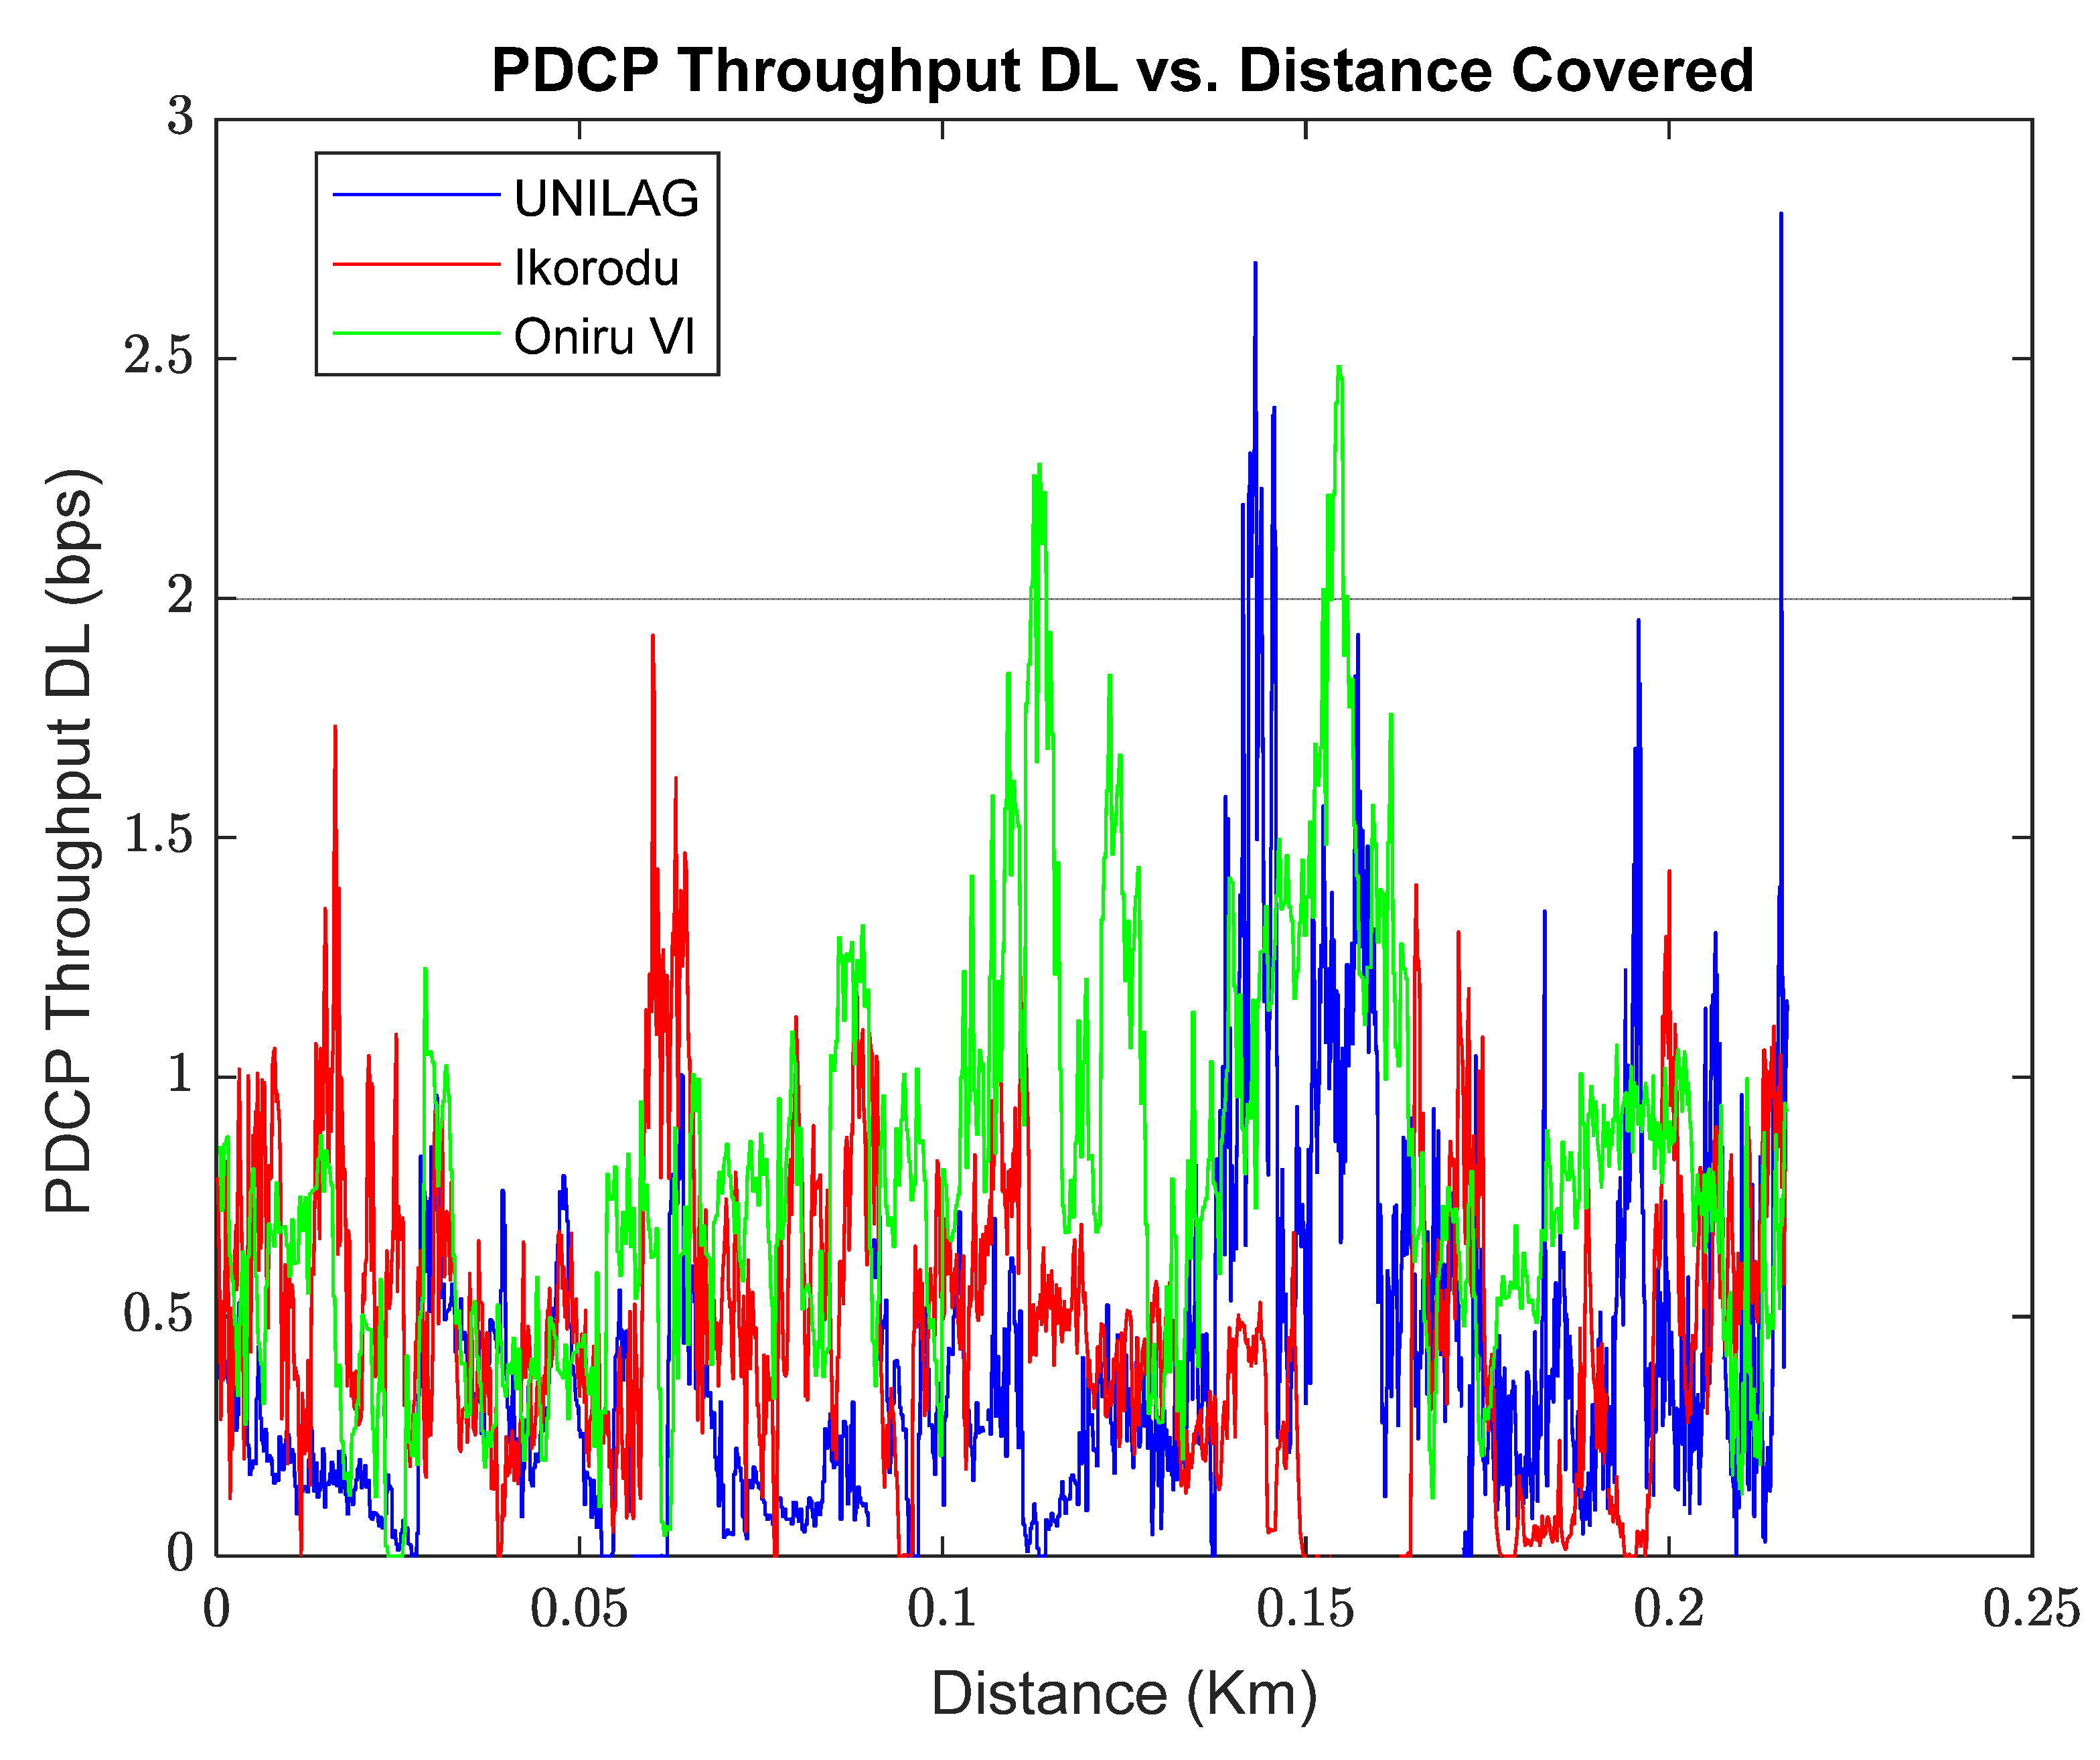
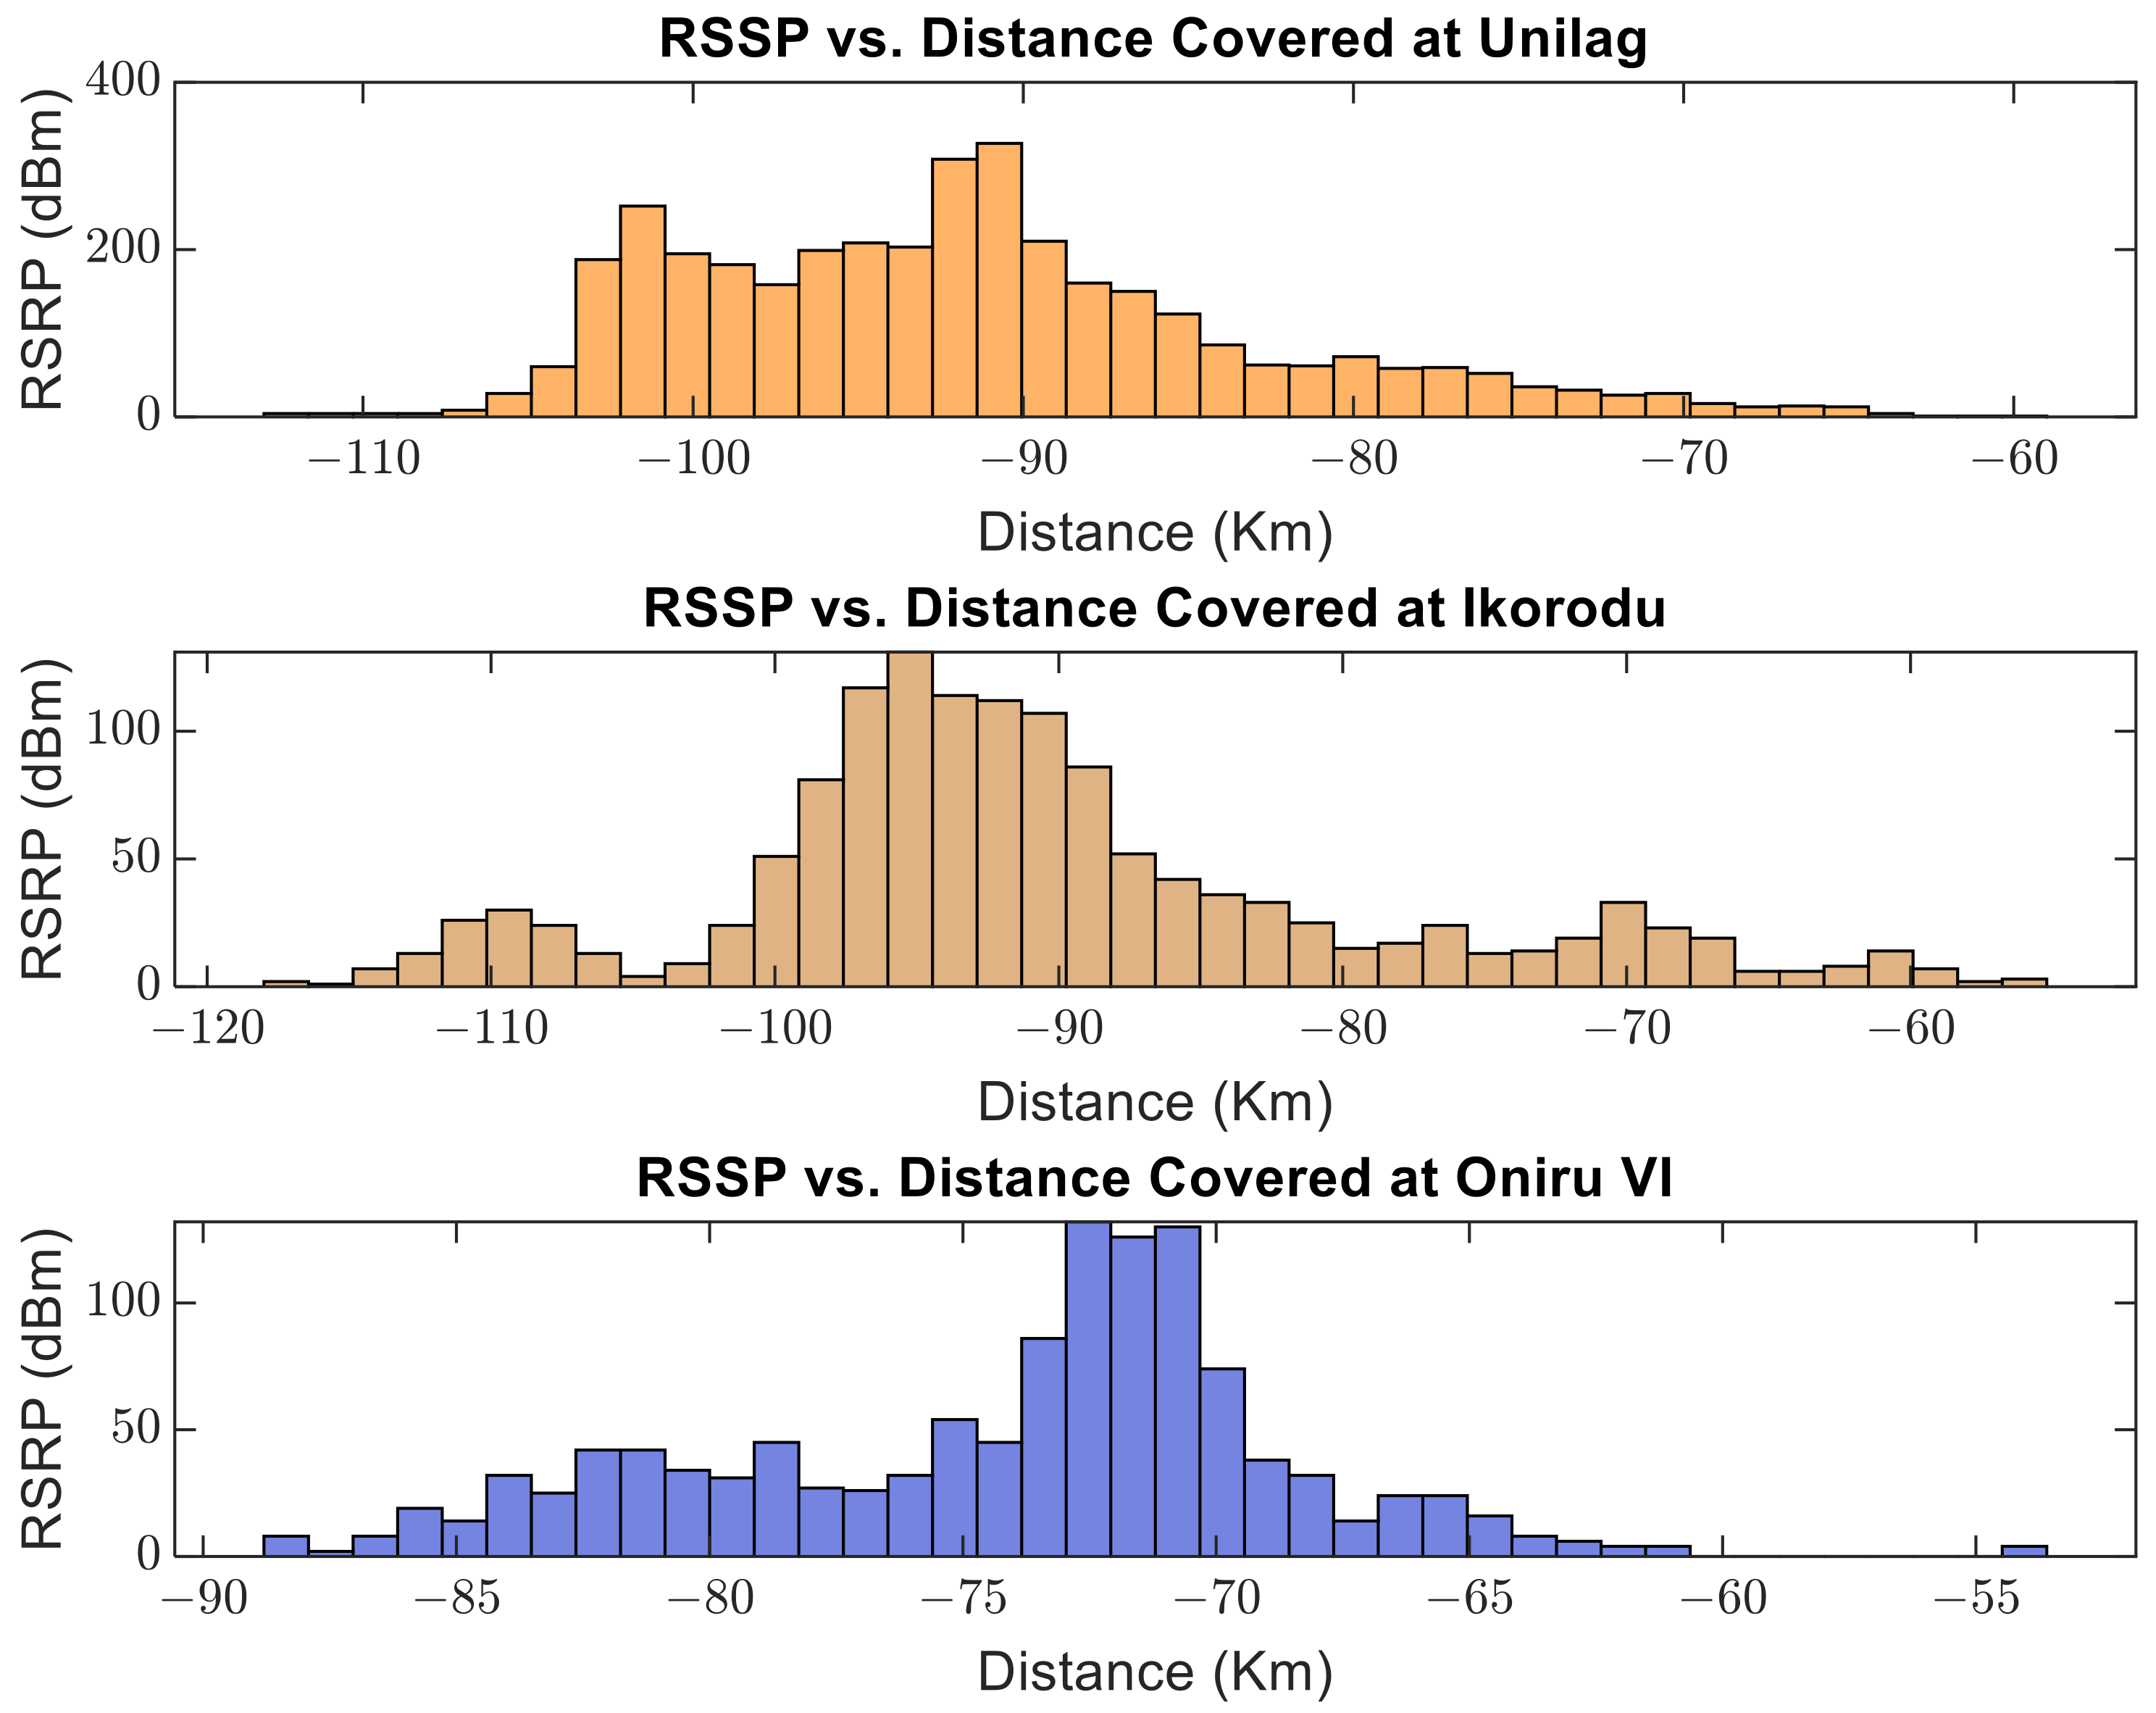
4.1. Extensive 4G LTE Mapping and Signal Performance Measurement

The network mapping and performance at the three locations are presented in Figure 2, Figure 3, Figure 4, Figure 5, Figure 6 and Figure 7. In an attempt to compare signal strengths across the different metrics used, the performance at each location for the metrics has been set side by side. Figure 2 compares the received signal received power (RSRP) performance for UNILAG, Ikorodu, and Oniru VI. A similar comparison approach is adopted in Figure 3, Figure 4, Figure 5, Figure 6 and Figure 7. Figure 3 shows the reference signal received quality (RSRQ) monitoring and comparison for the three locations. Figure 4 depicts the received signal strength indicator (RSSI) coverage in three locations and shows how the three locations vary in signal strength. Figure 5 shows the ratio of the packet component carrier (PCC) to the signal-to-noise ratio (SINR) for each location. This is a good indicator of the stability of the signals and the download speeds obtainable in the locations. Figure 6 and Figure 7 show the speeds as well as the efficiency of the network for physical and logical links.

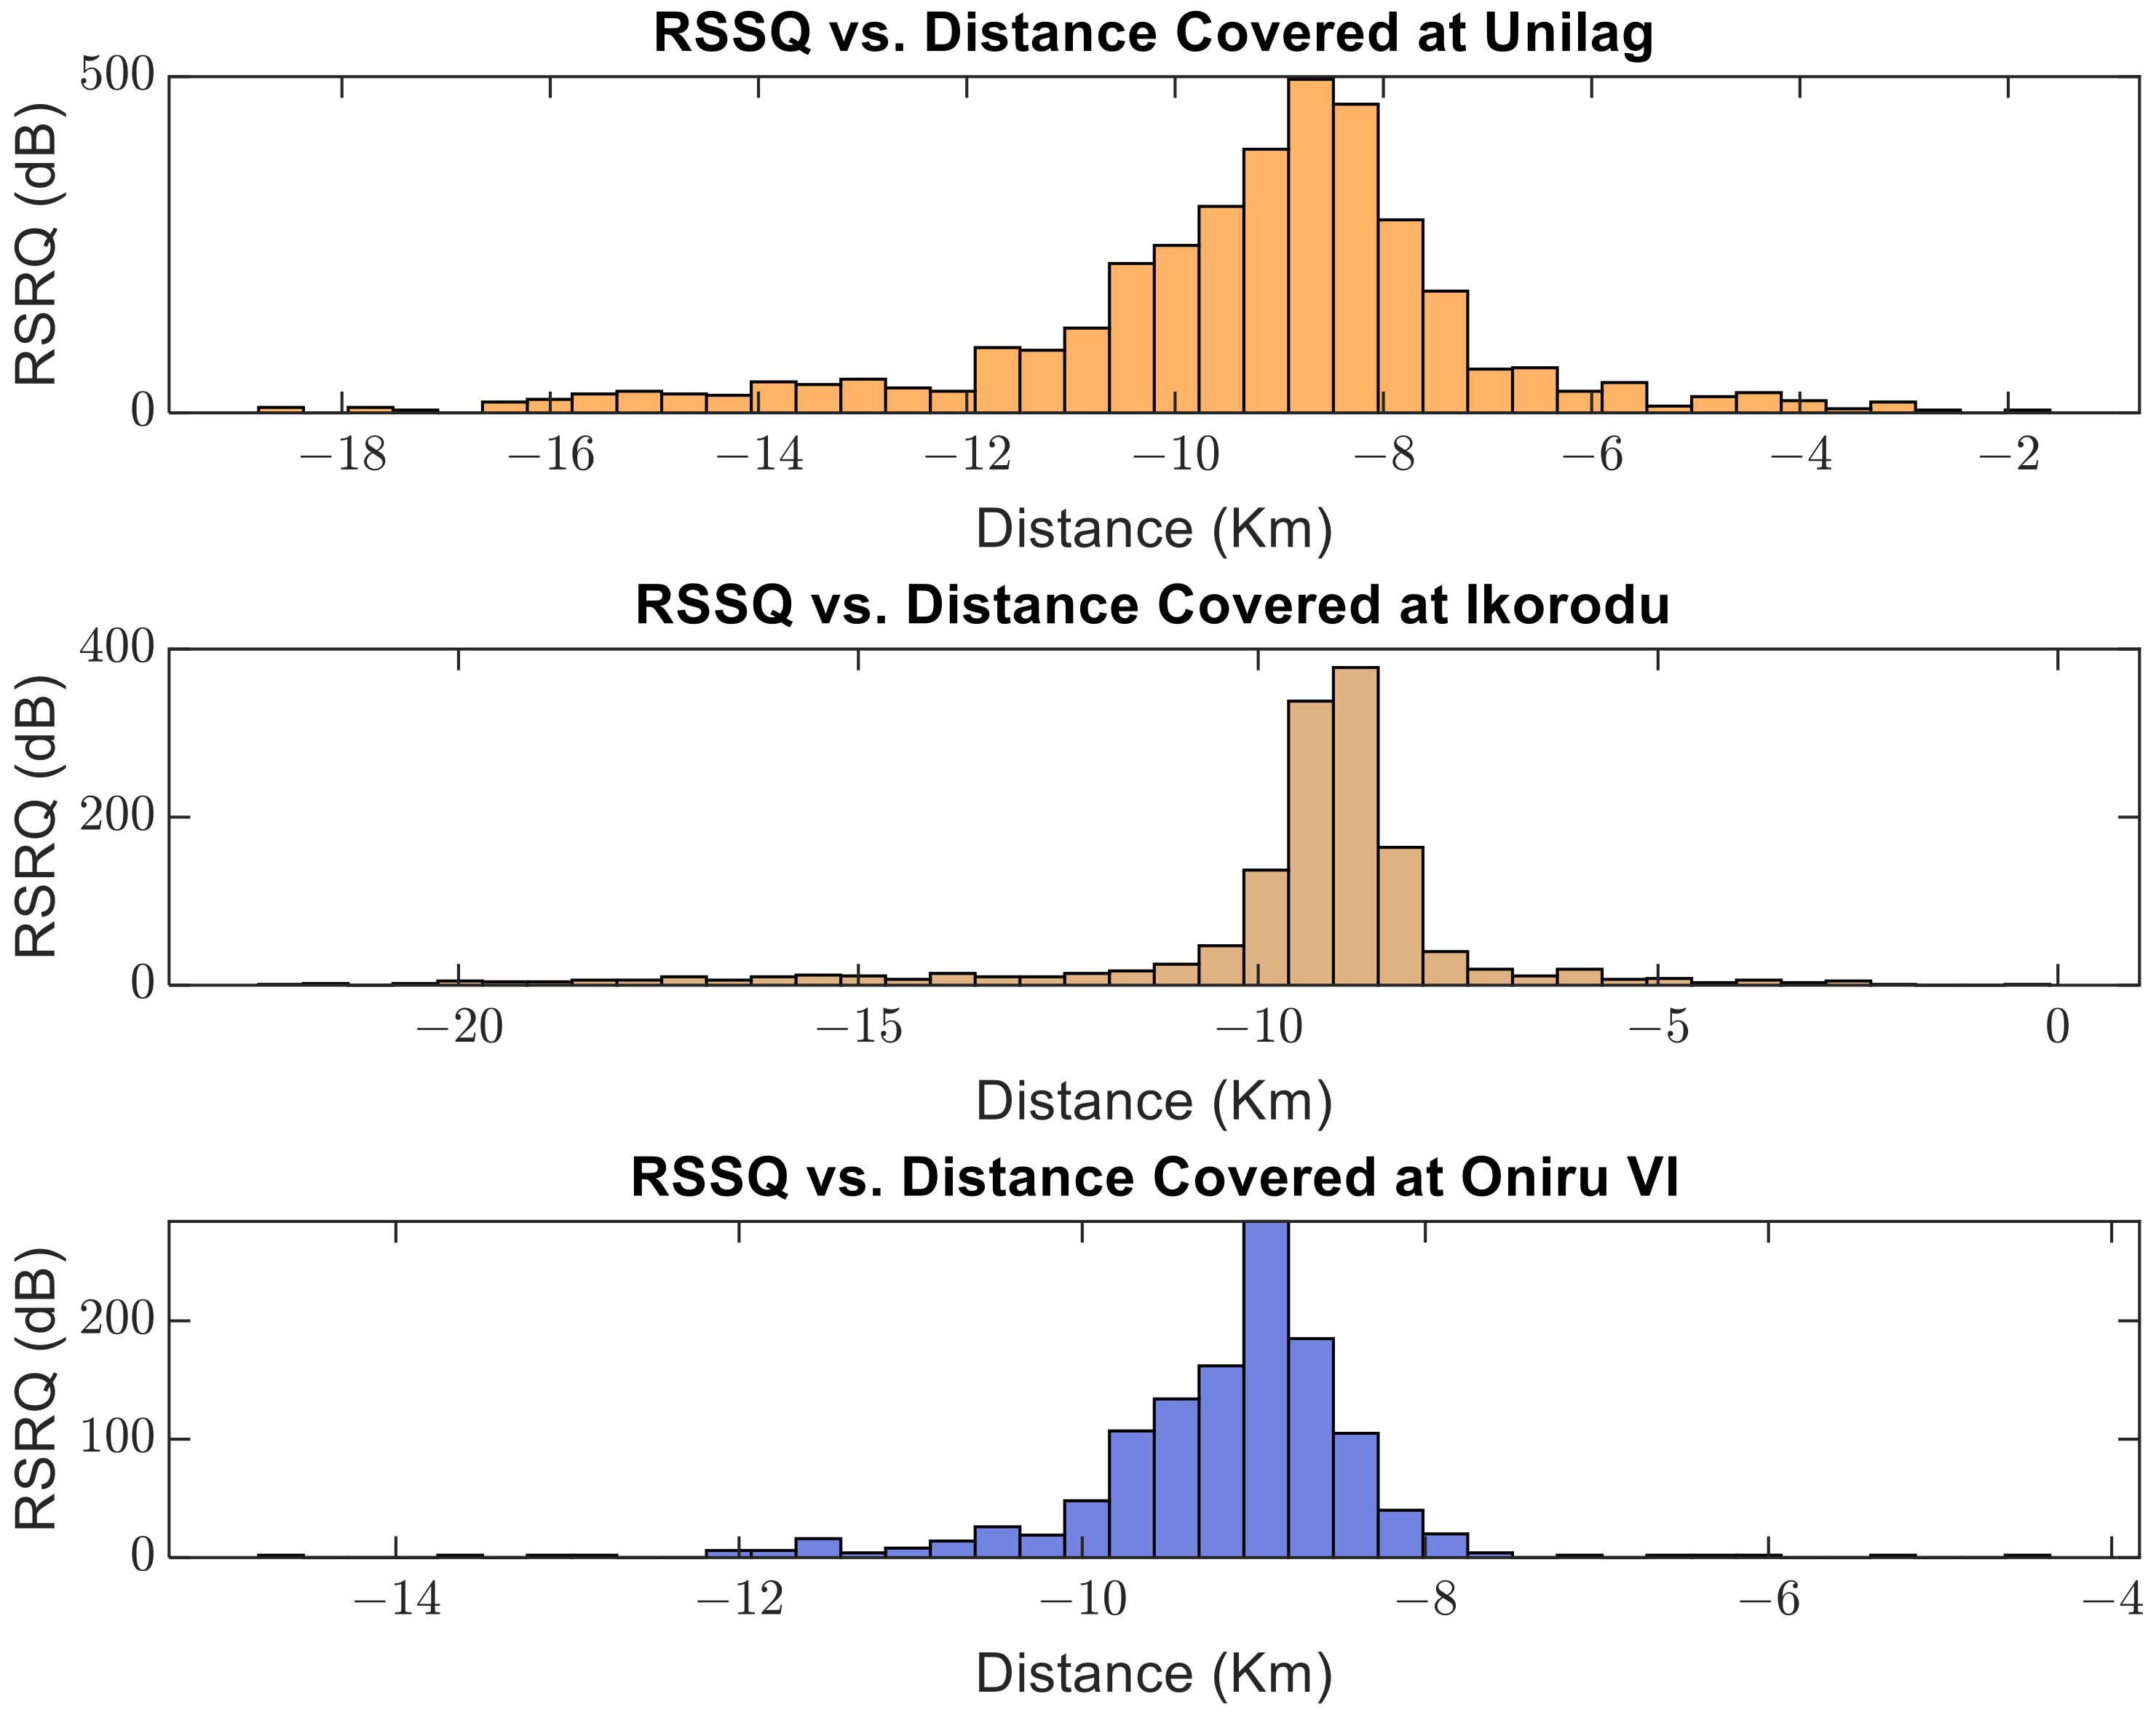
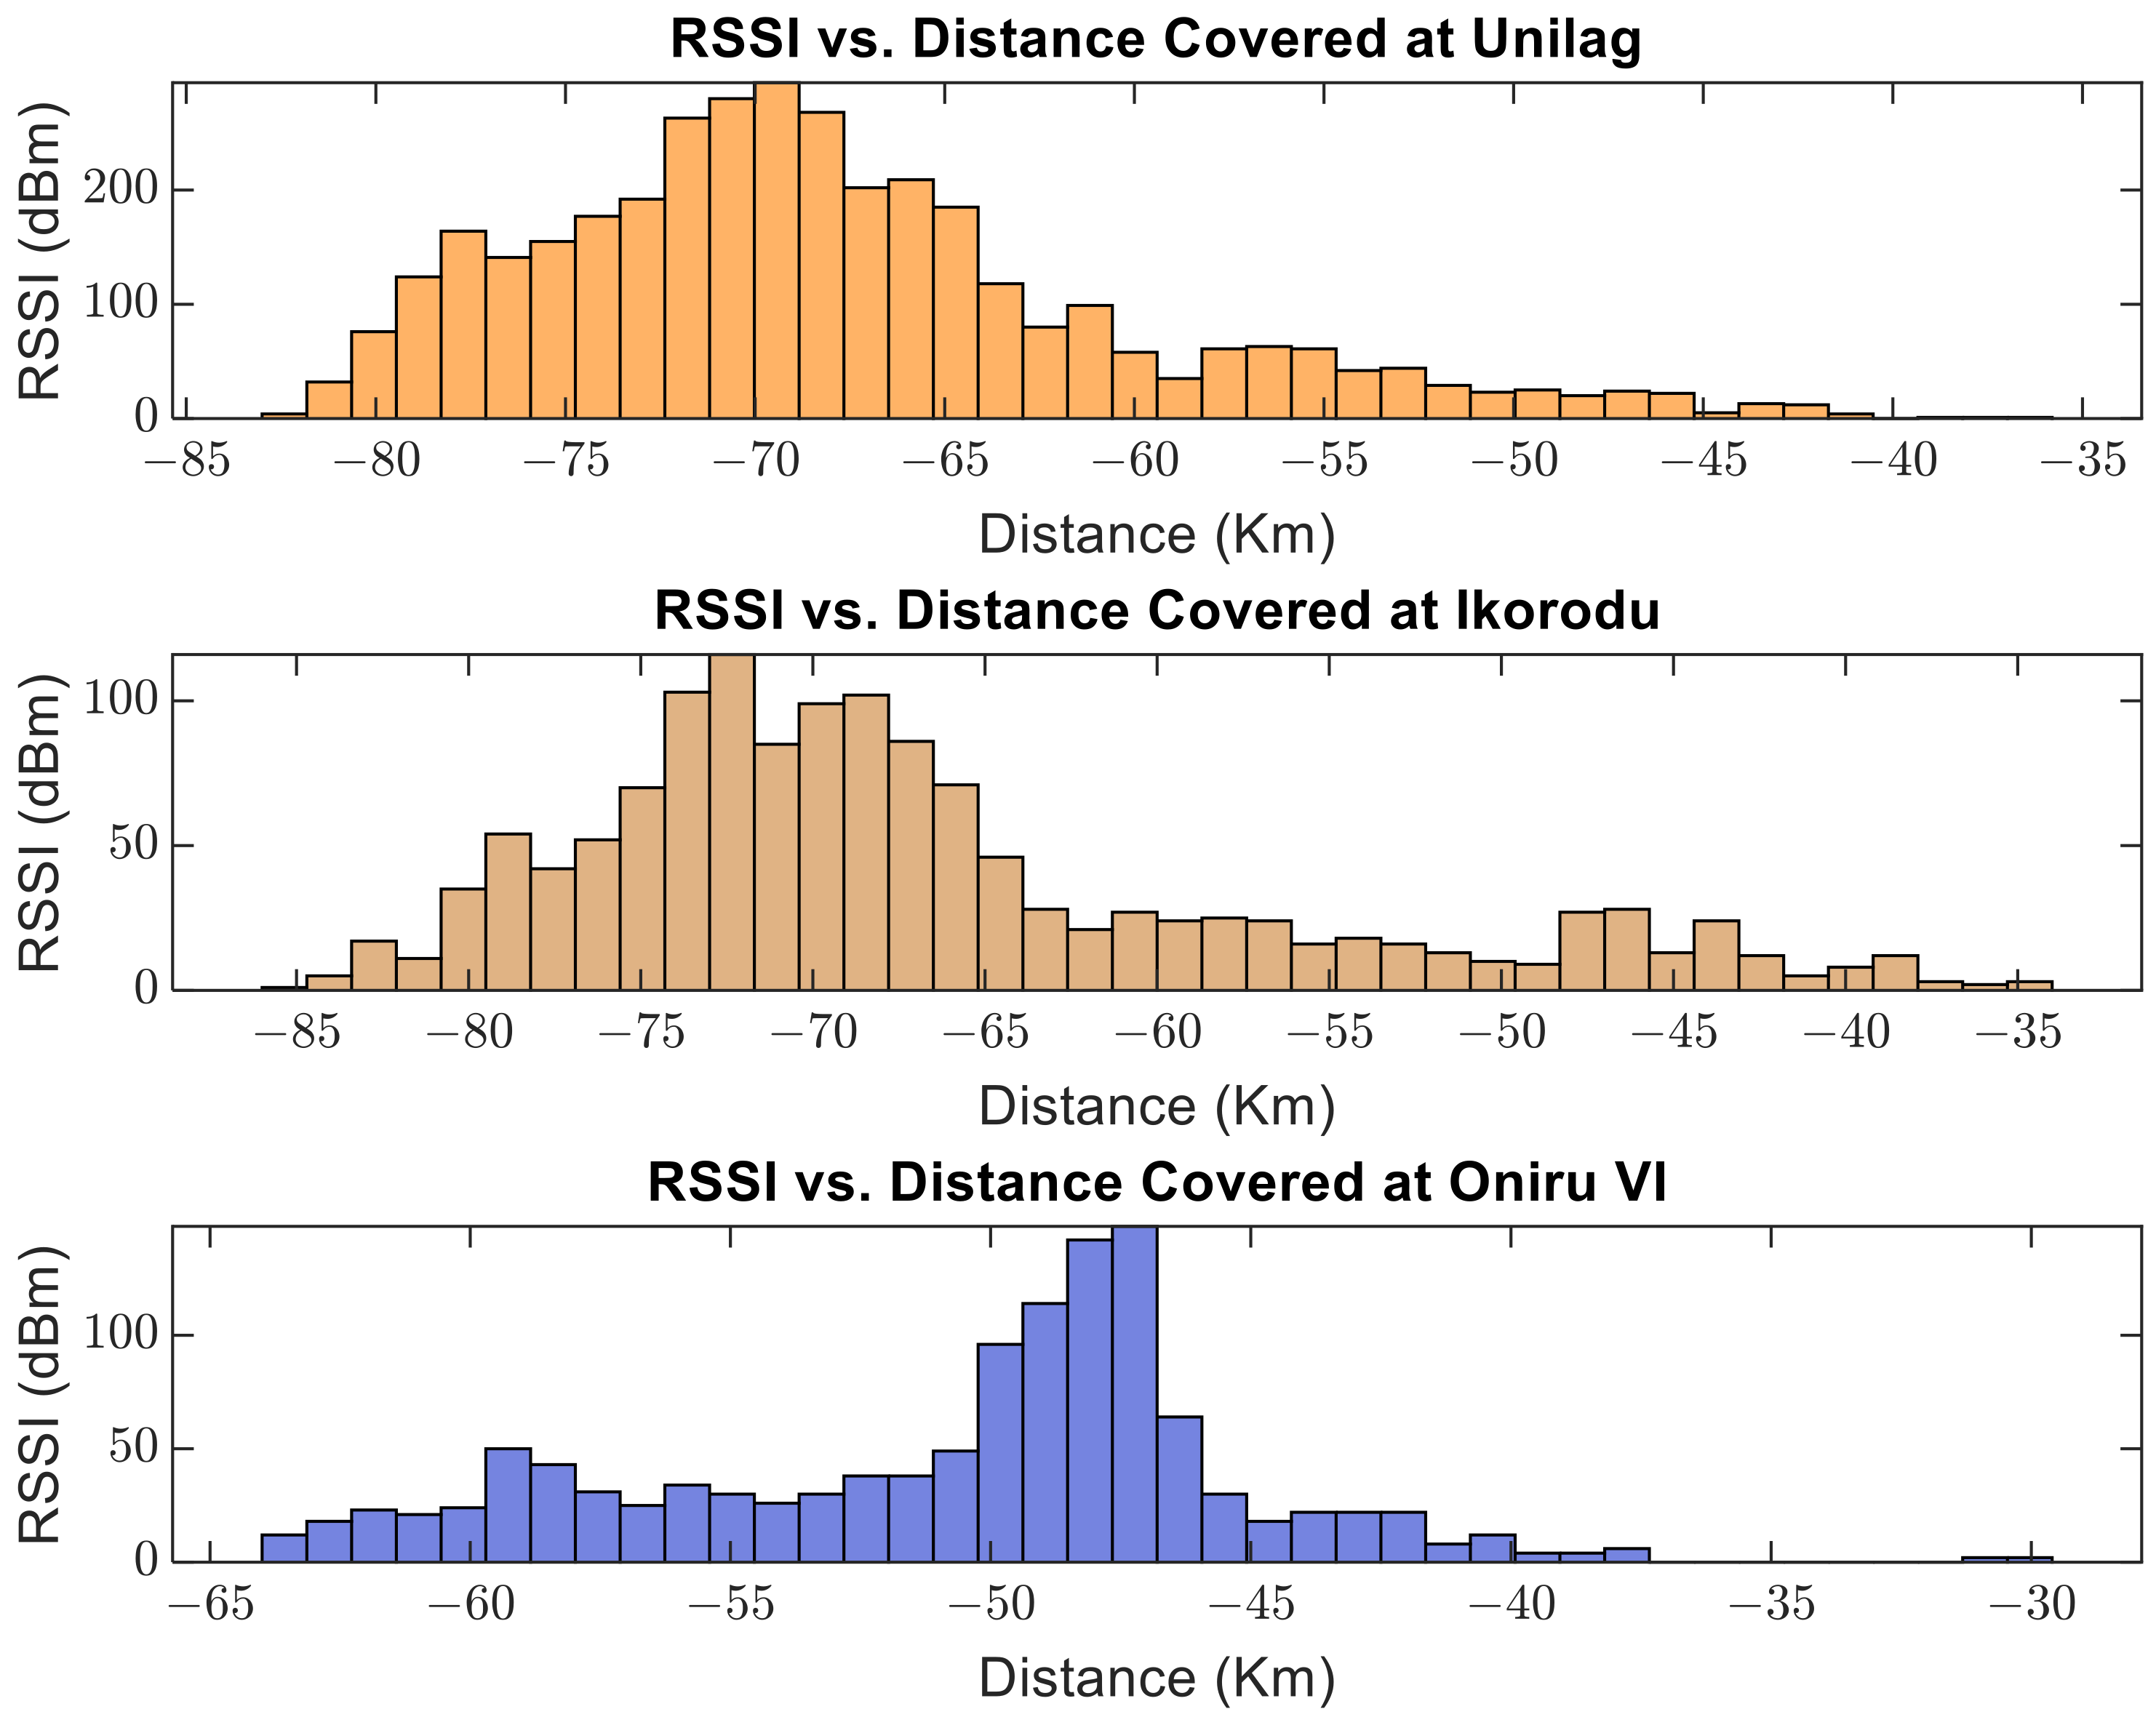
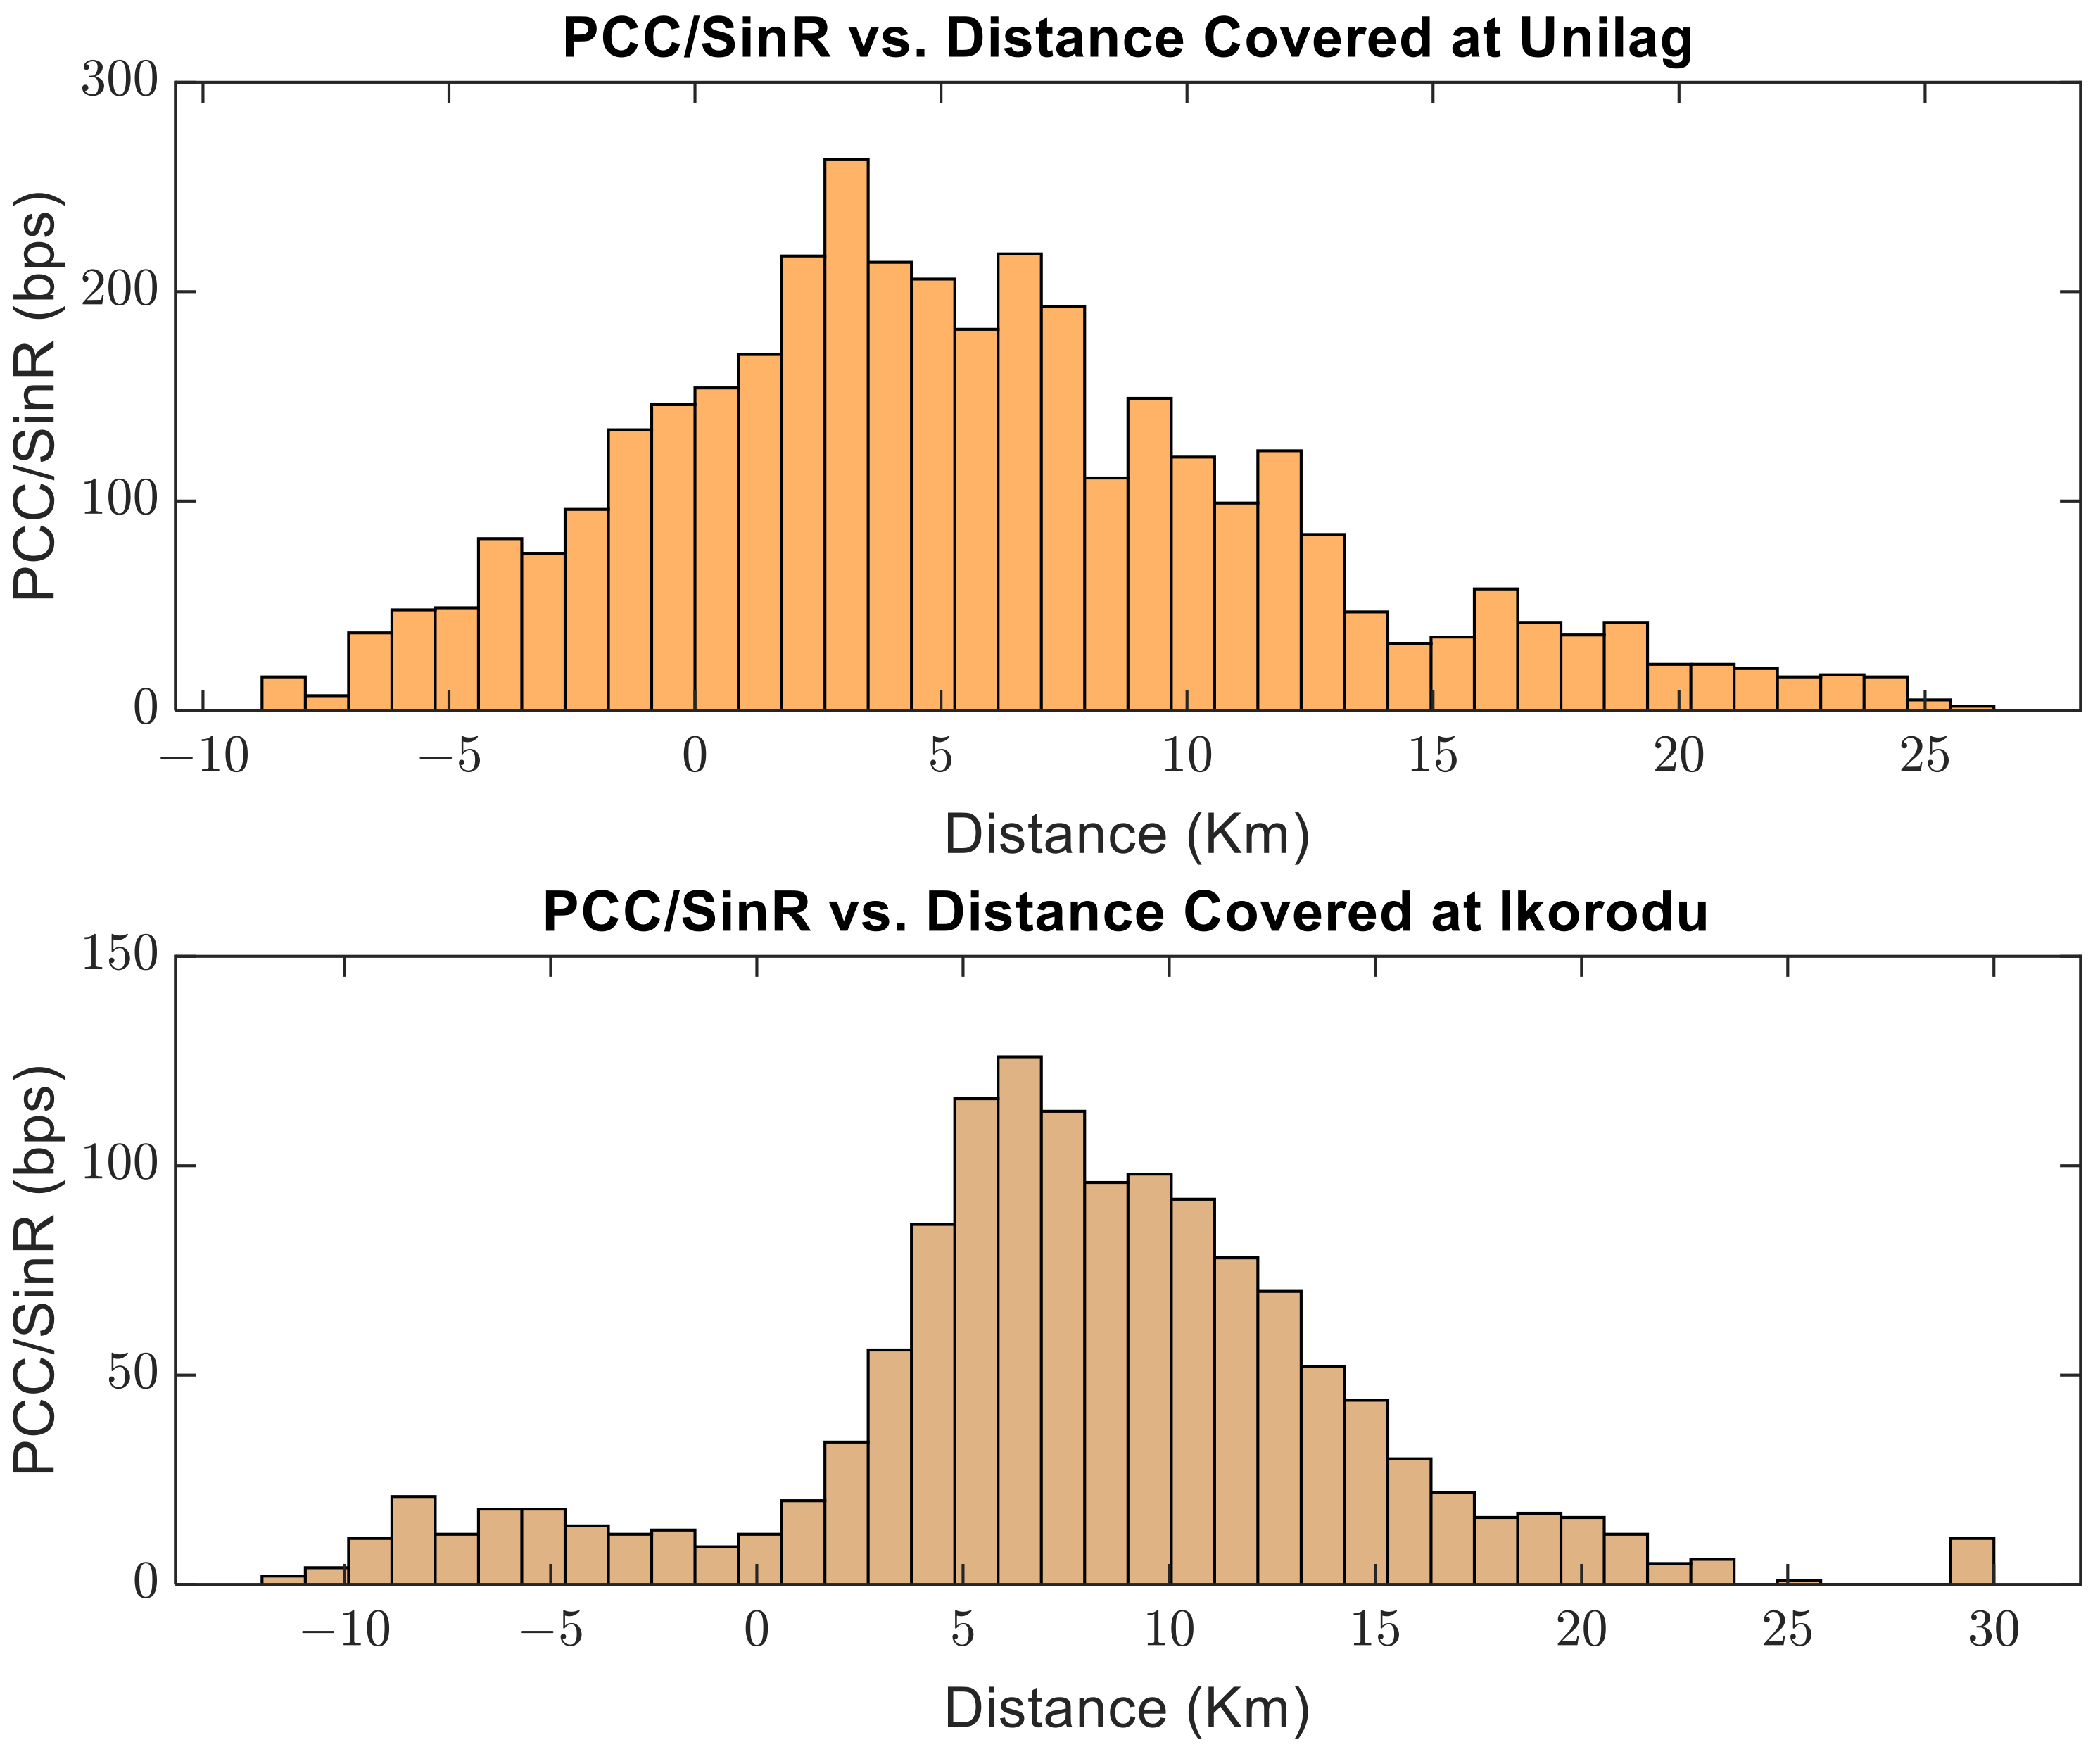
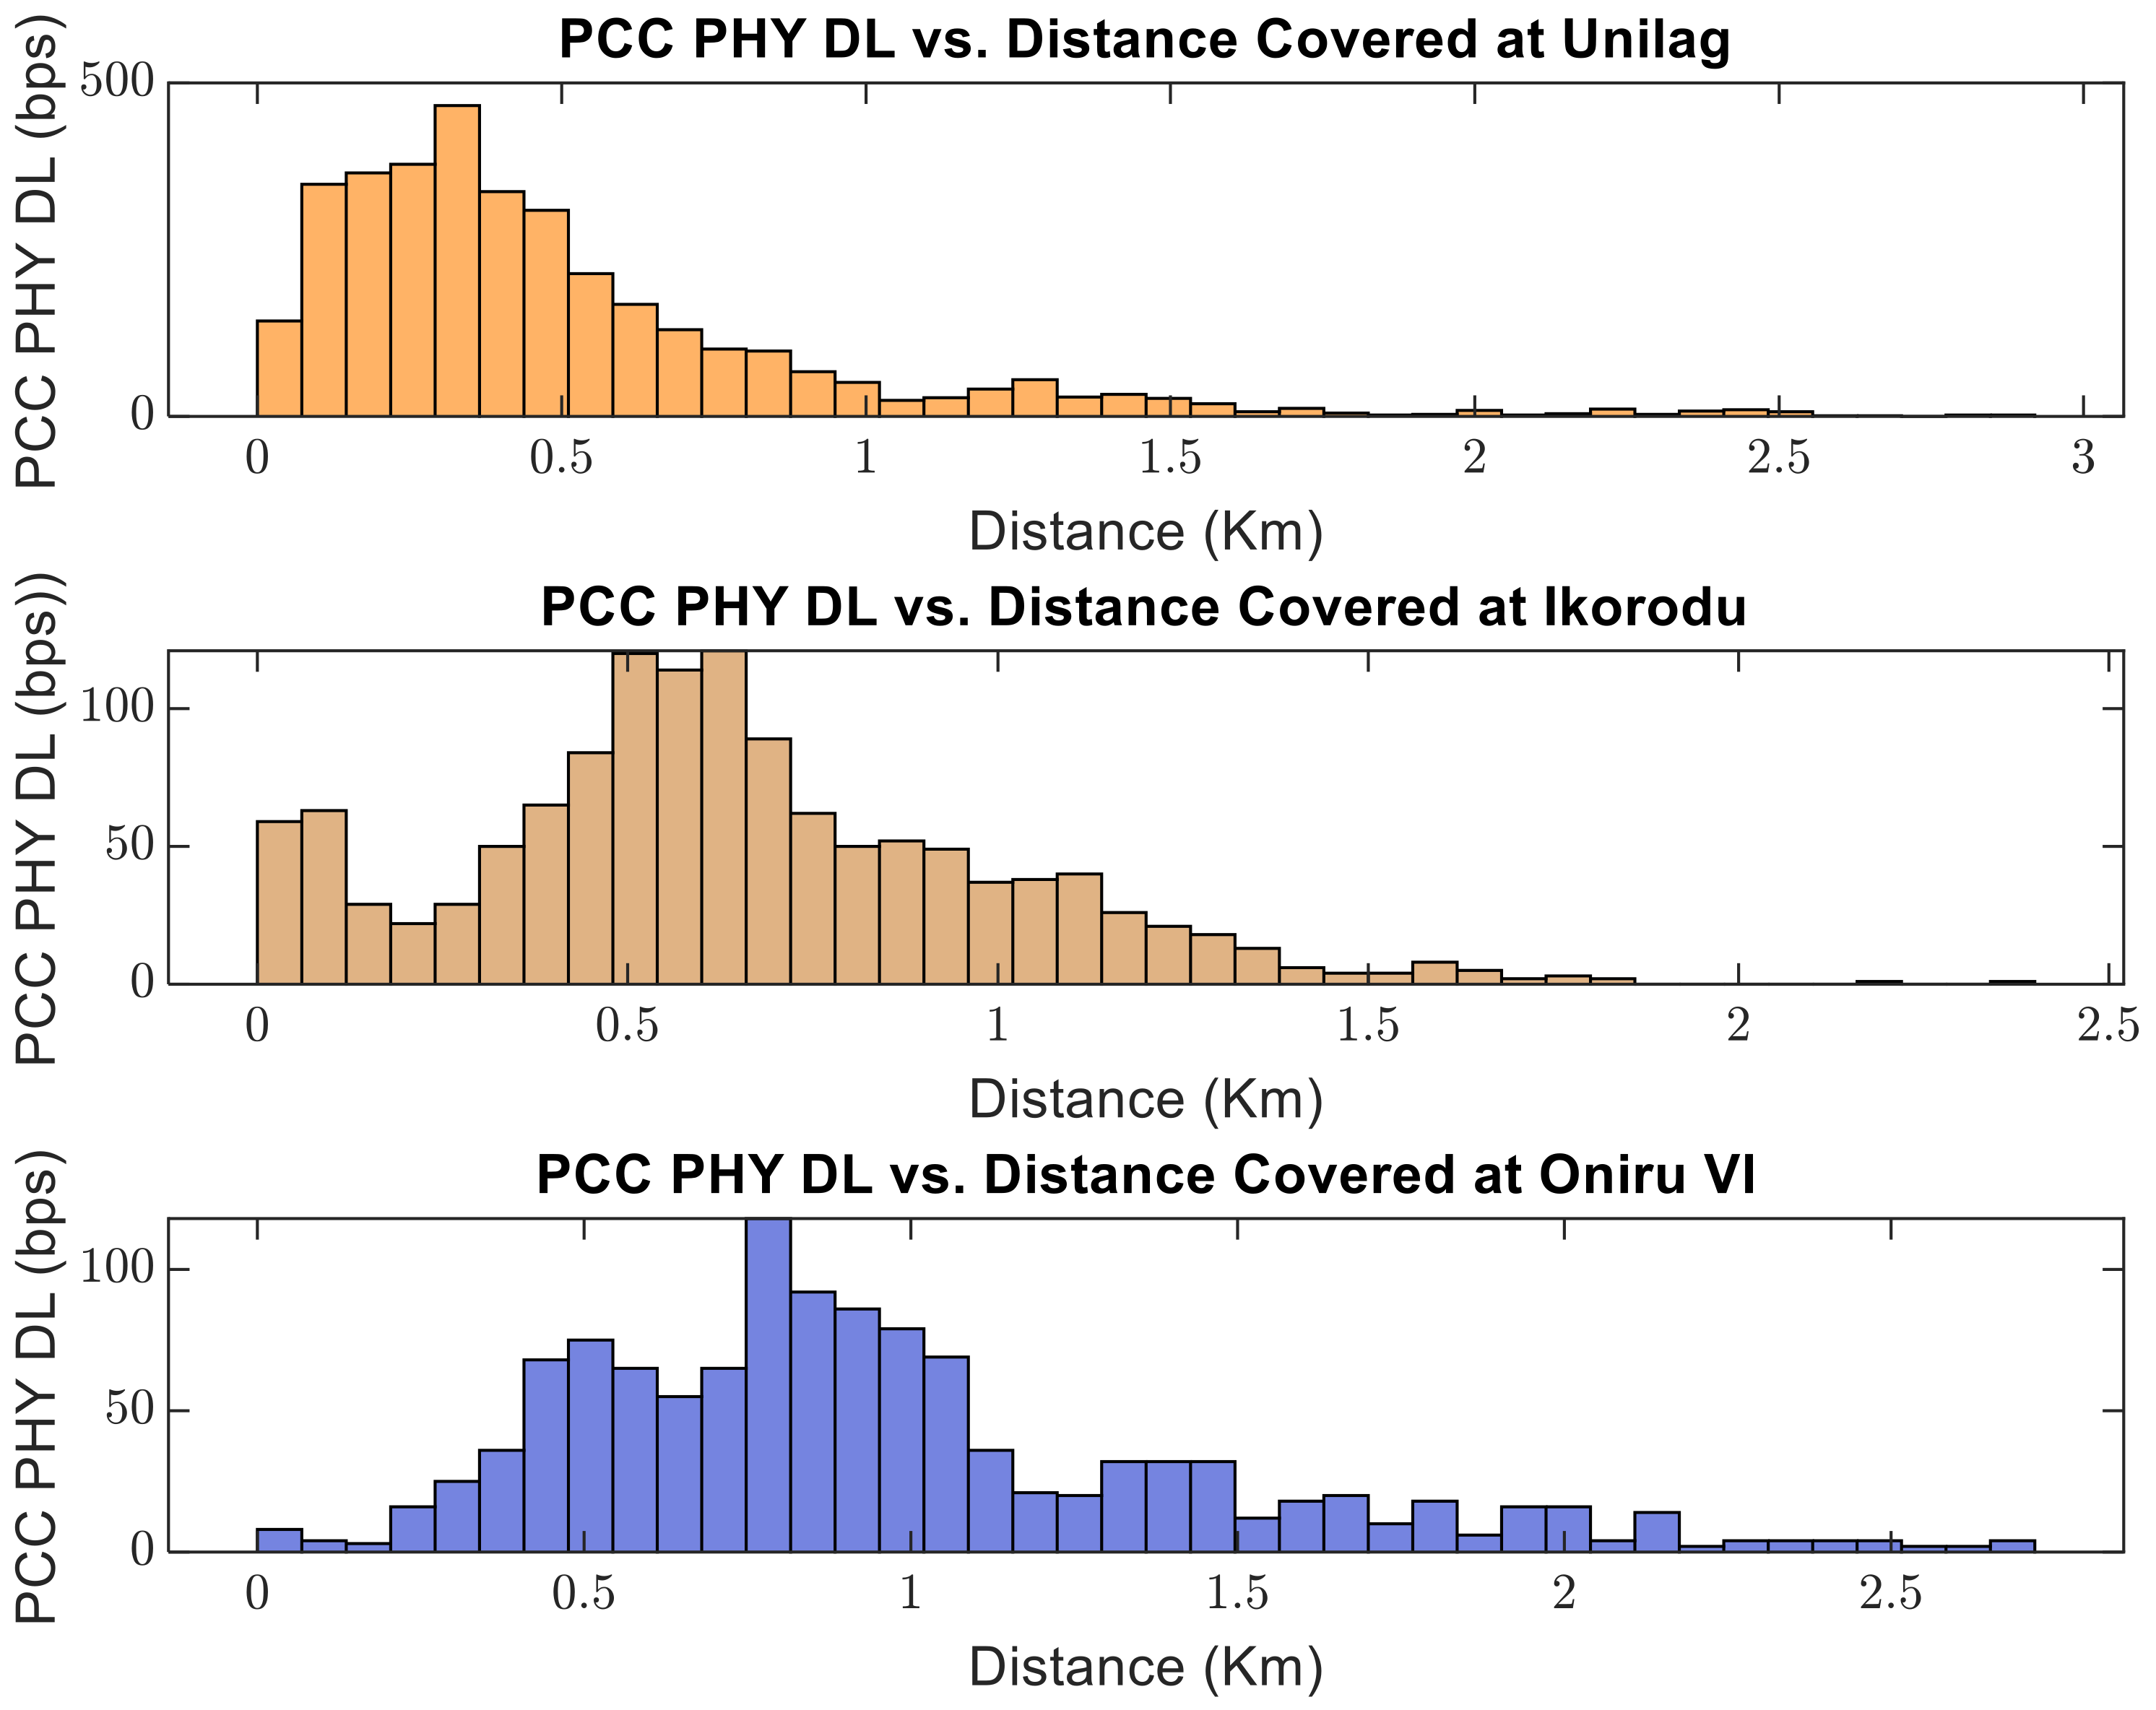
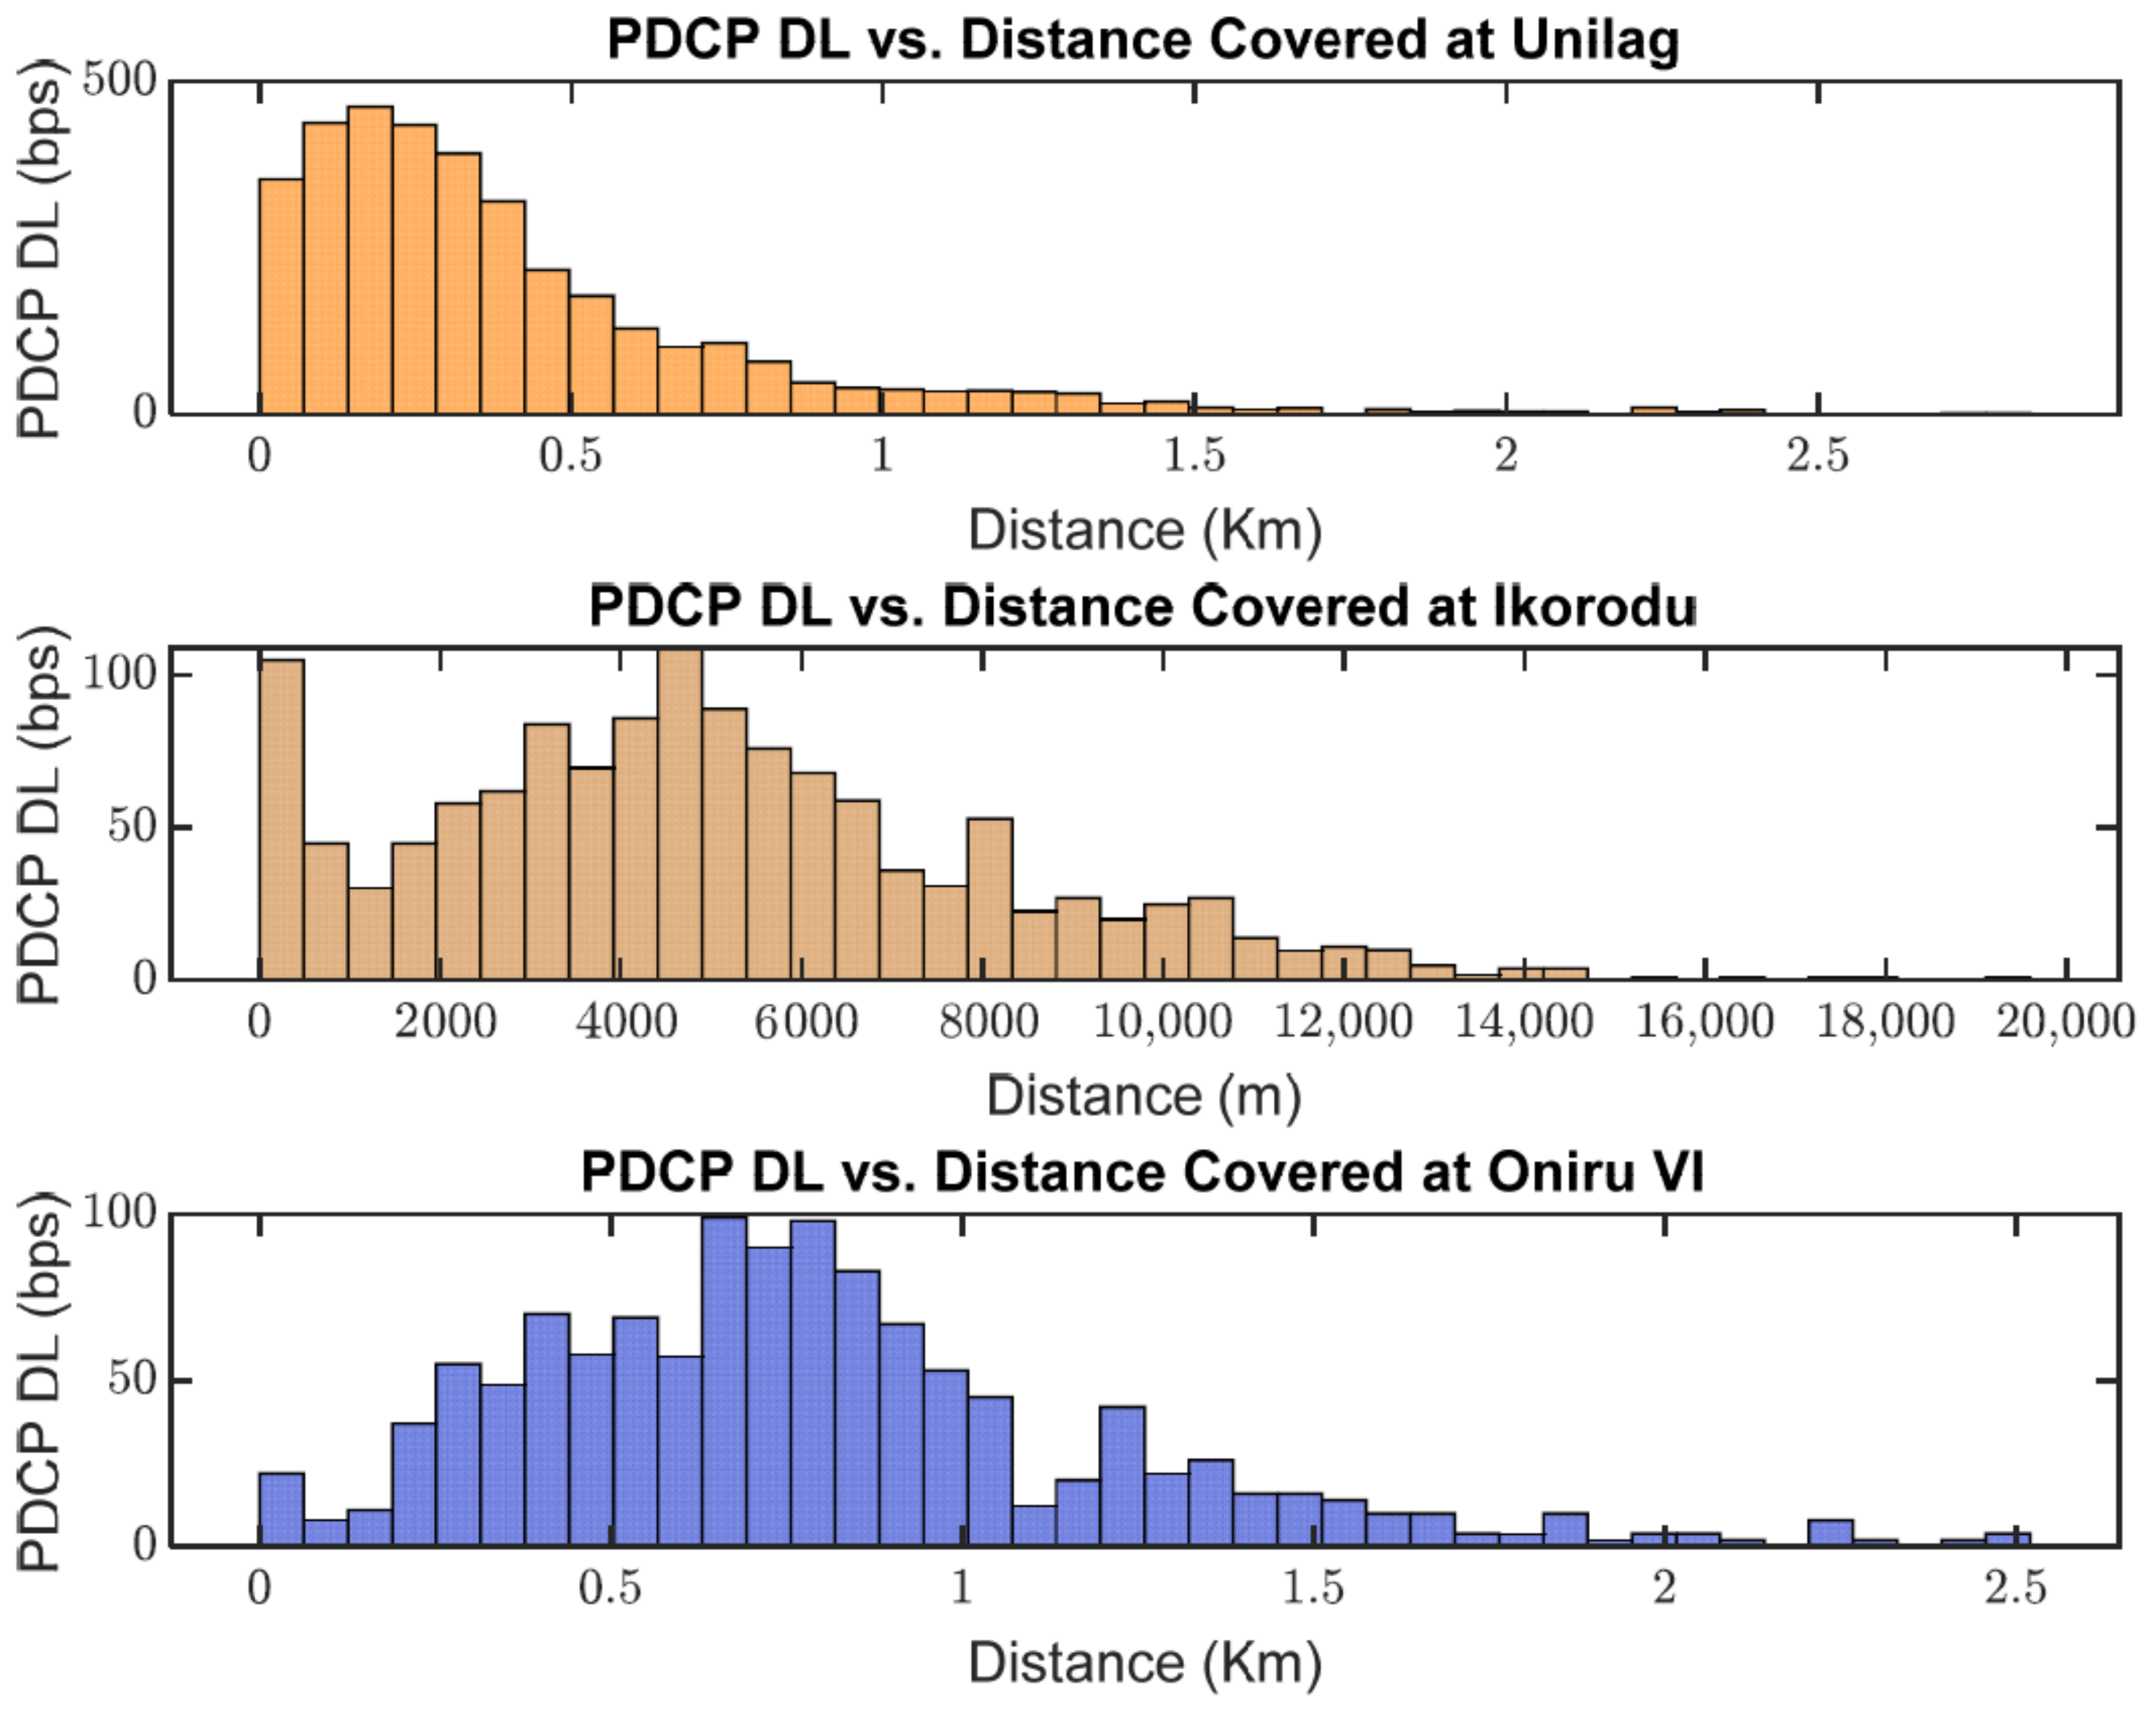
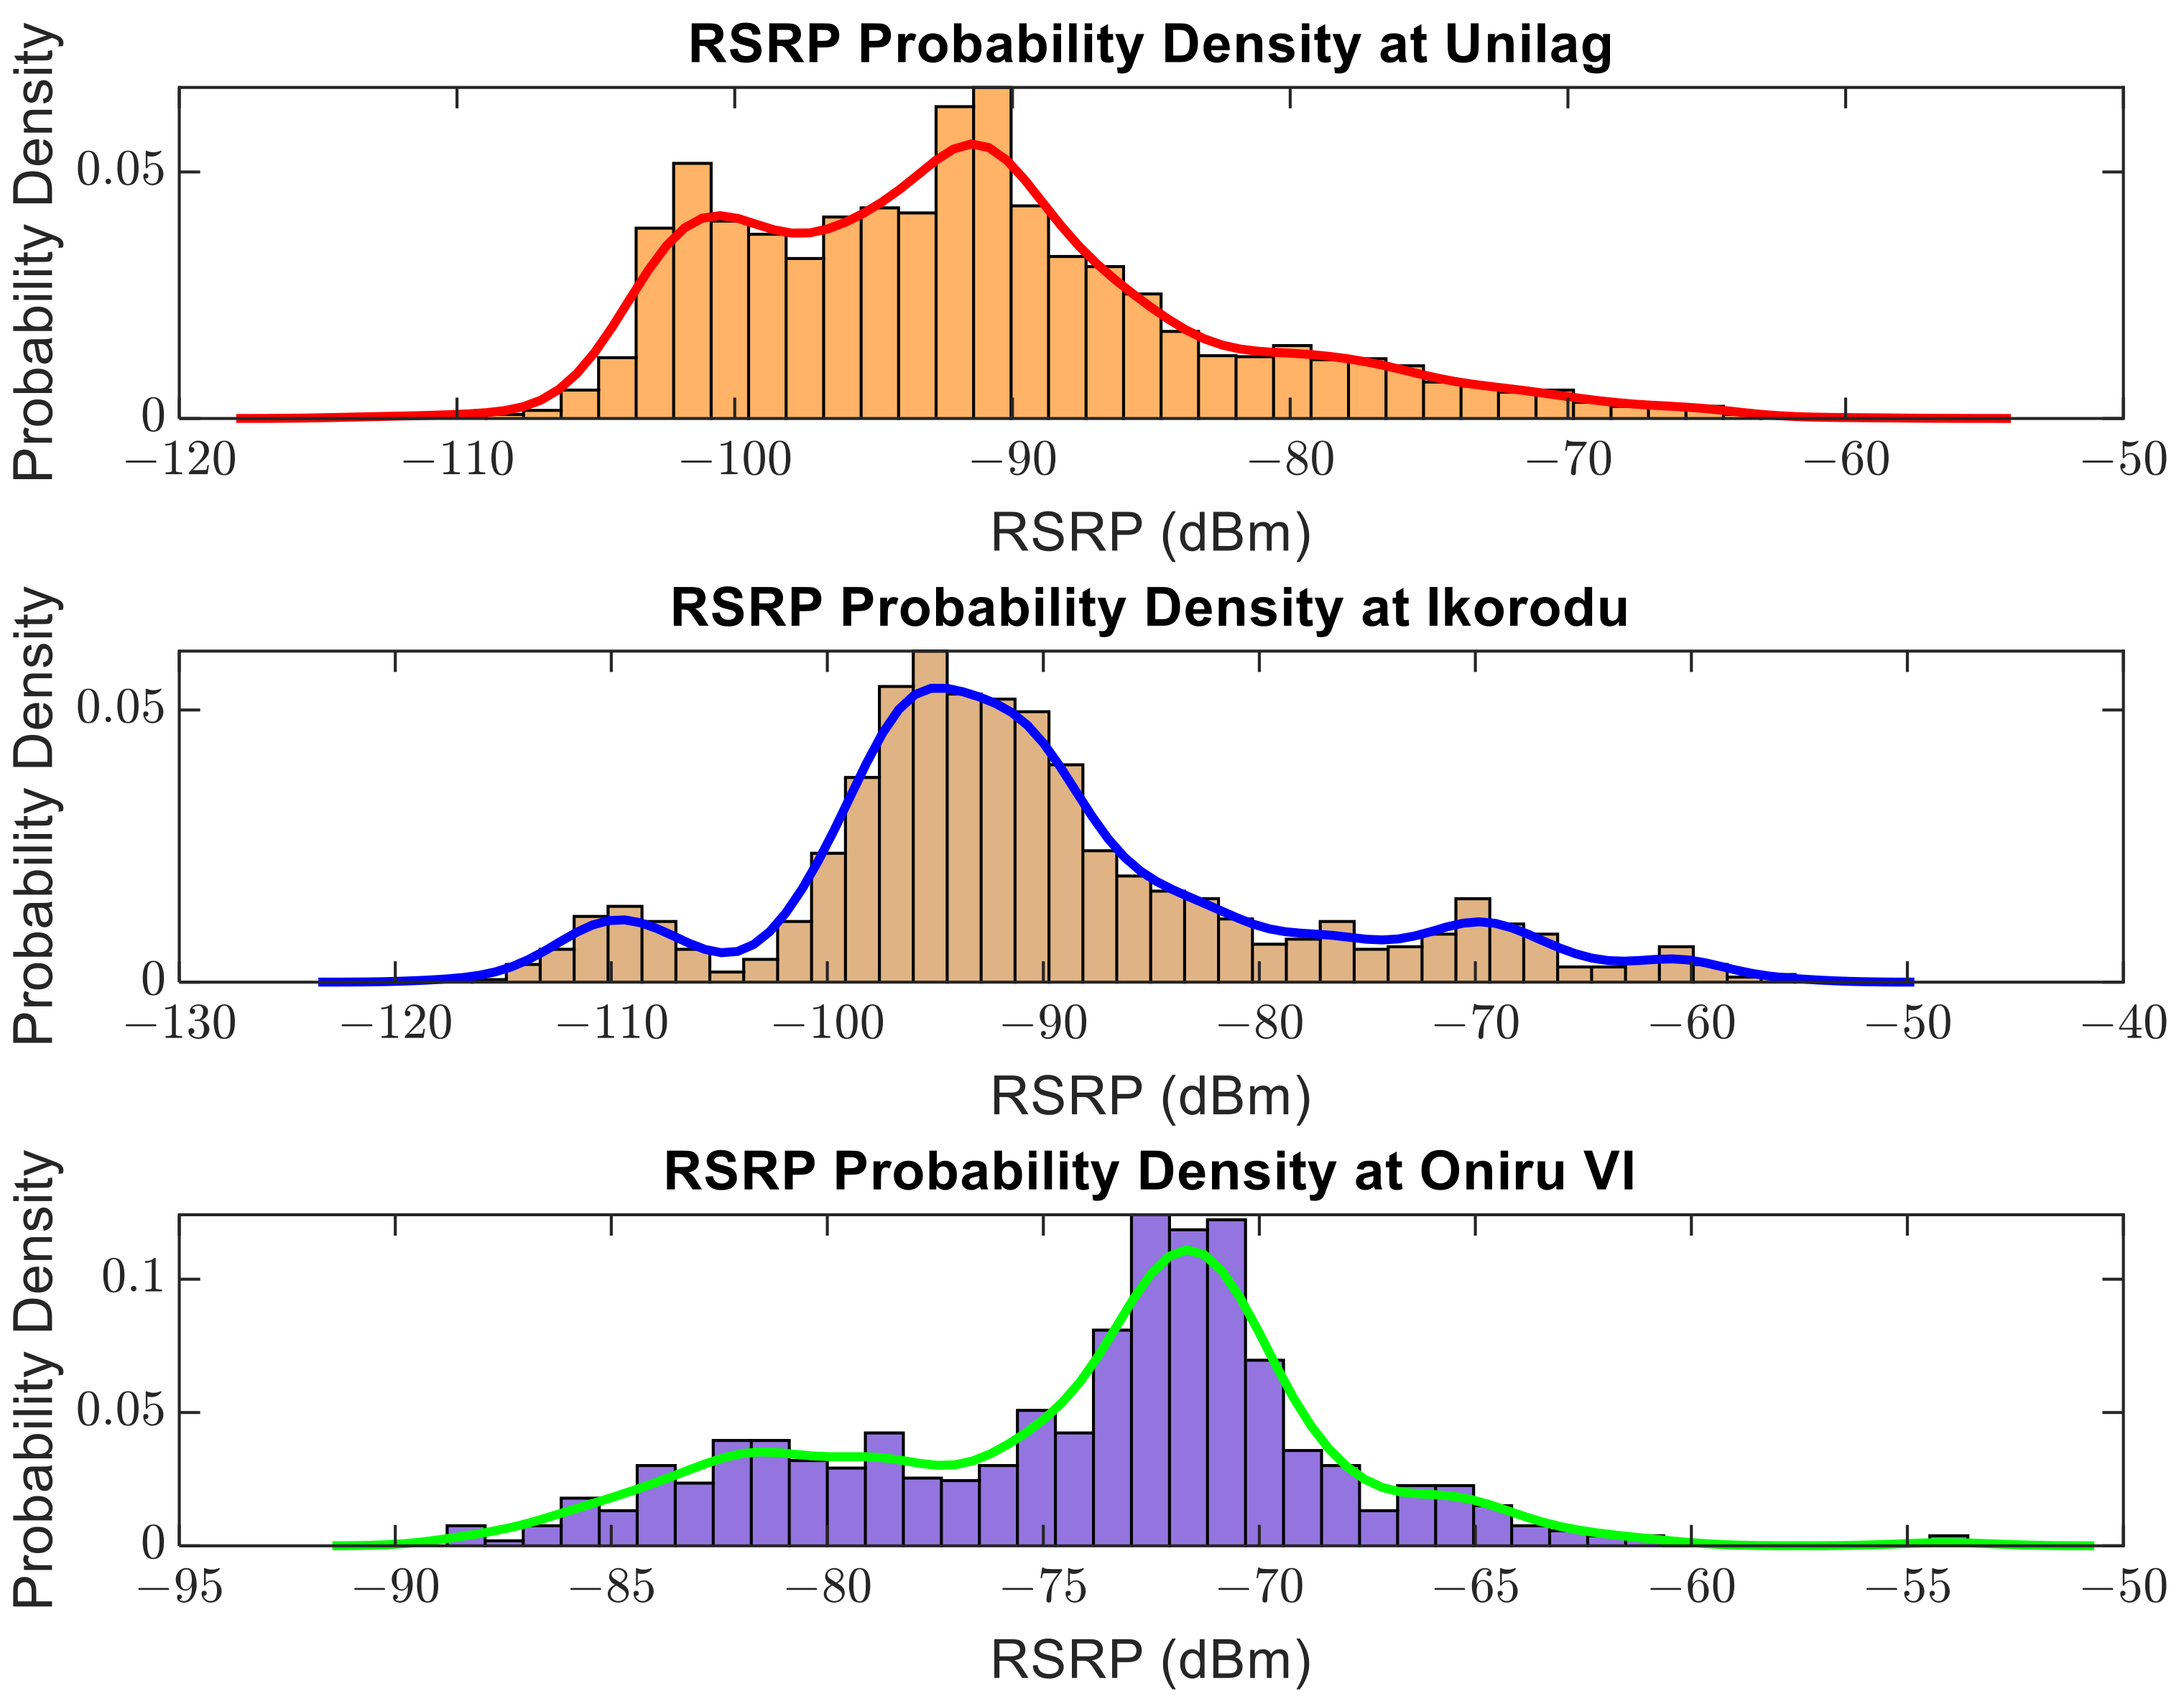
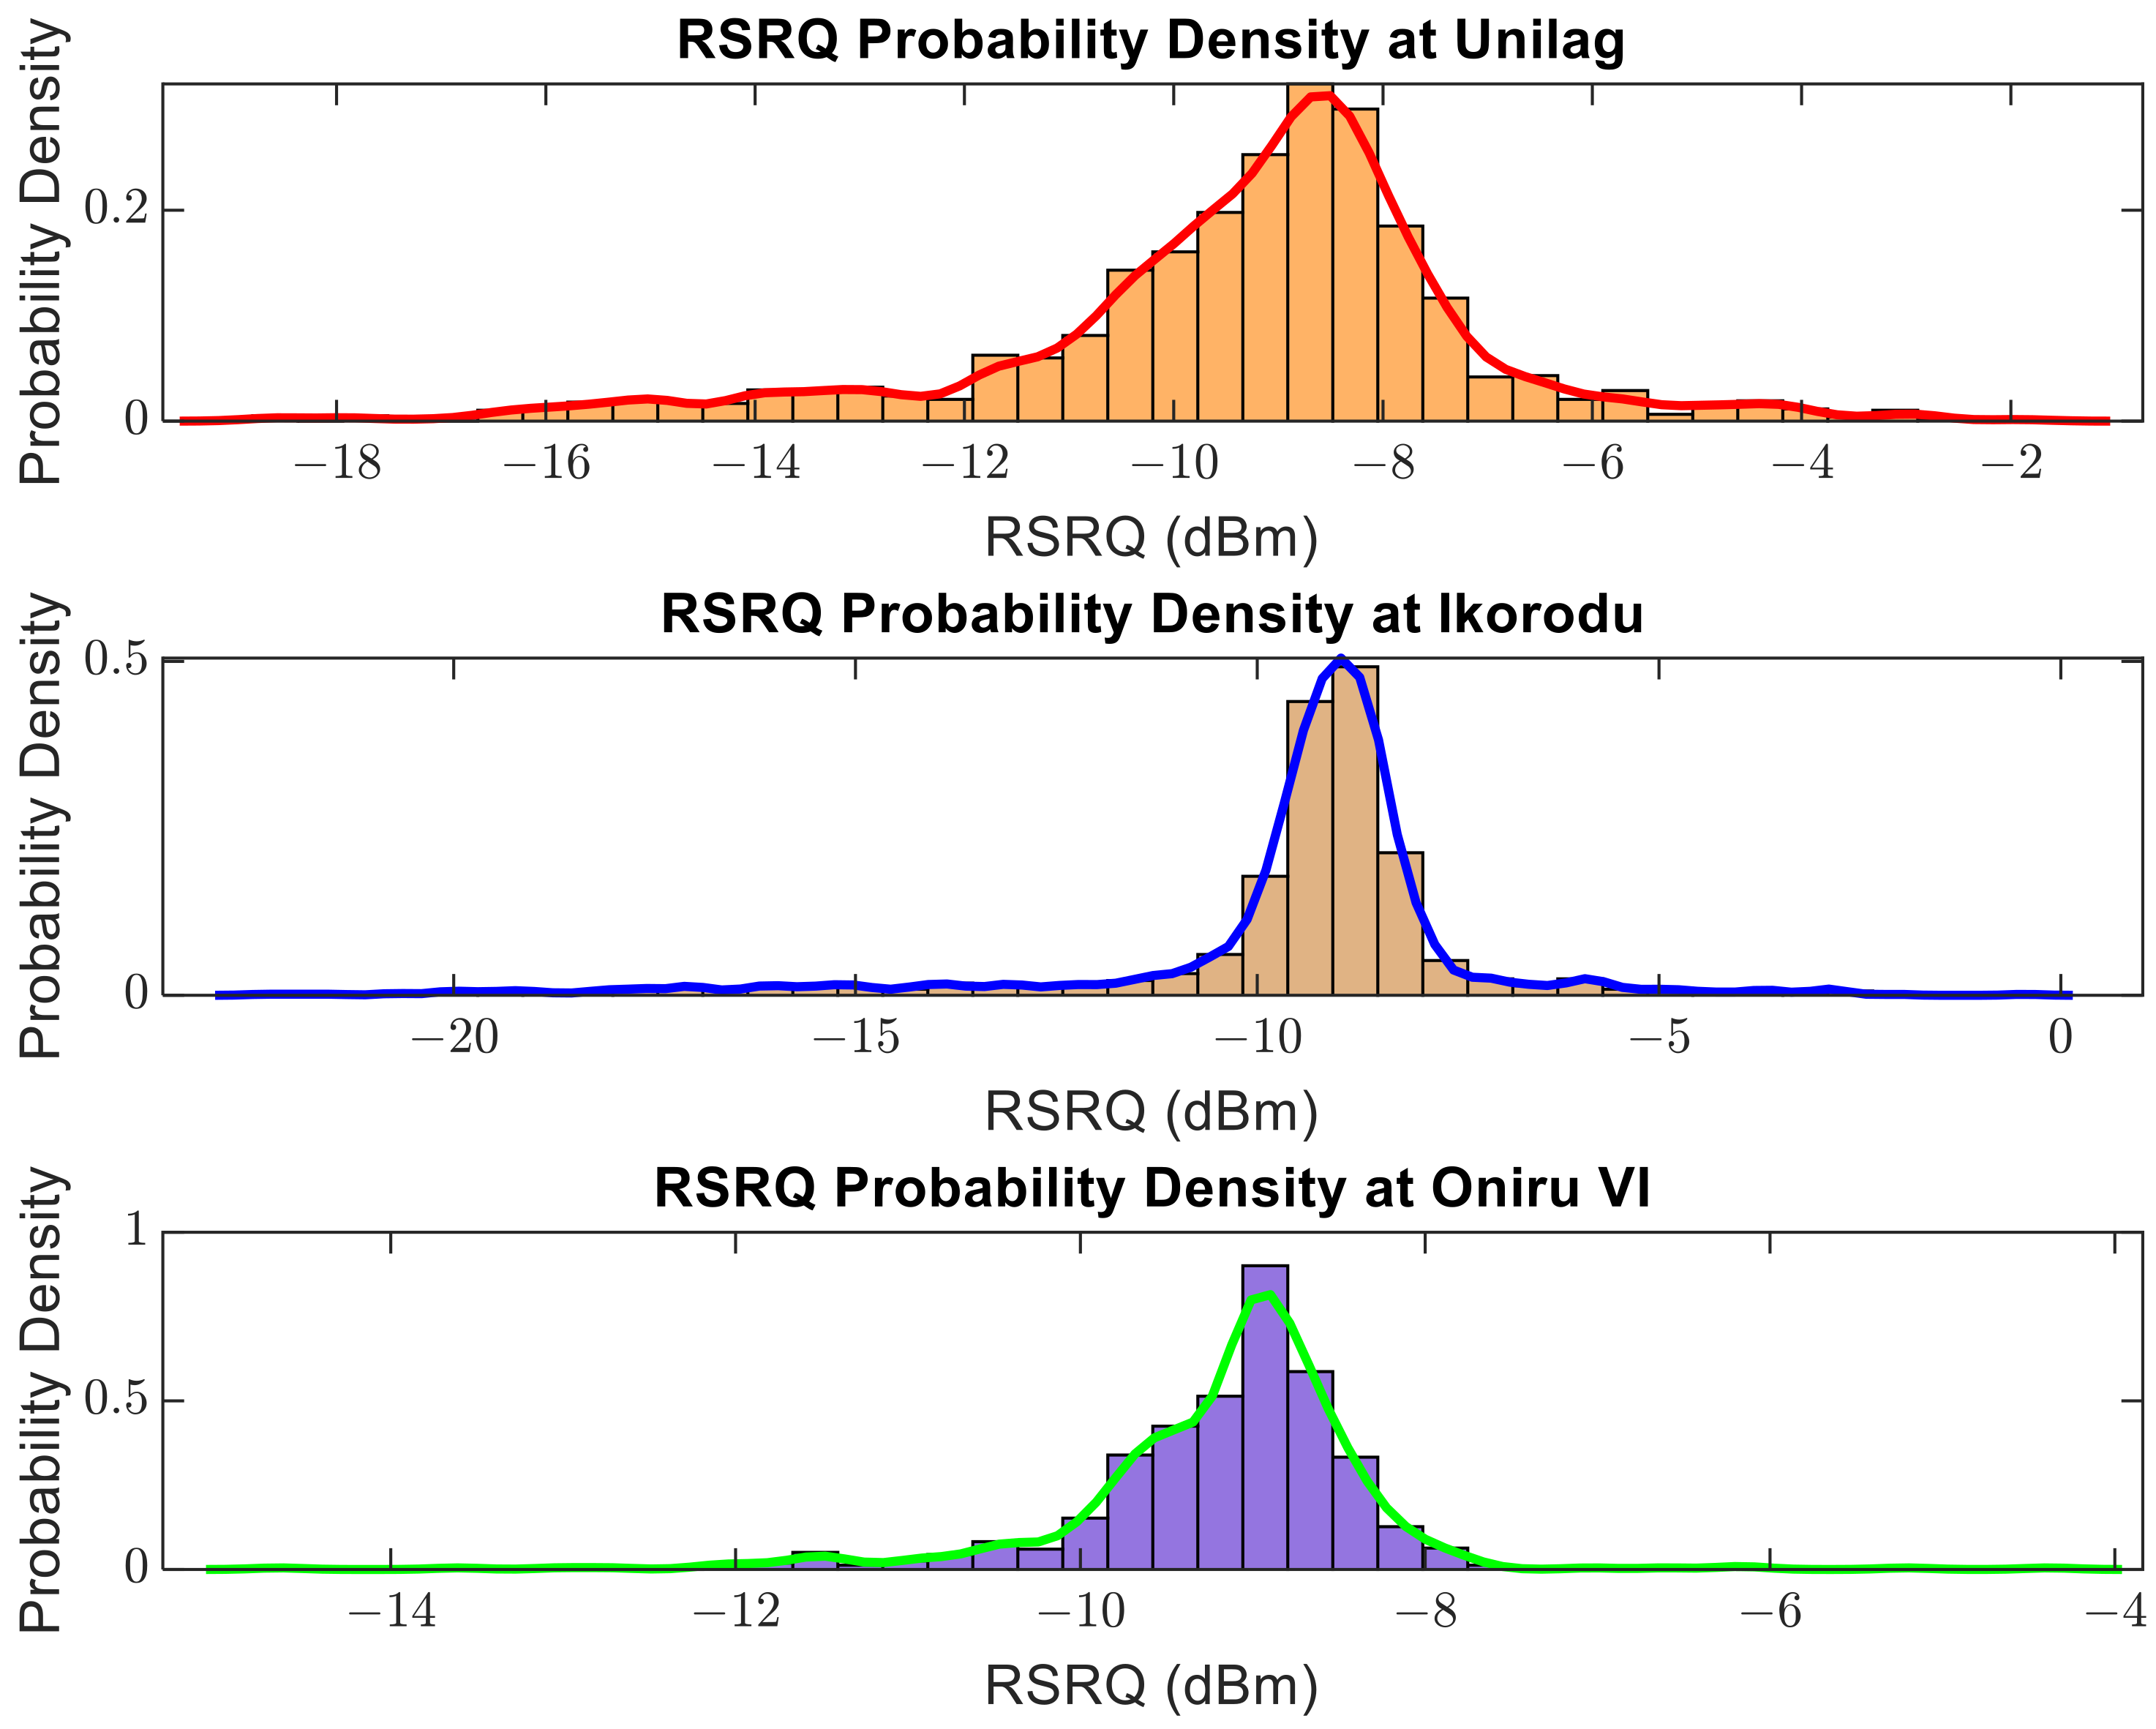
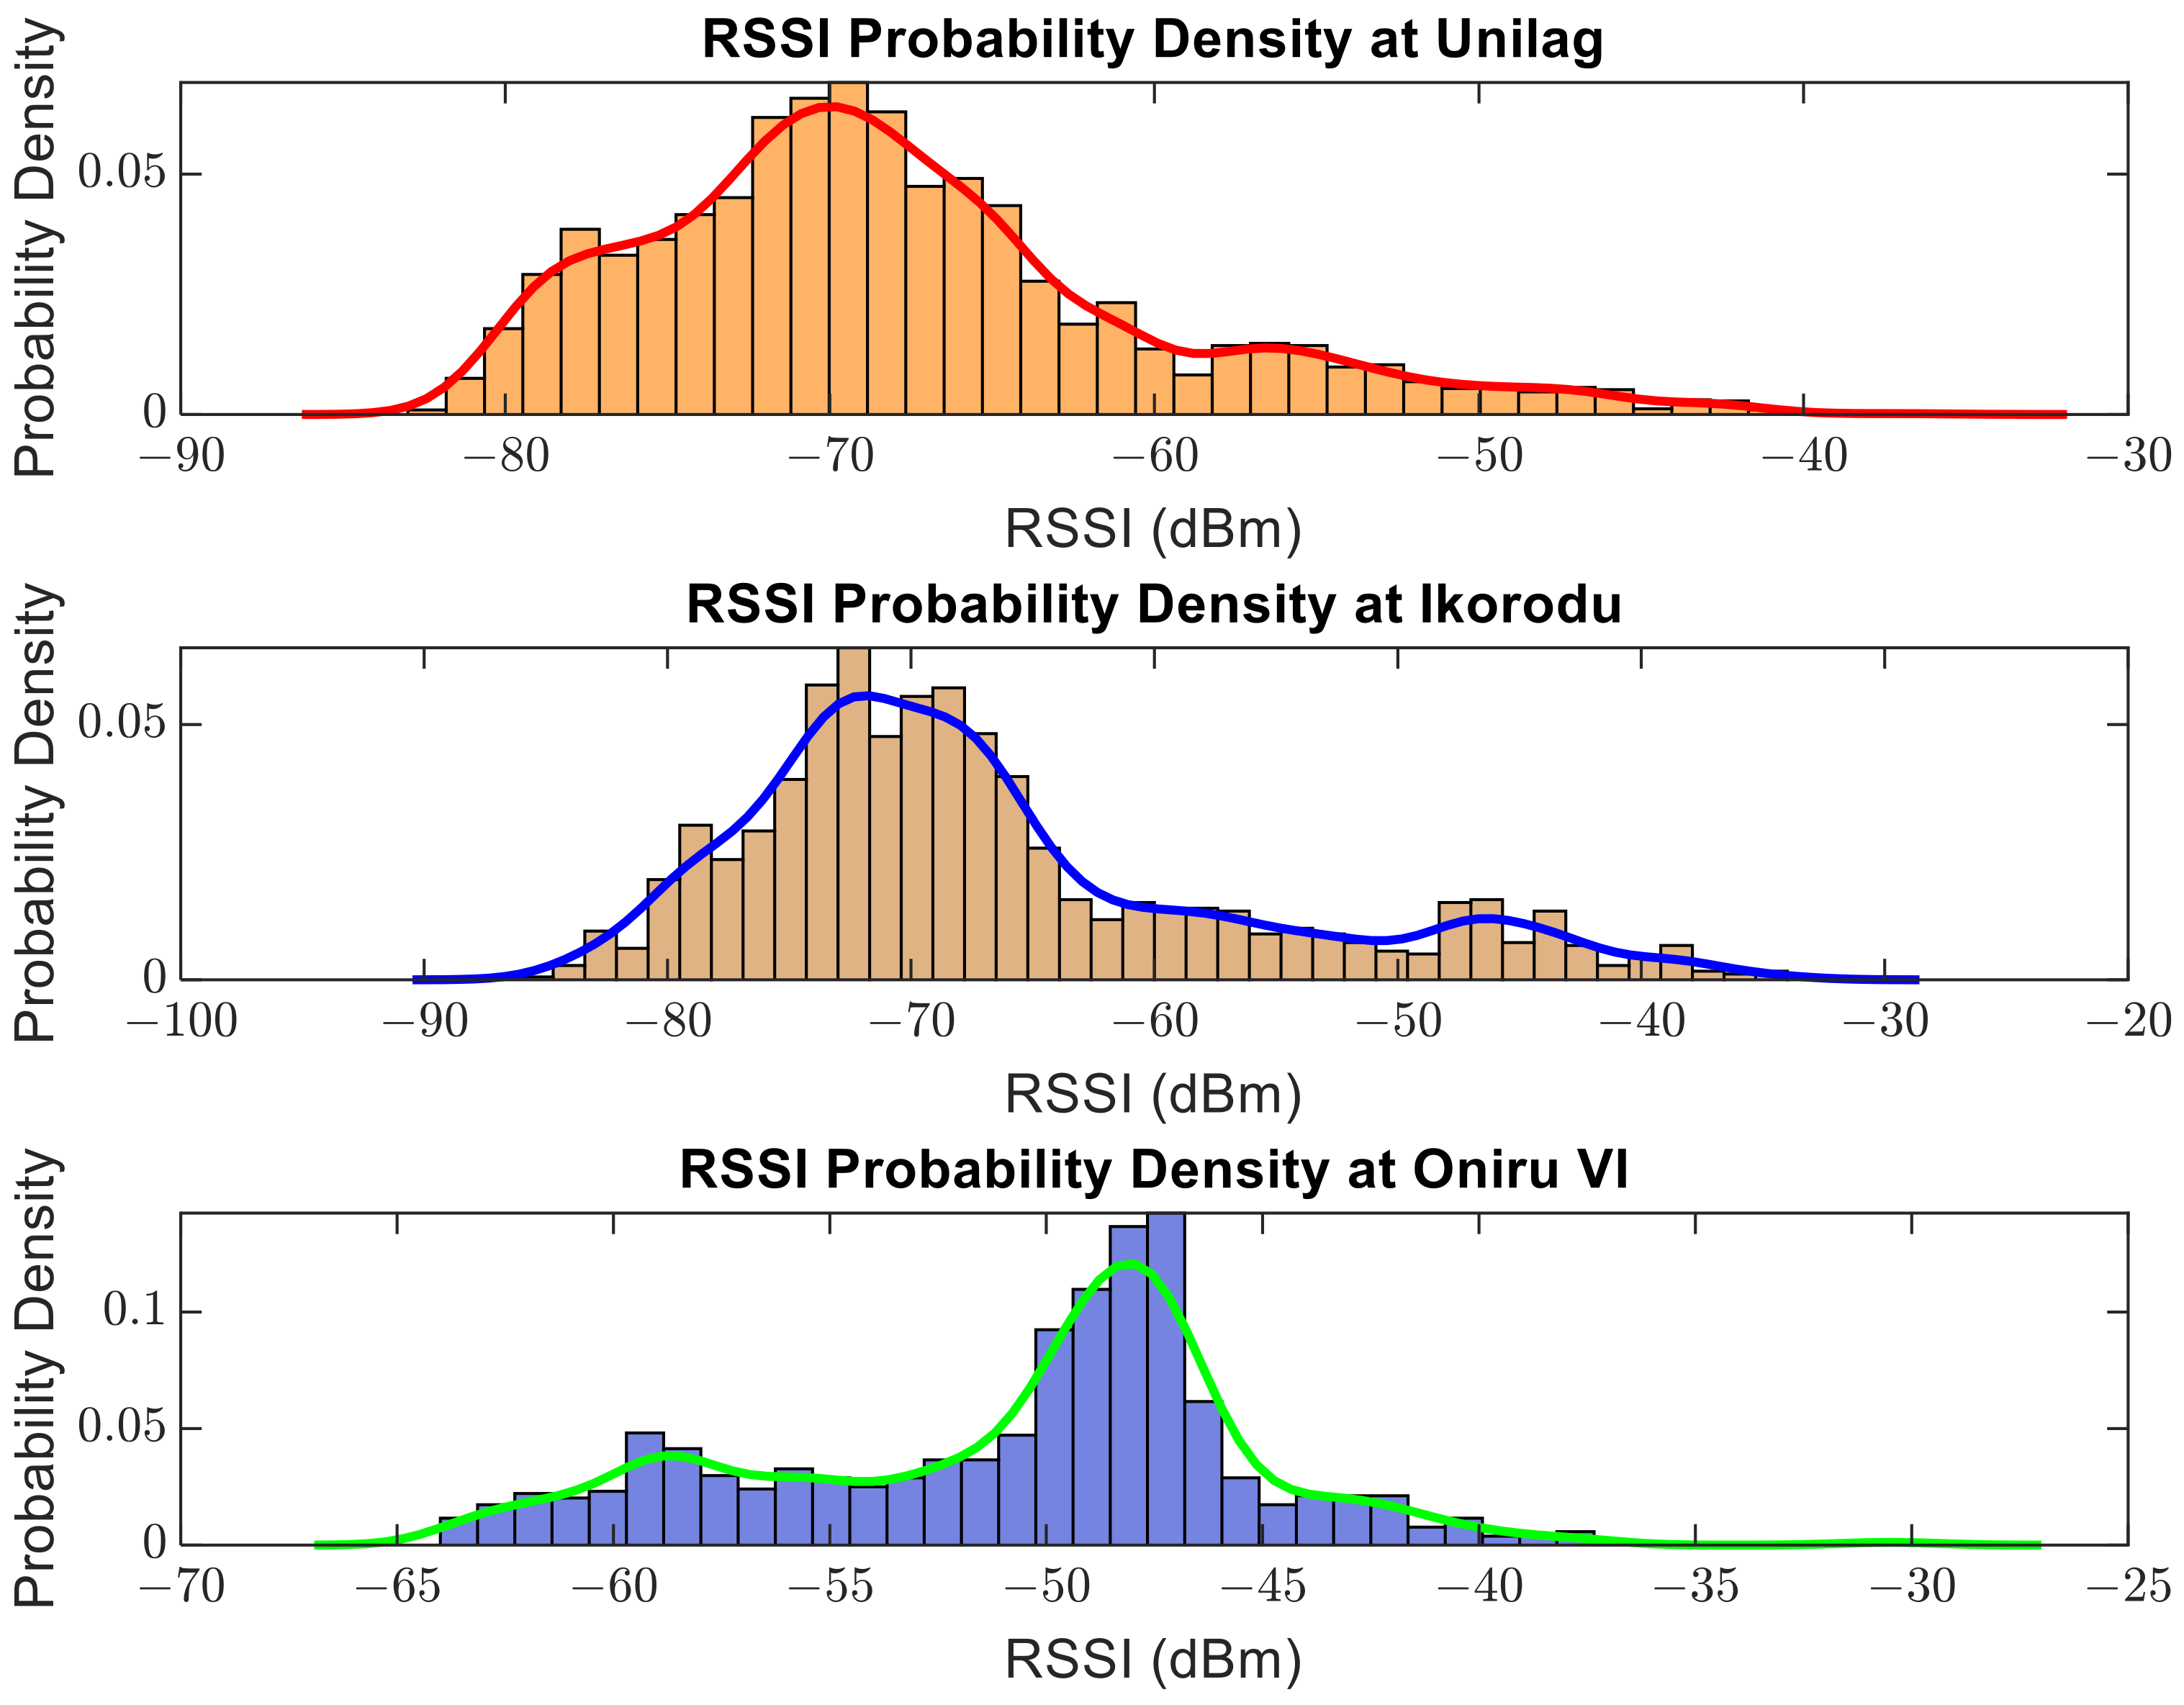
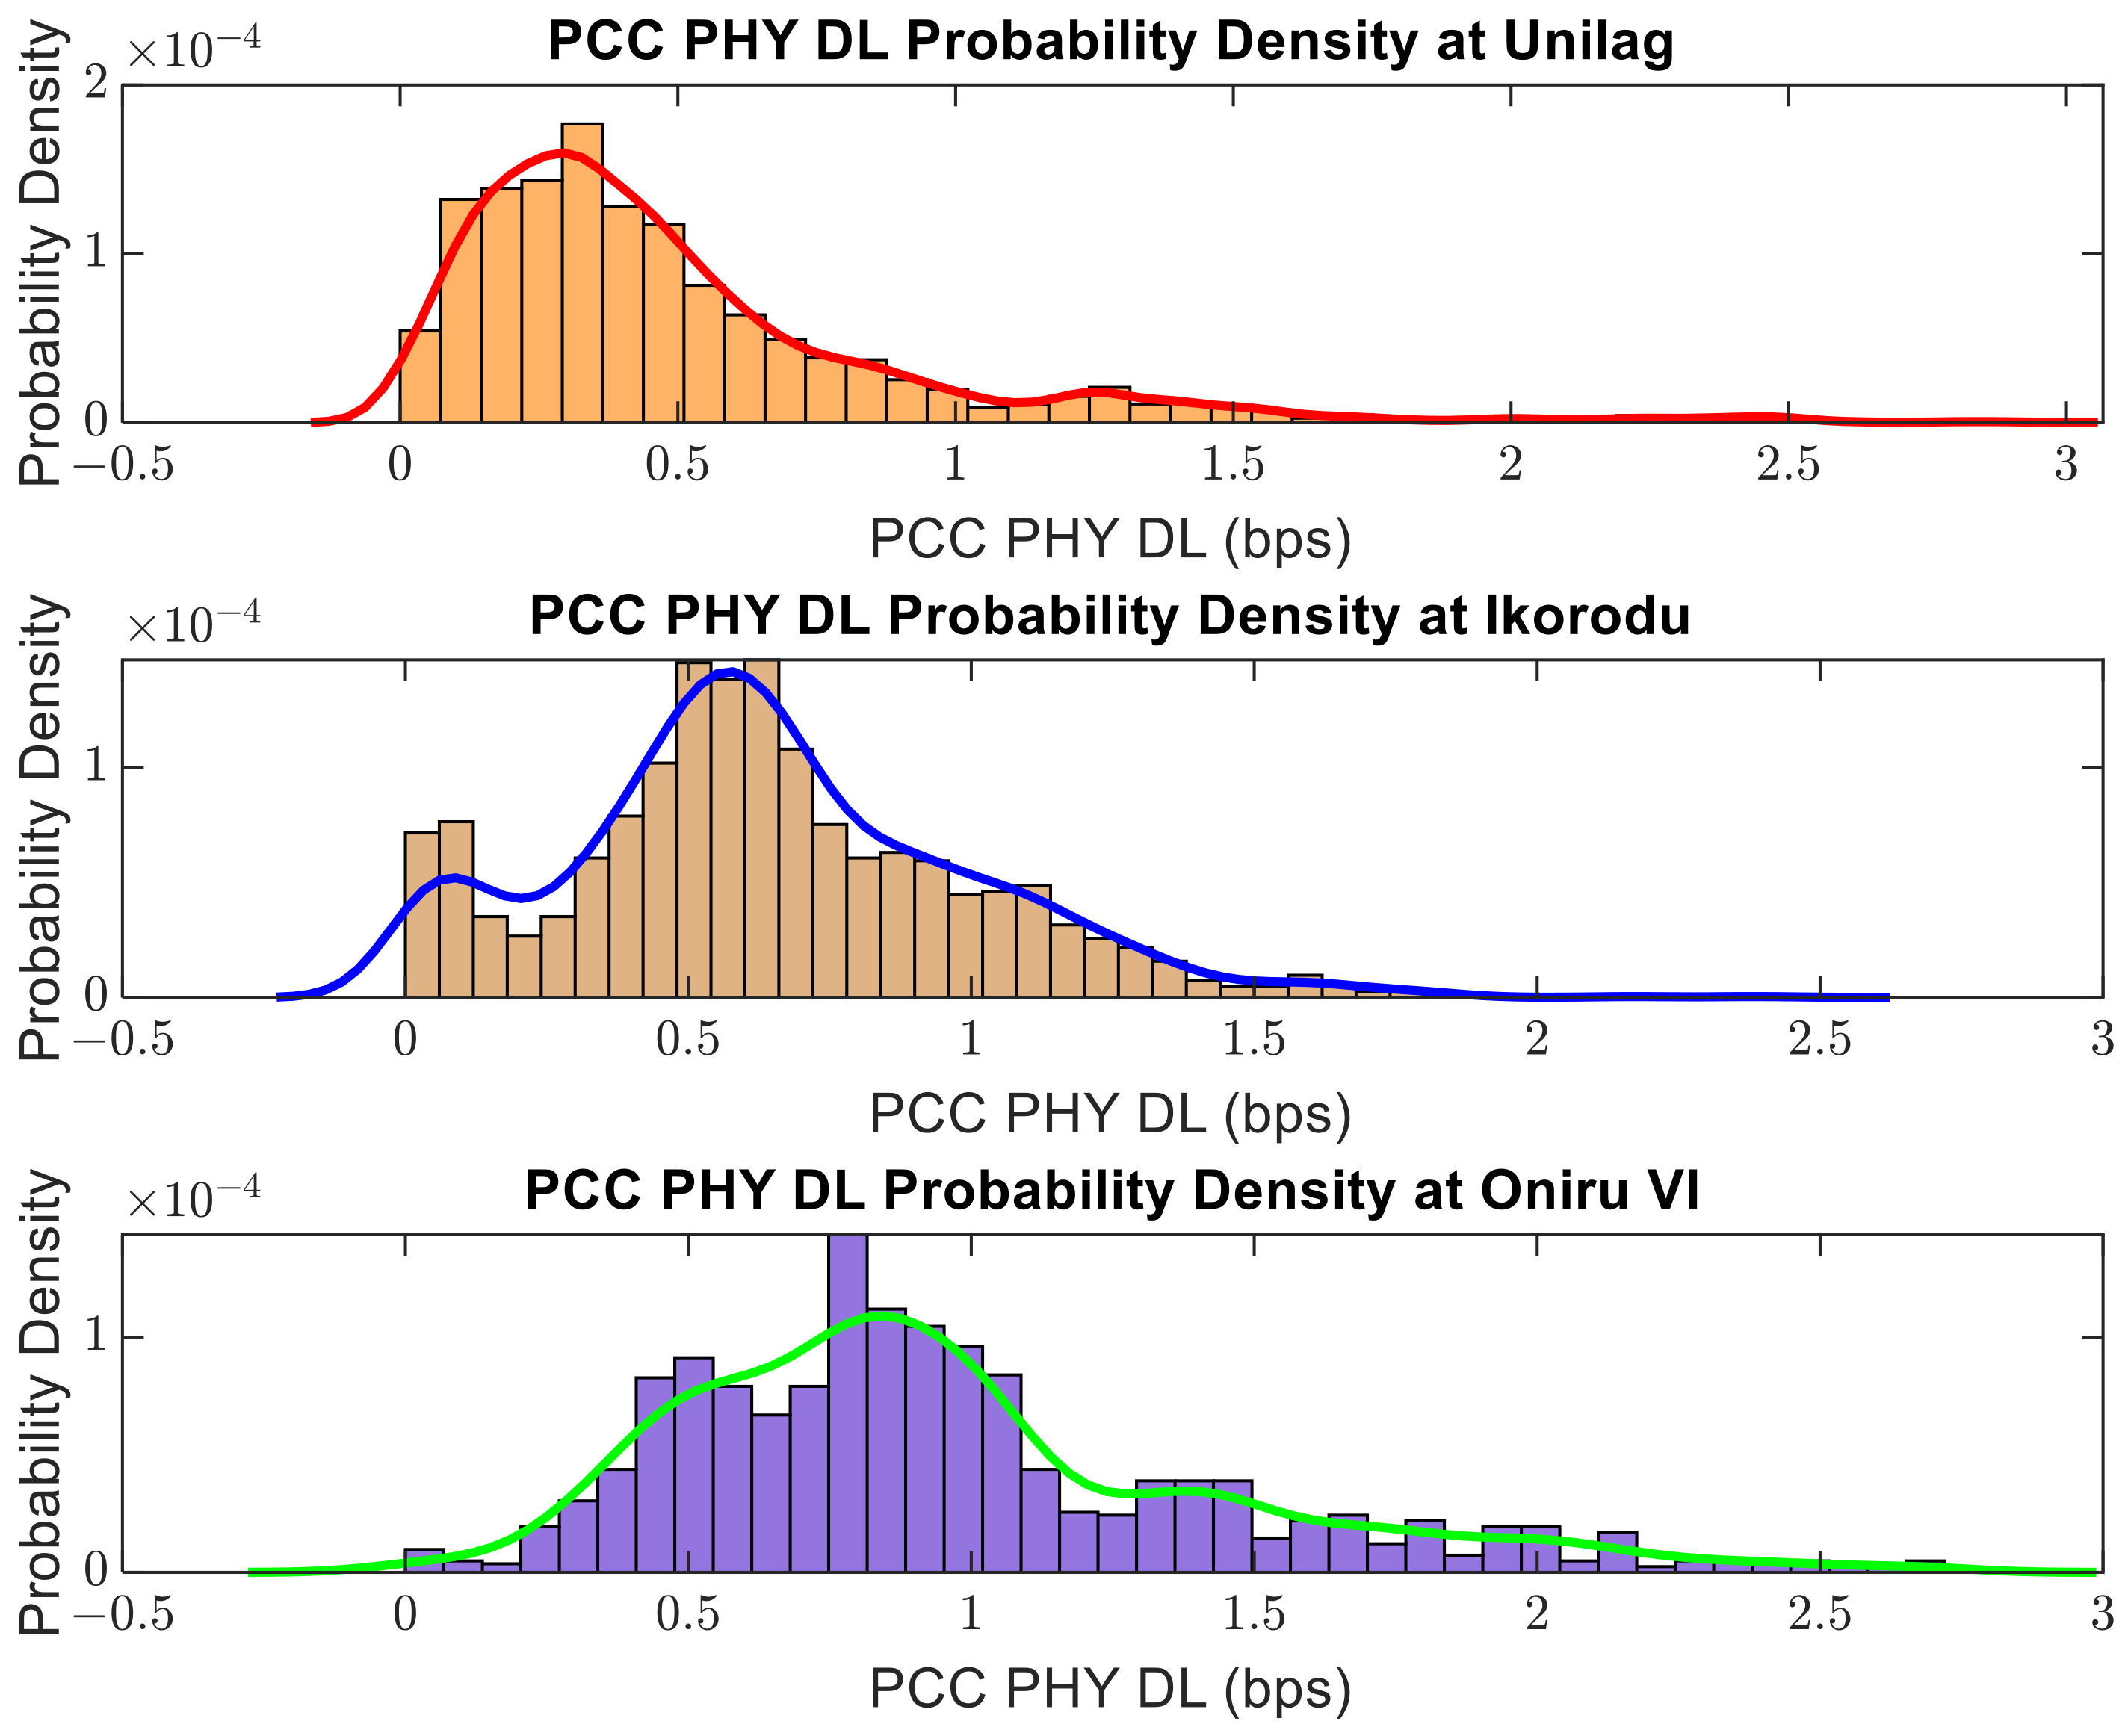
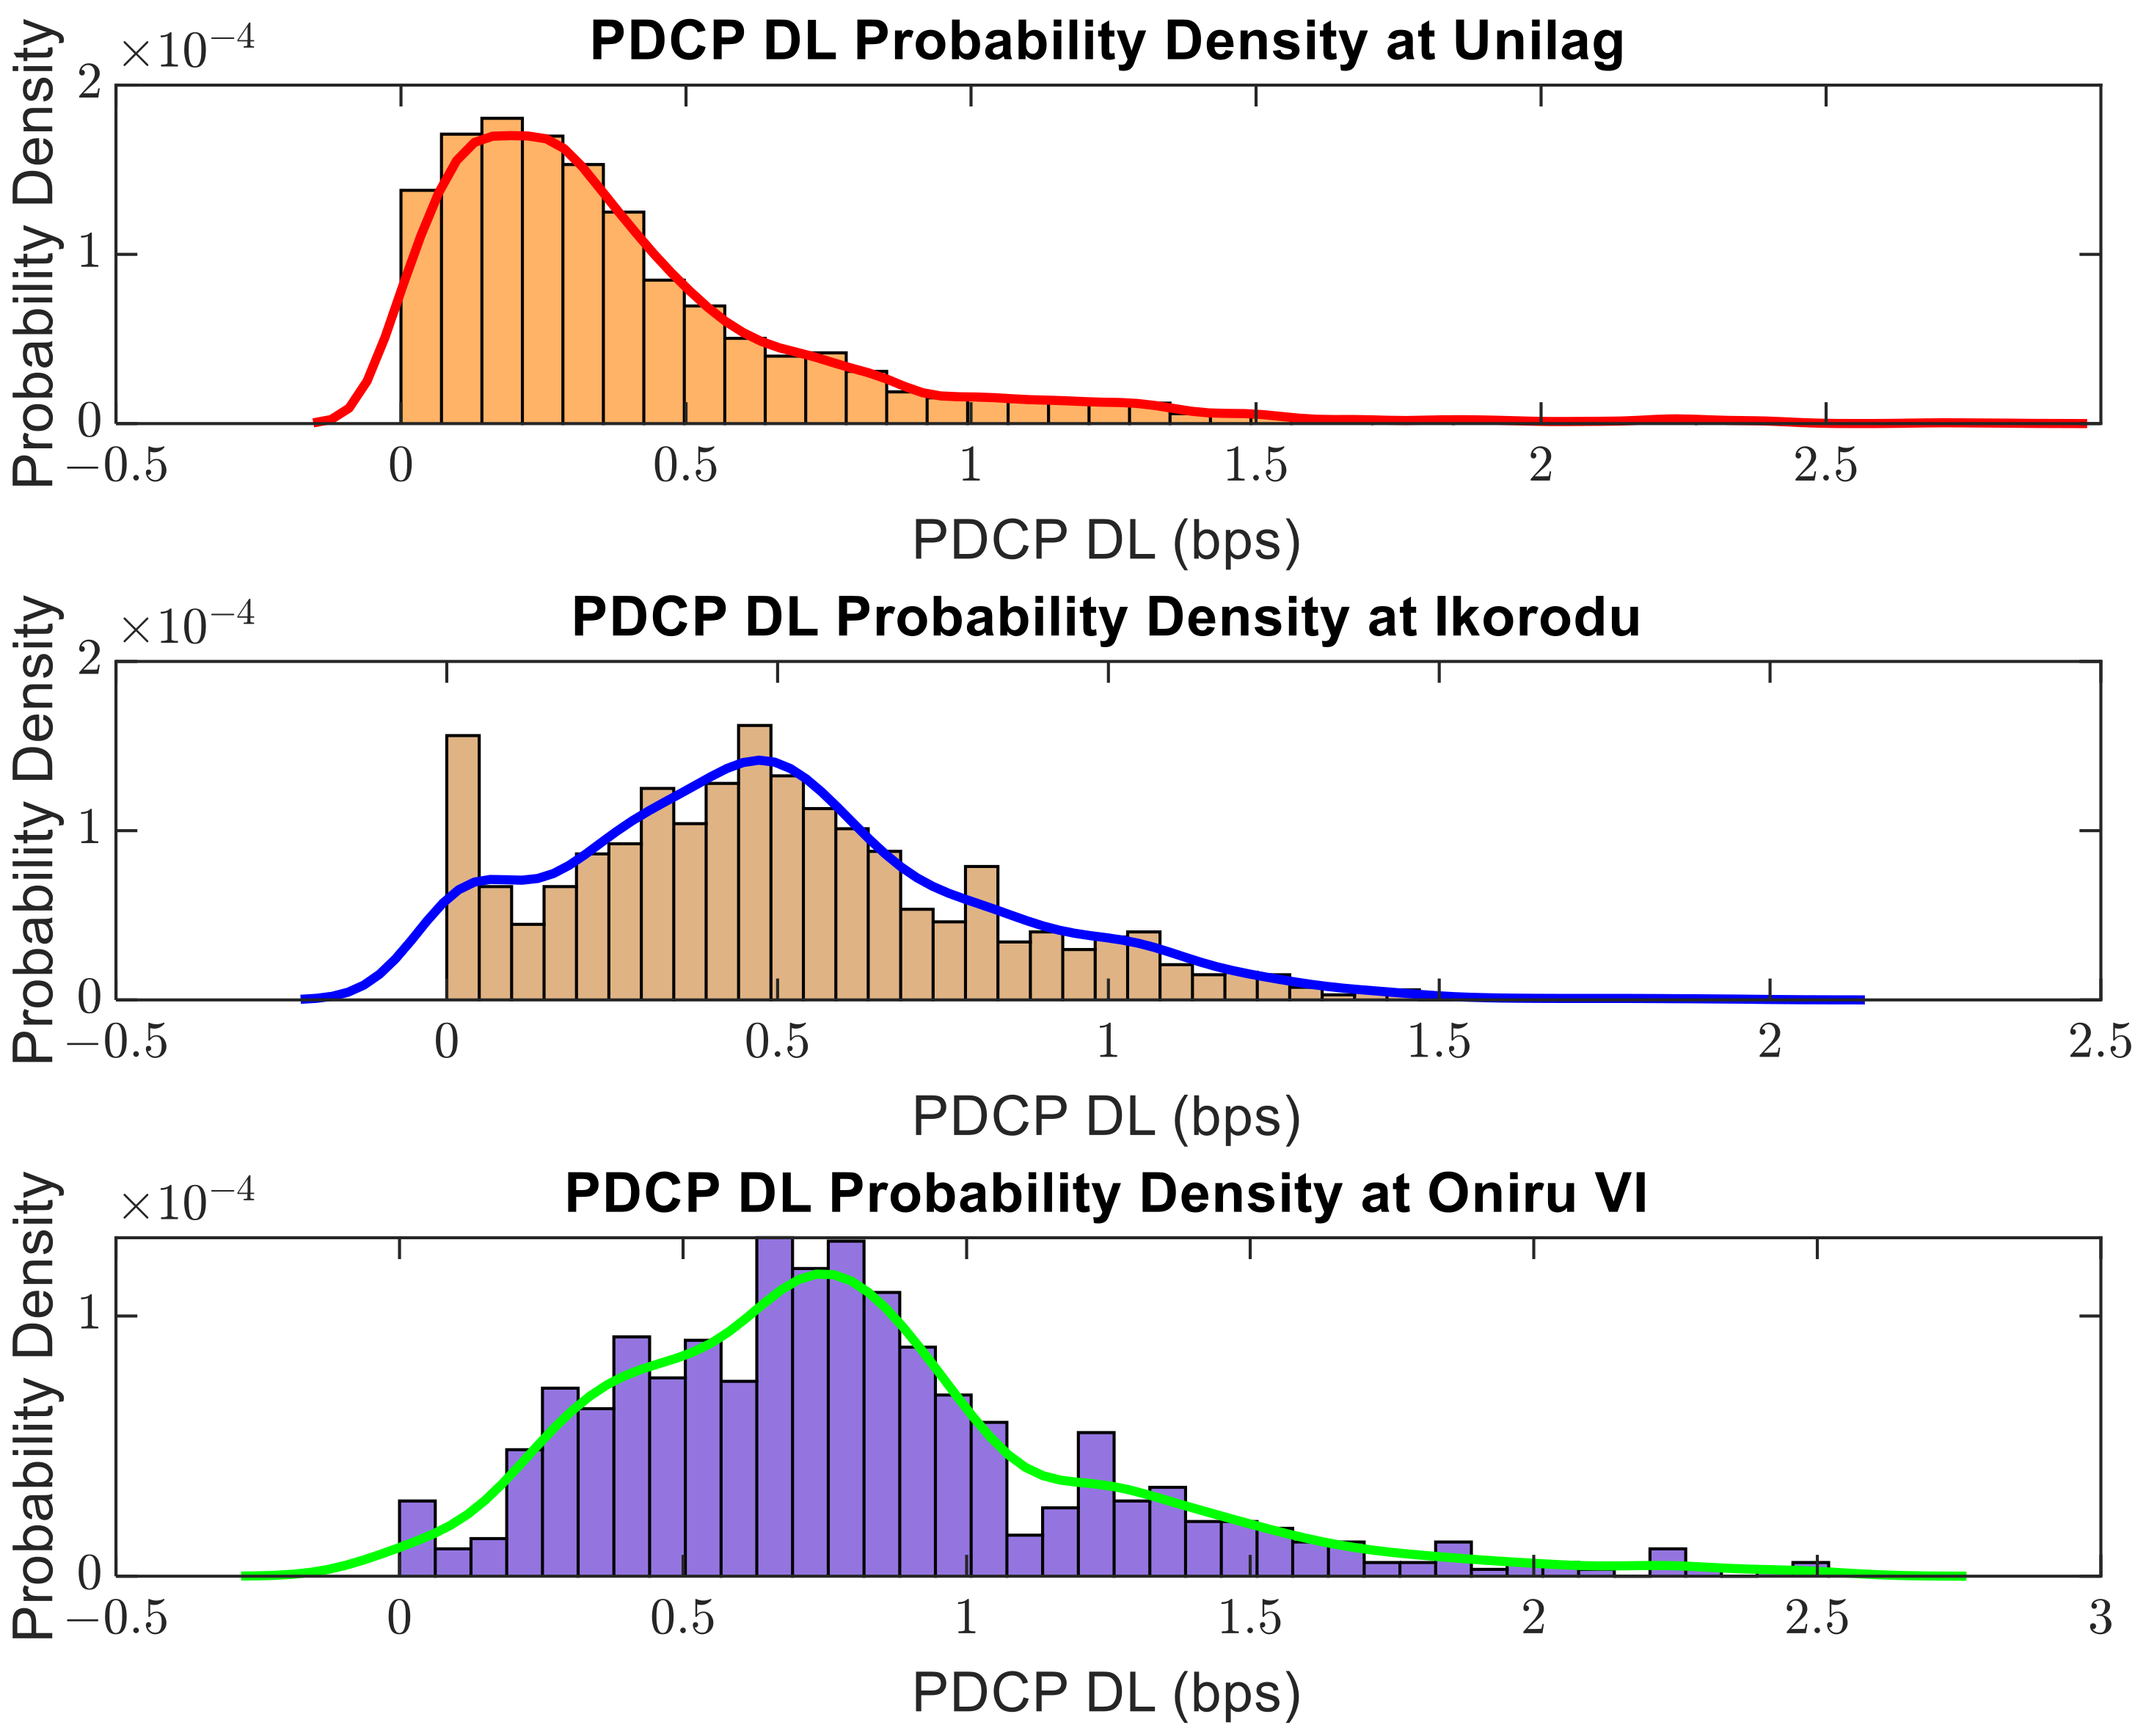
4.2. Statistical Data Analysis and Visualization of Measured Data

The statistically analyzed data from the measured values in the three locations are presented in this section. Table 2, Table 3 and Table 4 are the statistical data for UNILAG, Ikorodu, and Oniru VI, respectively. As expected, missing data influences the computational results, as seen especially in Table 3 and Table 4. Therefore, all the considered metrics are analyzed in order to show their face value comparison, especially at specific locations. The percentage of missing data is also computed to ascertain the statistical viability of the computed data. A summary of the statistical data of the measurements from Oniru VI is presented in Table 5.

4.3. The Measure of Data Distribution

4.3.1. A Multidimensional Approach to the Examination of the QoS Obtained

Figure 8, Figure 9, Figure 10, Figure 11, Figure 12 and Figure 13 compare the metrics individually in forty bin histograms. Figure 8 is the histogram of the RSRP for the three locations. A strategy that presents the result for the locations in subplots has been adopted to ensure that the trends are seen. Figure 9 shows the histogram for the RSRQ obtained at different distances from the base station. Figure 10 shows the signal strength distribution for the three locations as recorded. Figure 11 shows the ratio of the packet component carrier (PCC) to the signal-to-noise ratio (SINR) for UNILAG and Ikorodu. The measured data from Oniru VI was not sufficient enough to compute the histogram for the PCC/SINR. Figure 12 and Figure 13 are the histograms for the download speeds (PCC-PHY and PCDP) obtained in all locations.
Clear trends can be seen in the histograms (Figure 8, Figure 9, Figure 10, Figure 11, Figure 12, Figure 13 and Figure 14), which will form the basis of the discussion in Section 4.5. Figure 8 shows that the RSRP data for two out of the three locations follow the shape of a normal distribution. Although the Oniru VI values are slightly skewed to the left, the same trend is not seen in UNILAG and Ikorodu values on the first and second subplots. This indicates that despite having respective means, the distributions of the RSRP values for the three locations have different characteristics. The shape of the Oniru histogram indicates that the value of the mean is much less than the median or mode [43]. The presence of outliers on the right end of the Oniru VI value histogram suggests the possibility of a wide disparity between the RSRP values recorded in certain locations compared to the overall data set. However, the Ikorodu values show a more clustered distribution of the data on the left and right of the modal values.
In the case of the RSRQ, the histograms seem to follow a normal distribution; however, on closer observation, it is clear that the values are pulled to the right for each of the subplots, indicating that more of the data is higher than the mean value. In Figure 10, the histograms are right-skewed, indicating that the median signal strength is lower than the mean value. It is also a sign that many of the values are near the lower end of the range, and higher values are infrequent. Figure 12 and Figure 13 show that the download speeds shown by the throughput values are positively skewed. The bimodal shape of the PDCP throughput in the Ikorodu area shows that there are lower speeds recorded in that area compared to the mean values obtained for the area. In Figure 12 and Figure 13, the download speeds obtained in Oniru VI show a wider spread of values and they are less skewed to the right compared to the speeds recorded at UNILAG and Ikorodu.

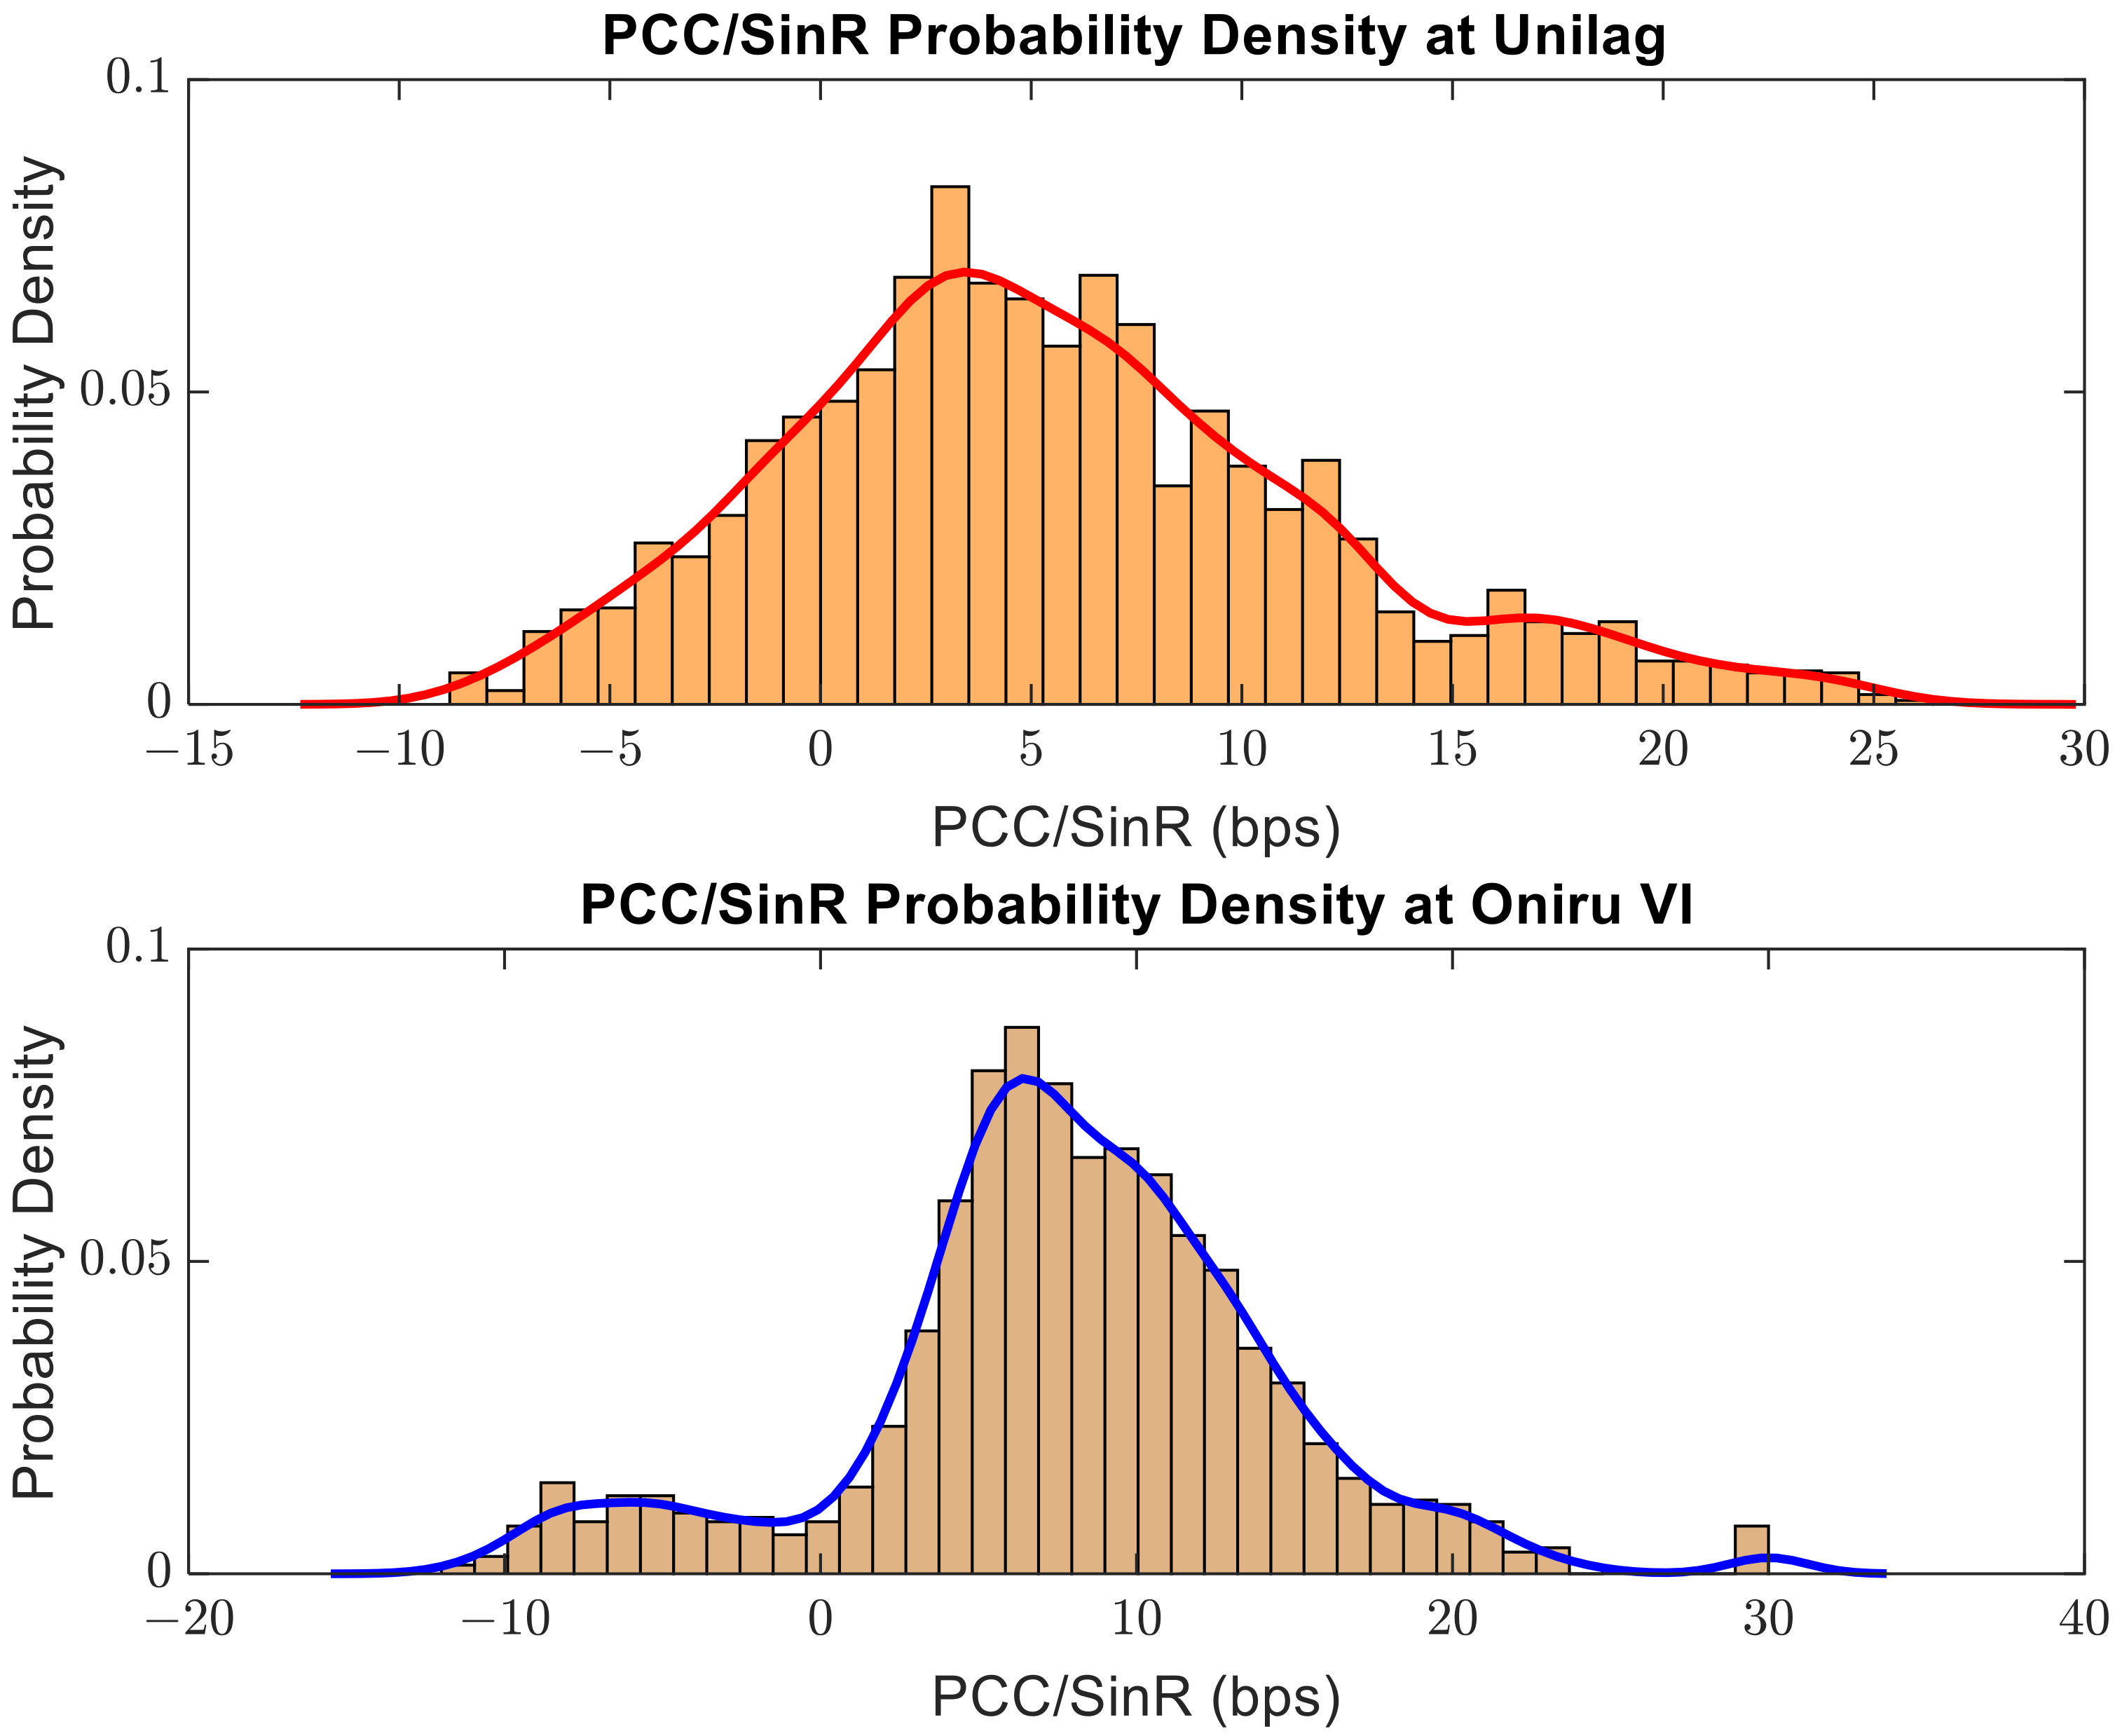
4.3.2. Probability Density

Equally important is the consistency in our measured data. Say an optimal RSRP, RSSI, and throughput value are found. What would be the probability of finding these values in the area where this experiment was conducted? Figure 14, Figure 15, Figure 16, Figure 17, Figure 18 and Figure 19 present the normalized probability distribution function of the measured data. The probability of obtaining specific metrics values is also presented, and a normalized curve is used to show the congruence of the data. Figure 14 is the probability density function of the RSRP values for the three locations. Figure 15 highlights how the RSRQ values are distributed, with Oniru VI showing higher chances (about 0.9 pdf value) of obtaining the −7 dB to −9 dB range. Measured in decibels, the most probable RSSI values obtainable in the three locations can be seen in Figure 16. Figure 17 shows a probability density function (pdf) of the ratio of the packet component carrier (PCC) to the signal-to-noise ratio (SINR) for two locations. In terms of download speeds, Figure 18 and Figure 19 show the most probable download speeds over the network at the three locations using the physical and logical links, respectively.
In line with the deductions from the histograms in Figure 8, Figure 9, Figure 10, Figure 11, Figure 12, Figure 13 and Figure 14, the PDF graphs and curves provide more detailed information on the likelihood of sustaining various values for the different metrics considered. As expected, we observe that certain value ranges are more readily available, with corresponding higher probabilities of being obtained in the sample space (environment). For example, the PDF curve for RSRP in Unilag assumes an almost bimodal shape with two peaks, indicating that the data record a pattern where two ranges of values are more likely to be obtained in the environment. This confirms existing literature that wireless network parameters are not evenly distributed and may occur in clusters [44,45,46,47,48]. Although a similar graph is seen in the RSRP curve for Ikorodu, there is a significant disparity between the modal values. Additionally, it is important to note that the three graphs are skewed to the right, with fewer outliers found in the Oniru VI graph.
However, the graph in Figure 15 is similar to a bell-shaped curve slightly tilted to the right, which is expected of real-world data. Describing the RSRQ values for the three locations, we can observe that the curve forms a kurtosis greater than three with heavy tails, especially in Ikorodu. This confirms that we have a normal distribution, even if the graph is slightly skewed to the right. The PDF functions for the PCC DL and the PDCP DL are almost identical in each case. This may indicate that the MNO has made efforts to provide hardware that can sustain similar physical and logical download speeds.

4.4. Optimization Results for the Specific Metrics

Algorithm 2 shows the pseudocode modifications made to the general PSO algorithm in Algorithm 1 to suit the measured data for the optimization of the specific objective function.
Algorithm 2: PSO algorithm with the objective function, the upper and lower bound for obtaining the global and personal best positions and velocities of a swarm
Input: objective function ( f )
    upper and lower bound of the search space
    population size ( N )
    maximum number of generations m a x _ g e n
    inertia weight w
    cognitive constant c 1
    social constant c 2
Output :   g b e s t o p t : Optimized global best value
      p b e s t o p t : Optimized personal best value
    1.   START
    2.   % Step 1: Initialization
    3.   for i = 1:N
    4.      x i , :   = random initialization within the search space
    5.      v i , : = zeros(1,dimension) % Initialize velocity to zero
    6.      p b e s t i , : = x i , :
    7.      p b e s t _ f i t n e s s i = f x i , :
    8.   end for
    9.  
    10. % Initialize global best position and fitness
    11.  [ global _ best _ fitness ,   i d x ] = min ( p b e s t _ f i t n e s s )
    12.  g b e s t = p b e s t i d x , :
    13. 
    14. % Step 2: Main loop
    15.  for   t = 1 :   m a x _ g e n
    16.     % Loop through each particle in the swarm
    17.      for i = 1:N
    18.        % Step 3: Update particle velocity and position
    19.      v i , : = w × v i , : + c 1 × r a n d 1 , d i m e n s i o n . × p b e s t i , : x i , :  
    20.          + c 2 × r a n d 1 , d i m e n s i o n . × g b e s t x i , :
    21.      x i , : = x i , : + v i , :
    22.        
    23.        % Step 4: Check if the new position is within bounds
    24.        % Apply boundary conditions
    25.        for d = 1: dimension
    26.             if   x i , d > x m a x then
    27.           x i , d = x m a x
    28.           v i , d = v i , d % Reverse velocity if out of bounds
    29.             else   if   x i , d < x m i n  
    30.           x i , d = x m i n  
    31.           v i , d = v i , d
    32.            end if
    33.        end for
    34.        
    35.        % Step 5: Update personal best
    36.         fitness =   f x i , :
    37.         if   fitness   <   p b e s t _ f i t n e s s i
    38.             p b e s t i , : = x i , :
    39.             p b e s t _ f i t n e s s i = fitness
    40.        end if
    41.        
    42.     end for
    43.     
    44.     % Step 6: Update global best
    45.      c u r r e n t _ b e s t _ f i t n e s s ,   i d x = m i n p b e s t _ f i t n e s s
    46.      if   c u r r e n t _ b e s t _ f i t n e s s < g l o b a l _ b e s t _ f i t n e s s
    47.         g l o b a l _ b e s t _ f i t n e s s = c u r r e n t _ b e s t _ f i t n e s s
    48.         g b e s t = p b e s t i d x , :
    49.     end if
    50. 
    51. end for
    52. STOP
A comparison between the measured values and the optimized solutions from the PSO algorithm for the RSRP, RSRQ, RSSI, and SINR is shown in Table 6. Mean values for the metrics have been selected for the different locations to indicate the viability of the values, and where the mean values could not be computed due to excessive missing data, the “−” symbol has been used to fill in the gap.
Table 7 presents a comparison between the optimized and unoptimized values. The best value from the RSRP optimization found was 72.54   dBm , with an RMSE of 10.11   dBm for the optimized values compared to 68.51   dBm for the original values. Similarly, for the RSSI optimization, the best value found was also 69.42   dBm , with an RMSE of 9.21   dBm for the optimized values compared to 68.51   dBm for the original values. Furthermore, the best RSRQ value found was 9.04   dB , with an RMSE of   4.38   dB for the optimized values compared to 9.62   dB for the original values.
In addition, we also applied PSO to optimize the signal-to-interference-plus-noise ratio (SINR) values using the already optimized RSRQ, RSRP, and RSSI values. However, we found no improvement in the RMSE of the SINR values because we used the already optimized values against themselves.

4.5. Discussion of Results

The obtained results are discussed as follows:
The comprehensive summary of the performance metrics from the DT in Lagos (UNILAG, Ikorodu, and Oniru VI) in Table 2, Table 3 and Table 4 show a compromise with existing literature [49,50,51]. Where the available data was not enough to compute the result required, the use of a dash (−) has been adopted in the tables. It is clear from Table 2, Table 3 and Table 4 that the RSRP for the three locations has a maximum value within the −50 dBm range. This appears to be the threshold that Etisalat provides across the areas covered. Also noteworthy is the range of the RSRP, which goes from as low as 34.37 dBm in Oniru VI to 53.90 dBm in UNILAG and 62.74 dBm in Ikorodu. The close gap in the values obtained in the case of UNILAG in Table 3 may be dependent on the proximity of the structures and the topographical layout of the terrain. Such tight value difference may be beneficial, as users in the area of poor RSRP values (allocated less RB) would experience a QoS close to that of users receiving the highest RSRP in the area. The highest values of RSRP were obtained in Oniru VI (Table 5). It will, however, not be accurate to state emphatically that users in this area experience better 4G LTE QoS because they record the highest RSRP values. As seen in Table 4, Ikorodu records higher RSRQ values (−0.44 dB) than Oniru ( 4.38   dB ), suggesting that users may experience seamless cell reselection and handover rates in Ikorodu compared to Oniru VI.
Also noteworthy is that the values obtained from the UNILAG area consistently lie within the highest and lowest values of RSRP and RSRQ. On the surface, this suggests fewer erratic signals compared to the other areas, but this is quickly disputed by the simulation of the RSRP and RSRQ values shown in Figure 2 and Figure 3, respectively. NCC recommends RSSI values of 95   dBm at the edge of the cell radius of the base transceiver station. As seen in the values obtained, while there is a record at Ikorodu of 85.05   dBm , a value very close to the recommended signal strength, and 82.23   dBm for UNILAG, Oniru VI happens to lag as a distant third with 63.93   dBm . This is most likely caused by poor network mapping and routing coupled with a poorly executed urban housing design. Low RSSI can quickly have an unfavorable effect on user network reception. The erratic RSSI simulation in Figure 4 shows how unreliable the QoE a user in Oniru VI tends to get is when other signal-reducing factors, such as UE distance from the transceiver, physical obstruction to the wave propagation, and radio interference, are considered. However, one may associate the poor RSSI values in the area with these same factors, as Oniru VI is an urban settlement with all the aforementioned limiting factors in abundance. Despite the commendable RSSI values obtained in Ikorodu and UNILAG, the degree of dispersion of the signal recorded en route to the area is also not encouraging. With a range of 46.31   dBm and 51.05   dBm for UNILAG and Ikorodu, respectively, it is clear that a user at the high receiving end will experience network quality that is greatly dwarfed by a user at the low end of the spectrum.
Marred by missing values of about 0.91 % to 5.76 % , the throughput (data rate) obtained is considered unreliable for making informed inferences. Furthermore, it became difficult to compute the standard deviation and variance of these KPIs without compromising the practicality of the data by using sophisticated algorithms such as the PCHIP to presumptuously fill in the missing data blocks. However, the data obtained was sufficient to monitor the signal speeds and download bits per second obtained at different distances from the base station.
Since it is common to experience signal clusters in wireless communication services such as MBB networks where certain areas from the base transceiver station (BTS) have high signal strengths while other areas are marred with low signal coverage experience, Figure 8, Figure 9, Figure 10, Figure 11, Figure 12 and Figure 13 shows how the various network KPIs are distributed at 50 block locations away from the base stations in the three areas. From Figure 8, it is clear that the signal clusters around about 0.9   km away from the BTS. With a sharp build-up, it can be said the MNO signal in Ikorodu has a wider spread and reaches most of the area. For Oniru VI, however, it indicates areas where it may be difficult to get reception despite a strong area of clustered network strengths elsewhere. Figure 9 helps visualize the distribution of the RSRQ values in Table 2, Table 3 and Table 4. The lean distribution in the RSRQ signal across the different areas confirms the strong variance values in Table 2, Table 3 and Table 4. Figure 8, Figure 9, Figure 10, Figure 11, Figure 12 and Figure 13 overview how the different signals are distributed across the areas.
From Figure 14, we can predict a 0.07 chance of finding a 90   dBm RSRP value at any part of UNILAG. Though different values are true for Ikorodu, Oniru VI has a denser value range and there is a higher chance (0.2) of finding an RSRP signal value from 70   dBm to 73   dBm at any given part of Oniru. This is a very interesting analysis, as it shows us the possibility of establishing a near-consistent network reach. Despite being low, a 0.2 chance of obtaining the peak RSRP values in Oniru shows that when optimized, Oniru VI can experience a more uniform spread of the MBB strength. In contrast, the lower RSRP values quickly decrease in their respective availability, making it difficult to maintain such a spread. It is therefore important that the cause of the sharp network decline in the area be investigated and such problems addressed before the application of optimized network parameters. Unimpressive probabilities are also associated with the RSRQ of Oniru Island. While there is a near-unity probability prediction to get an RSRQ value of 9   dB , it quickly becomes difficult to get lower or higher values, as the probability of getting any value declines sharply. From Figure 15, Figure 16, Figure 17, Figure 18 and Figure 19, the trend of high signal values having high probabilities and lower or less common values having a sharp decline in availability is seen in Oniru VI, confirming a fundamental network planning problem in the area. Another culprit could be the size of missing data in the measured values.
In general, our experimental design choice of maintaining the integrity of the measured data has been followed in earnest. This is why all plots and statistical analyses were done without filling in the missing data by use of appropriate algorithms. As seen in Figure 2, Figure 3, Figure 4, Figure 5, Figure 6 and Figure 7, visual perception of the data confirms our informed guess from the statistical analysis. While the RSRP values in Oniru VI (green) seem to maintain a lower level of variance compared to the signals from UNILAG and Ikorodu, its values barely make it past the 65   dBm values, which are considered unacceptable [17]. Sharply contrasting with the consistency in the Oniru values is the Ikorodu set of measurements. Having the highest range, it is clear that the best and worst RSRP values and the effect of such values are common in Ikorodu. In Figure 3, the consistency in values is still maintained by the Oniru VI values. As expected, Ikorodu values are also the most varied, and stability is mostly found in the UNILAG values. Technically, this confirms our initial inference that cell reselection and handover would be more seamless in UNILAG than in Ikorodu and worst in Oniru VI. Regarding signal strength, it is clear from Figure 4 that UNILAG and Ikorodu record better value ranges. However, the most consistent values in Oniru may be an advantage here as users across different areas within the network reach will experience almost similar signal strengths when available.
Surprisingly, Figure 5, Figure 6 and Figure 7 indicate that high data rates are more common in the UNILAG and Oniru areas compared to Ikorodu. Although more erratic, the throughput signal levels indicate that more data speeds are recorded in UNILAG than in Ikorodu. As stated in Section 4.2, this may be due to actual MBB differences or owed to the lapses in the measurement data obtained.
While executing the PSO in Algorithm 2, it is important to highlight at this point that in assigning the upper and lower boundaries, the least and highest values obtained during the test were used so that the swarm was forced to search within the sample space of the 3086 rows of data recorded during the test for the RSRP, RSRQ, and RSSI optimization procedures. The SINR values were not measured, and as such, a prior initialization of data was performed using an appropriate objective function. As presented in Table 6, we can see that the optimized values, though not exactly the values set by the NCC, are much closer to the specified values. Nonetheless, these values have considered the environmental factors and the hardware limitations of the MNO in operation.

4.6. Findings

From the data analyzed and real-life experience while using the MNO network in real-time, the trends and patterns can be summarized in the following findings:
  • The RSRP or any other relevant KPI is not sufficient enough on its own to determine the QoS of an MNO, as observed from the UE.
  • To get better MBB performance in Lagos, especially the sample space researched, a thorough mapping and possible replanning of the routes and the hardware used may be necessary.
  • From the probability distribution functions, the chances of getting the best value obtained from the PSO optimization are 0.02, 0.018, and 0.035 in UNILAG, Ikorodu, and Oniru VI, respectively.
  • For instance, in areas such as UNILAG, the QoS of one user at a location with good receptivity is greatly dwarfed by the experience of a user at a location with poor reception.
  • Though there seems to be a consistency in value with the data obtained in Oniru VI, the measured values generally indicated poorer user experience in that area.

5. Conclusions

Based on the findings of this study, it can be concluded that relying solely on a single KPI, such as RSRP, is insufficient for assessing a mobile network operator’s quality of service as perceived by end-users. In order to improve mobile broadband performance in the areas under study, a detailed mapping process and potential route and hardware redesign may be required. This can help with issues such as congested networks and insufficient network coverage. According to the probability distribution functions, there was a relatively small chance that the PSO optimization would produce the best results in each of the three areas under consideration. However, the results showed that the PSO successfully optimized the RSSI and RSRP values, significantly reducing the RMSE of 59.30   dBm and 58.40   dBm between the original and optimized values, respectively. Although the improvement in RMSE for the SINR ( 0   dB ) and the RSRQ ( 5.24   dB ) was not as significant as in the case of RSRP and RSSI, the optimized values can still contribute to better network planning and optimization, leading to improved network performance and quality user experience. The findings also highlight the significance of network reception in influencing user experience. One user’s QoS in a location with good reception differs significantly from one with poor reception. Finally, while the values obtained in Oniru VI are consistent, the results indicate a generally worse user experience than in UNILAG and Ikorodu. These findings could provide mobile network operators with valuable information for improving their services and user experience. Future research could explore alternative optimization algorithms and additional network parameters to improve the accuracy and application of the results obtained. Future work will provide correction factors for applying the optimized models in other related dense urban environments.

Author Contributions

The manuscript was written through the contributions of all authors. A.L.I. and F.U. were responsible for the conceptualization of the topic; article gathering and sorting were carried out by A.L.I. and F.U.; manuscript writing, and original drafting and formal analysis was carried out by A.L.I., F.U., J.I. and C.-C.L.; writing of reviews and editing were carried out by A.L.I., F.U., J.I. and C.-C.L.; and A.L.I. led the overall research activity. All authors have read and agreed to the published version of the manuscript.

Funding

The work of Agbotiname Lucky Imoize is supported by the Nigerian Petroleum Technology Development Fund (PTDF) and the German Academic Exchange Service (DAAD) through the Nigerian–German Postgraduate Program under grant 57473408.

Institutional Review Board Statement

Not applicable.

Informed Consent Statement

Not applicable.

Data Availability Statement

The data that support the findings of this paper are available from the corresponding author upon reasonable request.

Conflicts of Interest

The authors declare no conflict of interest related to this work.

Abbreviations

AbbreviationMeaning
4GFourth Generation
5GFifth Generation
BTSBase Transceiver Station
CPWCoplanar Waveguide
CSVComma Separated Values
DLDownlink
DPEDirect Position Estimation
DTDrive Test
eMBBEnhanced Mobile Broadband
UEUser Equipment
FDDFrequency Division Duplex
GPS Global Positioning System
IoTInternet of Things
KPIsKey Performance Indicators
LDPCLow-Density Parity-Check
LTELong Term Evolution
MATLABMatrix Laboratory
MIMOMultiple Input Multiple Output
MLMaximum Likelihood
MNOsMobile Network Operators
mMIMOMassive Multiple Input Multiple Output
mMTCMassive Machine-Type Communication
mmWavesMillimeter waves
NCCNigerian Communications Commission
OFDMAOrthogonal Frequency Division Multiple Access
PCC PHY DL ThroughputPhysical Channel Control Downlink Throughput
PDCP DL ThroughputPacket Data Convergence Protocol Downlink Throughput
RMSERoot Mean Square Error
ULUplink
UMTSUniversal Mobile Telecommunication Service
URLLCUltra-Reliable Low-Latency
V2XVehicle-to-Everything
WiMAXWorld Wide Interoperability for Microwave Access

References

  1. El-Saleh, A.A.; Alhammadi, A.; Shayea, I.; Hassan, W.H.; Honnurvali, M.S.; Daradkeh, Y.I. Measurement Analysis and Performance Evaluation of Mobile Broadband Cellular Networks in a Populated City. Alex. Eng. J. 2023, 66, 927–946. [Google Scholar] [CrossRef]
  2. Imoize, A.L.; Obakhena, H.I.; Anyasi, F.I.; Sur, S.N. A Review of Energy Efficiency and Power Control Schemes in Ultra-Dense Cell-Free Massive MIMO Systems for Sustainable 6G Wireless Communication. Sustainability 2022, 14, 11100. [Google Scholar] [CrossRef]
  3. Ogundokun, R.O.; Awotunde, J.B.; Imoize, A.L.; Li, C.T.; Abdulahi, A.T.; Adelodun, A.B.; Sur, S.N.; Lee, C.C. Non-Orthogonal Multiple Access Enabled Mobile Edge Computing in 6G Communications: A Systematic Literature Review. Sustainability 2023, 15, 7315. [Google Scholar] [CrossRef]
  4. Silalahi, L.M.; Simanjuntak, I.U.V.; Budiyanto, S.; Silaban, F.A.; Rochendi, A.D.; Osman, G. Analysis of Lte 900 Implementation to Increase Coverage and Capacity of 4g Lte Network on Telkomsel Provider. In Conference on Broad Exposure to Science and Technology 2021 (BEST 2021); Atlantis Press: Amsterdam, The Netherlands, 2022. [Google Scholar]
  5. Taheribakhsh, M.; Jafari, A.; Peiro, M.M.; Kazemifard, N. 5G Implementation: Major Issues and Challenges. In Proceedings of the 2020 25th International Computer Conference, Computer Society of Iran (CSICC), Tehran, Iran, 1–2 January 2020; IEEE: Piscataway, NJ, USA, 2020; pp. 1–5. [Google Scholar]
  6. Alexis, C. Madrigal Waymo’s Robots Drove More Miles Than Everyone Else Combined. Available online: https://www.theatlantic.com/technology/archive/2019/02/the-latest-self-driving-car-statistics-from-california/582763/ (accessed on 9 April 2023).
  7. Shamaei, K.; Kassas, Z.M. Receiver Design and Time of Arrival Estimation for Opportunistic Localization with 5G Signals. IEEE Trans. Wirel. Commun. 2021, 20, 4716–4731. [Google Scholar] [CrossRef]
  8. Fascista, A.; Coluccia, A.; Ricci, G. A Pseudo Maximum Likelihood Approach to Position Estimation in Dynamic Multipath Environments. Signal Process. 2021, 181, 107907. [Google Scholar] [CrossRef]
  9. Esmaeily, A.; Kralevska, K. Small-Scale 5G Testbeds for Network Slicing Deployment: A Systematic Review. Wirel. Commun. Mob. Comput. 2021, 2021, 6655216. [Google Scholar] [CrossRef]
  10. Venkata, P.; Sowmya, S.; Nava Teja, R. Energy Efficiency Optimization & Resource Allocation of Cross-Layer Broad Band Wireless Communication Systems Using Dynamic Particle Swarm Optimization. Int. J. Mod. Trends Sci. Technol. 2021, 7, 5–11. [Google Scholar] [CrossRef]
  11. Al-Azzeh, J.S.; Odarchenko, R.; Abakumova, A.; Bondar, S. Method for QOE Monitoring and Increasing in Cellular Networks Based on QOE-to-QOS Mapping Using Spline Approximation. EURASIP J. Wirel. Commun. Netw. 2022, 2022, 43. [Google Scholar] [CrossRef]
  12. Goldstein, A.B.; Zarubin, A.A.; Onufrienko, A.V.; Elagin, V.S.; Belozertsev, I.A. Synchronization of Delay for OTT Services in LTE. In Proceedings of the 2018 Systems of Signal Synchronization, Generating and Processing in Telecommunications (SYNCHROINFO), Minsk, Belarus, 4–5 July 2018; IEEE: Piscataway, NJ, USA, 2018; pp. 1–4. [Google Scholar]
  13. Blaise, O.O.; Olujimi, A.D. A Comparative Review of Emerging Wireless Technology. Int. J. Sci. Res. Comput. Sci. Eng. Inf. Technol. 2020, 7, 163–175. [Google Scholar] [CrossRef]
  14. Ojo, S.; Imoize, A.; Alienyi, D. Radial Basis Function Neural Network Path Loss Prediction Model for LTE Networks in Multitransmitter Signal Propagation Environments. Int. J. Commun. Syst. 2021, 34, e4680. [Google Scholar] [CrossRef]
  15. Ibhaze, A.E.; Imoize, A.L.; Ajose, S.O.; John, S.N.; Ndujiuba, C.U.; Idachaba, F.E. An Empirical Propagation Model for Path Loss Prediction at 2100MHz in a Dense Urban Environment. Indian J. Sci. Technol. 2017, 10, 1–9. [Google Scholar] [CrossRef]
  16. Imoize, A.; Dosunmu, A. Path loss characterization of long term evolution network for Lagos, Nigeria. Jordan J. Electr. Eng. 2018, 4, 114–128. [Google Scholar]
  17. Imoize, A.L.; Tofade, S.O.; Ughegbe, G.U.; Anyasi, F.I.; Isabona, J. Updating Analysis of Key Performance Indicators of 4G LTE Network with the Prediction of Missing Values of Critical Network Parameters Based on Experimental Data from a Dense Urban Environment. Data Brief. 2022, 42, 108240. [Google Scholar] [CrossRef] [PubMed]
  18. Isabona, J.; Ugochukwu, C.C.; Imoize, A.L.; Faruk, N. An Empirical Comparative Analysis of 4G LTE Network and 5G New Radio. In Proceedings of the 2022 5th Information Technology for Education and Development (ITED), Abuja, Nigeria, 1–3 November 2022; IEEE: Piscataway, NJ, USA, 2022; pp. 1–5. [Google Scholar]
  19. Gbahabo, P.T.; Ajuwon, O.S. Mobile broadband and economic growth in Nigeria. Oradea J. Bus. Econ. 2019, 4, 65–78. [Google Scholar] [CrossRef]
  20. The World Bank Group. The World Bank Annual Report 2016; World Bank Publications—Books; The World Bank Group: Washington, DC, USA, 2016. [Google Scholar]
  21. Magray, M.I.; Karthikeya, G.S.; Muzaffar, K.; Koul, S.K. Compact Co-Design of Conformal 4G LTE and MmWave 5G Antennas for Mobile Terminals. IETE J. Res. 2022, 68, 2137–2148. [Google Scholar] [CrossRef]
  22. Barik, D.K.; Mali, S.; Ali, F.A.; Agarwal, A. Design and Analysis of RF Optimization in 2G GSM and 4G LTE Network. In Innovation in Electrical Power Engineering, Communication, and Computing Technology: Proceedings of Second IEPCCT 2021; Springer: Singapore, 2022; pp. 11–18. [Google Scholar]
  23. Yang, C.; Arizabaleta-Diez, M.; Weitkemper, P.; Pany, T. An Experimental Analysis of Cyclic and Reference Signals of 4G LTE for TOA Estimation and Positioning in Mobile Fading Environments. IEEE Aerosp. Electron. Syst. Mag. 2022, 37, 16–41. [Google Scholar] [CrossRef]
  24. De Antunes, E.O.; Caetano, M.F.; Marotta, M.A.; Araujo, A.; Bondan, L.; Meneguette, R.I.; Filho, G.P.R. Optimized Solutions for Deploying a Militarized 4G/LTE Network with Maximum Coverage and Minimum Interference. IEEE Trans. Netw. Serv. Manag. 2022, 19, 3645–3656. [Google Scholar] [CrossRef]
  25. Karim, S.; He, H.; Laghari, A.A.; Magsi, A.H.; Laghari, R.A. Quality of Service (QoS): Measurements of Image Formats in Social Cloud Computing. Multimed. Tools Appl. 2021, 80, 4507–4532. [Google Scholar] [CrossRef]
  26. Laghari, A.A.; He, H.; Memon, K.A.; Laghari, R.A.; Halepoto, I.A.; Khan, A. Quality of Experience (QoE) in Cloud Gaming Models: A Review. Multiagent Grid Syst. 2019, 15, 289–304. [Google Scholar] [CrossRef]
  27. Laghari, A.A.; He, H.; Karim, S.; Shah, H.A.; Karn, N.K. Quality of Experience Assessment of Video Quality in Social Clouds. Wirel. Commun. Mob. Comput. 2017, 2017, 8313942. [Google Scholar] [CrossRef]
  28. Laghari, A.A.; Jumani, A.K.; Laghari, R.A. Review and State of Art of Fog Computing. Arch. Comput. Methods Eng. 2021, 28, 3631–3643. [Google Scholar] [CrossRef]
  29. Jarschel, M.; Schlosser, D.; Scheuring, S.; Hoßfeld, T. Gaming in the Clouds: QoE and the Users’ Perspective. Math. Comput. Model. 2013, 57, 2883–2894. [Google Scholar] [CrossRef]
  30. Laghari, A.A.; He, H.; Shafiq, M.; Khan, A. Assessing Effect of Cloud Distance on End User’s Quality of Experience (QoE). In Proceedings of the 2016 2nd IEEE International Conference on Computer and Communications (ICCC), Chengdu, China, 14–17 October 2016; IEEE: Piscataway, NJ, USA, 2016; pp. 500–505. [Google Scholar]
  31. Atxutegi, E.; Fajardo, J.O.; Ibarrola, E.; Liberal, F. Experimental Suitability Evaluation of Standardized QoS Measurements over Mobile Broadband Networks. In Proceedings of the 2017 International Conference on Performance Evaluation and Modeling in Wired and Wireless Networks (PEMWN), Paris, France, 28–30 November 2017; IEEE: Piscataway, NJ, USA, 2017; pp. 1–6. [Google Scholar]
  32. Laghari, A.; He, H.; Laghari, R.; Khan, A.; Yadav, R. Cache Performance Optimization of QoC Framework. ICST Trans. Scalable Inf. Syst. 2019. [Google Scholar] [CrossRef]
  33. Astely, D.; Dahlman, E.; Furuskar, A.; Jading, Y.; Lindstrom, M.; Parkvall, S. LTE: The Evolution of Mobile Broadband. IEEE Commun. Mag. 2009, 47, 44–51. [Google Scholar] [CrossRef]
  34. Ozovehe, A.; Usman, A. Performance Analysis of Gsm Networks in Minna Metropolis of Nigeria. Niger. J. Technol. 2015, 34, 359. [Google Scholar] [CrossRef]
  35. Deepak, N.R.; Balaji, S. Performance Analysis of MIMO-Based Transmission Techniques for Image Quality in 4G Wireless Network. In Proceedings of the 2015 IEEE International Conference on Computational Intelligence and Computing Research (ICCIC), Madurai, India, 10–12 December 2015; IEEE: Piscataway, NJ, USA, 2015; pp. 1–5. [Google Scholar]
  36. Navita; Amandeep. Performance Analysis of OFDMA, MIMO and SC-FDMA Technology in 4G LTE Networks. In Proceedings of the 2016 6th International Conference—Cloud System and Big Data Engineering (Confluence), Noida, India, 14–15 January 2016; IEEE: Piscataway, NJ, USA, 2016; pp. 554–558. [Google Scholar]
  37. Yadav, P.; Upadhyay, A.; Prasath, V.B.S.; Ali, Z.; Khare, B.B. Evolution of Wireless Communications with 3G, 4G, 5G, and Next Generation Technologies in India. In Advances in Electronics, Communication and Computing: Select Proceedings of ETAEERE; Springer: Singapore, 2021; pp. 355–359. [Google Scholar]
  38. Amin, P.; Yla-Jaaski, A. Improved Handover Mechanisms to Reduce Packet Forwarding in LTE-Advanced. In Proceedings of the 2013 9th International Wireless Communications and Mobile Computing Conference (IWCMC), Sardinia, Italy, 1–5 July 2013; IEEE: Piscataway, NJ, USA, 2013; pp. 831–836. [Google Scholar]
  39. Afroz, F.; Subramanian, R.; Heidary, R.; Sandrasegaran, K.; Ahmed, S. SINR, RSRP, RSSI and RSRQ Measurements in Long Term Evolution Networks. Int. J. Wirel. Mob. Netw. 2015, 7, 113–123. [Google Scholar] [CrossRef]
  40. Tanhatalab, M.R.; Jadeh, S.M.J.J.; Esfahani, A.O. Practical Schemes for Throughput Improvement in Live Networks. In Proceedings of the 2017 International Conference on Signals and Systems (ICSigSys), Bali, Indonesia, 16–18 May 2017; IEEE: Piscataway, NJ, USA, 2017; pp. 239–244. [Google Scholar]
  41. Hofer, W.; Svoboda, P.; Kastner, W.; Raida, V.; Rupp, M. Open Monitoring Platform for Mobile Broadband. In Proceedings of the 2020 IEEE 91st Vehicular Technology Conference (VTC2020-Spring), Antwerp, Belgium, 25–28 May 2020; IEEE: Piscataway, NJ, USA, 2020; pp. 1–5. [Google Scholar]
  42. Raida, V.; Svoboda, P.; Rupp, M. On the Inappropriateness of Static Measurements for Benchmarking in Wireless Networks. In Proceedings of the 2020 IEEE 91st Vehicular Technology Conference (VTC2020-Spring), Antwerp, Belgium, 25–28 May 2020; IEEE: Piscataway, NJ, USA, 2020; pp. 1–5. [Google Scholar]
  43. Burger, W.; Burge, M.J. Histograms and Image Statistics. In Digital Image Processing; Springer: Cham, Switzerland, 2022; pp. 29–48. [Google Scholar]
  44. Zhao, Y. Clustered Wireless Sensor Network Assisted the Design of Intelligent Art System. J. Sens. 2022, 2022, 3216727. [Google Scholar] [CrossRef]
  45. Mishra, P.K.; Verma, S.K. A Survey on Clustering in Wireless Sensor Network. In Proceedings of the 2020 11th International Conference on Computing, Communication and Networking Technologies (ICCCNT), Takayama, Japan, 14–16 September 2010; IEEE: Piscataway, NJ, USA, 2020; pp. 1–5. [Google Scholar]
  46. Zhong, L.; Shi, M.; Huang, Z.; Xin, P.; Jiang, J.; Li, G.; Lu, J. DBSCAN-Based Energy Consumption Pattern Clustering Identification Method for 5G Base-Station. In Thirteenth International Conference on Signal Processing Systems (ICSPS 2021); Xie, Y., Li, Q., Mao, K., Eds.; SPIE: Washington, DC, USA, 2022; p. 63. [Google Scholar]
  47. Narayanan, A.; Zhang, X.; Zhu, R.; Hassan, A.; Jin, S.; Zhu, X.; Zhang, X.; Rybkin, D.; Yang, Z.; Mao, Z.M.; et al. A Variegated Look at 5G in the Wild. In Proceedings of the 2021 ACM SIGCOMM 2021 Conference, Virtual Event, USA, 23–27 August 2021; ACM: New York, NY, USA, 2021; pp. 610–625. [Google Scholar]
  48. Imoize, A.L.; Ogunfuwa, T.E. Propagation Measurements of a 4G LTE Network in Lagoon Environment. Niger. J. Technol. Dev. 2019, 16, 36–42. [Google Scholar] [CrossRef]
  49. Imoize, A.L.; Orolu, K.; Atayero, A.A.-A. Analysis of Key Performance Indicators of a 4G LTE Network Based on Experimental Data Obtained from a Densely Populated Smart City. Data Brief 2020, 29, 105304. [Google Scholar] [CrossRef]
  50. Isabona, J.; Imoize, A.L. Terrain-Based Adaption of Propagation Model Loss Parameters Using Non-Linear Square Regression. J. Eng. Appl. Sci. 2021, 68, 33. [Google Scholar] [CrossRef]
  51. Imoize, A.L.; Oseni, A.I. Investigation and Pathloss Modeling of Fourth Generation Long Term Evolution Network along Major Highways in Lagos Nigeria. Ife J. Sci. 2019, 21, 39. [Google Scholar] [CrossRef]
Figure 1. Flowchart of optimization and measurement.
Futureinternet 15 00181 g001
Figure 2. Signal monitoring of the reference signal received power (RSRP).
Futureinternet 15 00181 g002
Figure 3. Signal monitoring of the reference signal received quality (RSRQ).
Futureinternet 15 00181 g003
Figure 4. Signal monitoring of the received signal strength indicator (RSSI).
Futureinternet 15 00181 g004
Figure 5. Signal monitoring of the ratio of the packet component carrier (PCC) to the signal-to-noise ratio (SINR).
Futureinternet 15 00181 g005
Figure 6. Signal monitoring of the packet component carrier (PCC) physical (PHY) downlink (DL) throughput.
Futureinternet 15 00181 g006
Figure 7. Signal monitoring of the packet data convergence protocol (PDCP) downlink (DL) throughput.
Futureinternet 15 00181 g007
Figure 8. Histogram of reference signal received power (RSRP).
Futureinternet 15 00181 g008
Figure 9. Histogram of reference signal received quality (RSRQ).
Futureinternet 15 00181 g009
Figure 10. Histogram of received signal strength indicator (RSSI).
Futureinternet 15 00181 g010
Figure 11. Histogram of the ratio of the packet component carrier (PCC) to the signal-to-noise ratio (SINR).
Futureinternet 15 00181 g011
Figure 12. Histogram of packet component carrier (PCC) physical (PHY) downlink (DL) throughput.
Futureinternet 15 00181 g012
Figure 13. Histogram of packet data convergence protocol (PDCP) downlink (DL) throughput.
Futureinternet 15 00181 g013
Figure 14. Probability density function of the reference signal received power (RSRP).
Futureinternet 15 00181 g014
Figure 15. Probability density function of the reference signal received quality (RSRQ).
Futureinternet 15 00181 g015
Figure 16. Probability density function of the received signal strength indicator (RSSI).
Futureinternet 15 00181 g016
Figure 17. Probability density function of the ratio of the packet component carrier (PCC) to the signal-to-noise ratio (SINR).
Futureinternet 15 00181 g017
Figure 18. Probability density function of the packet component carrier (PCC) physical (PHY) downlink (DL) throughput.
Futureinternet 15 00181 g018
Figure 19. Probability density function of the packet data convergence protocol (PDCP) downlink (DL) throughput.
Futureinternet 15 00181 g019
Table 1. Summary of the related works.
ReferenceScope and FocusContributionsLimitations
[1]A comprehensive analysis of the existing MBB performance in an urban area: Cyberjaya City, Malaysia.Provides suggestions, such as the deployment of more indoor hotspots for MBB providers to improve their performance networks.The suggestions and methods used are solely for the environment studied.
[5]Examination of important challenges in the implementation of 5G. Extensive documentation of possible 5G technological challenges common in mmWave communication, D2D communication, and security.No measurement of actual data to ascertain the degree of impact of the challenges discussed.
[7]Development of a 5G navigation system that utilizes the downlink channel in an opportunistic approach.Presentation of a 5G structure capable of exploiting the downlink channels using an experimental approach in evaluating the performance of the proposed structure with real 5G signals.Addresses the 5G network, which is yet to be implemented in developing countries such as Nigeria.
[8]Addressing the dramatic complexity of plain maximum likelihood (ML) formulation in direct position estimation (DPE).The proposition of a reduced-complexity algorithm based on the pseudo-ML approach.A theoretical approach backed by simulations forms the core of the study.
[9]A detailed review of existing cost-efficient and small-scale testbeds for the investigation of network slicing functionalities in 5G.Provision of a detailed study comprised of software packages and criteria for small-scale state-of-the-art testbeds for deploying network slicing.It is unspecified if the methods developed can be applied to areas where the 5G network has not been deployed.
[10]Use of DPOS to reduce the asset portion and energy proficiency in 5G systems.Provision of minimal solutions that address the energy and asset portion consumption in 5G networks.A completely theoretical approach devoid of experimental data is adopted.
[12]Prediction of the QoE for over-the-top (OTT) services in LTE technologies and their corresponding effects.Establishes the need for the monitoring of the QoS and QoE of MBB networks for the improvement of user experience.The measured data were not optimized, nor were suggestions made as to how MNOs can provide better service for user.
[13]An extensive review of the elements of wireless communication. Categorization and comparative analysis of varying types of wireless communication technologies.There is a need for the analysis of specific performance metrics of the technologies discussed.
[17]Extensive measurement and performance analysis of 4G LTE in two urban areas.An update of measurements and analyses performed in previous work in the environment.The analysis did not address the question of the distribution and optimization of the QoS in the environments considered.
[18]Experimental measurement and analysis of 4G and 5G networks.An empirical comparison between 4G LTE and 5G NR networks.Extensive research and analysis without optimization or suggestion for better QoS in 4G LTE networks.
[21]Design of conformal 4G and 5G MIMO antenna.Proposal of a MIMO antenna design to be integrated electrically.Design of MIMO antenna without actual testing and optimization of user experience.
[25]Qualitative QoS strategies that measure the image quality and QoS for download and uploading of images.Use of deep learning techniques to classify the quality of images.The work was focused on algorithmic logic, leaving out the place of actual testing, implementation, and optimization.
[34]Performance analysis of the KPIs for the GSM networks in Minna.Measurement and analysis of network KPIs in Minna, Nigeria.A costly suggestion of physical modifications of hardware without simulation.
Table 2. Measurement Parameters.
ParametersValues
Operating frequency ( f o p )1876.6 MHz
Downlink frequency ( f )1872.6 MHz
Uplink frequency ( f )1776.6 MHz
Receiver antenna height ( h a )1.5 m
Transmitter antenna height ( h t )30 m
Average building height ( h b )15 m
Average inter-building distance ( d b )20 m
Transmitter-receiver distance ( d t r )100 m
Base station transmitter power ( P t )46 dBm
Table 3. Statistical data of the measurements from UNILAG.
Statistical MeasureRSRP (dBm)RSRQ (dB)PCC/SINR (bps)RSSI (dBm)DL EARFCN (bps)PCC PHY DL (bps)PDCP DL (bps)
Range53.9016.6934.7146.310.0028,822.9428,040.11
Minimum value−112.95−18.62−8.63−82.231876.0068.000.00
Maximum value−59.05−1.9326.08−35.921876.0028,890.9428,040.11
Median value−92.21−8.964.84−69.251876.00
Mean value−91.74−9.355.53−68.061876.00
Standard deviation8.512.256.437.850.00
Variance72.495.0541.4061.630.00
Skewness0.74−0.830.540.91 2.082.11
Number of Missing values000008727
% of missing values0.000.000.000.000.002.410.75
Table 4. Statistical data of the measurements from Ikorodu.
Statistical MeasureRSRP (dBm)RSRQ (dB)PCC/SINR (bps)RSSI (dBm)DL EARFCN (bps)PCC PHY DL (bps)PDCP DL (bps)
Range62.7421.9441.7651.054524.0023,805.7019,223.97
Minimum value−117.99−22.38−11.76−85.051876.0080.000.00
Maximum value−55.25−0.4430.00−34.006400.0023,885.7019,223.97
Median value
Mean value
Standard deviation
Variance
Skewness0.66−1.92−0.181.024.100.570.66
Number of Missing values999998579
Percentage of missing values0.66%0.66%0.66%0.66%0.66%6.20%5.76%
Table 5. Statistical data of the measurements from Oniru VI.
Statistical MeasureRSRP (dBm)RSRQ (dB)PCC/SINR (bps)RSSI (dBm)DL EARFCN (bps)PCC PHY DL (bps)PDCP DL (bps)
Range34.3710.2733.940.0026,750.1724,837.20
Minimum value−88.25−14.65−63.931876.00175.800.00
Maximum value−53.88−4.38−29.991876.0026,925.9724,837.20
Median value−72.63−9.02−49.251876.00
Mean value−74.10−9.17−50.751876.00
Standard deviation5.580.865.610.00
Variance31.090.7431.490.00
Skewness−0.29−1.03−0.321.021.01
Number of Missing values00120800113
Percentage of missing values0.00%0.00%100%0.00%0.00%0.91%0.25%
Table 6. Summary of optimized and unoptimized results.
MetricMean of Unoptimized ValuesOptimized
Value
UNILAGIkoroduOniru VI
RSRP (dBm)−91.74−74−72.54
RSRQ (dB)−9.35−9.79.04
RSSI (dBm)−68.061.9396−50.7569.42
SINR (dB)15.57
Table 7. Summary of comparison between optimized and unoptimized results.
RSRP (dBm)RSRQ (dB)RSSI (dBm)SINR (dB)
Optimized Value−72.54−9.04−69.4215.57
RMSE of Original Data68.519.6268.51
RMSE of Optimized Solution10.114.389.21
Difference in RMSE−58.40−5.24−59.3000.00
Disclaimer/Publisher’s Note: The statements, opinions and data contained in all publications are solely those of the individual author(s) and contributor(s) and not of MDPI and/or the editor(s). MDPI and/or the editor(s) disclaim responsibility for any injury to people or property resulting from any ideas, methods, instructions or products referred to in the content.

