Article

Assessing Interactive Web-Based Systems Using Behavioral Measurement Techniques

by
Thanaa Saad AlSalem
* and
Majed Aadi AlShamari
*
Department of Information Systems, King Faisal University, Al-Ahsa 31982, Saudi Arabia
*
Authors to whom correspondence should be addressed.
Future Internet 2023, 15(11), 365; https://doi.org/10.3390/fi15110365
Submission received: 30 September 2023 / Revised: 29 October 2023 / Accepted: 6 November 2023 / Published: 11 November 2023
(This article belongs to the Special Issue Advances and Perspectives in Human-Computer Interaction)

Abstract

:
Nowadays, e-commerce websites have become part of people’s daily lives; therefore, it has become necessary to seek help in assessing and improving the usability of the services of e-commerce websites. Essentially, usability studies offer significant information about users’ assessment and perceptions of satisfaction, effectiveness, and efficiency of online services. This research investigated the usability of two e-commerce web-sites in Saudi Arabia and compared the effectiveness of different behavioral measurement techniques, such as heuristic evaluation, usability testing, and eye-tracking. In particular, this research selected the Extra and Jarir e-commerce websites in Saudi Arabia based on a combined approach of criteria and ranking. This research followed an experimental approach in which both qualitative and quantitative approaches were employed to collect and analyze the data. Each of the behavioral measurement techniques identified usability issues ranging from cosmetic to catastrophic issues. It is worth mentioning that the heuristic evaluation by experts provided both the majority of the issues and identified the most severe usability issues compared to the number of issues identified by both usability testing and eye-tracking combined. Usability testing provided fewer problems, most of which had already been identified by the experts. Eye-tracking provided critical information regarding the page design and element placements and revealed certain user behavior patterns that indicated certain usability problems. Overall, the research findings appeared useful to user experience (UX) and user interface (UI) designers to consider the provided recommendations to enhance the usability of e-commerce websites.

1. Introduction

Globally, e-commerce is increasingly growing without any signs of declining in the future. E-commerce has revolutionized business, offering organizations limitless possibilities for growth and success [1]. The ongoing growth of e-commerce is derived from advancements in product visualization, such as 3D presentation techniques [2,3]. Therefore, the user interface (UI) of websites is of great importance, and various graphical UI design principles, such as flexibility, simplicity, and learnability, should be ensured [4]. Users firstly judge the website through its UI and explore different pages with the aim of finding out different information about their inquiry [5,6]. To create a first, good lasting impression, the UI should be consistent across all the pages and through all times. This is mainly vital for e-commerce websites because they are regularly changing in line with the ongoing change in daily needs and promotional offers [7,8]. Usability is a quality aspect that helps users achieve their goals easily. Websites that have good usability attain users and ensure they are happy [5,9]. Usability measures how easily a user can utilize the interface [10]. The significance of usability evaluation is undeniable when designing a website [11]. It is also of crucial importance for already running websites [5].
Usability analysis is performed through traditional methods, including, but not limited to, click analysis and questionnaires. Nevertheless, such methods are not capable of addressing the aspects that the technological-centered websites present. They are not capable of providing the cognitive processes and direct information on a user’s thinking. It is challenging to evaluate these aspects through such traditional methods [12]. To ultimately improve technology-centered e-commerce websites, a number of behavioral measurement techniques are adopted, such as usability testing [13,14,15], heuristic evaluation [15,16,17], eye-tracking [18,19,20], electroencephalography (EEG) [21], and physiological measures [22]. However, each method has its advantages and disadvantages. Some methods report limited usability issues or minor ones only. Therefore, there are questions about their effectiveness in identifying valid, significant, and consistent problems.
In light of existing studies in the usability literature, it is observed that there is a lack of studies specifically related to conducting behavioral measurement techniques on e-commerce websites, particularly in Saudi Arabia. As e-commerce is a growing industry in Saudi Arabia, it is important to ensure that websites are user-friendly and provide a positive user experience. In view of this, there is a serious need to identify usability challenges and provide recommendations for improvements to enhance the online presence of businesses in the region and attract more customers. Based on that, this research aims to investigate the usability of two e-commerce websites in Saudi Arabia and compare the effectiveness of various behavioral measurement techniques, such as heuristic evaluation, usability testing, and eye-tracking. Specifically, the research selects the Extra and Jarir e-commerce websites in Saudi Arabia based on a combined approach of criteria and ranking. This research adapts an experimental approach in which both qualitative and quantitative approaches are used to collect and analyze the data. The contributions of this paper can be highlighted as follows:
-
The utilization of three different behavioral measurement techniques, which has not been addressed in previous studies, and the comparison of their effectiveness in identifying usability issues make a significant contribution to the field of website usability evaluation.
-
By incorporating a comprehensive comparative study of these behavioral measurement techniques, this research aims to advance the understanding and effectiveness of usability evaluation methods for e-commerce websites in Saudi Arabia, an area that has not received adequate attention thus far.
-
Based on the obtained results, this study provides detailed recommendations which are divided into three primary groups (for the Extra and Jarir websites, for e-commerce websites, and for usability elevators).
-
The identification of the strengths and weaknesses of the Extra and Jarir websites through our research provides insights into their usability and user experience (UX). As these websites attract a large number of daily visitors and hold considerable importance within the e-commerce sector in Saudi Arabia, it is crucial to ensure an optimal UX for users.
In fact, this research fills a critical gap by evaluating the usability of e-commerce websites specifically within the context of Saudi Arabia. It serves as a foundational study in addressing the importance of website usability in the Saudi Arabian context, where there is currently a lack of focused research on this specific problem. While the selection of conducting this research in Saudi Arabia may not be driven by a single explicit reason, the evaluation of the Extra and Jarir websites serves as a practical case within the e-commerce sector in general, which is relevant and significant to the Saudi Arabian context. Since e-commerce plays a crucial role in Saudi Arabia’s Vision 2030, contributing to various aspects such as economic diversification, job creation, digital infrastructure development, small and medium-sized enterprises (SME) growth, consumer convenience, and global competitiveness. We believe that our methodology and results can be applied to other e-commerce websites in similar contexts. However, through our recommendations and insights gained from the study, we mainly aim to specifically promote awareness and understanding of the significance of usability among Saudi websites and to motivate them towards enhancing the overall user experience.
The paper is organized as follows. Section 2 sheds light on relevant concepts and reviews the previous related studies, while Section 3 shows the followed research methodology. Section 4 analyzes the results of the study. Section 5 presents the experimental results. Section 6 discusses the findings. Section 7 displays the recommendations. Finally, Section 8 concludes the research with the limitations and presents future research.

2. Literature Review

2.1. Usability

Usability means the ease of using an interface [10], how friendly the application is in meeting users’ requirements, flexibility, and controllability of the application [7]. Usability is a vital component for electronic businesses [23]. It is essential to collect and analyze the user’s feedback on particular design elements that prevent or motivate users to behave in a certain way [24]. In general, assessing the usability of interfaces is a central and essential part of human–computer interaction (HCI) development [25,26]. Therefore, it has become a vital component for the success of various applications. According to ISO 9421-11, usability is defined as “The extent to which a product can be used by specified users to achieve specified goals with effectiveness, efficiency, and satisfaction in a specified context of use” [27]. The ISO definition refers to three attributes, namely, effectiveness, efficiency, and satisfaction. Effectiveness describes completeness and how accurate the process is of accomplishing particular goals [5]. Effectiveness shows whether users are able to complete a task within a specified time [28], and the webpage is judged to have poor usability if the task cannot be completed within this time, hence, it does not meet the design specifications [29]. For websites, the effectiveness measures include the percentage of successfully completed tasks, error rates, placement accuracy, ratio of correct to retrieved information, the ability of users to recall information from the webpage, completeness, quality of outcomes, and capability of understanding information from the interface [30]. When it comes to efficiency, it depends on the resources required to achieve goals [4]. It is an important aspect when measuring usability in regular usability testing that investigators compare products by recording the time each task takes to be completed [31]. However, efficiency and effectiveness include more than just task completion time and success; consequently, studies have also developed task difficulty ratings as measures of efficiency [32]. Satisfaction is the acceptability and comfortability of use [5]. To measure participants’ satisfaction, a range of validated and standardized usability surveys exist. For instance, the questionnaire for UI satisfaction [33], the system usability scale (SUS) [34], and the Single Ease Question (SEQ) [35].
Since usability is a vital aspect of websites, it is essential to have methods for measuring the appropriateness of the usability level [36]. Usability analysis is performed through conventional as well as modern methods. However, the conventional measures are not capable of addressing aspects that the technology-centered applications present. Methods like observation or questionnaire surveys are not capable of providing direct information about a user’s cognitive and thinking processes. Such aspects are challenging to evaluate through such traditional methods [12]. In addition, it is argued that “for different levels of user performance, different types of information are processed, and users will make different types of errors. Based on the error’s immediate cause and the information being processed, usability problems can be classified into three categories. They are usability problems associated with skill-based, rule-based, and knowledge-based levels of performance” [37]. This reflects how detecting usability issues is related to users’ performance and knowledge. Reaching this point, using measurement techniques for measuring such aspects and for finding how they influence usability is vital for the successful assessment of usability to ultimately improve e-commerce websites.

2.2. Usability and E-Commerce

In fact, the quality of an e-commerce website is vital for the success of e-commerce [38,39]. The significance of usability as a quality aspect is even greater in the e-commerce field; hence, embedding fundamental usability elements when developing e-commerce websites is crucial for their success [40]. Despite the growing increase in the e-commerce market over recent years, the actual convergence from only an online search into a purchase only occurs through 29% of users due to usability and security issues [41]. This fact, combined with high business competition, shows the importance for an e-commerce website to test usability and UX systematically [42]. For users to be satisfied, the absence of errors is necessary. Users need to identify the product they need easily and conveniently find what they want to complete their order and make payment with no difficulty [43]. It is indicated that in cases where a user’s experience was difficult when performing one of the previously mentioned tasks, it is probable that they leave the website and visit a different e-commerce website [44]. For that reason, online customer satisfaction is perceived as a key precursor of e-commerce success, and usability is reported as a key to increasing customer satisfaction [45]. Consequently, a range of studies has been carried out to test usability with indications of the need for further evaluation within this domain [12,41,46,47,48]. By the year 2050, it is expected that all commerce will convert into e-commerce [49]. For Saudi Arabia in particular, the significant role of e-commerce in websites is obvious through a number of statistical figures. According to a report from Statista, e-commerce revenue is likely to be USD 7703 M in 2021. By 2025, in the e-commerce sector, the number of users is expected to reach 34.5 M users. With a market volume of USD 2495 M, fashion has the biggest share in the market in 2021 [50].
A study was carried out with the purpose of identifying how effective are usability testing and heuristic evaluation methods in assessing the usability of e-commerce websites. To assess and compare these methods, the quantity, severity, and type of usability issues were detected by each approach. The cost of implementing these approaches was also taken into account. The findings showed the number and severity level of 44 distinct usability problem areas that were uniquely detected by either heuristic evaluation or user testing techniques, as well as common problems that both methods identified and problems that each method overlooked. The findings revealed that user testing successfully found major issues in four distinct areas, as well as minor issues in one area. The heuristic evaluation, on the other hand, indicated minor issues in eight categories and serious issues in three categories [15].
In the study of [51], the search and scan patterns used by users engaging with a web interface of education and e-commerce domains were examined. A usability test was carried out utilizing OGAMA software as an eye-tracking tool to simultaneously capture and evaluate eye and mouse tracking data from slideshow eye-tracking studies. Fixation count, fixation length, and length of saccade of each website were considered during the evaluation period. The findings revealed that an educational-based website met users’ needs better than an e-commerce website because there was less distraction owing to fewer visuals and pictures. The study proposed that interface designs should be empty of the presentation of unnecessary ad content and incorporate suitable structuring of navigation components to help with regard to an improved UX [51].

2.3. Behavioral Measurements Techniques

Behavioral measurement techniques aim to assess the usability of e-commerce websites. In this sub-section, heuristic evaluation, usability testing, and eye-tracking were explored in terms of the pros and cons of their effectiveness.

2.3.1. Heuristic Evaluation

Heuristic evaluation is a method for evaluating usability based on expert insights built mainly on predefined principles. As an engineering method for evaluating usability, heuristic testing is performed as part of an iterative design process for evaluating and determining interface design usability issues. It is carried out by a group of evaluators who evaluate the interface based on standard usability principles called heuristics [52]. In heuristics’ evaluation, the UI is assessed based on the opinions of several evaluators who observe an interface to decide on the upwards and downwards direction [53].
Heuristic evaluation has some advantages as well as disadvantages. With the help of heuristic evaluation, researchers find more problems than with other usability evaluation methods [54]. For instance, it is claimed that heuristic evaluation addressed 72% of problems, whereas user testing found only 10% and 18% of the problems that were mutual to both [15]. It is a relatively cheap and fast method of evaluation [55].
On the other hand, there are several concerns that must be considered when using heuristic evaluation. One such concern pertains to the limited scope of the predefined heuristics or guidelines, which may result in the identification of only a subset of usability issues. Another concern that demands attention is the subjectivity of evaluators, as different evaluators may identify distinct issues or rate the severity of issues differently. Moreover, the absence of user feedback may impede the ability of heuristic evaluation to capture all usability issues. The efficacy of the evaluation is also contingent upon the expertise of the evaluators, which could pose a challenge if inexperienced evaluators are enlisted. Furthermore, heuristic evaluation may be a time-consuming and costly endeavor, particularly if multiple evaluators are involved. Lastly, heuristic evaluation may not be suitable for all types of user interfaces, such as those that necessitate specialized domain knowledge or entail complex interactions.
Despite these concerns, heuristic evaluation can still be a valuable method for evaluating usability, particularly when employed in conjunction with other methods, such as user testing. Therefore, it is imperative to take these concerns into account when utilizing heuristic evaluation and to supplement it with other methods to obtain a more comprehensive evaluation of usability.

2.3.2. Usability Testing

Usability testing is a technique of testing the functionality of digital products, applications, or websites, by observing actual users as they seek to complete assigned tasks [13]. To gain information about the cognitive processes of users, the test participants are usually requested to think aloud while performing the test tasks. Traditional usability testing involves predefined test tasks where the environment of the test is controlled.
Usability testing has some advantages as well as disadvantages. The advantages of usability testing include reasonably affordable costs and quick results. Usability testing could reveal problems that other methods could not [56]. However, some researchers also believe that usability testing is not affordable to establish, entails more time for planning and organizing, and involves the expense of incentivizing and recruiting participants from target users [57]. Furthermore, a usability test is helpful in addressing usability in terms of performance, but it is not capable of finding the causes that represent bedrock information for the design development [58].

2.3.3. Eye Tracking

Eye tracking is defined as “the recording and study of eye movements when following a moving object, lines of text, or other visual stimuli; it is used as a means of evaluating and improving the visual presentation of information” [59]. An eye-tracking device records the movements of users’ eyes, and computer software analyzes how the gaze changes [48]. Eye-tracking tools help researchers register the required time for a task to be completed as well as analyze the first fixation duration and fixation time [29].
In eye-tracking research, what the user looks at and the relevant mental processes are linked with the user’s gaze. Perceptions of visual appeal are expressed through analyzing how users look at websites. This is achieved through various variables of gaze that are used to interpret the visual aesthetics’ perception. Standard measures of eye-tracking based on cognitive load comprise a duration of fixations, pupil diameter, and saccadic length and speed [60]. When the eye is focused on a particular point on the screen, fixations occur and are collected as x and y coordinates [61]. When the eye moves from one fixation to the next fixation, saccades happen. Scanpaths are then composed of consecutive combinations of fixations and saccades. The output of the eye tracker may be a heatmap and eye movement trajectories. The heatmap depends on fixation counts or fixation duration [61].
As with other evaluation methods, eye tracking has advantages and disadvantages. Eye tracking provides more information that helps in a deeper understanding of the causes of usability problems [58]. It also provides mental process-related information and reliable data because users focus their attention on where they are looking [62]. It is also easy to collect the data with no sacrifice of the study’s ecological validity. It provides a better understanding of how the interaction happens through linking apparent events like clicking, typing, and scrolling with the attentional mental process’s information [63]. Thus, it could be used to develop possible guidelines for fostering usability [58]. An additional advantage is the variety of ways and measures that the eye-tracking tool represents to researchers (and hence a multitude of measures) researchers can use to examine their data [64]. The eye-tracking methodology allows researchers to gather actual quantitative data: fixations, regressions, and saccades [65]. These data reveal attracting or distracting items on the web page, revealing indications about distinct user search strategies [61].
However, with the ubiquity of eye tracking in usability research, it is essential to make sure that the methodology is used appropriately, ensuring the validity of research outcomes [64]. One drawback of eye-tracking research is the consideration that the gaze dot or cursor on the screen refers accurately to where a user is looking. Like other types of measurement devices, eye-trackers are prone to measurement errors, which in turn influence data interpretation [64]. Furthermore, in eye-tracking research, it is not possible to justify why a user fixates on a particular spot on a website [66]. In addition, the cost and the obstruction to the users are reported as issues when testing usability using eye-trackers [26].

2.4. Recent Research Studies

Several studies in the literature have examined the effectiveness and efficiency of usability testing, heuristic evaluation, and eye-tracking in different contexts. Maguire and Isherwood [57] compared the usability testing and heuristic evaluation in terms of efficiency and effectiveness for two different websites. The outcomes demonstrated that usability testing required less time to complete and underlined slightly more severe problems on average than heuristic evaluation. However, heuristic evaluation surpassed usability testing in terms of the identified number of problems and identification rate, and therefore it is perceived as more effective and efficient. In fact, each method complements the other due to the advantages of each method. Nevertheless, the study had a relatively small sample size, potentially limiting the generalizability of the findings. Building on this research, Fu et al. [37] conducted a study comparing heuristic evaluation and usability testing. Their research demonstrated that heuristic evaluation, relying on human experts, was more successful in identifying usability issues related to rule- and skill-based levels of performance. On the other hand, usability testing proved more effective in identifying issues associated with knowledge-based level of performance. Essentially, this finding underscores the importance of considering different evaluation methods based on the specific performance aspects being assessed. However, it is worth mentioning that the number of participants in the user testing were equal to the expert testing in this study, and the higher number of participants may have produced different outcomes for the usability testing. In [15], a comparison of usability evaluation methods is presented for evaluating e-commerce websites. It was found that the user testing and heuristic evaluation are both effective methods for evaluating the usability of e-commerce websites, with user testing being better at identifying major problems and heuristic evaluation being better at identifying minor problems.
While the abovementioned studies contribute to the understanding of usability testing and heuristic evaluation, other studies in the literature have also investigated and incorporated the eye-tracking approach in diverse contexts. In [18], eye tracking was used to analyze the usability of the Algebra Nation website, revealing important relationships between eye movement metrics and task difficulty ratings and completion time. Najjar et al. [48] further utilized both eye tracking and task-based testing to evaluate the usability of an arranged layout for an Arabic software keyboard. The study assessed the effectiveness, efficiency, and satisfaction using objective and subjective measures. However, the study also acknowledged limitations concerning the adoption of the arranged keyboard layout by users, raising questions about its effectiveness in real-world scenarios. In another study, Ritthiron and Jiamsanguanwong [58] combined the use of an eye-tracking device and usability testing to evaluate the usability of a library website. They included seven activity tasks and utilized the Tobii Pro X2-30 eye-tracker, sourced from Tobii AB, a company based in Stockholm, Sweden, to track participants’ eye movements. Although an in-depth analysis of qualitative data obtained from the eye-tracking device and think-aloud technique was conducted and resulted in identifying the causes of usability problems, the findings of this study were not assessed in comparison to relevant works. Moreover, the implementation of improvement guidelines was not thoroughly addressed in this study.
In respect of the usability of web platforms, Flores-Sánchez et al. [65], Bojko [63], and Kaysi and Topaloǧlu [67] have highlighted the importance of utilizing behavioral measurement techniques for evaluating the usability of web platforms and information systems. Flores-Sánchez et al. [65] employed eye-tracking and survey techniques to assess a student web platform, finding no correlation between eye-tracking data and usability survey data. The survey technique was reported as a weak approach. However, additional exploration is required to draw more concrete conclusions. Specifically, a heatmap could also be generated and incorporated for eye-tracking experiments to offer a more comprehensive understanding of user interactions. On the other hand, Bojko [63] compared the ease of locating and mental processing of major tasks between a proposed website design and the original design using eye tracking, click accuracy, and task time as performance measures. In particular, eye tracking successfully reported errors and helped in identifying the superiority of one design over the other. However, it is worth noting that the cost associated with implementing this method may necessitate a thorough analysis, especially when applying eye tracking across multiple interfaces. Further, Kaysi and Topaloǧlu [67] focused on eye tracking to evaluate usability improvements in a student information system. Their findings led to the development of a new system interface that reduced task completion time. However, it should be noted that the tasks employed in this study were of a similar nature and did not encompass scenarios that could potentially introduce exceptions or challenges, such as uploading lecture notes or publishing a quiz.

3. Research Methodology

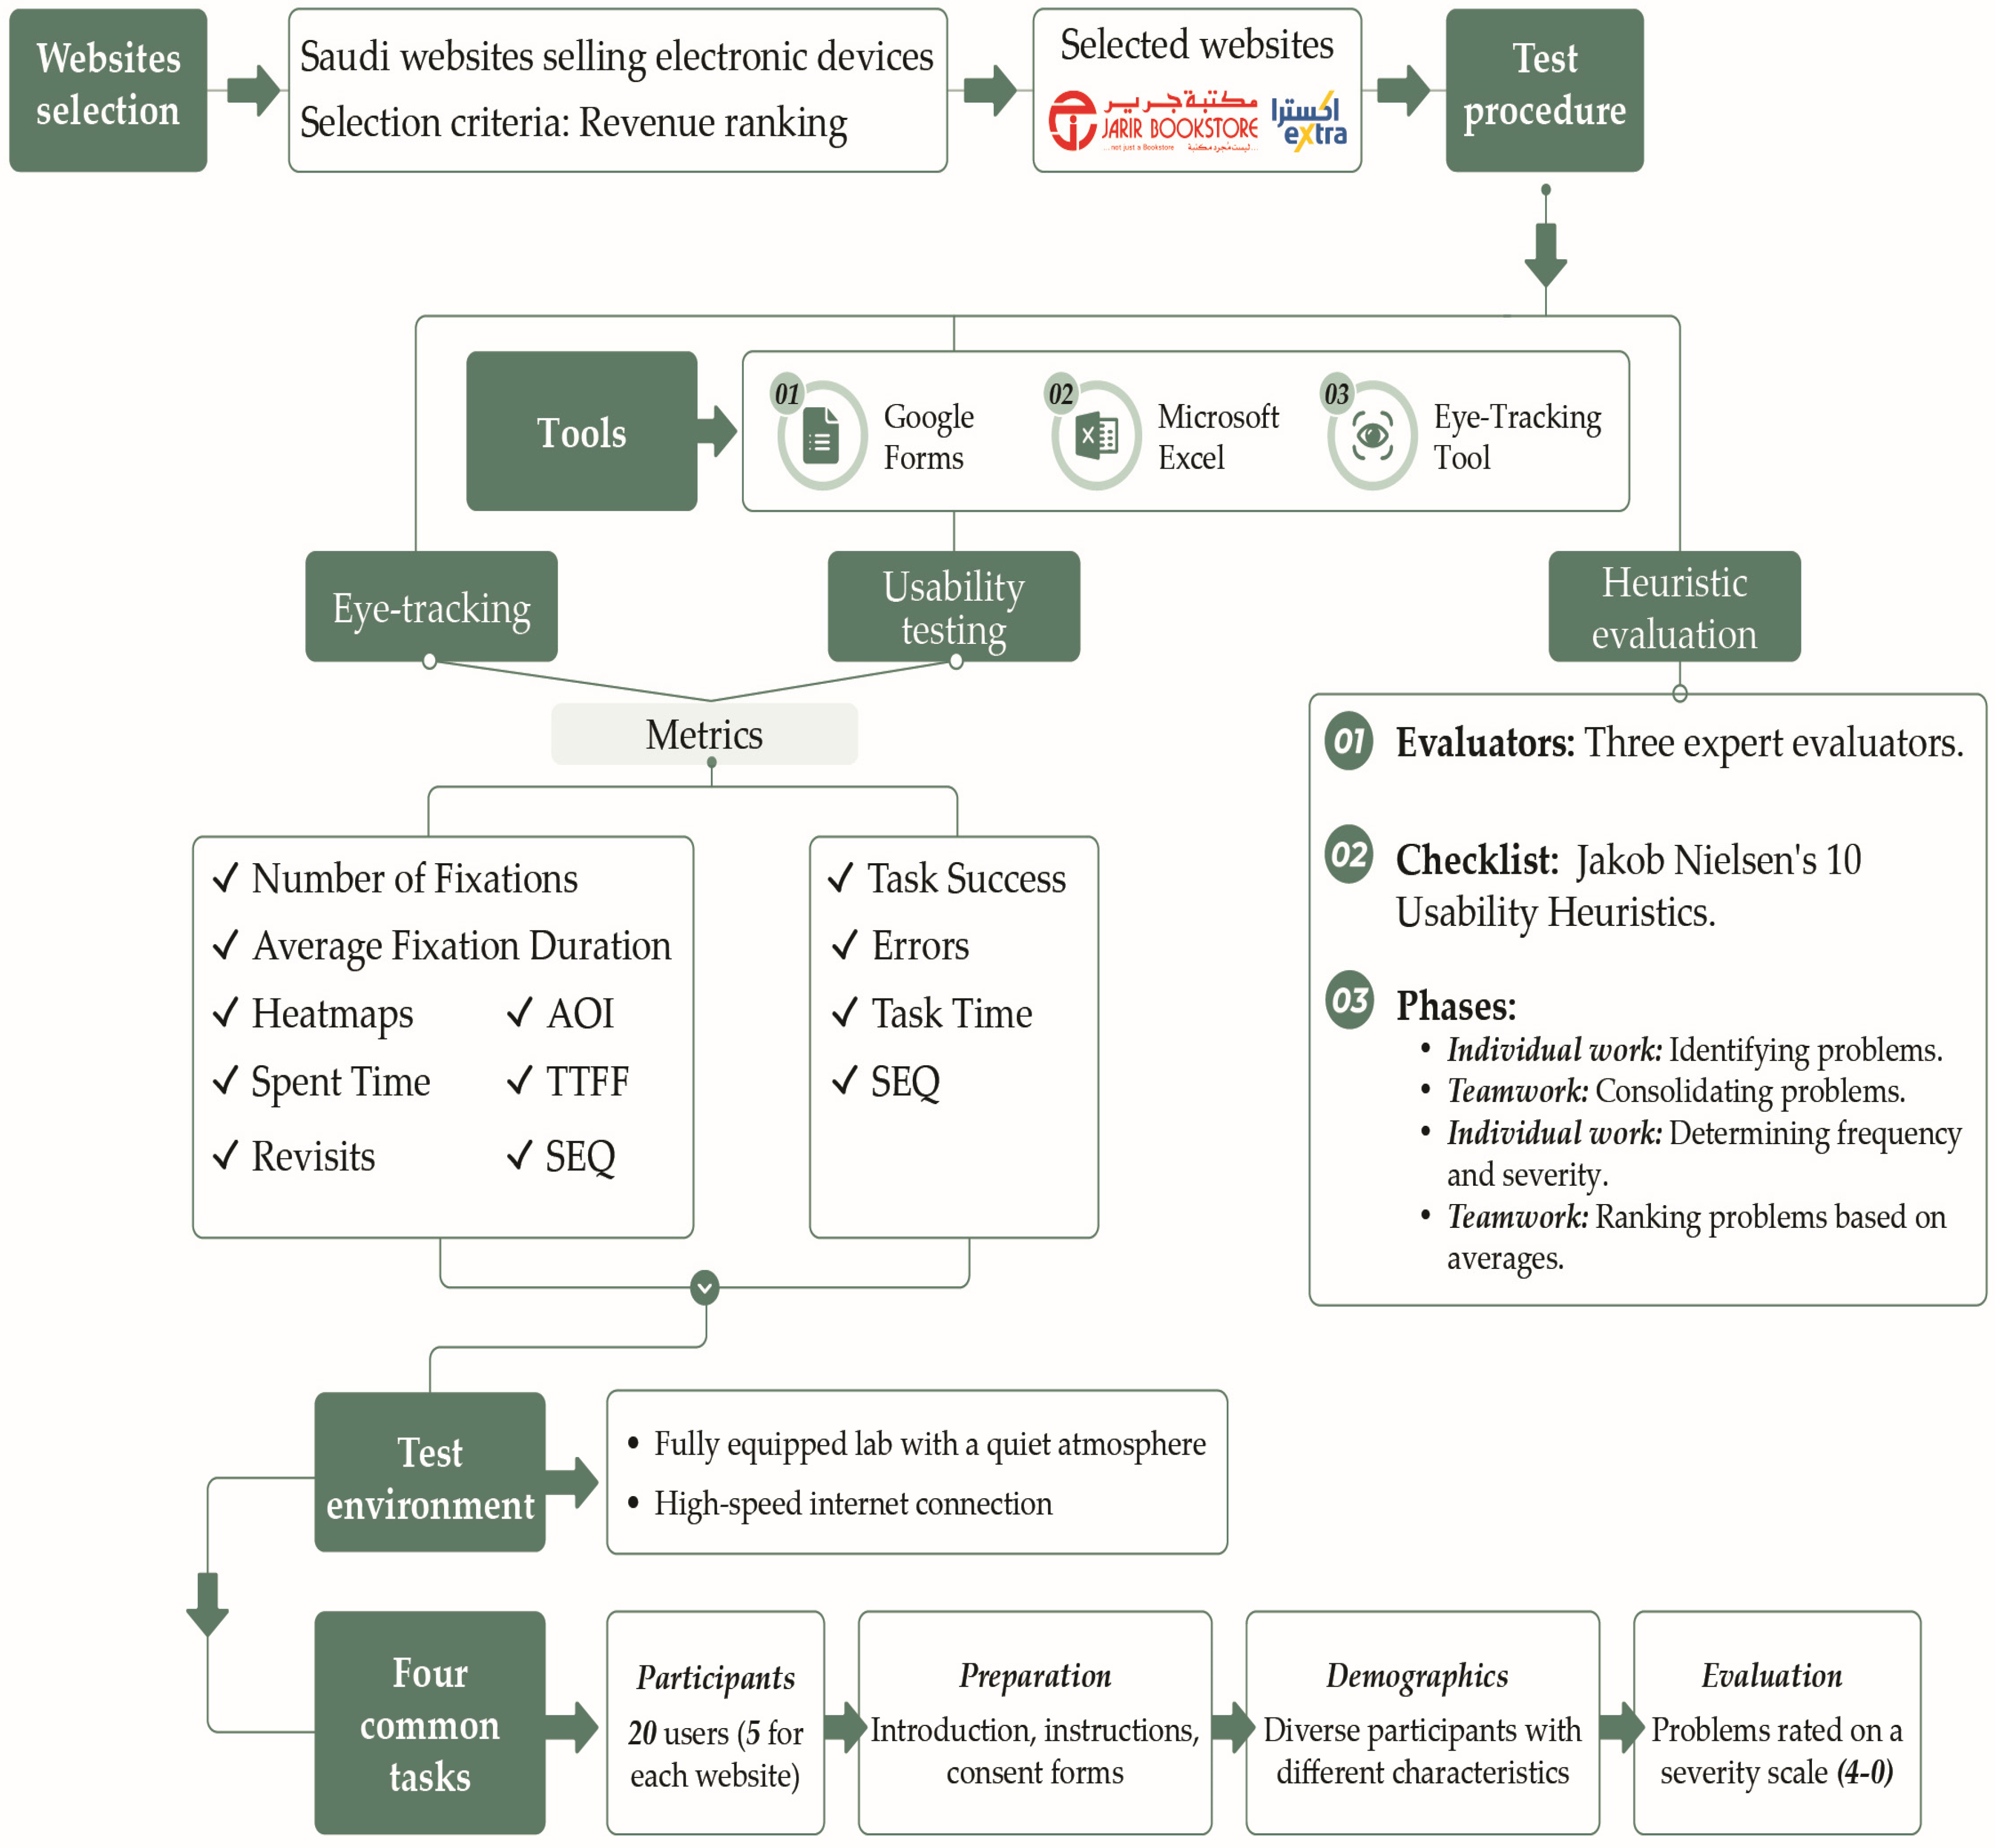
The procedural steps of the research methodology are lucidly illustrated in Figure 1, and discussed in the following subsections.

3.1. Websites Selection

The websites were selected based on a combined approach of criteria and ranking. Therefore, the criteria for selecting the websites were Saudi websites belonging to the same domain of selling electronic devices. In addition, the two websites were ranked among the top-ranked websites concerning revenue [68]. According to the criteria, the Jarir and Extra websites were the outcome of the selection process [69,70].

3.2. Test Procedure

3.2.1. Measures

The metrics used were task success, error number, task time, number of fixations, average of fixation duration, heatmaps, area of interest (AOI), time to first fixation (TTFF), spent time, revisit, and (SEQ). The aim of using these measures was to measure the website’s usability, effectiveness, efficiency, and satisfaction to show an insight into the user’s behavior. Table 1 shows each metric definition.

3.2.2. Evaluators and Participants

In heuristic evaluation, a group of three to five evaluators can detect 65–75% of usability issues, based on [52]. Therefore, three expert evaluators were assigned to the heuristic evaluation. The checklist of the heuristic evaluation was conducted using the 10 usability heuristics proposed by Jakob Nielsen’s 10 general principles for interaction design [52]. The heuristic evaluation involves four phases: (1) individual work—each evaluator individually names possible problems with the website; (2) teamwork—all the evaluators engage in teamwork in coordination that is led by a supervising evaluator to address all the problems and create one list of problems; (3) individual work—each evaluator determines the frequency and its related severity; (4) teamwork—the averages of frequency and severity are estimated to rank all the listed problems. In this way, more attention is given to the more serious problems to be resolved [47].
In usability testing and eye-tracking, according to the past literature, five users will find over 80% of the usability problems [71]. Therefore, five different participants performed usability testing for each website. The usability testing technique was used to obtain quantitative and qualitative data about test participants’ performance when they performed the tasks during a usability test. All participants received introduction and instruction sheets in addition to a consent and withdrawal form. Once the participants signed the consent form, a schedule and timing of the test session were designed, and they were notified accordingly. Twenty users were selected: five users for usability testing and five users for the eye-tracking method for each website. The experiment was conducted with users with upper-intermediate English and computer skills, and of different demographic characteristics, such as gender, age, and education level, as shown in Table 2. All the addressed problems were rated based on the severity rating scale; severity rating is a scale for ranking the usability problems by the observer and expert evaluators. Therefore, this research applied a rating scale of 0–4, as described by [52].

3.2.3. Tools

  • Google Forms: this was used to design the SEQ questionnaire and collect data from users.
  • Microsoft Excel version 16.73: Microsoft Excel was used to analyze and visualize the data.
  • Eye-Tracking Tool: RealEye version 10.0 is an online platform with webcam eye tracking.

3.2.4. Tasks

Four common tasks were selected for the two websites. The users were required to perform these tasks.
  • Task 1: Find the total price for an LG 55-inch, 4K ULTRA HD Nano Cell LED Smart TV, black color.
  • Task 2: Compare the price of (Nikon D3500 DSLR Camera) and (Canon EOS 4000D (NIS) DSLR Camera) to determine which one is cheaper.
  • Task 3: Add Eufy RoboVoac G10 Hybrid Robotic Vacuum Cleaner to the cart, white color.
  • Task 4: Write down the telephone number of customer support.

4. Data Analysis

This section aims to show the followed procedures and findings of the experiments of the behavioral measurements techniques for the Extra and Jarir websites.

4.1. Heuristic Evaluation Analysis

Three experts were selected according to their experiences with UI/UX and heuristic evaluation. They were reached through e-mail and furnished with the three attachment files. The introductory file included the welcome message and the purposes of this research. The second and third files were evaluation forms for the Jarir and Extra websites that included the process of heuristic evaluation, Nielsen’s 10 general principles with a description of each one, and severity rating. Each expert spent 2 days before submitting the report for each website. Then, the provided problems with severity ratings were aggregated in one file. In total, the experts identified 50 usability issues, where 24 of the discovered issues were for the Extra website, and 26 of the issues were for the Jarir website.
A detailed quantitative analysis of the Extra and Jarir websites based on the heuristic evaluation was demonstrated. For each heuristic principle, a list of usability issues found per each severity score was provided. For a comprehensive estimation, a calculation was conducted on a weighted score for each principle by multiplying the number of usability issues per severity by the severity score to achieve. The total sum of these values for each heuristic principle was also calculated. The average severity score for each principle was calculated, and the results were rounded up. The higher the average severity scores, the more severe the usability problems. The following sub-sections present the analysis for both websites.

4.1.1. Heuristic Evaluation Analysis for Extra Website

Table 3 shows the average and frequency of the severity of problems based on the principles of heuristic evaluation for the Extra website.
In an initial evaluation, it was noted that nine problems (40.91% of total identified problems) were major, seven problems (31.82%) were minor, five problems (22.73%) were catastrophic, and three problems (13.64%) were merely cosmetic. Regarding individual principles, “flexibility and efficiency of use” and “help and documentation” resulted in average severity scores of 4 (catastrophic problem). Following that, “match between the system and real world”, “user control and freedom”, “consistency and standards”, and “aesthetic and minimal design” resulted in average severity scores of 3 (major problem). “Visibility of the system status”, “error prevention”, and “recognition rather than recall” resulted in average severity scores of 2 (minor problem). Despite the identified usability issues, no issues were found in “help users recognize, diagnose, and recover from errors”.
Major usability issues for the Extra website included vague system performance and unclear status. For instance, no UI change occurred when a user clicked on a menu item. Thus, the user was unable to know on which page they were. In addition, it was reported that the Extra website does not support smart search and spelling checks as users are not expected to recognize model numbers and items’ full names.

4.1.2. Heuristic Evaluation Analysis for Jarir Website

Table 4 shows the average and frequency of the severity of the problems based on the principles of heuristic evaluation for the Jarir website.
For the Jarir website, the initial evaluation showed that nine problems (34.62% of total identified problems) were minor, seven problems (26.92%) were major, five problems (19.23%) were catastrophic, and five problems (19.23%) were merely cosmetic. Regarding individual principles, “help users recognize, diagnose, and recover from errors” and “help and documentation” resulted in average severity scores of 4 (catastrophic problem). Following that, “match between the system and real world”, “user control and freedom”, “recognition rather than recall”, and “flexibility and efficiency of use” resulted in average severity scores of 3 (major problem). “Visibility of the system status”, “consistency and standards”, “error prevention”, and “aesthetic and minimal design” resulted in average severity scores of 2 (minor problem) average severity score.
Among the notable usability issues for the Jarir website was the limitation in user controls, such as the number of items in an order. The user could only order up to 20 instances of certain items using a drop-down menu to select a quantity. The user had to scroll down to reach the required number and was unable to simply type it. On other items, the user could only order one instance. Jarir also does not include basic error prevention functions, such as input validation. For instance, an expert provided an invalid phone number. However, the website did not show an error message or a notification.

4.2. Usability Testing Analysis

This section presents the data analysis of the usability testing technique of the selected websites. The usability analysis utilized multiple metrics: task success rate, task time, and error number. In addition, this section demonstrates the usability issues for each website.

4.2.1. Usability Testing Analysis for Extra Website

  • Task Success Metrics
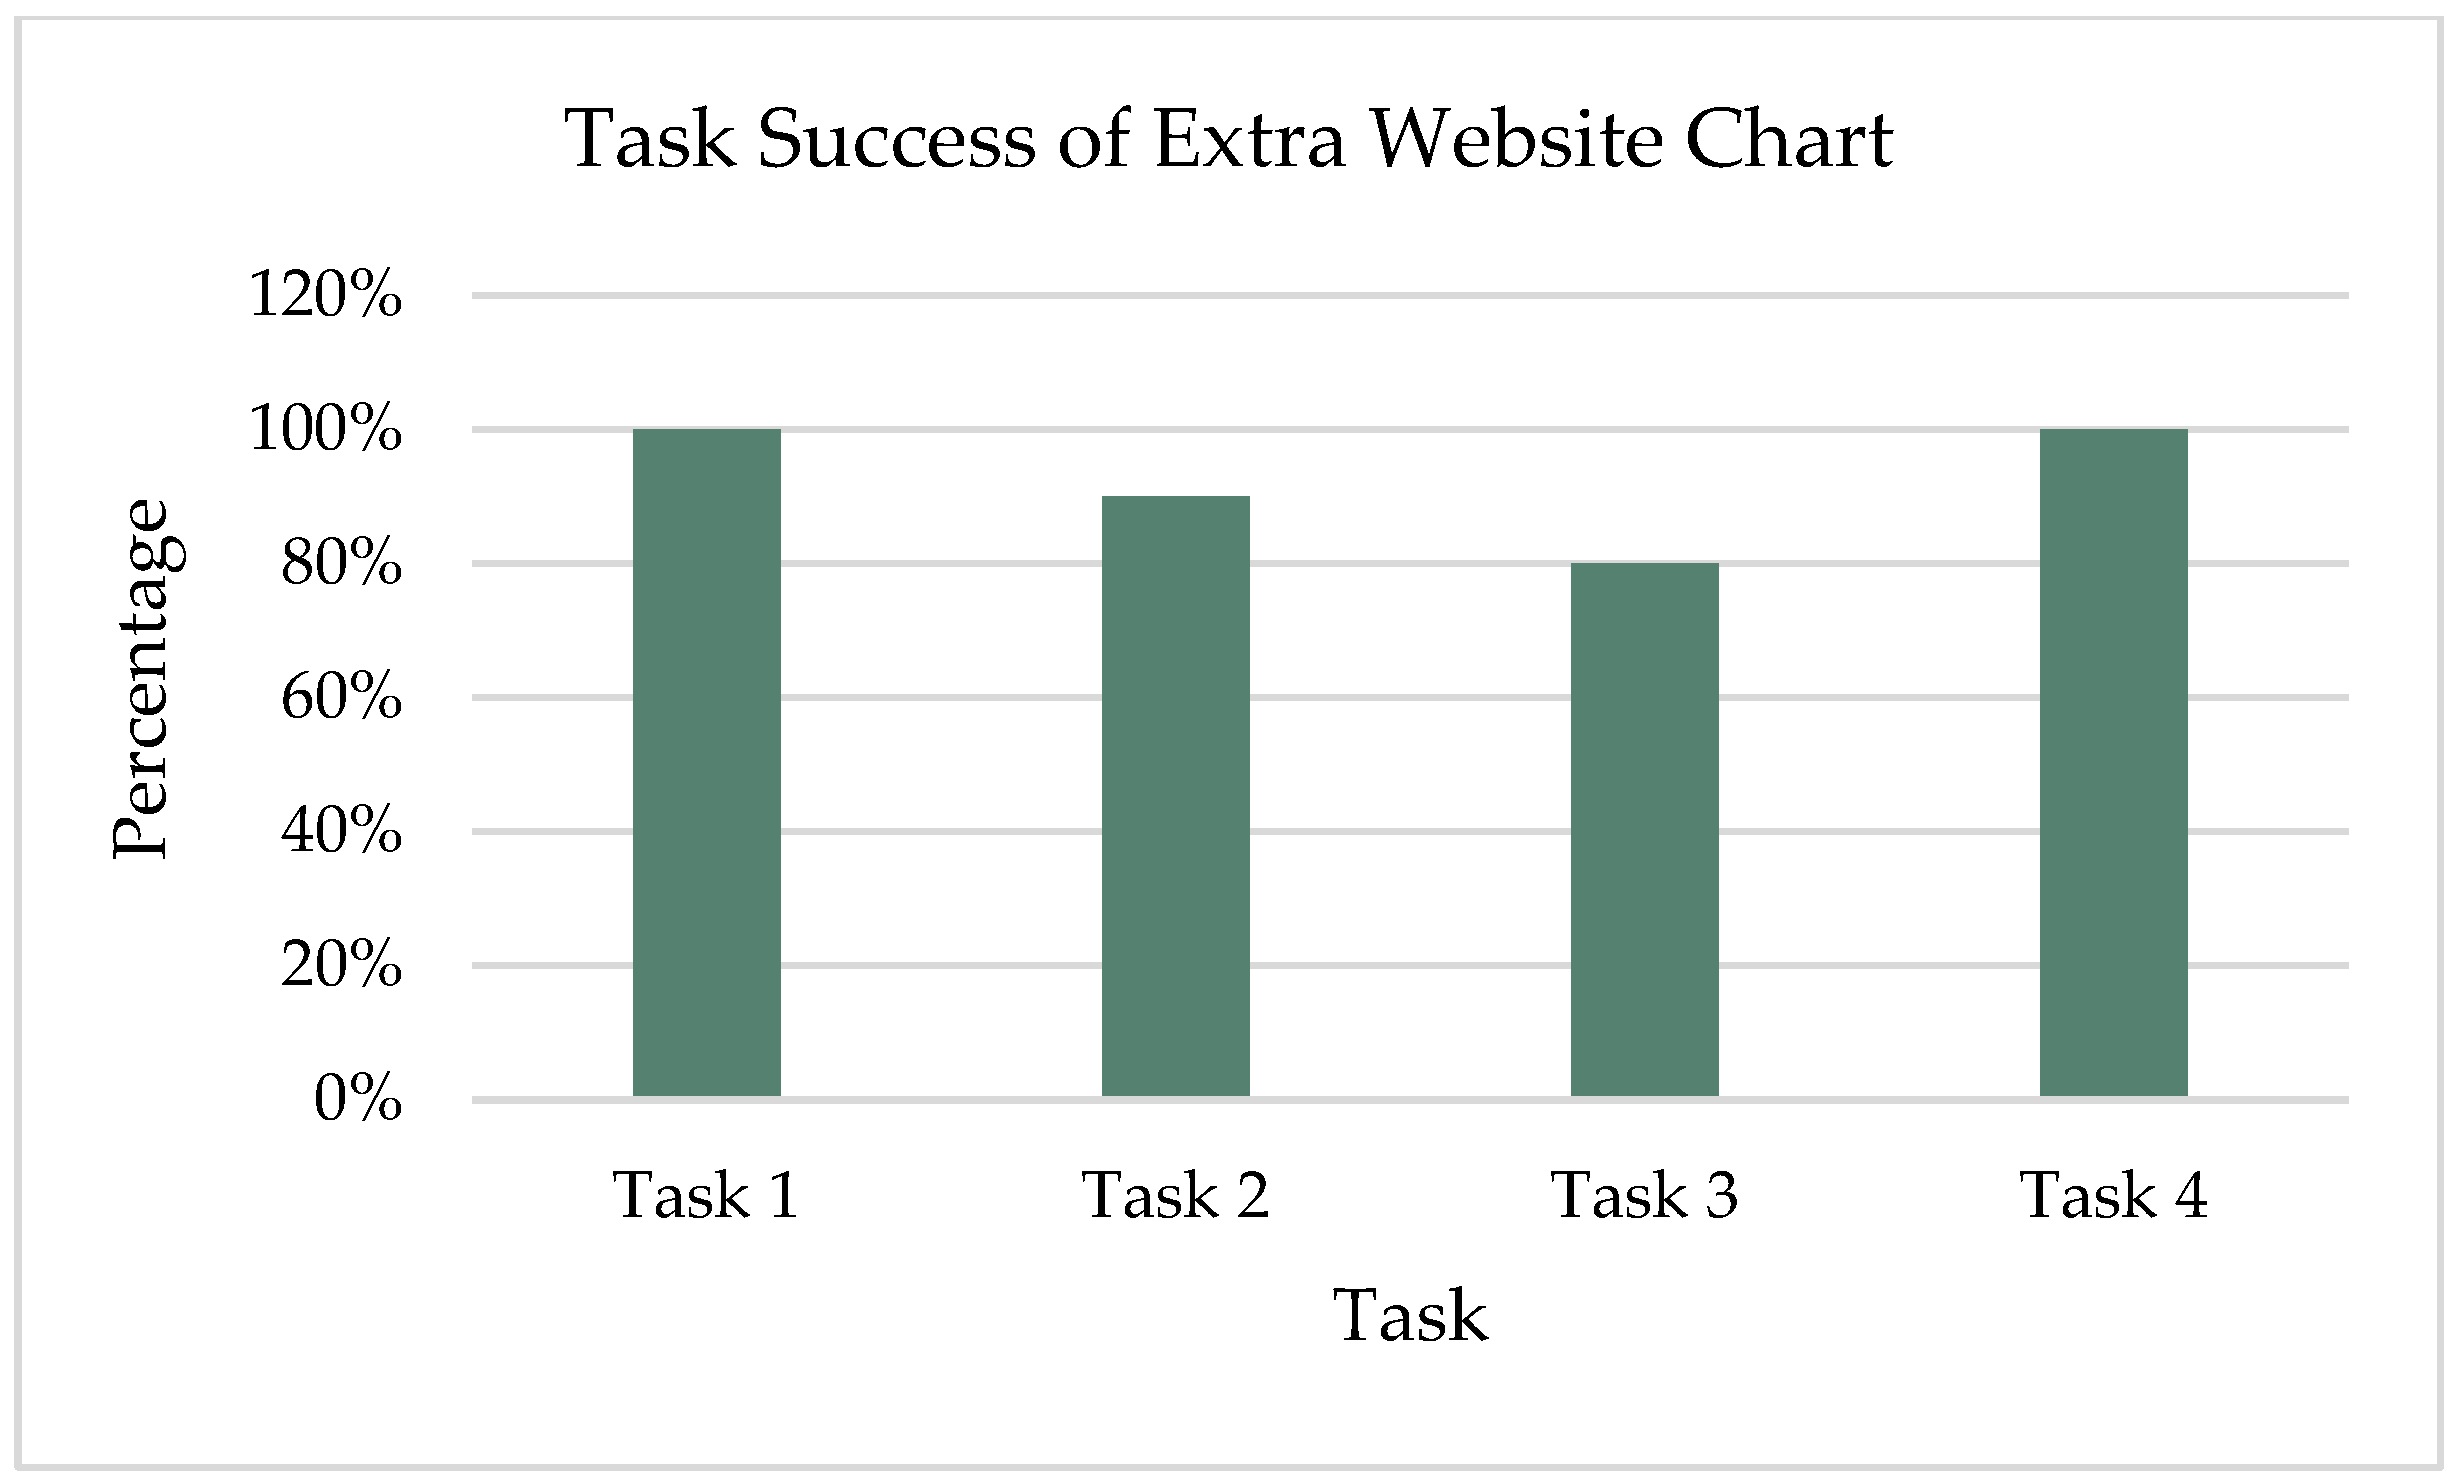
The percentage of success and failure of all four tasks is shown in Figure 2. Three users were able to complete Tasks 1, 2, 3, and 4 without any help, while one user needed help with Task 2, and one user failed to complete Task 3. Most of the users struggled to finish Task 2 because they were unable to find the “Compare” button. They completed the task by manually comparing the product price. Participant (P1) was unable to complete Task 3; she added the wrong item to the cart.
  • Task Time Metrics
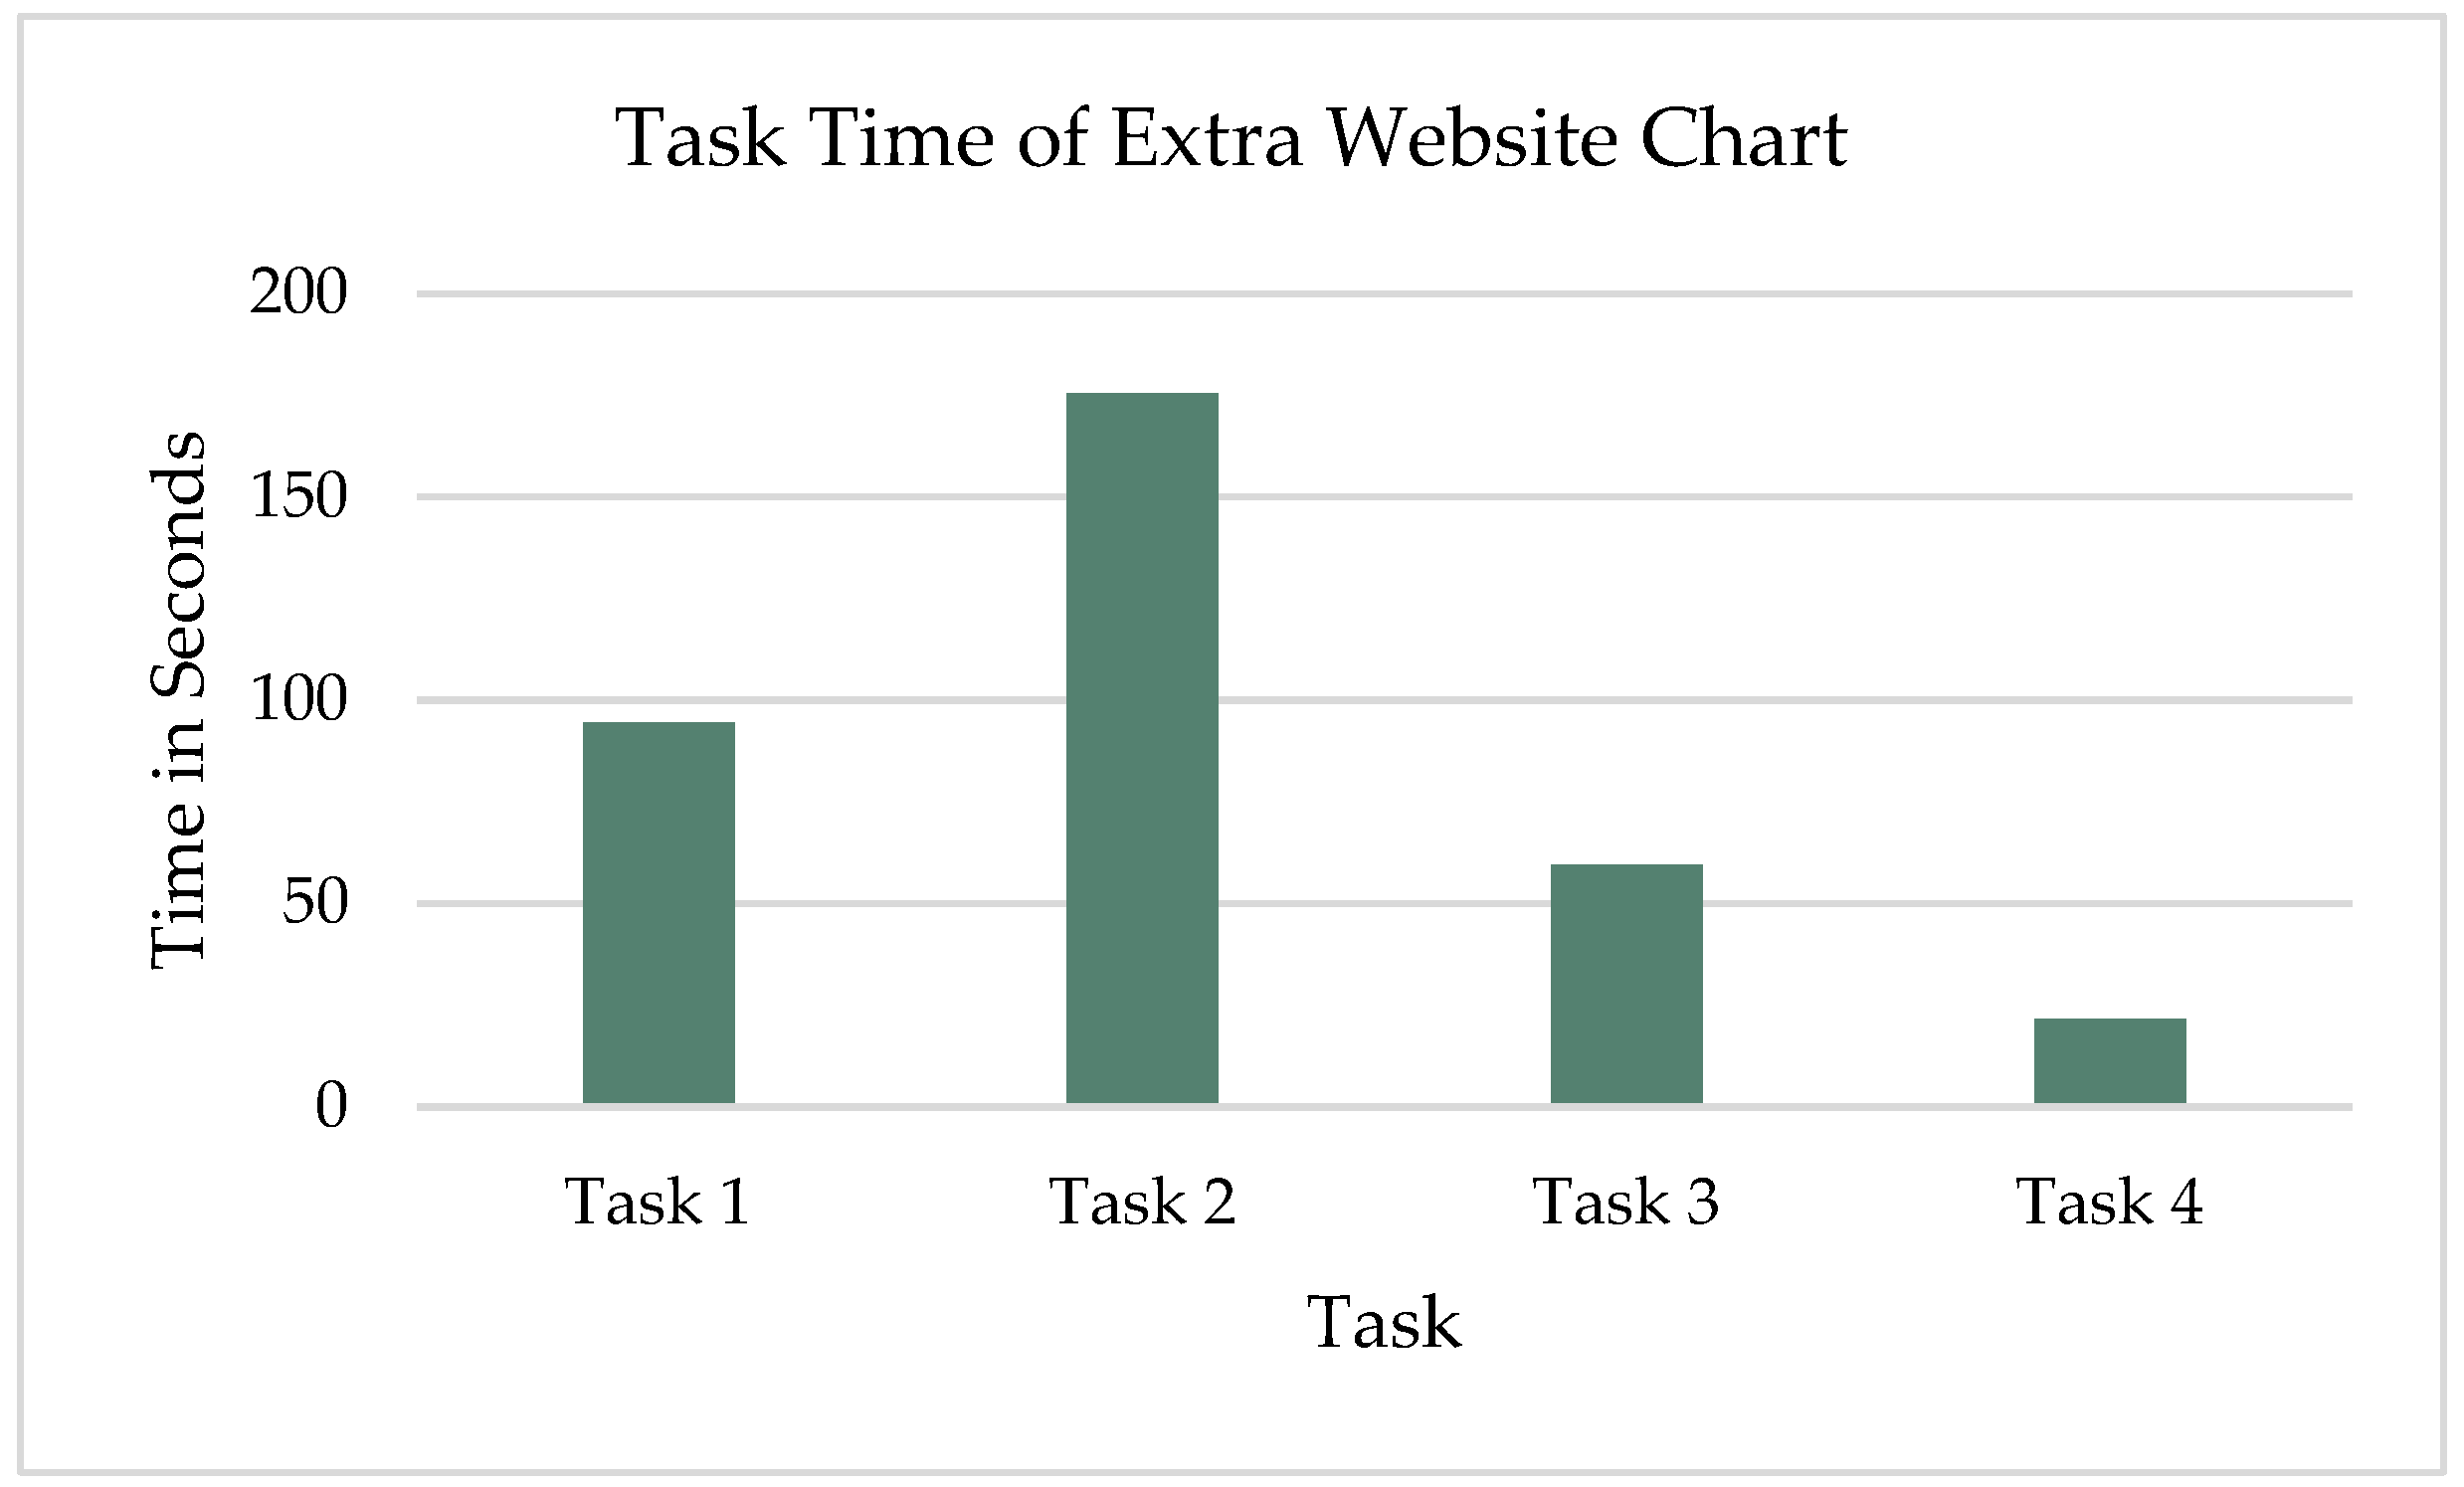
The average task time of each task was calculated as shown in Figure 3. The users demonstrated a short time on Task 4 compared to the others. Tasks 1, 2, and 3 took a long time. Task 2 took the longest time, and its average time was 175.4 s because users were searching for similar products to add to a comparison list, but they could not find the “Compare” button. They again needed to go back and search for similar products that they wanted to compare, and then they had to compare products manually.
  • Error Number Metrics
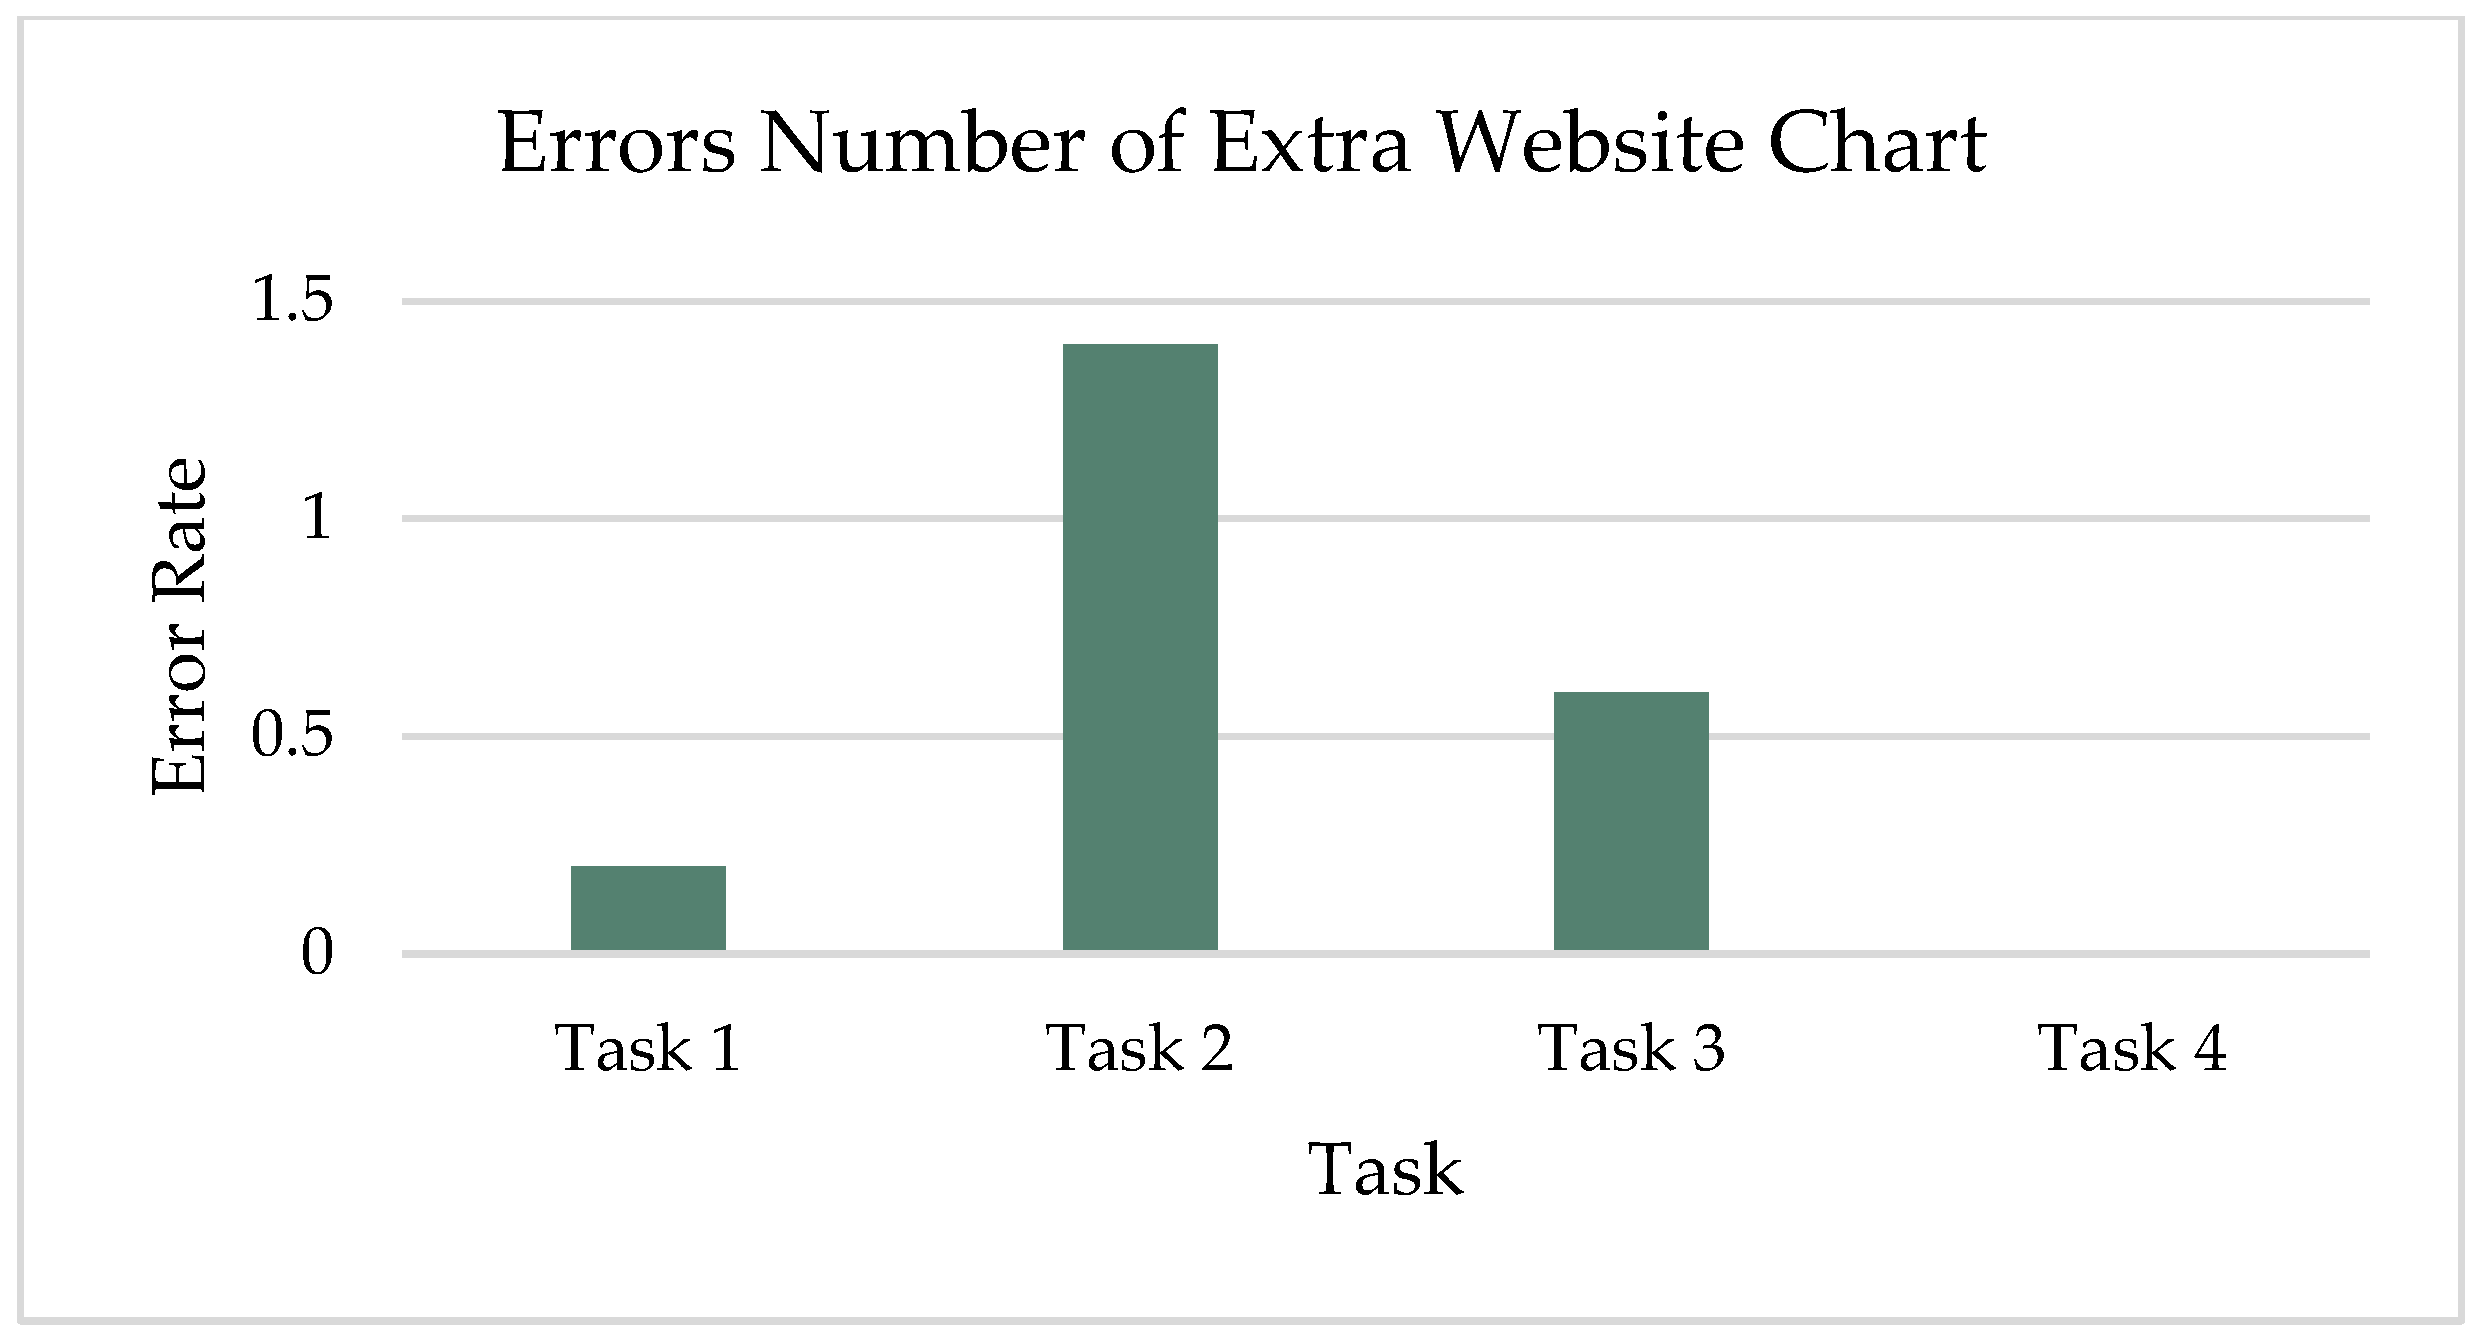
After observing the users and analyzing their performance while implementing the four tasks, as shown in Figure 4, the errors were most frequent in Task 2 followed by Task 3 and Task 1. Most participants committed errors with Task 2. They selected the wrong product for comparison because the search option showed irrelevant products. Some participants selected different product colors first and then found the correct product color in Task 1 and Task 3.
Considering all users and tasks, the overall success rate for the Extra website was 92.5, which (according to [72]) was above the average completion rate of 78%. The minimum average completion score across all tasks was 80%, which was also above the average completion rate of 78%. The total number of errors was 11, corresponding to 0.55 per task, which was less than 0.7, the average number of errors per task.
  • Discovered Usability Issues
Table 5 shows the identified usability issues and severity ratings for the Extra website. The usability issues pointed out problems related to effectiveness and efficiency.

4.2.2. Usability Testing Analysis for Jarir Website

  • Task Success Metrics
The percentage of success and failure of all four tasks is shown in Figure 5. One user was able to complete Tasks 1–4 without any help, while two users needed help with Tasks 1–3, two users failed to complete Tasks 1–3. All users completed Task 4. Users were unable to change the product color in Tasks 1 and 3, which led them to not completing the tasks. Most of the users struggled to finish Task 2 because they were unable to find the comparison list.
  • Task Time Metrics
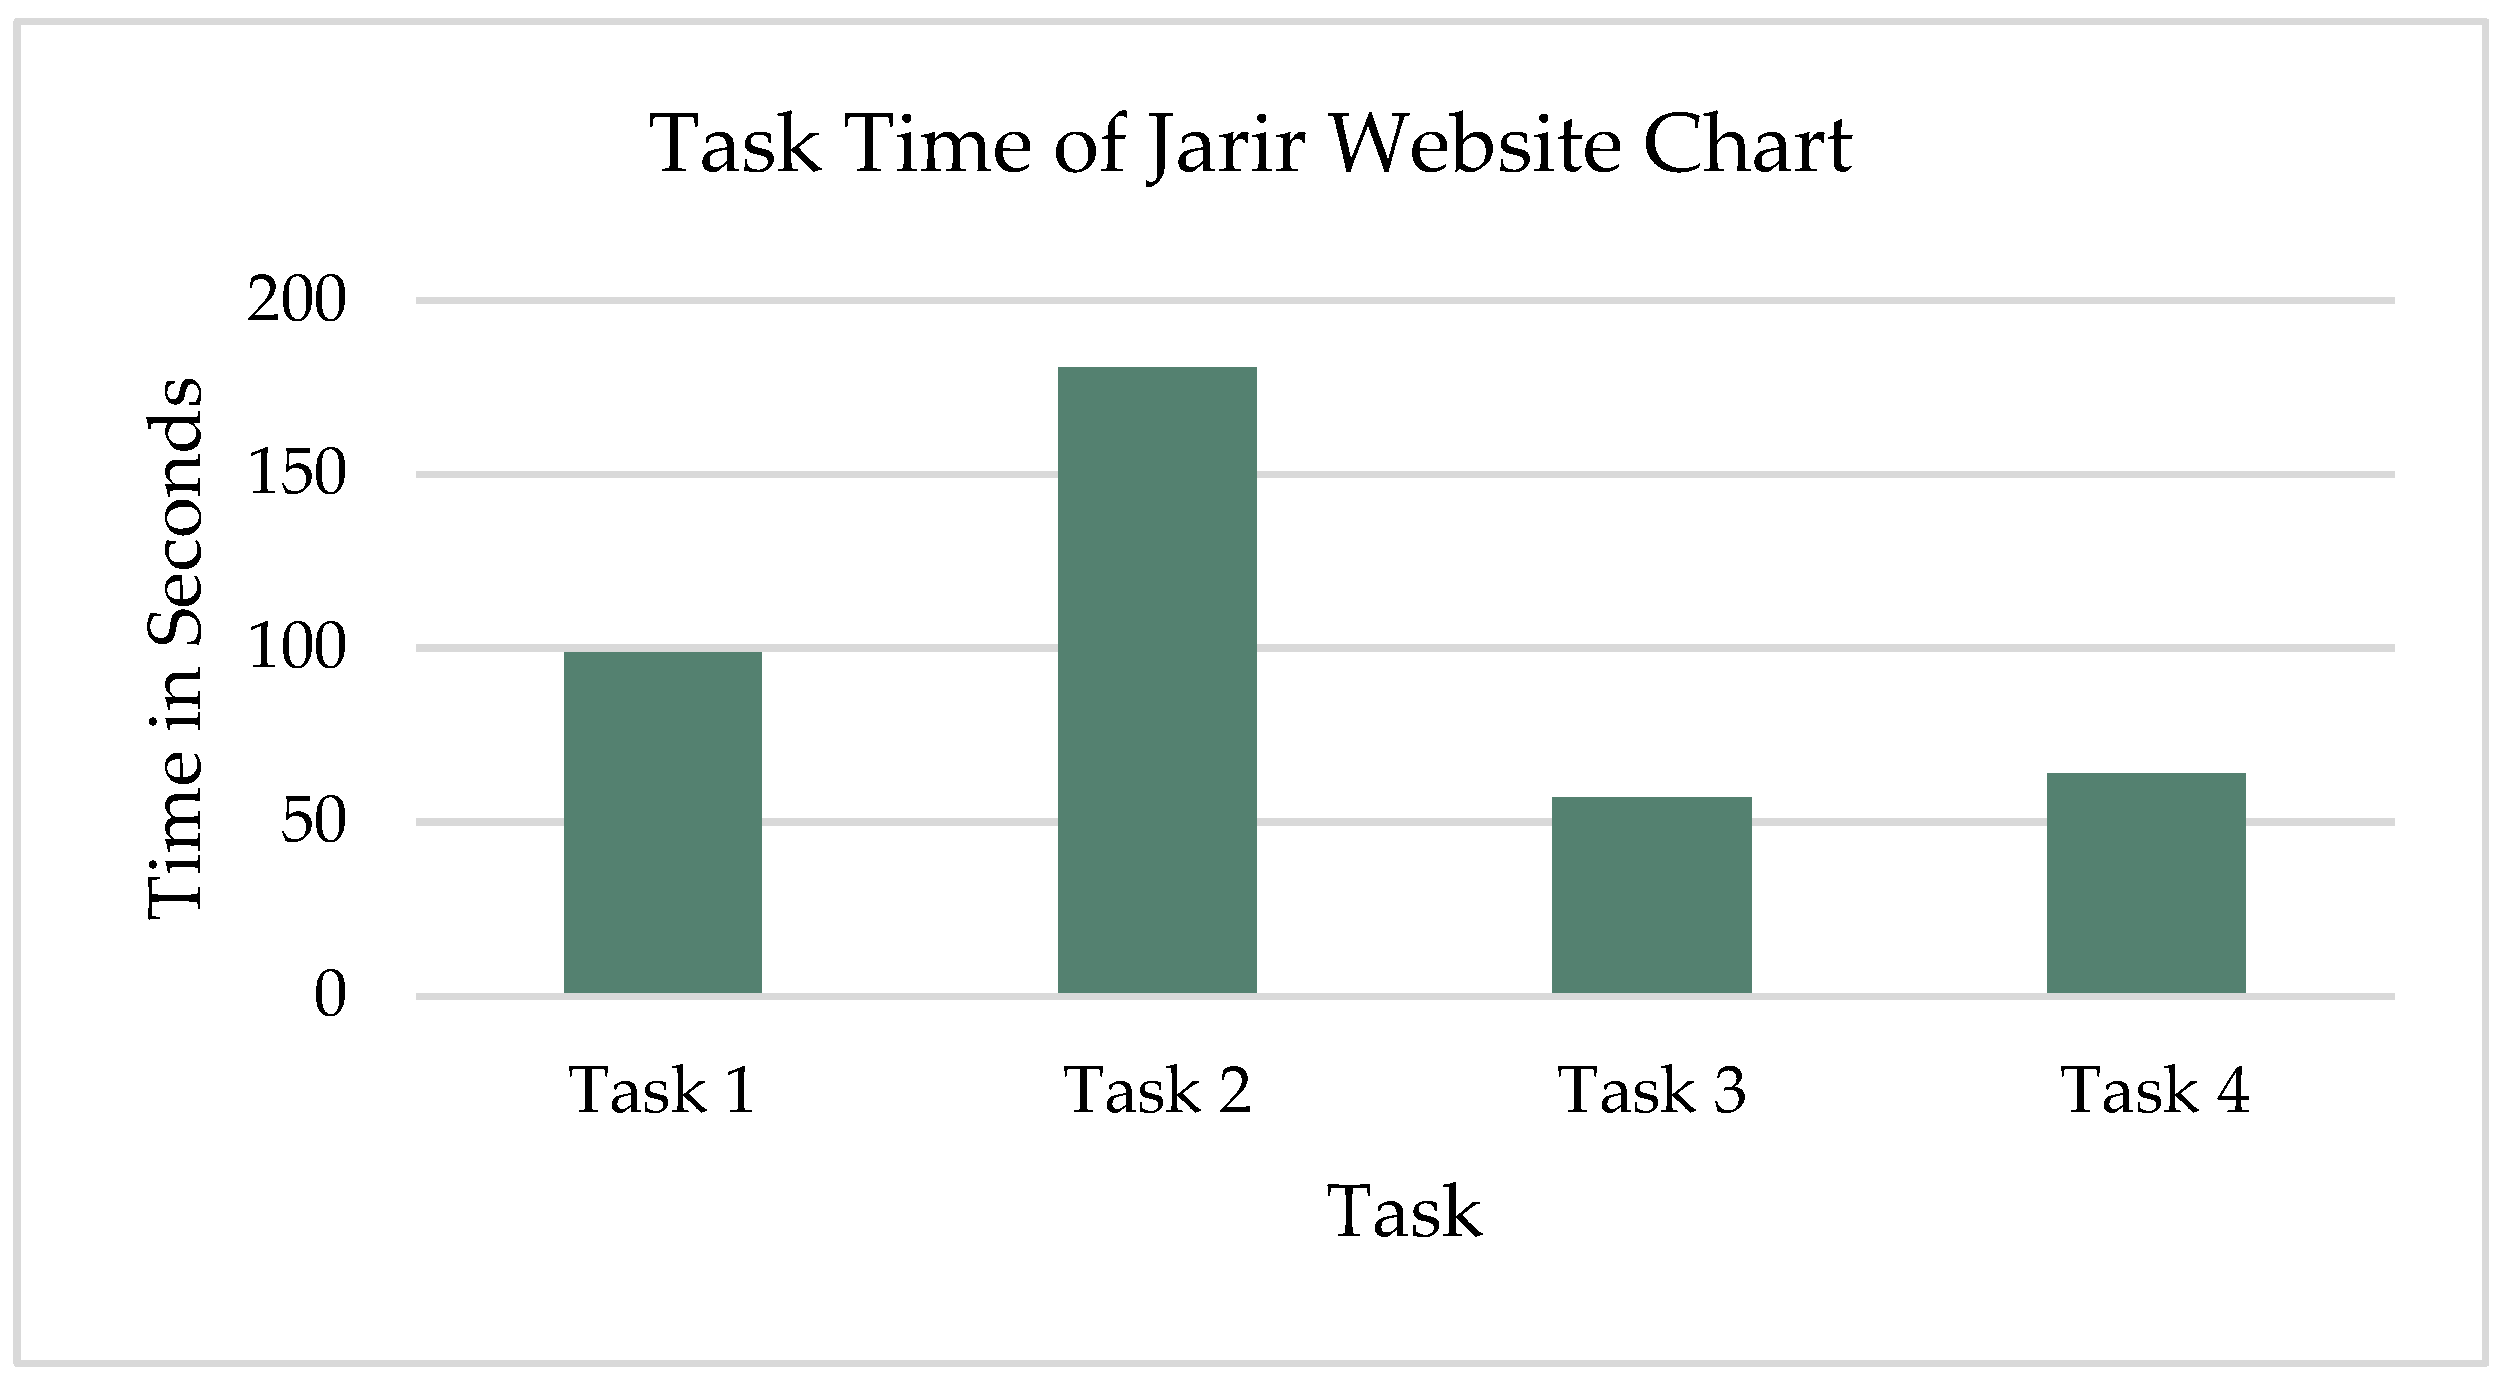
The average task time of each task was calculated as shown in Figure 6. The users demonstrated a short time on Task 3 compared to others. Tasks 2, 1, and 4 took a longer time. Task 2 took the longest time, and its average time was 186.6 s, because users were searching for similar products to add a comparison list after clicking on the “Compare” button, but then they could not quickly find a comparison list in a visible place.
  • Error Number Metrics
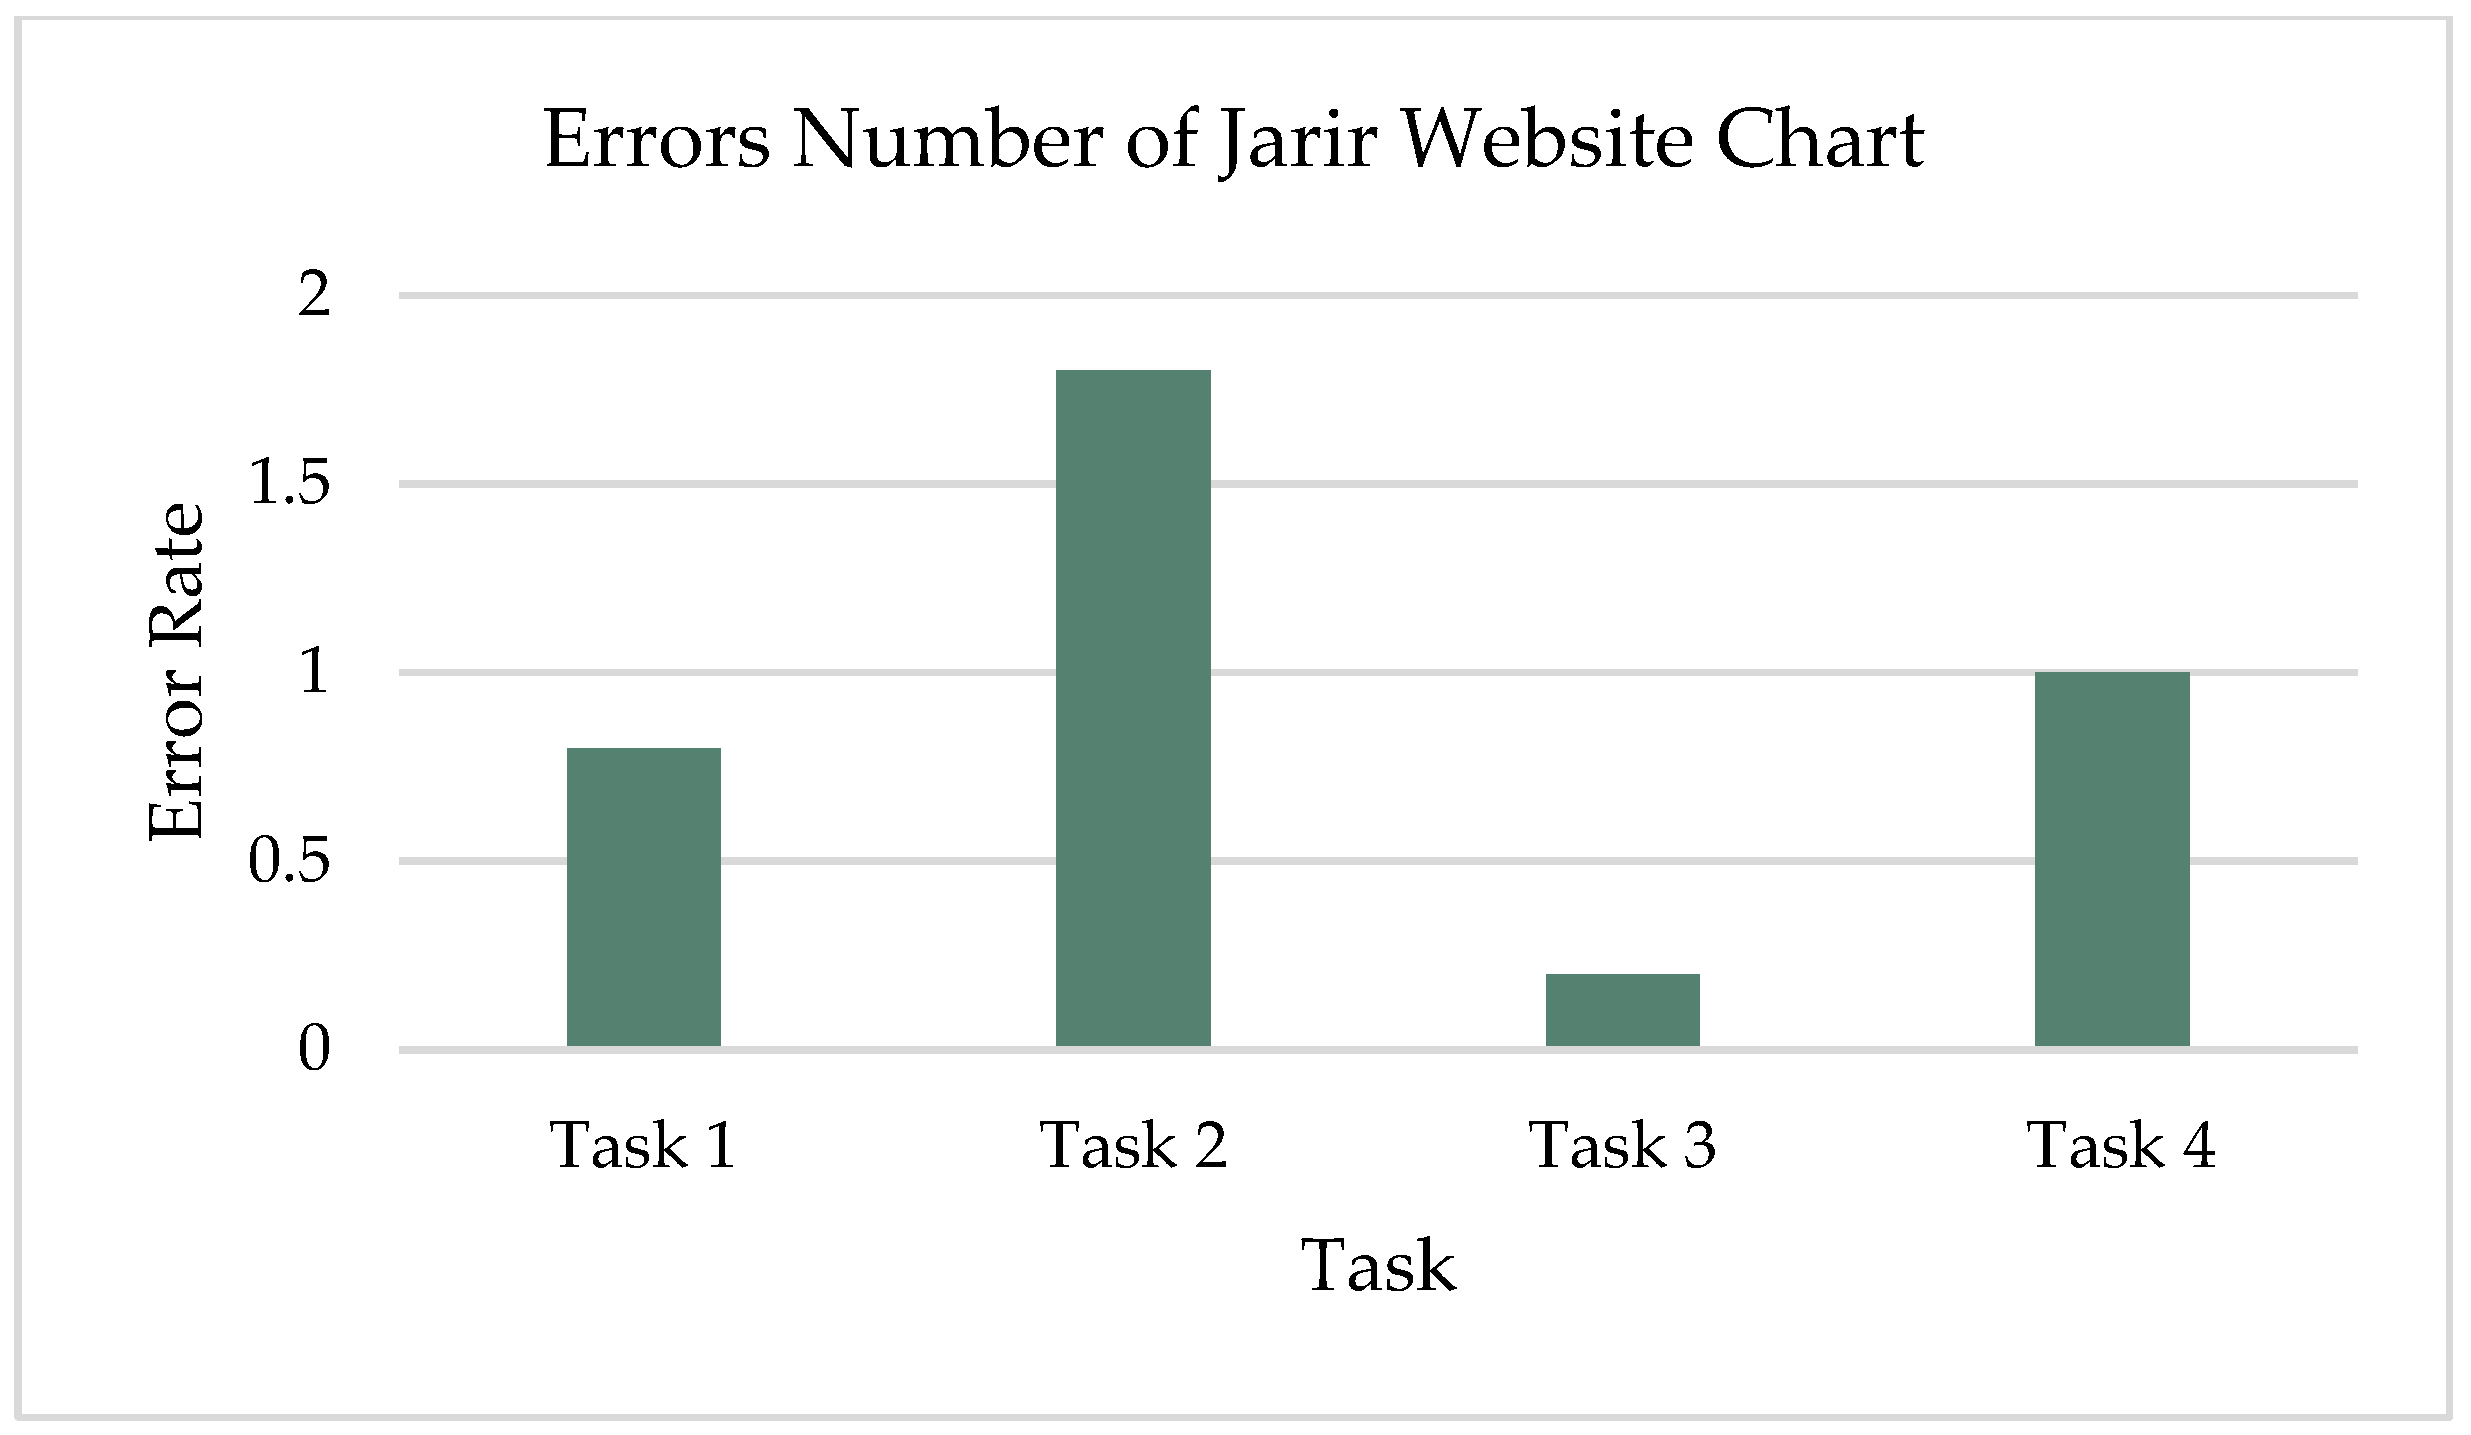
After observing the users and analyzing their performance while implementing the four tasks, as shown in Figure 7. The errors were most frequent in Task 2 followed by Tasks 1, 4, and 3. Most participants committed errors in Task 2. They selected the wrong product for comparison because the search option showed irrelevant products. Some participants selected different products color first and then found the correct product color in Task 1 and Task 3. One user made four errors in Task 4 because he did not quickly find the telephone number of Customer Support.
Considering all users and tasks, the overall success rate of the Jarir website was 75% which (according to [72]) was less than the average completion rate of 78%. The minimum average completion score across all tasks was 50%, considerably less than the average completion rate of 78%, indicating a major usability issue in the corresponding task, which was comparing items. The total number of errors was 19, which corresponded to 0.95 per task, more than 0.7, the average number of errors per task in the literature.
  • Discovered Usability Issues: Table 6 shows the identified usability issues and the severity rating for the Jarir website. The usability issues pointed out problems related to effectiveness and efficiency.

4.3. Eye-Tracking Analysis

This section covers the usability analysis using eye tracking for both the Extra and Jarir websites. The experiment was carried out using Realeye.io, an online platform that offers subscription-based eye-tracking analysis. Using the platform, five participants per website performed the same tasks mentioned in Section 4.3. While attempting to perform the tasks, the participants’ fixation number, average fixation duration, TTFF, spent time, AOI, revisits, and heatmaps were recorded.
The heatmap is a method for data visualization that indicates how the user views and interacts with a page, where red points to hot areas on which the user focuses and blue represents cold areas that receive very little attention. In terms of usability, a hot area could also indicate elements that are difficult to process. The same applies to fixations: while a long fixation could indicate a very interesting target, it could also indicate that the user could not immediately figure out the point of the element or had difficulty extracting information.
The analysis was carried out in three stages:
  • An overall evaluation of the website during user browsing: in this stage, an examination was conducted on the total time spent on tasks, the average fixation duration during tests, and the overall number of fixations and revisits.
  • Task-specific areas of interest: in this stage, an examination was also conducted on the above-mentioned metrics for certain areas of interest as shown in Table 7.
  • Other non-task-related findings: in this stage, user behavior on the website was examined and provided an analysis based on their behavior and feedback.

4.3.1. Extra Website

  • Overall Evaluation of Extra Website
On average, the participants spent 450 s performing tasks (7.5 min), of which 214 s (3.6 min) were spent fixating on elements. The nature of tasks and participant behavior during experiments indicated that the reason for the long fixation was the difficulty in locating what they were looking for. Table 8 shows the overall fixation data for the Extra website.
  • Task-Specific Evaluation of Extra website
    Task 1
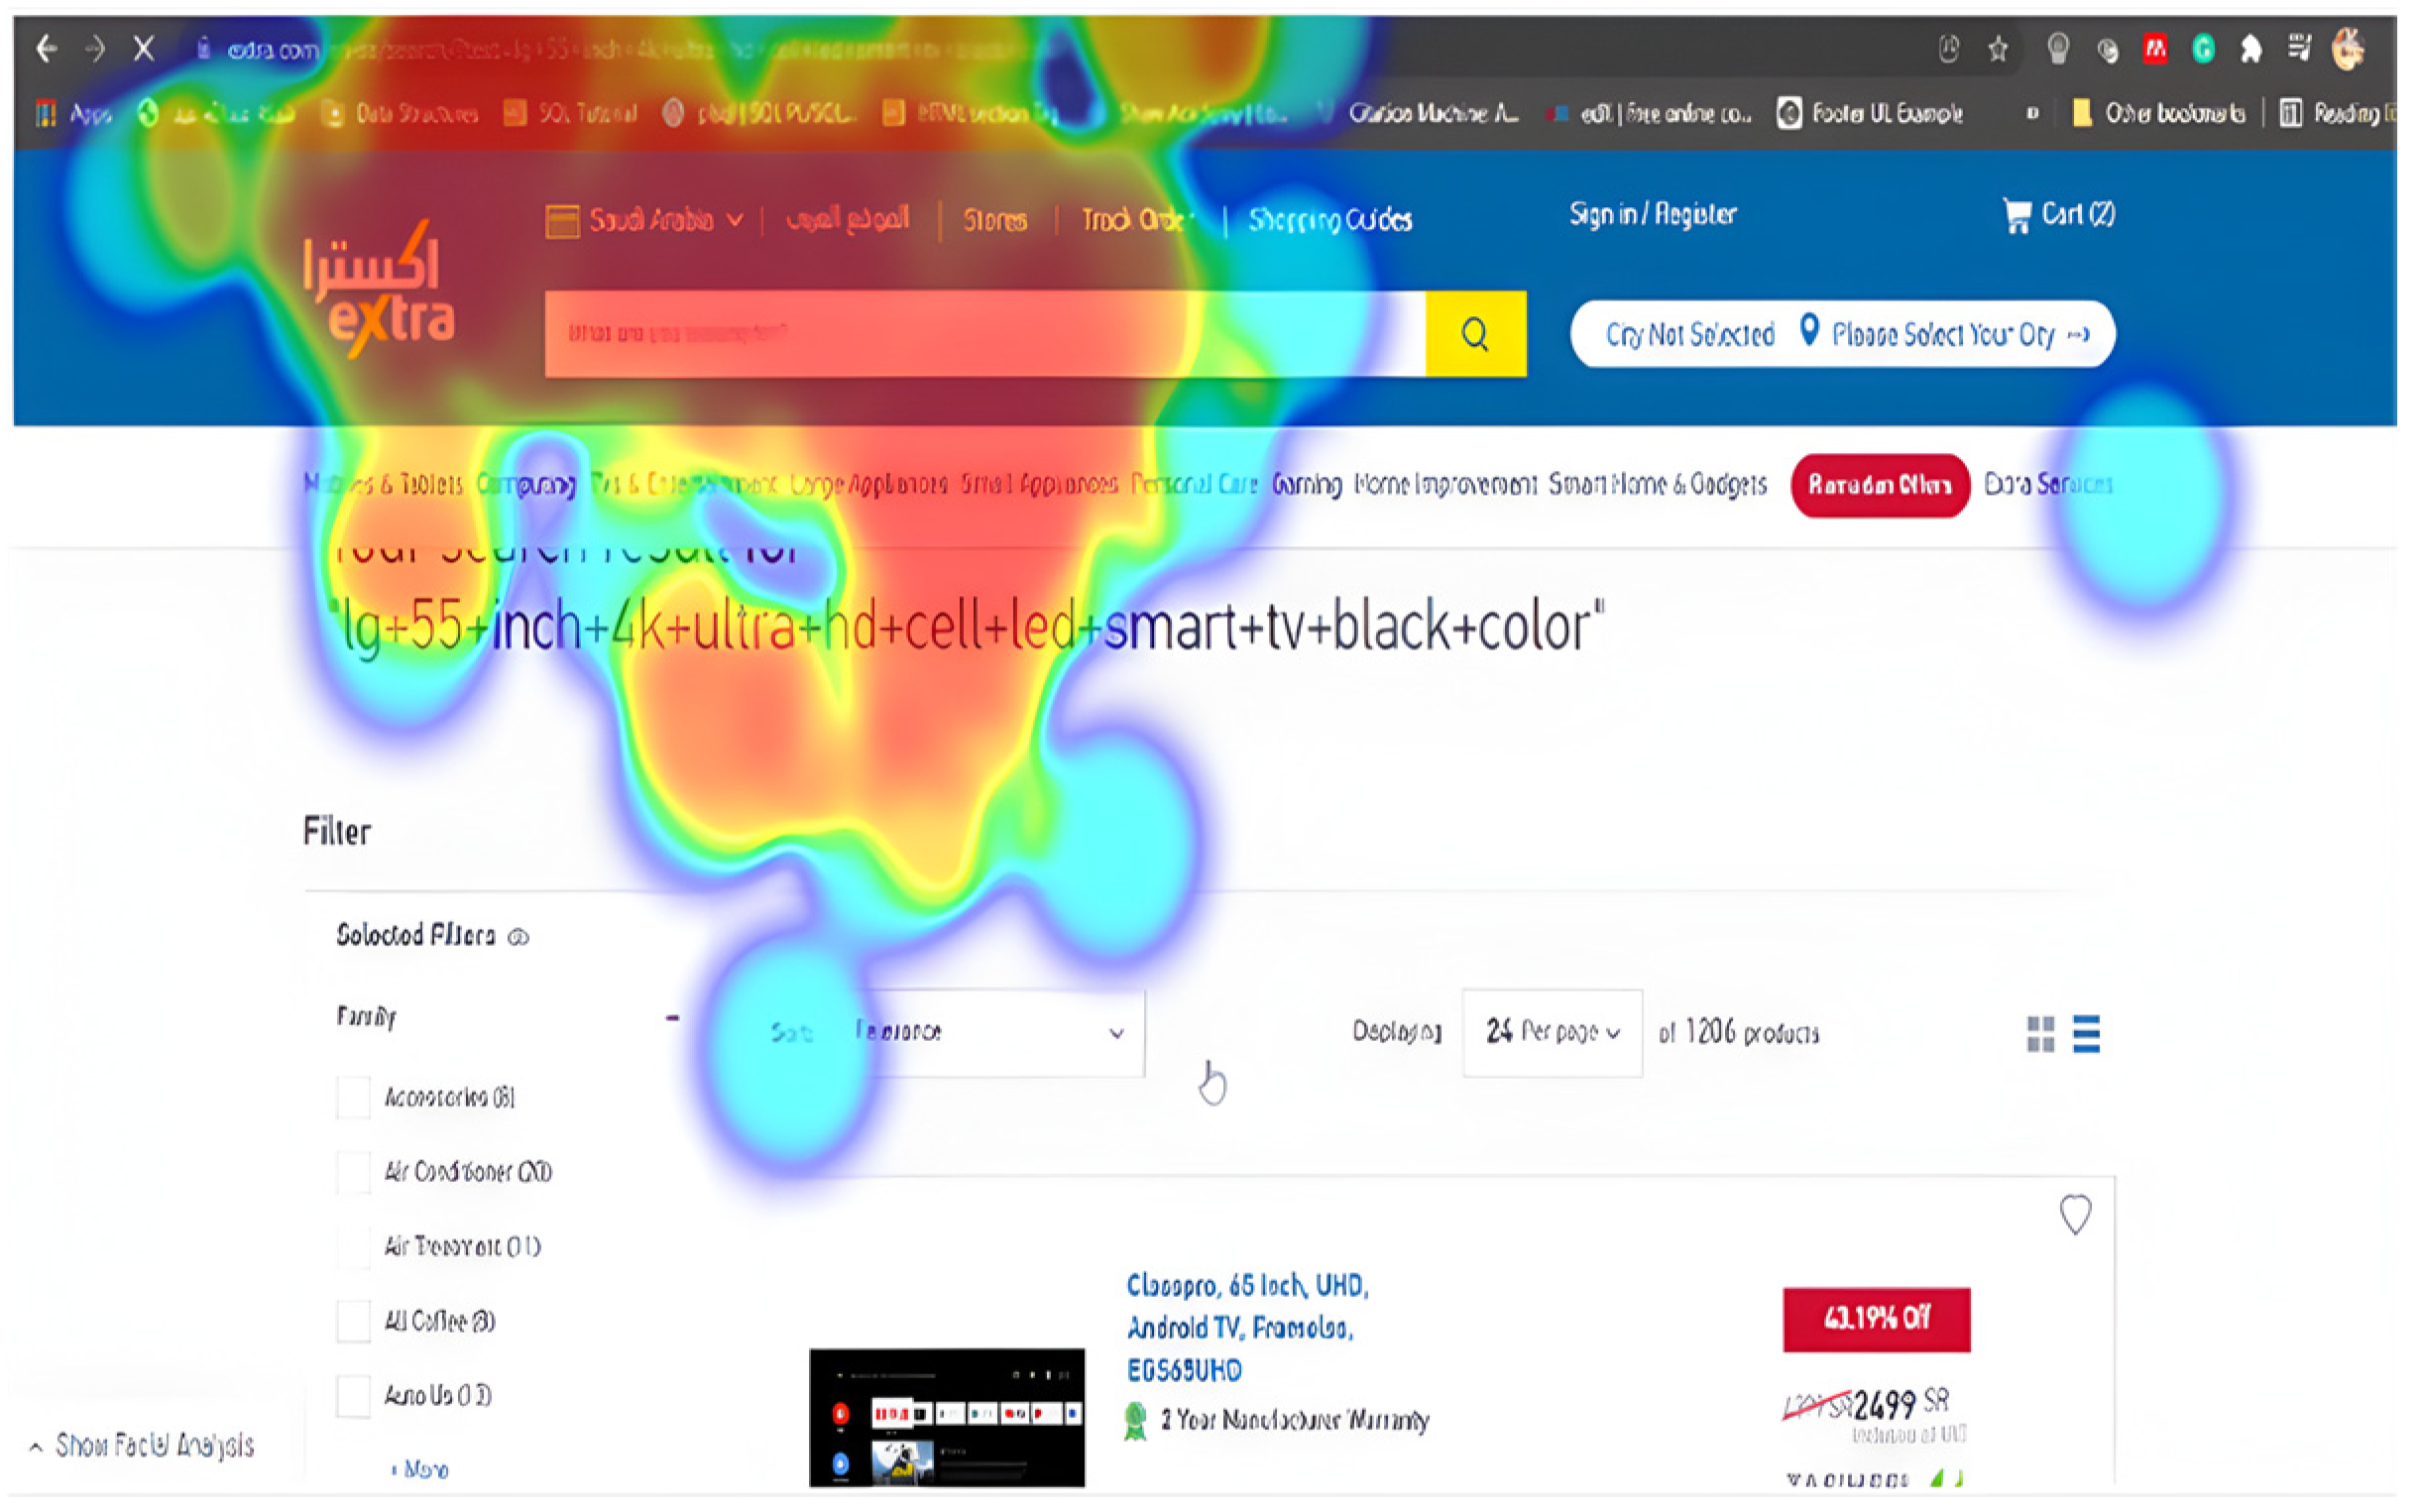
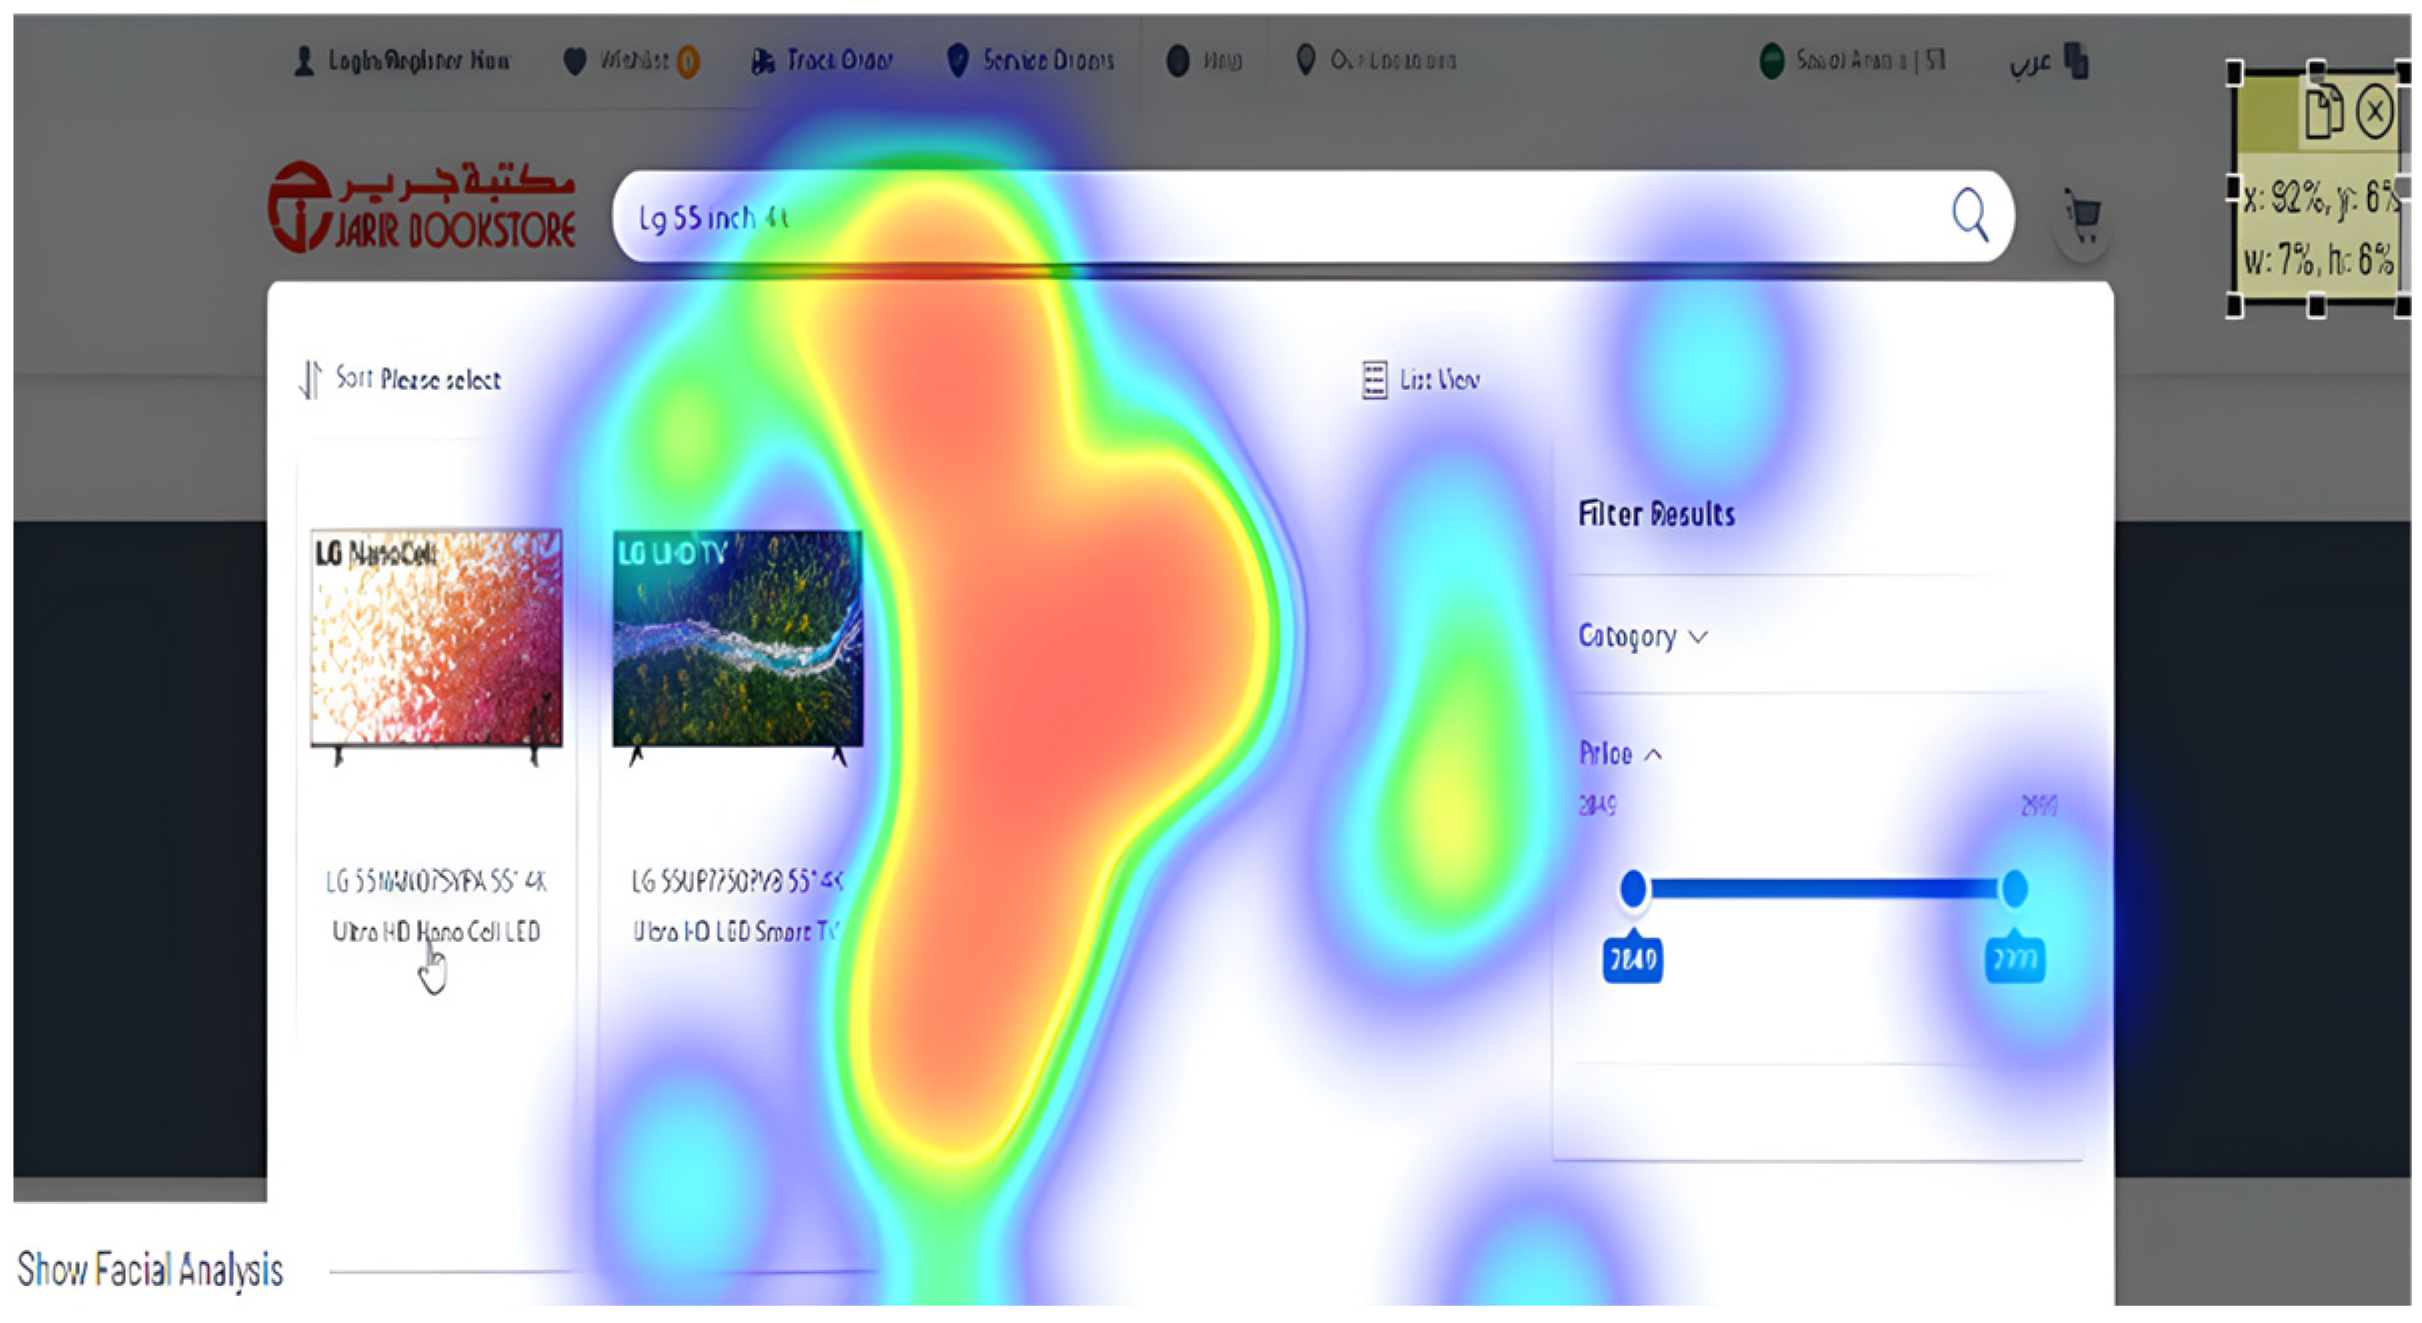
Table 9 shows a considerable number of fixations and a significant number of revisits to major areas of interest, mainly the search bar and main menu. The relatively long fixation time of the search bar was due to a lack of smart search; some users had to type and retype. On the other hand, the high number of fixations of the item price and description was due to active search; before users committed to the task, their eyes roamed all over the item image, description, and primary features to ensure they had the right item.
The users had two ways to locate the element: either by typing the name or by searching through categories. Users who attempted to type the name had a problem without an auto-complete functionality, which led to users having to type the full name.
Figure 8 shows an aggregated heatmap for all users during Task 1; the main hot areas included the left side of the search bar and the area of the drop-down menu on which users expected to find smart suggestions.
On the other hand, users who searched through the categories had difficulty with the menus disappearing with any slight movement of the mouse. Figure 9 shows users searching for items using menu categories; users kept flicking back to the source menu due to the disappearance of submenus.
  • Task 2
As depicted in Table 10, in this task, the time to the first fixation was significantly reduced. The users became more familiar with the position and purpose of the main elements on the website. The time spent on the search bar was significant due to the user searching for the first item and then for the second. The main menu was neglected by all users. All users performed the price comparison by browsing the first item and then the second. No user was able to detect the “Compare” button; therefore, no data were available for this element.
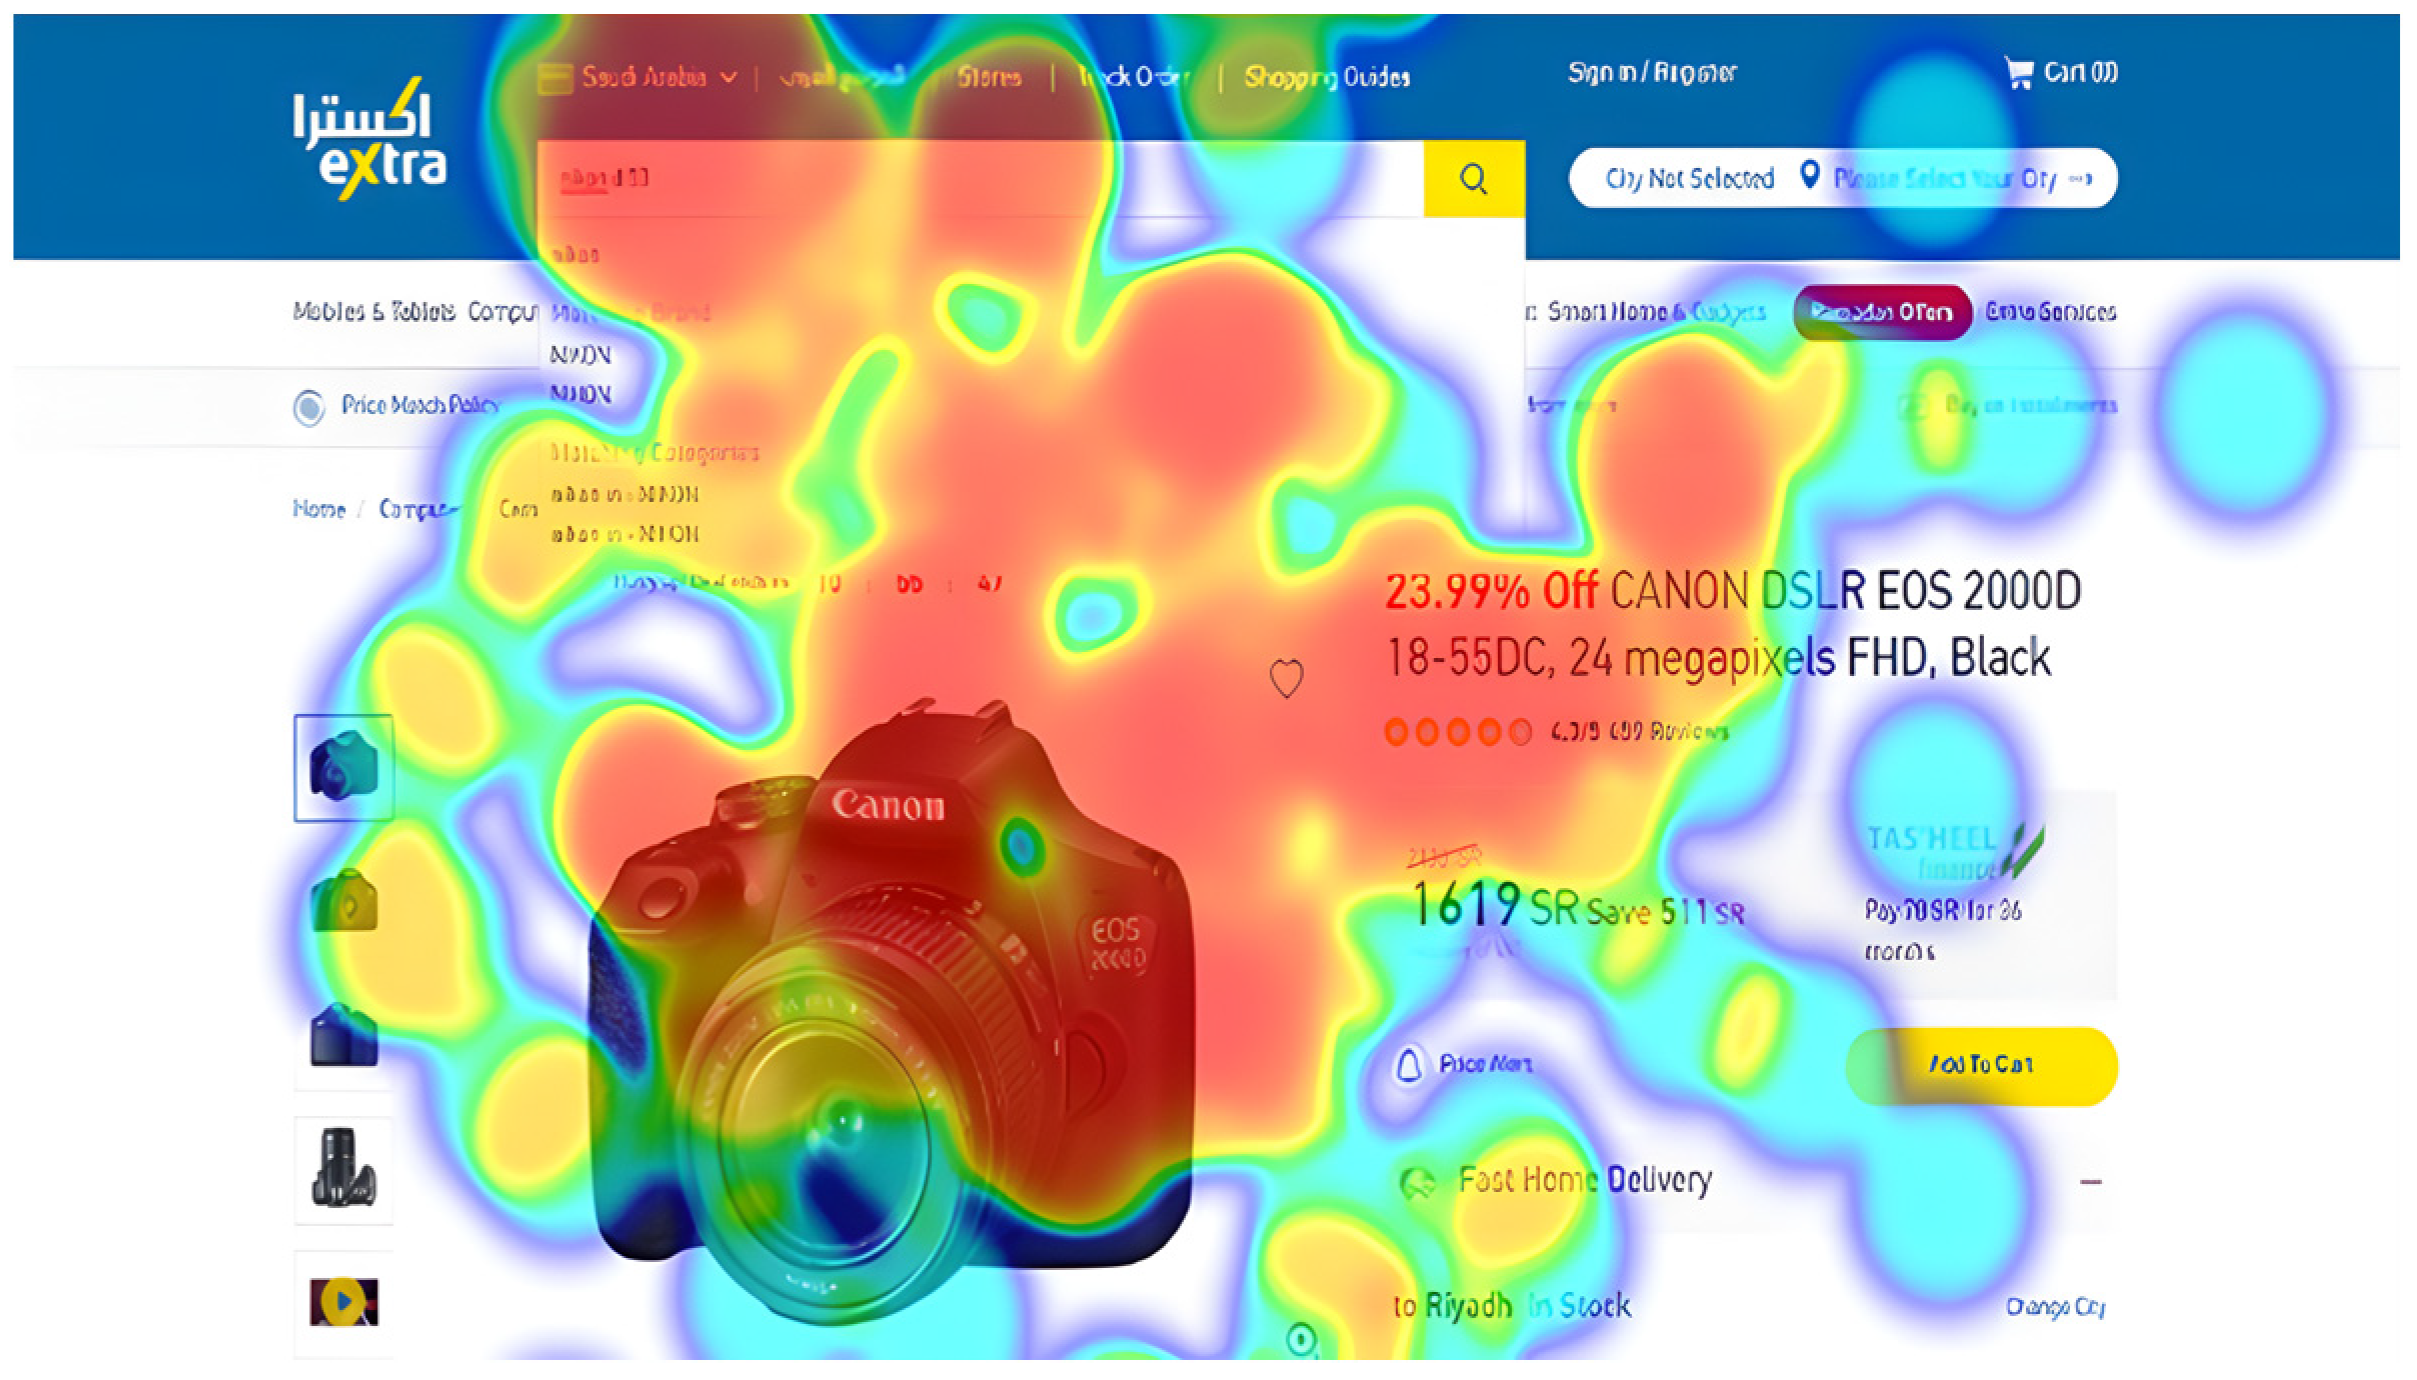
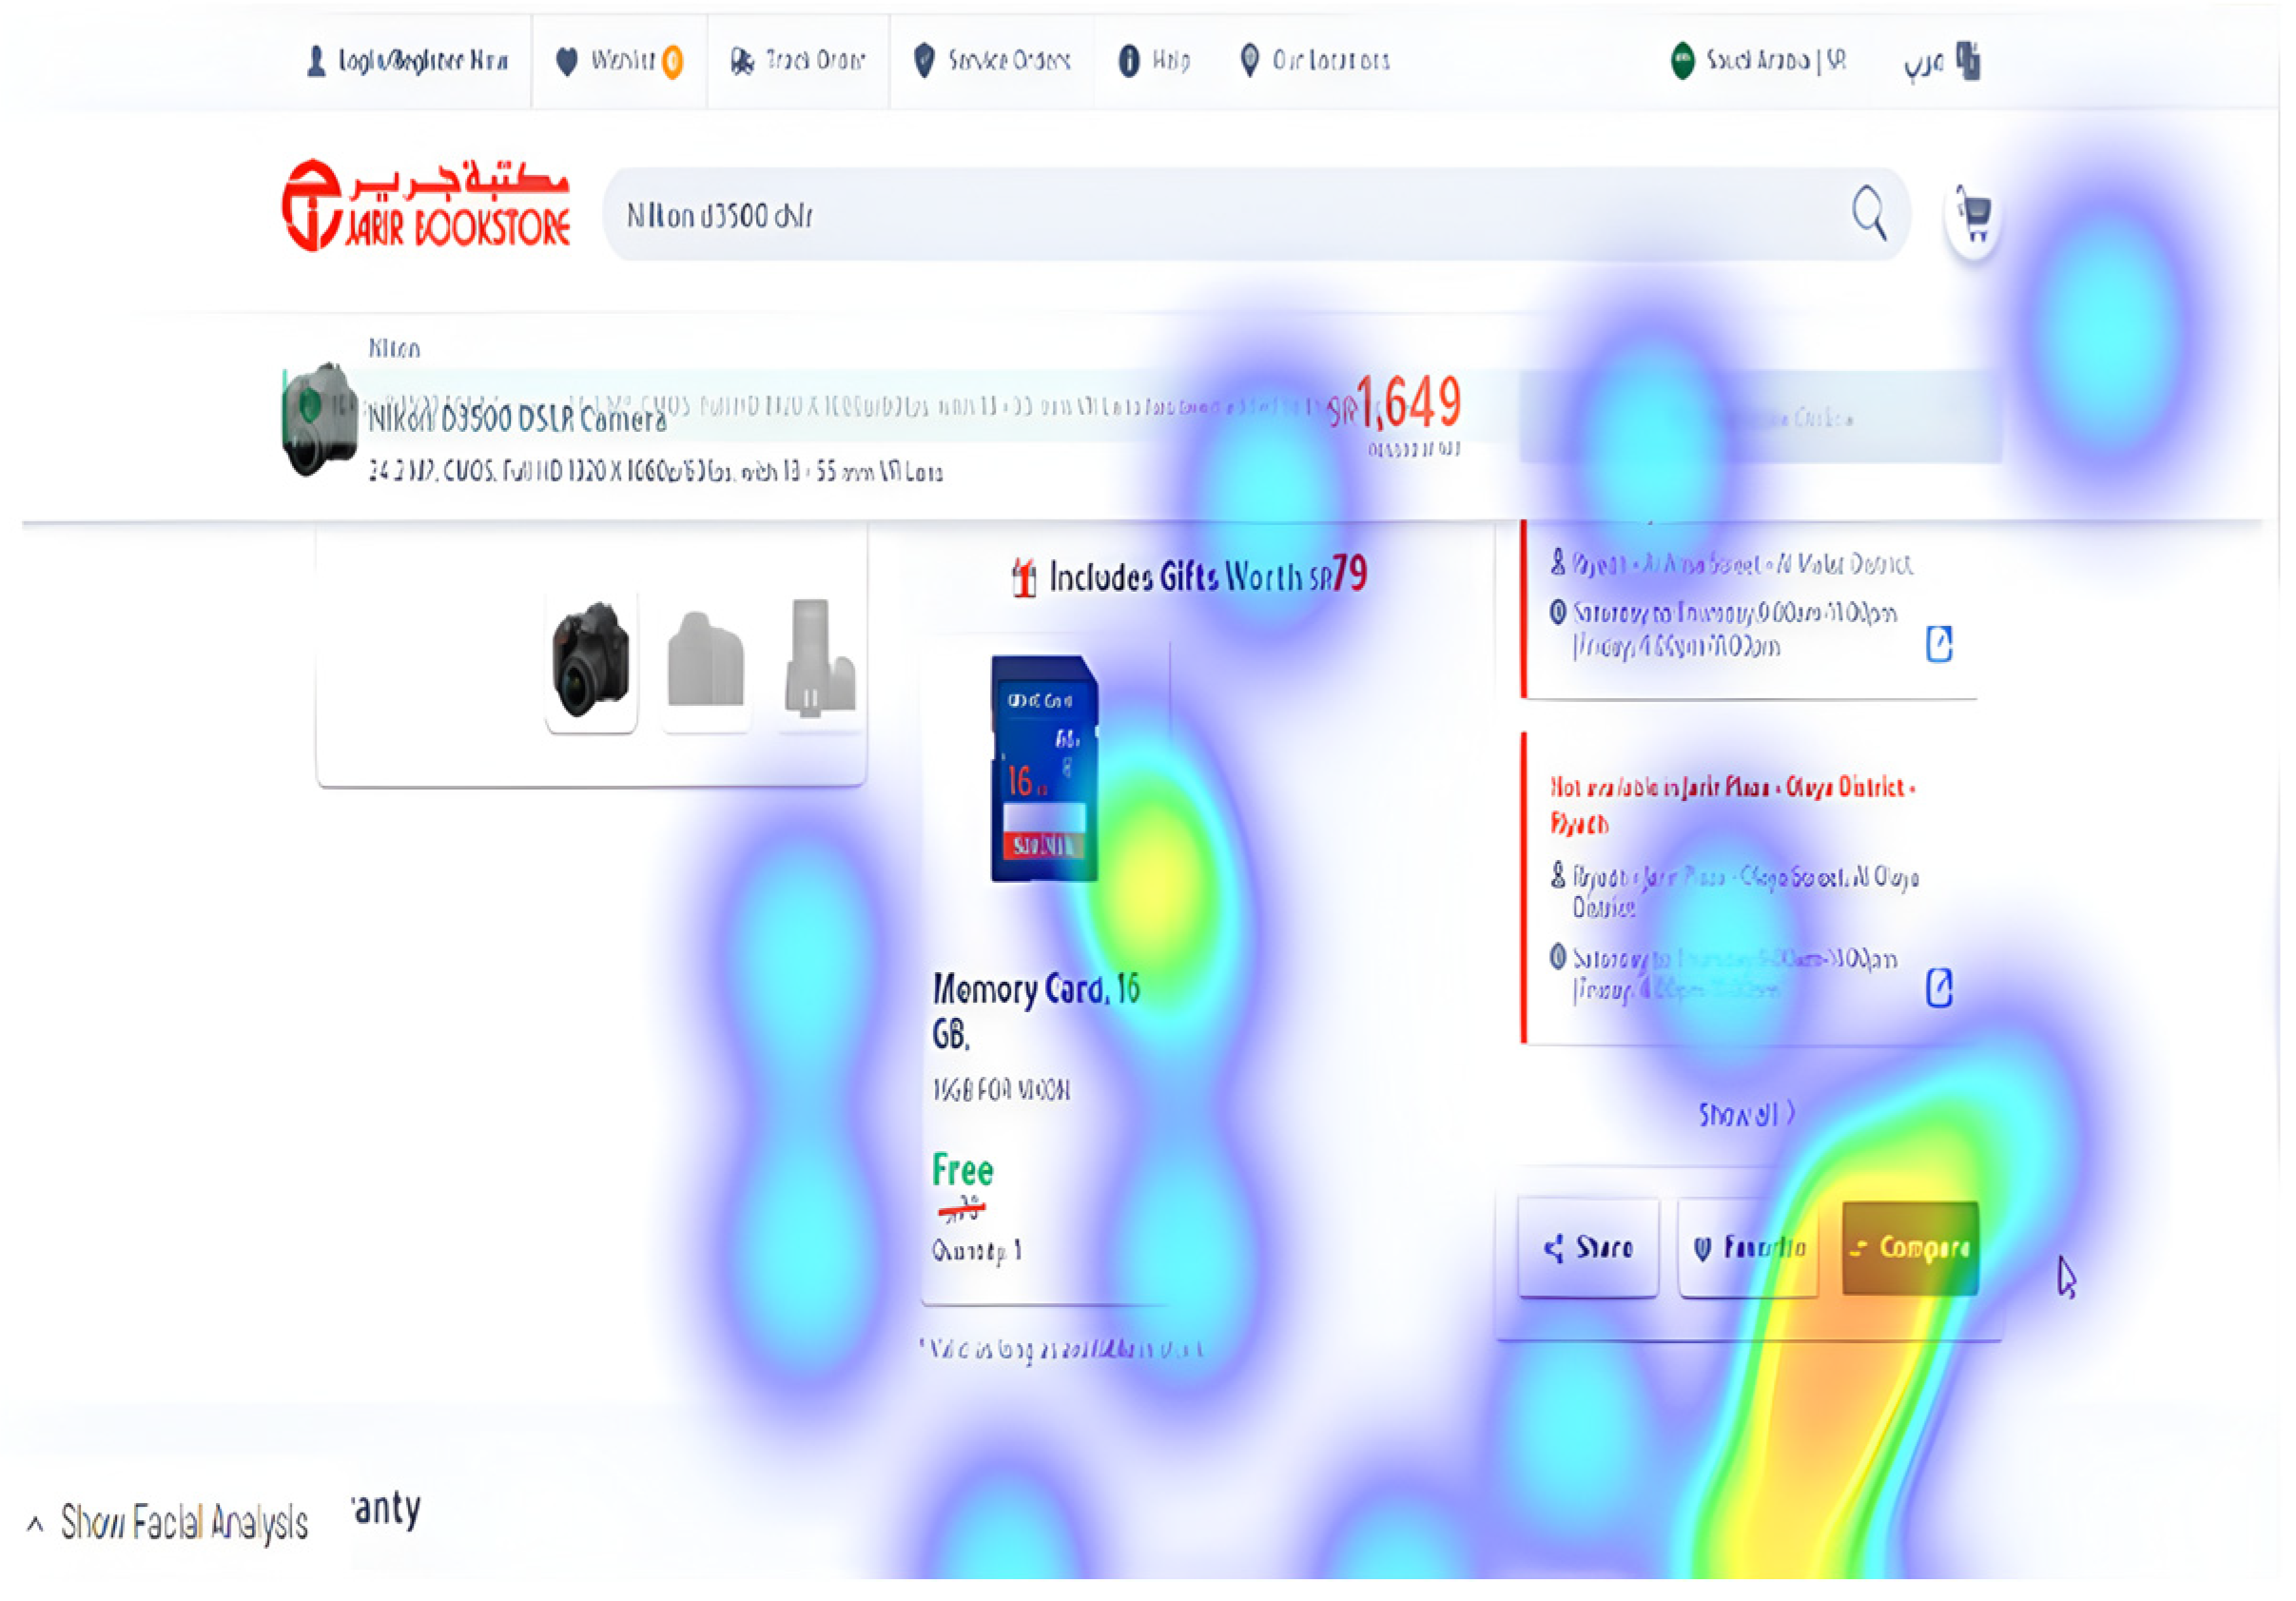
As expected, users spent considerable time fixating on item cards and item descriptions in an attempt to locate a “compare” button, as shown in Figure 10 and Figure 11.
  • Task 3
As shown in Table 11, users became adept at using the website. They focused on the search bar immediately and spent little time fixating on the task. Despite the simplicity of this task, the users faced an issue. When scrolling through search results, the cards did not contain an “Add to Cart” button. The following heatmap shows how after the product was identified, the users searched for an “Add to Cart” button on the right side of the page but found none, as shown in Figure 12. For a regular buyer or an experienced user, this could be frustrating. All users had to access the full page before they could add the item to the cart. Furthermore, using a financing service should be an option, not a compulsory path. When adding an item to the cart, the users were greeted with the financing service banner. This could be avoided by using a separate button for users who wished to simply buy the item and those who wished to apply for financing services.
  • Task 4
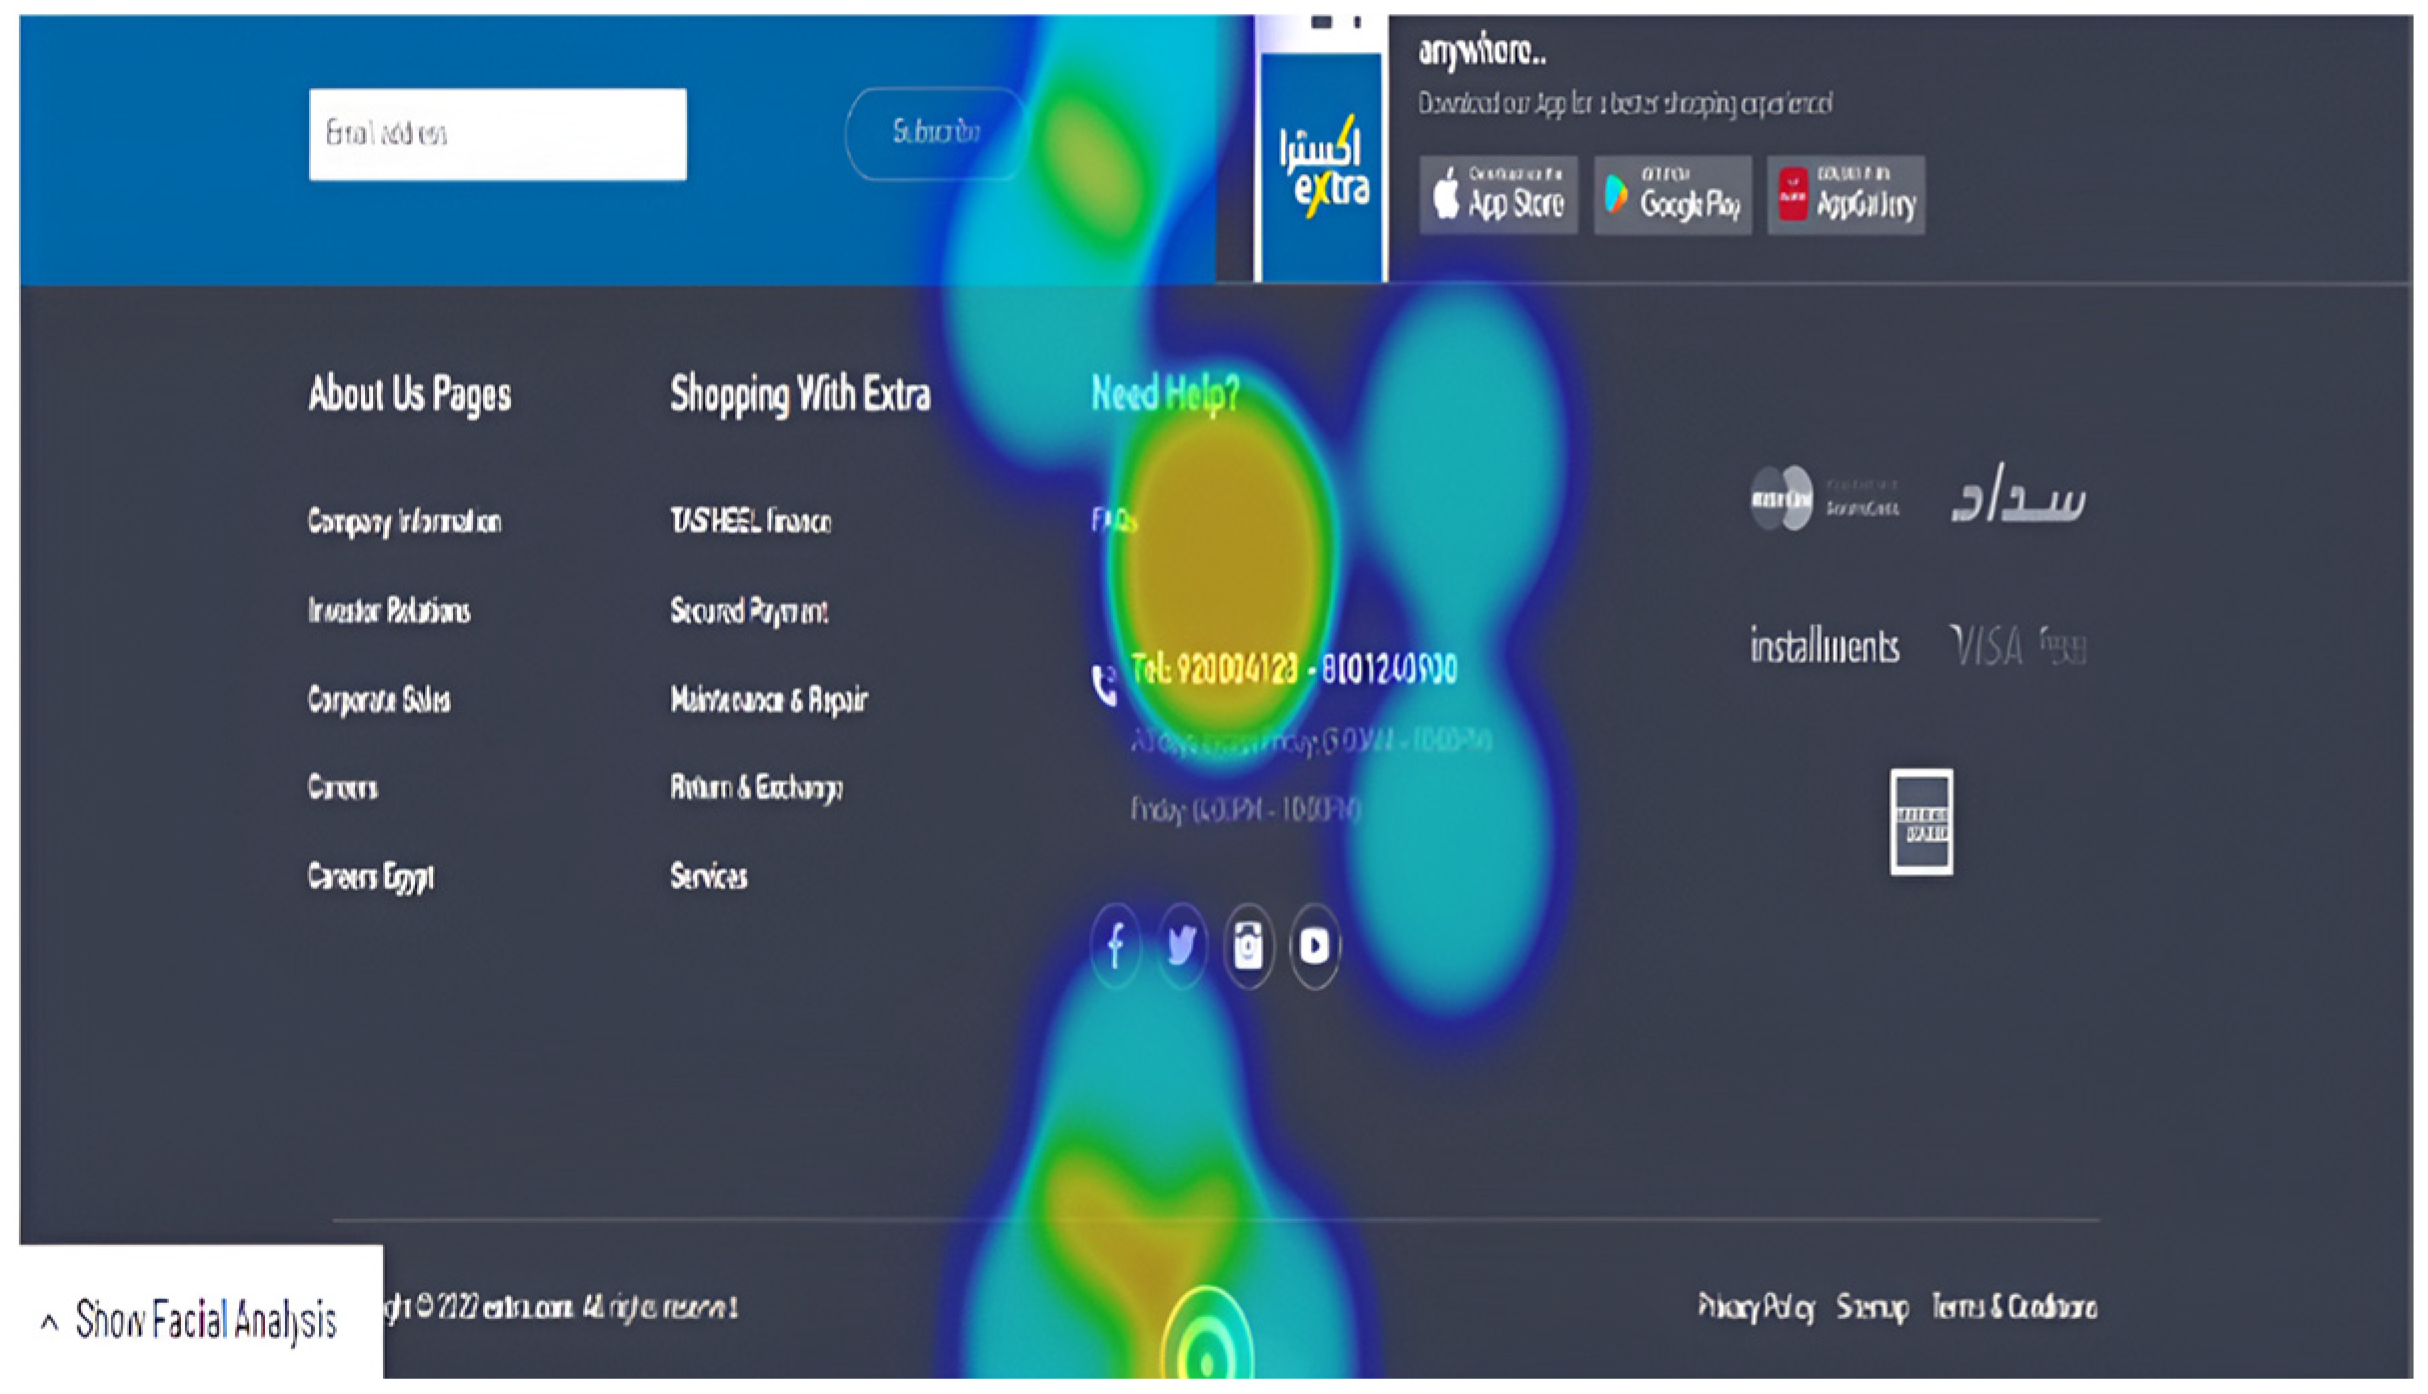
Table 12 shows the fixation data for the final task for the Extra website. The users were able to detect the support number easily on the footer, which was the first location to search for all users, with only one fixation and no revisits. The heatmap is shown in Figure 13.
  • Eye Tracking Discovered Usability Issues
Table 13 shows the identified usability issues using eye tracking and the severity rating for the Extra website. The usability issues pointed out problems related to user behavior.
  • Non-Task-Related Observations
In addition to the tasks, a further analysis was conducted on the user behavior while browsing the website, and the findings are as follows:
  • In general, following gazes and fixations, users did not pay attention to the main banner on the home page, despite its considerable size and central position. This is due to either their focus on the tasks or the banner’s inability to catch users’ attention while browsing.
  • User scan paths were regressive, tracing back and forth between certain areas on the page. This is an indicator of search inefficiency. Unfortunately, a dedicated eye-tracking system, rather than software, is required to generate an accurate analysis.

4.3.2. Jarir Website

  • Overall Evaluation of Jarir Website
As shown in Table 14, the participants spent 408 s on average performing tasks (6.8 min), of which 195 s (3.25 min) were spent fixating on elements. The nature of tasks and participant behavior during experiments indicated that the reason for the long fixation was the difficulty in locating what they were looking for. Interestingly, the average time to first fixation was 2 s, which is relatively high. This is due to the extensive set of banners all over Jarir’s homepage. The user gazed through colors and images without focusing on an item that stood out.
  • Task-Specific Evaluation of Jarir Website
    Task 1
As per Table 15, the TTFF for the main menu was considerably less than the TTFF for the search bar. In fact, most users attempted to locate the item using the main menu due to its colorful design and clear, inviting labels in contrast with the barely visible, grey search bar. However, the menu categories were very complicated and similar, which resulted in longer task times, longer fixations, and considerably more revisits. Figure 14 shows Jarir’s menu heatmap with hot areas around the path to locate the required TV set.
In contrast, the search functionality was very efficient. Users who reverted to search using the toolbar were able to browse the impressive smart suggestions provided and immediately located the required item, as shown in Figure 15. Interestingly, the item description was easily located, and the price was immediately detected as it stood out in a bold, red font.
  • Task 2
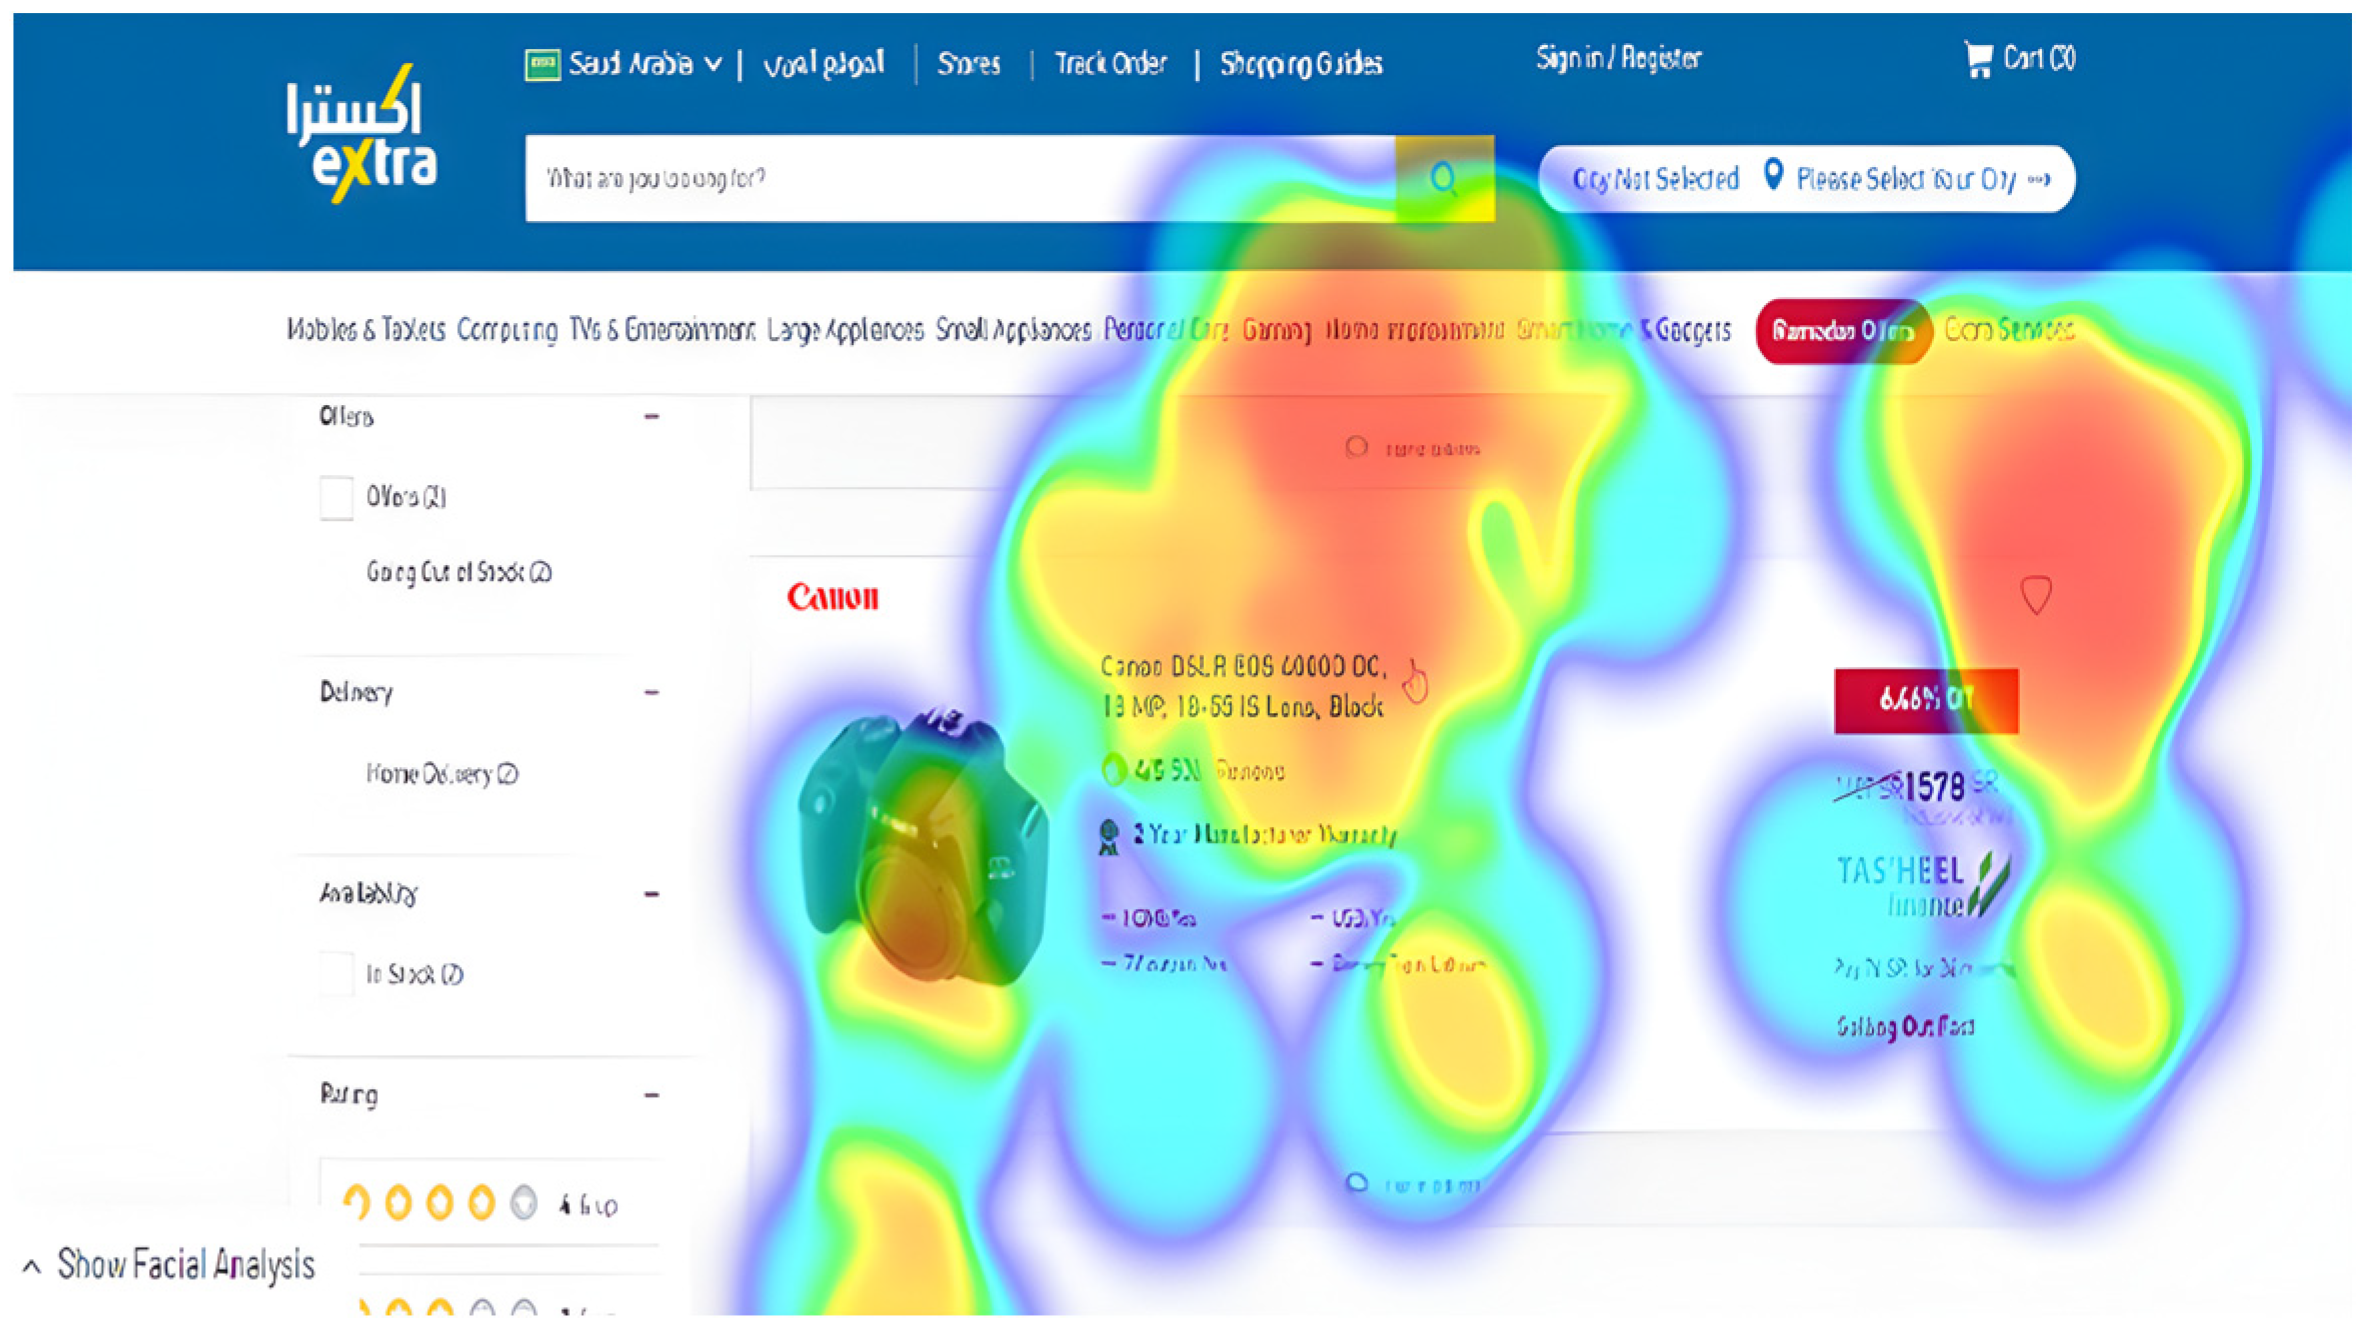
As shown in Table 16, all users reverted to search using the search bar, and the menu received very little attention, which indicates the difficulty they faced while using it. This is shown in the shorter TTFF on the search bar compared to the main menu and the fewer number of fixations the latter received. However, the “Compare” button was located immediately, as shown in Figure 16 and Figure 17.
  • Task 3
Table 17 shows user bias using the search bar and the lack of interest in the menu. This is reflected in the users’ TTFF and the number of fixations, depicted in Figure 18.
Jarir provides a clear call to action, and the Add to Cart button was easily located by users from the item card, as shown in Figure 19.
  • Task 4
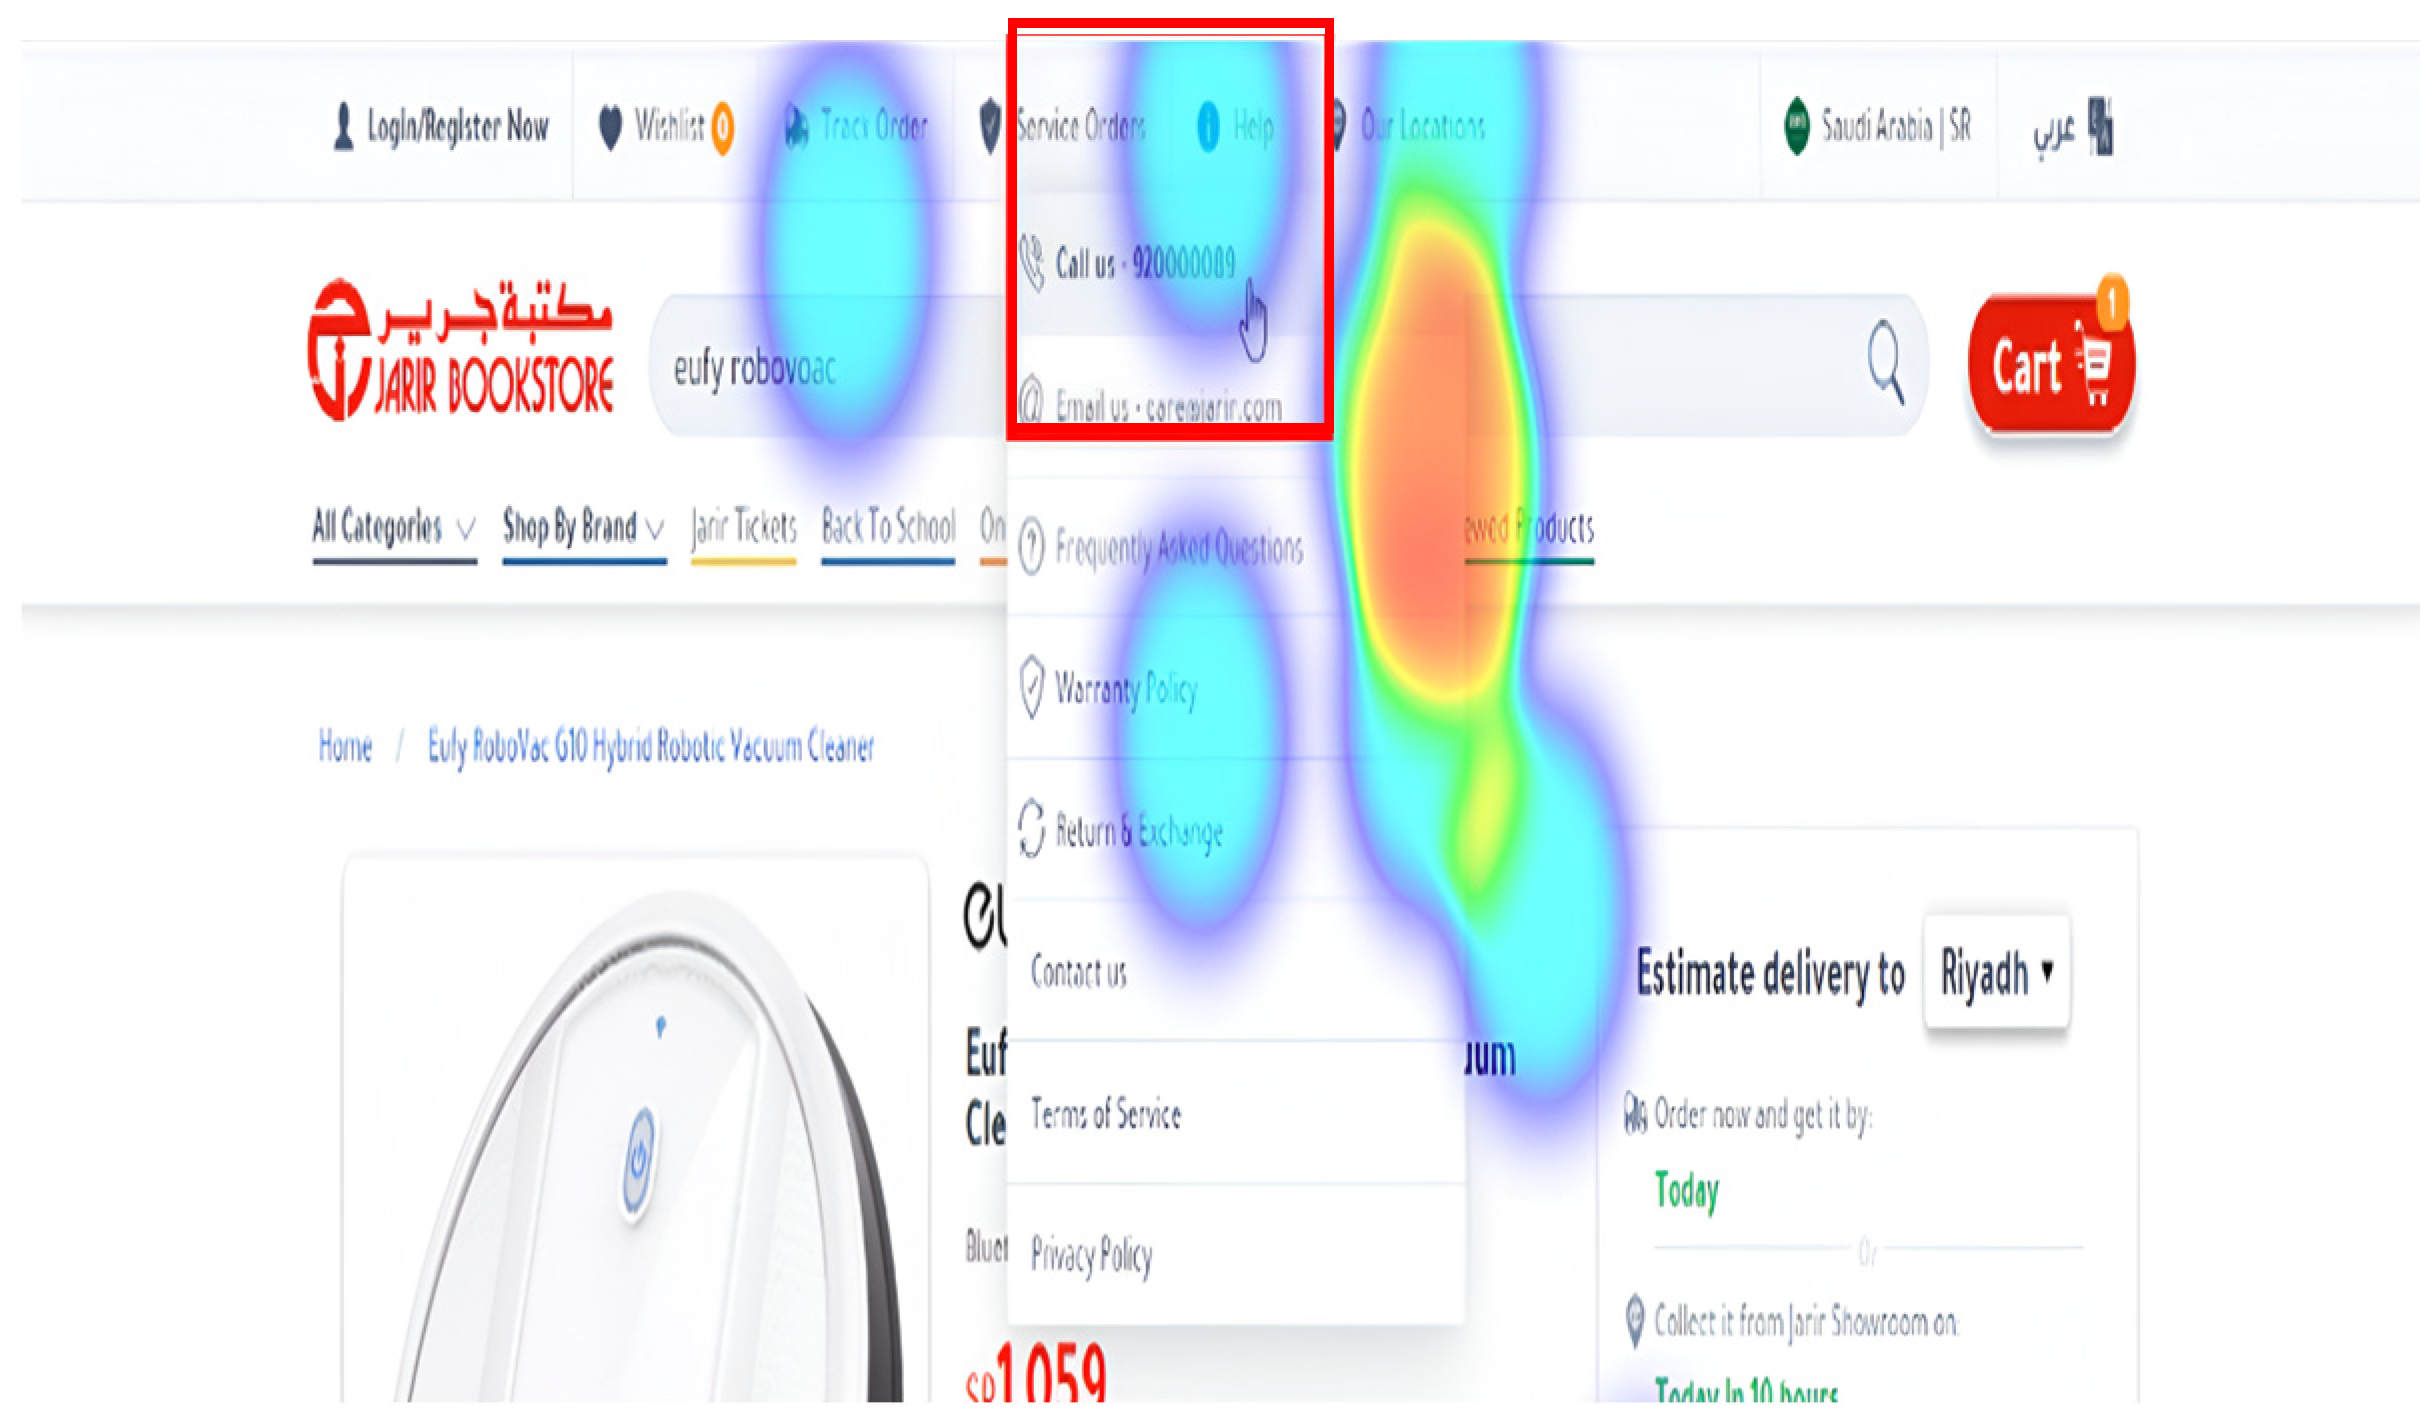
Table 18 shows fixation data for the final task on the Jarir website. Users had to actively search for the support number. They attempted to scan the website for a call button or support number at the footer. However, they finally managed to locate the help button in the top menu. Figure 20 shows the heatmap for identifying the support number location on the Jarir website.
  • Eye Tracking Discovered Usability Issues
Table 19 shows the identified usability issues using eye tracking and the severity rating for the website. The usability issues pointed out problems related to user behavior.
  • Non-Task-Related Observations
Further analysis of user behavior on the website revealed the following:
  • The users did not register any notable interest in the homepage despite its colorful design and attractive banners. However, the users’ notice of the main banner was more than that for the Extra website.
  • User scan paths were somewhat regressive, tracing back and forth between certain areas on the page. On the Jarir website, this was also due to the crowded banners with small fonts and icons.

4.4. SEQ

After the participants completed the required tasks in usability testing and eye-tracking techniques, they answered an SEQ to assess the difficulty of the tasks. The question was: Overall, how difficult or how easy were the tasks to complete?
The answers were on a Likert Scale, with 1 indicating very difficult and 7 corresponding to very easy; the results were calculated per both websites. Average SEQ scores for the Extra and Jarir websites are shown in Table 20.
According to [73], the average task difficulty using SEQ is 4.8. The calculated average SEQ among users was 4.1 and 5 for the Extra and Jarir websites, respectively. This indicates a below-average score for Extra, which corresponds with a higher number of task errors and more severe usability issues. As for Jarir, the score indicates an above-average score. In general, users on Jarir had less difficulty performing tasks which is reflected in a higher SEQ.

5. Results

This section aims to show the experimental results of the behavioral measurement techniques by comparing the effectiveness of the three techniques by listing the number of identified usability problems alongside the severity ratings. This section also covers the results of the selected techniques for both websites and analyzes these results.
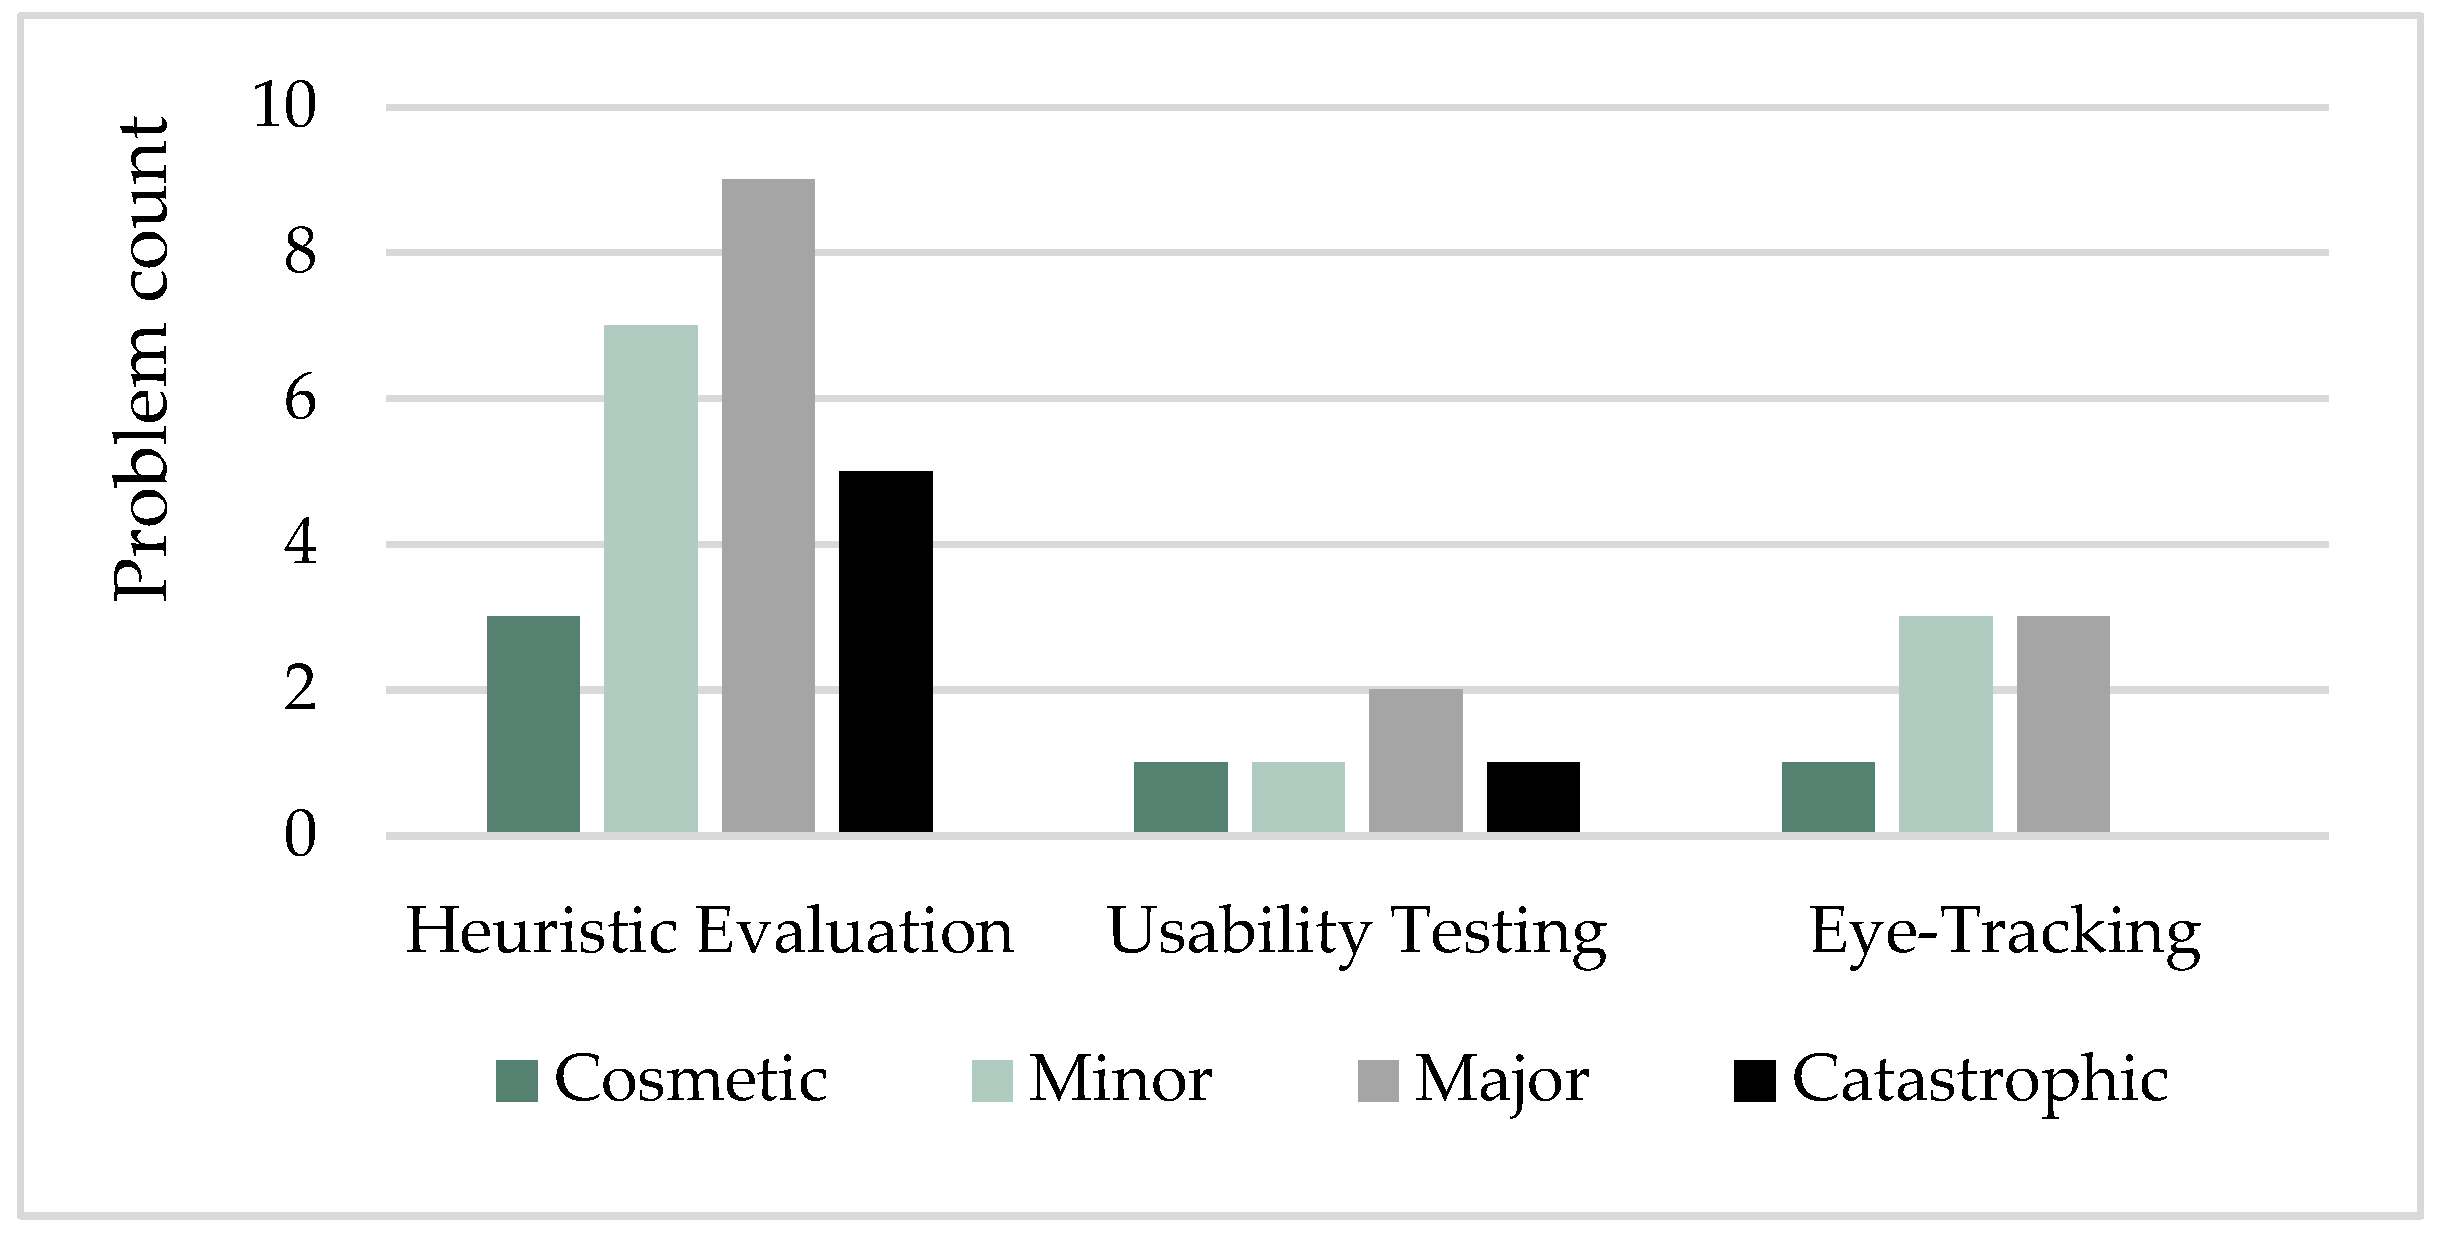
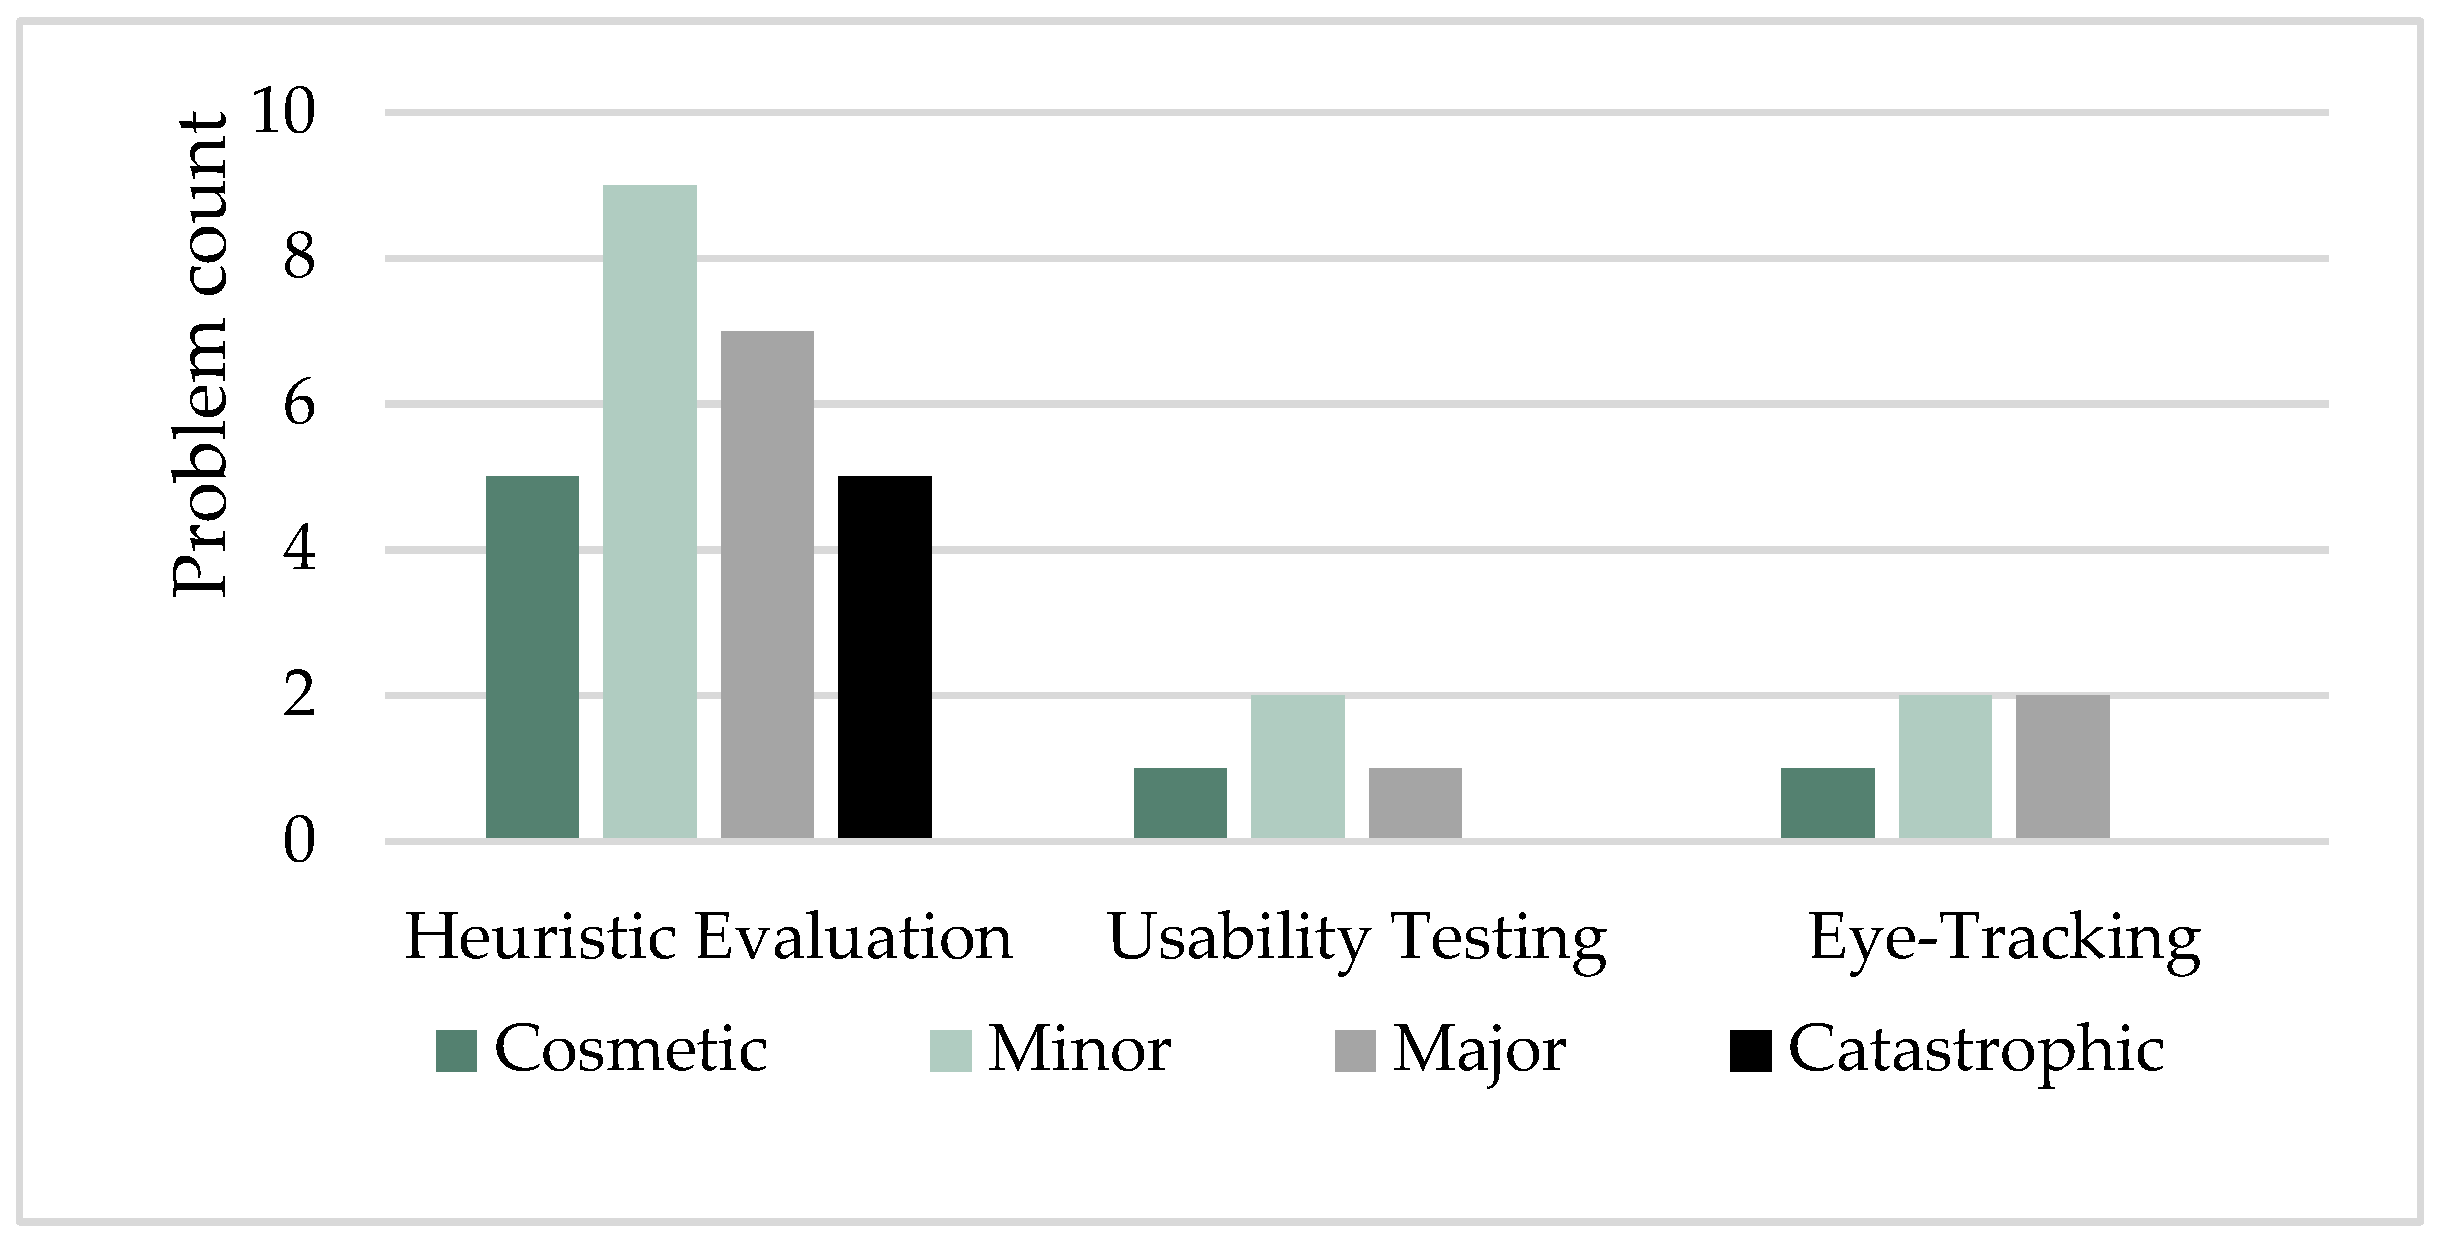
Table 21 shows a comparison of the effectiveness of the selected techniques for the Extra website. The initial evaluation of the Extra website using the three behavioral measurement techniques uncovered 36 problems, 28 of which were determined uniquely. Table 21 shows that 24 of the total detected problems (66.66%) were discovered by heuristic evaluation, 5 (13.9%) by usability testing, and the remaining 7 (19.44%) using eye-tracking analysis. Of these problems, 14 problems (38.89% of total identified problems) were major, 11 problems (30.55%) were minor, 6 problems (16.66%) were catastrophic, and 5 problems (13.9%) were merely cosmetic. As per each technique, a subsequent figure illustrates how each technique was performed in regard to the severity of the detected problems for the Extra website. The highest number of problems per all severity ratings was obtained using the heuristic evaluation, whereas usability testing and eye-tracking came next with comparable numbers of detected problems.
For the minor and major severity ratings, 2 and 3, respectively, eye tracking achieved better results than usability testing. However, for the catastrophic rating of 4, usability testing detected 1 problem, but the eye-tracking technique detected none. The usability testing and heuristic evaluation yielded equal average severity of 2.6, while the average severity score of problems identified by eye tracking was 2.3. Overall, the problems were mainly related to the website functionalities, such as weak search and lack of compare and undo functionalities, and the website design, such as menu complexity, inconsistent item cards, and system response. Figure 21 shows the severity rating for the Extra website based on the behavioral measurement techniques.
On the other hand, Table 22 shows a comparison of the effectiveness of the selected techniques for the Jarir website. The initial evaluation of Jarir’s website using three behavioral measurement techniques uncovered 35 problems, 30 of which were determined as unique. As the table shows, 26 of the total detected problems (74.29%) were discovered using heuristic evaluation, 4 (11.43%) via usability testing, and the remaining 5 (14.28%) using eye-tracking analysis. Of these problems, 13 problems (37.13% of total identified problems) were minor, 10 problems (28.58%) were major, 7 problems (20%) were cosmetic, and 5 problems (14.29%) were catastrophic. As per each technique, a subsequent figure illustrates how each technique performed in terms of the severity of the detected problems for Jarir. The highest number of problems per all severity ratings was obtained using the heuristic approach, whereas usability testing and eye tracking came next with comparable numbers of detected problems.
Both eye tracking and usability testing achieved the same results of one and two problems each for cosmetic and minor severity ratings, respectively. However, both methods did not detect any catastrophic problems, whereas eye tracking detected two problems in the major severity rating against only one problem detected using usability testing. The highest average severity score was 2.5, obtained using heuristic evaluation, followed by eye tracking with an average severity of 2.2 and usability testing with an average severity of 2. Overall, the problems were mainly related to the website functionalities, such as lack of undo features, and the website design, such as menu complexity and the crowded homepage. Figure 22 shows the severity rating for the Jarir website based on the behavioral measurement techniques.

6. Discussion

This research has integrated three behavioral measurement techniques: heuristic evaluation, usability testing, and eye-tracking to evaluate the website usability of Extra and Jarir. This section discusses the findings in three major aspects: first, it highlights some detected usability problems. Next, this section illustrates the major differences between the applied techniques in terms of the number of detected problems, their severity, and their nature. Finally, this section lists the strengths and weaknesses observed on each website.
As indicated in [15], usability problems detected on e-commerce websites mostly relate to page navigation, search facilities, purchasing, consistency, design, security, and lack of certain functionalities. The findings for both websites agree with these categories, in particular, the search optimization and missing functionalities.
In general, the heuristic evaluation yielded many interesting usability problems. Among the catastrophic problems was the lack of input validation for the phone number on the Jarir website and the subsequent absence of any error messages when the verification failed. This issue may degrade the UX, especially as it comes shortly after the buying decision is made. The users may unknowingly mistype their phone number and not receive any notification of their order for no apparent reason as they received no error message.
One interesting usability problem is the restriction placed by both websites on the possible number of ordered items. For instance, on both websites, users can not order more than one expensive item, such as a smartphone or a TV. This is a critical weakness as it limits shopping behavior and may require users to order several times. In fact, such items are not commonly ordered in bulk. However, an alternative, better practice would be to display a warning message and emphasize the total cost of the order.
Moreover, both the Jarir and Extra websites lack documentation and user guides. This seems to be a common usability problem among e-commerce websites, as indicated by [74]. Business owners and web developers may assume that users are already familiar with online shopping. Despite the recent rise in the number of online shoppers in Saudi Arabia and worldwide, many users are still inexperienced or unsure and may need to frequently access help pages.
The Extra and Jarir websites also share another usability problem, and that is the inconvenience of the slider element that moves one item at a time. Thus, if the user wishes to slide 10 items to the left, they need to click the left arrow 10 times. This may annoy users and redirect them to another navigation option.
Among the problems identified by usability testing but not detected by experts was the reappearing offers on both websites. Users were interrupted several times while performing tasks by the website’s ads, which led to user distraction and confusion. The marketing efforts in such scenarios are not only lost, but contribute to the users’ dissatisfaction. This problem was detected neither by experts nor via eye tracking. Experts may not be as annoyed with the disruption as ordinary users. On the other hand, on eye tracking, no significant fixation was recorded on the pop-up messages. The user attempted to locate the “Exit” button to close the message. Therefore, such problems are not detected by eye tracking.
Furthermore, the menu design, the lack of smart search, and the low quality of search results all led to usability problems. Despite this fact, the Jarir website performed better than the Extra website in terms of search results. These problems will hinder the user’s activity on the website and restrict their shopping experience.
The eye-tracking technique revealed that the main menu categories on the Extra website would disappear with the slightest movement of the mouse pointer. This was reflected in longer and higher density fixations around the main menu. Furthermore, the lack of an obvious comparison button was clearly illustrated in the heat map and scan path. The users fixated, searched, and revisited the same side of the page on which they expected to find the button. The smart use of color on the Jarir website and the placement of item prices in a bold, red font led to faster detection by users.
Heuristic evaluation yielded the highest number of problems, identifying 26 and 24 unique usability problems on the Extra and Jarir websites, respectively. In other words, heuristic evaluation yielded additional and more severe problems, twice the number identified by both eye tracking and usability testing combined. Eye tracking detected seven usability problems on Extra and five on Jarir websites, whereas usability testing identified four and five usability problems on the Extra and Jarir websites, respectively. This corresponds to other works, such as [37,57,75]. The higher number of problems identified by heuristic evaluation can be attributed to the expertise of participants in comparison to normal users who conducted the usability testing and eye tracking. Furthermore, experts in the heuristic evaluation were free to roam the website and navigate pages, whereas users were required to perform tasks that limited the scope of usability problems they could find. For instance, in this experiment, experts uncovered usability problems related to the number of items ordered and the phone verification process. In usability testing and eye tracking, users were not required to, and thus did not, reach this stage.
Regarding the severity of identified problems, heuristic evaluation yielded the highest average severity on both websites. On the Extra website, the average severity scores of the heuristic and usability testing were similar. However, on the Jarir website, both heuristic evaluation and eye tracking achieved a higher average severity score than usability testing. This does not agree with previous works, such as [57,76,77], which stated that the average severity score obtained by the usability testing is higher than that of heuristic evaluation. This difference could be due to several reasons. For instance, the nature of tasks required in usability testing did not cover all aspects examined by heuristic evaluation. Many severe usability problems were detected while placing an order or verifying location, which were beyond the scope of the required tasks.
In terms of the nature of identified usability problems, the three techniques provided significantly varying perspectives of the websites. Heuristic evaluation provided a fine-grained evaluation that scanned all aspects of the website. The participants were professional UI/UX experts able to detect cosmetic and severe problems in areas which user testing was unlikely to reach. Interestingly, the heuristic evaluation provided more design-related problems, such as menu design, item navigation, and placement, and product display, whereas usability testing and eye-tracking reported more workflow obstacles, such as the absence of comparison buttons, annoying update notifications, and search inefficiency. This observation is in line with the work of [78].
Regarding eye tracking, the high number of fixations and long average fixation duration can be attributed to either interest in the element or inefficient search and failure to extract information. In relation to the nature of tasks, the user was unlikely to be attracted to the “Compare” button area, for instance. The high SEQ score on both websites indicated that users found the tasks relatively easy, leading to the conclusion that users were having minor difficulties with the interface. Such problems can be detected neither by heuristic evaluation nor with traditional usability testing. This makes eye-tracking more attractive as a supportive technique for usability evaluation but not a stand-alone usability evaluation technique as it does not provide sufficient information on its own. This is supported by the works of [63,79]. Unfortunately, eye tracking requires extensive analysis to determine the exact underlying usability problem. Furthermore, to provide an authentic assessment of usability problems, user browsing behavior should be as natural as possible. This will allow the evaluators to assess all aspects of the UX, not simply task-related. For instance, a browsing user may be distracted by a side banner or intrigued by a particular element. In task-based studies, users are focused and quite restricted in their roaming around the website.
In short, the strengths and weaknesses of the Extra and Jarir websites can be summarized as shown in Table 23.

7. Recommendations

This research evaluated the usability of e-commerce websites in Saudi Arabia and identified critical problems. In this section, the recommendations and insights gained from this research are presented. The recommendations provided are divided into three primary groups presented in detail in the following sub-sections.

7.1. Recommendations for Extra and Jarir Websites

Extra and Jarir are the top-two e-commerce websites in Saudi Arabia, and their websites receive massive traffic from shoppers every day. Therefore, it is of utmost importance to ensure users have the optimal UX. In order to do so, these websites require a few minor and major changes. Both websites would benefit from the following considerations:
  • Providing clear indications for the system status and user progress.
  • Optimizing search experience by using auto-correct and smart search.
  • Providing documentation and user guides.
  • Minimizing distractions such as notifications and offers.
Extra as a website is well-designed. However, its menu is hard to navigate and requires an emphasis on menu items by using larger fonts, background contrast, UI indications, and more accented margins. On the other hand, Jarir has an elegant design and a better search result suggestion mechanism. However, the main menu requires simplifying and ensuring input validation.

7.2. Recommendations for E-Commerce Websites

E-commerce shops and businesses should plan and design their websites with the end-user in mind; this requires an iterative development model in which the website is continuously being tried and tested. The recommendations provided for Extra and Jarir can be generalized for all e-commerce websites. This research recommends e-commerce websites adhere to the following guidelines:
  • The system should be as user-friendly as possible, and UX/UI designers should take into consideration users in varying age groups and with a wide range of computer expertise. Among the most significant aspects that require attention are the search facilities and access to support. Users in e-commerce websites start with a search to locate their target items. Thus, effective search functionality is essential for a positive UX. The users also need to be able to access help at all times. It might be helpful to add a floating chat/call button on the page, even if it first directs the user to a bot.
  • The UX/UI designers should consider all the situations in which users are prone to errors and employ prevention techniques and/or error correction functions. This includes input validation, auto-correct, undo and redo functions, and confirmation messages wherever possible. UX/UI designers can utilize a floating bot that provides help on the go as the user browses the website. Users may choose to turn the bot on and off to avoid harassing experienced users. However, for new buyers and inexperienced users, the bot can provide an easy, cost-free walk-through for the buyer and enhance their overall experience on the website.
  • The UX/UI designers should minimize distractions, such as pop-up banners and advertisements or offers.

7.3. Recommendations for Usability Evaluators

The three usability evaluation methods provide distinct insights into the target websites. Therefore, one method can not replace the others, and these techniques are most effective when combined to provide a comprehensive report of usability problems. However, further analysis of e-commerce websites is required. The following is a list of the recommendations for usability evaluators:
  • In usability testing, tasks should cover all the website functions, such as creating an account and logging in, editing info, browsing, purchasing, requesting a refund, canceling orders, and compiling and editing the cart.
  • It is important to create a trade-off between the number of tasks for each participant and the system coverage. It can be helpful to include more participants, divide them into several groups, and assign each group with different tasks.
  • In eye tracking, aggregated heatmaps and scan paths were essential indicators of elements’ complexity and search inefficiency. However, an analysis was required for user behavior and task outcome to determine the true problems. Therefore, it is more helpful to combine both usability testing and eye tracking. On the other hand, applying eye tracking with heuristic evaluation is counter-productive because experts are consciously fixating and searching for usability problems and are not in a natural browsing mode which is necessary to reveal problems.
  • If eye tracking and usability testing are conducted separately, it is more effective to use different tasks.
Using dedicated eye-tracking hardware is more effective as it measures more metrics and provides more accurate data.

8. Conclusions

This work provided a comprehensive literature review on behavioral measurement techniques to identify the gap analysis. Another objective of this research was to assess the usability of different e-commerce websites in Saudi Arabia using three behavioral measurement techniques, namely: heuristic evaluation, usability testing, and eye-tracking technology, in an attempt to compare the effectiveness of these techniques in identifying and reporting the usability issues.
This research assessed two major e-commerce websites: Extra and Jarir. Many usability problems with varying severity scores were identified, and proper recommendations were provided accordingly. The heuristic evaluation technique yielded the highest number of usability problems and the highest number of severe problems, whereas usability testing provided fewer problems and most of which were already identified by the experts.
Eye tracking provided critical information regarding the page design and element placements and revealed certain user behavior patterns that indicated certain usability problems. For instance, longer fixation and retracing scan paths indicated search inefficiency and layout issues. Since eye tracking and usability testing required users to perform the same tasks, there was a significant overlap in their results. Overall, when used properly, the three behavioral measurement techniques are complementary. It is recommended to apply all these techniques if the available resources, namely budget and time, are sufficient. However, in case of time constraints and the cost of tests, heuristic evaluation by experts is enough to detect most of the usability problems on the websites.
Unfortunately, there have been many obstacles that hindered the progress of this research, some of which were circumvented. This research utilized an online subscription-based platform to conduct the eye-tracking experiment as the researcher had no access to an eye-tracking device. The device was not available at the researcher’s university, and there was no possibility of purchasing one since it was expensive. Therefore, due to time constraints, the researcher substituted the device with the online platform, which is less accurate, generates fewer metrics, and has a limited user session.
Future work can be pursued to further verify the obtained results by using a more accurate eye-tracking device in addition to including more groups of participants, more tasks to cover all the website features, and combining usability testing with eye-tracking and think-aloud methods. We acknowledge that further research on classification of the identified usability problems would strengthen the results and can be explored as a future direction. Moreover, real-life tests can also be beneficial, such as testing users with actual buying intentions. Such users will exhibit more authentic behavior towards the website design and its functionalities. Furthermore, more focus can be directed to applying the behavioral measurement techniques on other domains, such as Saudi governmental websites, as these websites are becoming more important, especially with the Saudi 2030 vision of the transformation to digitalization. Accordingly, it is essential to identify usability issues and provide recommendations to enhance the UX.
Author Contributions

Conceptualization, M.A.A.; methodology, T.S.A. and M.A.A.; validation, T.S.A. and M.A.A.; formal analysis, T.S.A.; investigation, T.S.A.; resources, M.A.A. and T.S.A.; writing—original draft preparation, T.S.A.; writing—review and editing, T.S.A. and M.A.A.; visualization, T.S.A.; supervision, M.A.A.; project administration, M.A.A. All authors have read and agreed to the published version of the manuscript.

Funding

This research was funded by the Deputyship for Research and Innovation, Ministry of Education in Saudi Arabia, grant number 523.

Data Availability Statement

Data are contained within the article.

Conflicts of Interest

The authors declare no conflict of interest.

References

  1. Taher, G. E-Commerce: Advantages and Limitations. Int. J. Acad. Res. Account. Financ. Manag. Sci. 2021, 11, 153–165. [Google Scholar] [CrossRef]
  2. Geelhaar, J.; Rausch, G. 3D Web Applications in E-Commerce—A secondary study on the impact of 3D product presentations created with HTML5 and WebGL. In Proceedings of the 2015 IEEE/ACIS 14th International Conference on Computer and Information Science (ICIS), Las Vegas, NV, USA, 28 June–1 July 2015; pp. 379–382. [Google Scholar]
  3. Kamińska, D.; Zwoliński, G.; Laska-leśniewicz, A. Usability Testing of Virtual Reality Applications—The Pilot Study. Sensors 2022, 22, 1342. [Google Scholar] [CrossRef]
  4. Ejaz, A.; Syed, D.; Yasir, M.; Farhan, D. Graphic user interface design principles for designing augmented reality applications. Int. J. Adv. Comput. Sci. Appl. 2019, 10, 209–216. [Google Scholar] [CrossRef]
  5. Arthana, K.R.; Pradnyana, I.M.A.; Dantes, G.R. Usability testing on website wadaya based on ISO 9241-11. J. Phys. Conf. Ser. 2019, 1165, 012012. [Google Scholar] [CrossRef]
  6. Muslim, E.; Moch, B.N.; Wilgert, Y.; Utami, F.F.; Indriyani, D. User interface redesign of e-commerce platform mobile application (Kudo) through user experience evaluation to increase user attraction. IOP Conf. Ser. Mater. Sci. Eng. 2019, 508, 012113. [Google Scholar] [CrossRef]
  7. Jain, S.; Purandare, P. Study of the Usability Testing of E-commerce applications. J. Phys. Conf. Ser. 2021, 1964, 042059. [Google Scholar] [CrossRef]
  8. Huang, J.; Wang, X. User experience evaluation of B2C E-commerce websites based on fuzzy information. Wirel. Commun. Mob. Comput. 2022, 2022, 6767960. [Google Scholar] [CrossRef]
  9. Jongmans, E.; Jeannot, F.; Liang, L.; Dampérat, M. Impact of website visual design on user experience and website evaluation: The sequential mediating roles of usability and pleasure. J. Mark. Manag. 2022, 38, 2078–2113. [Google Scholar] [CrossRef]
  10. Panda, S.K.; Swain, S.K.; Mall, R. An investigation into usability aspects of E-Commerce websites using users’ preferences. Adv. Comput. Sci. Int. J. 2015, 1, 65–73. [Google Scholar]
  11. Korableva, O.; Durand, T.; Kalimullina, O.; Stepanova, I. Usability testing of MOOC: Identifying user interface problems. In Proceedings of the 21st International Conference on Enterprise Information Systems, Crete, Greece, 3–5 May 2019; pp. 468–475. [Google Scholar]
  12. Doi, T. Usability textual data analy sis: A formulaic coding think-aloud protocol method for usability evaluation. Appl. Sci. 2021, 11, 7047. [Google Scholar] [CrossRef]
  13. Sasmito, G.W.; Zulfiqar, L.O.M.; Nishom, M. Usability testing based on system usability scale and net promoter score. In Proceedings of the 2019 International Seminar on Research of Information Technology and Intelligent Systems (ISRITI), Yogyakarta, Indonesia, 5–6 December 2019; pp. 540–545. [Google Scholar]
  14. Wirasasmiata, R.; Uska, M. Evaluation of E-rapor usability using usability testing method. In Proceedings of the 6th International Conference on Educational Research and Innovation (ICERI 2018), Yogyakarta, Indonesia, 30–31 August 2019; Atlantis Press: Paris, France, 2019; pp. 71–74. [Google Scholar]
  15. Hasan, L.; Morris, A.; Probets, S. A comparison of usability evaluation methods for evaluating e-commerce websites. Behav. Inf. Technol. 2012, 31, 707–737. [Google Scholar] [CrossRef]
  16. Fernández, J.; Macías, J.A. Heuristic-based usability evaluation support: A systematic literature review and comparative study. In Proceedings of the XXI International Conference on Human Computer Interaction, Málaga, Spain, 22–24 September 2021; ACM: New York, NY, USA, 2021; pp. 1–9. [Google Scholar]
  17. Joyce, G. Adaptation of Heuristic Evaluation for Mobile Applications and the Impact of Context of Use. Ph.D. Thesis, University of Hertfordshire, London, UK, 2021. [Google Scholar]
  18. Wang, J.; Antonenko, P.; Celepkolu, M.; Jimenez, Y.; Fieldman, E.; Fieldman, A. Exploring relationships between eye tracking and traditional usability testing data. Int. J. Hum.–Comput. Interact. 2019, 35, 483–494. [Google Scholar] [CrossRef]
  19. Bataineh, E.; Mourad, B.A.; Kammoun, F. Usability analysis on Dubai e-government portal using eye tracking methodology. In Proceedings of the 2017 Computing Conference, London, UK, 18–20 July 2017; pp. 591–600. [Google Scholar]
  20. Bhattacharya, N.; Gwizdka, J. Relating eye-tracking measures with changes in knowledge on search tasks. In Proceedings of the 2018 ACM Symposium on Eye Tracking Research & Applications-ETRA ’18, Warsaw, Poland, 14–17 June 2018; ACM: New York, NY, USA, 2018; pp. 1–5. [Google Scholar]
  21. Castiblanco Jimenez, I.A.; Gomez Acevedo, J.S.; Olivetti, E.C.; Marcolin, F.; Ulrich, L.; Moos, S.; Vezzetti, E. User Engagement Comparison between Advergames and Traditional Advertising Using EEG: Does the User’s Engagement Influence Purchase Intention? Electronics 2022, 12, 122. [Google Scholar] [CrossRef]
  22. Zaki, T.; Islam, M.N. Neurological and physiological measures to evaluate the usability and user-experience (UX) of information systems: A systematic literature review. Comput. Sci. Rev. 2021, 40, 100375. [Google Scholar] [CrossRef]
  23. Abraham, G.T.; Osaisai, E.F.; Wariowei, D.S.; Ineyekineye, A.; Tuesday, O.T. Usability issues with E-commerce websites in Nigeria. Asian J. Comput. Sci. Technol. 2021, 10, 5–12. [Google Scholar] [CrossRef]
  24. Khan, S.S.; Liu, H. Exploring the Impact on User Information Search Behaviour of Affective Design: An Eye-Tracking Study. In Proceedings of the BIRDS@ SIGIR, Xi’an, China, 30 July 2020; pp. 55–69. [Google Scholar]
  25. Schiessl, M.; Duda, S.; Fischer, R. Eye tracking and its application in usability and media research. MMI-Interakt. J. 2003, 6, 41–50. [Google Scholar]
  26. Sharma, C.; Dubey, S.K. Analysis of eye tracking techniques in usability and HCI perspective. In Proceedings of the 2014 International Conference on Computing for Sustainable Global Development (INDIACom), New Delhi, India, 5–7 March 2014; pp. 607–612. [Google Scholar]
  27. Usability: Definitions and Concepts. Available online: https://www.iso.org/obp/ui/ (accessed on 29 September 2023).
  28. Lewis, J.R.; Sauro, J. The factor structure of the system usability scale. In Human Centered Design; Springer: Berlin/Heidelberg, Germany, 2009; pp. 94–103. [Google Scholar]
  29. Fu, J. Usability evaluation of software store based on eye-tracking technology. In Proceedings of the 2016 IEEE Information Technology, Networking, Electronic and Automation Control Conference, Chongqing, China, 20–22 May 2016; pp. 1116–1119. [Google Scholar]
  30. Hornbæk, K. Current practice in measuring usability: Challenges to usability studies and research. Int. J. Hum. Comput. Stud. 2006, 64, 79–102. [Google Scholar] [CrossRef]
  31. Adukaite, A.; Inversini, A.; Cantoni, L. Examining user experience of cruise online search funnel. In Design, User Experience, and Usability. Web, Mobile, and Product Design; Springer: Berlin/Heidelberg, Germany, 2013; pp. 163–172. [Google Scholar]
  32. Albert, B.; Tullis, T. Measuring the User Experience: Collecting, Analyzing, and Presenting Usability Metrics; Morgan Kaufmann: Burlingto, MA, USA; Newnes: London, UK, 2013. [Google Scholar]
  33. Chin, J.P.; Diehl, V.A.; Norman, L.K. Development of an instrument measuring user satisfaction of the human-computer interface. In Proceedings of the SIGCHI Conference on Human Factors in Computing Systems-CHI ’88, Washington, DC, USA, 15–19 May 1988; ACM: New York, NY, USA, 1988; pp. 213–218. [Google Scholar]
  34. Brooke, J. SUS-A quick and dirty usability scale. Usability Eval. Ind. 1996, 189, 4–7. [Google Scholar]
  35. Sauro, J.; Lewis, J.R. Quantifying user research. In Quantifying the User Experience; Elsevier: Amsterdam, The Netherlands, 2016; pp. 9–18. [Google Scholar]
  36. Diaz, E.; Arenas, J.J.; Moquillaza, A.; Paz, F. A systematic literature review about quantitative metrics to evaluate the usability of E-commerce web sites. In Advances in Intelligent Systems and Computing; Springer: Cham, Switzerland, 2019; pp. 332–338. [Google Scholar]
  37. Fu, L.; Salvendy, G.; Turley, L. Effectiveness of user testing and heuristic evaluation as a function of performance classification. Behav. Inf. Technol. 2002, 21, 137–143. [Google Scholar] [CrossRef]
  38. Dhingra, S.; Gupta, S.; Bhatt, R. A study of relationship among service quality of E-commerce websites, customer satisfaction, and purchase intention. Int. J. E-Bus. Res. 2020, 16, 42–59. [Google Scholar] [CrossRef]
  39. Rababah, O.; Hamtini, T. Causal interrelations among e-business website quality factors. Yarmok Res. 2004, 14, 231–239. [Google Scholar]
  40. Sivaji, A.; Downe, A.G.; Mazlan, M.F.; Soo, S.T.; Abdullah, A. Importance of incorporating fundamental usability with social & trust elements for E-Commerce website. In Proceedings of the 2011 International Conference on Business, Engineering and Industrial Applications, Kuala Lumpur, Malaysia, 5–7 June 2011; pp. 221–226. [Google Scholar]
  41. Mohd, N.A.; Zaaba, Z.F. A review of usability and security evaluation model of ecommerce website. Procedia Comput. Sci. 2019, 161, 1199–1205. [Google Scholar] [CrossRef]
  42. Wątróbski, J.; Jankowski, J.; Karczmarczyk, A.; Ziemba, P. Integration of eye-tracking based studies into e-commerce websites evaluation process with eQual and TOPSIS methods. In Information Systems: Research, Development, Applications, Education; Springer: Cham, Switzerland, 2017; pp. 56–80. [Google Scholar]
  43. Blazek, P.; Pilsl, K. The impact of the arrangement of user interface elements on customer satisfaction in the configuration process. In Proceedings of the 7th World Conference on Mass Customization, Personalization, and Co-Creation (MCPC 2014), Aalborg, Denmark, 4–7 February 2014: Twenty Years of Mass Customization–Towards New Frontiers; Lecture Notes in Production Engineering; Springer: Cham, Switzerland, 2014; pp. 517–527. [Google Scholar]
  44. Nielsen, L.; Madsen, S. The usability expert’s fear of agility: An empirical study of global trends and emerging practices. In Proceedings of the 7th Nordic Conference on Human-Computer Interaction Making Sense Through Design-NordiCHI ’12, Copenhagen, Denmark, 14–17 October 2012; ACM: New York, NY, USA, 2012; pp. 261–264. [Google Scholar]
  45. De Oliveira, R.; Cherubini, M.; Oliver, N. Influence of Usability on Customer Satisfaction: A Case Study on Mobile Phone Services. In Proceedings of the I-UxSED, Copenhagen, Denmark, 14 October 2012; pp. 14–19. [Google Scholar]
  46. Afonso, P.; Lima, J.R.; Cota, M.P.P. Usability assessment of web interfaces: User Testing. In Proceedings of the 2013 8th Iberian Conference on Information Systems and Technologies (CISTI), Lisboa, Portugal, 19–22 June 2013; pp. 1–7. [Google Scholar]
  47. Bascur, C.; Rusu, C.; Quiñones, D. ECUXH: A set of user eXperience heuristics for e-commerce. In Social Computing and Social Media: Experience Design and Social Network Analysis; Springer: Cham, Switzerland, 2021; pp. 407–420. [Google Scholar]
  48. Benabid Najjar, A.; Al-Wabil, A.; Hosny, M.; Alrashed, W.; Alrubaian, A. Usability evaluation of optimized single-pointer Arabic keyboards using eye tracking. Adv. Hum.-Comput. Interact. 2021, 2021, 6657155. [Google Scholar] [CrossRef]
  49. Laudon, K.C.; Traver, C.G. E-Commerce 2016: Business, Technology, Society, Global Edition, 12th ed.; Pearson Education: London, UK, 2016. [Google Scholar]
  50. eCommerce—Saudi Arabia. Available online: https://www.statista.com/outlook/dmo/ecommerce/saudi-arabia (accessed on 29 September 2023).
  51. Oyekunle, R.; Bello, O.; Jubril, Q.; Sikiru, I.; Balogun, A. Usability evaluation using eye-tracking on E-commerce and education domains. J. Inf. Technol. Comput. 2020, 1, 1–13. [Google Scholar] [CrossRef]
  52. Nielsen, J. Guerrilla HCI: Using discount usability engineering to penetrate the intimidation barrier. In Cost-Justifying Usability; Academic Press: Cambridge, MA, USA, 1994; pp. 245–272. [Google Scholar]
  53. Nielsen, J.; Molich, R. Heuristic evaluation of user interfaces. In Proceedings of the SIGCHI Conference on Human Factors in Computing Systems Empowering People-CHI ’90, Seattle, WA, USA, 1–5 April 1990; ACM: New York, NY, USA, 1990; pp. 249–256. [Google Scholar]
  54. Hartson, H.R.; Andre, T.S.; Williges, R.C. Criteria for evaluating usability evaluation methods. Int. J. Hum. Comput. Interact. 2003, 15, 145–181. [Google Scholar] [CrossRef]
  55. Kumar, A.; Goundar, M.S.; Chand, S.S. A framework for heuristic evaluation of mobile learning applications. Educ. Inf. Technol. 2020, 25, 3189–3204. [Google Scholar] [CrossRef]
  56. Tourangeau, R.; Maitland, A.; Steiger, D.; Yan, T. A framework for making decisions about question evaluation methods. In Advances in Questionnaire Design, Development, Evaluation and Testing; John Wiley & Sons: New York, NY, USA, 2020; pp. 47–73. [Google Scholar]
  57. Maguire, M.; Isherwood, P. A comparison of user testing and heuristic evaluation methods for identifying website usability problems. In Design, User Experience, and Usability: Theory and Practice; Springer: Cham, Switzerland, 2018; pp. 429–438. [Google Scholar]
  58. Ritthiron, S.; Jiamsanguanwong, A. Usability evaluation of the university library network’s website using an eye-tracking device. In Proceedings of the International Conference on Advances in Image Processing, Bangkok, Thailand, 25–27 August 2017; ACM: New York, NY, USA, 2017; pp. 184–188. [Google Scholar]
  59. Strzelecki, A. Eye-tracking studies of web search engines: A systematic literature review. Information 2020, 11, 300. [Google Scholar] [CrossRef]
  60. Pappas, I.; Sharma, K.; Mikalef, P.; Giannakos, M. Visual aesthetics of E-commerce websites: An eye-tracking approach. In Proceedings of the 51st Hawaii International Conference on System Sciences, Hilton Waikoloa Village, HI, USA, 3–6 January 2018. [Google Scholar]
  61. Schall, A.; Romano Bergstrom, J. The future of eye tracking and user experience. In Eye Tracking in User Experience Design; Elsevier: Amsterdam, The Netherlands, 2014; pp. 351–360. [Google Scholar]
  62. Liversedge, S.P.; Findlay, J.M. Saccadic eye movements and cognition. Trends Cogn. Sci. 2000, 4, 6–14. [Google Scholar] [CrossRef]
  63. Bojko, A. Using eye tracking to compare web page designs: A case study. J. Usability Stud. 2006, 1, 112–120. [Google Scholar]
  64. Godfroid, A.; Hui, B. Five common pitfalls in eye-tracking research. Second Lang. Res. 2020, 36, 277–305. [Google Scholar] [CrossRef]
  65. Flores-Sánchez, V.; Collado-Martínez, L.; López-Orozco, F. Towards a new hybrid usability methodology: Analysis through eye-tracking and survey techniques. In Proceedings of the 7th Mexican Conference on Human-Computer Interaction, Merida, Mexico, 29–31 October 2018; ACM: New York, NY, USA, 2018; pp. 112–120. [Google Scholar]
  66. Ross, J. Eyetracking: Is It Worth It? Available online: https://www.uxmatters.com/mt/archives/2009/10/eyetracking-is-it-worth-it.php (accessed on 29 September 2023).
  67. Kaysi, B.; Topaloǧlu, Y. Competitive usability testing of student information systems with eye tracking method. In Proceedings of the 2017 International Conference on Computational Science and Computational Intelligence (CSCI), Las Vegas, NV, USA, 14–16 December 2017; pp. 951–956. [Google Scholar]
  68. Top Online Stores in Saudi Arabia by Revenue. Available online: https://ecommercedb.com/en/ranking/sa/all (accessed on 29 September 2023).
  69. Jarir. Available online: https://www.jarir.com/sa-en (accessed on 29 September 2023).
  70. Extra. Available online: https://www.extra.com/en-sa (accessed on 29 September 2023).
  71. Nielsen, J. Why You Only Need to Test with 5 Users? Available online: http://www.useit.com/alertbox/20000319.html (accessed on 29 September 2023).
  72. Cho, H.; Powell, D.; Pichon, A.; Kuhns, L.M.; Garofalo, R.; Schnall, R. Eye-tracking retrospective think-aloud as a novel approach for a usability evaluation. Int. J. Med. Inform. 2019, 129, 366–373. [Google Scholar] [CrossRef]
  73. Tsironis, A.; Katsanos, C.; Xenos, M. Comparative usability evaluation of three popular MOOC platforms. In Proceedings of the 2016 IEEE Global Engineering Education Conference (EDUCON), Abu Dhabi, United Arab Emirates, 10–13 April 2016; pp. 608–612. [Google Scholar]
  74. Chen, S.Y.; Macredie, R.D. The assessment of usability of electronic shopping: A heuristic evaluation. Int. J. Inf. Manag. 2005, 25, 516–532. [Google Scholar] [CrossRef]
  75. Tan, W.S.; Liu, D.; Bishu, R. Web evaluation: Heuristic evaluation vs. user testing. Int. J. Ind. Ergon. 2009, 39, 621–627. [Google Scholar] [CrossRef]
  76. Zardari, A.; Hussain, Z.; Arain, A.A.; Rizvi, W.H.; Vighio, M.S. QUEST e-learning portal: Applying heuristic evaluation, usability testing and eye tracking. Univers. Access Inf. Soc. 2021, 20, 531–543. [Google Scholar] [CrossRef]
  77. Wang, E.; Caldwell, B. An empirical study of usability testing: Heuristic Evaluation vs. User Testing. Proc. Hum. Factors Ergon. Soc. Annu. Meet. 2002, 46, 774–778. [Google Scholar] [CrossRef]
  78. Moczarny, M. Dual-Method Usability Evaluation of E-Commerce Websites: In Quest of Better User Experience. Ph.D. Thesis, University of South Africa, Cape Town, South Africa, 2011. [Google Scholar]
  79. Albayrak, D.; Cagiltay, K. Analyzing Turkish E-government websites by eye tracking. In Proceedings of the 2013 Joint Conference of the 23rd International Workshop on Software Measurement and the 8th International Conference on Software Process and Product Measurement, Ankara, Turkey, 23–26 October 2013; pp. 225–230. [Google Scholar]
Figure 1. Research methodology.
Futureinternet 15 00365 g001
Figure 2. Task success of Extra website.
Futureinternet 15 00365 g002
Figure 3. Task times of Extra website.
Futureinternet 15 00365 g003
Figure 4. Error number rate of Extra website.
Futureinternet 15 00365 g004
Figure 5. Task success of Jarir website.
Futureinternet 15 00365 g005
Figure 6. Task time of Jarir website.
Futureinternet 15 00365 g006
Figure 7. Error number rate of Jarir website.
Futureinternet 15 00365 g007
Figure 8. Aggregated heatmap for search bar—Task 1.
Futureinternet 15 00365 g008
Figure 9. Aggregated heatmap menu and categories—Task 1.
Futureinternet 15 00365 g009
Figure 10. Users fixating on the item card to Locate a compare button.
Futureinternet 15 00365 g010
Figure 11. Users’ fixation on the item description page to locate a compare button.
Futureinternet 15 00365 g011
Figure 12. No add to cart button in item cards.
Futureinternet 15 00365 g012
Figure 13. Heatmap for detecting customer support.
Futureinternet 15 00365 g013
Figure 14. Menu browsing heatmap—Jarir.
Futureinternet 15 00365 g014
Figure 15. Search heatmap—Jarir.
Futureinternet 15 00365 g015
Figure 16. Users search for a compare button.
Futureinternet 15 00365 g016
Figure 17. Finalizing comparison—Jarir.
Futureinternet 15 00365 g017
Figure 18. Using the search bar to locate items.
Futureinternet 15 00365 g018
Figure 19. Adding an item to cart.
Futureinternet 15 00365 g019
Figure 20. Heatmap of support number location on Jarir website.
Futureinternet 15 00365 g020
Figure 21. Behavioral measurement techniques severity rating for Extra website.
Futureinternet 15 00365 g021
Figure 22. Behavioral measurement techniques severity rating for Jarir website.
Futureinternet 15 00365 g022
Table 1. Metrics Definitions.
MetricsExplanation
Task Success (Effectiveness)This includes the measures of whether the users completed the tasks or not. Hence, this involves identifying the number of correct tasks and the number of tasks not completed within a specific duration or the tasks the users gave up on completing.
Number of Errors (Effectiveness)This captures the errors made by a user during the process of completing a task or finding a solution to it.
Task Time (Efficiency)This measure depicts how long users took to complete the tasks.
Number of FixationsThis measures the number of fixations that the user made in the interface to perform the assigned task.
Average of Fixation DurationThis determines how long the average fixation lasted and can be calculated for individuals or groups.
HeatmapThis provides metrics for data visualization that indicate how the user viewed and interacted with the page.
AOIThis is a tool for selecting parts of a presented stimulus and extracting metrics for those regions only.
TTFFThis points out how long it took a user (or all users on average) to look at a certain AOI after the stimulus was shown.
Spent TimeThis determines how much time the users spent looking at a certain AOI.
RevisitsThe number of revisits indicates how many times a user’s gaze was drawn back to a specific area within an AOI.
SEQ (Satisfaction)This measures how difficult users found a task by using a 7-point rating scale.
Table 2. Users’ demographics.
CategoryNumber
GenderMale8
Female 12
Age20–29 years old12
30–39 years old5
40–49 years old3
Academic LevelBachelor’s14
Master’s6
Table 3. Heuristic evaluation for Extra website.
Heuristic Evaluation PrincipleSeverityFrequencyAverage Severity
1234
Visibility of system status021032: Minor problem
Match between the system and real world011023: Major problem
User control and freedom012143: Major problem
Consistency and standards201253: Major problem
Error prevention020022: Minor problem
Recognition rather than recall111032: Minor problem
Flexibility and efficiency of use001124: Catastrophic problem
Aesthetic and minimal design002023: Major problem
Help users recognize, diagnose, and recover from errors.00000N/A
Help and documentation000114: Catastrophic problem
TotalFrequency379524
%13.6431.8240.9122.73
Table 4. Heuristic evaluation for Jarir website.
Heuristic Evaluation PrincipleSeverityFrequencyAverage Severity
1234
Visibility of system status121152: Minor problem
Match between the system and real world100123: Major problem
User control and freedom022043: Major problem
Consistency and standards112042: Minor problem
Error prevention010012: Minor problem
Recognition rather than recall001013: Major problem
Flexibility and efficiency of use011023: Major problem
Aesthetic and minimal design220152: Minor problem
Help users recognize, diagnose, and recover from errors.000114: Catastrophic problem
Help and documentation000114: Catastrophic problem
TotalFrequency597526
%19.2334.6226.9219.23
Table 5. Identified usability issues for Extra website.
Usability ProblemsSeverity Rating
1While users search for a product in the search bar, the website does not show auto-suggestions and suggestions are wrong, which makes searching difficult for users.3: Major problem
2Filter options are not available on the product details page, so it is difficult for the users to change the color of the product.2: Minor problem
3New update notifications are popping up unnecessarily and blocking the most important function of the page, which is annoying for users to complete their goals on the website.1: Cosmetic problem
4Some of the categories and products have compare options, while others do not.4: Catastrophic problem
5When users are trying to compare a product with other similar products, there is no “Compare” feature available on that page. Users need to compare products manually, which takes a long time. Also, there are no similar products available to compare on the page.3: Major problem
Table 6. Identified usability issues for Jarir website.
Usability ProblemsSeverity Rating
1While users search for a product in the search bar, the website does not show auto-complete suggestions properly, which makes searching difficult for users.3: Major problem
2Filters options are not available on the product details page. Therefore, it is difficult for the users to change the color of the product.2: Minor problem
3New update notifications block the “Compare” function, so users are searching for a “Compare List” button on the page.1: Cosmetic problem
4There are no similar products available to compare on the page.2: Minor problem
Table 7. Areas of interest per task.
TaskObjectiveAreas of Interest
1Locating an item
  • Search bar
  • Main menu
  • Item price and description
2Comparing items
  • Search bar
  • Main menu
  • Compare button
  • Item card
3Adding an item to the cart
  • Search bar
  • Main menu
  • Add to Cart button
4Finding support number
  • Upper menu
  • Footer
Table 8. Overall fixation data for Extra website.
Number of ParticipantsTotal TimeTTFFAverage Fixation DurationNumber of FixationsSpent TimeRevisits
Participant 1370 s1.72 s0.39 s601230 s61
Participant 2474 s0.86 s0.32 s583187 s48
Participant 3490 s0.76 s0.34 s610208 s84
Participant 4460 s0.9 s0.37 s598220 s64
Participant 5454 s0.7 s0.3 s757226 s57
Average450 s1 s0.34 s630214 s63
Table 9. Fixation data for Task 1.
TTFFAverage Fixation DurationNumber of FixationsSpent TimeRevisits
Search bar2.23 s0.3 s3611 s17
Main menu1.14 s0.25 s318 s23
Item price and description0.2 s0.26 s5113.5 s26
Table 10. Fixation data for Task 2.
TTFFAverage Fixation DurationNumber of FixationsSpent TimeRevisits
Search bar0.03 s0.29 s216.09 s17
Main menu0.1 s0.13 s60.71 s1
Compare buttonN/AN/AN/AN/AN/A
Item card0.02 s0.27 s5414.35 s42
Table 11. Fixation data for Task 3.
TTFFAverage Fixation DurationNumber of FixationsSpent TimeRevisits
Search bar0.01 s0.15 s20.3 s0
Main menu0.03 s0.22 s91.96 s6
Add to cart button0.2 s0.3 s61.81 s2
Table 12. Fixation data for Task 4.
TTFFAverage Fixation DurationNumber of FixationsSpent TimeRevisits
Upper Menu and/or footer0.4 s0.18 s10.180
Table 13. Eye-tracking identified usability issues for Extra website.
IndicatorUsability IssueSeverity Rating
1
  • Number of overall fixations is high.
  • Long scan path.
Sub-optimal layout that causes inefficient search.3: Major problem
2Long fixations.The user has difficulty extracting information or locating elements of interest.3: Major problem
3Scan path transition between areas.Search uncertainty due to interface design.2: Minor problem
4Users failed to complete the second task.Comparison functionality is not available in item cards and during search.3: Major problem
5Users spent too much time gazing/fixating on the menu and search bar.
  • Auto-suggestion and smart search features are lacking.
  • The menu disappears suddenly while browsing.
2: Minor problem
6The financing service banner appears whenever an item is added to cart even if the user did not request for it.Using a financing service should be optional and separate from the Add to Cart function.1: Cosmetic problem
Table 14. Overall fixation data for Jarir website.
Number of ParticipantsTotal TimeTTFFAverage Fixation DurationNumber of FixationsSpent TimeRevisits
Participant 1600 s1.3 s0.41 s1011412 s89
Participant 2324 s1.91 s0.3 s484146 s21
Participant 3287 s0.78 s0.32 s470149 s65
Participant 4401 s2.8 s0.27 s511139 s60
Participant 5428 s3.1 s0.29 s443128 s49
Average408 s2 s0.32 s584195 s57
Table 15. Fixation data for Task 1.
TTFFAverage Fixation DurationNumber of FixationsSpent TimeRevisits
Search bar1.720.23 s112.53 s3
Main menu1 s0.5 s 58 29 s 20
Item price and description0.04 s0.19 s91.7 s1
Table 16. Fixation data for Task 2.
TTFFAverage Fixation DurationNumber of FixationsSpent TimeRevisits
Search bar0.01 s0.34 s144.76 s6
Main menu0.3 s0.11 s30.33 s1
Compare button0.17 s0.24 s61.44 s3
Item card0.01 s0.32 s165.12 s2
Table 17. Fixation data for Task 3.
TTFFAverage Fixation DurationNumber of FixationsSpent TimeRevisits
Search bar0.02 s0.33 s134.29 s2
Main menu3.05 s0.16 s60.964
Add to Cart button0.2 s0.27 s30.81 s1
Table 18. Fixation data for Task 4.
TTFFAverage Fixation DurationNumber of FixationsSpent TimeRevisits
Upper menu and/or footer1.9 s0.22 s122.64 s3
Table 19. Eye tracking identified usability issues for Jarir website.
IndicatorUsability IssueSeverity
1
  • Number of overall fixations is high
  • Long scan path
  • Sub-optimal layout that causes inefficient search
  • Main menu too detailed and crowded
3: Major problem
2: Minor problem
2Long TTFFCrowded pages, too many banners2: Minor problem
3Long fixationsThe user has difficulty extracting information of locating elements of interest3: Major problem
4The user has to search for a support numberContacting support should be easy and more eye-catching1: Cosmetic problem
Table 20. Extra and Jarir websites’ SEQ Scores.
Participant 1Participant 2Participant 3Participant 4Participant 5Average
Extra Website
Usability Testing444344.1
Eye tracking43474
Jarir Website
Usability Testing557575
Eye tracking43734
Table 21. Effectiveness of behavioral measurement techniques for extra website.
TechniqueNumber/Percentage of Usability Problems Detected Per Severity RatingAverage Severity ScoreUnique Issues to the MethodCommon Issues (in Two or All Methods)
Total1234
Heuristic Evaluation2437952.6195
66.66%8.33%19.44%25%13.89%
Usability Testing511212.614
13.9%2.78%2.78%5.56%2.78%
Eye Tracking713302.334
19.44%2.78%8.33%8.33%0
Total36511146
13.9%30.55%38.89%16.66%
Table 22. Effectiveness of behavioral measurement techniques for Jarir Website.
TechniqueNumber/Percentage of Usability Problems Detected Per Severity RatingAverage Severity ScoreUnique Issues to the MethodCommon Issues (in Two or All Methods)
Total1234
Heuristic
Evaluation
2659752.523 3
74.29%14.29%25.71%20%14.29%
Usability Testing412102 2 2
11.43%2.86%5.71%2.86%0
Eye Tracking512202.223
14.28%2.86%5.71%5.71%0
Total35713105
20%37.13%28.58%14.29%
Table 23. Strengths and weaknesses of Extra and Jarir websites.
AspectStrengthsWeaknesses
Extra Website
DesignElements are in standard, prominent locations.
  • No UI changes or cues to help users identify where they are.
  • Hard-to-navigate menu design with narrow margins and crowded labels.
FunctionalityPage navigation and workflow are intuitive.
  • No compare, undo, redo functions.
  • No smart search and auto correct.
User-friendlinessUsers can contact support easily.
  • No page translation available.
  • No help and documentation available.
Jarir Website
DesignColorful design.
  • Complex multi-level menu design.
  • Crowded homepage.
Functionality
  • Comparison between products easily performed.
  • Search suggestions are abundant.
  • Page navigation and workflow are intuitive.
No undo/redo functions.
User-friendliness
  • Main menu provides clear navigation options.
  • Categories are detailed and clear.
  • No error prevention/mitigation mechanisms.
  • No page translation available.
  • No help and documentation available.
Disclaimer/Publisher’s Note: The statements, opinions and data contained in all publications are solely those of the individual author(s) and contributor(s) and not of MDPI and/or the editor(s). MDPI and/or the editor(s) disclaim responsibility for any injury to people or property resulting from any ideas, methods, instructions or products referred to in the content.