

New RFI Model for Behavioral Audience Segmentation in Wi-Fi Advertising System


Abstract
1. Introduction
- -
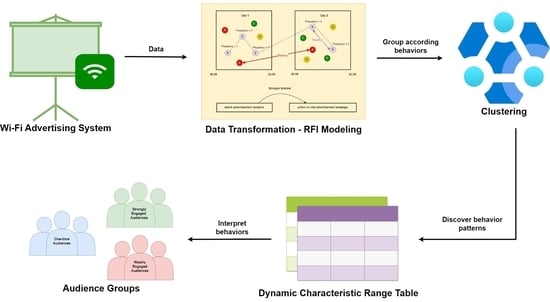
- To propose a new RFI model that is generally applicable to measure the audience behaviors in Wi-Fi advertising system.
- -
- To segment the audience behaviors into well-defined groups based on the RFI model.
- -
- To create a dynamic-characteristics range table to interpret the segmented behavioral characteristics of the audience based on their respective RFI values.
2. Related Works
2.1. Behavioral Analysis
2.2. Audience Segmentation
2.3. Performance Evaluation Metrics
3. Proposed Framework
3.1. Dataset
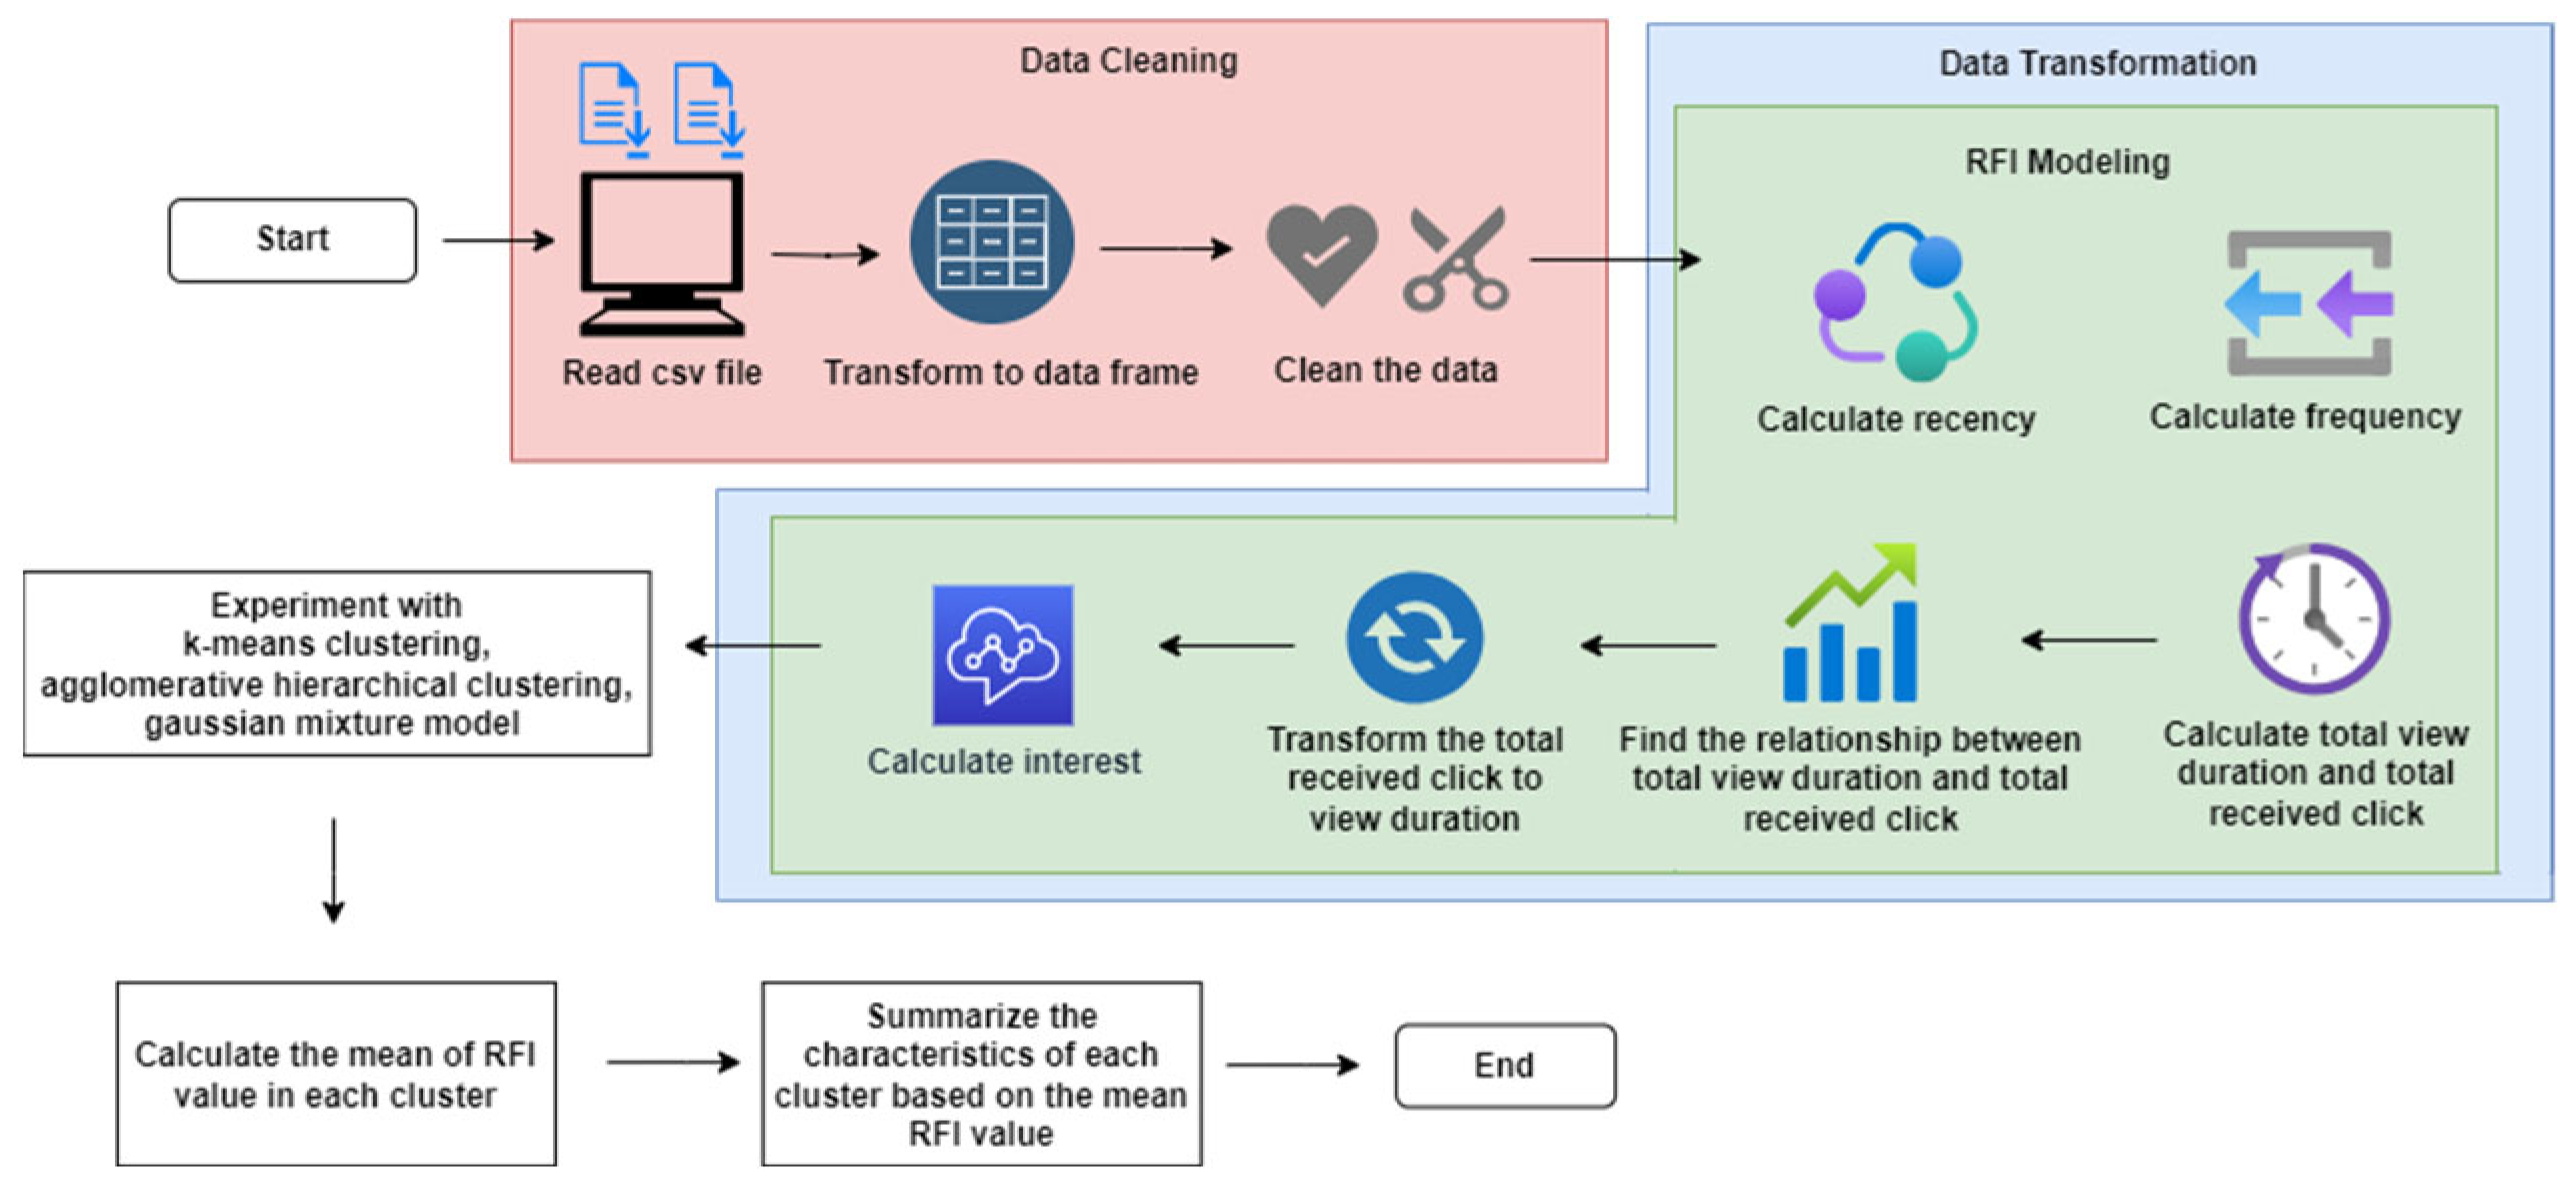
3.2. Data Cleaning
3.3. Data Transformation
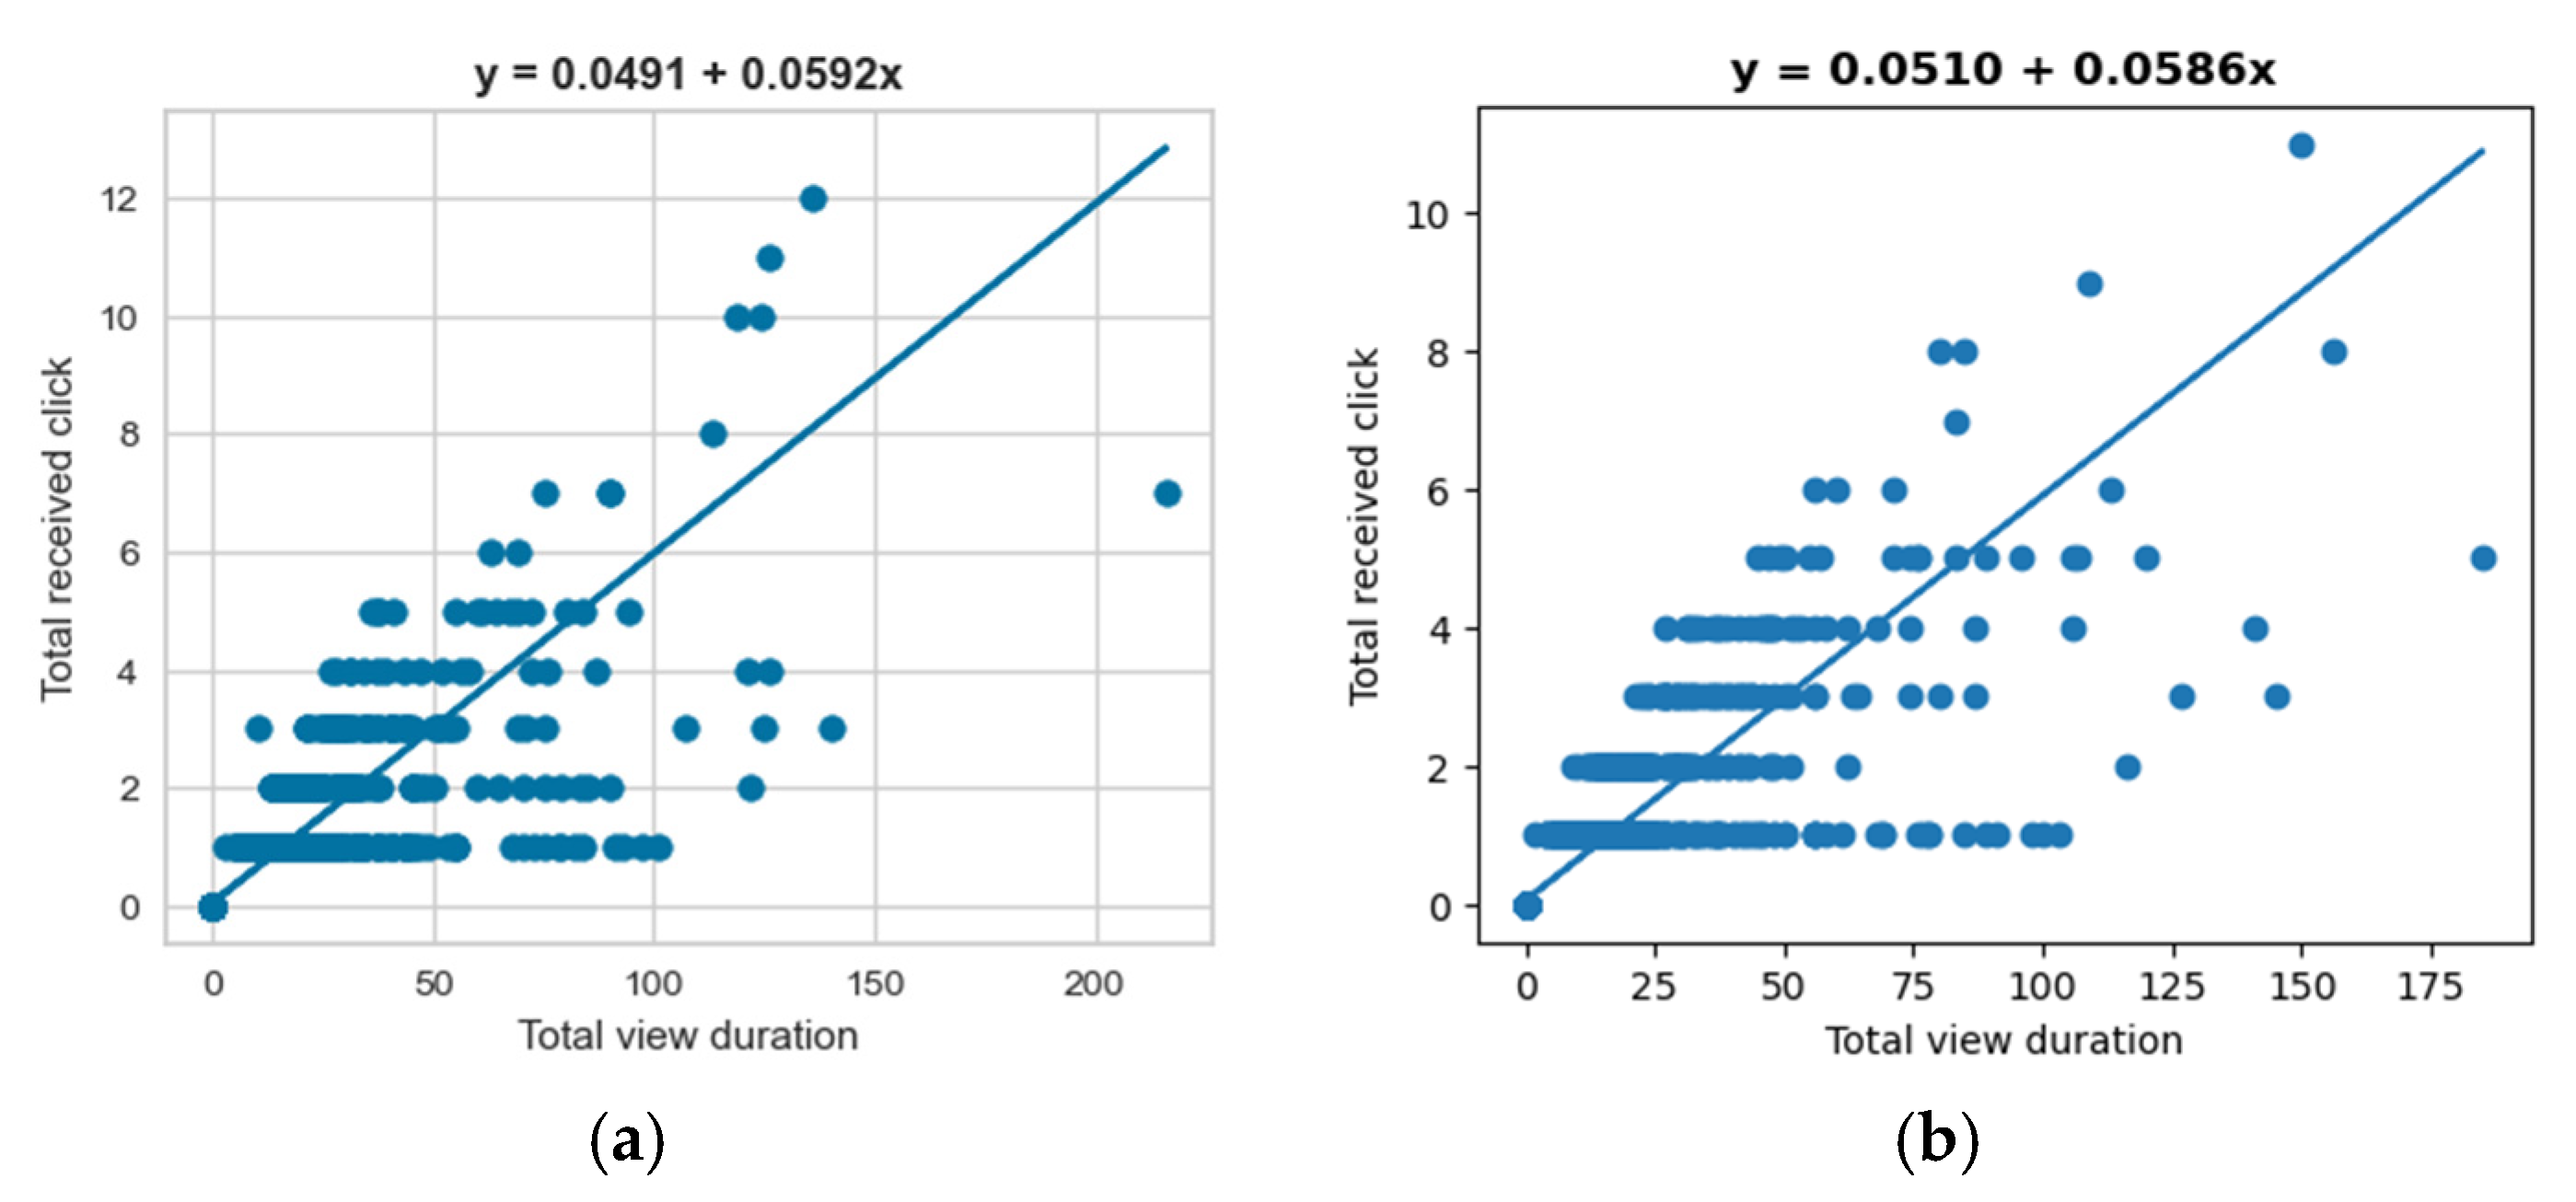
4. Experiments and Results
5. Discussion
6. Conclusions
Author Contributions
Funding
Data Availability Statement
Conflicts of Interest
References
- Lim, J. TM Offers Free WiFi at 5800 Hotspots Nationwide with Newly Launched UniFi App. SAYS, 26 September 2017. Available online: https://says.com/my/tech/tm-offers-free-wi-fi-at-5-800-hotspots-nationwide-with-newly-launched-unifi-app (accessed on 29 September 2023).
- Stellin, S. Free Wi-Fi, but Speed Costs. The New York Times, 4 September 2012. Available online: https://www.nytimes.com/2012/06/05/business/airports-and-hotels-look-at-tiered-pricing-for-internet-access.html (accessed on 29 September 2023).
- Simon, K. Digital 2022: Malaysia—DataReportal—Global Digital Insights. DataReportal. 15 February 2022. Available online: https://datareportal.com/reports/digital-2022-malaysia (accessed on 29 September 2023).
- Shirole, R.; Salokhe, L.; Jadhav, S. Customer Segmentation using RFM Model and K-Means Clustering. Int. J. Sci. Res. Sci. Technol. 2021, 8, 591–597. [Google Scholar] [CrossRef]
- Zhou, J.; Wei, J.; Xu, B. Customer segmentation by web content mining. J. Retail. Consum. Serv. 2021, 61, 102588. [Google Scholar] [CrossRef]
- Wang, T.; Li, N.; Wang, H.; Xian, J.; Guo, J. Visual Analysis of E-Commerce User Behavior Based on Log Mining. Adv. Multimed. 2022, 2022, e4291978. [Google Scholar] [CrossRef]
- Oliveira, W.V.; Araújo, D.S.A.; Bezerra, L.C.T. Supermarket customer segmentation: A case study in a large Brazilian retail chain. In Proceedings of the 2022 IEEE 24th Conference on Business Informatics (CBI), Amsterdam, The Netherlands, 15–17 June 2022; Volume 1, pp. 70–79. [Google Scholar] [CrossRef]
- Heikal, J.; Rialialie, V.; Rivelino; Supriyono, I.A. Hybrid Model of Structural Equation Modeling PLS and RFM (Recency, Frequency and Monetary) Model to Improve Bank Average Balance. Aptisi Trans. Technopreneurship 2021, 4, 1–8. [Google Scholar] [CrossRef]
- Mamashli, Z.; Zolfani, S.H. Customer Segmentation Based on Mobile Banking User’s Behavior. Int. J. Mechatron. Electr. Comput. Technol. 2022, 12, 5267–5276. [Google Scholar]
- Nandapala, E.Y.L.; Jayasena, K.P.N.; Rathnayaka, R.M.K.T. Behavior Segmentation based Micro-Segmentation Approach for Health Insurance Industry. In Proceedings of the 2020 2nd International Conference on Advancements in Computing (ICAC), Malabe, Sri Lanka, 10–11 December 2020; Volume 1, pp. 333–338. [Google Scholar] [CrossRef]
- Kumar, S.J.; Oommen Philip, A. Achieving Market Segmentation from B2B Insurance Client Data Using RFM & K-Means Algorithm. In Proceedings of the 2022 IEEE International Conference on Signal Processing, Informatics, Communication and Energy Systems (SPICES), Thiruvananthapuram, India, 10–12 March 2022; Volume 1, pp. 463–469. [Google Scholar] [CrossRef]
- RFM Migration Analysis: A New Approach to a Proven Technique. Available online: http://www.dbmarketing.com/articles/Art123.htm (accessed on 31 March 2023).
- Kohavi, R.; Parekh, R. Visualizing RFM Segmentation. In Proceedings of the 2004 SIAM International Conference on Data Mining (SDM), Lake Buena Vista, FL, USA, 22–24 April 2004. [Google Scholar] [CrossRef][Green Version]
- Khajvand, M.; Zolfaghar, K.; Ashoori, S.; Alizadeh, S. Estimating customer lifetime value based on RFM analysis of customer purchase behavior: Case study. Procedia Comput. Sci. 2011, 3, 57–63. [Google Scholar] [CrossRef]
- Rajeev, S. Pareto principle and compulsive buying disorder—An analysis. J. Educ. Soc. Res. 2022, 8, 44–59. [Google Scholar]
- Wei, J.-T.; Lin, S.-Y.; Wu, H.-H. A review of the application of RFM model. Afr. J. Bus. Manag. Dec. Spec. Rev. 2010, 4, 4199–4206. [Google Scholar]
- Giesen, C.G.; Schmidt, J.R.; Rothermund, K. The Law of Recency: An Episodic Stimulus-Response Retrieval Account of Habit Acquisition. Front. Psychol. 2020, 10, 2927. Available online: https://www.frontiersin.org/articles/10.3389/fpsyg.2019.02927 (accessed on 29 September 2023). [CrossRef]
- Christy, A.J.; Umamakeswari, A.; Priyatharsini, L.; Neyaa, A. RFM ranking—An effective approach to customer segmentation. J. King Saud Univ. Comput. Inf. Sci. 2021, 33, 1251–1257. [Google Scholar] [CrossRef]
- Zaltman, G. How Customers Think: Essential Insights Into the Mind of the Market; Harvard Business Press: Boston, MA, USA, 2003. [Google Scholar]
- Johnston, K.A.; Taylor, M. (Eds.) The Handbook of Communication Engagement, 1st ed.; Wiley-Blackwell: Hoboken, NJ, USA, 2018. [Google Scholar]
- Dolan, R.; Conduit, J.; Fahy, J.; Goodman, S. Social media: Communication strategies, engagement and future research directions. Int. J. Wine Bus. Res. 2017, 29, 2–19. [Google Scholar] [CrossRef]
- Jaisinghani, M.R.; Lundwani, C.; Mukherjee, O.; Nagori, N.; Solanke, P. CTR Prediction of Advertisements using Decision Trees based Algorithms. In Proceedings of the 2022 International Seminar on Application for Technology of Information and Communication (ISemantic), Semarang, Indonesia, 17–18 September 2022; pp. 107–112. [Google Scholar] [CrossRef]
- Hayes, R.A.; Carr, C.T.; Wohn, D.Y. One Click, Many Meanings: Interpreting Paralinguistic Digital Affordances in Social Media. J. Broadcast. Electron. Media 2016, 60, 171–187. [Google Scholar] [CrossRef]
- Peelen, E.; Beltman, R. Customer Relationship Management, 2nd ed.; Pearson: London, UK, 2013. [Google Scholar]
- Rodrigues, F.; Ferreira, B. Product Recommendation based on Shared Customer’s Behaviour. Procedia Comput. Sci. 2016, 100, 136–146. [Google Scholar] [CrossRef][Green Version]
- Mishra, R.K.; Raj, H.; Urolagin, S.; Jothi, J.A.A.; Nawaz, N. Cluster-Based Knowledge Graph and Entity-Relation Representation on Tourism Economical Sentiments. Appl. Sci. 2022, 12, 8105. [Google Scholar] [CrossRef]
- Xu, D.; Tian, Y. A Comprehensive Survey of Clustering Algorithms. Ann. Data Sci. 2015, 2, 165–193. [Google Scholar] [CrossRef]
- Lim, Z.-Y.; Ong, L.-Y.; Leow, M.-C. A Review on Clustering Techniques: Creating Better User Experience for Online Roadshow. Future Internet 2021, 13, 233. [Google Scholar] [CrossRef]
- Ahmed, M.; Seraj, R.; Islam, S.M.S. The k-means Algorithm: A Comprehensive Survey and Performance Evaluation. Electronics 2020, 9, 1295. [Google Scholar] [CrossRef]
- Tan, P.-N.; Steinbach, M.; Karpatne, A.; Kumar, V. Introduction to Data Mining; Pearson India: Bengaluru, India, 2016. [Google Scholar]
- Wan, H.; Wang, H.; Scotney, B.; Liu, J. A Novel Gaussian Mixture Model for Classification. In Proceedings of the 2019 IEEE International Conference on Systems, Man and Cybernetics (SMC), Bari, Italy, 6–9 October 2019; pp. 3298–3303. [Google Scholar] [CrossRef]
- Syakur, M.A.; Khotimah, B.K.; Rochman, E.M.S.; Satoto, B.D. Integration K-Means Clustering Method and Elbow Method for Identification of The Best Customer Profile Cluster. IOP Conf. Ser. Mater. Sci. Eng. 2018, 336, 012017. [Google Scholar] [CrossRef]
- Liu, Y.; Li, Z.; Xiong, H.; Gao, X.; Wu, J. Understanding of Internal Clustering Validation Measures. In Proceedings of the 2010 IEEE International Conference on Data Mining, Sydney, NSW, Australia, 13–17 December 2010; pp. 911–916. [Google Scholar] [CrossRef]
- Shi, C.; Wei, B.; Wei, S.; Wang, W.; Liu, H.; Liu, J. A quantitative discriminant method of elbow point for the optimal number of clusters in clustering algorithm. EURASIP J. Wirel. Commun. Netw. 2021, 2021, 31. [Google Scholar] [CrossRef]
- Lima, S.; Cruz, M. A genetic algorithm using Calinski-Harabasz Index for automatic clustering problem. Rev. Bras. Comput. Apl. 2020, 12, 97–106. [Google Scholar] [CrossRef]
- Luna-Romera, J.M.; del Mar Martínez-Ballesteros, M.; García-Gutiérrez, J.; Riquelme-Santos, J.C. An Approach to Silhouette and Dunn Clustering Indices Applied to Big Data in Spark. In Advances in Artificial Intelligence; Luaces, O., Gámez, J.A., Barrenechea, E., Troncoso, A., Galar, M., Quintián, H., Corchado, E., Eds.; Springer International Publishing: Berlin/Heidelberg, Germany, 2016; Volume 9868, pp. 160–169. [Google Scholar] [CrossRef]
- Försch, S.; de Haan, E. Targeting online display ads: Choosing their frequency and spacing. Int. J. Res. Mark. 2018, 35, 661–672. [Google Scholar] [CrossRef]
- Lydersen, S. Mean and standard deviation or median and quartiles? Tidsskr. Den Nor. Legeforening. 2020, 140, 1–3. [Google Scholar] [CrossRef]
- Wan, X.; Wang, W.; Liu, J.; Tong, T. Estimating the sample mean and standard deviation from the sample size, median, range and/or interquartile range. BMC Med. Res. Methodol. 2014, 14, 135. [Google Scholar] [CrossRef] [PubMed]


| Domain | Year | Behavioral Analysis | Behavioral Segmentation | Purpose of Application |
|---|---|---|---|---|
| e-Commerce | 2021 [4] | RFM model | K-means clustering | Purchasing behavioral segmentation - Segment the customers according to their purchasing behaviors as the marketing reference. |
| 2021 [5] | RFMT model | Agglomerative hierarchical clustering (AHC) | Online shopping behavioral segmentation - Segment the customers based on their shopping behaviors to discover their online shopping patterns. | |
| 2022 [6] | RFM model | K-means clustering | Customer classification - Segment the customers according to their behaviors for improving sales. | |
| 2022 [7] | RFM model | Gaussian Mixture Model (GMM) | Supermarket customer segmentation - Segment the customers according to their purchasing behaviors. | |
| Banking | 2021 [8] | RFM model | RFM score | Customer segmentation - Segment the customer behaviors in bank activities in increasing bank average balances. |
| 2022 [9] | RFMT model | K-means clustering, Agglomerative hierarchical clustering (AHC) | Mobile banking behavioral segmentation - Segment the customers to discover the customer’s transaction patterns in banking. | |
| Insurance | 2020 [10] | RFM model | RFM score | Policyholder segmentation - Segment the policyholders according to their claiming patterns. |
| 2022 [11] | RFM model | K-means clustering | Client segmentation - Segment the clients according to their behaviors for the needs of the policy. |
| Categories | Algorithm | Key Characteristic |
|---|---|---|
| Centroid based | K-means [29] | Partitioning the data into k clusters based on the centroid of cluster |
| Hierarchical based | Agglomerative Hierarchical Clustering [30] | Recursively merging the nearest pair of data or clusters to generate a hierarchy of clusters |
| Model based | Gaussian Mixture Model (GMM) [31] | Estimating the probabilities of each data belonging to each cluster |
| Case | Campaign | Algorithm | Elbow Method | Silhouette Score | CH Index | Dunn Index |
|---|---|---|---|---|---|---|
| Normal case | 764 | K-means | 5 | 5 | 5 | 3 |
| Agglomerative hierarchical | 5 | 5 | 5 | 4 | ||
| Gaussian Mixture Model | 3 | 5 | 3 | 3 | ||
| 776 | K-means | 5 | 5 | 5 | 3 | |
| Agglomerative hierarchical | 5 | 4 | 5 | 3 | ||
| Gaussian Mixture Model | 3 | 4 | 3 | 3 | ||
| Special case | 764 | K-means | 5 | 5 | 5 | 3 |
| Agglomerative hierarchical | 4 | 4 | 4 | 4 | ||
| Gaussian Mixture Model | 3 | 5 | 3 | 3 | ||
| 776 | K-means | 5 | 5 | 5 | 3 | |
| Agglomerative hierarchical | 5 | 5 | 5 | 3 | ||
| Gaussian Mixture Model | 3 | 3 | 3 | 3 |
| Case | Campaign | Clustering Algorithm | Elbow Method ↓ | Silhouette Score ↑ | CH Index ↑ | Dunn Index ↑ |
|---|---|---|---|---|---|---|
| Normal case | 764 | K-means | 17,179.932 | 0.512 | 12,127.681 | 0.337 |
| Agglomerative hierarchical | 23,695.748 | 0.459 | 9911.987 | 0.734 | ||
| Gaussian Mixture Model | 34,949.082 | 0.143 | 6897.579 | 0.771 | ||
| 776 | K-means | 16,297.157 | 0.511 | 12,658.076 | 0.393 | |
| Agglomerative hierarchical | 17,555.738 | 0.495 | 11,400.780 | 0.375 | ||
| Gaussian Mixture Model | 34,077.653 | 0.419 | 7015.656 | 0.785 | ||
| Special case | 764 | K-means | 17,737.915 | 0.501 | 11,590.687 | 0.320 |
| Agglomerative hierarchical | 19,004.798 | 0.490 | 10,488.531 | 0.399 | ||
| Gaussian Mixture Model | 38,536.754 | 0.367 | 5750.592 | 0.472 | ||
| 776 | K-means | 17,198.727 | 0.496 | 11,738.731 | 0.349 | |
| Agglomerative hierarchical | 19,000.083 | 0.480 | 10,163.169 | 0.400 | ||
| Gaussian Mixture Model | 37,381.868 | 0.379 | 5901.983 | 0.499 |
| Campaign | Audience Number | Audience Percentage | Cluster | Recency ↓ (Day) | Frequency ↑ (Time) | Interest ↑ (Second) |
|---|---|---|---|---|---|---|
| 764 (Total audience 19,777) | 1693 | 8.56% | 1 | 2.3156 | 4.1784 | 0.1110 |
| 8457 | 42.76% | 2 | 3.1211 | 1.2157 | 0.0000 | |
| 7511 | 37.98% | 3 | 10.1687 | 1.0570 | 0.0000 | |
| 122 | 0.62% | 4 | 2.5039 | 5.3934 | 3.6148 | |
| 1994 | 10.08% | 5 | 6.4750 | 1.3661 | 1.0587 | |
| 776 (Total audience 19,524) | 7483 | 38.33% | 1 | 10.2028 | 1.0588 | 0.0000 |
| 1601 | 8.20% | 2 | 2.3031 | 4.1537 | 0.0906 | |
| 8268 | 42.35% | 3 | 3.0987 | 1.2124 | 0.0000 | |
| 131 | 0.67% | 4 | 2.4740 | 5.2595 | 3.7023 | |
| 2041 | 10.45% | 5 | 6.3460 | 1.3988 | 1.0642 |
| Campaign | Audience Number | Audience Percentage | Cluster | Recency ↓ (Day) | Frequency ↑ (Time) | Interest ↑ (Second) |
|---|---|---|---|---|---|---|
| 764 (Total audience 19,777) | 1764 | 8.92% | 1 | 2.2631 | 4.1508 | 3.9372 |
| 8458 | 42.77% | 2 | 3.1215 | 1.2158 | 0.0000 | |
| 7514 | 37.99% | 3 | 10.1718 | 1.0568 | 0.0112 | |
| 127 | 0.64% | 4 | 2.7980 | 4.8110 | 115.7868 | |
| 1914 | 9.68% | 5 | 6.6500 | 1.3161 | 27.4169 | |
| 776 (Total audience 19,524) | 7570 | 38.77% | 1 | 10.2471 | 1.0577 | 0.2763 |
| 1647 | 8.44% | 2 | 2.2784 | 4.1299 | 3.0429 | |
| 8274 | 42.38% | 3 | 3.1014 | 1.2127 | 0.0000 | |
| 138 | 0.71% | 4 | 2.8428 | 4.8696 | 115.9700 | |
| 1895 | 9.70% | 5 | 6.0973 | 1.3858 | 28.2536 |
| Criteria | Quartile Range | Actual Range | Characteristics | |
|---|---|---|---|---|
| Campaign 764 | Campaign 776 | |||
| Recency (R) | R = 0 | value = 0.0000 | value = 0.0000 | Audience with no gap time from the last engagement |
| 0 < R ≤ 25% | 0 < value ≤ 3.2551 | 0 < value ≤ 3.2566 | Audience with shortest gap time from the last engagement | |
| 25% < R ≤ 50% | 3.2551 < value ≤ 6.0630 | 3.2566 < value ≤ 6.0915 | Audience with medium gap time from the last engagement | |
| 50% < R ≤ 75% | 6.0630 < value ≤ 8.8710 | 6.0915 < value ≤ 8.9265 | Audience with long gap time from the last engagement | |
| R > 75% | value > 8.8710 | value > 8.9265 | Audience with longest gap time from the last engagement | |
| Frequency (F) | F ≤ 0 | value = 0.0000 | value = 0.0000 | Audience with no frequency |
| 0 < F ≤ 25% | 0 < value ≤ 2.2271 | 0 < value ≤ 2.2105 | Audience with low frequency | |
| 25% < F ≤ 50% | 2.2271 < value ≤ 3.0900 | 2.2105 < value ≤ 3.0348 | Audience with medium frequency | |
| 50% < F ≤ 75% | 3.0900 < value ≤ 3.9530 | 3.0348 < value ≤ 3.8592 | Audience with high frequency | |
| F > 75% | value > 3.9530 | value > 3.8592 | Audience with highest frequency | |
| Interest (I) | I = 0 | value = 0.0000 | value = 0.0000 | Audience with no interest in the advertisement |
| 0 < I ≤ 25% | 0 < value ≤ 18.0680 | 0 < value ≤ 29.2051 | Audience with low interest in the advertisement | |
| 25% < I ≤ 50% | 18.0680 < value ≤ 54.2039 | 29.2051 < value ≤ 58.4103 | Audience with medium interest in the advertisement | |
| 50% < I ≤ 75% | 54.2039 < value ≤ 176.1219 | 58.4103 < value ≤ 188.3255 | Audience with high interest in the advertisement | |
| I > 75% | value > 176.1219 | value > 188.3255 | Audience with highest interest in the advertisement | |
| Campaign | Case | Cluster | Audience Percentage | Characteristics |
|---|---|---|---|---|
| 764 | Normal case | 1 | 8.56% | Audience with shortest gap time from the last engagement, highest frequency, and low interest in the advertisement |
| 2 | 42.76% | Audience with shortest gap time from the last engagement, low frequency, and no interest in the advertisement | ||
| 3 | 37.98% | Audience with longest gap time from the last engagement, low frequency, and no interest in the advertisement | ||
| 4 | 0.62% | Audience with shortest gap time from the last engagement, highest frequency, and highest interest in the advertisement | ||
| 5 | 10.08% | Audience with long gap time from the last engagement, low frequency, and medium interest in the advertisement | ||
| Special case | 1 | 8.92% | Audience with shortest gap time from the last engagement, highest frequency, and low interest in the advertisement | |
| 2 | 42.77% | Audience with shortest gap time from the last engagement, low frequency, and no interest in the advertisement | ||
| 3 | 37.99% | Audience with longest gap time from the last engagement, low frequency, and low interest in the advertisement | ||
| 4 | 0.64% | Audience with shortest gap time from the last engagement, highest frequency, and high interest in the advertisement | ||
| 5 | 9.68% | Audience with long gap time from the last engagement, low frequency, and medium interest in the advertisement | ||
| 776 | Normal case | 1 | 38.33% | Audience with longest gap time from the last engagement, low frequency, and no interest in the advertisement |
| 2 | 8.20% | Audience with shortest gap time from the last engagement, highest frequency, and low interest in the advertisement | ||
| 3 | 42.35% | Audience with shortest gap time from the last engagement, low frequency, and no interest in the advertisement | ||
| 4 | 0.67% | Audience with shortest gap time from the last engagement, highest frequency, and highest interest in the advertisement | ||
| 5 | 10.45% | Audience with long gap time from the last engagement, low frequency, and medium interest in the advertisement | ||
| Special case | 1 | 38.77% | Audience with longest gap time from the last engagement, low frequency, and low interest in the advertisement | |
| 2 | 8.44% | Audience with shortest gap time from the last engagement, highest frequency, and low interest in the advertisement | ||
| 3 | 42.38% | Audience with shortest gap time from the last engagement, low frequency, and no interest in the advertisement | ||
| 4 | 0.71% | Audience with shortest gap time from the last engagement, highest frequency, and high interest in the advertisement | ||
| 5 | 9.70% | Audience with long gap time from the last engagement, low frequency, and medium interest in the advertisement |
Disclaimer/Publisher’s Note: The statements, opinions and data contained in all publications are solely those of the individual author(s) and contributor(s) and not of MDPI and/or the editor(s). MDPI and/or the editor(s) disclaim responsibility for any injury to people or property resulting from any ideas, methods, instructions or products referred to in the content. |
© 2023 by the authors. Licensee MDPI, Basel, Switzerland. This article is an open access article distributed under the terms and conditions of the Creative Commons Attribution (CC BY) license (https://creativecommons.org/licenses/by/4.0/).
Share and Cite
Lim, S.-T.; Ong, L.-Y.; Leow, M.-C. New RFI Model for Behavioral Audience Segmentation in Wi-Fi Advertising System. Future Internet 2023, 15, 351. https://doi.org/10.3390/fi15110351
Lim S-T, Ong L-Y, Leow M-C. New RFI Model for Behavioral Audience Segmentation in Wi-Fi Advertising System. Future Internet. 2023; 15(11):351. https://doi.org/10.3390/fi15110351
Chicago/Turabian StyleLim, Shueh-Ting, Lee-Yeng Ong, and Meng-Chew Leow. 2023. "New RFI Model for Behavioral Audience Segmentation in Wi-Fi Advertising System" Future Internet 15, no. 11: 351. https://doi.org/10.3390/fi15110351
APA StyleLim, S.-T., Ong, L.-Y., & Leow, M.-C. (2023). New RFI Model for Behavioral Audience Segmentation in Wi-Fi Advertising System. Future Internet, 15(11), 351. https://doi.org/10.3390/fi15110351