1. Introduction
In an era marked by rapid advancements in robotics and autonomous systems, the impact of these technologies on various sectors is evident [
1,
2]. One domain undergoing significant transformation due to these innovations is the modern warehouse. With the integration of robotics, Internet of things (IoT) devices, and real-time data analytics, warehouses are evolving into efficient, data-driven entities [
3,
4]. Specifically, the deployment of UGVs is revolutionizing how warehouses operate.
However, as warehouses scale in both size and technological complexity, new challenges emerge. Two primary issues dominate current discussions: the efficient navigation and task allocation for UGVs [
5,
6,
7,
8] and the strategic placement of power stations and batteries to support their continuous operation [
9]. An inappropriately placed power station can create workflow disruptions, resulting in decreased UGV operational times and overall inefficiency.
This study addressed the intertwined challenges of UGV task allocation and battery placement in the warehouse setting. Our contributions are as follows:
A novel approach to improve UGV operations within modern warehouses by strategically placing batteries and power stations.
Extensive simulations in realistic warehouse settings to validate our approach.
By focusing on these aspects, we aimed to significantly reduce the time UGVs spend traveling and performing associated sub-operations in warehouses. We validated our approach using extensive simulations set in warehouse environments with real-world characteristics.
Regarding the structure of this paper,
Section 2 delivers a review of relevant studies that resonate with our core theme. The essence of our proposed algorithm is given in
Section 3.
Section 4 dives deep into the empirical evidence, elucidating our evaluation methodology.
Section 5 explores the intricate challenges of modern warehouse management and the drawbacks of approximate cellular decomposition (ACD) [
10] and emphasizes the complexities and hurdles in achieving optimization. Lastly,
Section 6 presents a recapitulation of our discoveries, culminating with forward-thinking conclusions.
2. Related Work
The problem of routing, or the act of mapping optimal paths for robots, is pivotal in the discourse on autonomous systems. At its core, routing seeks to minimize travel costs. Thus far, the efforts to solve this conundrum have been delineated into two camps: static and dynamic routing algorithms. While static solutions [
11,
12] offer fixed, predetermined paths, dynamic solutions [
13,
14] have the agility to adjust to environment and robot variations, usually resulting in enhanced operational efficiency. A notable challenge arises when accounting for the intricate parameters of routing. Many previous studies sidestepped addressing diverse robot attributes, such as varied types, speeds, and mutable positions, due to the computational heft of these concerns. This omission, in turn, complicates the validation of newly proposed algorithms, as benchmarking becomes a formidable task without any genuine touchstone for comparison.
In several scholarly pursuits, routing decisions have leaned toward the principle of the shortest path. Kim and Tanchoco [
15] proposed dynamic robot routing within a two-way path system. Although they formulated temporal equations, their findings remained somewhat decoupled from these theoretical undertakings.
In the realm of autonomous robotics and vehicle operations, a nascent yet burgeoning topic of interest is the strategic placement of energy stations or battery recharging points. Much of the prevailing research in this domain emphasizes a broader perspective, focusing on energy station deployment throughout urban landscapes to cater to electric vehicles [
16,
17,
18]. Despite this macro outlook, the underlying principle remains consistent: determining optimal locations based on demand, traffic, and logistical factors. It is important to note that while the challenges of battery placement within controlled environments, like warehouses, might differ from the broad-scale deployment of charging stations across cities, the foundational goal converges on optimizing resource allocation and enhancing efficiency.
In the broader context of autonomous system applications, beaches, with their unique challenges stemming from both natural and human influences, emerge as a critical area of concern. The interplay between climate change, pollution, and beach health necessitates innovative solutions that fuse the best of technology and sustainability. One such solution is presented in a paper detailing the development of an intelligent hierarchical cyber-physical system (IHCPS) for beach waste management [
19]. This system, termed BeWastMan, is an autonomous solution that seamlessly integrates an unmanned aerial vehicle for aerial beach surveillance and monitoring, with a data-processing ground station and a UAV dedicated to waste collection and sorting. The strength of this research lies not only in its innovative approach but also in its practical applicability, as demonstrated by the real-world case study under the BIOBLU project.
In scrutinizing the extensive body of literature on robotic operations within warehouses, it becomes evident that while many studies have delved into specific facets of the challenge, there is a conspicuous absence of comprehensive solutions tailored to contemporary warehouses. Many papers offered insights into individual elements, such as task allocation [
20], navigation [
21], or energy management [
22]. However, the holistic integration of these components into a unified system remains an uncharted territory.
Pivoting to the warehouse domain, as automated warehouses burgeon in size and complexity, emergent logistical challenges, such as automated inventory counting, become increasingly pressing. Addressing this issue, recent work proposed a highly scalable, low-cost, plug-and-play multirobot system tailor-made for inventory management. Central to this system is the ensemble of a micro-drone, an embedded camera module, and a ground mobile robot working in harmony. Tests under various configurations, including individual and paired multirobot system sets, underscore the efficacy of this interconnected approach, revealing tangible benefits in reducing inventory management task times [
23].
The work presented in this paper sought to bridge this gap. Our objective was to craft a unified framework that seamlessly intertwines task allocation, movement prediction, and strategic battery placement for UGVs within modern warehouses. In doing so, we aspired to significantly amplify both throughput and efficiency, ushering in a new benchmark for warehouse operations in the era of automation.
3. The Proposed System
3.1. Environment Definition
At the heart of our proposed system lies the meticulous and precise representation of a modern warehouse environment. Understanding the spatial configuration of a warehouse is pivotal for the seamless movement and optimal functioning of UGVs. In order to computationally model and interpret the expansive nature of a warehouse, we utilized a grid-based representation. Each cell within the grid corresponds to the Cartesian coordinates of an actual warehouse, effectively transmuting the physical space into a digital grid. This systematic digital mirroring allows for more efficient algorithmic traversals and path calculations for the UGVs.
Within this gridded representation, the shelves, which are fundamental structures housing products, are meticulously arranged in rows. These shelves serve as both landmarks and destinations for the UGVs. Notably, the structural design of these shelves is not uniform; their heights vary considerably. Some shelves are so high that they are inaccessible to certain UGVs due to their design constraints. This height variation introduces an additional layer of complexity in task allocation, as UGVs have to be delegated tasks based on both their capability to navigate and their ability to access specific shelf heights.
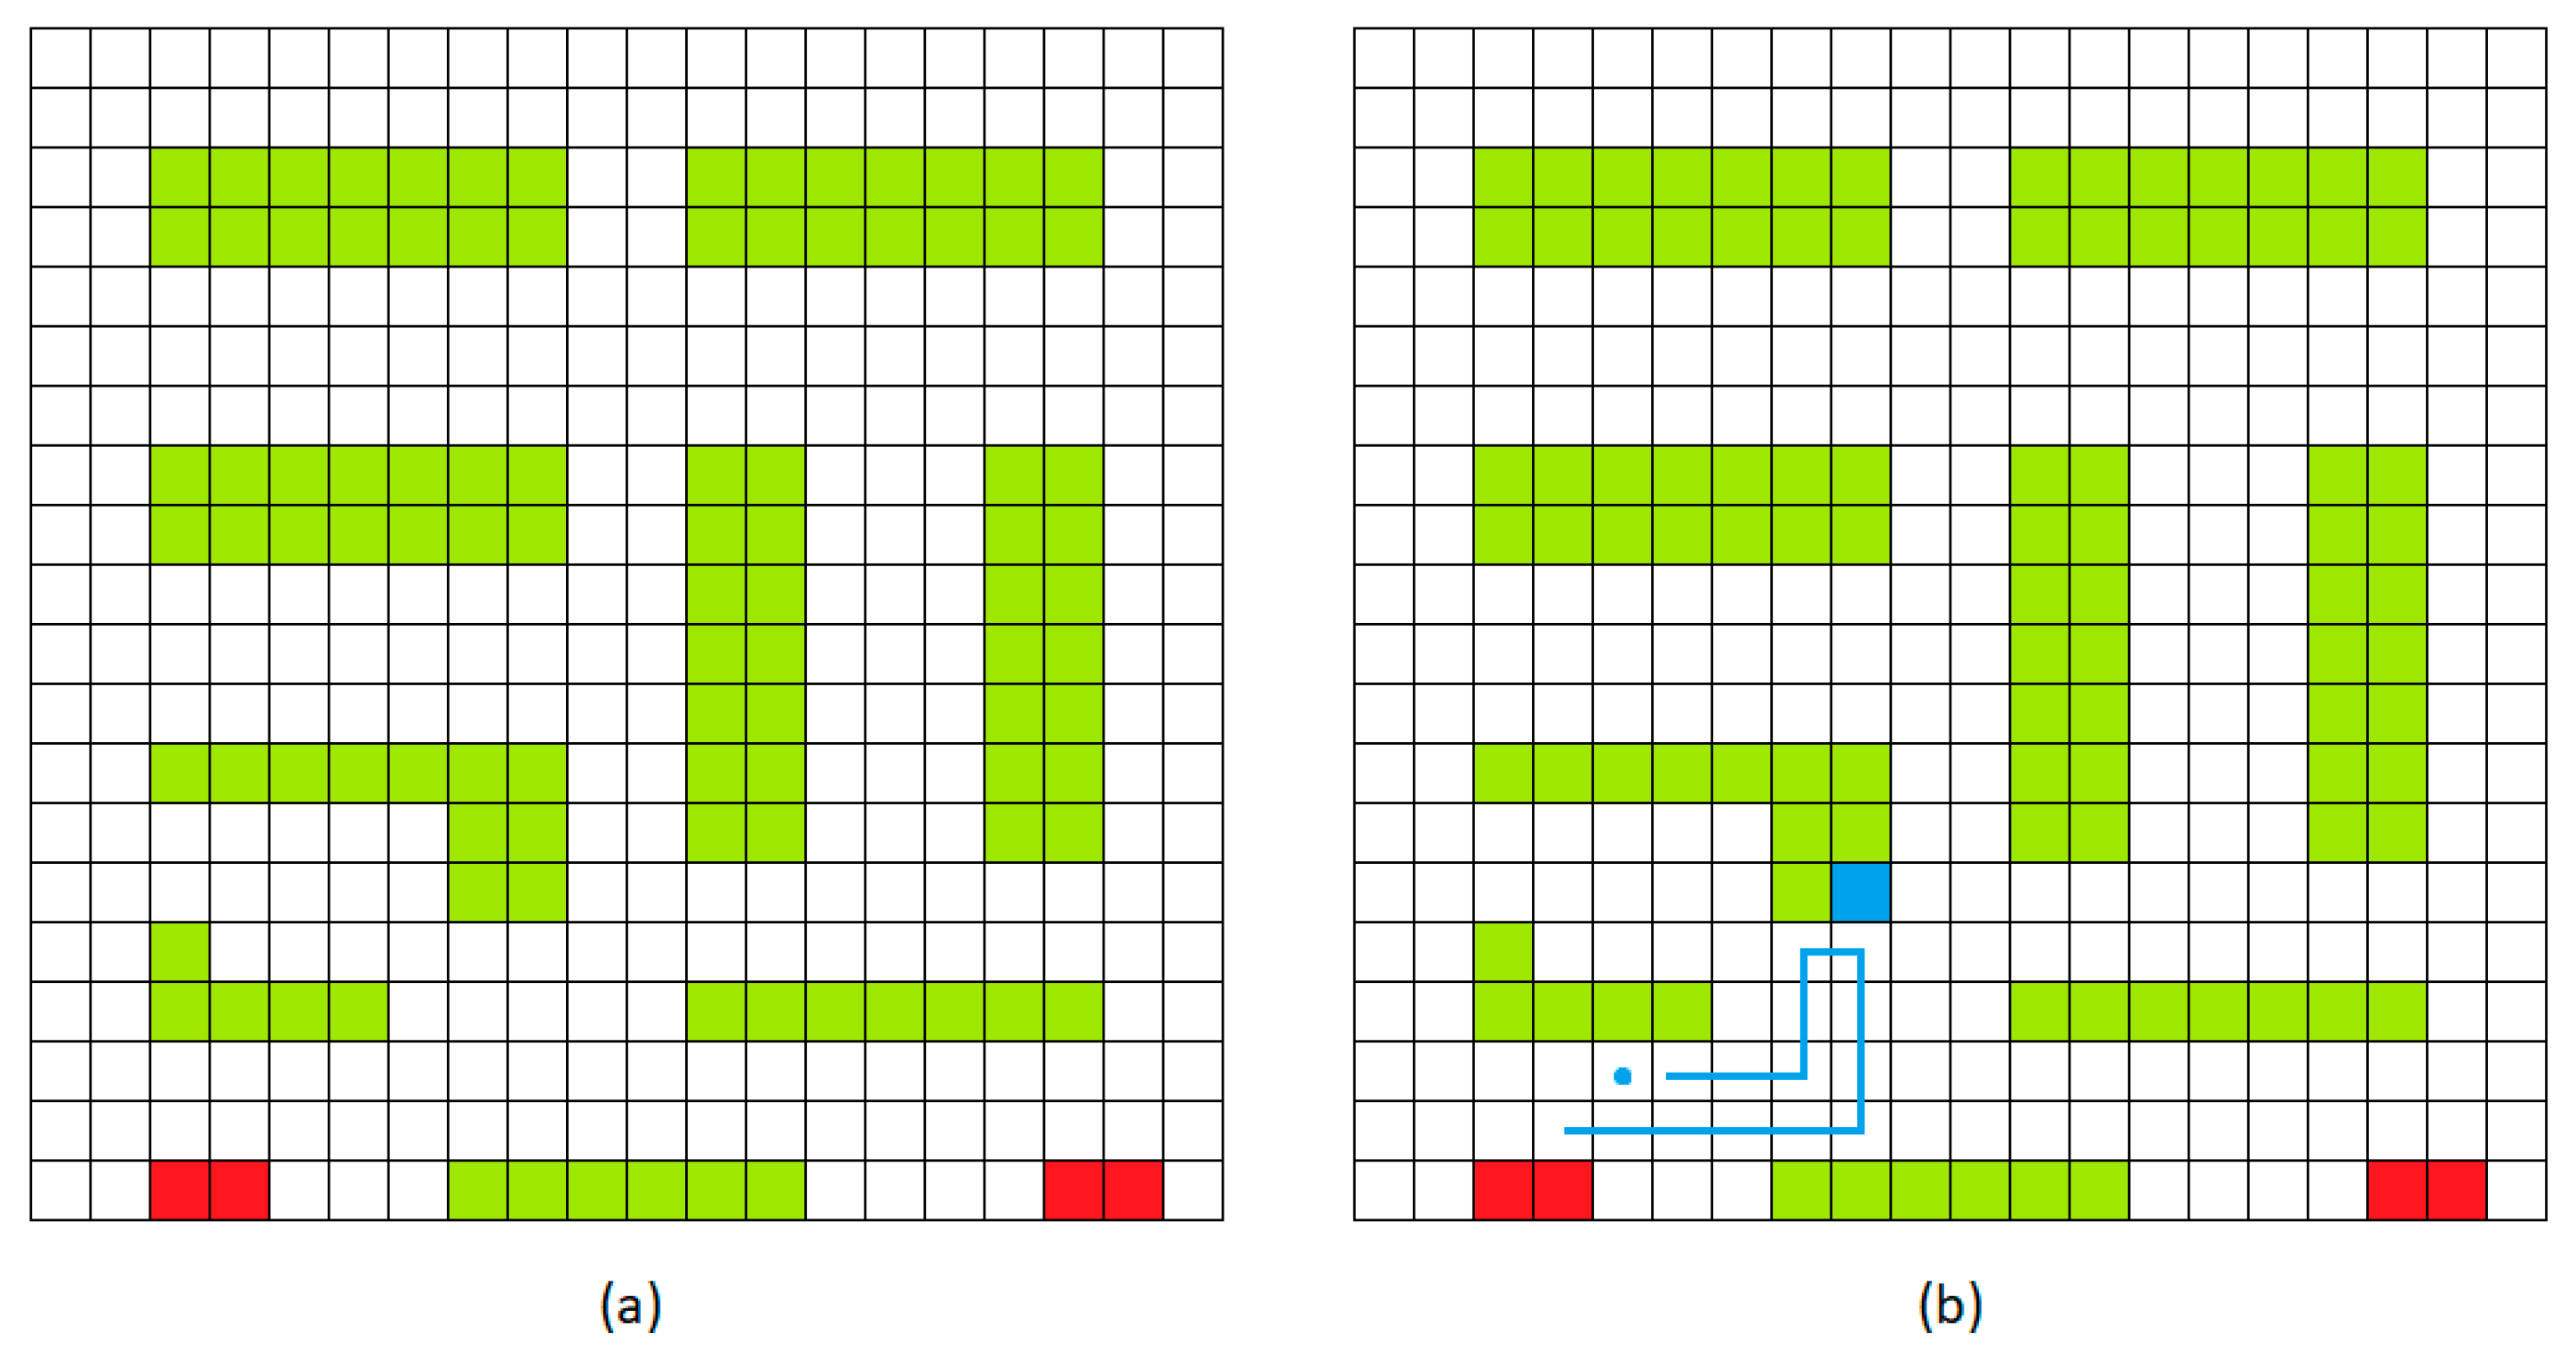
Figure 1 depicts a grid representing a modern warehouse environment.
A delivery task, in its essence, is a sequence of moves that a UGV undertakes to fulfill an order. Initiated from its resting or starting point, a UGV embarks on a journey that sees it navigate through the matrix-defined warehouse. It weaves its way toward the designated shelf, secures the desired product, and then proceeds to transport this product to a predetermined exit within the warehouse. Given the design constraints and to maintain simplicity in their movement patterns, UGVs are programmed to move in straight lines, which means their navigation is strictly confined to vertical and horizontal trajectories. This movement constraint ensures predictability in their paths and facilitates easier coordination between multiple UGVs.
As we delve deeper into the intricacies of task allocation and path generation for UGVs within our digitally represented warehouse environment, it is crucial to mention that the underlying algorithmic framework for these processes is largely based on our previously proposed methodology detailed in paper [
15]. Given its prior establishment and comprehensive detailing in that publication, an exhaustive discussion of the algorithm’s nuances, mechanics, and applications is beyond the purview of this current work. The cornerstone of this manuscript and its primary contribution to the existing body of research is the innovative approach to battery placement within warehouse environments. By synergizing energy management with optimized logistics, our focus here was to underscore the significance of strategic battery placement and its overarching impact on the efficiency and throughput of modern warehousing operations.
3.2. Calculating Sub-Areas
The first stage of the proposed methodology for efficient battery placement is to identify the areas of high and low activity (traffic). In modern warehousing operations, efficiency is often determined by how well we can pinpoint and serve areas of high activity and frequent UGV navigation. With this understanding, it is important to discern these hotspots within the warehouse environment. By assimilating real-time operational data, such as navigation paths, the goal is to accurately identify the most frequented cells within the warehouse matrix. Utilizing the AP clustering algorithm allows us to delineate distinct sub-areas within the larger warehouse matrix. These sub-areas, which are demarcated based on UGV traffic intensity, become the cornerstone of our battery allocation strategy. The AP algorithm, as illustrated in Algorithm 1, was designed to assign sub-areas within a warehouse environment. The input is a warehouse grid, denoted as W, of size X by Y. Each cell within this grid quantifies the traffic (frequency of UGV traversal). The algorithm initiates by transforming the warehouse environment into a collection of data points where each cell becomes a data point situated in a two-dimensional plane, carrying its traversal count as a value. Pairs of these data points undergo similarity calculations grounded in the negative squared Manhattan distance between their UGV traversal counts, subsequently storing these similarities in matrix S. As the process unfolds, two matrices named R (responsibility) and A (availability) are introduced and set to zero. For precise computations, the diagonal of matrix S is set to its median value, which is a strategy used to determine the preference value. The algorithm then enters an iterative phase aimed at convergence, wherein it updates the R and A matrices. Upon stabilization, exemplars, or representative points, are identified where the sum of matrices A and R is at its peak. The final steps see the non-exemplar points being matched with their closest exemplar based on the highest similarity, ensuring spatial connectedness. The culmination of this procedure yields clusters of proximate cells, highlighting regions within the warehouse with analogous traversal patterns.
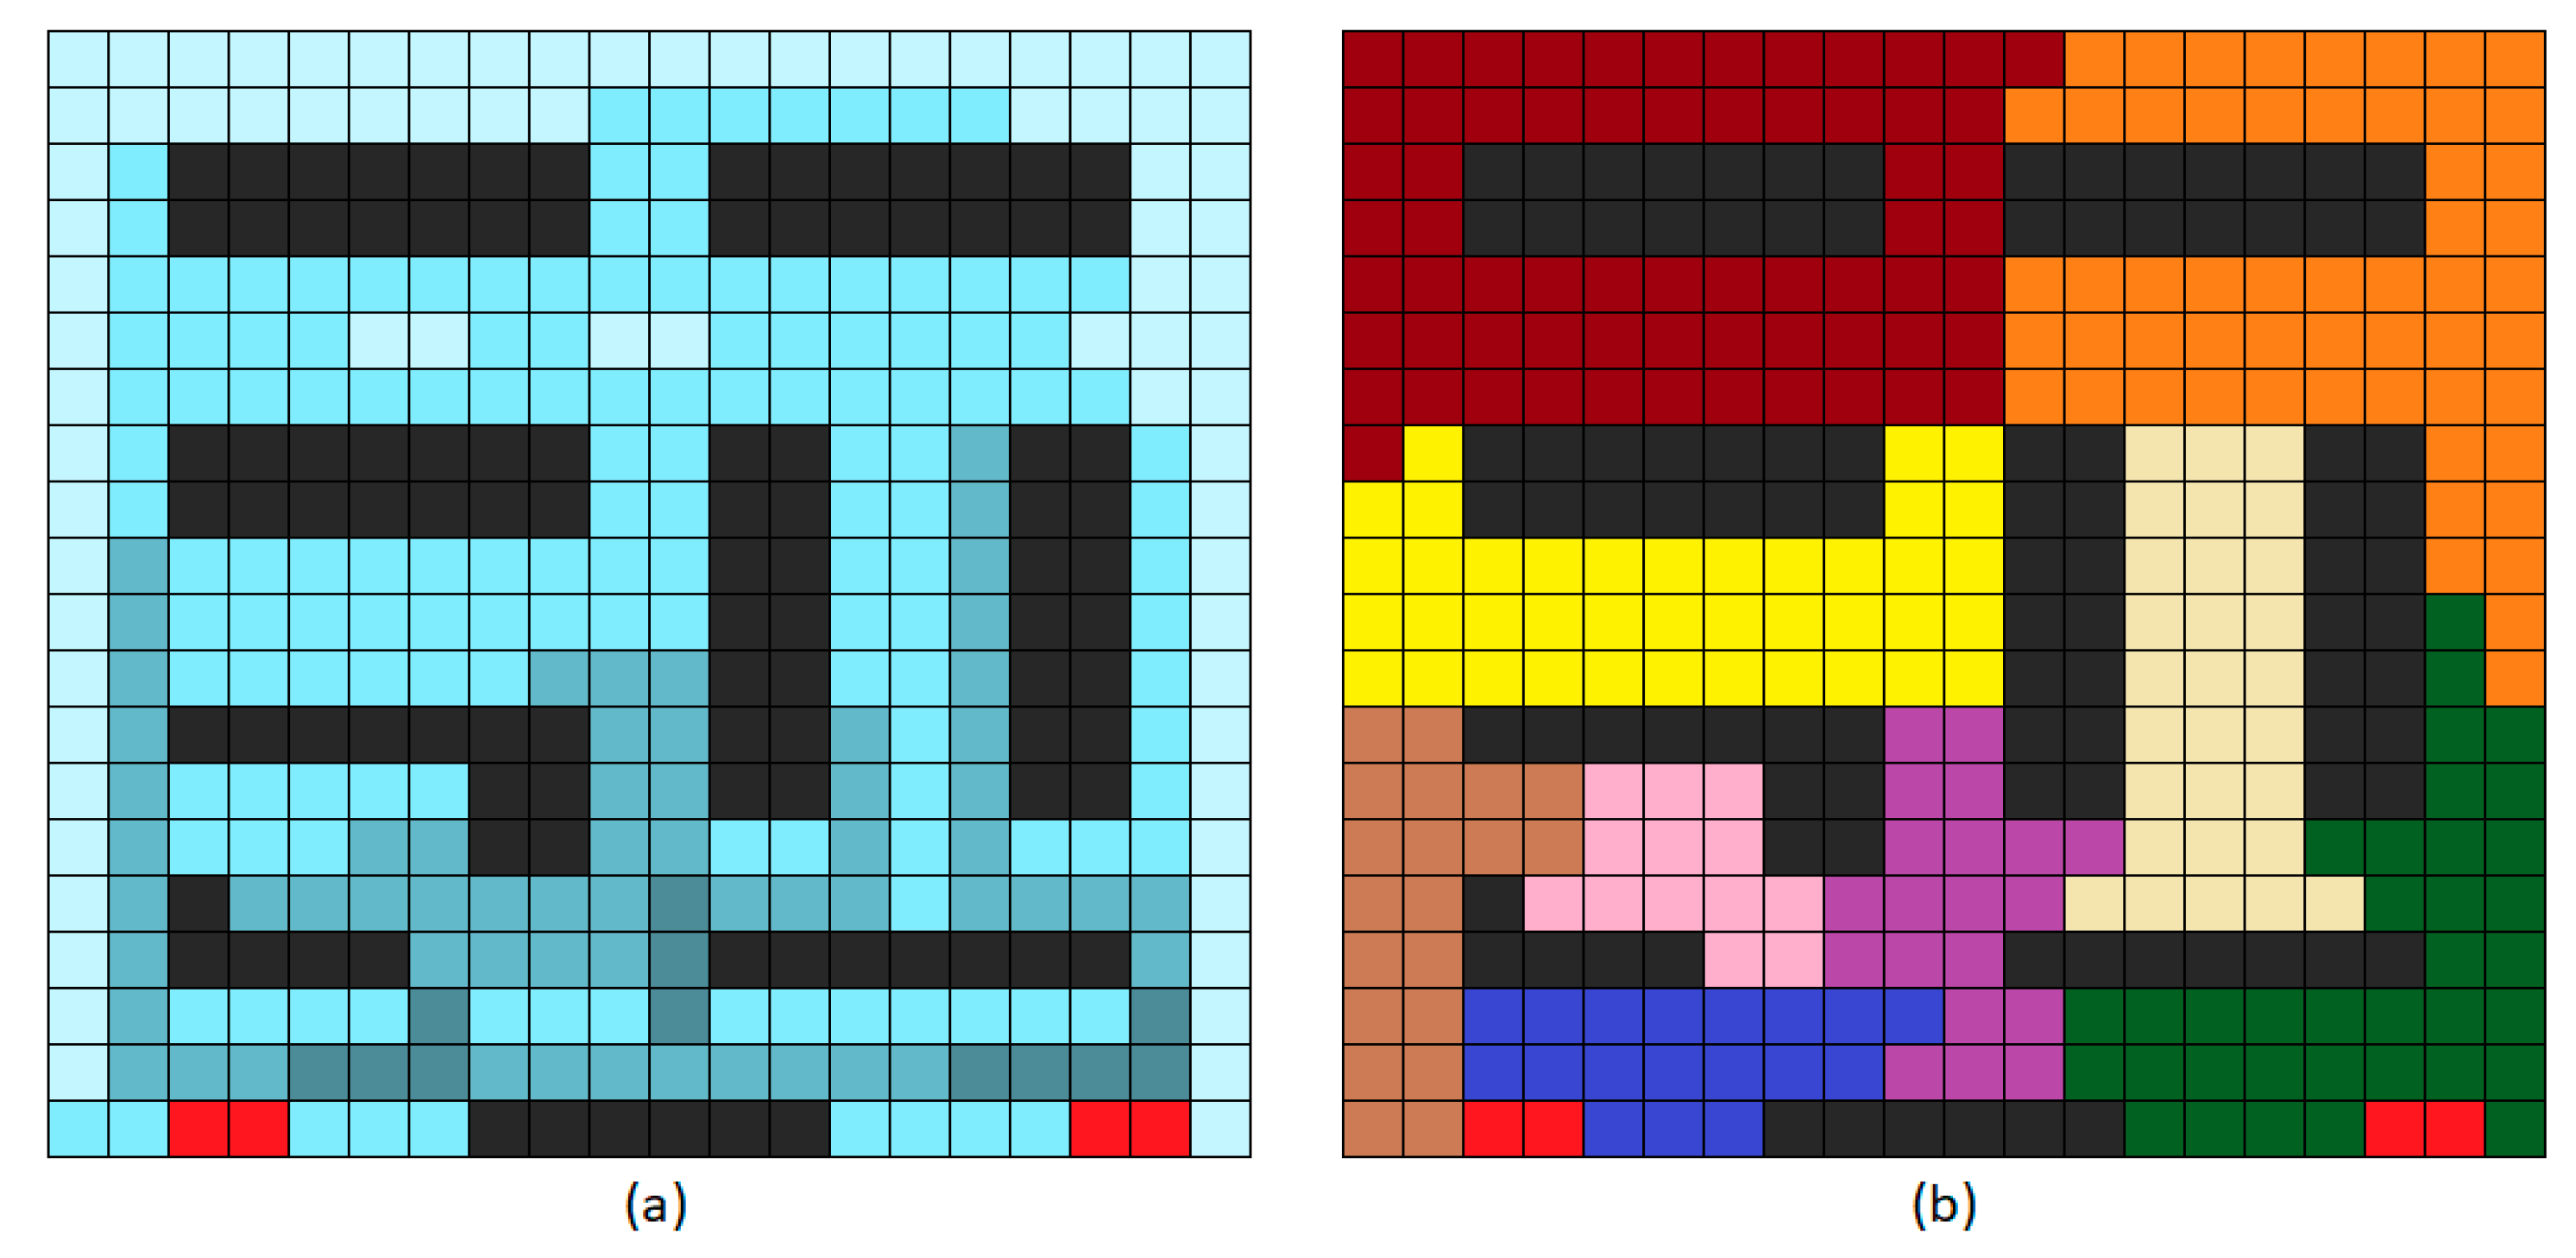
Figure 2 shows the outcome of the algorithm in a 20-by-20 environment.
| Algorithm 1: Affinity propagation algorithm for sub-area assignment. |
Input: Warehouse environment W with dimensions X by Y, where each cell rep resents UGV traversal count. Output: Clusters of neighboring cells with similar traversal counts. Step 1: Convert the warehouse environment W into a set of data points. Represent each cell as a data point in a two-dimensional coordinate system with its value being the traversal count. Step 2: Calculate the similarity between every pair of data points Compute similarity based on the negative squared Manhattan distance between UGV traversal counts. Store the similarity in a matrix S. Step 3: Initialize messages between data points. Initialize two matrices, namely, R (responsibility) and A (availability), to zero. Set diagonal of similarity matrix S to the median of all values in S (preference value). Step 4: Iterate until convergence (or maximum number of iterations). Update the responsibility matrix R using R(i, k) < −S(i, k) − max{ A(i, k′) + S(i, k′): for all k′ ≠ k }. Update the availability matrix A using A(i, k) <- min{ 0, R(k, k) + sum{ min(0, R(i′, k)): for all i′ not in {i, k} } }. Step 5: Identify exemplars. Identify data points where the sum of A and R is maximized for each point as exemplars. Step 6: Assign cells to clusters Assign each non-exemplar data point to the exemplar with which it shares the highest similarity (considering neighboring cells using the 4-neighbor scheme). Group the data points assigned to each exemplar into a cluster. Step 7: Return the clusters of neighboring cells.
|
Following the outlined AP algorithm, it is notable that its standard configuration is tailored to cluster cells (or data points) based on similarity. Thus, cells with akin traffic patterns will typically coalesce. While this trait suits numerous applications, it is not quite fitting for our specific challenge. For the context of our warehouse optimization, the goal is a more nuanced clustering: denser traffic areas should be condensed into smaller clusters, while lighter traffic zones should sprawl over more expansive clusters. This design choice maximizes battery utility and optimizes the likelihood of a UGV securing an available battery during its operation. Equation (1) shows how the self-similarity
is calculated. Cells with more traffic are rewarded, while cells with less traffic (weight matrix
W) are punished and are less likely to become exemplars. The constant
is a small positive constant that prevents the equation from becoming undefined, controls the influence of cells with low traffic values, and introduces a desired level of granularity in the clustering process.
Central to this adjusted clustering behavior is the recalibration of the self-similarity values within the similarity matrix
. Notably, diagonal values within
, which represent self-similarities, pivotally determine the cluster count. Rather than defaulting to the median of each row for these values, we adjusted them to the negative logarithmic value of the corresponding traffic value from the matrix
. This adjustment introduces a distinct behavior: cells in high-traffic zones, with their elevated values, are predisposed to become exemplars, fostering a multiplication of clusters. In contrast, those in quieter zones are less apt to become standalone exemplars and would typically be subsumed into larger clusters. This nuanced approach achieves our objective: high-traffic areas see more clusters and low-traffic areas span larger ones. A visual representation of this can be seen in
Figure 2, which exhibits a warehouse environment segmented into its respective sub-areas.
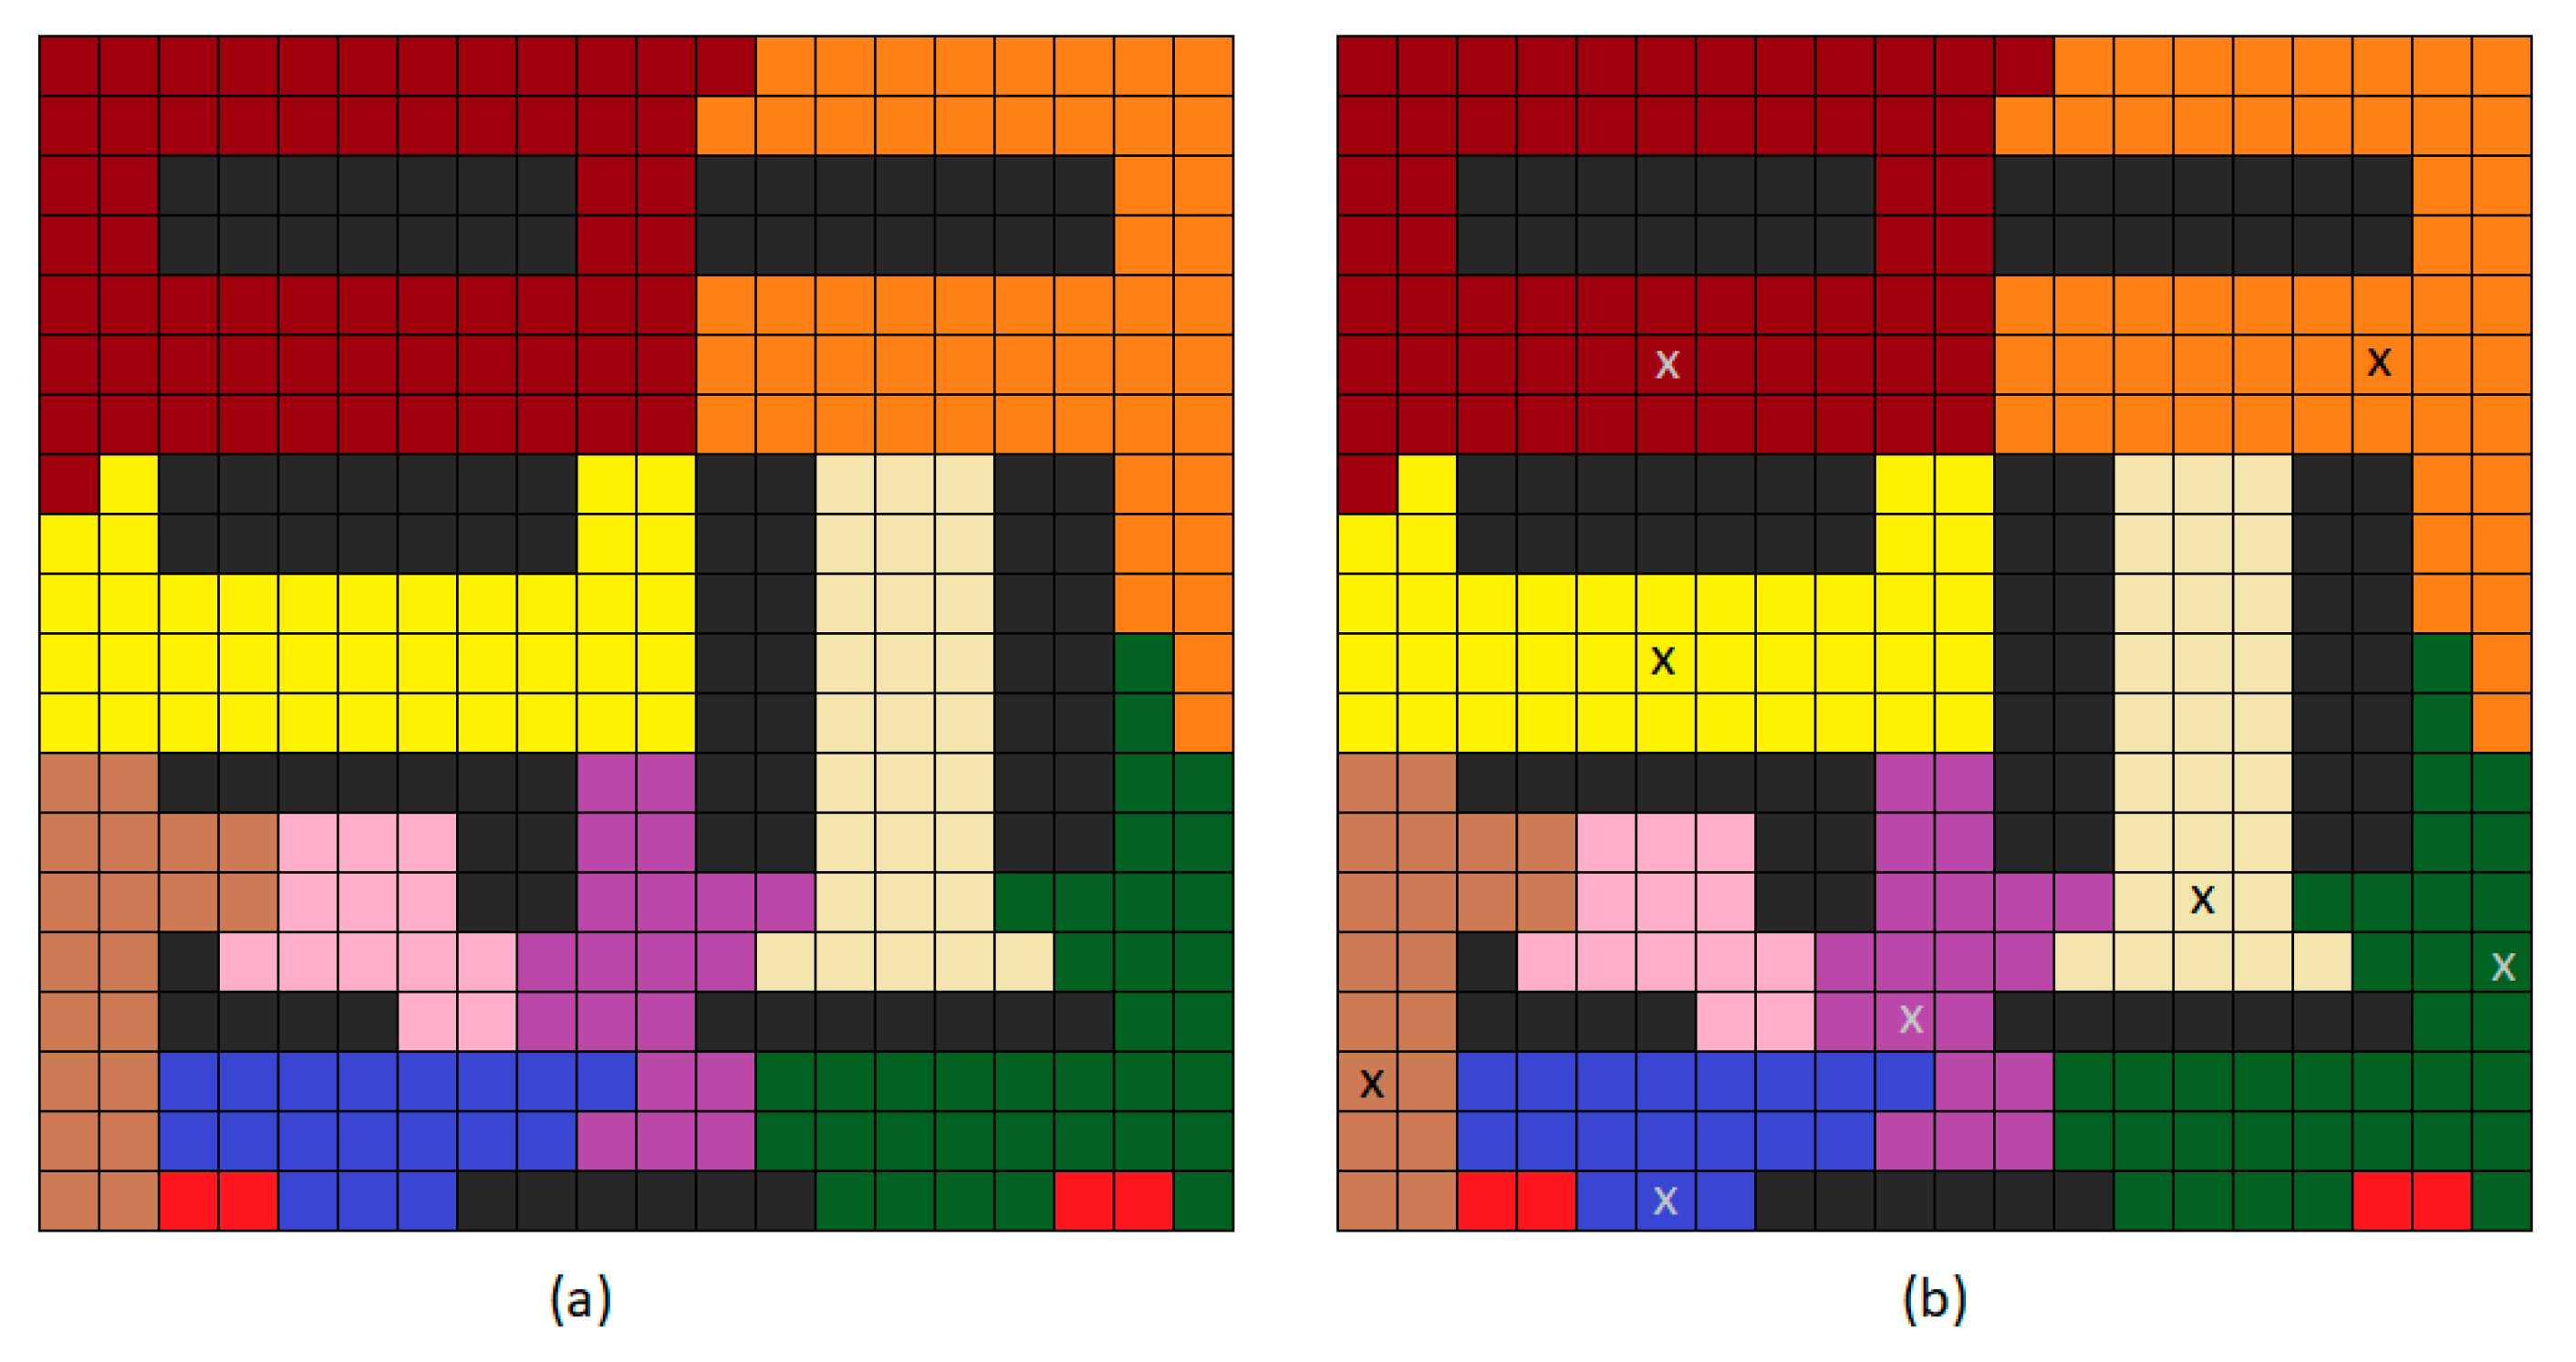
3.3. Placement of Batteries
After we segmented the warehouse into clusters based on their traffic densities, our next objective was to identify optimal battery placement within each cluster. This is crucial, as strategic placement ensures minimal interruption to the UGV traffic, optimizes the UGV operational times, and enhances the overall efficiency of the warehouse. The problem of the placement of batteries and power stations typically has the following constraints:
Proximity to shelves: cells adjacent to shelves are ruled out for battery placement to avoid hindrance during product loading.
High-traffic zones: Extreme ends of each row, which typically observe high traffic, are not prioritized for battery placement. Placing batteries at these cells could impede UGV operations.
Distance from high-traffic cell: The ideal battery placement should not be too distant from the cell with the highest traffic within the cluster. This ensures UGVs have quick access to charging, minimizing downtime.
Mathematically, we represent the scoring function for a cell c within a cluster as
where:
, , and are weighting constants that help to balance the influence of each factor on the overall score.
TrafficDesirability() can be represented by an inverted bell curve, often taking the shape of 1 − (Traffic() − mean(Traffic))2.
ProximityToShelves() can be a binary value (1 if adjacent to a shelf, 0 otherwise).
DistanceFromHighTrafficCell() is the Manhattan distance from the most trafficked cell within the cluster.
After calculating the scores for every cell within a cluster, the algorithm picks the cell with the highest score as the battery placement point. This procedure is reiterated for each cluster in the warehouse, ensuring that batteries are optimally located to cater to UGV energy demands without causing operational bottlenecks. It is worth mentioning that the weights
,
, and
can be used to further tune the outcome of the post-processing based on actual warehouse operations and UGV behaviors. This flexibility in adjusting the weights makes the proposed scoring system adaptable to various warehouse scenarios.
Figure 3 depicts the outcome of the battery placement in a 20-by-20 warehouse environment.
4. Experimental Results
To empirically assess the effectiveness of the proposed AP-based battery placement algorithm, we undertook a systematic comparison against a randomized placement approach. This evaluation aimed to determine how much our AP-driven approach can reduce the average distance a UGV must travel to reach its designated battery station within its cluster.
For our experimentation, we ran 100 individual trials. In each trial, a new, randomized traffic pattern was generated for the warehouse environment. We then normalized the traffic data for every cell in the warehouse, transforming the highest traffic cell to represent a value of 100 and proportionally scaling down other cells. This normalized traffic value can be interpreted as the probability of a UGV landing on a particular cell and subsequently requiring a battery recharge. This ensures that our evaluations are grounded on realistic and varied traffic patterns, reflecting the diverse navigational behaviors UGVs may exhibit in actual warehouse settings. Subsequently, for each trial, we calculated two key metrics:
Average distance using the AP algorithm: this represents the mean distance a UGV, based on its position, would need to travel to reach a battery station positioned via our AP-based approach.
Average distance using random placement: analogously, this represents the same mean distance, but with batteries placed randomly within the defined clusters.
By comparing these distances, we aimed to quantify the improvement gained by using the AP algorithm over a simplistic random placement.
Table 1 shows the results of the 10 synthetic experiments we conducted.
While distance optimization remains a paramount consideration in our evaluations, an equally critical metric is the energy consumption of UGVs during their transit to the battery stations. Reducing the distance traveled is beneficial, but understanding the energy implications of this travel offers a holistic insight into operational efficiency. It is not just about how far a UGV travels, but also how it travels: considering straight paths versus turns and idle times due to obstructions or other UGVs is also important. As such, to complement our distance metrics and to provide a comprehensive evaluation framework, we delved into an energy consumption model tailored for UGVs operating within the warehouse environment. This model factors in the distinct energy expenditures associated with different movement patterns and behaviors of the UGVs, allowing us to paint a clearer picture of the tangible benefits of our AP-based battery placement algorithm in terms of both distance and energy.
Let
= energy consumed by the UGV when traveling straight for one cell.
= energy consumed by the UGV when making a turn.
= idle energy cost per unit time.
= number of cells the UGV needs to travel straight.
= number of cells the UGV needs to turn.
= time the UGV remains idle, waiting for the path to clear.
Then, the energy consumption
for a UGV to reach the battery from its current position is given by
This formula effectively captures the total energy expenditure based on the UGV’s motion and idle time. It sums the energy used when the UGV travels straight, turns, and idles. It is pivotal to emphasize that the exact energy calculations, especially values for , , and , can vary and depend largely on the specifications of the robot. During the experimental evaluation, compared with the random battery placement, the proposed model managed to achieve up to 50% less distance traveled by the robots. If we consider the simplified version of Equation (3), where only the distance traveled is taken into account, this would result in approximately 50% less energy and time consumed. Given that a shorter path to the battery is less likely to contain turns, it is safe to assume that based on Equation (3), the actual energy gains could be even higher.
Different robots have distinct energy consumption patterns. Some robots might consume more energy when making turns due to the mechanics involved in such actions. In contrast, other robots, especially those designed for high-efficiency straight-path travels, might consume more energy when idling, waiting for obstructions to clear, or for the path ahead to become available. Therefore, calculating precise numbers to identify the exact energy gains of the proposed algorithm would most likely require the particular energy requirements of each robot.
In more intricate or demanding environments, the energy consumption model may warrant further refinement. For instances where granular precision becomes pivotal, additional factors, such as variations in terrain, robot acceleration patterns, or even ambient temperature fluctuations, could be incorporated. Such enhancements can provide an even more nuanced understanding of energy expenditure, ensuring the model’s robustness and adaptability to diverse operational scenarios.
5. Discussion
5.1. Warehouse Representation Limitations
Cellular decomposition is a technique used in robotics and computational geometry to represent large continuous spaces as an aggregation of smaller, discrete units called cells. The dimensions of these cells in a grid representation, especially in the context of a warehouse with variable-sized shelves, are critical for effective and accurate modeling.
Cell size and shelf representation: The dimensions of a cell should ideally be chosen such that the most common or average shelf sizes in the warehouse can be represented using an integer number of cells. This ensures that the majority of the warehouse can be accurately represented without significant distortions. However, it is essential to recognize that in real-world scenarios, shelves might not always conform to these standardized sizes. Some might span across the border of a cell or occupy a fraction of it.
Impact on the AP algorithm: The effectiveness of the AP algorithm hinges upon the granularity of the grid representation. If the cells are too large, the nuances in robot traffic patterns might be lost, leading to sub-optimal clustering. Conversely, if the cells are too small, the algorithm might become computationally expensive, and the resulting clusters could be too granular to be practically useful. Moreover, misalignment between cell boundaries and actual physical structures like shelves could lead to clustering that does not accurately reflect the true traffic patterns.
Inherent challenges of ACD: This dilemma is not unique to the scenario described but is a characteristic challenge of all approximate cellular decomposition methods. When decomposing a continuous space into discrete cells, there is always a trade-off between representation accuracy and computational efficiency. Too fine a decomposition can capture the environment’s nuances but may be computationally prohibitive, while a coarser decomposition might miss critical details. Additionally, real-world environments are seldom perfectly regular. Objects, such as shelves, might not neatly align with the imposed grid, leading to representation errors. These discrepancies can influence pathfinding, task allocation, and other algorithmic processes reliant on the grid.
5.2. Problem Complexity and Challenges
The question of optimal battery and power station placement in contemporary warehouses remains a multifaceted challenge. At the outset, every warehouse environment is unique. Variances in structural layout, scale, storage design, and operational needs mean that a one-size-fits-all approach is often impractical. Even warehouses with similar structures may have different internal operations and logistical demands, making their requirements distinct.
A critical yet often overlooked factor in battery and power station placement is the dynamic nature of product placement within the warehouse. Depending on inventory turnover, seasonality, and changing consumer demands, product locations within a warehouse can shift, leading to evolving UGV paths. Such shifts inadvertently affect the density of traffic in various regions of the warehouse. For instance, an area previously considered low-traffic might suddenly become a hotspot if high-demand products are stored there. This dynamism underscores the need for flexible and adaptive approaches to battery and power station placements, as static configurations may quickly become suboptimal.
Given the transient nature of warehouse configurations, a pertinent consideration arises: how often should the warehouse model be updated? Shelves may undergo modifications over time, or temporary objects might find themselves placed in pathways or vacant areas. These alterations can distort the accuracy of the initial grid model. To retain an optimal battery and power station placement, periodic model updates are essential. During the experimental evaluation of the proposed methodology, it was found that in order to ensure that the system remains responsive to the actual ground conditions, rather than adhering to an outdated grid representation, the algorithm must be run every time the task delivery patterns change. In practical terms, this could mean adjustments to the model with the introduction of new products or shifts in consumer preferences.
Furthermore, beyond the physical and logistical attributes of the warehouse, other variables might influence the optimal placement of power solutions. Factors such as the energy consumption patterns of UGVs, variations in UGV models and their energy requirements, and even external elements like temperature fluctuations (which can influence battery performance) can add layers of complexity to the problem.
Throughout our experimentation, even within a simulated realistic warehouse environment, we observed stark variations in outcomes depending on the input conditions. Specifically, different product delivery tasks and patterns of UGV movement significantly altered the identification of hot spot areas within the warehouse. As a result, the optimal positions for power stations correspondingly shifted. This variability underscores the dynamic nature of warehouse operations and the inherent challenge of predicting power station placements without a comprehensive understanding of the full spectrum of tasks and operational nuances specific to each environment.
Given these multifaceted challenges, it becomes evident that a holistic approach is imperative. To truly optimize warehouse operations, there is a compelling need for a unified system that harmoniously integrates product placement, task allocation, UGV navigation, and power station placement. Such a system would not only maximize operational efficiency but also enhance the adaptability of warehouses to the ever-changing dynamics of the logistics industry.
6. Conclusions
In this research, we delved deep into the multifaceted challenges of optimizing warehouse operations, particularly concerning energy management for UGVs. The presented algorithm, which is rooted in the principles of affinity propagation, not only aids in discerning the intricate traffic patterns within a warehouse but also adroitly recommends strategic battery placement points. These placements, as demonstrated through our experiments using synthetic warehouse grid environments, have the potential to revolutionize energy management in warehouse logistics. By addressing the dual concerns of reducing UGV downtime and ensuring non-obstructive operational flow, our approach promises significant boosts in overall warehouse throughput and efficiency.
However, every research endeavor, irrespective of its successes, invariably uncovers avenues for further exploration. Our algorithm, though robust in its current iteration, could benefit from incorporating real-time adaptability, allowing it to respond to changing traffic patterns and UGV operational dynamics on the fly. Such adaptability would further diminish the time UGVs spend on ancillary operations, and thus, further increase the warehouse’s operational efficiency.
Looking ahead, we envision several promising expansions for our proposed algorithm. One imminent focus area is the integration of machine learning techniques to continuously refine the cluster generation and battery placement processes based on accumulated operational data. Additionally, extending the algorithm to accommodate multi-tiered warehousing systems, where vertical movement becomes pivotal, poses an exciting challenge. Future endeavors could also investigate adaptive mechanisms or modular augmentations to the algorithm, ensuring it remains both efficient and effective as the environment’s scale and intricacy grow. We believe that with appropriate modifications, our algorithm has the potential to maintain its efficacy across a broader spectrum of scenarios. Furthermore, in light of the growing ubiquity of electric vehicles in urban settings, adapting our methodology for city-wide electric charging station placements is a natural progression. This would blend the micro-level insights from warehouse operations with the macroscopic intricacies of urban planning, potentially laying the foundation for smarter, more energy-efficient cities of the future.


 ,
, 


