
Financial Data Quality Evaluation Method Based on Multiple Linear Regression


Abstract
:1. Introduction
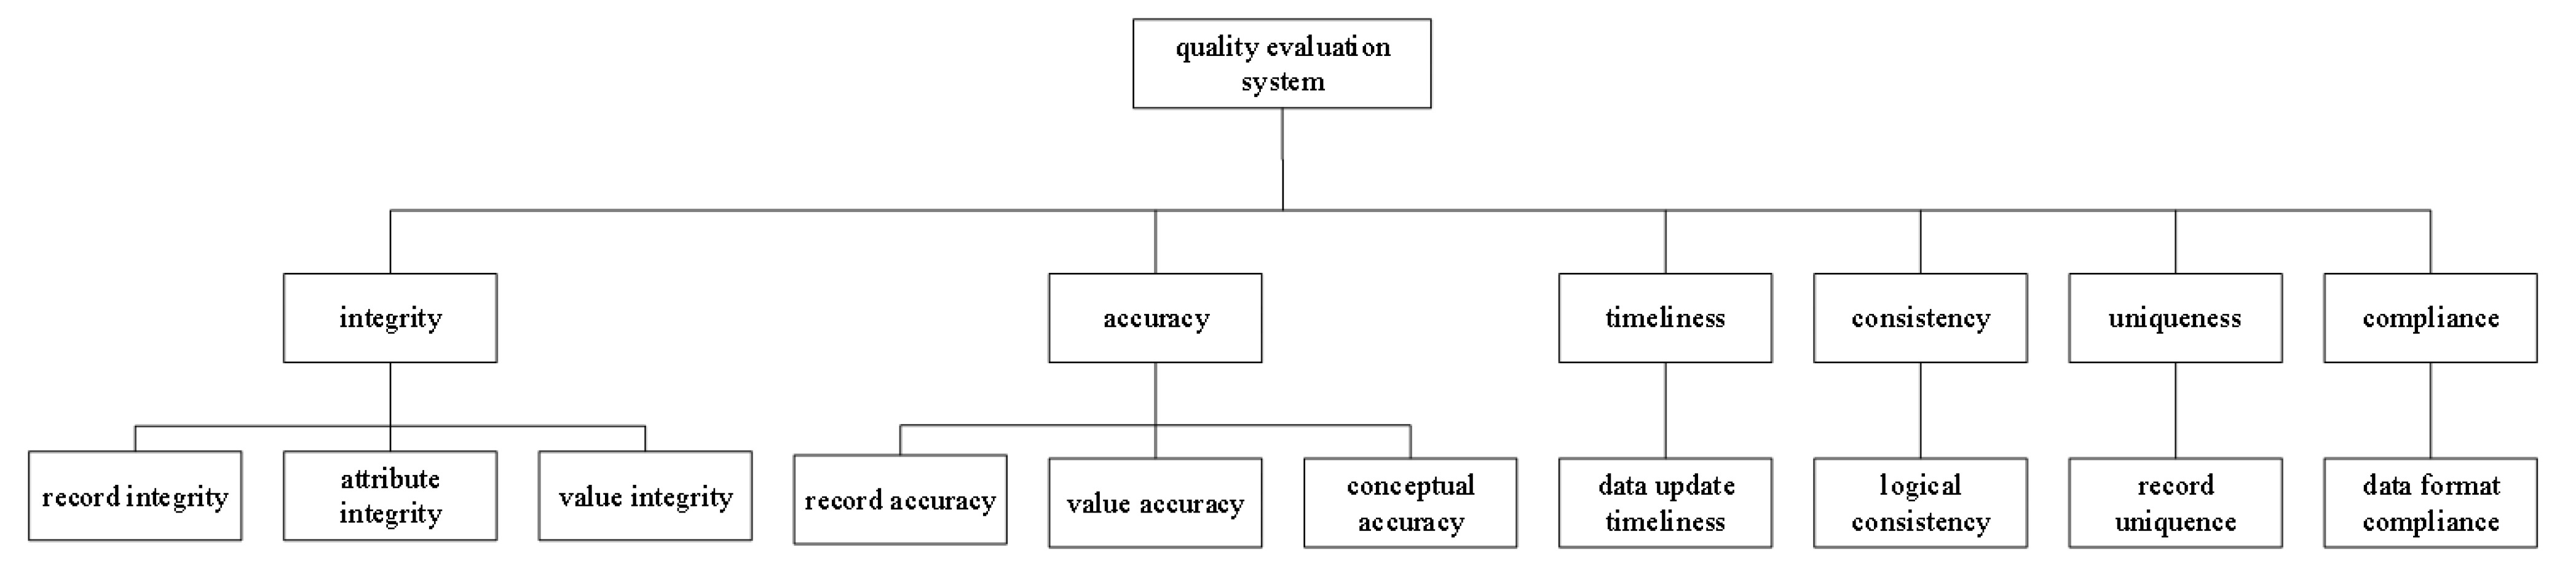
- We proposed a new system for constructing quality evaluation indicators by surveying the current status of data quality evaluation research. This system forms primary indicators according to completeness, accuracy, timeliness, consistency, uniqueness, and compliance. We used AHP to determine the weight among these indicators.
- We proposed a data quality evaluation method based on multiple linear regression (MLP) to objectively evaluate data quality. In addition, we employed et al. Shapley value for feature selection to reduce the complexity of the model and shorten the training time.
- By using customer-related table information from a specific financial institution as an example, we verified the feasibility and accuracy of the quality evaluation system and the quality evaluation model. Additionally, we found that the evaluation and processing of incremental customer form information could be automated.
2. Construction of Quality Evaluation Indicator System
- Quality evaluation focuses on each dataset as the target. Every department is responsible for managing multiple datasets [16]. These datasets are typically represented as information source tables.
- Data usability is the fundamental prerequisite for effective data utilization. The data resource centralization department can contribute by identifying factors that impede the basic usability of the data. These factors include empty data items, irregular formats, incomplete data, and other similar issues (Table 1).
- Data flexibility takes center stage as a crucial consideration. When evaluating the quality of customer data types, it is essential to consider its unique characteristics while maintaining a certain level of flexibility. For instance, empty fields may be the result of non-required fields [17].
2.1. Basic Attributes of Quality Evaluation
- Required fields: These fields must be filled in accordance with the business rules of each department or according to the specifications outlined in the data dictionary.
- Key fields: These fields serve as unique primary keys or facilitate associations with related data tables. Examples of such key fields include the identity card number, the unified social credit identifier, and other identification numbers or codes that act as primary keys in related associations.
2.2. Determination of Indicator Weights Based on the AHP
2.2.1. Single Scoring
2.2.2. Comprehensive Scoring
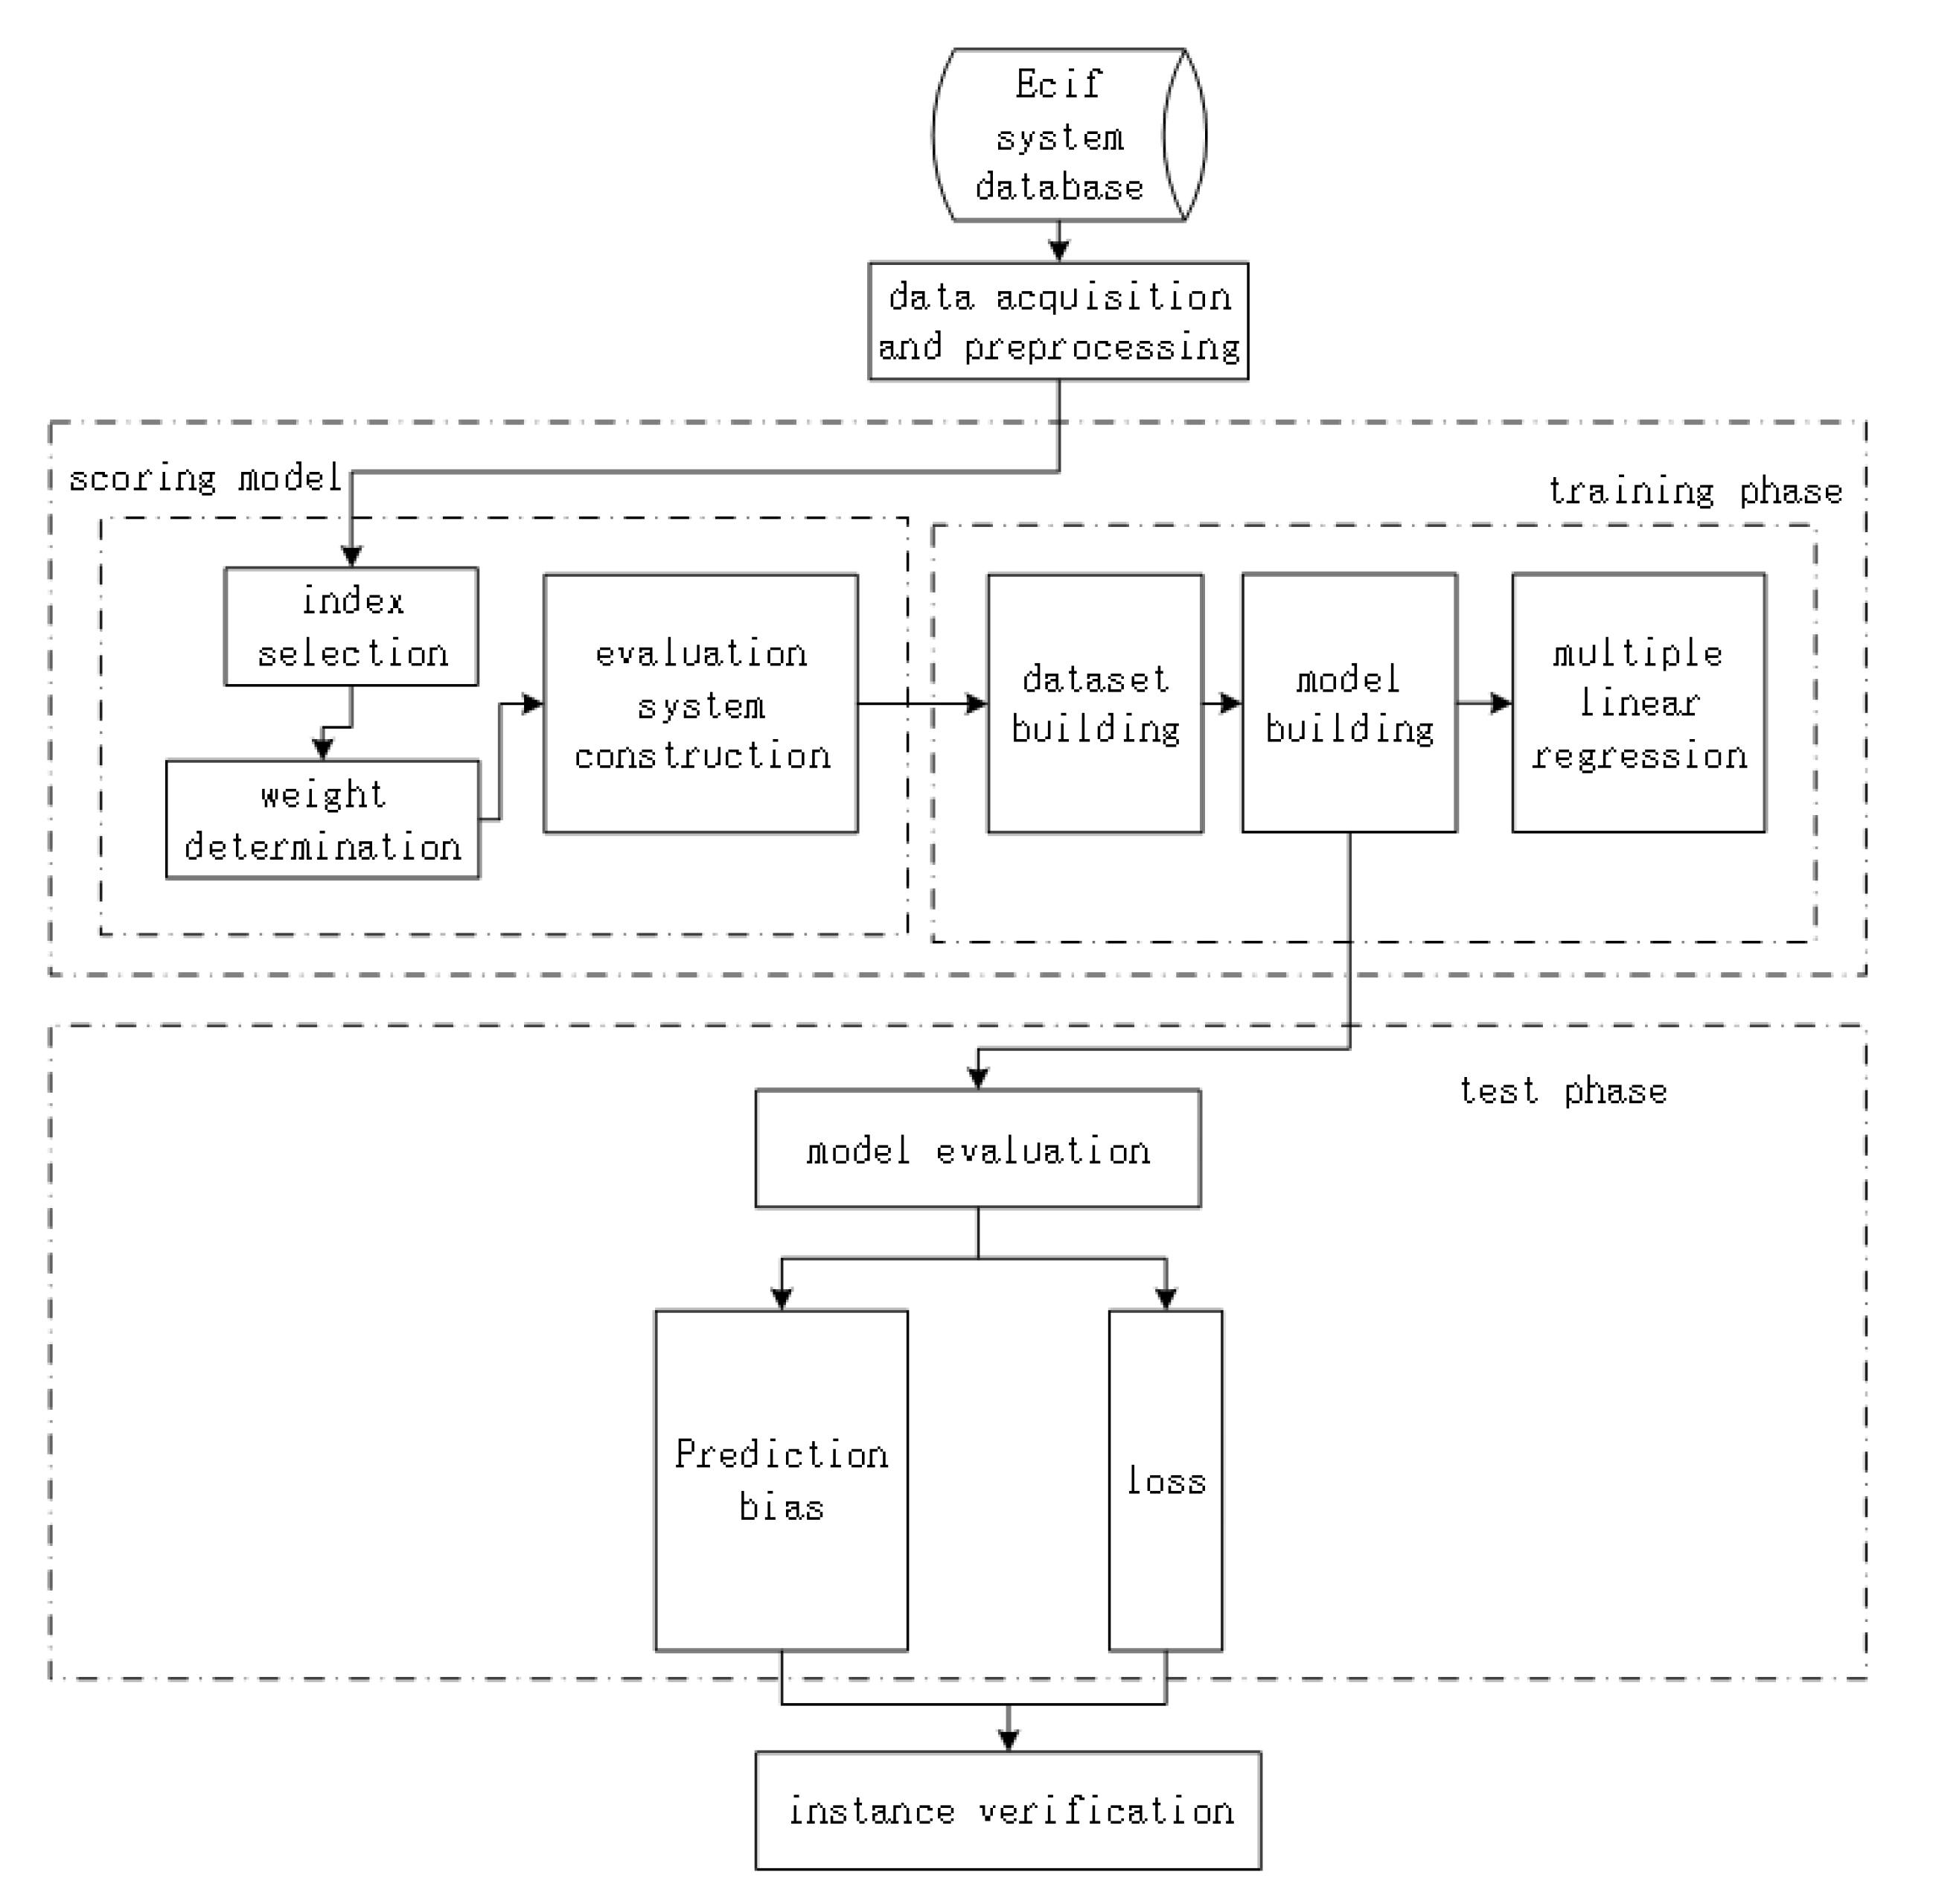
3. Construction of Quality Evaluation Model Based on Multiple Liner Regression
- Select relevant customer information data from the customer information database, and preprocess the data based on the proposed label generation algorithm.
- Extract quality evaluation indicators and associated data, constructing a quality evaluation indicator system suitable for machine learning models.
- Train and test the machine learning model to complete its construction.
- Evaluate the results using performance indicators.
3.1. Data Acquisition and Indicator Extraction
3.2. Label Generation Algorithm
3.3. Feature Selection Based on Shapley Value
- Population initialization: A set of feature subsets is randomly produced, marking the formation of the initial population.
- Fitness evaluation: A fitness function is implemented to assess the aptness of each entity, employing metrics like accuracy, F1 score, and so forth.
- Selection process: Individuals exhibiting higher fitness are chosen to serve as the base for the next-generation population as determined by the fitness function assessment results.
- Crossover procedure: Using a crossover operation, select individuals with superior fitness are randomly amalgamated to generate new offspring.
- Mutation procedure: To enhance the population’s diversity, random alterations are introduced to the new offspring through a mutation operation.
- Iteration: Steps 2–5 are reiterated until the predetermined stop conditions are satisfied.
3.4. Regression Model Building
4. Results
4.1. Quality Evaluation Indicator System
- Synthesizing the pair-wise comparison matrix (example: Table 5).
- Calculating the priority vector for a criterion such as experience (example: Table 5).
- Calculating the consistency ratio.
- Calculating .
- Calculating the consistency index, .
- Selecting appropriate value of the random consistency ratio from Table 5.
- Checking the consistency of the pair-wise comparison matrix to check whether the decision maker’s comparisons were consistent or not.
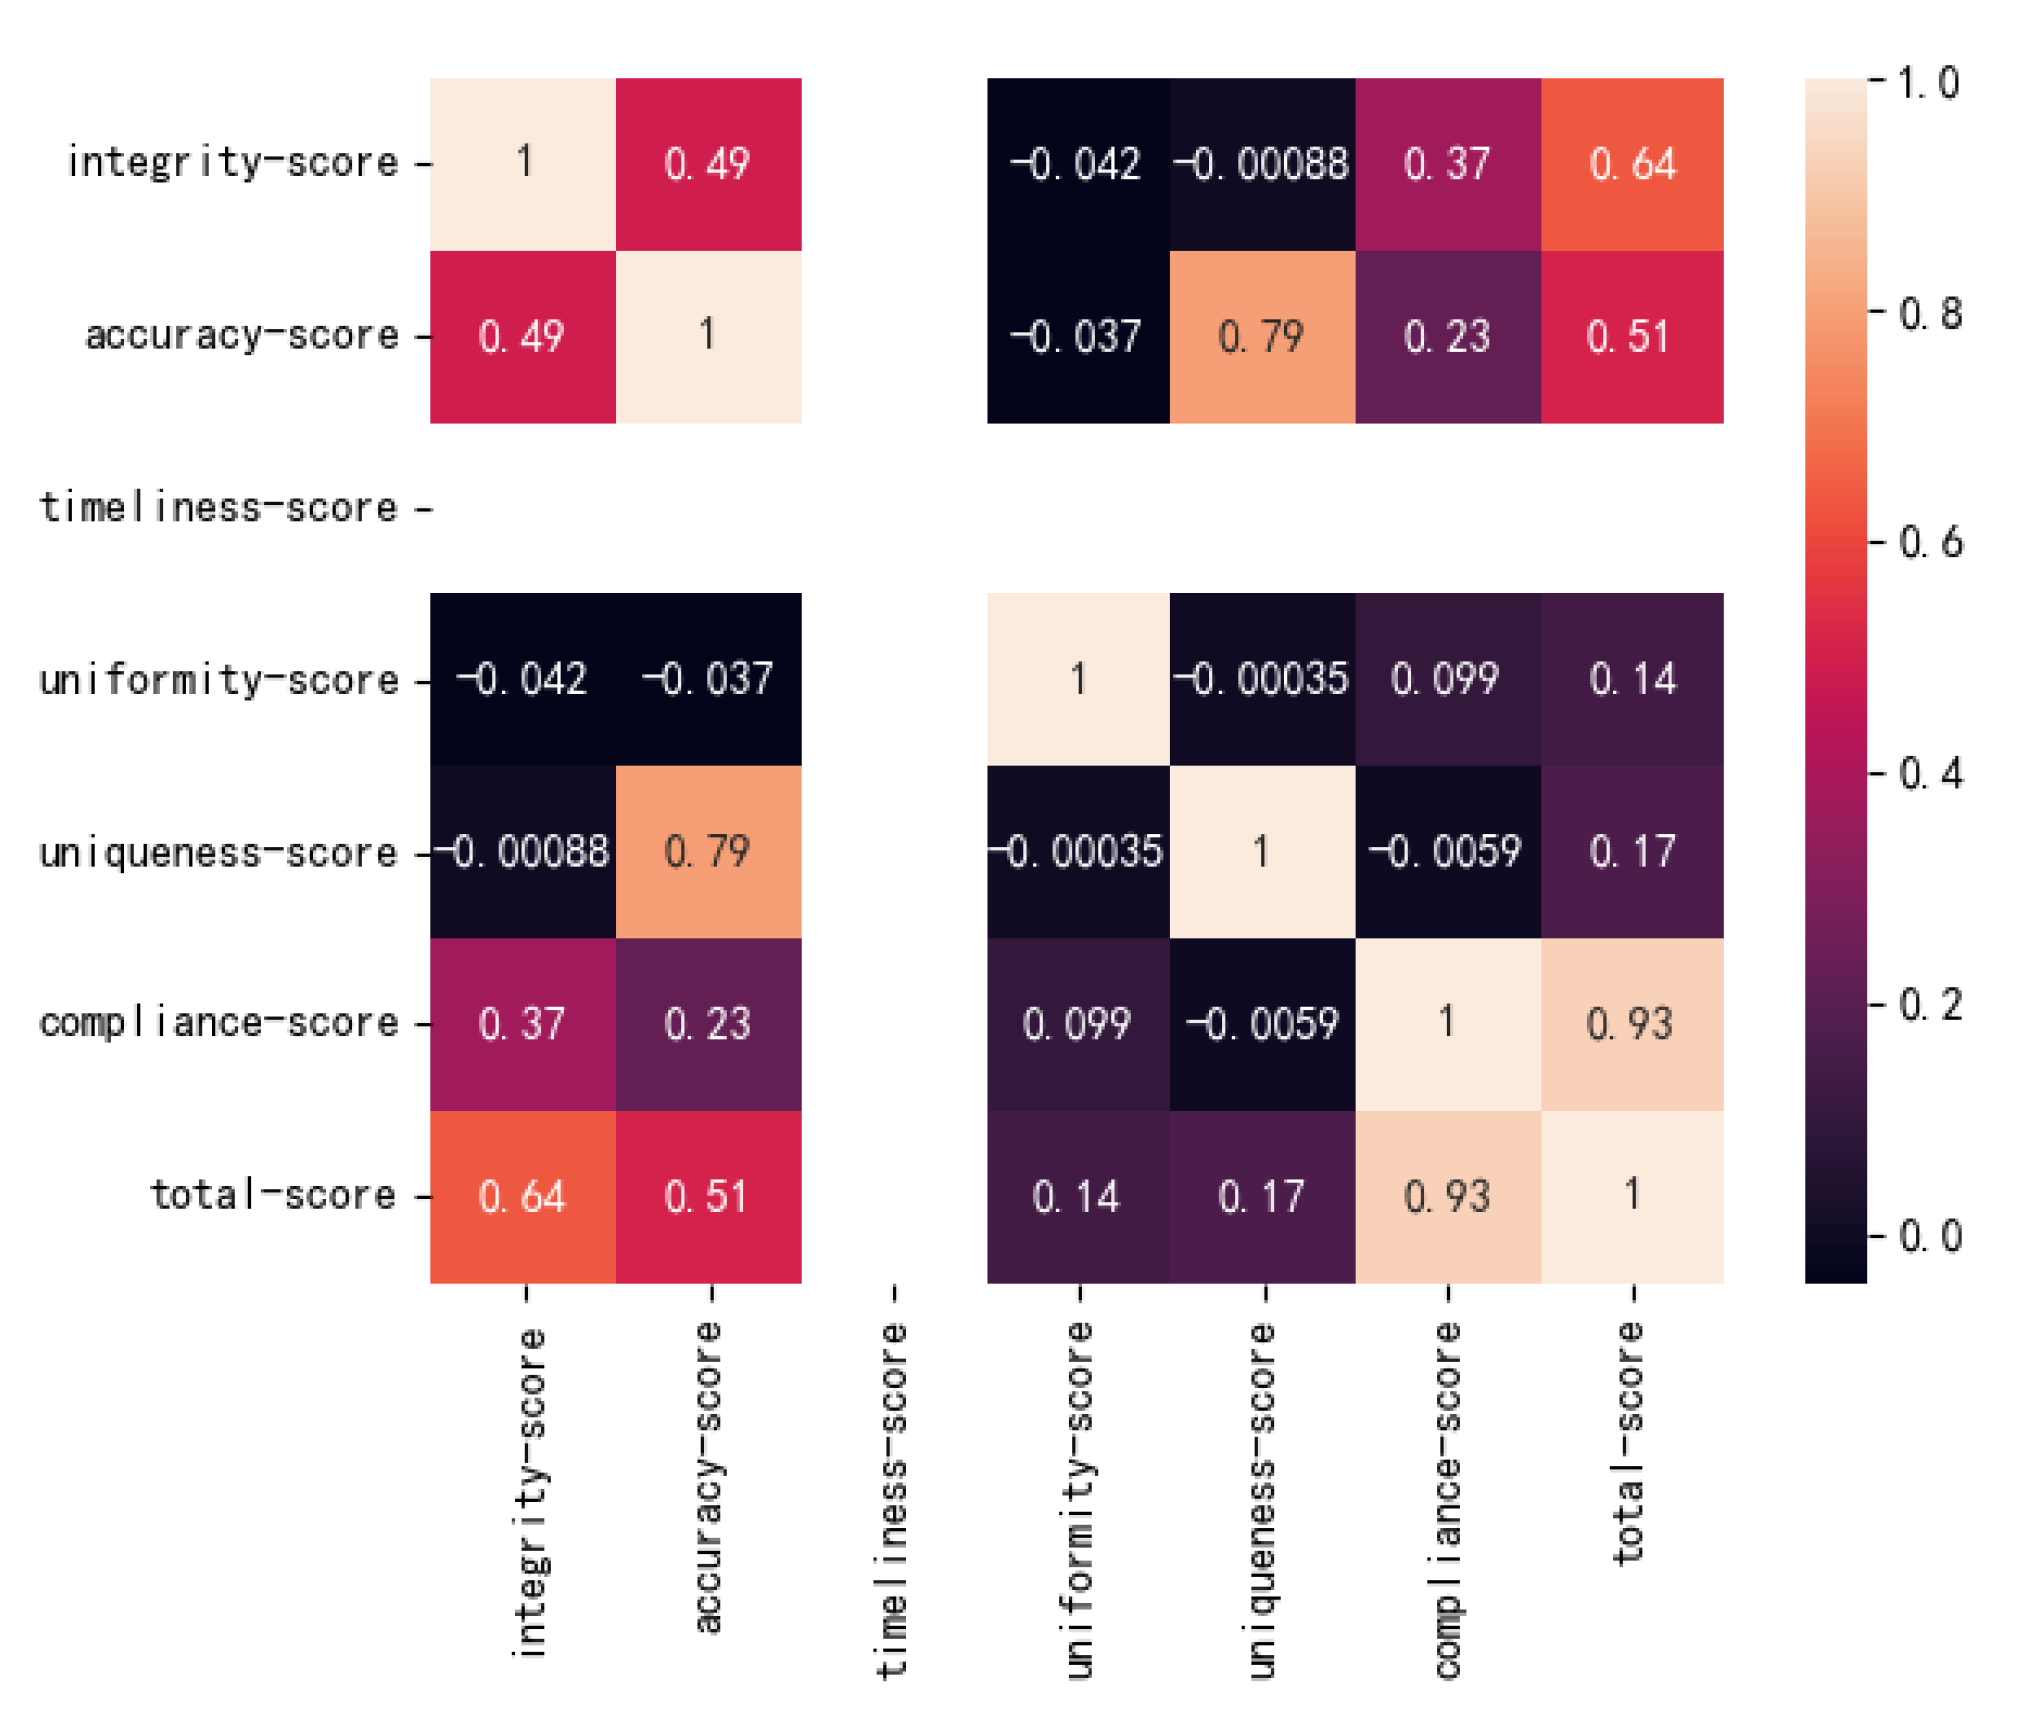
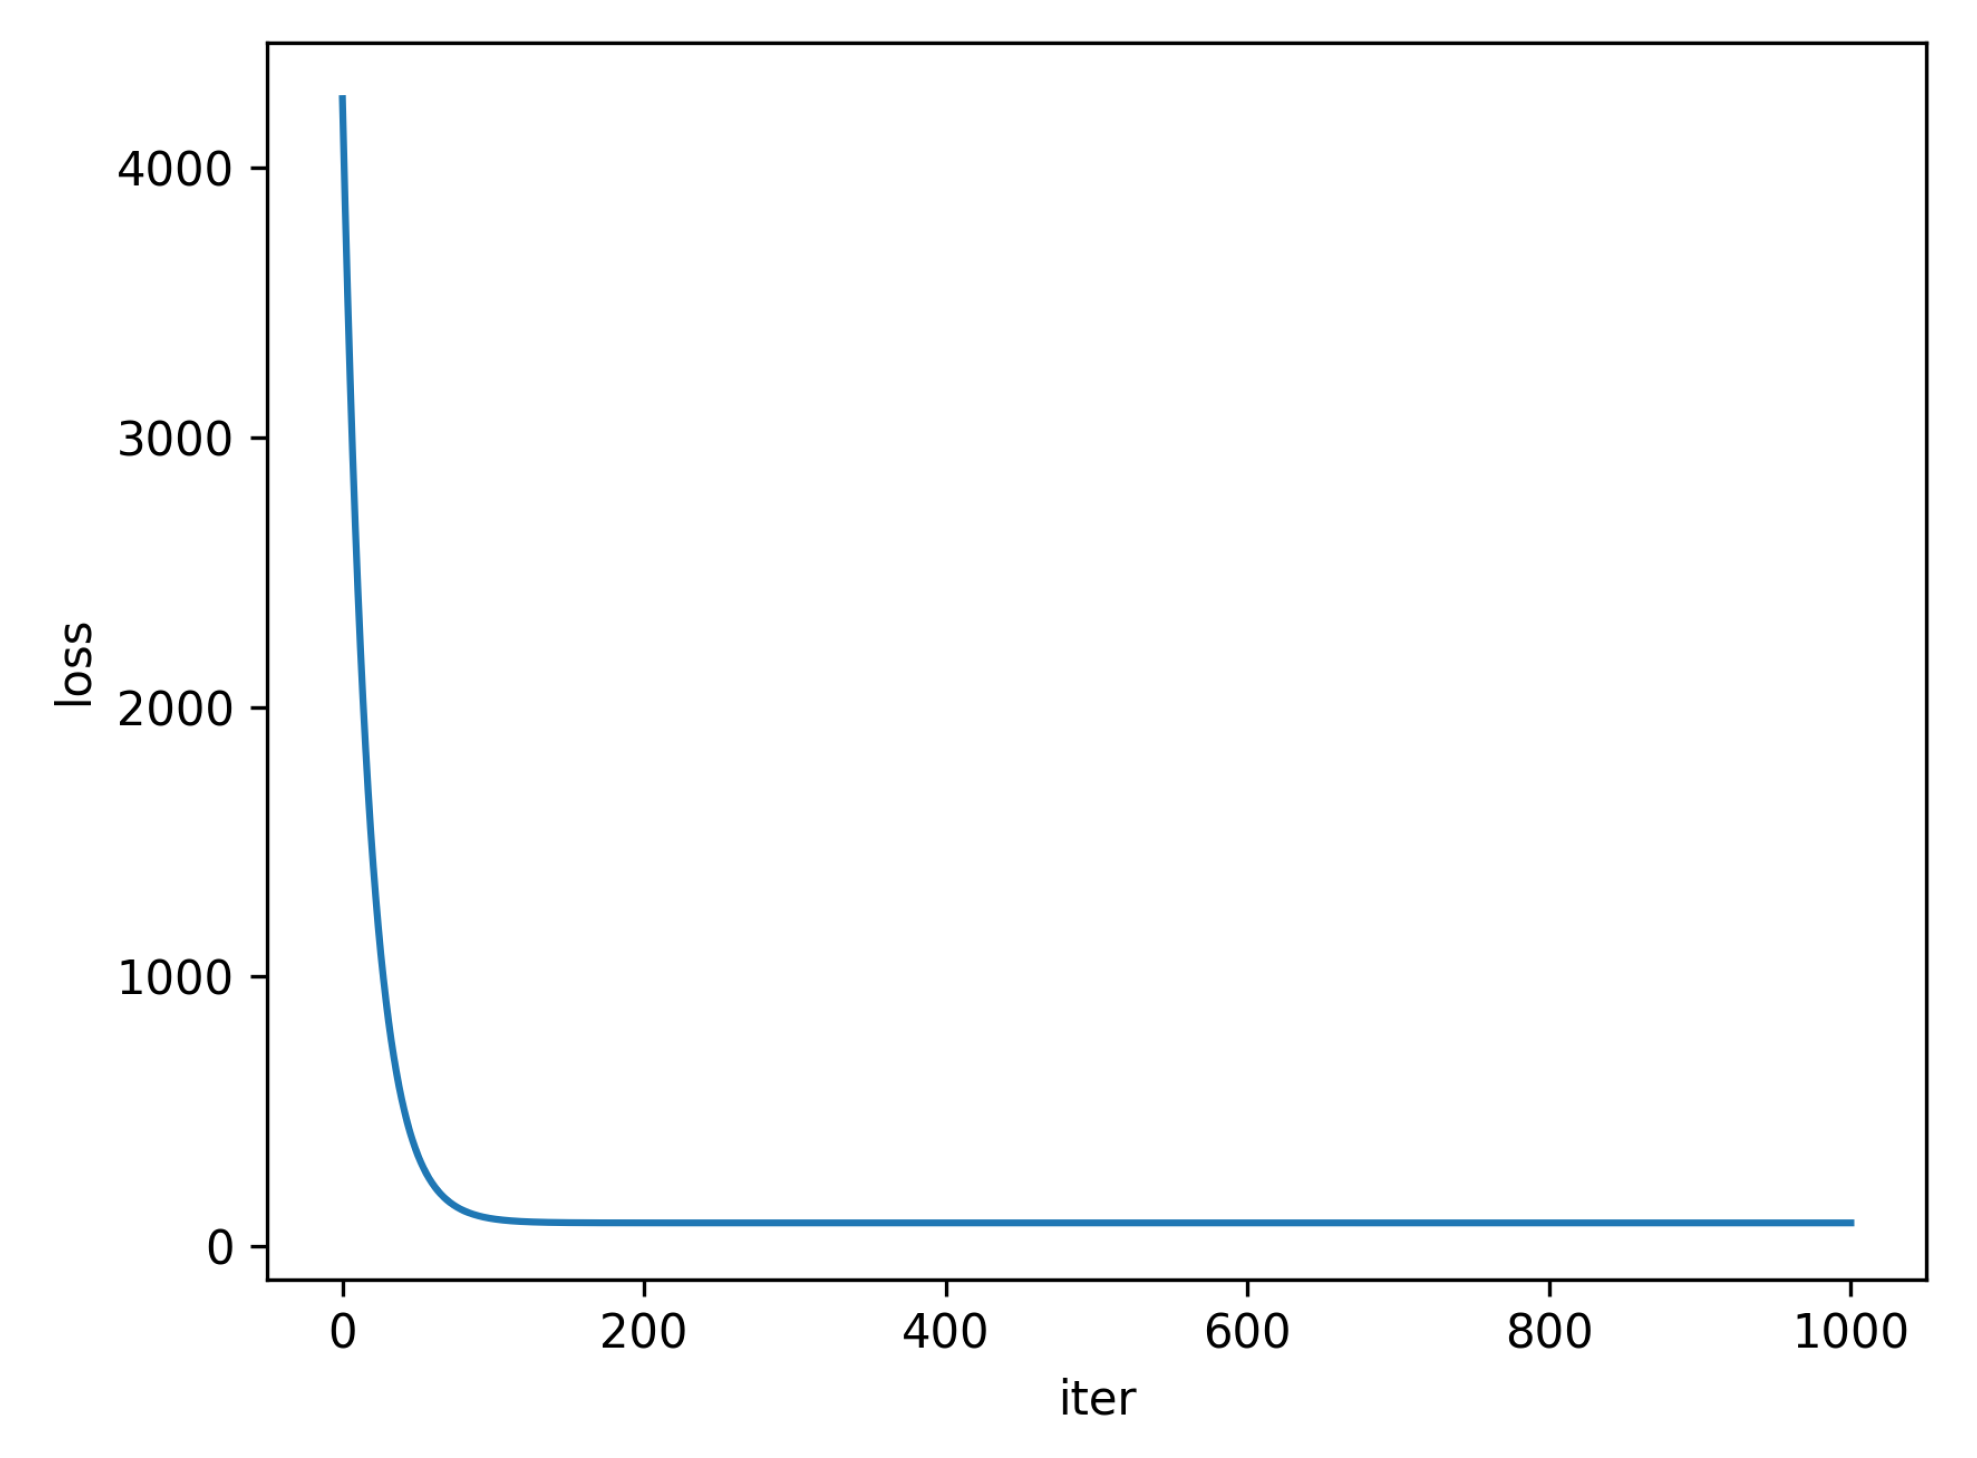
4.2. Multiple Linear Regression Quality Evaluation Model
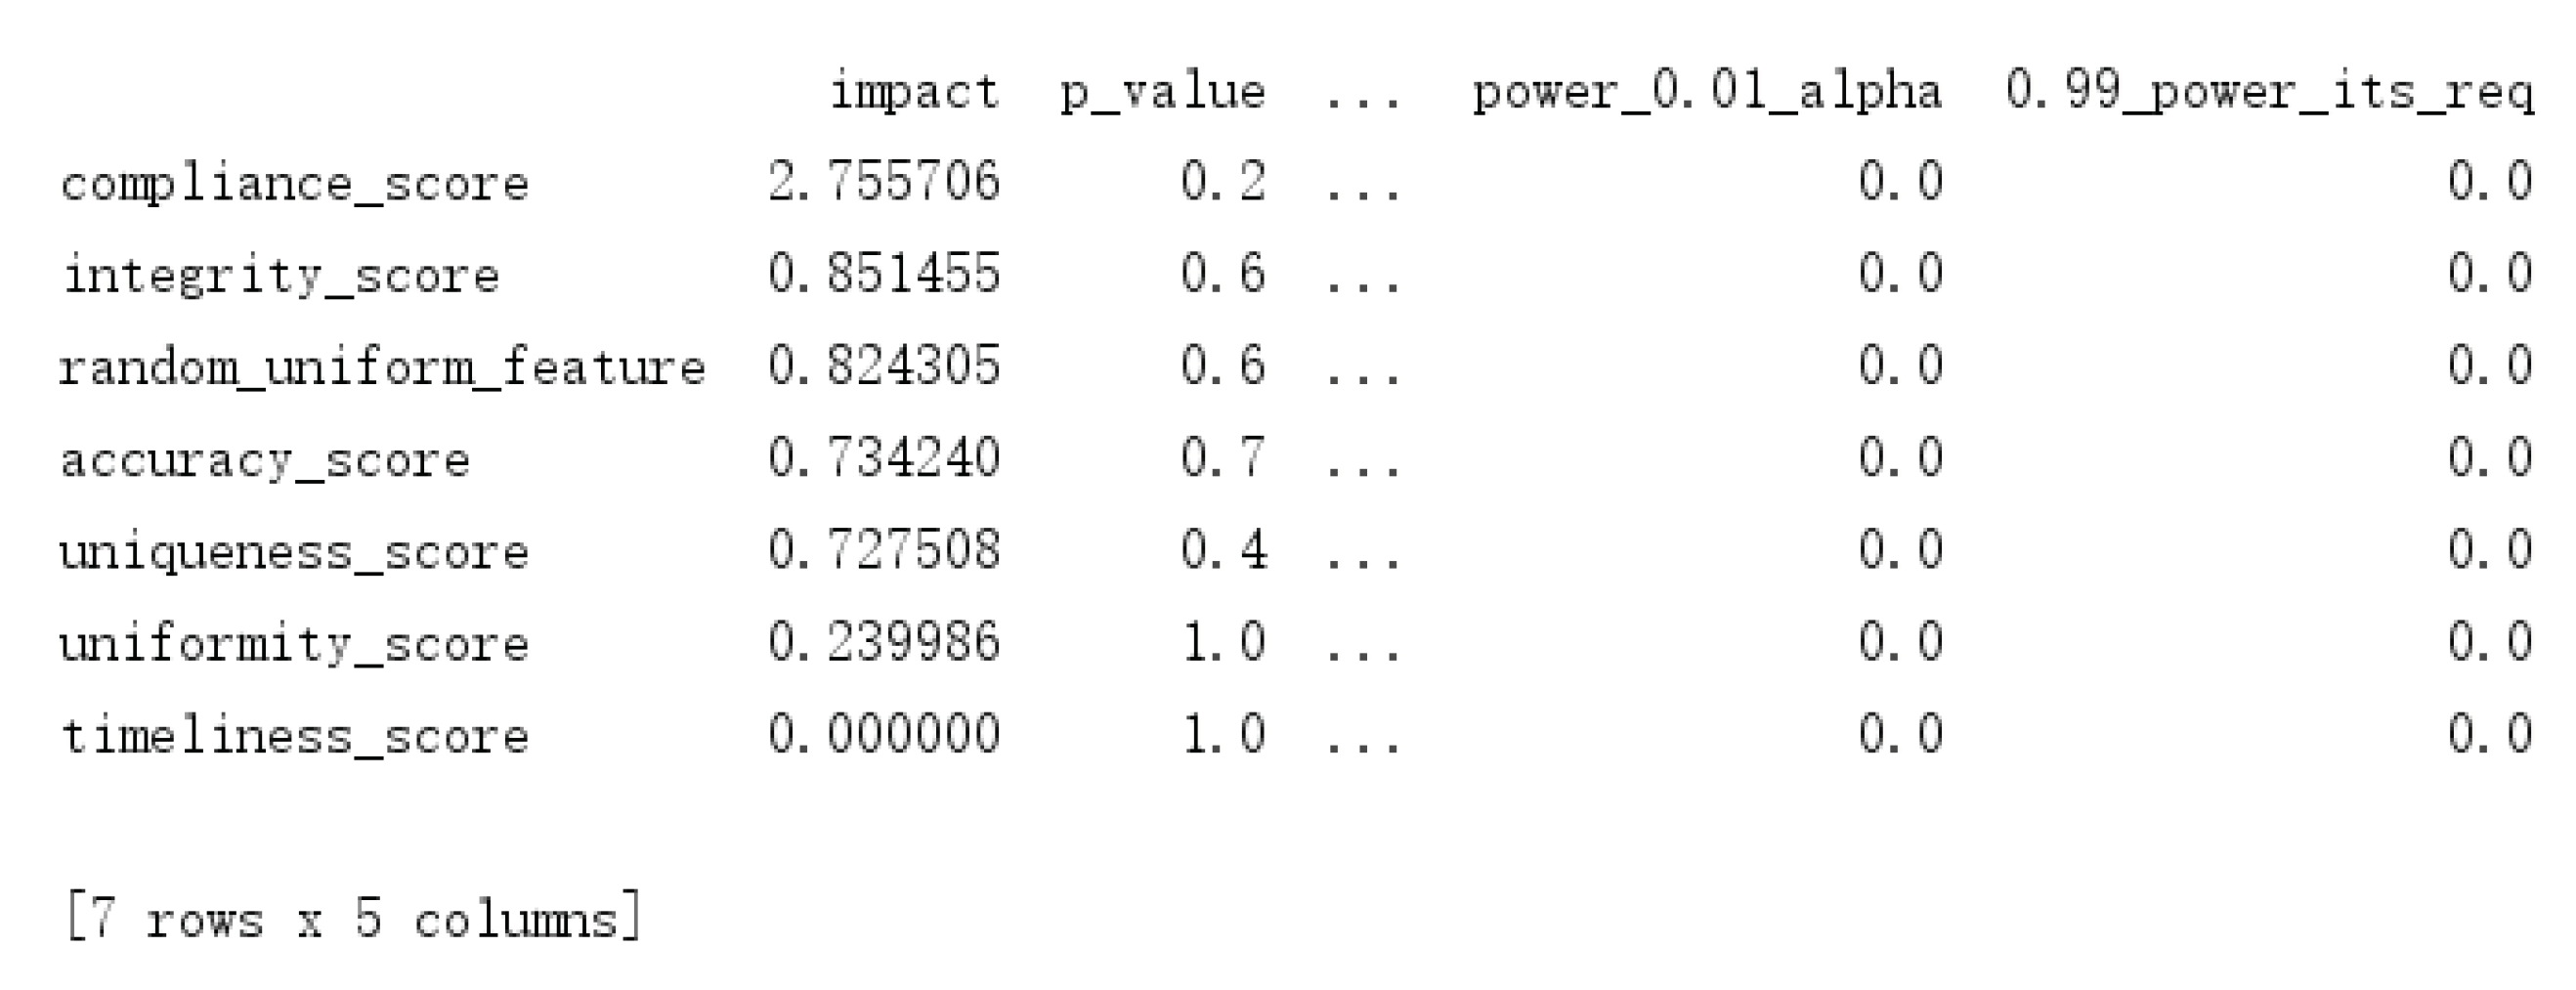
4.3. Feature Selection Based on Shapley Value
5. Conclusions
Author Contributions
Funding
Data Availability Statement
Conflicts of Interest
References
- Weber, K.; Otto, B.; Osterle, H. One Size Does Not Fit All—A Contingency Approach to Data Governance. J. Data Inf. Qual. 2009, 1, 4. [Google Scholar] [CrossRef]
- Begg, C.; Cairat, T. Exploring the SME quandary:data governance in practise in the small to medium-sized enterprise sector. Electron. J. Inf. Syst. Eval. 2012, 15, 3–13. [Google Scholar]
- Newman, D.; Logan, D. Governance is an essential building block for enterprise information management. Gart. Res. Stamford 2006, 13, 4. [Google Scholar]
- Niemi, E. Designing a data governance framework. In Proceedings of the IRIS Conference, Turku, Finland, 16–19 August 2011. [Google Scholar]
- Karkošková, S. Data governance model to enhance data quality in financial institutions. Inf. Syst. Manag. 2023, 40, 90–110. [Google Scholar] [CrossRef]
- Mcgilvray, D. Executing Data Quality Projects Ten Steps to Quality Data and Trusted Information; Elsevier: Amsterdam, The Netherlands, 2008; Volume 12, pp. 2–4. [Google Scholar]
- Omara, E.; Said, T.E.; Mousa, M. Employing neural networks for assessment of data quality with emphasis on data completeness. Int. J. Artif. Intell. Mach. Learn. 2011, 11, 21. [Google Scholar]
- Peltier, J.W.; Zahay, D.; Lehmann, D.R. Organizational learning and CRM success: A model for linking organizational practices, customer data quality, and performance. J. Interact. Mark. 2013, 27, 1–13. [Google Scholar] [CrossRef]
- Taleb, I.; Kassabi, H.; Serhani, M.A.; Dssouli, R.; Bouhaddioui, C. Big Data Quality: A Quality Dimensions Evaluation. Ubiquitous Intelligence and Computing. In Proceedings of the Advanced and Trusted Computing, Scalable Computing and Communications, Cloud and Big Data Computing, Internet of People, and Smart World Congress, Toulouse, France, 18–21 July 2016. [Google Scholar]
- Juddoo, S. Overview of data quality challenges in the context of Big Data. In Proceedings of the 2015 International Conference on Computing, Communication and Security (ICCCS), Pointe aux Piments, Mauritius, 4–5 December 2015; pp. 1–9. [Google Scholar]
- Madhikermi, M.; Kubler, S.; Robert, J.; Buda, A.; Främling, K. Data quality assessment of maintenance reporting procedures. Expert Syst. Appl. 2016, 63, 145–164. [Google Scholar] [CrossRef]
- Mashoufi, M.; Ayatollahi, H.; Khorasani-Zavareh, D.; Talebi Azad Boni, T. Data quality in health care: Main concepts and assessment methodologies. Methods Inf. Med. 2023, 62, 5–18. [Google Scholar] [CrossRef]
- Uzoka, F.M. AHP-based system for strategic evaluation of financial information. Inf. Knowl. Syst. Manag. 2005, 5, 49–61. [Google Scholar]
- Khan, A.W.; Khan, M.U.; Khan, J.A.; Ahmad, A.; Khan, K.; Zamir, M.; Kim, W.; Ijaz, M.F. Analyzing and evaluating critical challenges and practices for software vendor organizations to secure big data on cloud computing: An AHP-based systematic approach. IEEE Access 2021, 9, 107309–107332. [Google Scholar] [CrossRef]
- Alam, M.K. A systematic qualitative case study: Questions, data collection, NVivo analysis and saturation. Qual. Res. Organ. Manag. Int. J. 2021, 16, 1–31. [Google Scholar] [CrossRef]
- Gomes, V.C.F.; Queiroz, G.R.; Ferreira, K.R. An overview of platforms for big earth observation data management and analysis. Remote Sens. 2020, 12, 1253. [Google Scholar] [CrossRef]
- Liu, Y.; Wang, Y.; Xue, F.; Chen, J. A hybrid approach for supplier selection based on quality management system evaluation and grey relational analysis. J. Intell. Fuzzy Syst. 2021, 41, 1149–1159. [Google Scholar]
- Malik, S.; Tahir, M.; Sardaraz, M.; Alourani, A. A resource utilization prediction model for cloud data centers using evolutionary algorithms and machine learning techniques. Appl. Sci. 2022, 12, 2160. [Google Scholar] [CrossRef]
- Titus, B.D.; Brown, K.; Helmisaari, H.S.; Vanguelova, E.; Stupak, I.; Evans, A.; Clarke, N.; Guidi, C.; Bruckman, V.J.; Varnagiryte-Kabasinskiene, I.; et al. Sustainable forest biomass: A review of current residue harvesting guidelines. Energy Sustain. Soc. 2021, 11, 10. [Google Scholar] [CrossRef]
- Hou, Y.; Biljecki, F. A comprehensive framework for evaluating the quality of street view imagery. Int. J. Appl. Earth Obs. Geoinf. 2022, 115, 103094. [Google Scholar] [CrossRef]
- Sun, H.; Chen, Z. Interval neutrosophic hesitant fuzzy AHP method based on combined weights. J. Intell. Fuzzy Syst. 2021, 41, 8015–8028. [Google Scholar]
- Wang, Y.; Liu, Z.; Cai, C.; Xue, L.; Ma, Y.; Shen, H.; Chen, X.; Liu, L. Research on the optimization method of integrated energy system operation with multi-subject game. Energy 2022, 21, 123305. [Google Scholar] [CrossRef]
- Liu, J.; Huang, J.; Zhou, Y.; Li, X.; Ji, S.; Xiong, H.; Dou, D. From distributed machine learning to federated learning: A survey. Knowl. Inf. Syst. 2022, 64, 885–917. [Google Scholar] [CrossRef]
- Chen, H.; Covert, I.C.; Lundberg, S.M.; Lee, S.I. Algorithms to estimate Shapley value feature attributions. Nat. Mach. Intell. 2023, 5, 590–601. [Google Scholar] [CrossRef]
- Liu, L.; Li, Z.; Yang, J. An emergency plan evaluation model based on combined DEA and TOPSIS methods. J. Clean. Prod. 2021, 315, 62. [Google Scholar]
- Kitiyodom, P.; Chindapa, P. Development of an emergency response plan assessment model for hazardous chemical accidents in Thailand. J. Loss Prev. Process. Ind. 2021, 70, 307. [Google Scholar]
- Wen, C.; Yang, J.; Gan, L.; Pan, Y. Big data driven Internet of Things for credit evaluation and early warning in finance. Future Gener. Comput. Syst. 2021, 34, 295–307. [Google Scholar] [CrossRef]
- Liapis, C.M.; Kotsiantis, S. Energy Balance Forecasting: An Extensive Multivariate Regression Models Comparison. In Proceedings of the 12th Hellenic Conference on Artificial Intelligence, Corfu, Greece, 7–9 September 2022; pp. 1–7. [Google Scholar]
- Tiwari, P. Bank affection and customer retention: An empirical investigation of customer trust, satisfaction, loyalty. SN Bus. Econ. 2022, 2, 54. [Google Scholar] [CrossRef]


| Problem Situation | Description and Examples |
|---|---|
| field empty | Empty values appear in required fields such as gender, nationality, address, contact information, and certificate validity period |
| irregular format | The 18-digit format that does not meet the standard, such as ID number, etc. |
| consistency error | Formats that do not meet the standard, such as the ID number does not match the gender or the date of birth, etc. |
| timeliness error | The validity period of the certificate has “valid until less than the current date”, etc. |
| data record duplication | The same data are repeatedly recorded, and there is a situation of “multiple compilations for one household” |
| Question Type | Problem Statement |
|---|---|
| False | The data are not true, such as the ID number being non-existent |
| inconsistent information | The related information does not correspond, such as the ID number not corresponding to the name, or there being a situation where one ID number corresponds to multiple names |
| timing relationship error | The relative timing between data is not correct, such as the creation time of individual customers being later than the modification time |
| invalid data | Data records should not be valid relative to a certain period of time or a certain point in time; for example, the establishment time of the enterprise is later than the current time |
| Data Record | NO. | Customer Number | Customer Name | Gender |
|---|---|---|---|---|
| 1 | 1000103445 | 112803 | He Zhixiong | 2 |
| 2 | 1000103445 | 112803 | He Zhixiong | 2 |
| 3 | 1000103445 | 112803 | He Zhixiong | 2 |
| 4 | 1000083575 | 112803 | Zhu Hongyan | 1 |
| Indicator Number | Indicator Name | Scoring Formula and Instructions |
|---|---|---|
| integrity | ||
| record integrity | ||
| : the number of missing data items in the data table | ||
| : the total number of data items that should be recorded in the data table | ||
| attribute integrity | ||
| : the number of missing attributes in the data table | ||
| : the total number of attributes that should be recorded in the data table | ||
| value integrity | ||
| : missing required fields in the data table | ||
| : the total number of data items that should be required in the data table | ||
| accuracy | ||
| record accuracy | ||
| : the number of inaccurate data items recorded in the data table | ||
| : the total number of assigned data items in the data table | ||
| value accuracy | ||
| : number of data items in the data table with inaccurate values | ||
| : the total number of data items that should be recorded in the data table | ||
| conceptual accuracy | ||
| : the number of conceptually inaccurate data items in the data table | ||
| : the total number of data items that should be recorded in the data table | ||
| timeliness | ||
| data update timeliness | ||
| : the number of data items that are not updated in time in the data table | ||
| : the total number of data items that should be recorded in the data table | ||
| consistency | ||
| logical consistency | ||
| : the number of data items in the data table that do not satisfy the logic | ||
| : the total number of data items that should be recorded in the data table | ||
| uniqueness | ||
| record uniqueness | ||
| : the number of data items repeated in the data table | ||
| : the total number of assigned data items in the data table | ||
| compliance | ||
| data format compliance | ||
| : number of data items with non-compliant format in the data table | ||
| : the total number of assigned data items in the data table |
| Size of Matrix | 1 | 2 | 3 | 4 | 5 | 6 | 7 | 8 | 9 | 10 |
|---|---|---|---|---|---|---|---|---|---|---|
| Random consistency | 0 | 0 | 0.58 | 0.9 | 1.12 | 1.24 | 1.32 | 1.41 | 1.45 | 1.49 |
| Integrity | Accuracy | Timeliness | Consistency | Uniqueness | Compliance | ||
|---|---|---|---|---|---|---|---|
| integrity | 1 | 2 | 1/2 | 3 | 3 | 2 | 0.229 |
| accuracy | 1/2 | 1 | 1/3 | 2 | 2 | 1 | 0.133 |
| timeliness | 2 | 3 | 1 | 4 | 4 | 3 | 0.364 |
| consistency | 1/3 | 1/2 | 1/4 | 1 | 1 | 1 | 0.084 |
| uniqueness | 1/3 | 1/2 | 1/4 | 1 | 1 | 1 | 0.084 |
| compliance | 1/2 | 1 | 1/3 | 1 | 1 | 1 | 0.106 |
| , | |||||||
| Record Integrity | Attribute Integrity | Value Integrity | ||
|---|---|---|---|---|
| record integrity | 1 | 5 | 5 | 0.714 |
| attribute integrity | 1/5 | 1 | 1 | 0.143 |
| value integrity | 1/5 | 1 | 1 | 0.143 |
| , | ||||
| Logical Accuracy | Value Accuracy | Conceptual Accuracy | ||
|---|---|---|---|---|
| logical accuracy | 1 | 2 | 1/3 | 0.238 |
| value accuracy | 1/2 | 1 | 1/4 | 0.137 |
| conceptual accuracy | 3 | 4 | 1 | 0.625 |
| , | ||||
| Level 1 Indicators | Level 2 Indicators | ||||
|---|---|---|---|---|---|
| indicator number | indicator name | weights () | indicator number | indicator name | weights () |
| B1 | integrity | 0.229 | C11 | record integrity | 0.714 |
| C12 | attribute integrity | 0.143 | |||
| C13 | value integrity | 0.143 | |||
| B2 | accuracy | 0.133 | C21 | logical accuracy | 0.238 |
| C22 | value accuracy | 0.137 | |||
| C23 | conceptual accuracy | 0.625 | |||
| B3 | timeliness | 0.364 | C31 | data update timeliness | 1 |
| B4 | consistency | 0.084 | C41 | logical consistency | 1 |
| B5 | uniqueness | 0.084 | C51 | record uniqueness | 1 |
| B6 | compliance | 0.106 | C61 | format compliance | 1 |
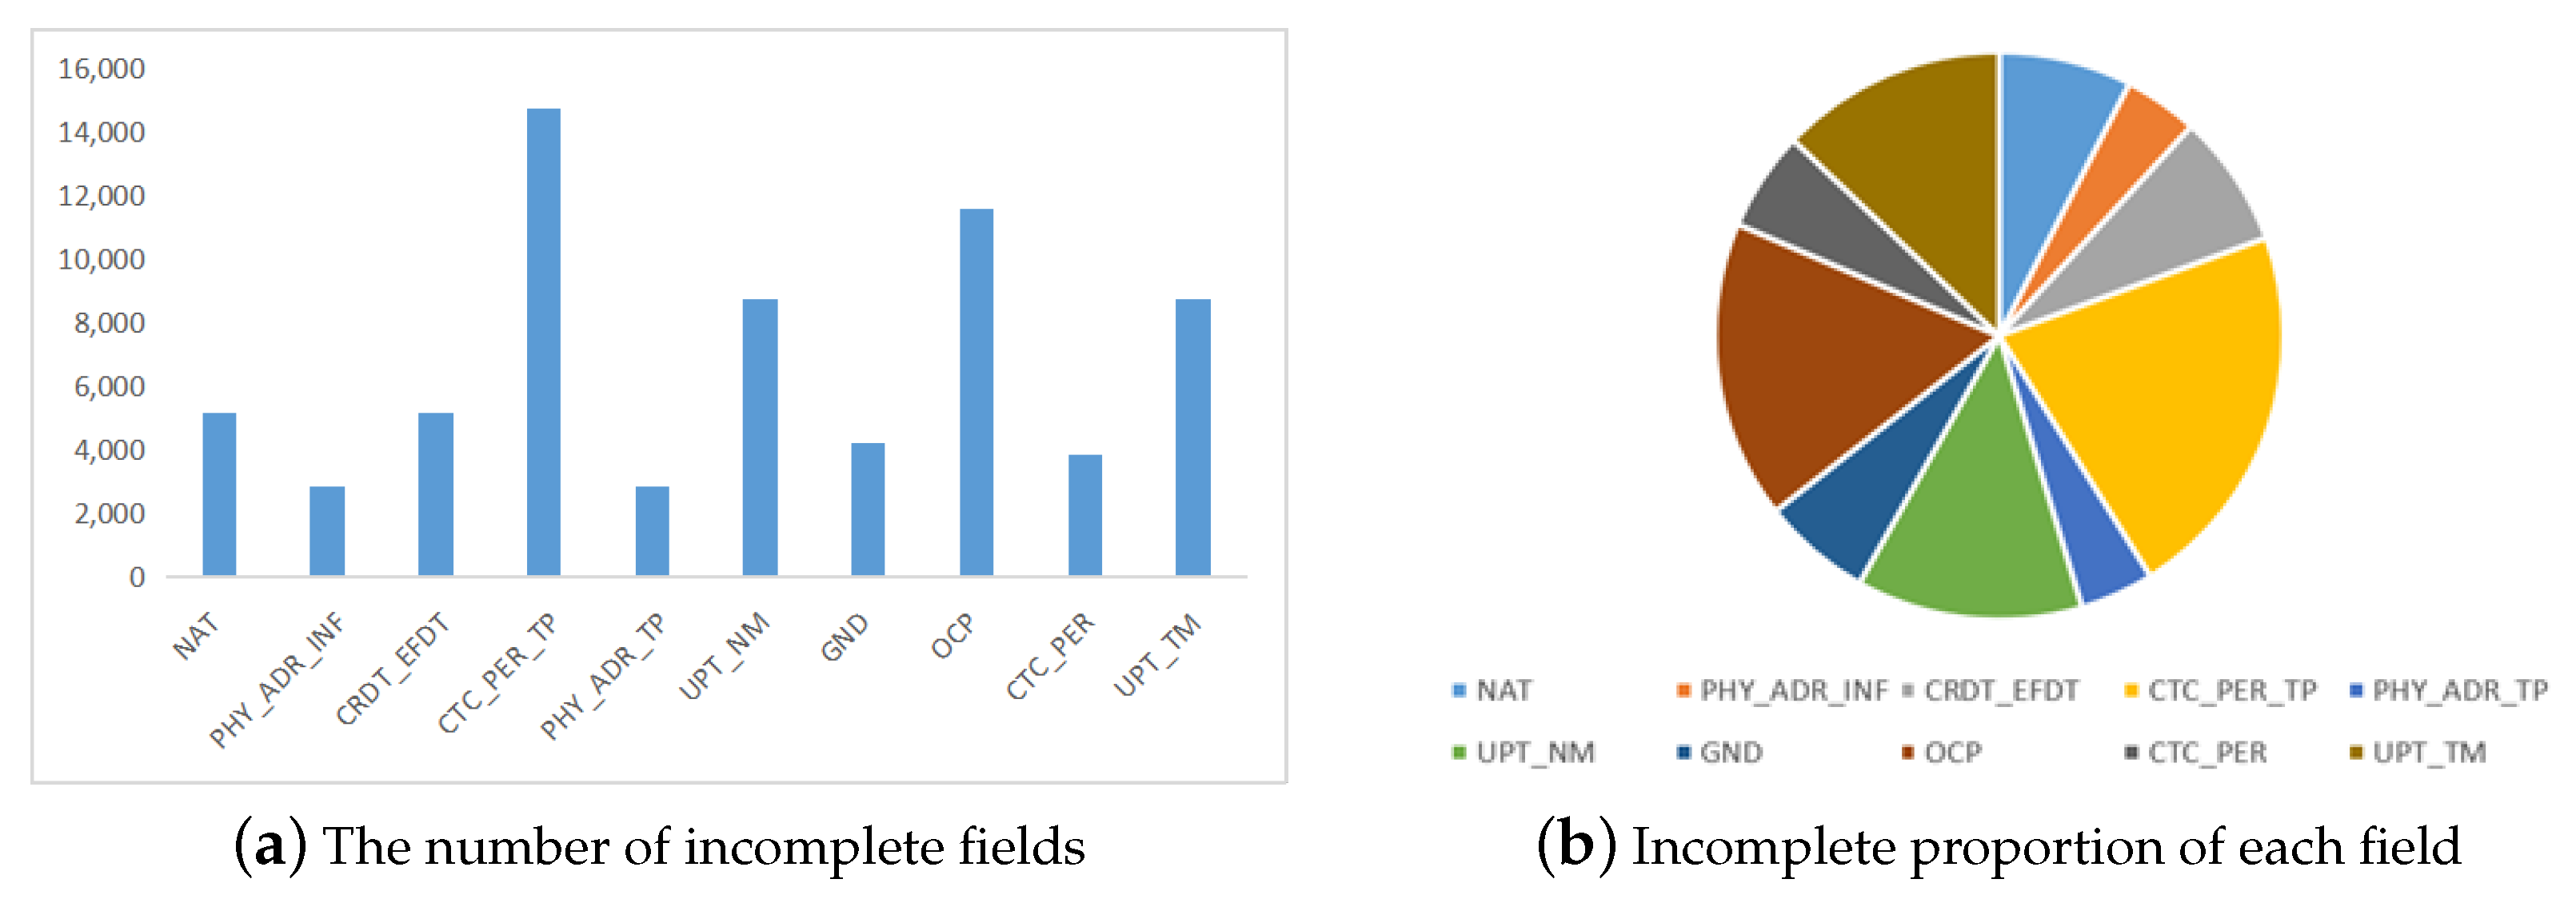
| Field Chinese Name | Field English Name | Is Empty | Null Ratio | Field Chinese Name | Field English Name | Is Empty | Null Ratio |
|---|---|---|---|---|---|---|---|
| name | CST_NM | 0 | 0 | type of certificate | CRDT_TP | 0 | 0 |
| ID number | CRDT_NO | 0 | 0 | gender | GND | 4225 | 28.72% |
| nationality | NAT | 5145 | 34.98% | profession | OCP | 11,549 | 78.52% |
| address | PHY_ADR_INF | 2859 | 19.44% | contact information | CTC_PER | 3850 | 26.17% |
| certificate validity period | CRDT_EFDT | 5156 | 35.05% | customer number | CST_ID | 0 | 0 |
| contact type | CTC_PER_TP | 14,709 | 1 | system source | SYS_SRC | 0 | 0 |
| address type | PHY_ADR_TP | 2858 | 19.43% | sales channels | SALE_SRC | 0 | 0 |
| updater | UPT_NM | 8744 | 59.45% | update time | UPT_TM | 8744 | 59.45% |
| founder | CRT_NM | 0 | 0 | creation time | CRT_TM | 0 | 0 |
| Index | Maximum Value | Minimum Value | Average | Standard Deviation |
|---|---|---|---|---|
| integrity | 87.59 | 74.4 | 80.9 | 0.25 |
| accuracy | 98.3 | 80.26 | 91.56 | 0.38 |
| timeliness | 100 | 100 | 100 | 0 |
| consistency | 9.09 | 0 | 1.15 | 0.23 |
| uniqueness | 100 | 52.61 | 99.94 | 1.26 |
| Compliance | 74.12 | 6.67 | 67.53 | 1.71 |
| Index | Maximum Value | Minimum Value | Average | Standard Deviation |
|---|---|---|---|---|
| integrity | 84.75 | 78.81 | 80.12 | 0.3 |
| accuracy | 97.83 | 82.1 | 92.33 | 0.28 |
| timeliness | 100 | 100 | 100 | 0 |
| consistency | 9.3 | 1.5 | 3.85 | 0.29 |
| uniqueness | 100 | 89.66 | 98.1 | 0.86 |
| Compliance | 50.66 | 11.5 | 43.21 | 2.03 |
| Table Name | Number of Samples | AHP Time Spent | Quality Review Score | Machine Learning Time Spent | Quality Review Score |
|---|---|---|---|---|---|
| MO_CI_PER_CONSIGNMENT | 10,000 | 600.02 s | 81.39 | 613.89 s | 83.55 |
| 20,000 | 1192.28 s | 83.21 | 650.25 s | 85.89 | |
| 30,000 | 1532.43 s | 80.91 | 690.11 s | 83.22 | |
| MO_CI_PER_CUSTOMER | 10,000 | 576.22 s | 84.43 | 623.14 s | 85.99 |
| 20,000 | 1312.34 s | 79.98 | 652.25 s | 82.01 | |
| 30,000 | 1701.36 s | 80.12 | 661.21 s | 80.56 |
Disclaimer/Publisher’s Note: The statements, opinions and data contained in all publications are solely those of the individual author(s) and contributor(s) and not of MDPI and/or the editor(s). MDPI and/or the editor(s) disclaim responsibility for any injury to people or property resulting from any ideas, methods, instructions or products referred to in the content. |
© 2023 by the authors. Licensee MDPI, Basel, Switzerland. This article is an open access article distributed under the terms and conditions of the Creative Commons Attribution (CC BY) license (https://creativecommons.org/licenses/by/4.0/).
Share and Cite
Li, M.; Liu, J.; Yang, Y. Financial Data Quality Evaluation Method Based on Multiple Linear Regression. Future Internet 2023, 15, 338. https://doi.org/10.3390/fi15100338
Li M, Liu J, Yang Y. Financial Data Quality Evaluation Method Based on Multiple Linear Regression. Future Internet. 2023; 15(10):338. https://doi.org/10.3390/fi15100338
Chicago/Turabian StyleLi, Meng, Jiqiang Liu, and Yeping Yang. 2023. "Financial Data Quality Evaluation Method Based on Multiple Linear Regression" Future Internet 15, no. 10: 338. https://doi.org/10.3390/fi15100338
APA StyleLi, M., Liu, J., & Yang, Y. (2023). Financial Data Quality Evaluation Method Based on Multiple Linear Regression. Future Internet, 15(10), 338. https://doi.org/10.3390/fi15100338