Article

Data-Driven Safe Deliveries: The Synergy of IoT and Machine Learning in Shared Mobility

Department of Computer Science and Engineering, American University of Sharjah, Sharjah P.O. Box 26666, United Arab Emirates
*
Author to whom correspondence should be addressed.
Future Internet 2023, 15(10), 333; https://doi.org/10.3390/fi15100333
Submission received: 1 September 2023 / Revised: 25 September 2023 / Accepted: 3 October 2023 / Published: 10 October 2023

Abstract

:
Shared mobility is one of the smart city applications in which traditional individually owned vehicles are transformed into shared and distributed ownership. Ensuring the safety of both drivers and riders is a fundamental requirement in shared mobility. This work aims to design and implement an adequate framework for shared mobility within the context of a smart city. The characteristics of shared mobility are identified, leading to the proposal of an effective solution for real-time data collection, tracking, and automated decisions focusing on safety. Driver and rider safety is considered by identifying dangerous driving behaviors and the prompt response to accidents. Furthermore, a trip log is recorded to identify the reasons behind the accident. A prototype implementation is presented to validate the proposed framework for a delivery service using motorbikes. The results demonstrate the scalability of the proposed design and the integration of the overall system to enhance the rider’s safety using machine learning techniques. The machine learning approach identifies dangerous driving behaviors with an accuracy of 91.59% using the decision tree approach when compared against the support vector machine and K-nearest neighbor approaches.

1. Introduction

Population growth around the globe introduced new transportation challenges. Shared mobility involves the convergence of novel digital platforms and innovative solutions, marking a departure from traditional individual ownership toward communal resource utilization. This transition is particularly evident in the transportation industry, where the quick uptake of shared mobility platforms has led to significant economic growth. As highlighted in [1], the sharing economy’s prevalence within the mobility sector is projected to experience a compounded annual growth rate of 23% from 2013 to 2025. These platforms leverage technology to streamline the sharing of transportation resources.
The Internet of Things (IoT) plays a significant role in generating large amounts of data through sensors and allowing things such as shared mobility to be connected. Furthermore, cloud computing platforms support IoT in data collection and creating software services for data analysis.
In shared mobility systems, individuals or companies can offer their vehicles for others to use. The shared mobility activities include dynamic systems in which drivers and riders are matched through automated processes facilitated by shared mobility services.
This work implements an on-demand smart shared transportation system. The smart aspect of the proposed system lies in the shared mobility vehicle’s capacity to share its knowledge and make automated decisions, specifically during emergencies. This is becoming more feasible due to the advancements in the field of IoT and communication protocols. This paper aims to propose an adequate reference model that enables mobility sharing, monitors the riders’ behavior, and provides the necessary assistance when needed. Moreover, shared mobility systems require real-time decision making in response to situations such as accident detection, safety hazards, and theft.
A case study is implemented focusing on delivery services that use motorbikes as a shared mobility. The implemented system’s objective is to track and monitor the motorcycle’s condition and the driver’s behavior throughout the delivery trip. This was accomplished by considering the analyzed risk level, which was obtained from analyzing the collected data: the bike’s acceleration, rotation, distance from nearby obstacles, impact level, and location coordinates. Therefore, the system ensures precise monitoring of driving patterns, a safe journey supported by safety procedures, and accurate accident documentation before and after the incident. The implemented case study contains a frontend interface that shows the statistics related to drivers’ behavior, tendencies for rash driving, and accidents. This allows administrators to take early preventive action toward that driver. This shall reduce the number of accidents occurring and enhance the delivery service and customer satisfaction. To the best of the authors’ knowledge, current systems in the literature do not present a holistic view of shared mobility systems but rather look into specific challenges in the decision component with the integration of technology. Hence, this paper extends the proposed approaches in the literature with the following main contributions:
  • Design and develop a shared mobility framework.
  • Design and develop the hardware and software components that can be added to a shared mobility vehicle.
  • Design and implement a practical solution for shared mobility for delivery service case study that continuously records the riding behavior and detects accidents.
  • Implement a machine learning model that detects the dangerous behavior of the rider.
  • Evaluate the accuracy of the detected dangerous behavior of the riders.
The rest of the paper is organized as follows: a literature survey is presented in Section 2, the proposed shared mobility framework is presented in Section 3, a case study prototype implementation and validation are discussed in Section 4, the proposed architecture is evaluated and discussed in Section 5, and a conclusion is presented in Section 6.

2. Literature Review

Ride sharing involves the practice of offering drivers the chance to add extra passengers to existing car trips. Initially, ride-sharing platforms were websites used as public noticeboards where users could freely post and search for excursions, which were often grouped using keywords like cities. Through these tools, individuals might get in touch with one another and spontaneously plan collaborative trips [2]. These online platforms improved over time, gradually increasing the effectiveness of setting up carpooling arrangements by introducing a booking-based system for facilitating connections and coordinating shared journeys [3]. To facilitate the seamless connection between drivers and passengers, studies on ride-sharing algorithms focus on optimizing the count of driver–rider pairs to the maximum extent [4], minimizing the overall distance or travel time for drivers [5,6,7], or reducing the overall detour duration [8,9]. A recent study [10] has proposed a real-time ride-sharing system with dynamic temporal segmentation and anticipation-based migration. The framework showed improved commuter waiting times by up to 65% and raised frequencies of successful matches by 136.11% through proper parameter tweaking using formal modeling and practical methods.
Another application of shared mobility is micro-mobility services. Micro-mobility refers to the provision of mobility services via a fleet of small, low-speed vehicles (primarily bikes and e-scooters) for personal transportation in urban areas as an alternative to ride hailing, public transportation, or walking, where vehicles can be accessed by one person at a time and charged at a usage rate. Urban areas have the highest concentration of bike-sharing systems, which let people use traditional or electric bicycles whenever they need them from a network of dock-based stations or for short trips in places with good connectivity and a density of free-floating destinations based on GPS and mobile apps [1]. Studies on micro-mobility systems mainly focused on three areas: the difficulty in distributing bikes [11,12], the planning of vehicle routes [13,14], and prediction of bike-sharing demands [15,16]. To address the issue of bike-sharing distribution, [12] introduced a model based on an adaptive capacity-constrained K-centers clustering algorithm and mixed-integer nonlinear programming. The study [14] introduced a comprehensive framework employing reinforcement learning to address the vehicle routing problem. To reallocate resources for bike-sharing demands, [16] suggested a hierarchical model for predicting the number of rents/returns of each bike.
Due to the emergence of these shared mobility platforms among users, communities, and urban landscapes, safety issues around their use should be highly considered. The safety of passengers becomes a vital concern as people depend more and more on shared mobility services choices. Ensuring the secure operation of shared mobility systems mainly depends on monitoring the behavior of road users, especially bike and scooter riders, and minimizing the vulnerabilities they are exposed to on the road [17]. Specifically, most studies on ensuring bike/scooter rider safety focused on the use of smart helmets [18,19,20,21,22] or smart bikes [23,24,25] along with mobile applications [19,23,24,25] or cloud-based databases [22,25].
In the study [18], a helmet-integrated control system was presented with the goal of improving biker safety and lowering accidents, especially those with serious consequences. The proposed system enforced mandatory helmet wearing via a Radio-Frequency (RF) transmitter and receiver setup, ensuring compliance with the legal requirement of wearing a helmet. In [19], a smart helmet was implemented to prevent bike accidents caused by alcohol consumption and lack of helmet usage. Utilizing gas, infrared, vibration, and MEMS sensors, the proposed prototype detected alcohol levels, helmet usage, vehicle load, reckless driving, and accidents. The prototype included a PIC microcontroller, LCD display, and Android application, sending accident information via GPS to hospitals and providing alerts to riders in case of non-compliance. Similarly, [20] used gas sensors and infrared sensors along with a GSM/GPRS module to warn medical staff in emergency situations. The study [21] proposed a helmet-based system using a PIC microcontroller. The system used a force-sensitive resistor to detect helmet wearing, an activated buzzer for helmet reminders, and an LED that flashes when the speed sensor detects exceeding speed limits. The study in [23] proposed a smart bike system that incorporated an Android application on the smartphone for data transmission through the 4G network between the app and a cloud-based real-time database and a microcontroller for communication via Bluetooth 4.0 Low Energy (BLE) between sensors and the phone. The study used ultrasonic sensors to detect nearby vehicles and an inertial measurement unit to measure acceleration and angular velocities. A smart bike architecture, proposed by [24], integrated a microcontroller, an accelerometer/gyroscope module to monitor bike movements, and a GSM/GPRS module to collect the bike’s location and send it over the cellular network to emergency contacts. The study in [25] used a similar system along with the use of MQTT protocol to transmit the collected data to a cloud-based database.
Several machine-learning approaches were used in the literature [26,27,28] to analyze sensor-collected data patterns in driving behavior that affect safety. An Artificial Neural Network (ANN) algorithm is proposed in [26] for detecting abnormal movements among motorcyclists. The study utilized smartphone accelerometer and gyroscopes sensors data. The ANN algorithm processed these collected data to make decisions. The system is trained to identify nine distinct types of movements, and it achieved detection with varying accuracies. On average, the ANN demonstrated an accuracy rate of 96.2%. The embedded sensors of smartphones are also utilized in [27] to identify four distinct driving activities among motorcyclists. The study evaluated various classifiers, with the random forest (RF) classifier achieving the highest accuracy of 86.51%.
Another system that deploys the random forest classifier based on mobile phone sensors data is introduced in [28]. This system, named the Vehicle mode-driving Activity Detection System, comprises two primary modules. The Vehicle mode Detection Module (VDM) is designed to determine the user’s current mode of transportation (such as walking, biking, motorcycling, driving a car, or riding a bus) based on the smartphone’s accelerometer input. The second module, referred to as the Activity Detection Module (ADM), is dedicated to recognizing four core driving activities by analyzing data from the smartphone’s accelerometer, gyroscope, and magnetometer sensors. The system managed to achieve an average accuracy of 98.33% in identifying vehicle modes and an average accuracy of 98.95% in identifying the motorist movements.
This literature review provides a broad overview of the transformative effects of shared mobility on transportation systems, focusing on the shift away from traditional ownership paradigms and toward cooperative resource utilization [1]. The growth of ride-sharing services and other shared mobility platforms has sparked the creation of sophisticated algorithms that optimize interactions between drivers and passengers and boost the effectiveness of shared travel [2,3,4,5,6,7,8,9,10]. Research has not only focused on mobility sharing effects on urban transportation but also on distribution techniques, route optimization, and precise demand forecasting [11,12,13,14,15,16]. Safety concerns sparked creative solutions, such as smart helmets, smart bikes, and mobile applications intended to protect road users, as these platforms have grown in popularity [17,18,19,20,21,22,23,24]. In addition, machine-learning techniques have been used to identify accidents and categorize traffic irregularities using sensor-collected data [26,27,28]. These results highlight the complex interactions between shared mobility, technological development, and safety improvements in modern transportation paradigms.

3. Methodology and Proposed Approach

This work presents a reference model for shared mobility that enables the data collection, processing, management, and monitoring of individuals to ensure the safety of the riders. The system must monitor and manage vehicles (cars, bikes, motorbikes, scooters, etc.). The proposed framework transforms the physical shared mobility environment into a digital form to enable the system’s processing, monitoring, and management features. The focus is to automate the safety monitoring features, where the system identifies vehicle accidents, violations, and misuse.
An adequate design of the shared mobility framework must achieve the following objectives:
  • Collect the required data representing the physical shared mobility environment, including readings from the accelerometer, gyroscope, GPS, ultrasonic, and video of the surrounding environment. The design shall accommodate the addition of new sensors within the environment.
  • Transform the collected data to make meaningful insights related to the safety of the riders.
  • Expose functionalities for the riders and administrators to view the driving and safety behavior of the shared mobility. Those functionalities must have a modular design for future extensions to the framework.
  • Automate the system’s decision component to maximize the riders’ safety to avoid and identify accidents and misuse of the vehicles.
  • Locate and track vehicles.
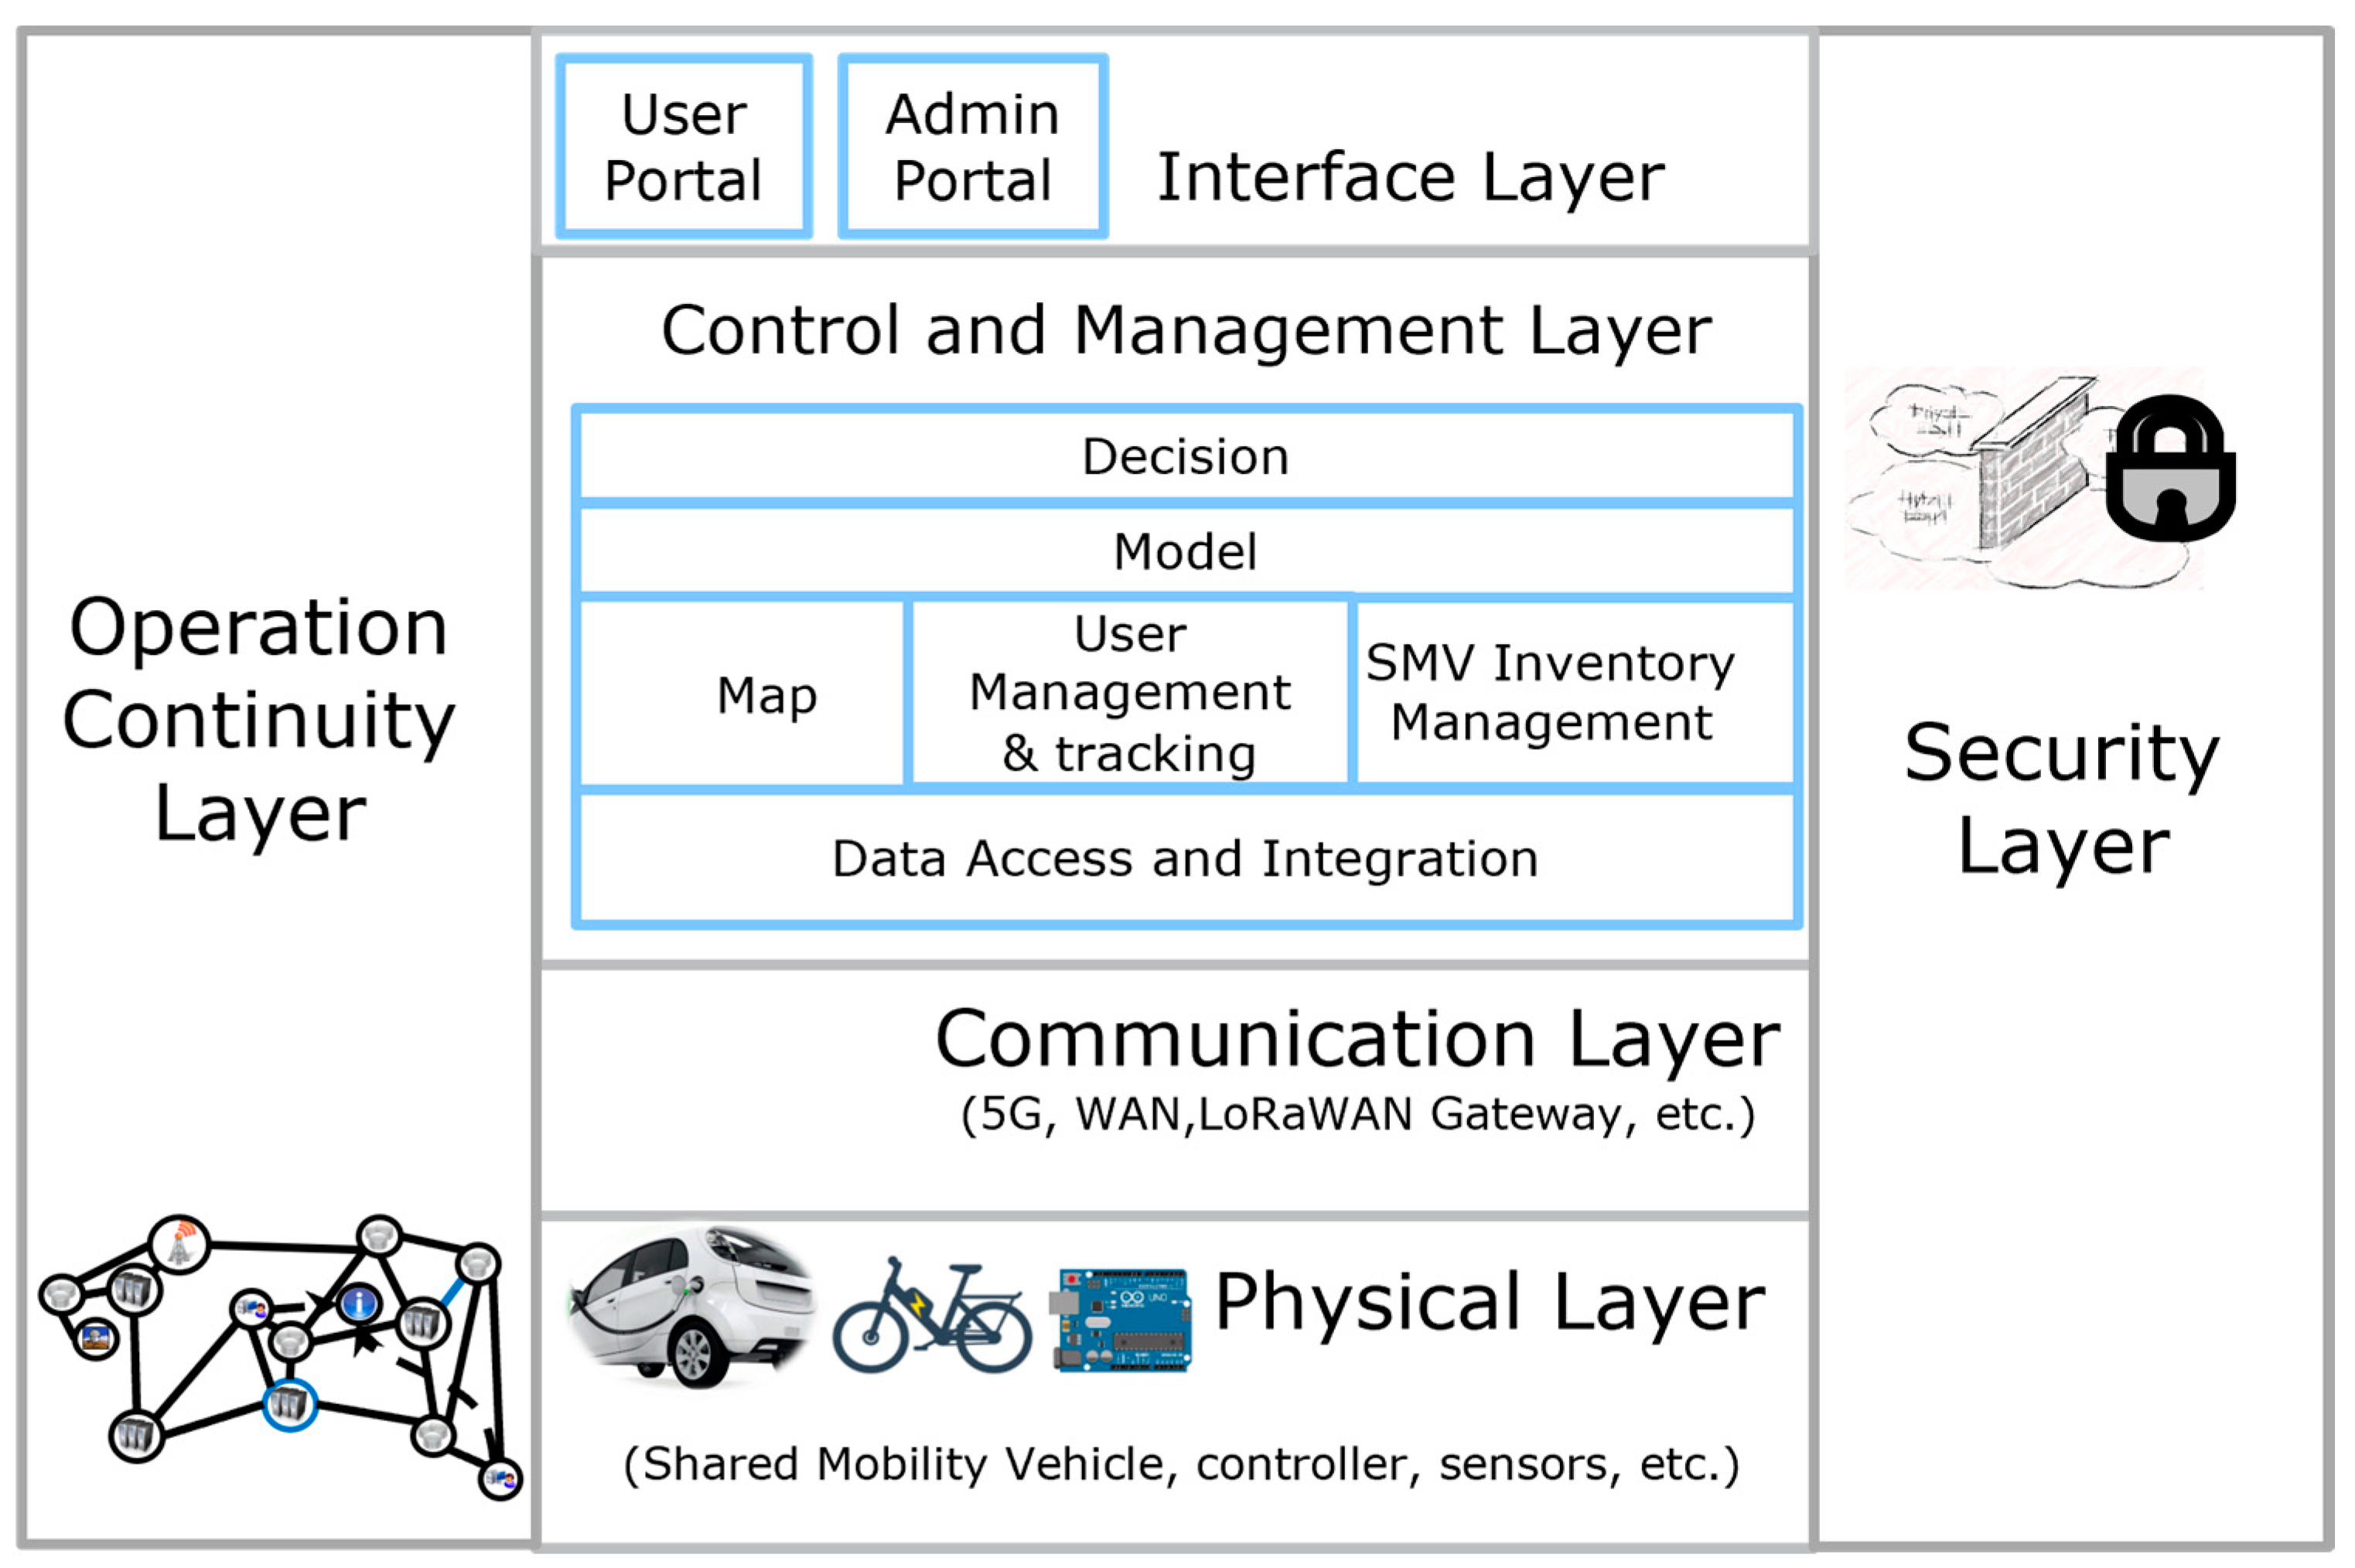
The shared mobility layered reference model is presented in Figure 1, where the top layer depends on the layer below it to meet the design objectives. A detailed description of each layer and its deployment is presented in the subsections.

3.1. Physical Layer

This layer contains the physical resources to operate in the shared mobility infrastructure as follows:
  • Shared Vehicles: Contains the physical vehicles to be used within the infrastructure.
  • Edge Computing Device: used to process the collected data from the vehicle node at the edge.
  • GPS Module: Tracks location for localization purposes.
  • Ultrasonic Sensor: Measures the distance between the vehicle and nearby objects. It offers non-contact distance measurement functionality from 2 to 400 cm and has a range accuracy that can reach up to 3 mm [29]. The ultrasonic sensor was interfaced with the edge computing device’s digital Input/Output ports.
  • Force-sensing resistor: Detects if the vehicle faced any impact force caused by another object. The force range detected is 0 to 100 Newtons. This sensor was interfaced with the digital Input/Output ports of the edge computing device.
  • Accelerometer and gyroscope sensor: Collects a 6-axis motion tracking. The sensor is interfaced with the edge computing unit using serial communication ports. This work used it to measure the vehicle’s x, y, and z acceleration and angular velocities.
  • Camera: Records the video footage of the trips while on the move. It is interfaced with the edge computing unit using the Universal Serial Bus (USB) protocol.
  • Communication module: Transmits the data to the cloud services through adequate modules connected with the edge device. The communication module choice depends on the appropriate technology specified by the communication layer (discussed in Section 3.2).

3.2. Communication Layer

This layer enables the data transmission and interaction between the control and management layer and the physical layer. It can use the 5G, WiFi, or LoRaWan technologies to enable communication and data transfer between the edge device in the physical layer and the Data Access and Integration module in the Control and Management layer. Our previous work in [30] discussed the details and the evaluation of the LoRaWan technology in a shared mobility environment.

3.3. Control and Management Layer

This layer effectively monitors, manages, and controls the operation of the shared mobility environment. A critical component within this layer is the one that deals with data transformation, integration, and accessibility. This module is named the ‘Data Access and Integration’ module. After integrating the collected data, the core software modules, including Inventory Management, User Management and Tracking, and the Map, rely on the functionality provided by the data access and integration module. A detailed descriptions of each module can be found in the following subsections.

3.3.1. Data Access and Integration Module

This module offers services for sensory devices to integrate with the overall system. It also provides software interfaces for other software components to access and store data. The data operation requests originating from the modules positioned above the “Data Access and Integration” layer and those from the shared mobility vehicles within the physical layer can be categorized into deletion, insertion, query, and update operations. Irrespective of the type of operation requested by consumer modules, the data access module executes the following tasks: (1) Initiates transaction management, (2) Gains access to the data source via data connections, and (3) Evaluates whether additional data operations, such as transformations, are needed and, if so, executes them. Furthermore, devices within the physical layer have the capability to insert and update data in the database. For device requests originating from the physical layer, the data access module performs the subsequent tasks: (1) Initiates transaction management, (2) Identifies the operation based on device ID and event type, (3) Transforms data generated by devices into the data source schema, and (4) Accesses the data source through data connections. Access to the database is achieved by invoking the interfaces provided by this module, thereby shielding the devices and modules utilizing the data access service from the technical intricacies of the operation.
An essential aspect of the data access and integration module is the “Data Transformation” function. This function is responsible for affecting the necessary conversion of unstructured data into structured data wherever it is applicable. When a shared mobility vehicle generates an event, it frequently produces unstructured data, necessitating transformation into structured data presented in a comprehensible format for consumption by different modules.

3.3.2. Shared Mobility Inventory Management

This module facilitates the addition of a new shared mobility vehicle (SMV) to the system through the registration process. It also allows for updating the shared mobility data, including its availability at a specific time, and offers the capability to deregister a shared mobility vehicle.

3.3.3. User Management and Tracking Module

This module enables the inclusion, removal, and modification of community members’ access to utilize available SMVs within the predefined boundaries. In case of violations, the user can be suspended by the system. This module further tracks the user and captures his/her behavior while using the SMV. The tracking serves as a fundamental module in establishing the regulations governing SMV usage within the specified environmental boundaries.

3.3.4. Map Module

This module allows for creating and managing the community map and facilitates integration with external mapping systems, such as Google Maps.

3.3.5. Rules Module

This module provides the ability for administrators to create and manage constraints for the consumers of SMV, which may pertain to actions like operating the SMV beyond authorized boundaries. These rules operate on an “if condition, then action” basis. Additionally, this module employs machine learning models to train and identify hazardous riding or driving behaviors exhibited by SMV consumers.

3.3.6. Decision Module

This module monitors the established rules and carries out the specified actions when the prescribed conditions are met. Additionally, it leverages the trained machine learning model to detect instances of rule violations and accidents.
The interface layer defines the entities permitted to interact with the system via a provided user interface. It offers two distinct portals, one for administrators and another for regular users, each tailored to their respective roles. A primary objective of this layer is to present comprehensive information about all the services available to specific user roles.
For regular users, it provides access to the SMV services, encompassing various details like service descriptions, service types, costs, regulations, and more. Moreover, this layer empowers regular users to access and oversee their rented service instances. Requests from regular users are relayed to the control and management layer for execution.
Additionally, the interface layer provides functionalities for administrator users, enabling them to oversee the operation of SMV assets and the overall platform.

3.4. Security Layer

It outlines the implementation of administrative and technical measures to mitigate security risks and ensure the security of the SMV shared mobility platform. This holistic approach spans across all the previously mentioned layers: physical, communication, control and management, and interface, with the objective of delivering secure services to users. It encompasses both administrative and technical measures to ensure the safe delivery of services by the shared mobility system. The comprehensive examination of risks, vulnerabilities, attacks, and defense mechanisms is beyond the scope of this paper.

3.5. Operation Continuity Layer

It outlines adopting proactive and reactive measures to enable the SMV shared mobility platform to mitigate the effects of planned and unforeseen downtime. The support is extended to all layers, including the physical, communication, control and management, and service layers, to ensure uninterrupted services to consumers. The comprehensive details of the risks and the specific proactive and reactive mechanisms fall outside the scope of this paper.

4. System Design and Implementation

To validate the proposed system, a case study was implemented for the shared mobility system that is applied to motorcycle delivery services. The service contains multiple motorcycles that can be assigned or rented to individual riders. The riders utilize the motorcycle for delivering orders from restaurants, grocery stores, pharmacies, etc. In this section, the practical design and the implementation of the system is introduced.

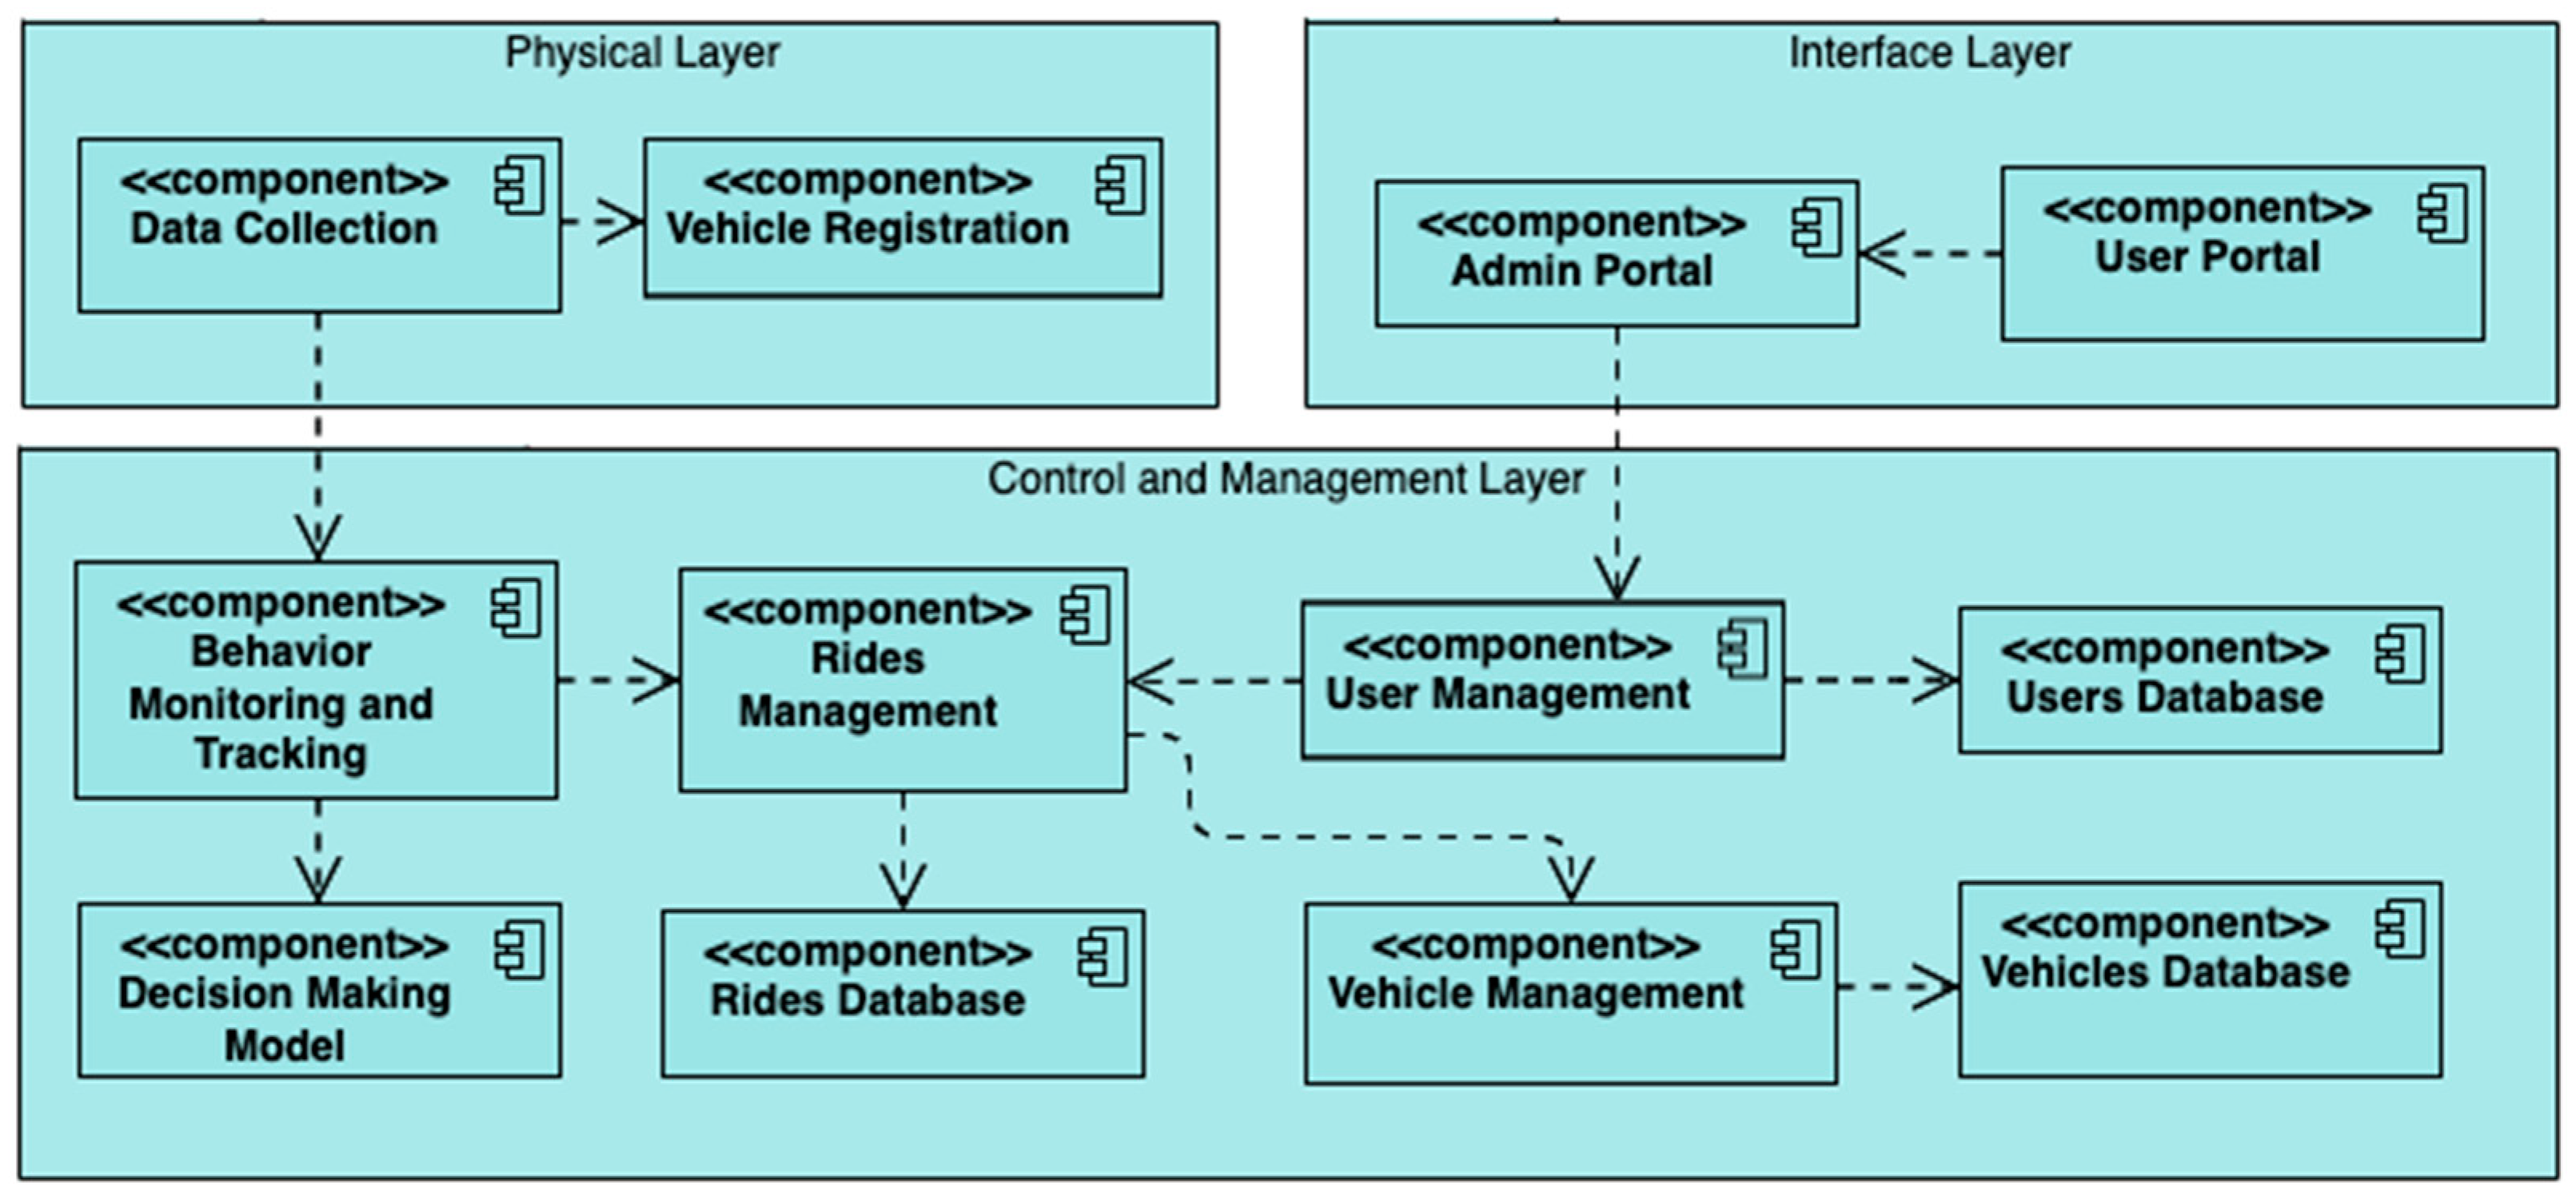
4.1. Component Design

This section discusses the system’s component design using the unified modeling language (UML). The components are based on the presented reference model shown in Figure 1. The component design of the proposed shared mobility system for motorcycle delivery services is presented in Figure 2, and the description of each component is provided in the subsections.

4.1.1. Physical Layer

The physical layer consists of two components as follows:
  • Data Collection Component: It is responsible for collecting driving parameters, location data, and other relevant information from motorcycles equipped with sensors.
  • Vehicle Registration Component: It ensures proper registration of vehicles, verifies their status, and checks the functionality of sensor devices.

4.1.2. Control and Management Layer

The control and management layer consists of the following components:
  • Behavior Monitoring and Tracking Component: It analyzes data collected by the Data Collection Component using predefined rules to track and monitor vehicle behavior. It depends on the Rides Management Component to update vehicle statuses.
  • Decision-Making Model Component: It utilizes the analyzed data from the Behavior Monitoring and Tracking Component as input for machine learning models, facilitating behavior classification.
  • Rides Management Component: It records ride details, including analyzed data and decisions made during trips. It also maintains a comprehensive history of all rides and associated vehicle behavior analysis. It depends on the Vehicle Management Component to update vehicle statuses.
  • User Management Component: It manages the user usage of vehicles, recording decisions made, ride reports, and the vehicles used by each user. It relies on the Users Database Component to store and retrieve user data.
  • Vehicle Management Component: It manages vehicle-related data, including registration details, sensor status, and availability. It interfaces with the Vehicle Database Component to update and retrieve vehicle data. It depends on the Rides Management Component to keep track of vehicle statuses during rides.
  • Rides Database Component: It stores and retrieves ride information and generates reports, supporting historical analysis and reporting.
  • Users Database Component: It stores and retrieves user data, enabling user management functionalities.
  • Vehicle Database Component: It stores and manages vehicle-related data, including registration details, sensor status, and availability.

4.1.3. Interface Layer

The Interface layer consists of the following components:
  • Admin Portal Component: It provides administrators with an intuitive interface to oversee and manage the overall shared mobility platform. It interfaces with the User Management and Rides Management Components in the Control and Management Layer.
  • User Portal Component: It offers regular users an accessible interface to access services, rent motorcycles, and track their activities. It interfaces with the User Management Component in the Control and Management Layer.

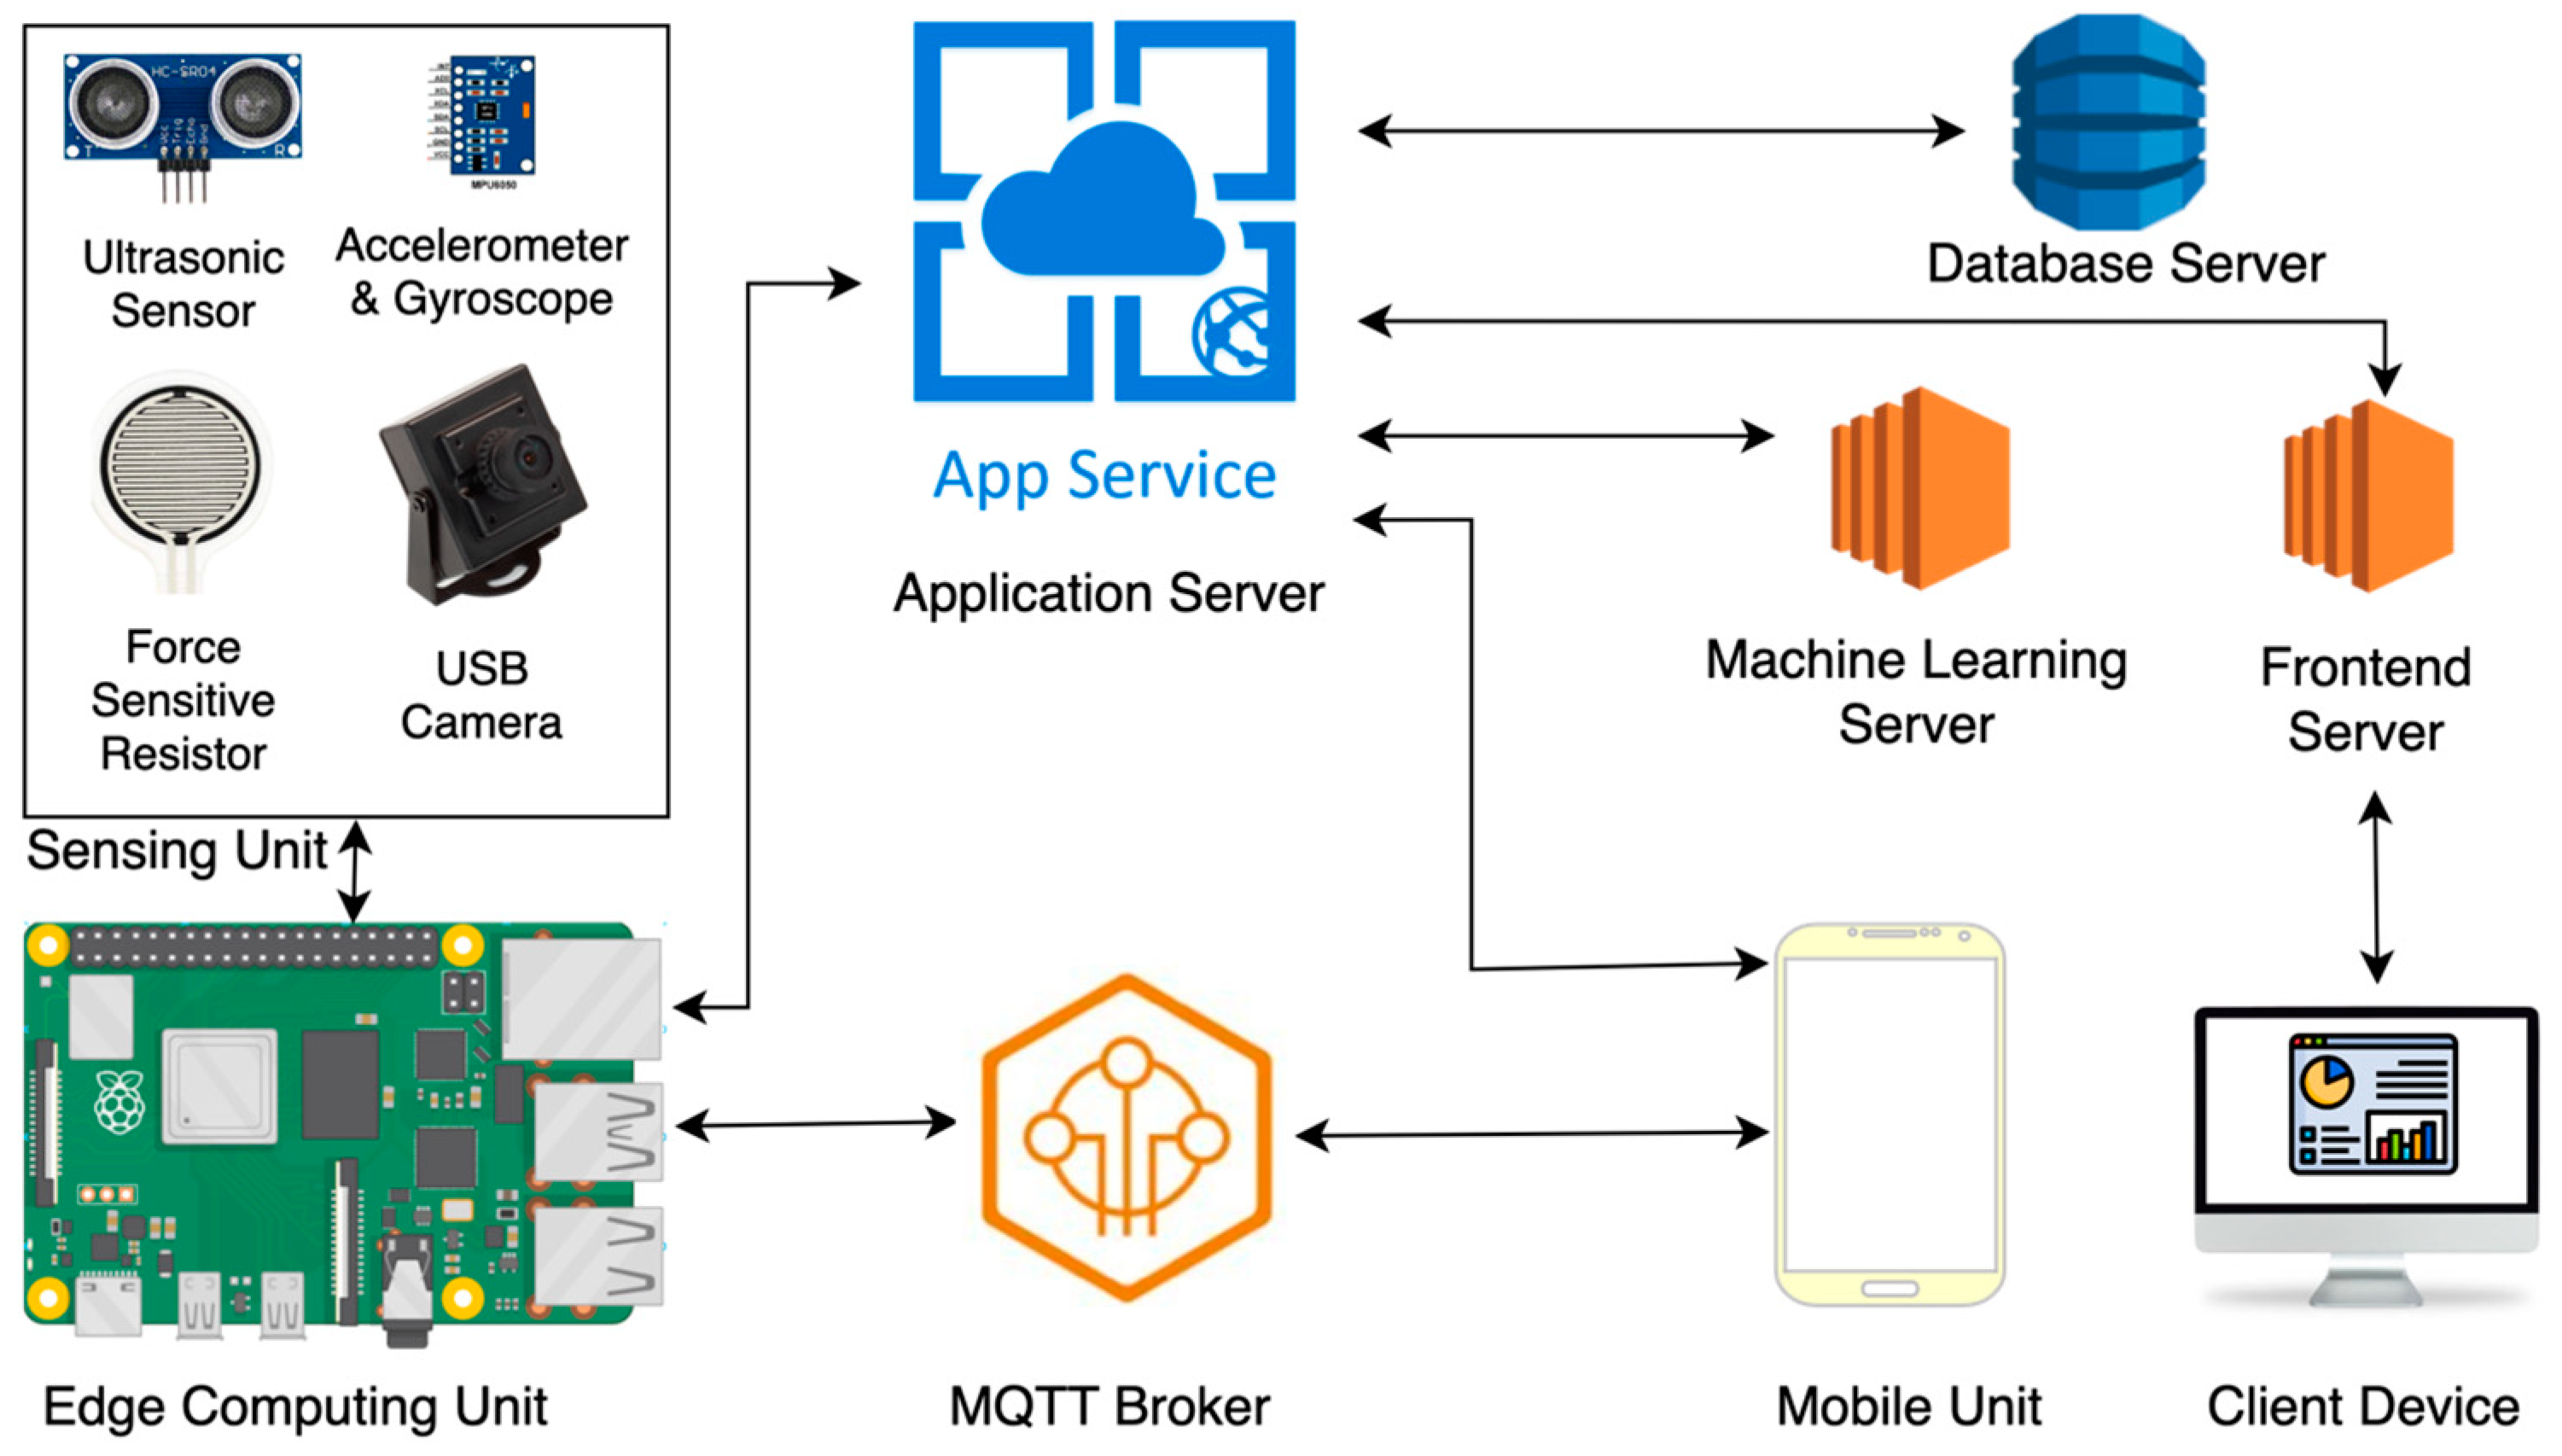
4.2. System Deployment

The implementation deployment of the system is presented in Figure 3. It includes the hardware and software components, and the overall system integration is required to deliver on the shared mobility for delivery services.
The details of the implementation of the proposed system categorized with respect to the physical, control, management layer, communication, and interface layers are depicted in the following subsections.

4.2.1. Physical Layer

The physical layer of the proposed shared mobility system consists of the hardware components responsible for data collection and sensing on motorcycles. The following hardware components are used in the proposed system:
  • Raspberry Pi (RPi) 4: The RPi 4 served as the edge computing device in the implementation, acting as the data collection component. It featured a 64-bit CPU running at 1.4 GHz, 4 GB of RAM, a 64 GB SD memory card, 4 USB ports, Ethernet and Wi-Fi access points, Bluetooth connections, 26 GPIO pins, and SPI, SCI, and I2C communication interfaces. The RPi 4 interfaced with various sensors is installed on the motorcycles, collecting driving parameters, location data, and relevant information during trips.
  • Sensing Unit: The sensing unit consists of several sensors, enhancing the data collection capabilities of the motorcycles. The following key sensors are used:
    • HC-SR04 Ultrasonic Distance Module: It is utilized for non-contact distance measurement between the motorcycle and nearby objects, with a range accuracy of up to 3 mm and a measurement range from 2 to 400 cm.
    • Force-Sensing Resistor (FSR): It is used for detecting impact force on the motorcycle caused by other objects with a resistance range from infinite/open circuit to 100 KΩ and a force range of 0 to 100 Newtons.
    • MPU-6050 Accelerometer and Gyroscope Module: It is employed for providing 6-axis motion tracking, capturing x, y, and z acceleration in addition to the angular velocities of the motorcycle during rides.
    • Arducam USB Camera: It is deployed for the video recording of rides, offering a 4K 8MP IMX219 autofocus capability with a resolution of 1080P.

4.2.2. Control and Management Layer

The implementation of the control and management layer of the proposed system is described below:
  • Edge Rule-Based Monitoring: A program was developed using Python to compare the readings collected from the sensors in the physical layer to preset values to detect irregular changes in acceleration, approaching nearby objects, and physical impacts on the bike. This program was deployed on the RPi 4 discussed in the physical layer to ensure immediate action is taken, such as sending warnings to the rider’s mobile phone or contacting emergency contacts in case of accidents.
  • Application Servers: The application services were developed as Java-based microservices. The microservices were classified as riders’ management, vehicle management, and user management, and each of them were deployed on a cloud-based server. They received data from the edge computing device, processed events, and facilitated communication between different components of the system. Additionally, they provided user management, rides management, vehicle management, and decision-making functionalities.
  • NoSQL Database System: A NoSQL database system was utilized to store and retrieve various data related to trips, sensor faults, registrations, reports, emergency contacts, and user information. The database system was used to store the rides, vehicles, and users’ databases.
  • Machine Learning Server: The dedicated machine learning server integrated machine learning capabilities into the system. The machine learning model was trained and integrated into a Flask web service deployed on a cloud. It processed the sensor data collected during trips and classified maneuvers based on predefined patterns and algorithms. By analyzing driving behavior, the machine learning server identified risky instances, such as sudden acceleration or harsh braking, contributing to the decision-making process.

4.2.3. Communication Layer

The communication layer facilitated efficient data transfer and interaction between different components of the system. It consisted of the following components:
  • MQTT Broker: Utilizing the MQTT protocol, the MQTT broker served as a messaging intermediary between the edge computing unit (RPi 4) and the mobile unit. It ensured reliable and low-latency communication, allowing the RPi 4 to send warnings and accident notifications, receive trip instructions, and synchronize data with the mobile unit.
  • Standard HTTP Requests: HTTP requests were employed to facilitate the communication between the servers and the edge computing unit. They facilitated the exchange in vehicle, sensor, rides, and user data between the different system modules.

4.2.4. Interface Layer

The interface layer facilitated user interaction with the proposed system:
  • Frontend Server: The frontend server hosted the user interface, allowing users to interact with the system and access relevant information. It served the ReactJS application, providing a user-friendly interface for users and admins to view trip details, access reports, and manage user information.
  • Client Device: The client device represented any thin client that accessed the frontend web interface of the system. Through the frontend server, users and admins could interact with the ReactJS application, access trip details, generate reports, and manage user information through a web browser.
  • Mobile Application: The mobile application was developed for Android 10 smartphones. It connected to the MQTT broker to receive warnings and accident notifications from the RPi 4 and sent trip instructions to start and end trips. Furthermore, the mobile app retrieved the details of emergency contacts in case of an accident and provided the ability to view trip information.

5. Results and Discussion

This section outlines the proposed system’s results and a discussion of the decision-making component.

5.1. Edge Monitoring

The edge monitoring process was completed by reading data from various sensors, including the ultrasonic sensor, acceleration and gyroscope sensors, impact sensor, and camera, at the physical layer. The deployed program on the edge computing unit facilitated real-time warnings to be generated based on the sensor data.
To detect nearby objects, the ultrasonic sensor measured distances, and if the measured distance was less than 2 m, indicating the presence of a nearby object, the edge computing unit immediately triggered a warning that was sent to the driver’s smartphone. For the acceleration and gyroscope readings, the program calculated the root mean square value of the x-axis accelerometer jerk, y-axis accelerometer jerk, z-axis accelerometer jerk as well as the root mean square value of the x-axis gyroscope jerk, y-axis gyroscope jerk, and z-axis gyroscope jerk. To calculate the jerk from accelerometer readings (in m/s2) for each axis, the third derivative of the acceleration values in m/s2 over time was computed. Similarly, to calculate the jerk from gyroscope readings (in degrees/second) for each axis, the angular velocity values for each axis were integrated over time to obtain linear acceleration, and then, the third derivative of this linear acceleration over time was calculated. These calculations were performed every 500 ms on arrays containing 20 readings from the accelerometer and gyroscope. Furthermore, the program maintained a rolling average of the root mean square values of the gyroscope and accelerometer jerk values. When any newly calculated jerk value deviated by 15% from the rolling average, a warning would be triggered and sent to the driver’s mobile phone, alerting them to a possible risky maneuver. The 15% deviation threshold was determined through extensive trials on the bike to identify the percentage difference value that effectively captured irregular behavior.
In the event of impact sensor detection, the program on the edge computing unit would be immediately interrupted, triggering an accident response from the mobile application. The mobile application provided the rider with a 5 s window and prompted them to confirm or deny the occurrence of the accident (in case of a faulty reading). If the driver does not respond during the 5 s window, the system automatically sets the accident flag as true. If the accident flag is set to true, the application automatically calls the driver’s emergency contacts, providing them with the location coordinates captured from the phone’s GPS capability. Throughout the ride, the video camera recorded the journey from start to finish, and in the event of an accident, it recorded an additional two minutes of footage.
A risk level was calculated by dividing the number of warnings triggered during the ride’s duration in minutes, which was multiplied by 120 to account for the program’s 500 ms warning checks, resulting in a maximum of 120 checks per minute. The calculated value was then converted to a scale of 0 to 100. If an accident was triggered during the ride, the risk level was automatically set to 100. The risky instances (the 20 sensor readings generated before each warning), along with the calculated risk level, ride’s video recording, and start and end times, were aggregated and sent to the application servers for further analysis and storage.
The edge monitoring process involved the testing of both hardware and software components. For hardware testing, the impact sensor was subjected to different force intensities, and the results showed that it detected impacts accurately in various scenarios. The ultrasonic sensor was tested for its range of distance measurement, and it effectively detected nearby objects during the rides. The accelerometer and gyroscope sensor exhibited sensitivity to bike movements and rotations, accurately capturing changes in acceleration and angular velocities. The camera successfully recorded high-quality video footage of bike trips and critical events leading up to accidents, ensuring comprehensive data collection for later analysis. The software program running on the edge computing unit was thoroughly tested through unit, integration, and performance testing. The program demonstrated reliable data processing and communication with the MQTT server, effectively sending real-time warnings to the mobile application. The mobile application for warnings and accident notifications was extensively tested, ensuring effective connection and message publishing to the MQTT broker. It successfully received and displayed warnings, triggered impact warnings when required, and promptly initiated emergency procedures. Testing included simulations of different emergency scenarios to verify the functionality of emergency contact retrieval and SMS sending. In conclusion, the edge monitoring system passed comprehensive testing for both hardware and software components, ensuring its ability to monitor the bike’s environment, detect risky instances, and issue real-time warnings.

5.2. Classification Model

To accurately assess the risk level associated with motorcycle rides, a machine learning model was developed to analyze the sensor data collected during a ride and classify it into different types of maneuvers. The following subsections discuss the model development and performance results.

5.2.1. Dataset Selection

The dataset used in this study was obtained from [31]. It was obtained from a professional driver and comprised a total of 1.8 million data samples, providing three-axis acceleration and three-axis angular velocities across time. The dataset was labeled with different types of maneuvers, providing valuable information for training the classification model. The labeled maneuvers were (1) acceleration on a curve, (2) acceleration on a straight line, (3) fall-like maneuver, (4) harsh braking on a straight line, (5) degraded track, (6) fall in a curve, (7) fall in the roundabout, (8) fall on a slippery straight line, and (9) fall with leaning of the motorcycle.

5.2.2. Data Preprocessing and Feature Extraction

Prior to model training, the dataset underwent a preprocessing phase to allow the classifiers to capture patterns in the driving behavior. Specifically, to reduce the data volume and streamline the analysis, every 20 readings were aggregated into a single sample. As a result, the dataset was refined to approximately 90,000 data samples. Moreover, important kinematic quantities, such as jerk values, were computed from both the acceleration and angular velocity data. Descriptive statistics were calculated for each sample, resulting in a total of 49 features after preprocessing. The distribution of samples in each class after preprocessing is presented in Table 1.
The original dataset consisted of the readings of the gyroscope and accelerometer sensors. The gyroscope readings were represented as the angular velocities on three axes of the gyroscope and were denoted as gyro_x, gyro_y, and gyro_z. The accelerometer readings were represented as the acceleration values on three axes of the accelerometer and were denoted as acc_x, acc_y, and acc_z. Every consecutive 20 readings were grouped together and used to extract kinematic, statistical, and rotational features. The details of these features are as follows:
(a)
Kinematic Features
The kinematic features were extracted through the calculation of different jerk values from the gyroscope and accelerometer readings. Jerk is the measure of how rapidly the acceleration changes over time. The features included individual axis jerk values, such as gyro_jerk_x, gyro_jerk_y, and gyro_jerk_z, which represent the rate of change in acceleration in the x, y, and z axes, respectively, as measured by the gyroscope sensor. Jerk is a critical measure of how rapidly the acceleration changes over time. Additionally, the feature overall_gyro_jerk represented the overall jerk calculated from the three axes of the gyroscope (x, y, z). This value is typically obtained by taking the square root of the sum of the squares of the jerk values in each axis. Another essential feature, gyro_mean_jerk, was computed to represent the mean (average) jerk derived from the three axes of the gyroscope (x, y, z). It is typically obtained by summing the jerk values in each axis and dividing by the number of data points. Analogously, acc_jerk_x, acc_jerk_y, and acc_jerk_z represented the jerk, or rate of change in acceleration, in the x, y, and z axes, respectively, as measured by the accelerometer sensor. Similarly, mean_acc_jerk was calculated as the mean (average) jerk derived from the three axes of the accelerometer (x, y, z) by summing the jerk values in each axis and dividing by the number of data points.
(b)
Statistical Features
Various statistics were computed for the acceleration and gyroscope data on each axis. For the acceleration data in the x-axis, features such as acc_x_mean, acc_x_std, acc_x_median, acc_x_min, acc_x_max, and acc_x_sem represented the mean, standard deviation, median, minimum, maximum, and standard error of the mean (SEM) values, respectively. Similar statistics were derived for the acceleration data in the y-axis (acc_y_mean, acc_y_std, acc_y_median, acc_y_min, acc_y_max, acc_y_sem) and z-axis (acc_z_mean, acc_z_std, acc_z_median, acc_z_min, acc_z_max, acc_z_sem). Likewise, the same set of statistics was calculated for the gyroscope data in the x-axis (gyro_x_mean, gyro_x_std, gyro_x_median, gyro_x_min, gyro_x_max, gyro_x_sem), y-axis (gyro_y_mean, gyro_y_std, gyro_y_median, gyro_y_min, gyro_y_max, gyro_y_sem), and z-axis (gyro_z_mean, gyro_z_std, gyro_z_median, gyro_z_min, gyro_z_max, gyro_z_sem).
(c)
Rotational Features
The rotational features orientation, pitch, and roll represented the orientation of the gyroscope sensor, which is typically obtained by combining gyroscope readings from multiple axes. Specifically, orientation represented the overall orientation of the device in 3D space, while pitch and roll represented the rotation angles around the x-axis and y-axis, respectively.

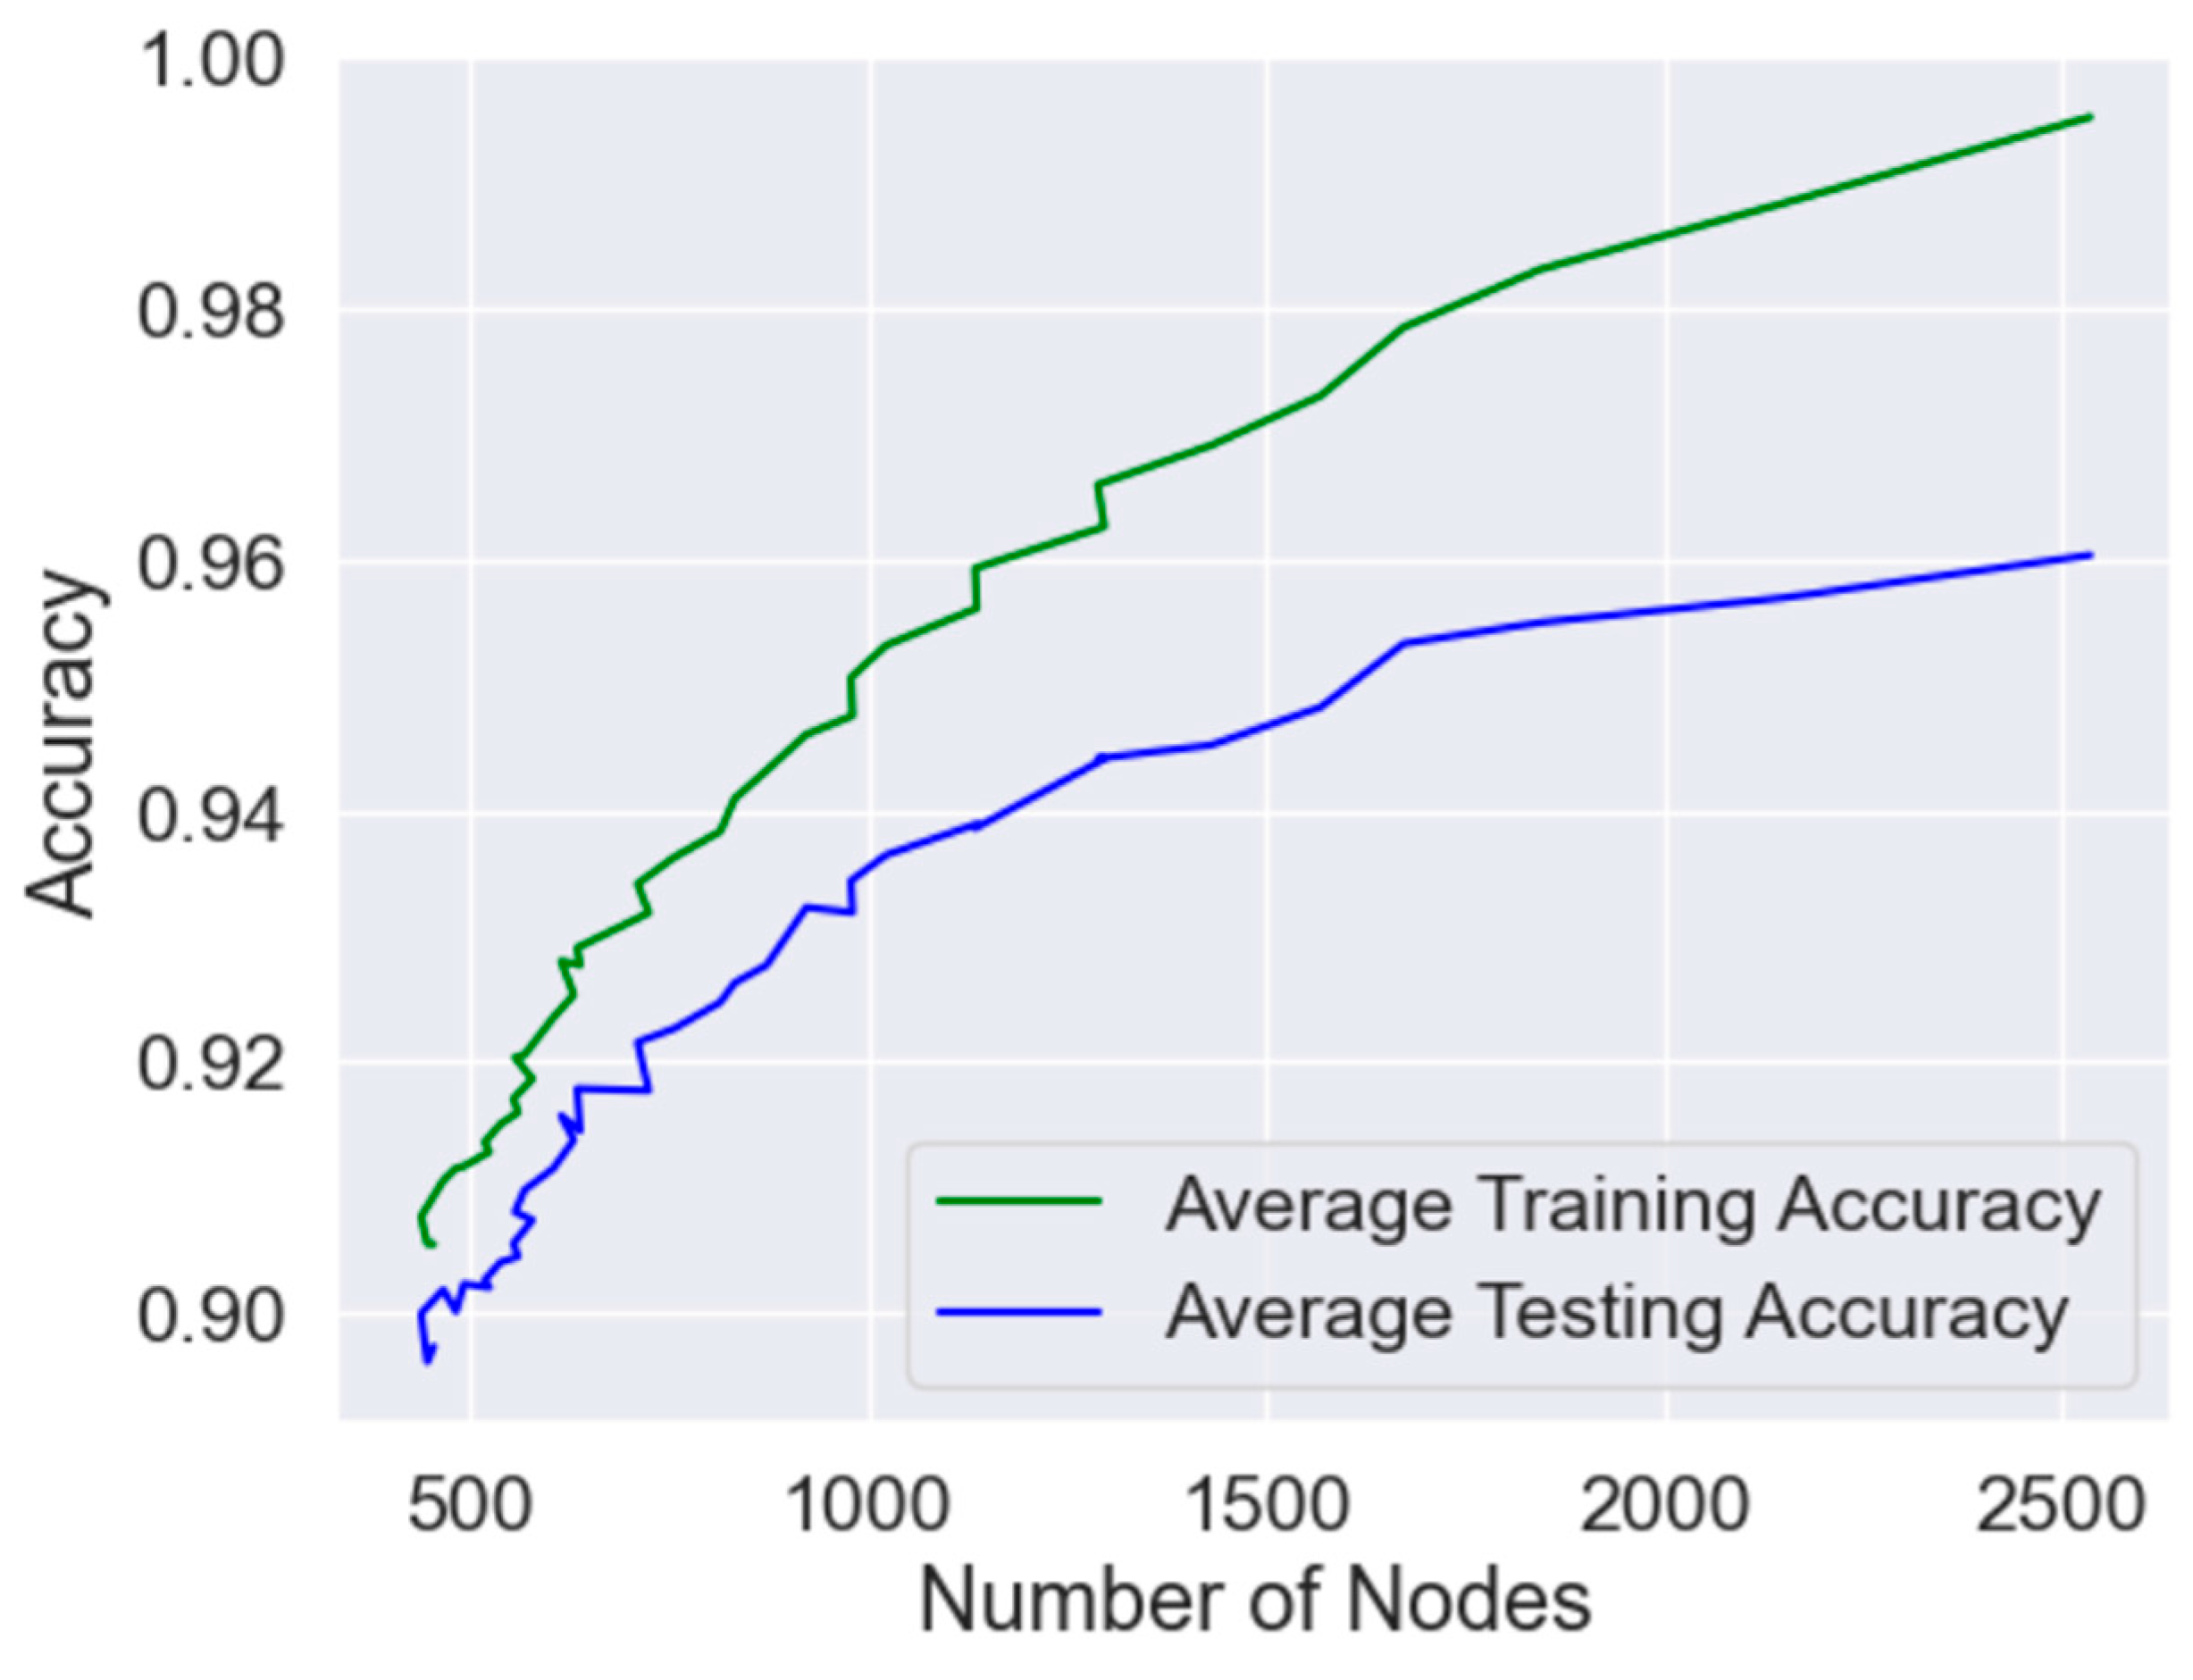
5.2.3. Model Training and Selection

To identify the most appropriate classifier for the model, various algorithms, including Support Vector Machine (SVM), Decision Tree (DT), Naive Bayes (NB), and K-Nearest Neighbor (KNN), were trained and compared based on accuracy and F1-score. After rigorous evaluation, the Decision Tree classifier exhibited outstanding performance with an accuracy of 0.95 and an F1-score of 0.94, making it the optimal choice for further analysis.
The Decision Tree model underwent further optimization through hyperparameter tuning. Initially, given the unequal distribution of data samples across various classes, we employed the class weight parameter, setting it to “balanced” during the model’s training. This ensured that all classes were treated with equal importance during the classification process with weights assigned inversely proportional to the number of samples in each class.
Furthermore, to evaluate the model’s performance, we divided the dataset into training and testing subsets, employing the conventional 80–20 split ratio. Our primary objective was to determine the optimal number of tree nodes within the decision tree, thereby avoiding overfitting. This was accomplished through the experimentation with different values of the “minimum samples split” parameter, which is the minimum number of data samples required to split an internal node in the decision tree. For each value of minimum samples, we split the dataset multiple times and recorded the average number of tree nodes in the decision tree along with the average training and testing accuracies. The relationship between the number of nodes and the corresponding accuracy scores was visualized in Figure 4. As shown in the figure, the average training and testing accuracy graphs are close to one another when the testing accuracy is 91%. Based on this analysis, a minimum sample split of 115, resulting in 637 tree nodes, was selected, as it showed the closest average training and testing accuracies.
To enhance the model efficiency, recursive feature elimination with cross-validation was employed to extract feature importance. Consequently, the following features were omitted due to their negligible importance: gyro_jerk_y, gyro_jerk_z, gyro_mean_jerk, acc_jerk_x, acc_jerk_y, acc_jerk_z, mean_acc_jerk, overall_acc_jerk, acc_x_std, acc_y_mean, acc_y_std, acc_y_median, acc_y_min, acc_y_max, acc_y_sem, acc_z_std, gyro_x_mean, gyro_x_std, gyro_x_max, gyro_x_sem, gyro_y_mean, gyro_y_std, gyro_y_min, gyro_y_sem, gyro_std, and gyro_z_sem.
The refined model, post-dimensionality reduction, demonstrated promising performance with a testing accuracy of 0.91, an F1-score of 0.88, a recall of 0.9, a precision of 0.88, and a Cohen’s kappa coefficient of 0.89. The confusion matrix of the refined model is presented in Figure 5, and it provides a detailed breakdown of the classifier’s performance for each class. The labels on the confusion matrix stand for the classes acceleration on a curve, acceleration on a straight line, fall-like maneuver, harsh braking on a straight line, degraded track, fall in a curve, fall in the roundabout, fall on a slippery section, and fall with leaning of the motorcycle, respectively. The classifier correctly identified many instances of acceleration on a curve, acceleration on a straight line, and degraded tracks, with relatively low numbers of false positives and false negatives. However, it struggled to identify instances of falling in a curve, falling in a roundabout, and falling on a slippery section, as shown by the higher numbers of false negatives for these classes in the confusion matrix. This indicates there may be some underlying patterns or features that the classifier cannot capture effectively. Overall, the testing conducted on the decision tree classifier has shown that it is an effective tool for identifying patterns and making accurate predictions.

5.3. Overall System Performance

The overall system performance was assessed through a series of tests on specific maneuver types that can be safely tested without putting human subjects in danger using an electric bike. The system’s performance was evaluated on maneuver types that could be safely replicated during short rides on the motorbike. The tested maneuver types included fall-like, harsh braking, degraded track, acceleration on a curve, and acceleration on a straight line. Each of these maneuvers was attempted three times, and during the rides, the system recorded risky instances along with their classifications. The percentage of positive classifications for the tested maneuver type in the different trials was computed and used to evaluate the system’s performance.
It is evident that the performance of the system varied for different maneuvers. The average positive classification for the fall-like maneuver was 74%. The harsh braking maneuver had an average positive classification of 80%. In the case of the degraded track maneuver, the system showed an average positive classification of 85%. For acceleration on a curve, the average positive classification was 77%. Finally, acceleration on a straight line had an average positive classification of 77%.
Overall, the system’s performance is acceptable for the tested maneuver types. It is worth mentioning that several factors might have affected the system’s performance and contributed to the observed variations. Firstly, the system’s performance heavily relied on the expertise of the rider, which could be a limitation, as none of the participants were licensed motorbike drivers, thus lacking the finesse needed to perform maneuvers accurately. Furthermore, the dataset used for evaluation was conducted on a single track by one driver, which might limit the generalizability of the results. Additionally, the testing environment was confined within the university campus and thus may not fully reflect real-world scenarios, which might have impacted the system’s performance under different conditions. Due to these limitations, the system’s performance evaluation results may not be as accurate as desired. However, the preliminary tests suggest that the system has the potential to be a valuable tool for motorcycle safety.
Table 2 compares the proposed system with other machine learning-based systems documented in the literature.
Notably, [27,28] primarily focus on classifying normal driving behaviors: left turn, right turn, U-turn, and going straight in [27] and left turn, right turn, stopping, and going straight in [28]. These works only address routine driving activities. Moreover, only five of the identified maneuver types in [26] are risky driving behaviors, while the other four types are normal driving behaviors. Our model, in contrast, concentrates on detecting a wider range of nine risky maneuver types, extending the classification beyond normal maneuver types. Our system’s approach is intentionally designed to be more general, unlike the solution proposed in [26], which demonstrates optimal performance at a specific speed of 30 km/h and was trained on a relatively small dataset comprising 718 samples. Instead, our system utilizes over 90,000 data samples and does not impose speed limitations. The preliminary tests of our proposed system were intentionally conducted across various speed scenarios to assess its adaptability to real-world motorcycle scenarios.

6. Conclusions and Future Work

The proposed work introduced a comprehensive on-demand smart shared transportation system that makes use of IoT, communication protocols, cloud computing, and machine learning to enhance the safety of shared mobility systems. A framework was designed to allow shared mobility vehicles to collaboratively share information and make informed decisions. The proposed framework consists of the physical, communication, control and management, interface, operation continuity, and security layers. Through this framework, the shared mobility environment is transformed into a digitally interconnected system, allowing for real-time data processing, monitoring, and management. The presented framework was validated through a case study of a shared mobility system tailored for motorbike delivery services. In this context, the physical layer incorporated sensors and an edge computing unit for data collection and vehicle registration functions. The control and management layer consisted of the following main modules: (1) an edge monitoring program that communicated with a smartphone to monitor the rider’s behavior in real time, generate warnings, and contact emergency contacts in case of accidents; (2) cloud-based web application servers that deployed the microservices responsible for user management, vehicle management, rides management, and decision-making machine learning models; and (3) cloud-based services for the storage of data related to users, vehicles, and rides. The communication layer of the proposed system utilized MQTT and HTTP protocols to share data between the system modules. The interface layer utilized a mobile application for real-time warnings to the user and a frontend web application for the driving behavior reporting to the user and administrators. The decision making in this work was achieved through (1) the real-time processing of the data collected from the accelerometer/gyroscope, ultrasonic, and impact sensors to send the warnings to the rider’s smartphone and (2) a decision tree classification model that used accelerometer and gyroscope readings to classify maneuver types. The classification model achieved a promising accuracy of 91% and an F1-score of 88%. The classification of the maneuver types was preliminarily tested in real-life scenarios, and the maneuver-type classes showed an average positive classification of 78%. Overall, this study contributes to the existing ones by bridging a significant gap in the field of shared mobility. While previous research has predominantly focused on individual system modules, this work presents an innovative approach by seamlessly integrating various components such as real-time behavior monitoring, IoT-based data collection, cloud computing, and machine learning-driven maneuver classification. Notably, a significant contribution to the system is incorporating a decision tree classification model for maneuver kinds, which improves the effectiveness of shared motorbike mobility services.
Future work will include different types of vehicles to validate the proposed reference model where cars, scooters, motorbikes, etc. are integrated. Furthermore, security risks in shared mobility shall be studied to identify security threats and mechanisms that minimize the risk of cyber-attacks. Operation continuity is another area of future work where the critical components of the system are to be studied in order to architect a design solution that provides high availability of the shared mobility system. Accordingly, proactive and reactive mechanisms are to be implemented to provide the high availability of the shared mobility system.

Author Contributions

Conceptualization, R.A., A.R.A.-A., F.E. and A.T.; Investigation, R.A., A.R.A.-A., F.E., A.A.N., A.T., A.A. and M.E.; Methodology, R.A., A.R.A.-A., A.A.N., F.E., A.A., A.T. and M.E.; Software, F.E., A.T., A.A., M.E. and R.A.; Supervision, R.A., A.R.A.-A. and A.A.N.; Writing, R.A., A.A.N., F.E., A.T., A.A., M.E. and A.A.N. All authors have read and agreed to the published version of the manuscript.

Funding

The work in this paper was supported, in part, by the Open Access Program from the American University of Sharjah. This paper represents the opinions of the author(s) and does not mean to represent the position or opinions of the American University of Sharjah.

Data Availability Statement

The dataset adopted in this research is openly available in [ScienceDirect] at https://doi.org/10.1016/j.dib.2019.103828 (accessed on 6 October 2023).

Conflicts of Interest

The authors declare no conflict of interest.

References

  1. Shaheen, S.A.; Martin, E.; Bansal, A. Peer-to-Peer (P2P) Carsharing: Understanding Early Markets, Social Dynamics, and Behavioral Impacts; Transportation Sustainability Research Center: UC Berkeley, CA, USA, 2018; Available online: https://escholarship.org/uc/item/7s8207tb (accessed on 30 August 2023).
  2. Furuhata, M.; Dessouky, M.; Ordóñez, F.; Brunet, M.-E.; Wang, X.; Koenig, S. Ridesharing: The state-of-the-art and future directions. Transp. Res. Part B Methodol. 2013, 57, 28–46. [Google Scholar]
  3. Guyader, H. No one rides for free! Three styles of collaborative consumption. J. Serv. Mark. 2018, 32, 692–714. [Google Scholar]
  4. Santos, D.; Xavier, E. Dynamic Taxi and Ridesharing: A Framework and Heuristics for the Optimization Problem. In Proceedings of the Twenty-Third International Joint Conference on Artificial Intelligence, Beijing, China, 3–9 August 2013; pp. 2885–2891. [Google Scholar]
  5. Huang, Y.; Bastani, F.; Jin, R.; Wang, X.S. Large Scale Real-Time Ridesharing with Service Guarantee on Road Networks. Proc. VLDB Endow. 2014, 7, 2017–2028. [Google Scholar] [CrossRef]
  6. Ma, S.; Zheng, Y.; Wolfson, O. T-Share: A Large-Scale Dynamic Taxi Ridesharing Service. In Proceedings of the 2013 IEEE 29th International Conference on Data Engineering (ICDE), Brisbane, QLD, Australia, 8–11 April 2013; pp. 410–421. [Google Scholar] [CrossRef]
  7. Ma, S.; Zheng, Y.; Wolfson, O. Real-Time City-Scale Taxi Ridesharing. IEEE Trans. Knowl. Data Eng. 2015, 27, 1782–1795. [Google Scholar] [CrossRef]
  8. Pelzer, D.; Xiao, J.; Zehe, D.; Lees, M.H.; Knoll, A.C.; Aydt, H. A Partition-Based Match Making Algorithm for Dynamic Ridesharing. IEEE Trans. Intell. Transp. Syst. 2015, 16, 2587–2598. [Google Scholar] [CrossRef]
  9. Schreieck, M.; Safetli, H.; Siddiqui, S.A.; Pflügler, C.; Wiesche, M.; Krcmar, H. A Matching Algorithm for Dynamic Ridesharing. Transp. Res. Procedia 2016, 19, 272–285. [Google Scholar] [CrossRef]
  10. Guo, Y.; Zhang, Y.; Boulaksil, Y. Real-Time Ride-Sharing Framework with Dynamic Timeframe and Anticipation-Based Migration. Eur. J. Oper. Res. 2021, 288, 810–828. [Google Scholar] [CrossRef]
  11. O’Mahony, E.; Shmoys, D. Data Analysis and Optimization for (Citi)Bike Sharing. In Proceedings of the AAAI Conference on Artificial Intelligence, Austin, TX, USA, 25–30 January 2015; Volume 29. [Google Scholar] [CrossRef]
  12. Liu, J.; Sun, L.; Chen, W.; Xiong, H. Rebalancing Bike Sharing Systems. In Proceedings of the 22nd ACM SIGKDD International Conference on Knowledge Discovery and Data Mining, San Francisco, CA, USA, 13–17 August 2016. [Google Scholar] [CrossRef]
  13. Ritzinger, U.; Puchinger, J.; Hartl, R.F. A Survey on Dynamic and Stochastic Vehicle Routing Problems. Int. J. Prod. Res. 2015, 54, 215–231. [Google Scholar] [CrossRef]
  14. Nazari, M.; Oroojlooy, A.; Snyder, L.; Takac, M. Reinforcement Learning for Solving the Vehicle Routing Problem. Available online: https://proceedings.neurips.cc/paper/2018/hash/9fb4651c05b2ed70fba5afe0b039a550-Abstract.html (accessed on 30 August 2023).
  15. Du, B.; Hu, X.; Sun, L.; Liu, J.; Qiao, Y.; Lv, W. Traffic Demand Prediction Based on Dynamic Transition Convolutional Neural Network. IEEE Trans. Intell. Transp. Syst. 2021, 22, 1237–1247. [Google Scholar] [CrossRef]
  16. Yang, J.; Guo, B.; Wang, Z.; Ma, Y. Hierarchical Prediction Based on Network-Representation-Learning-Enhanced Clustering for Bike-Sharing System in Smart City. IEEE Internet Things J. 2021, 8, 6416–6424. [Google Scholar] [CrossRef]
  17. Turoń, K.; Czech, P.; Tóth, J. Safety and Security Aspects in Shared Mobility Systems. Sci. J. Silesian Univ. Technol. Ser. Transp. 2019, 104, 169–175. [Google Scholar] [CrossRef]
  18. Agarwal, N.; Singh, A.K.; Singh, P.P.; Sahani Dfa, R. Smart helmet. Int. Res. J. Eng. Technol. 2015, 2, 19–22. [Google Scholar]
  19. Jesudoss, A.; Vybhavi, R.; Anusha, B. Design of Smart Helmet for Accident Avoidance. In Proceedings of the 2019 International Conference on Communication and Signal Processing (ICCSP), Melmaruvathur, India, 4–6 April 2019; pp. 0774–0778. [Google Scholar]
  20. Srithar, S.; Venkata Suvathe, V.S.; Vijay Pandi, S.; Mounisha, M. Implementation of Smart Secure System in Motorbike using Bluetooth Connectivity. Int. Res. J. Eng. Technol. 2019, 6, 4817–4821. [Google Scholar]
  21. Mohd, A.; Madzhi, N.K.; Johari, J. Smart Helmet with Sensors for Accident Prevention. In Proceedings of the 2013 International Conference on Electrical, Electronics and System Engineering (ICEESE), Selangor, Malaysia, 4–5 December 2013; pp. 21–26. [Google Scholar]
  22. Swathi, S.J.; Raj, S.; Devaraj, D. Microcontroller and Sensor Based Smart Biking System for Driver’s Safety. In Proceedings of the 2019 IEEE International Conference on Intelligent Techniques in Control, Optimization and Signal Processing (INCOS), Tamilnadu, India, 11–13 April 2019; pp. 1–5. [Google Scholar]
  23. Lai, P.C.; Huang, H.Z.; Sheu, M.H.; Wu, C.M.; Le, J.T.; Chen, T.H. Bike Sensor System Design for Safety and Healthy Riding. In Proceedings of the 2018 IEEE International Conference on Consumer Electronics-Taiwan (ICCETW), Taichung, Taiwan, 19–21 May 2018; pp. 1–2. [Google Scholar]
  24. Islam, M.M.; Ridwan, A.E.M.; Mary, M.M.; Siam, M.F.; Mumu, S.A.; Rana, S. Design and Implementation of a Smart Bike Accident Detection System. In Proceedings of the 2020 IEEE Region 10 Symposium (TENSYMP), Dhaka, Bangladesh, 5–7 June 2020; pp. 386–389. [Google Scholar]
  25. Tashfia, S.S.; Islam, R.; Sultan, S.I.; Rahman, M.W.; Habib, A.; Pinky, L.Y. Intelligent Motorcycle Monitoring Scheme Using IoT with Expert System in Bangladesh. In Proceedings of the 2020 23rd International Conference on Computer and Information Technology (ICCIT), Dhaka, Bangladesh, 19–21 December 2020; pp. 1–6. [Google Scholar]
  26. Nuswantoro, F.M.; Sudarsono, A.; Santoso, T.B. Abnormal Driving Detection Based on Accelerometer and Gyroscope Sensor on Smartphone using Artificial Neural Network (ANN) Algorithm. In Proceedings of the 2020 International Electronics Symposium (IES), Surabaya, Indonesia, 29–30 September 2020; pp. 356–363. [Google Scholar]
  27. Raheel, A.; Ehatisham-ul-Haq, M.; Iqbal, A.; Ali, H.; Majid, M. Driving Activity Recognition of Motorcyclists Using Smartphone Sensor. In Proceedings of the International Conference on Intelligent Technologies and Applications INTAP 2019, Bahawalpur, Pakistan, 6–8 November 2019; pp. 684–694. [Google Scholar]
  28. Lu, D.-N.; Nguyen, D.-N.; Nguyen, T.-H.; Nguyen, H.-N. Vehicle Mode and Driving Activity Detection Based on Analyzing Sensor Data of Smartphones. Sensors 2018, 18, 1036. [Google Scholar] [CrossRef]
  29. HC-SR04 Sensor Datasheet Pdf—Ultrasonic Sensor. Equivalent, Catalog. Available online: https://datasheetspdf.com/pdf/1380136/ETC/HC-SR04/1 (accessed on 30 August 2023).
  30. Aburukba, R.; Al-Ali, A.R.; Riaz, A.H.; Al Nabulsi, A.; Khan, D.; Khan, S.; Amer, M. Fog Computing Approach for Shared Mobility in Smart Cities. Energies 2021, 14, 8174. [Google Scholar] [CrossRef]
  31. Boubezoul, A.; Dufour, F.; Bouaziz, S.; Larnaudie, B.; Espié, S. Dataset on Powered Two Wheelers Fall and Critical Events Detection. Data Brief 2019, 23, 103828. [Google Scholar] [CrossRef] [PubMed]
Figure 1. Shared mobility reference model.
Futureinternet 15 00333 g001
Figure 2. Component design of the proposed system.
Futureinternet 15 00333 g002
Figure 3. Prototype implementation of the proposed system.
Futureinternet 15 00333 g003
Figure 4. Number of decision tree nodes vs. average training and testing accuracies.
Futureinternet 15 00333 g004
Figure 5. Confusion matrix of the decision tree model.
Futureinternet 15 00333 g005
Table 1. Percentage of samples for each maneuver type.
Maneuver TypeNumber of SamplesPercentage
Acceleration on a curve38034.20%
Acceleration on a straight line10,97512.13%
Fall-like maneuver32,52035.94%
Harsh braking on a straight line88469.78%
Degraded track10,48011.58%
Fall in a curve62266.88%
Fall in the roundabout52665.82%
Fall on a slippery section58756.49%
Fall with leaning of the motorcycle64807.16%
Table 2. Proposed system comparison with systems reported in the literature.
Ref No.Sensors Used to Detect
Maneuver
Number of Maneuvers IdentifiedManeuver Types IdentifiedBest Average Accuracy
[26]Mobile phone accelerometer and gyroscope9Normal, zigzag, sleepy, turn right, turn left, U-turn, sudden braking, sudden acceleration, and speed bumpsANN: 96.2%
[27]Mobile phone gyroscope4Left turn, right turn, U-turn, and a straight pathRF: 86.51%
[28]Mobile phone accelerometer, gyroscope and magnetometer4Left turn, right turn, stopping, and going straightRF: 98.95%
Proposed SystemDiscrete accelerometer and gyroscope9Acceleration on a curve, acceleration on a straight line, fall-like maneuver, harsh braking on a straight line, degraded track, fall in a curve, fall in the roundabout, fall on a slippery straight line, and fall with leaning of the motorcycleDT: 91.59%
Disclaimer/Publisher’s Note: The statements, opinions and data contained in all publications are solely those of the individual author(s) and contributor(s) and not of MDPI and/or the editor(s). MDPI and/or the editor(s) disclaim responsibility for any injury to people or property resulting from any ideas, methods, instructions or products referred to in the content.

